Real Wage, Labor Productivity, and Employment Trends · PDF fileReal Wage, Labor Productivity,...
28
WP/12/92 Real Wage, Labor Productivity, and Employment Trends in South Africa: A Closer Look Nir Klein
Transcript of Real Wage, Labor Productivity, and Employment Trends · PDF fileReal Wage, Labor Productivity,...

WP/12/92
Real Wage, Labor Productivity, and Employment Trends in South Africa: A Closer
Look
Nir Klein
© 2012 International Monetary Fund WP/12/92
IMF Working Paper
African Department
Real Wage, Labor Productivity, and Employment Trends in South Africa: A Closer Look
Prepared by Nir Klein
Authorized for distribution by Calvin Andrew McDonald
April 2012
Abstract
The paper looks at the dynamics of employment in South Africa and examines the factors that contributed to the job-shedding observed during the recent financial crisis. The paper finds that the rapid growth of the real wage, which outpaced the labor productivity growth in most sectors, played an important role in suppressing employment creation. The paper also finds that while there is a co-integrating link between the real wage and labor productivity, the deviations from equilibrium are persistent and thus contribute to a weak link between real wage growth and labor productivity growth in the short term. This finding is also supported by a cross-country analysis, which shows that in South Africa the link between the real wage and labor productivity is substantially weaker than in other emerging markets, even after controlling for labor market tightness indicators.
JEL Classification Numbers: E60, J30
Keywords: Real wage, labor productivity, employment, panel analysis
Author’s E-Mail Address:[email protected]
This Working Paper should not be reported as representing the views of the IMF. The views expressed in this Working Paper are those of the author(s) and do not necessarily represent those of the IMF or IMF policy. Working Papers describe research in progress by the author(s) and are published to elicit comments and to further debate.

2
Contents Page I. Introduction .......................................................................................................................4
II. Brief literature review .......................................................................................................6
III. The sectoral dynamics of employment, real wages and labor productivity in
2008Q4-2011Q2 ...............................................................................................................8
A. A sectoral perspective – some stylized facts .....................................................8
B. The impact of the excess real wage growth on employment ............................9
C. The link between employment, output and excess real wage – a panel
VAR approach ................................................................................................12
IV. The link between the real wage and labor productivity: A long run perspective ...........13
V. The link between real wage growth and the change in labor productivity: A cross country perspective .........................................................................................................15
VI. Conclusions .....................................................................................................................20
Tables
1. Correlation between the real wage growth and the labor productivity growth .................9
2. Panel estimation using erw_cpi as explanatory variable ................................................11
3. Panel estimation using erw_df as explanatory variable ..................................................11
4. Labor productivity and the real wage: Long-term estimation 1970Q1-2011Q1 ............14
5. The long-term estimation’s residuals, unit root tests, 1970Q1-2011Q1 .........................14
6. Cross coutry panel estimation usind unemployment as an explanatory variable ...........17
7. Cross coutry panel estimation usind labor absorption rate as an explanatory variable ..18
Figures
1. South Africa: Employment and GDP ...............................................................................4
2. Output and employment in selected economies, cumulative change 2008-10 .................4
3. Cumulative growth of real wage and labor productivity of the non-agricultural sector ...5
4. Wage flexibility and the link between pay and productivity in selected economies ........5
5. South Africa: Employment change by sectors, 2008Q4-2011Q2 .....................................8
6. South Africa: The cumulative growth of labor productivity 2008Q4-2011Q2 ................8
7. Panel VAR, impulse response functions .........................................................................12
8. South Africa: Non-agricultural labor productivity and real wage ..................................13
9. South Africa: Co-integreting links between non-agricultural labor productivity and
real wage, 1970Q1-2011Q1 ............................................................................................15
10. Correlations between the real wage growth and labor productivity in selected economies 1996-2009 .....................................................................................................16
11. Fixed effects constants terms with two-standard error bands .........................................19

3
References ................................................................................................................................21 Appendix Tables
A1. Labor productivity and the real wage: Long-term estimation 1994Q1-2011Q1 ............23
A2. The long-term estimation’s residuals, unit root tests, 1994Q1-2011Q1 .........................23
A3. Short-term dynamics of the real wage ............................................................................24 Appendix Figures
A1. South Africa: Co-integreting links between non-agricultural labor productivity and
real wage, 1994Q1-2011Q1 ............................................................................................23
A2. South Africa: Real wage and labor productivity .............................................................25
A3. Panel VAR: Impulse response, erw_df ...........................................................................26
A4. Panel VAR: Impulse response, erw_cpi .........................................................................27

4
I. INTRODUCTION
The recent financial crisis hit South Africa’s labor market severely (Figure 1). In 2009–10, South Africa lost about 3 4 million jobs—equivalent to about 5 percent of total employment at end-2008, and unemployment, which already hovered above 20 percent during the pre-crisis period, increased further to about 25 percent. The large loss of employment has been broad based, and has affected both the formal and informal sectors. It occurred despite the government’s aggressive counter-cyclical fiscal policy, which was reflected in a substantial increase in the public sector’s employment. The large magnitude of job losses seems to be disproportionate to the output path.1 Although, in terms of the GDP growth, the South African economy did not stand out compared to its emerging market peers, the loss of employment (as a percent of total employment) was the highest, and similar to that in advanced economies at the epicenter of the crisis (Figure 2). The large swing in employment during the recent business cycle may stem from the high degree of output-employment elasticity, which in part reflects the generally weak employment protection2 and the sluggish recovery in South Africa’s traditional trading partners, such as the United States, Europe, and Japan, which led to weak external demand. The large employment loss can also represent other factors, such as the recent rapid increase in real wages. Despite the contraction of economic activity in 2009, the tepid recovery in 2010, and the overall soft labor market conditions, the real wage continued to increase rapidly, outpacing the growth of labor productivity (Figure 3). The misalignment of real wages and labor productivity may reflect the outcomes of the collective bargaining framework in South Africa, which not only contributes to the weak link between pay and productivity, but also reduces the responsiveness of the real wage to business cycle fluctuations (Figure 4).
1 Zhan (2010).
2 The latest score (2008) for South Africa’s employment protection legislation index is 1.25. This score is below the OECD’s average (1.95) and the lowest among the G-20 emerging markets.
88
90
92
94
96
98
100
102
104
106
2008 - Q4 2009 - Q2 2009 - Q4 2010 - Q2 2010 - Q4 2011 - Q2
Figure 1. South Africa: Employment and GDP (2008Q4=100)
Total employment GDP
Source: StatSA and IMF staff's calculations.
ZAF
HUN
UKR
CHL
RUS
POLKOR
MEX
ARG
CHN
BRA
THA
PER
MAL
IDN
ISR
PHL
TUR
-15
-10
-5
0
5
10
15
20
25
-8 -6 -4 -2 0 2 4 6 8
GD
P g
row
th (
pe
rce
nt)
Employment growth (percent)
Figure 2: Output and Employment in Selected Economies, Cumulative Change 2008-10
Source: World Economic Outlook.

5
ARG
BRA
CHL
CHN
COL
HUNIND
IDN ISRKOR
MAL
MEXPER
PHL
POLRUS
ZAF
THA
TUR
UKR
2
2.5
3
3.5
4
4.5
5
5.5
2 3 3 4 4 5 5 6 6
Link
bet
wee
n pa
y an
d pr
oduc
tivity
Wage flexibility
Figure 4. Wage Flexibility and the Link Between Pay and Productivity in Selected Economies
Decentralize wage bargainingCentralize wage bargaining
No
t re
late
d
Mu
ch r
elat
ed
Source: The Global Competitivness Report 2010-11.
Against this background, the primary objective of this paper is to explore to what extent the recent employment loss can be attributed to real wage developments. Additionally, the paper assesses the link between real wage growth and the change in labor productivity, and compares it to that in peer economies. In particular, the paper focuses on the following questions: To what extent did the gap between real wage growth and labor productivity growth
(hereafter, “excess real wage growth”) contribute to substantial job-shedding in the recent years, and is its impact on formal and informal employment similar?
Is there a long-term link between labor productivity and real wages, and does the recent period reflect a substantial deviation from equilibrium?
Do the changes in labor market conditions affect real wage growth in emerging markets, and to what extent does the role of these factors differ in South Africa?
The analysis indicates that the excess real wage plays an important role in South Africa’s employment creation. In particular, the results show that higher excess real wage growth led to a negative and significant impact on overall and formal employment. Back-of-the-envelope calculations suggest that “excess” real wage growth accounts for at least 25 percent of the employment loss during 2008–2010. Although not conclusive, some results suggest that the impact of the excess real wage growth on informal employment is positive, thus implying that higher excess real wage generates a substitution between formal and informal workers. The results indicate that there is a long-run link between labor productivity and the real wage. Statistical tests indicate that the two variables are co-integrated, although the long-run relationship suggests that the elasticity is significantly below one, implying that real wage growth is driven by other factors. Additionally, the short-run dynamics indicate that the average adjustment period to the deviations from “equilibrium” is relatively long, estimated at 10–12 quarters. And indeed, during the recent financial crisis, the rapid increase in real wage represents a positive and persistent deviation from equilibrium. The analysis also looks
12.4
8.9
7.1
16.7
13.2
9.38.5
6.45.9
0
2
4
6
8
10
12
14
16
18
2007-2010 2008-2010 2009-2010
Pe
rce
nt
Figure 3. Cumulative Growth of Real Wage and Labor Productivity of the Non-Agricultural Sector
Real wage (deflated by CPI)
Real wage (deflated by GDP prices)
Labor productivity
Source: StatSA and IMF staff's calculations.

6
at the link between real wage growth and labor productivity growth from a cross-country perspective. It finds that the real wage growth is positively correlated with labor productivity growth; however, in South Africa the link between the two is significantly weaker, even after controlling for labor market tightness indicators, such as the unemployment and labor absorption rates. Although the results show clear evidence of a weak link between real wage growth and labor productivity growth in South Africa, they should be treated with caution given the substantial structural reforms the economy went through in past years, particularly in the post-apartheid era. These structural reforms have changed the economic environment and, by extension, the links between some economic variables. Additionally, data collection on wages, productivity, and output continues to be challenging because of the large informal sector’s activity, which may not be fully recorded. This is further complicated by “structural breaks” in the historical series owing to methodological changes in the coverage of the labor force surveys. Acknowledging these weaknesses, the analysis contains various robustness tests, ranging from different measures of real wages and estimation methods to different sample periods and data frequency. The main results remain valid under different specifications, suggesting that concerns about spurious links can be dismissed.3 The rest of the paper is structured as follows. Section II provides a brief review of related literature. Section III focuses on the recent financial crisis (2008–2011) and presents a sectoral analysis, which aims at exploring the impact of the excess real wage on employment, using several panel estimation methods. Section IV examines the long-term link between the real wage and labor productivity by using a co-integration approach. Section V focuses on the link between real wage growth and change in labor productivity in a cross-country perspective and assesses whether South Africa stands out in a sample of 20 comparable emerging and advanced economies. Section VI concludes.
II. A BRIEF LITERATURE REVIEW
The positive link between the real wage and labor productivity is well anchored in economic theory. Other things being equal, higher output per worker should increase the demand for workers and result in an increase in labor compensation as long as the labor supply curve is not perfectly elastic. Some theoretical models suggest that the causality between the two may also work in the opposite direction. Akerlof (1982), for instance, argued that higher real wages lead to greater effort from workers. Additionally, higher real wages put upward pressure on labor costs and cause firms to substitute capital for labor, thereby increasing the marginal productivity of labor (Wakeford, 2004). In some countries, such as Israel (Lavi and Sussman, 2001), Australia (Kumar, Webber and Perry, 2009), the United States (Strauss and Wohar, 2004), and Malaysia (Goh and Wong, 2010), the empirical evidence generally supports a long-term co-integrating link between labor productivity and
3 While data weaknesses are likely to introduce some noise to the examined time series, it is unlikely that the noise is skewed toward one direction.
7
real wage. A co-integrated link between labor productivity and real wage was also found in South Africa (Wakeford, 2004). In other studies that focused on South Africa, the link between the two was mainly studied in terms of a real wage equation that also included other factors (Fallon, 1992, and Fallon and da Silva, 1994). The absence of a strong link between the real wage and labor productivity in some countries can be explained by macroeconomic and/or institutional factors. These factors tend to create a wedge between the two variables, thus implying that gains in labor productivity are not fully translated to real wage increases (or vice versa) in the short or the long term. Factors that may have short-term effects are price and wage rigidities and labor adjustment costs. Other factors, which are structural in nature, can have a more protracted effect. Among them are employment protection, entry restrictions, and market regulations. Bargaining power of workers versus firms can also play an important role in weakening the link between labor productivity and real wage (Bentolila and Saint-Paul, 2003). The deviations of the real wage from the marginal productivity of labor have implications for the firms’ profitability margins, and thus may also have repercussions for unemployment and employment creation. A commonly used benchmark for aggregate wage pressure is provided by the “distributive margin formula,” which identifies wage pressure with the excess of real wage compared to the growth rate of labor productivity (e.g., European Commission, 2003), or the “wage gap,” which refers to the gap between the real wage and the marginal productivity of labor at full employment (Bruno and Sachs, 1985). And indeed some studies indicate that excess real wage (or the “wage gap”) is positively correlated with unemployment (Sachs 1983, Bruno and Sachs, 1985, and Junankar and Madsen, 2004) and negatively correlated with the employment-to-population ratio (OECD Employment Outlook, 2003),4 although the evidence is not conclusive and tends to vary by countries, periods, and estimation methodologies.5, 6 In South Africa, Fedderke and Mariotti (2002), who focused on sectoral developments in 1970–97, found that where the growth rate in real remuneration outstripped growth in labor productivity, employment tended to decline.
4 These studies mostly focused on the levels of unemployment and employment-to-population ratios rather than looking at the impact of the first difference of the variables.
5 Bruno and Sachs (1985) argued, for example, that the wedge between real wage and labor productivity (“wage gap”), which could be an indicator for aggregate supply, is an important element in explaining the variation in the level of unemployment among the OECD members during the 1970s and early 1980s.
6 The question of whether the real wage is positively or negatively correlated with unemployment is at the epicenter of the debate between the Classical and the Keynesian views.

8
III. THE SECTORAL DYNAMICS OF EMPLOYMENT, REAL WAGES, AND LABOR
PRODUCTIVITY IN 2008Q4–2011Q2
This section explores the link between real wage, productivity, and employment in 2008Q4–2011Q2, and assesses to what extent the real wage increases contributed to the job shedding observed in recent years.7
A. A Sectoral Perspective—Some Stylized Facts
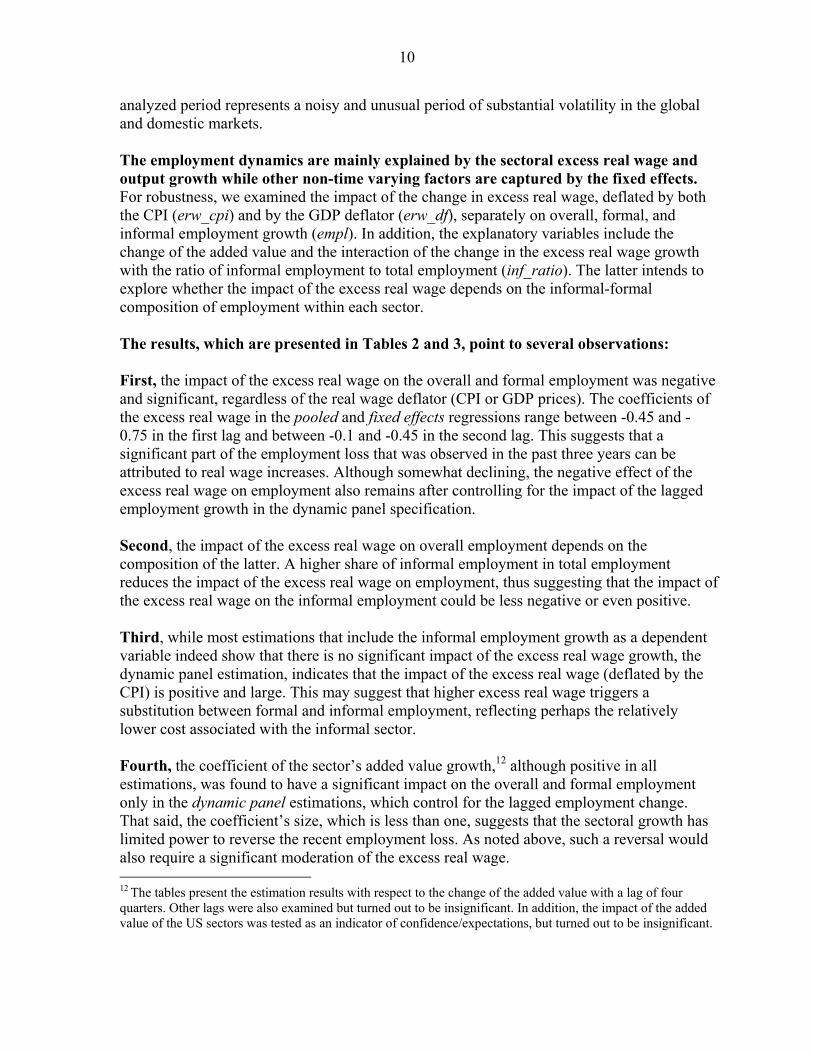
In absolute terms, most of the job shedding in the non-agricultural sector occurred in formal employment, particularly in manufacturing, trade, and construction, while in social services, finance, and utilities, employment increased (cumulative terms, Figure 5). At 2011Q2, informal employment (excl. agriculture) remained slightly below its pre-crisis level, reflecting a significant recovery in 2010, which almost offset the massive decline during 2009. The sectors’ employment and output patterns imply that most of them recorded labor productivity gains since 2008Q4 (Figure 6).8 On average, the cumulative increase during this period was 81 4 percent, and the most prominent increase was recorded in construction (22 percent), reflecting the non-trivial decline of 12 percent in employment and a 7 percent cumulative increase in its added value. Productivity in social services and finance remained flat owing to a proportional increase in labor and output. The cumulative decline in labor productivity in the utilities largely reflects the relatively sharp increase in employment since 2008Q4 (9 percent).
Source: StatSA and International Monetary Fund staff’s calculations.
7 This section relies on data from the Quarterly Labor Force Survey, (employment), Quarterly Employment Statistics (wages of the formal sector) and the national accounts (sectoral added value).
8 Agriculture and private households are excluded from the analysis given that they mostly consist of informal workers, and as a result data on wages is not available.
-25
-15
-5
5
15
25
35
-25
-15
-5
5
15
25
35
Pe
rce
nt
Figure 6. South Africa: The Cumulative Growth of Labor Productivity, 2008Q4-2011Q2
Productivity
Real wage (GDP prices)
Real wage (CPI)-20
-15
-10
-5
0
5
10
-250
-200
-150
-100
-50
0
50
100
150
200
Per
cent
Tho
usan
ds
Figure 5. South Africa: Employment Change by Sectors, 2008Q4-2011Q2
Formal employment
Informal employment
Percent change of overall employment (RHS)
9
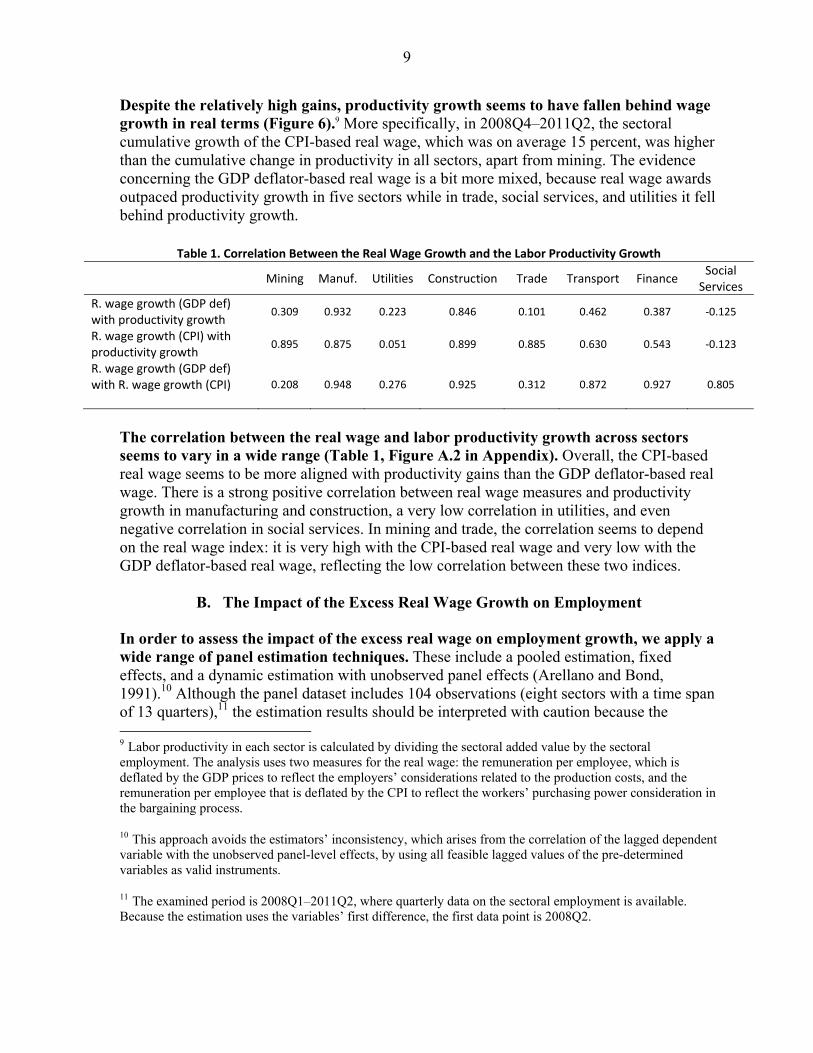
Despite the relatively high gains, productivity growth seems to have fallen behind wage growth in real terms (Figure 6).9 More specifically, in 2008Q4–2011Q2, the sectoral cumulative growth of the CPI-based real wage, which was on average 15 percent, was higher than the cumulative change in productivity in all sectors, apart from mining. The evidence concerning the GDP deflator-based real wage is a bit more mixed, because real wage awards outpaced productivity growth in five sectors while in trade, social services, and utilities it fell behind productivity growth.
The correlation between the real wage and labor productivity growth across sectors seems to vary in a wide range (Table 1, Figure A.2 in Appendix). Overall, the CPI-based real wage seems to be more aligned with productivity gains than the GDP deflator-based real wage. There is a strong positive correlation between real wage measures and productivity growth in manufacturing and construction, a very low correlation in utilities, and even negative correlation in social services. In mining and trade, the correlation seems to depend on the real wage index: it is very high with the CPI-based real wage and very low with the GDP deflator-based real wage, reflecting the low correlation between these two indices.
B. The Impact of the Excess Real Wage Growth on Employment
In order to assess the impact of the excess real wage on employment growth, we apply a wide range of panel estimation techniques. These include a pooled estimation, fixed effects, and a dynamic estimation with unobserved panel effects (Arellano and Bond, 1991).10 Although the panel dataset includes 104 observations (eight sectors with a time span of 13 quarters),11 the estimation results should be interpreted with caution because the 9 Labor productivity in each sector is calculated by dividing the sectoral added value by the sectoral employment. The analysis uses two measures for the real wage: the remuneration per employee, which is deflated by the GDP prices to reflect the employers’ considerations related to the production costs, and the remuneration per employee that is deflated by the CPI to reflect the workers’ purchasing power consideration in the bargaining process.
10 This approach avoids the estimators’ inconsistency, which arises from the correlation of the lagged dependent variable with the unobserved panel-level effects, by using all feasible lagged values of the pre-determined variables as valid instruments.
11 The examined period is 2008Q1–2011Q2, where quarterly data on the sectoral employment is available. Because the estimation uses the variables’ first difference, the first data point is 2008Q2.
Table 1. Correlation Between the Real Wage Growth and the Labor Productivity Growth
Mining Manuf. Utilities Construction Trade Transport Finance Social
Services
R. wage growth (GDP def) with productivity growth
0.309 0.932 0.223 0.846 0.101 0.462 0.387 -0.125
R. wage growth (CPI) with productivity growth
0.895 0.875 0.051 0.899 0.885 0.630 0.543 -0.123
R. wage growth (GDP def) with R. wage growth (CPI) 0.208 0.948 0.276 0.925 0.312 0.872 0.927 0.805
10
analyzed period represents a noisy and unusual period of substantial volatility in the global and domestic markets. The employment dynamics are mainly explained by the sectoral excess real wage and output growth while other non-time varying factors are captured by the fixed effects. For robustness, we examined the impact of the change in excess real wage, deflated by both the CPI (erw_cpi) and by the GDP deflator (erw_df), separately on overall, formal, and informal employment growth (empl). In addition, the explanatory variables include the change of the added value and the interaction of the change in the excess real wage growth with the ratio of informal employment to total employment (inf_ratio). The latter intends to explore whether the impact of the excess real wage depends on the informal-formal composition of employment within each sector. The results, which are presented in Tables 2 and 3, point to several observations: First, the impact of the excess real wage on the overall and formal employment was negative and significant, regardless of the real wage deflator (CPI or GDP prices). The coefficients of the excess real wage in the pooled and fixed effects regressions range between -0.45 and -0.75 in the first lag and between -0.1 and -0.45 in the second lag. This suggests that a significant part of the employment loss that was observed in the past three years can be attributed to real wage increases. Although somewhat declining, the negative effect of the excess real wage on employment also remains after controlling for the impact of the lagged employment growth in the dynamic panel specification. Second, the impact of the excess real wage on overall employment depends on the composition of the latter. A higher share of informal employment in total employment reduces the impact of the excess real wage on employment, thus suggesting that the impact of the excess real wage on the informal employment could be less negative or even positive. Third, while most estimations that include the informal employment growth as a dependent variable indeed show that there is no significant impact of the excess real wage growth, the dynamic panel estimation, indicates that the impact of the excess real wage (deflated by the CPI) is positive and large. This may suggest that higher excess real wage triggers a substitution between formal and informal employment, reflecting perhaps the relatively lower cost associated with the informal sector. Fourth, the coefficient of the sector’s added value growth,12 although positive in all estimations, was found to have a significant impact on the overall and formal employment only in the dynamic panel estimations, which control for the lagged employment change. That said, the coefficient’s size, which is less than one, suggests that the sectoral growth has limited power to reverse the recent employment loss. As noted above, such a reversal would also require a significant moderation of the excess real wage. 12 The tables present the estimation results with respect to the change of the added value with a lag of four quarters. Other lags were also examined but turned out to be insignificant. In addition, the impact of the added value of the US sectors was tested as an indicator of confidence/expectations, but turned out to be insignificant.

11
Table 2. Panel Estimation Using erw_cpi as Explanatory Variable1 Dependent variables: Change in overall employment, formal employment, and informal employment2
Pooled Regression Fixed Effects Dynamic Estimation with Unobserved Panel Effects
Overall empl.
Formal empl.
Informal empl.
Overall empl.
Formal empl.
Informal empl.
Overall empl.
Formal empl.
Informal empl.
d(empl(-1)
-0.737*
(-5.79) -0.798* (-5.72)
-0.928* (-8.21)
d(empl(-2)
-0.324* (-3.40)
d(erw_cpi(-1)) -0.765* (-7.17)
-0.615* (-6.77)
1.018 (1.26)
-0.791* (-7.11)
-0.625* (-6.63)
1.004 (1.19)
-0.277* (-5.40)
-0.166** (-1.98)
1.666* (2.95)
d(erw_cpi(-2)) -0.429* (-4.02)
-0.336* (-3.66)
0.076 (0.09)
-0.461* (-4.10)
-0.348* (-3.65)
0.058 (0.07)
-0.573* (-4.46)
-0.256*** (-1.84)
1.720*** (1.89)
D(added value(-4)) 0.271 (1.01)
0.288 (0.96)
1.955 (0.73)
0.265 (0.90)
0.279 (0.84)
1.946 (0.65)
0.440* (5.52)
0.618* (4.98)
0.556 (0.59)
d(erw_cpi(-1))*(inf_ ratio(-1))
0.024** (2.59)
0.026* (2.67)
0.017**
(2.28)
d(erw_cpi(-2))*(inf_ ratio(-2))
0.015 (1.58)
0.017***
(1.73)
0.020* (2.89)
Constant 0.165 (0.29)
0.170 (0.27)
-1.250 (-0.22)
0.171 (0.29)
0.189 (0.29)
-1.223 (-0.21)
-0.365 (-0.97)
-0.637 (-1.57)
-2.047 (-1.28)
# obs. 88 88 88 88 88 88 80 80 80
Table 3. Panel Estimation Using erw_df as Explanatory Variable1 Dependent variables: Change in overall employment, formal employment, and informal employment2
Pooled Regression Fixed Effects Dynamic Estimation with Unobserved
Panel Effects
Overall empl.
Formal empl.
Informal empl.
Overall empl.
Formal empl.
Informal empl.
Overall empl.
Formal empl.
Informal empl.
d(empl(-1)
-0.709*
(-5.28) -0.791* (-5.57)
-0.886* (-6.82)
d(empl(-2)
-0.378*
(-5.42) -0.422* (-3.64)
d(erw_df(-1)) -0.547* (-6.48)
-0.451* (-6.16)
-0.669 (-1.06)
-0.553* (-6.28)
-0.456* (-5.97)
-0.682 (-1.03)
-0.304* (-3.50)
-0.210* (-3.30)
0.498 (0.91)
d(erw_df(-2)) -0.133 (-1.55)
-0.13*** (-1.75)
0.520 (0.81)
-0.141 (-1.56)
-0.13*** (-1.77)
0.501 (0.74)
-0.155** (-2.33)
-0.151* (-2.68)
0.619 (0.99)
d(added value(-4)) 0.386 (1.42)
0.367 (1.19)
1.388 (0.52)
0.353 (1.17)
0.349 (1.02)
1.331 (0.45)
0.571* (8.07)
0.632* (5.50)
0.440 (0.64)
d(erw_df(-1))*(inf_ ratio(-1))
0.013** (2.09)
0.013** (2.01)
0.009
(1.42)
d(erw_df(-2))*(inf_ ratio(-2))
0.002 (0.43)
0.002 (0.42)
0.004
(1.17)
Constant -0.315 (-0.56)
-0.443 (-0.69)
-0.393 (-0.07)
-0.304 (-0.52)
-0.437 (-0.66)
-0.373 (-0.06)
-0.772** (-2.24)
-0.946** (-2.37)
0.341 (0.37)
# obs. 88 88 88 88 88 88 80 80 80 1Figures in parenthesis indicate t-statistics. 2d(empl(-X) indicates the dependent variable with X-quarter lag. Significance level: *significant at 1 percent, ** significant at 5 percent, *** significant at 10 percent.

12
C. The Link Between Employment, Output, and Excess Real Wage:a Panel VAR Approach
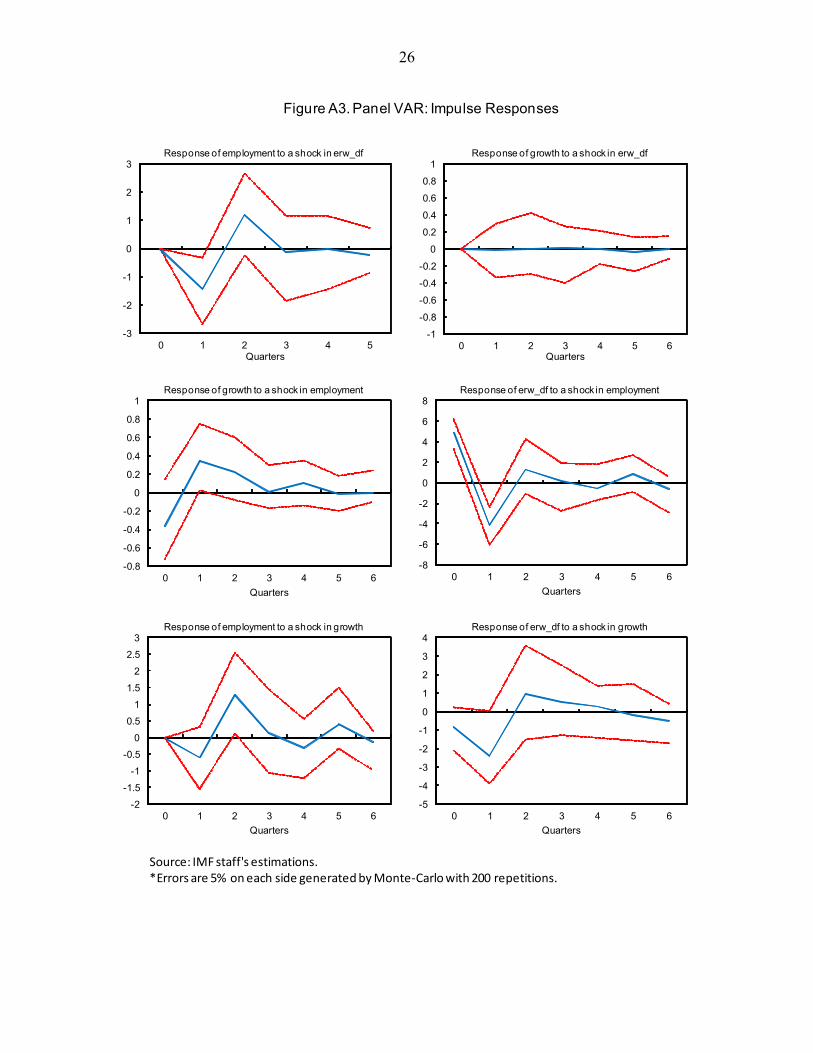
A panel VAR approach was also used to assess the link between employment, output growth and excess real wage. This approach combines the traditional VAR approach, which treats all the variables in the system as endogenous, with a panel data approach, which allows for unobserved individual heterogeneity (fixed effects). The advantage of the VAR approach is that it does not require any a priori assumptions on the direction of the feedback between the sectoral employment, growth, and the excess real wage.13 The dynamic behavior of the variables can then be assessed using impulse response function (IRFs), which describe the reaction of one variable in the system to innovation in another variable in the system while holding all other shocks at zero. As in the previous analysis, the IRFs also suggest that a higher excess real wage has a negative impact on employment (Figure 7 and Figures A3 and A4 in the Appendix). More specifically, the IRFs imply that a one percent increase in the excess real wage leads to a 25–30bp decline in employment within one quarter, similar to the results of the dynamic panel estimation. As expected, the IRFs show a positive link between growth and employment, with two-way causality. Interestingly, the IRFs do not point to a significant impact of the excess real wage on sectoral growth.
13 The panel VAR code is based on Love and Zicchino (2006).
Figure 7. Panel VAR, Impulse Response Functions
Source: IMF Staff's estimations.*Errors are 5% on each side generated by Monte-Carlo with 200 repetitions.
-3
-2
-1
0
1
2
3
0 1 2 3 4 5 6
Quarters
Response of overall employment growth to a shock in erw_cpi
-3
-2
-1
0
1
2
3
0 1 2 3 4 5 6
Quarters
Response of overall employment growth to a shock in erw_df
13
IV. THE LINK BETWEEN LABOR PRODUCTIVITY AND THE REAL WAGE: A LONG RUN
PERSPECTIVE
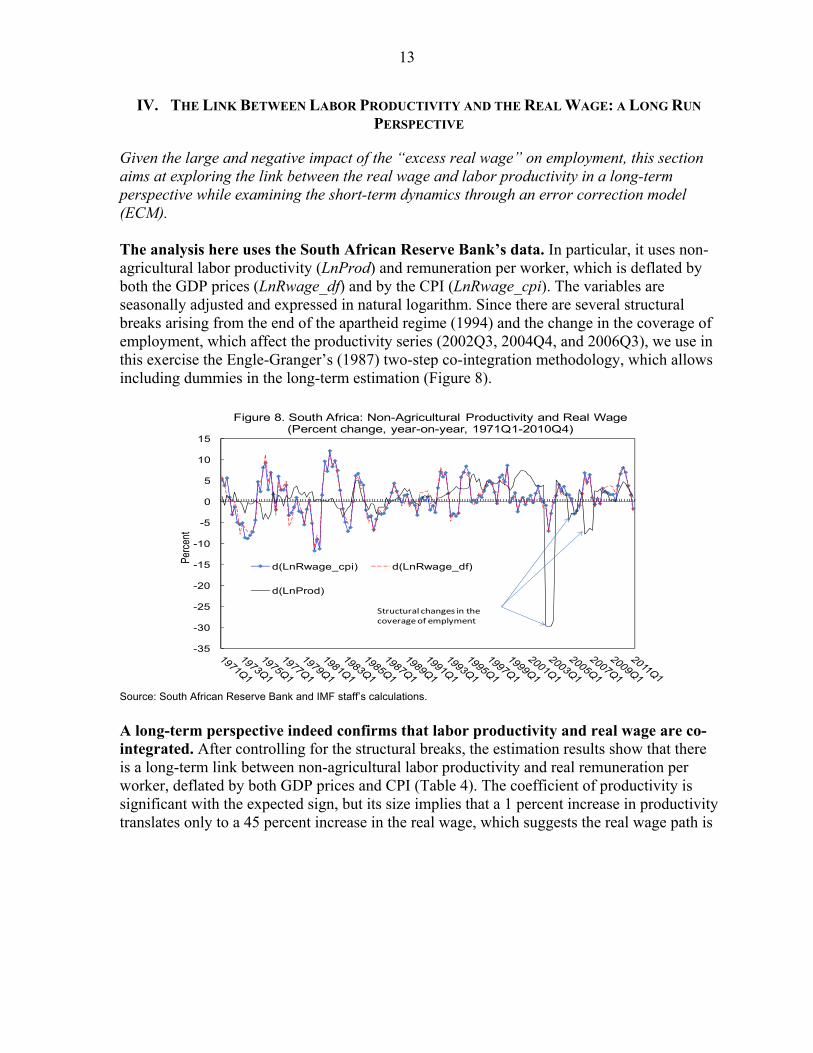
Given the large and negative impact of the “excess real wage” on employment, this section aims at exploring the link between the real wage and labor productivity in a long-term perspective while examining the short-term dynamics through an error correction model (ECM). The analysis here uses the South African Reserve Bank’s data. In particular, it uses non-agricultural labor productivity (LnProd) and remuneration per worker, which is deflated by both the GDP prices (LnRwage_df) and by the CPI (LnRwage_cpi). The variables are seasonally adjusted and expressed in natural logarithm. Since there are several structural breaks arising from the end of the apartheid regime (1994) and the change in the coverage of employment, which affect the productivity series (2002Q3, 2004Q4, and 2006Q3), we use in this exercise the Engle-Granger’s (1987) two-step co-integration methodology, which allows including dummies in the long-term estimation (Figure 8).
Source: South African Reserve Bank and IMF staff’s calculations.
A long-term perspective indeed confirms that labor productivity and real wage are co-integrated. After controlling for the structural breaks, the estimation results show that there is a long-term link between non-agricultural labor productivity and real remuneration per worker, deflated by both GDP prices and CPI (Table 4). The coefficient of productivity is significant with the expected sign, but its size implies that a 1 percent increase in productivity translates only to a 45 percent increase in the real wage, which suggests the real wage path is
-35
-30
-25
-20
-15
-10
-5
0
5
10
15
Perc
ent
Figure 8. South Africa: Non-Agricultural Productivity and Real Wage(Percent change, year-on-year, 1971Q1-2010Q4)
d(LnRwage_cpi) d(LnRwage_df)
d(LnProd)
Structural changes in the coverage of emplyment

14
also driven by other factors.14 The estimations’ residuals (EC_CPI and EC_DF) reject the null hypothesis of a unit root in the levels, thus pointing to a co-integration link (Table 5).15 The estimation’s residuals show that, over the past 40 years, the deviations from equilibrium were large, particularly during the 1970s when the two oil shocks (1973 and 1979) led to sharp negative deviations from equilibrium. Since the mid-1980s, the magnitude of the deviations has somewhat declined. In this context, the recent the financial crisis, which shows a positive deviation of about 51 2 percent at the peak, does not seem to be an outlier in terms of past deviations (Figure 5). Furthermore, in the last two quarters, the deviations from equilibrium seem to have narrowed to around 2–3 percent, reflecting the recent moderation of the real wage growth.
Table 5. The Long-Term Estimations’ Residuals, Unit Root Tests, 1970Q1–2011Q1
t-Statistic, ADF Prob.* t-Statistic, PP Prob.*
Null Hypothesis: EC_CPI has a unit root
EC_CPI** -5.983 0.000 -5.050 0.000
Null Hypothesis: EC_DF has a unit root
EC_DF** -6.005 0.000 -5.042 0.000
*MacKinnon (1996) one-sided p-values.
**EC_CPI refers to the residuals from the LnRwage_cpi estimation and EC_DF refers to the residuals from the LnRwage_df estimation. Source: IMF staff’s estimations.
14 Wakeford (2004), who focused on 1990–2002, also found that the long-run coefficient of productivity is significantly lower than one, yet slightly higher than the current estimation (0.58). Low levels of real wage productivity elasticity were found in Fallon (1992) and Fallon and Pereira da Silva (1994).
15 The long-run estimation results for the post-apartheid period (1994Q1–2011Q1) also yield the same elasticity, though the unit root assessment seems to depend on the specification of the test (Tables A.1 and A.2 in the Appendix).
Table 4. Labor Productivity and Real Wage: Long-Term Estimation, 1970Q1–2011Q1
Dependent Variable: LnRwage_df LnRwage_cpi
Variable Coefficient Prob. Coefficient Prob.
C -1.747 0.000 2.545 0.000
LnProd 0.446 0.000 0.440 0.000
Dum2002Q3 0.085 0.000 0.095 0.000
Dum2004Q4 0.006 0.113 0.015 0.012
Dum2006Q3 0.100 0.000 0.098 0.000
Dum1994 0.046 0.007 0.036 0.012
Adjusted R-squared 0.916 0.918

15
Source: IMF staff’s estimation.
The short-run dynamics were examined through an error correction model (ECM). The estimations show that the real wage growth responds to the deviations from equilibrium (with a one-quarter lag), and to the short-run dynamics of productivity growth, although the impact of the latter is rather small (Table A3 in the Appendix). Labor productivity, however, does not respond to real wage developments in the short-term or to the deviations from equilibrium. In addition, the size of error correction coefficients (0.23–0.31) implies that the deviations from equilibrium are rather persistent, and that, other things being equal, it takes 10–12 quarters to “correct” 95 percent of a deviation by the real wage movements. Robustness. The co-integrating link between the labor productivity and the real wage was also examined for the post-apartheid era (1994–2011). The results remain valid, although the adjustment coefficients decline somewhat to 0.19–0.25, thus suggesting that the adjustment period is 2–3 quarters longer (Figure A1 in the Appendix).
V. THE LINK BETWEEN THE REAL WAGE GROWTH AND THE CHANGE IN LABOR
PRODUCTIVITY: A CROSS-COUNTRY ANALYSIS
A cross-country analysis is used to examine the magnitude of the main determinants of the real wage growth in selected emerging and advanced economies. The analysis is based on annual data for 1996–2009 and covers nineteen emerging and advanced economies that are considered South Africa’s peer group.16 The data is taken from various sources, 16 The sample includes Argentina, Brazil, Chile, China, Colombia, Hungary, Indonesia, Israel, Korea, Malaysia, Mexico, Peru, Philippines, Poland, Russia, South Africa, Thailand, Turkey, and Ukraine. India, which is normally part of the peer group, is excluded on account of lack of employment data.
-0.2
-0.15
-0.1
-0.05
0
0.05
0.1
0.15
Figure 9. South Africa: Cointegrating Links Between Non-Agricultural Labor Productivity and Real Wage, 1970Q1-2010Q4
Co-integrating link (LnRwage_cpi)
Co-integrating link (LnRwage_df)

16
including the International Labour Organization’s (ILO) Global Wage Report 2010/11 (average nominal wages), the World Economic Outlook dataset (CPI and GDP deflator, which are used to calculate the wages in real terms, and GDP and employment levels, which are used to calculate the labor productivity), and the World Bank Development Indicators’ dataset (unemployment and absorption rates).
The cross-country comparison shows that overall the correlation between real wage growth and labor productivity growth are generally positive, although in some countries, such as Peru, China, and the Philippines, it is negative (1996–2009). Both the average and median of the correlations between labor productivity growth and the real wage are slightly higher when the real wage is deflated by the CPI (0.32 and 0.35, respectively) compared to the case where the real wage is deflated by the GDP prices (0.28 and 0.3, respectively). In South Africa, the correlation is positive, though it is still on the low side of the sample in both of the real wage indices. The wage equation was estimated in first difference. We use the two real wage indices as dependent variables: the average nominal wage deflated by the GDP prices (rwage_df) and the nominal average wage deflated by the CPI (rwage_cpi). The explanatory variables are the labor productivity growth, d(prod), which is expected to positively affect the real wages, and the change in unemployment, d(unemp), which aims at capturing the market conditions, particularly the gap between labor demand and supply.17, 18 Because in many countries the 17 A discussion on these variables in the context of a wage equation appears in Blanchard and Katz (1999).
18 The link between the change in unemployment and the change in real wage is consistent with the wage curve hypothesis (Blanchflower and Oswald, 1994).
Figure 10. Correlation Between the Real Wage Growth and Labor Productivity Growth in Selected Economies,1
Source:ILO, WEO, and IMF staff's calculations.1 Sample period may differ based on data availability.
-0.8
-0.6
-0.4
-0.2
0
0.2
0.4
0.6
0.8
1
PE
RC
HN
PH
LR
US
CH
LZ
AF
TH
AT
UR
CO
LA
RG
BR
AM
EX
UK
RH
UN
IDN
PO
LIS
RK
OR
Correlation between the growth of real wage growth (deflated by GDP prices) and labor productivity
-0.8
-0.6
-0.4
-0.2
0
0.2
0.4
0.6
0.8
1
PE
RP
HL
CH
NZ
AF
CO
LC
HL
TH
AB
RA
RU
SA
RG
ME
XH
UN
UK
RP
OL
ISR
IDN
KO
RT
UR
Correlation between the growth of real wage (deflated by CPI) and labor productivity

17
labor market participation rate fluctuated highly during the sample period, we also use the absorption rate (employment as a share of working age population), d(absrate), for a robustness check. These variables were also interacted with a dummy for South Africa (ZAF) to examine to what extent the links in South Africa are different from those of the sample’s average. The analysis includes a pooled estimation and fixed effects and dynamic panel estimations, which allow for unobserved individual heterogeneity. The estimation results are presented in Table 6 (estimations that include the change in unemployment rate) and Table 7 (estimations that include the change in absorption rate). The results confirm that the labor productivity growth plays an important role in the wage setting process. The coefficient of the labor productivity growth is positive, significantly different from zero, and remains sizable, even after controlling for the inertia in real wage growth. In addition, the labor markets’ tightness, as reflected by the unemployment rate was found to affect the real wage. Interestingly, the interaction of productivity growth with South Africa’s dummy variable (ZAF) suggests that, although productivity growth does affect the wage setting process in South Africa, its contribution to real wage growth is substantially lower than the sample’s average.
The results suggest that real wage growth is also affected by labor market tightness. Here, the absorption rate seems to be a better indicator than the unemployment rate. Although the contribution of the change in the unemployment rate was found to be significant in some specifications (Table 6), the estimations that included the change in the absorption rate were much more robust and suggest that higher employment-to-working age
Table 6. Cross-Country Panel Estimation Using Unemployment Rate as Explanatory Variable1 Dependent variable: Change in the real wage
Pooled Regression Fixed Effects Dynamic Estimation with Unobserved Panel Effects
d(rwage_df) d(rwage_cpi) d(rwage_df) d(rwage_cpi) d(rwage_df) d(rwage_cpi)
d(rwage_df(-1) 0.268*
(3.14)
d(rwage_cpi(-1) 0.307*
(4.46)
d(prod) 0.711* (6.72)
0.763* (7.21)
0.481* (4.30)
0.550* (4.98)
0.364*** (1.88)
0.509* (2.81)
d(prod)*ZAF -0.601***
(-1.77) -0.665***
(-1.96) -0.411 (-1.25)
-0.514 (-1.59)
-0.310*** (-1.71)
-0.381** (-2.39)
d(unemp) -0.074 (-0.20)
-0.676*** (-1.87)
-0.186 (-0.53)
-0.830** (-2.41)
-0.075 (-0.11)
-0.632 (-1.01)
d(unemp)*ZAF 0.317 (0.36)
0.671 (0.76)
0.326 (0.38)
0.663 (0.79)
0.021 (0.02)
-0.014 (-0.02)
Constant 0.249
(0.613) 0.938***
(1.90) 0.778 (1.63)
1.432* (3.04)
0.471 (0.75)
0.716 (1.62)
# obs. 241 241 241 241 203 203 1Figures in parenthesis indicate t-statistics.Significance level: *significant at 1 percent, ** significant at 5 percent, *** significant at 10 percent.

18
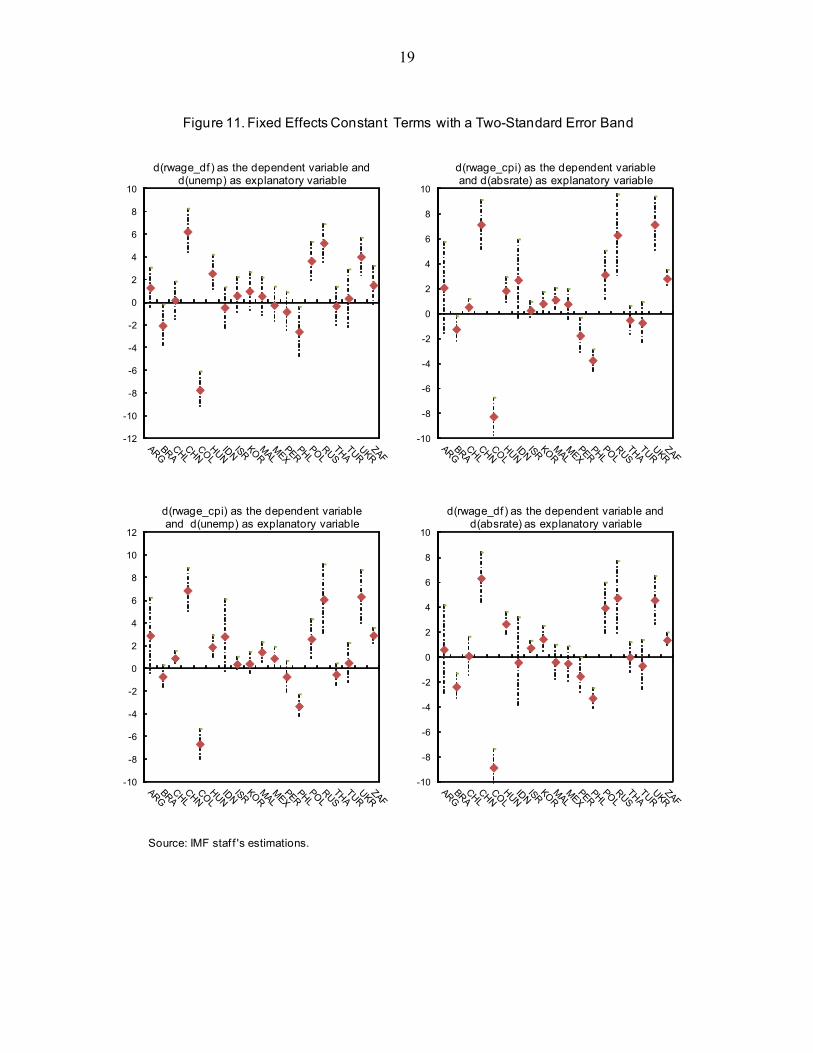
population ratio (lower slack) leads to higher real wage growth.19 While the interactions of the unemployment and absorption rates with South Africa’s dummy variable produced a coefficient with the opposite sign, none of the estimations showed that the impact of the labor market tightness on the real wage growth is significantly different in South Africa (compared to the sample average). The estimated fixed effects constant terms, which may reveal the real wage growth inertia, show much variability across countries (Figure 11). The estimation results, which include the change of the CPI-deflated wage as the dependent variable, show that, with a few exceptions, the constant terms were broadly positive, averaging 1–1.5 percent. Thus the intercept for South Africa is estimated to be slightly higher at about 23 4 –3 percent and is statistically different from zero. The estimation results, which include the change in the GDP-prices deflated wage, are lower and on average around 1 2 percent, yet the estimated constant terms for South Africa are still above the average at about 1–11 2 percent.
19 Blanchflower and Oswald (1994, 2005[Add the 2005 entry to the References]) interpreted the negative coefficient of unemployment as a bargaining power effect. In particular, they argued that higher unemployment reduces the possibility for workers to find jobs if they will be laid off, thus agreeing to lower real wages. In addition, higher unemployment can reflect an increasing gap between demand and supply of labor, which reduces the equilibrium real wage.
Table 7. Cross-Country Panel Estimation Using Labor Absorption Rate as an Explanatory Variable1 Dependent variable: Change in the real wage
Pooled Regression Fixed Effects Dynamic Estimation with Unobserved Panel Effects
d(rwage_df) d(rwage_cpi) d(rwage_df) d(rwage_cpi) d(rwage_df) d(rwage_cpi)
d(rwage_df(-1)) 0.286*
(3.72)
d(rwage_cpi(-1)) 0.339*
(5.23)
d(prod) 0.787* (7.10)
0.848* (7.57)
0.502* (4.23)
0.570* (4.87)
0.409** (2.45)
0.446** (2.33)
d(prod)*ZAF -0.705** (-2.01)
-0.777** (-2.19)
-0.454 (-1.36)
-0.551*** (-1.68)
-0.388** (-2.21)
-0.381** (-2.21)
d(absrate) 0.587 (1.33)
1.108** (2.47)
1.095** (2.56)
1.632* (3.87)
1.377** (1.98)
1.574** (2.06)
d(absrate)*ZAF -1.04
(-0.66) -1.139 (-0.71)
-1.372 (-0.93)
-1.388 (-0.95)
-1.387 (-1.18)
-0.367 (-0.42)
Constant -0.104 (-0.20)
0.572 (1.06)
0.614 (1.19)
1.272** (2.50)
0.197 (0.33)
0.690 (1.22)
# obs. 228 228 228 228 189 189 1Figures in parenthesis indicate t-statistics.Significance level: *significant at 1 percent, ** significant at 5 percent, *** significant at 10 percent.
19
Figure 11. Fixed Effects Constant Terms with a Two-Standard Error Band
Source: IMF staf f 's estimations.
-12
-10
-8
-6
-4
-2
0
2
4
6
8
10
d(rwage_df) as the dependent variable and d(unemp) as explanatory variable
-10
-8
-6
-4
-2
0
2
4
6
8
10
d(rwage_cpi) as the dependent variable and d(absrate) as explanatory variable
-10
-8
-6
-4
-2
0
2
4
6
8
10
12
d(rwage_cpi) as the dependent variable and d(unemp) as explanatory variable
-10
-8
-6
-4
-2
0
2
4
6
8
10
d(rwage_df) as the dependent variable and d(absrate) as explanatory variable
20
VI. CONCLUSIONS
The paper looks at the dynamics of employment during the financial crisis and examines, from a sectoral perspective, the contribution of real wage growth to the massive job shedding observed in South Africa. The paper’s main finding is that the “excess” real wage, which increased quite rapidly in some sectors, had an important role in suppressing employment creation. Interestingly, the results show that the impact of the excess real wage growth depends on the composition of employment within each sector. The analysis shows that the negative impact of the excess real wage growth is stronger when the share of formal employment is higher thus indicating that the net effect of the excess real wage growth on informal employment is positive. This result suggests that higher excess real wage growth generates a substitution between formal and informal employment given the relatively low cost of the latter. The paper also investigates the long-term link between the real wage and labor productivity while looking at their short-term dynamics. The results confirm that the two variables are co-integrated, in line with empirical evidence elsewhere, although the deviations from “equilibrium” are persistent and take about 10–12 quarters on average. And indeed, during the past three years, the rapid growth of the real wage was reflected in a positive deviation from its equilibrium level. The short-term dynamics, which are assessed through an error correction model, reveal that the real wage is the one that normally adjusts to the deviations from equilibrium, in addition to its response to the short-term dynamics of labor productivity. Finally, the paper examines the link between real wage growth and labor productivity growth from an international perspective. The analysis confirms that labor productivity growth has, on average, a positive and significant impact on real wage growth; however, in South Africa, the link between the two is substantially weaker than in other emerging markets, even after controlling for labor market tightness indicators such as unemployment and labor absorption rates. This suggests that, in South Africa, real wage growth is largely driven by other factors, which delink it from labor market conditions. While creating unwarranted rigidities in the labor market, these factors also amplify the impact of shocks on employment creation, as was observed in the past three years.

21
REFERENCES
Akerlof, G. A., 1982, “Labor Contracts as Partial Gift Exchange,” Quarterly Journal of Economics, 97, pp. 543–69.
Arellano, M. and S. Bond. 1991. “Some tests of specification for panel data: Monte Carlo evidence and an application to employment equations,” The Review of Economic Studies, 58. pp. 277 – 297. Bentolila, S., and G. Saint-Paul, 2003, “Explaining Movements in the Labor Share,” Contributions to Macroeconomics, 3 (1), Article 9. Blanchard, O., and L. Katz, 1999, “Wage Dynamics: Reconciling Theory and Evidence,” American Economic Review, Vol. 89(2), pp. 69–74, May. Blanchflower, D., and A. Oswald, 1994, “Estimating a Wage Curve for Britain: 1973–90,” Economic Journal, Royal Economic Society, Vol. 104(426), p. 1025–43. Bruno, M., and J.D. Sachs, 1985, Economics of Worldwide Stagflation, (Cambridge, MA: Harvard University Press). Engle, R., and C. Granger, 1987, “Co-integration and Error Correction: Representation, Estimation and Testing,” Econometrica, 55(2), 251–276. European Commission, 2003, “Employment in Europe 2003: Recent Trends and Prospects,” Brussels. Fallon, P., 1992, “An Analysis of Employment and Wage Behaviour in South Africa,” Informal Discussion Papers on Aspects of the Economy of South Africa No. 3, (Washington: The World Bank Southern Africa Department). Fallon, P., and L. Pereira da Silva, 1994, “South Africa: Economic Performance and Policies,” Informal Discussion Papers on Aspects of the Economy of South Africa No. 7, (Washington: The World Bank Southern Africa Department). Fedderke, J. W., and M. Mariotti, 2002, “Changing Labour Market Conditions in South Africa: A Sectoral Analysis for the Period 1970–1997,” South African Journal of Economics, Vol. 70(5), pp. 830–864. Global Wage Report 2010/11, “Wage Policies in Times of Crisis,” (Washington: International Labour Organization,) December 2010. Goh, S.K., and K.N. Wong, 2010, “Analyzing the Productivity-Wage-Unemployment Nexus in Malaysia: Evidence from the Macroeconomic Perspective,” International Research Journal of Finance and Economics, Issue 53. Junankar, P.N., and J.B. Madsen, 2004, “Unemployment in the OECD: Models and Mysteries,” IZA Discussion Paper No. 1168 (Bonn: Institute for the Study of Labor).

22
Kingdon, G., and J. Knight, 1998, “Unemployment and Wages in South Africa: A Spatial Approach,” Centre for the Study of African Economies Working Paper WPS/99/12 (Oxford: Oxford University). Kumar, S., D.J. Webber, and G. Perry (2009), “Real Wages, Inflation and Labour Productivity in Australia,” Department of Economics Discussion Paper 0921, (Bristol: University of the West of England). Lavi, Y., and N. Sussman, 2001, “The Determination of Real Wages in the Long Run and its Changes in the Short Run—Evidence from Israel: 1968–1998,” Bank of Israel Discussion Paper No. 2001.04 (city?: Bank of Israel). Love, I., and L. Zicchino, 2006, “Financial Development and Dynamic Investment Behavior: evidence from Panel VAR,” The Quarterly Review of Economics and Finance, 46, 190–210.
OECD Employment Outlook, 2004, (Paris: Organisation for Economic Cooperation and Development).
Rotemberg, J., and M. Woodford, 1991, “Markups and the Business Cycle,” in NBER Macroeconomics Annual 1991, edited by Olivier Blanchard and Stanley Fischer, pp. 63–129 (Cambridge, MA: MIT Press).
Sachs, J.D., 1983, “Real Wages and Unemployment in the OECD Countries,” Brookings Papers on Economic Activity, 1:1983 (Washington: The Brookings Institution). Strauss, J., and M. E. Wohar, 2004, “The Linkage between Prices, Wages and Labor Productivity: a Panel Study of Manufacturing Industries,” Southern Economic Journal, 70, pp. 920–941. Wakeford, J., 2004, “The Productivity-wage Relationship in South Africa: An empirical Investigation,” Development South Africa, 21, pp. 109–32. Zhan, Z., 2010, “Why Has South Africa Lost Proportionately More Jobs than Countries at the Epicenter of the Crisis?” Internal IMF Analytical Note (Washington: International Monetary Fund).

23
Appendix
Table A2. The Long-Term Estimations’ Residuals, Unit Root Tests, 1994Q1–2011Q1
t-Statistic, ADF Prob. t-Statistic, PP Prob.
Null Hypothesis: EC_CPI has a unit root
EC_CPI* -2.538 0.111 -4.406 0.000
Null Hypothesis: EC_DF has a unit root
EC_DF* -2.356 0.158 -3.951 0.002
*MacKinnon (1996) one-sided p-values.
*EC_CPI refers to the residuals from the LnRwage_cpi estimation, and EC_DF refers to the residuals from the LnRwage_df estimation.
-0.08
-0.06
-0.04
-0.02
0
0.02
0.04
0.06
0.08
Figure A1. South Africa: Cointegrating Links Between Non-Agricultural Labor Productivity and Real Wage, 1994Q1-2011Q1
Co-integrating link (LnRwage_cpi)
Co-integrating link (LnRwage_df)
Source: IMF staff's estimations.
Table A1. Labor Productivity and Real Wage: Long-Term Estimation 1994Q1–2011Q1
Dependent Variable: LnRwage_df LnRwage_cpi
Variable Coefficient Prob. Coefficient Prob.
C -1.774 0.000 2.40 0.000
LnProd 0.462 0.000 0.480 0.000
Dum2002Q3 0.086 0.000 0.098 0.000
Dum2004Q4 0.006 0.150 0.015 0.008
Dum2006Q3 0.100 0.000 0.098 0.000
Adjusted R-squared 0.867 0.911

24
Table A3. Short-Term Dynamics of the Real Wage
Dependent Variable
D(LnRwage_cpi)1970Q1-2011Q1
D(LnRwage_cpi)1994Q1-2011Q1
D(LnRwage_df) 1970Q1-2011Q1
D(LnRwage_df)1994Q1-2011Q1
C 0.000
(0.321) 0.005**(2.223)
0.001 (0.563)
0.005**(2.055)
EC_CPI(-1) -0.316*(-6.111)
-0.247**(-2.364)
EC_DF(-1)
-0.229* (-3.807)
-0.193**(-2.034)
D(LNPROD(-1)) 0.100*(2.623)
0.134*(2.706)
0.073*** (1.818)
0.121**(2.306)
D(LNPROD(-2)) -0.025
(-0.559) -0.025
(-0.482) -0.037
(-1.039) -0.035
(-0.640)
D(LNRWAGE_CPI(-1)) 0.067
(0.724) -0.042
(-0.323)
D(LNRWAGE_CPI(-2)) 0.074
(0.938) -0.031
(-0.268)
D(LNRWAGE_CPI(-3)) 0.067
(0.904)
D(LNRWAGE_CPI(-4)) 0.247*(3.052)
D(LNRWAGE_DF(-1))
0.041 (0.480)
-0.101(-0.742)
D(LNRWAGE_DF(-2))
0.015 (0.160)
-0.008(-0.069)
D(LNRWAGE_DF(-3))
0.012 (0.144)
D(LNRWAGE_DF(-4))
0.193** (2.227)
Adjusted R-squared 0.142 0.165 0.083 0.131
Significance level: * significant at 1 percent. ** significant at 5 percent. *** significant at 10 percent. Source: IMF staff’s estimations.

25
Real wage (deflated by CPI)
Labor productivity
Real wage (deflated by GDP prices)
Figure A.2. South Africa: Real Wage and Labor Productivity (2008Q4=100)
Source: StatSA and IMF staf f 's calculations.
60
70
80
90
100
110
120
130
140
2008 -Q4
2009 -Q2
2009 -Q4
2010 -Q2
2010 -Q4
2011 -Q2
Mining
60
70
80
90
100
110
120
130
140
2008 -Q4
2009 -Q2
2009 -Q4
2010 -Q2
2010 -Q4
2011 -Q2
Manufacturing
60
70
80
90
100
110
120
130
140
2008 -Q4
2009 -Q2
2009 -Q4
2010 -Q2
2010 -Q4
2011 -Q2
Utilities
60
70
80
90
100
110
120
130
140
2008 -Q4
2009 -Q2
2009 -Q4
2010 -Q2
2010 -Q4
2011 -Q2
Construction
60
70
80
90
100
110
120
130
2008 -Q4
2009 -Q2
2009 -Q4
2010 -Q2
2010 -Q4
2011 -Q2
Trade
60
70
80
90
100
110
120
130
2008 -Q4
2009 -Q2
2009 -Q4
2010 -Q2
2010 -Q4
2011 -Q2
Transportation
60
70
80
90
100
110
120
130
2008 -Q4
2009 -Q2
2009 -Q4
2010 -Q2
2010 -Q4
2011 -Q2
Finance
60
70
80
90
100
110
120
130
2008 - Q4 2009 - Q2 2009 - Q4 2010 - Q2 2010 - Q4
Social services
26
Figure A3. Panel VAR: Impulse Responses
Source: IMF staff's estimations.*Errors are 5% on each side generated by Monte-Carlo with 200 repetitions.
-3
-2
-1
0
1
2
3
0 1 2 3 4 5Quarters
Response of employment to a shock in erw_df
-1
-0.8
-0.6
-0.4
-0.2
0
0.2
0.4
0.6
0.8
1
0 1 2 3 4 5 6Quarters
Response of growth to a shock in erw_df
-0.8
-0.6
-0.4
-0.2
0
0.2
0.4
0.6
0.8
1
0 1 2 3 4 5 6
Quarters
Response of growth to a shock in employment
-8
-6
-4
-2
0
2
4
6
8
0 1 2 3 4 5 6
Quarters
Response of erw_df to a shock in employment
-2
-1.5
-1
-0.5
0
0.5
1
1.5
2
2.5
3
0 1 2 3 4 5 6
Quarters
Response of employment to a shock in growth
-5
-4
-3
-2
-1
0
1
2
3
4
0 1 2 3 4 5 6
Quarters
Response of erw_df to a shock in growth

27
Figure A4. Panel VAR: Impulse Responses
Source: IMF staff's estimations.*Errors are 5% on each side generated by Monte-Carlo with 200 repetitions.
-3
-2.5
-2
-1.5
-1
-0.5
0
0.5
1
1.5
2
2.5
0 1 2 3 4 5 6Quarters
Response of employment to a shock in erw_cpi
-0.6
-0.4
-0.2
0
0.2
0.4
0.6
0 1 2 3 4 5 6Quarters
Response of growth to a shock in erw_cpi
-1
-0.8
-0.6
-0.4
-0.2
0
0.2
0.4
0.6
0.8
0 1 2 3 4 5 6
Quarters
Response of growth to a shock in employment
-8
-6
-4
-2
0
2
4
6
8
1 2 3 4 5 6 7
Quarters
Response of erw_cpi to a shock in employment
-2
-1.5
-1
-0.5
0
0.5
1
1.5
2
0 1 2 3 4 5 6
Quarters
Response of employment to a shock in growth
-2.5
-2
-1.5
-1
-0.5
0
0.5
1
1.5
2
1 2 3 4 5 6 7
Quarters
Response of erw_cpi to a shock in growth