Ohio Leading Indicators July 2013 - Ohio Labor Market Information
22
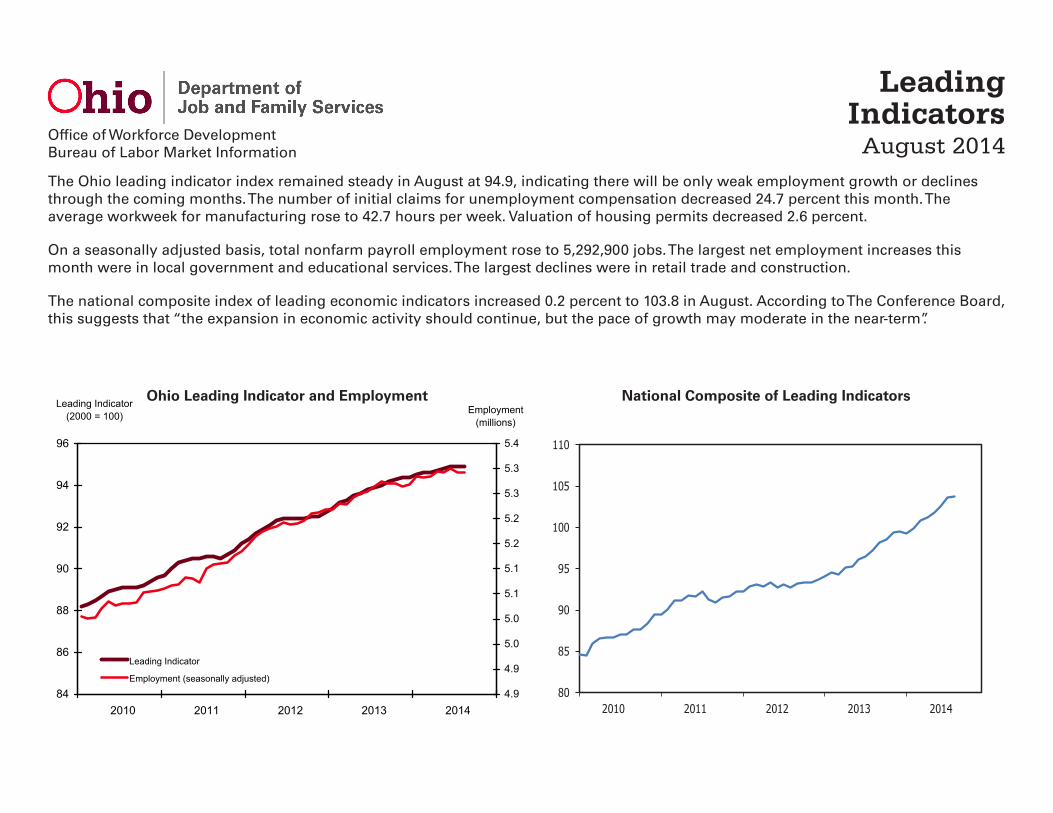
Leading Indicators August 2014 Office of Workforce Development Bureau of Labor Market Information The Ohio leading indicator index remained steady in August at 94.9, indicating there will be only weak employment growth or declines through the coming months. The number of initial claims for unemployment compensation decreased 24.7 percent this month. The average workweek for manufacturing rose to 42.7 hours per week. Valuation of housing permits decreased 2.6 percent. On a seasonally adjusted basis, total nonfarm payroll employment rose to 5,292,900 jobs. The largest net employment increases this month were in local government and educational services. The largest declines were in retail trade and construction. The national composite index of leading economic indicators increased 0.2 percent to 103.8 in August. According to The Conference Board, this suggests that “the expansion in economic activity should continue, but the pace of growth may moderate in the near-term” . 84 86 88 90 92 94 96 2010 2011 2012 2013 2014 Employment (millions) 4.9 4.9 5.0 5.0 5.1 5.1 5.2 5.2 5.3 5.3 5.4 Leading Indicator (2000 = 100) Leading Indicator Employment (seasonally adjusted) 80 85 90 95 100 105 110 2010 2011 2012 2013 2014 Ohio Leading Indicator and Employment National Composite of Leading Indicators
Transcript of Ohio Leading Indicators July 2013 - Ohio Labor Market Information
Leading Indicators
August 2014Office of Workforce Development Bureau of Labor Market Information
The Ohio leading indicator index remained steady in August at 94.9, indicating there will be only weak employment growth or declines through the coming months. The number of initial claims for unemployment compensation decreased 24.7 percent this month. The average workweek for manufacturing rose to 42.7 hours per week. Valuation of housing permits decreased 2.6 percent.
On a seasonally adjusted basis, total nonfarm payroll employment rose to 5,292,900 jobs. The largest net employment increases this month were in local government and educational services. The largest declines were in retail trade and construction.
The national composite index of leading economic indicators increased 0.2 percent to 103.8 in August. According to The Conference Board, this suggests that “the expansion in economic activity should continue, but the pace of growth may moderate in the near-term”.
84
86
88
90
92
94
96
2010 2011 2012 2013 2014
Employment(millions)
4.9
4.9
5.0
5.0
5.1
5.1
5.2
5.2
5.3
5.3
5.4
Leading Indicator(2000 = 100)
Leading Indicator
Employment (seasonally adjusted)80
85
90
95
100
105
110
2010 2011 2012 2013 2014
Ohio Leading Indicator and Employment National Composite of Leading Indicators
2
Ohio Leading Indicators – August 2014
United States Ohio
0
1
2
3
4
5
6
2010 2011 2012 2013 2014
Millions of Units
0
30
60
90
120
2010 2011 2012 2013 2014
Thousands
38
39
40
41
42
43
44
2010 2011 2012 2013 2014
Hours per Week
0
50
100
150
200
250
300
350
400
450
2010 2011 2012 2013 2014
Millions of Dollars
0
500
1,000
1,500
2,000
2,500
3,000
2010 2011 2012 2013 2014
Units
Total Units
Single Family Units
U.S. Domestic Auto Production
Initial Claims for Unemployment Insurance Average Weekly Hours in Manufacturing
Valuation of Housing Permits Number of Housing Permits
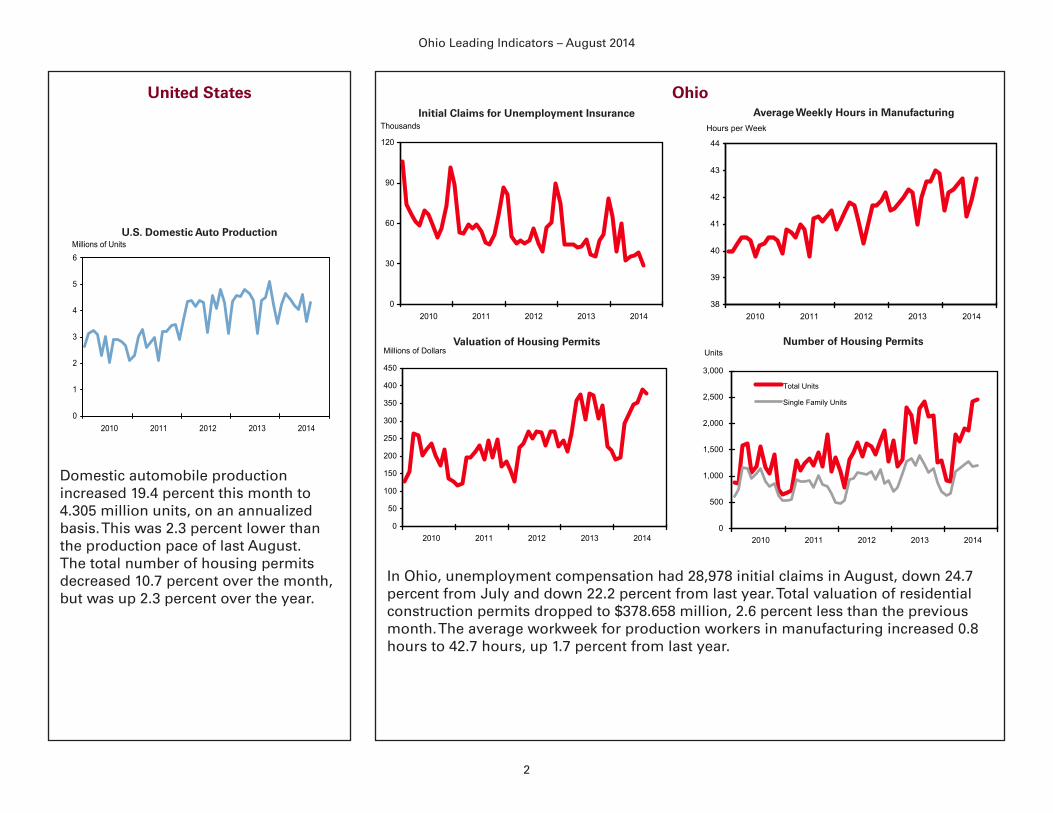
Domestic automobile production increased 19.4 percent this month to 4.305 million units, on an annualized basis. This was 2.3 percent lower than the production pace of last August. The total number of housing permits decreased 10.7 percent over the month, but was up 2.3 percent over the year.
In Ohio, unemployment compensation had 28,978 initial claims in August, down 24.7 percent from July and down 22.2 percent from last year. Total valuation of residential construction permits dropped to $378.658 million, 2.6 percent less than the previous month. The average workweek for production workers in manufacturing increased 0.8 hours to 42.7 hours, up 1.7 percent from last year.
3
Ohio Leading Indicators – August 2014
United States Aug Sep Oct Nov Dec Jan Feb Mar Apr May Jun Jul Aug Percent Change
2013 2013 2013 2013 2013 2014 2014 2014 2014 2014 2014 2014a 2014b Month Yearc
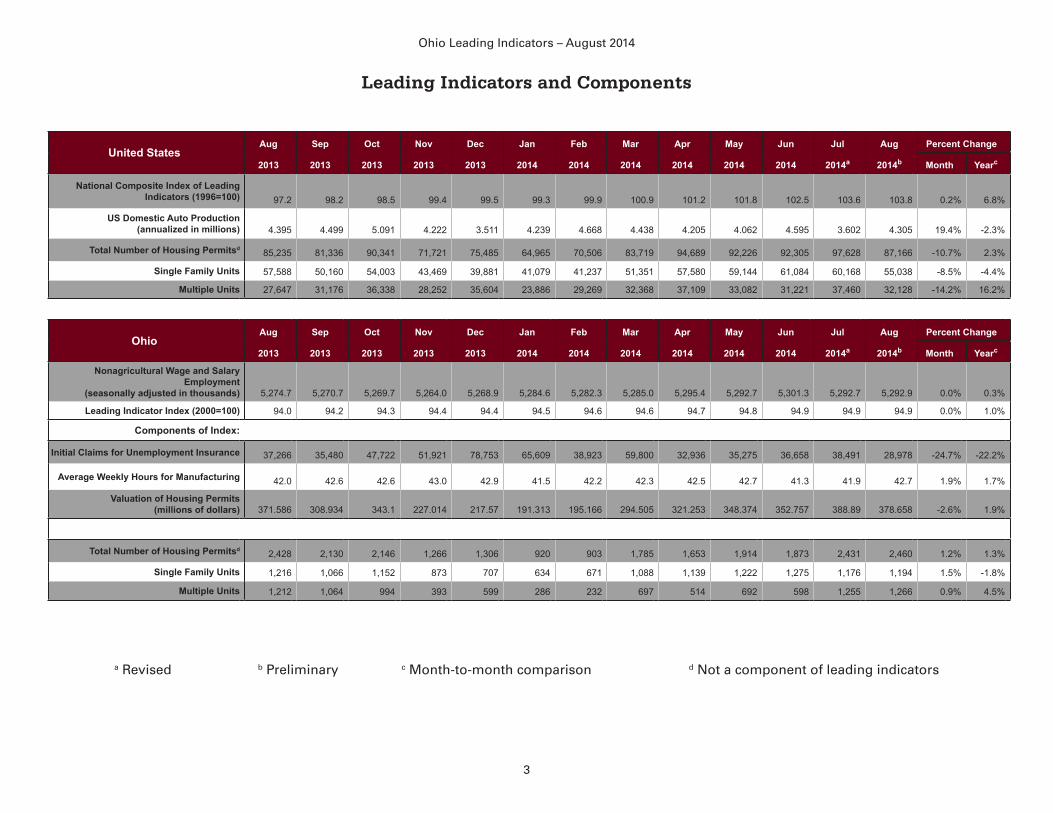
National Composite Index of Leading Indicators (1996=100) 97.2 98.2 98.5 99.4 99.5 99.3 99.9 100.9 101.2 101.8 102.5 103.6 103.8 0.2% 6.8%
US Domestic Auto Production (annualized in millions) 4.395 4.499 5.091 4.222 3.511 4.239 4.668 4.438 4.205 4.062 4.595 3.602 4.305 19.4% -2.3%
Total Number of Housing Permitsd 85,235 81,336 90,341 71,721 75,485 64,965 70,506 83,719 94,689 92,226 92,305 97,628 87,166 -10.7% 2.3%
Single Family Units 57,588 50,160 54,003 43,469 39,881 41,079 41,237 51,351 57,580 59,144 61,084 60,168 55,038 -8.5% -4.4%
Multiple Units 27,647 31,176 36,338 28,252 35,604 23,886 29,269 32,368 37,109 33,082 31,221 37,460 32,128 -14.2% 16.2%
OhioAug Sep Oct Nov Dec Jan Feb Mar Apr May Jun Jul Aug Percent Change
2013 2013 2013 2013 2013 2014 2014 2014 2014 2014 2014 2014a 2014b Month Yearc
Nonagricultural Wage and Salary Employment
(seasonally adjusted in thousands) 5,274.7 5,270.7 5,269.7 5,264.0 5,268.9 5,284.6 5,282.3 5,285.0 5,295.4 5,292.7 5,301.3 5,292.7 5,292.9 0.0% 0.3%
Leading Indicator Index (2000=100) 94.0 94.2 94.3 94.4 94.4 94.5 94.6 94.6 94.7 94.8 94.9 94.9 94.9 0.0% 1.0%
Components of Index:
Initial Claims for Unemployment Insurance 37,266 35,480 47,722 51,921 78,753 65,609 38,923 59,800 32,936 35,275 36,658 38,491 28,978 -24.7% -22.2%
Average Weekly Hours for Manufacturing 42.0 42.6 42.6 43.0 42.9 41.5 42.2 42.3 42.5 42.7 41.3 41.9 42.7 1.9% 1.7%
Valuation of Housing Permits (millions of dollars) 371.586 308.934 343.1 227.014 217.57 191.313 195.166 294.505 321.253 348.374 352.757 388.89 378.658 -2.6% 1.9%
Total Number of Housing Permitsd 2,428 2,130 2,146 1,266 1,306 920 903 1,785 1,653 1,914 1,873 2,431 2,460 1.2% 1.3%
Single Family Units 1,216 1,066 1,152 873 707 634 671 1,088 1,139 1,222 1,275 1,176 1,194 1.5% -1.8%
Multiple Units 1,212 1,064 994 393 599 286 232 697 514 692 598 1,255 1,266 0.9% 4.5%
a Revised b Preliminary c Month-to-month comparison d Not a component of leading indicators
Leading Indicators and Components
4
Ohio Leading Indicators – August 2014
Akron Metropolitan Statistical Area Portage and Summit Counties
90
92
94
96
98
100
102
104
2010 2011 2012 2013 2014
Employment(thousands)
305
310
315
320
325
330
335
Leading Indicator(2000 = 100)
Leading Indicator
Employment (seasonally adjusted)
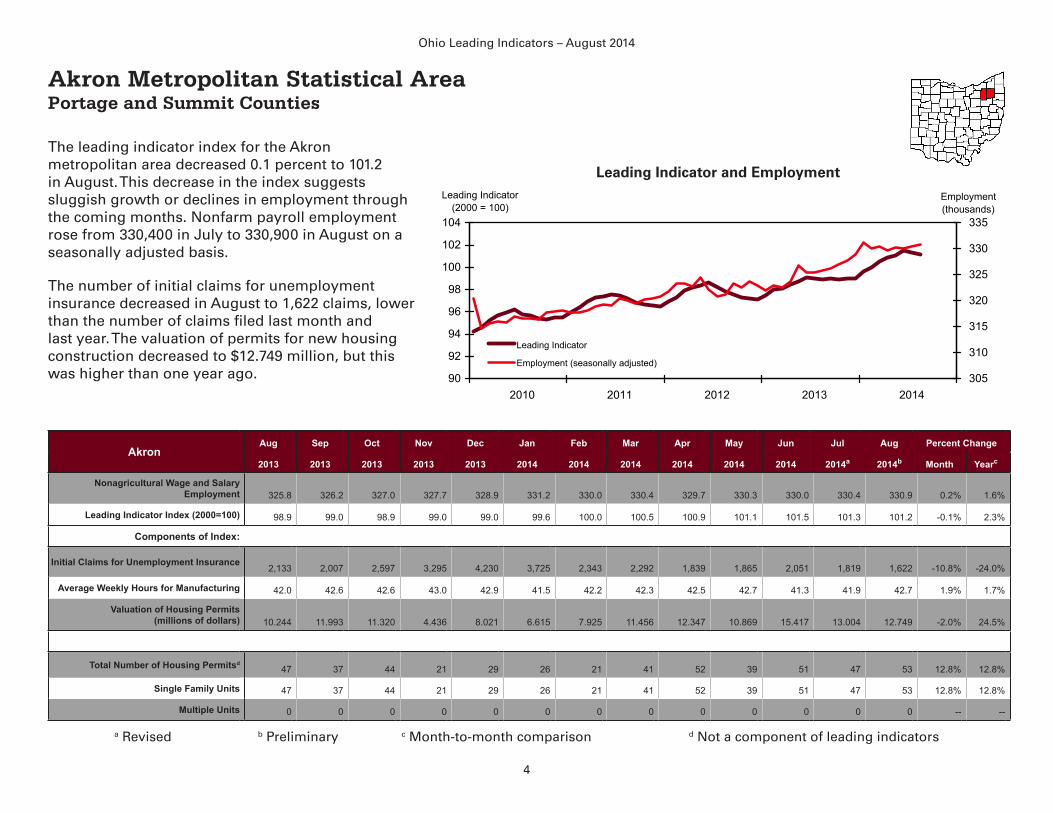
The leading indicator index for the Akron metropolitan area decreased 0.1 percent to 101.2 in August. This decrease in the index suggests sluggish growth or declines in employment through the coming months. Nonfarm payroll employment rose from 330,400 in July to 330,900 in August on a seasonally adjusted basis.
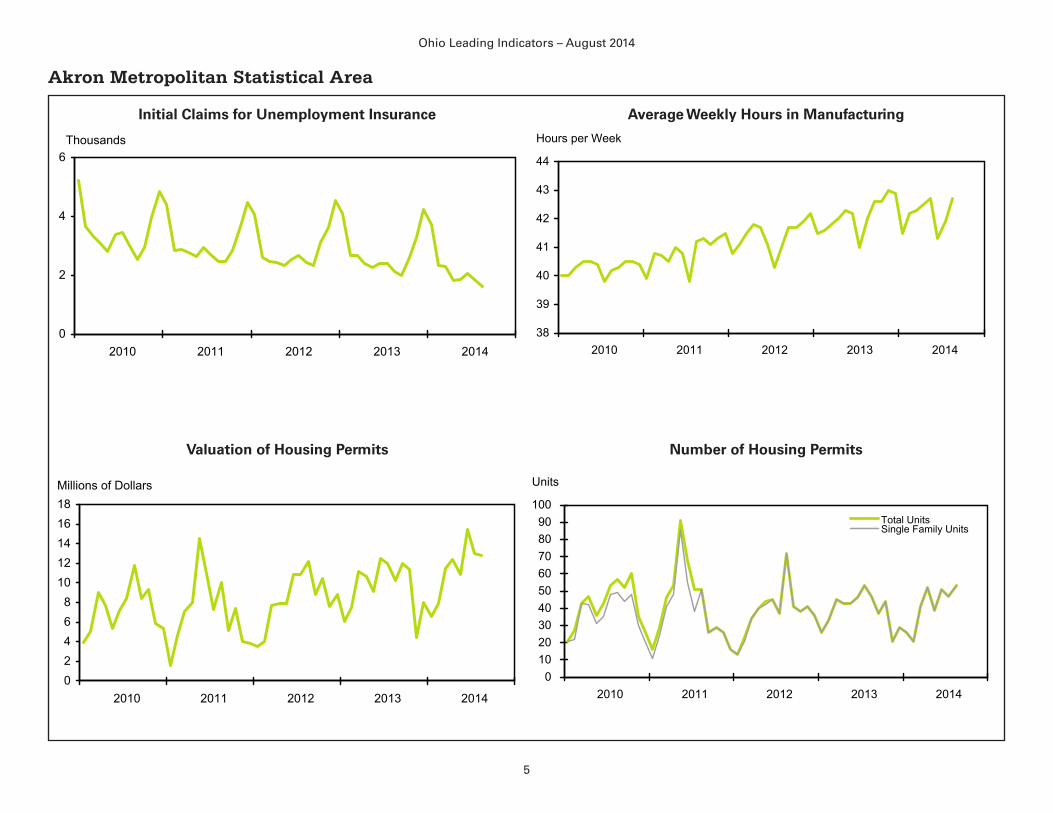
The number of initial claims for unemployment insurance decreased in August to 1,622 claims, lower than the number of claims filed last month and last year. The valuation of permits for new housing construction decreased to $12.749 million, but this was higher than one year ago.
AkronAug Sep Oct Nov Dec Jan Feb Mar Apr May Jun Jul Aug Percent Change
2013 2013 2013 2013 2013 2014 2014 2014 2014 2014 2014 2014a 2014b Month Yearc
Nonagricultural Wage and Salary Employment 325.8 326.2 327.0 327.7 328.9 331.2 330.0 330.4 329.7 330.3 330.0 330.4 330.9 0.2% 1.6%
Leading Indicator Index (2000=100) 98.9 99.0 98.9 99.0 99.0 99.6 100.0 100.5 100.9 101.1 101.5 101.3 101.2 -0.1% 2.3%
Components of Index:
Initial Claims for Unemployment Insurance 2,133 2,007 2,597 3,295 4,230 3,725 2,343 2,292 1,839 1,865 2,051 1,819 1,622 -10.8% -24.0%
Average Weekly Hours for Manufacturing 42.0 42.6 42.6 43.0 42.9 41.5 42.2 42.3 42.5 42.7 41.3 41.9 42.7 1.9% 1.7%
Valuation of Housing Permits (millions of dollars) 10.244 11.993 11.320 4.436 8.021 6.615 7.925 11.456 12.347 10.869 15.417 13.004 12.749 -2.0% 24.5%
Total Number of Housing Permitsd47 37 44 21 29 26 21 41 52 39 51 47 53 12.8% 12.8%
Single Family Units 47 37 44 21 29 26 21 41 52 39 51 47 53 12.8% 12.8%
Multiple Units 0 0 0 0 0 0 0 0 0 0 0 0 0 -- --
Leading Indicator and Employment
a Revised b Preliminary c Month-to-month comparison d Not a component of leading indicators
5
Ohio Leading Indicators – August 2014
Akron Metropolitan Statistical Area
0
2
4
6
2010 2011 2012 2013 2014
Thousands
38
39
40
41
42
43
44
2010 2011 2012 2013 2014
Hours per Week
0102030405060708090
100
2010 2011 2012 2013 2014
Units
Total UnitsSingle Family Units
02468
1012141618
2010 2011 2012 2013 2014
Millions of Dollars
Initial Claims for Unemployment Insurance Average Weekly Hours in Manufacturing
Valuation of Housing Permits Number of Housing Permits

6
Ohio Leading Indicators – August 2014
Canton-Massillon Metropolitan Statistical Area Carroll and Stark Counties
78
80
82
84
86
88
90
92
94
2010 2011 2012 2013 2014
Employment(thousands)
150
155
160
165
170
175
Leading Indicator(2000 = 100)
Leading Indicator
Employment (seasonally adjusted)
The Canton-Massillon leading indicator index decreased 0.3 percent this month to 91.5, suggesting moderate employment declines in the coming months. Total nonfarm employment fell to 171,000 jobs, seasonally adjusted.
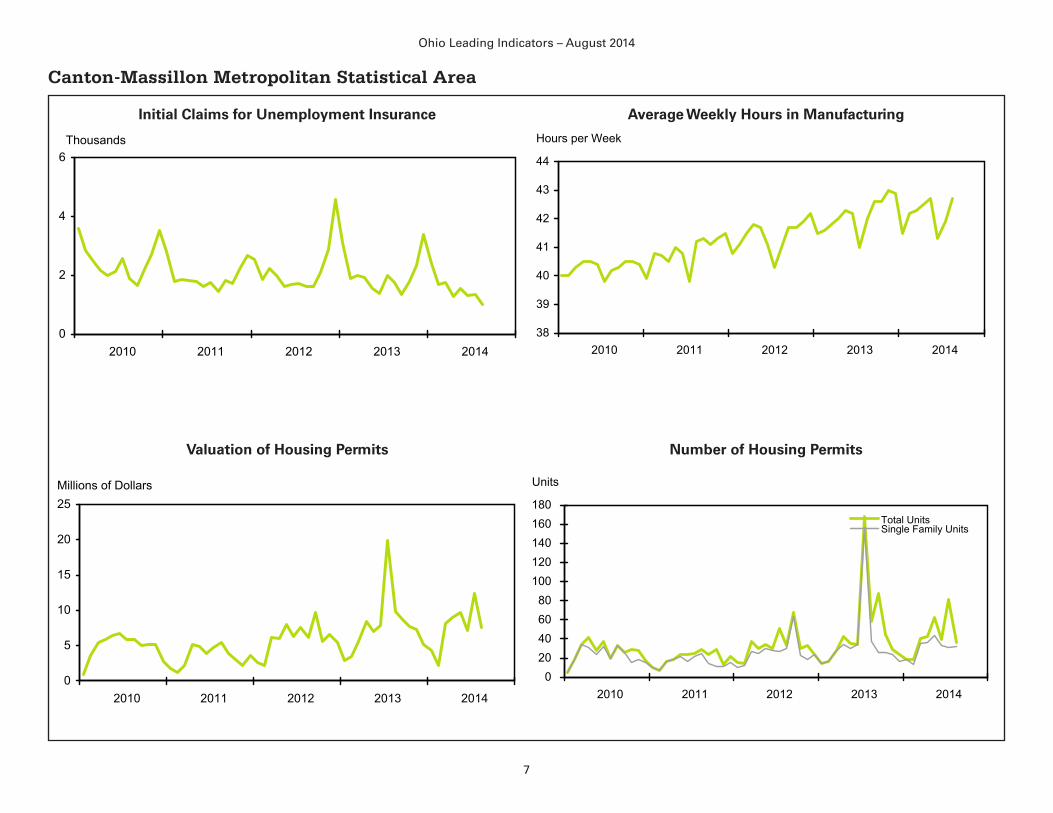
There were 1,015 initial claims for unemployment compensation, a monthly and annual decrease. Total valuation of residential building permits dropped 38.7 percent to $7.619 million. Total number of housing permits decreased 55.6 percent.
Canton-MassillonAug Sep Oct Nov Dec Jan Feb Mar Apr May Jun Jul Aug Percent Change
2013 2013 2013 2013 2013 2014 2014 2014 2014 2014 2014 2014a 2014b Month Yearc
Nonagricultural Wage and Salary Employment 171.5 170.8 170.6 170.6 170.2 170.2 170.0 170.4 170.2 170.3 171.0 171.1 171.0 -0.1% -0.3%
Leading Indicator Index (2000=100) 91.5 91.4 91.1 91.0 90.8 91.2 91.5 91.7 91.9 91.9 92.0 91.8 91.5 -0.3% 0.0%
Components of Index:
Initial Claims for Unemployment Insurance 1,738 1,347 1,784 2,334 3,401 2,387 1,675 1,747 1,279 1,533 1,310 1,336 1,015 -24.0% -41.6%
Average Weekly Hours for Manufacturing 42.0 42.6 42.6 43.0 42.9 41.5 42.2 42.3 42.5 42.7 41.3 41.9 42.7 1.9% 1.7%
Valuation of Housing Permits (millions of dollars) 9.797 8.660 7.684 7.305 5.213 4.361 2.175 8.162 9.046 9.696 7.100 12.420 7.619 -38.7% -22.2%
Total Number of Housing Permitsd58 87 45 29 24 19 18 40 43 62 39 81 36 -55.6% -37.9%
Single Family Units 37 26 26 24 16 19 13 35 36 44 33 31 32 3.2% -13.5%
Multiple Units 21 61 19 5 8 0 5 5 7 18 6 50 4 -92.0% -81.0%
Leading Indicator and Employment
a Revised b Preliminary c Month-to-month comparison d Not a component of leading indicators
7
Ohio Leading Indicators – August 2014
Canton-Massillon Metropolitan Statistical Area
0
2
4
6
2010 2011 2012 2013 2014
Thousands
38
39
40
41
42
43
44
2010 2011 2012 2013 2014
Hours per Week
020406080
100120140160180
2010 2011 2012 2013 2014
Units
Total UnitsSingle Family Units
0
5
10
15
20
25
2010 2011 2012 2013 2014
Millions of Dollars
Initial Claims for Unemployment Insurance Average Weekly Hours in Manufacturing
Valuation of Housing Permits Number of Housing Permits

8
Ohio Leading Indicators – August 2014
Cincinnati-Middletown Metropolitan Statistical Area Brown, Butler, Clermont, Hamilton and Warren Counties in Ohio This MSA also includes counties in Indiana and Kentucky (see page 21)
The index of leading economic indicators for the Cincinnati-Middletown metropolitan area was unchanged at 103.2 in August. This indicates only weak employment growth or declines in the coming months. Total nonfarm employment, on a seasonally adjusted basis, rose to 1,044,500 jobs.
Unemployment compensation had 3,646 initial claims this month, lower than the previous month and previous year. Total valuation of housing permits dropped to $85.148 million this month. The total number of housing permits rose to 666. 90
92
94
96
98
100
102
104
2010 2011 2012 2013 2014
Employment(thousands)
940
960
980
1,000
1,020
1,040
1,060
Leading Indicator(2000 = 100)
Leading Indicator
Employment (seasonally adjusted)
CincinnatiAug Sep Oct Nov Dec Jan Feb Mar Apr May Jun Jul Aug Percent Change
2013 2013 2013 2013 2013 2014 2014 2014 2014 2014 2014 2014a 2014b Month Yearc
Nonagricultural Wage and Salary Employment 1,027.6 1,028.7 1,030.7 1,030.3 1,028.0 1,032.9 1,033.9 1,036.7 1,038.7 1,041.7 1,040.8 1,044.0 1,044.5 0.0% 1.6%
Leading Indicator Index (2000=100) 100.7 101.0 101.0 101.1 101.1 101.5 102.0 102.2 102.5 102.8 103.3 103.2 103.2 0.0% 2.5%
Components of Index:
Initial Claims for Unemployment Insurance 4,747 4,419 5,637 5,131 8,269 7,582 4,733 4,648 4,296 4,216 4,737 4,191 3,646 -13.0% -23.2%
Average Weekly Hours for Manufacturing 42.0 42.6 42.6 43.0 42.9 41.5 42.2 42.3 42.5 42.7 41.3 41.9 42.7 1.9% 1.7%
Valuation of Housing Permits (millions of dollars) 68.382 62.502 57.793 51.587 48.396 47.148 50.196 67.291 87.547 76.377 72.361 98.034 85.148 -13.1% 24.5%
Total Number of Housing Permitsd331 483 272 268 227 230 253 463 386 400 353 559 666 19.1% 101.2%
Single Family Units 309 272 248 205 207 208 204 262 307 319 320 354 235 -33.6% -23.9%
Multiple Units 22 211 24 63 20 22 49 201 79 81 33 205 431 110.2% 1859.1%
Leading Indicator and Employment
a Revised b Preliminary c Month-to-month comparison d Not a component of leading indicators

9
Ohio Leading Indicators – August 2014
Cincinnati-Middletown Metropolitan Statistical Area
0
2
4
6
8
10
12
2010 2011 2012 2013 2014
Thousands
38
39
40
41
42
43
44
2010 2011 2012 2013 2014
Hours per Week
0
100
200
300
400
500
600
700
2010 2011 2012 2013 2014
Units
Total UnitsSingle Family Units
0
20
40
60
80
100
120
2010 2011 2012 2013 2014
Millions of Dollars
Initial Claims for Unemployment Insurance Average Weekly Hours in Manufacturing
Valuation of Housing Permits Number of Housing Permits

10
Ohio Leading Indicators – August 2014
Cleveland-Elyria-Mentor Metropolitan Statistical Area Cuyahoga, Geauga, Lake, Lorain and Medina Counties
The leading indicator index for the Cleveland-Elyria-Mentor metropolitan area dropped 0.2 percent this month to 91.8, indicating modest employment declines in the coming months. Nonfarm payroll employment decreased to 1,038,500 jobs, seasonally adjusted, higher than this time last year.
There were 5,885 initial claims for unemployment compensation, a monthly decrease of 21.5 percent. Total valuation of housing permits dropped 11.2 percent this month to $50.212 million.
8384858687888990919293
2010 2011 2012 2013 2014
Employment(thousands)
9509609709809901,0001,0101,0201,0301,0401,050
Leading Indicator(2000 = 100)
Leading Indicator
Employment (seasonally adjusted)
ClevelandAug Sep Oct Nov Dec Jan Feb Mar Apr May Jun Jul Aug Percent Change
2013 2013 2013 2013 2013 2014 2014 2014 2014 2014 2014 2014a 2014b Month Yearc
Nonagricultural Wage and Salary Employment 1,032.7 1,027.9 1,026.0 1,026.1 1,025.6 1,028.0 1,031.2 1,029.7 1,030.3 1,032.4 1,036.1 1,040.3 1,038.5 -0.2% 0.6%
Leading Indicator Index (2000=100) 90.8 90.9 90.7 90.7 90.7 91.1 91.4 91.6 91.9 92.0 92.1 92.0 91.8 -0.2% 1.1%
Components of Index:
Initial Claims for Unemployment Insurance 7,586 7,076 10,506 9,968 12,827 10,650 7,003 7,059 6,412 6,183 6,925 7,498 5,885 -21.5% -22.4%
Average Weekly Hours for Manufacturing 42.0 42.6 42.6 43.0 42.9 41.5 42.2 42.3 42.5 42.7 41.3 41.9 42.7 1.9% 1.7%
Valuation of Housing Permits (millions of dollars) 83.762 46.786 55.132 47.644 26.324 32.696 31.498 40.335 61.899 56.052 59.552 56.535 50.212 -11.2% -40.1%
Total Number of Housing Permitsd528 229 278 229 134 142 138 195 279 265 288 277 254 -8.3% -51.9%
Single Family Units 222 210 232 188 105 115 119 172 235 231 254 196 208 6.1% -6.3%
Multiple Units 306 19 46 41 29 27 19 23 44 34 34 81 46 -43.2% -85.0%
Leading Indicator and Employment
a Revised b Preliminary c Month-to-month comparison d Not a component of leading indicators

11
Ohio Leading Indicators – August 2014
Cleveland-Elyria-Mentor Metropolitan Statistical Area
0
2
4
6
8
10
12
14
16
2010 2011 2012 2013 2014
Thousands
38
39
40
41
42
43
44
2010 2011 2012 2013 2014
Hours per Week
0
100
200
300
400
500
600
2010 2011 2012 2013 2014
Units
Total UnitsSingle Family Units
0102030405060708090
2010 2011 2012 2013 2014
Millions of Dollars
Initial Claims for Unemployment Insurance Average Weekly Hours in Manufacturing
Valuation of Housing Permits Number of Housing Permits
12
Ohio Leading Indicators – August 2014
Columbus Metropolitan Statistical Area Delaware, Fairfield, Franklin, Licking, Madison, Morrow, Pickaway and Union Counties
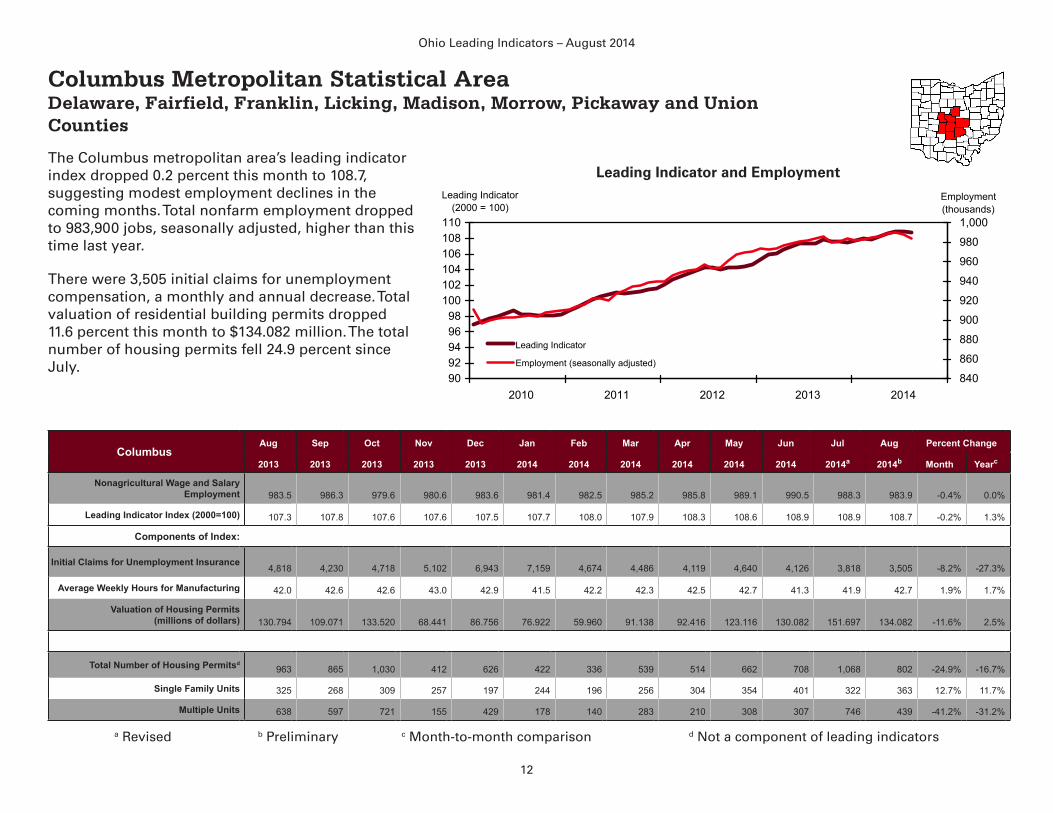
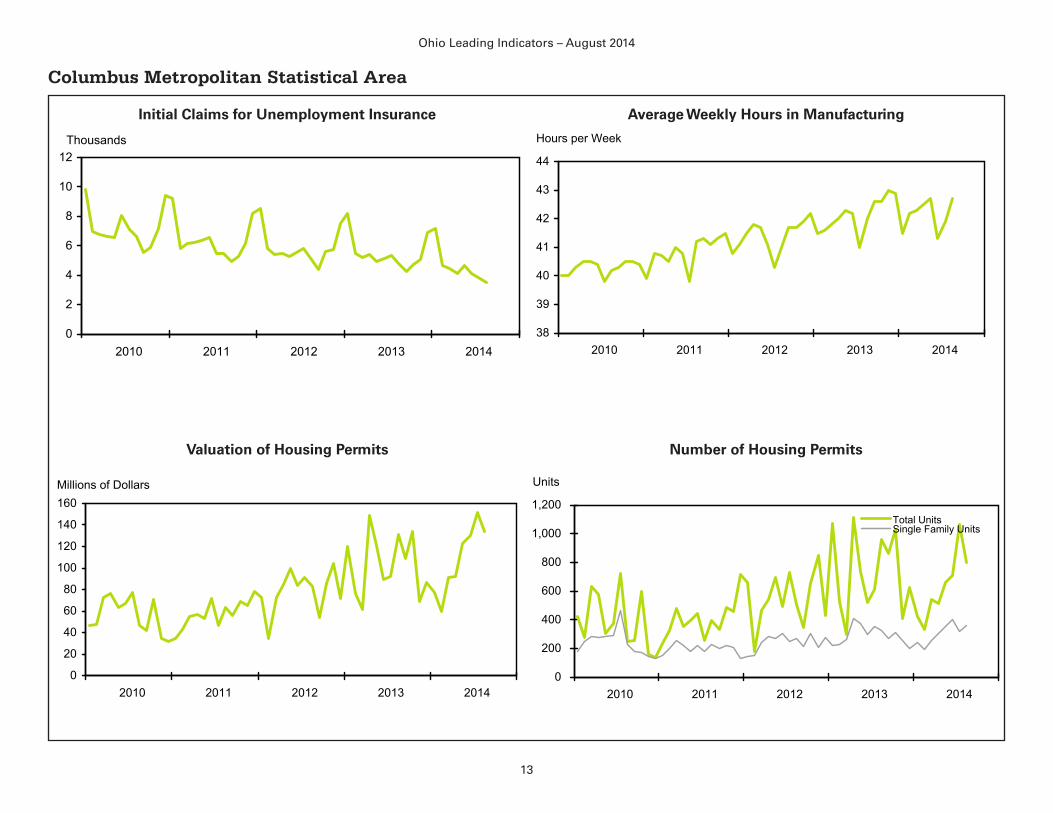
The Columbus metropolitan area’s leading indicator index dropped 0.2 percent this month to 108.7, suggesting modest employment declines in the coming months. Total nonfarm employment dropped to 983,900 jobs, seasonally adjusted, higher than this time last year.
There were 3,505 initial claims for unemployment compensation, a monthly and annual decrease. Total valuation of residential building permits dropped 11.6 percent this month to $134.082 million. The total number of housing permits fell 24.9 percent since July.
9092949698
100102104106108110
2010 2011 2012 2013 2014
Employment(thousands)
840
860
880
900
920
940
960
980
1,000
Leading Indicator(2000 = 100)
Leading Indicator
Employment (seasonally adjusted)
ColumbusAug Sep Oct Nov Dec Jan Feb Mar Apr May Jun Jul Aug Percent Change
2013 2013 2013 2013 2013 2014 2014 2014 2014 2014 2014 2014a 2014b Month Yearc
Nonagricultural Wage and Salary Employment 983.5 986.3 979.6 980.6 983.6 981.4 982.5 985.2 985.8 989.1 990.5 988.3 983.9 -0.4% 0.0%
Leading Indicator Index (2000=100) 107.3 107.8 107.6 107.6 107.5 107.7 108.0 107.9 108.3 108.6 108.9 108.9 108.7 -0.2% 1.3%
Components of Index:
Initial Claims for Unemployment Insurance 4,818 4,230 4,718 5,102 6,943 7,159 4,674 4,486 4,119 4,640 4,126 3,818 3,505 -8.2% -27.3%
Average Weekly Hours for Manufacturing 42.0 42.6 42.6 43.0 42.9 41.5 42.2 42.3 42.5 42.7 41.3 41.9 42.7 1.9% 1.7%
Valuation of Housing Permits (millions of dollars) 130.794 109.071 133.520 68.441 86.756 76.922 59.960 91.138 92.416 123.116 130.082 151.697 134.082 -11.6% 2.5%
Total Number of Housing Permitsd963 865 1,030 412 626 422 336 539 514 662 708 1,068 802 -24.9% -16.7%
Single Family Units 325 268 309 257 197 244 196 256 304 354 401 322 363 12.7% 11.7%
Multiple Units 638 597 721 155 429 178 140 283 210 308 307 746 439 -41.2% -31.2%
Leading Indicator and Employment
a Revised b Preliminary c Month-to-month comparison d Not a component of leading indicators
13
Ohio Leading Indicators – August 2014
Columbus Metropolitan Statistical Area
0
2
4
6
8
10
12
2010 2011 2012 2013 2014
Thousands
38
39
40
41
42
43
44
2010 2011 2012 2013 2014
Hours per Week
0
200
400
600
800
1,000
1,200
2010 2011 2012 2013 2014
Units
Total UnitsSingle Family Units
0
20
40
60
80
100
120
140
160
2010 2011 2012 2013 2014
Millions of Dollars
Initial Claims for Unemployment Insurance Average Weekly Hours in Manufacturing
Valuation of Housing Permits Number of Housing Permits
14
Ohio Leading Indicators – August 2014
Dayton Metropolitan Statistical Area Greene, Miami, Montgomery and Preble Counties
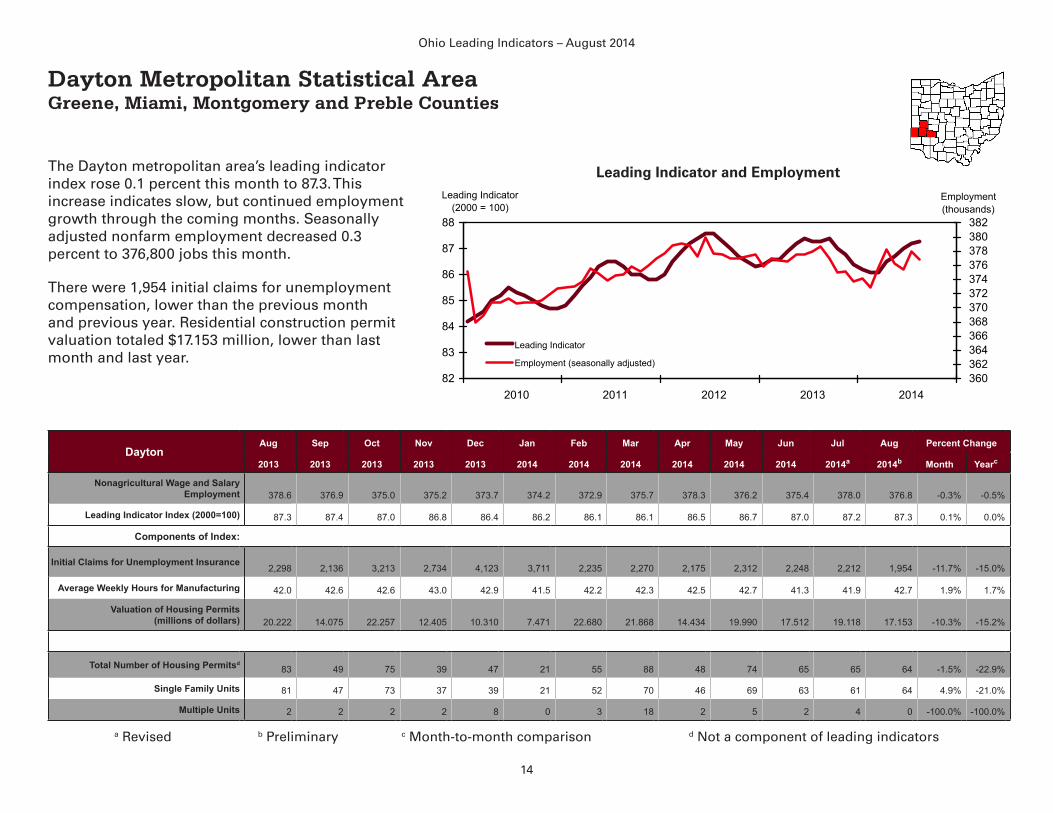
The Dayton metropolitan area’s leading indicator index rose 0.1 percent this month to 87.3. This increase indicates slow, but continued employment growth through the coming months. Seasonally adjusted nonfarm employment decreased 0.3 percent to 376,800 jobs this month.
There were 1,954 initial claims for unemployment compensation, lower than the previous month and previous year. Residential construction permit valuation totaled $17.153 million, lower than last month and last year.
82
83
84
85
86
87
88
2010 2011 2012 2013 2014
Employment(thousands)
360362364366368370372374376378380382
Leading Indicator(2000 = 100)
Leading Indicator
Employment (seasonally adjusted)
DaytonAug Sep Oct Nov Dec Jan Feb Mar Apr May Jun Jul Aug Percent Change
2013 2013 2013 2013 2013 2014 2014 2014 2014 2014 2014 2014a 2014b Month Yearc
Nonagricultural Wage and Salary Employment 378.6 376.9 375.0 375.2 373.7 374.2 372.9 375.7 378.3 376.2 375.4 378.0 376.8 -0.3% -0.5%
Leading Indicator Index (2000=100) 87.3 87.4 87.0 86.8 86.4 86.2 86.1 86.1 86.5 86.7 87.0 87.2 87.3 0.1% 0.0%
Components of Index:
Initial Claims for Unemployment Insurance 2,298 2,136 3,213 2,734 4,123 3,711 2,235 2,270 2,175 2,312 2,248 2,212 1,954 -11.7% -15.0%
Average Weekly Hours for Manufacturing 42.0 42.6 42.6 43.0 42.9 41.5 42.2 42.3 42.5 42.7 41.3 41.9 42.7 1.9% 1.7%
Valuation of Housing Permits (millions of dollars) 20.222 14.075 22.257 12.405 10.310 7.471 22.680 21.868 14.434 19.990 17.512 19.118 17.153 -10.3% -15.2%
Total Number of Housing Permitsd83 49 75 39 47 21 55 88 48 74 65 65 64 -1.5% -22.9%
Single Family Units 81 47 73 37 39 21 52 70 46 69 63 61 64 4.9% -21.0%
Multiple Units 2 2 2 2 8 0 3 18 2 5 2 4 0 -100.0% -100.0%
Leading Indicator and Employment
a Revised b Preliminary c Month-to-month comparison d Not a component of leading indicators

15
Ohio Leading Indicators – August 2014
Dayton Metropolitan Statistical Area
0
2
4
6
8
2010 2011 2012 2013 2014
Thousands
38
39
40
41
42
43
44
2010 2011 2012 2013 2014
Hours per Week
0
50
100
150
200
250
2010 2011 2012 2013 2014
Units
Total UnitsSingle Family Units
0
5
10
15
20
25
30
35
2010 2011 2012 2013 2014
Millions of Dollars
Initial Claims for Unemployment Insurance Average Weekly Hours in Manufacturing
Valuation of Housing Permits Number of Housing Permits

16
Ohio Leading Indicators – August 2014
Toledo Metropolitan Statistical Area Fulton, Lucas, Ottawa and Wood Counties
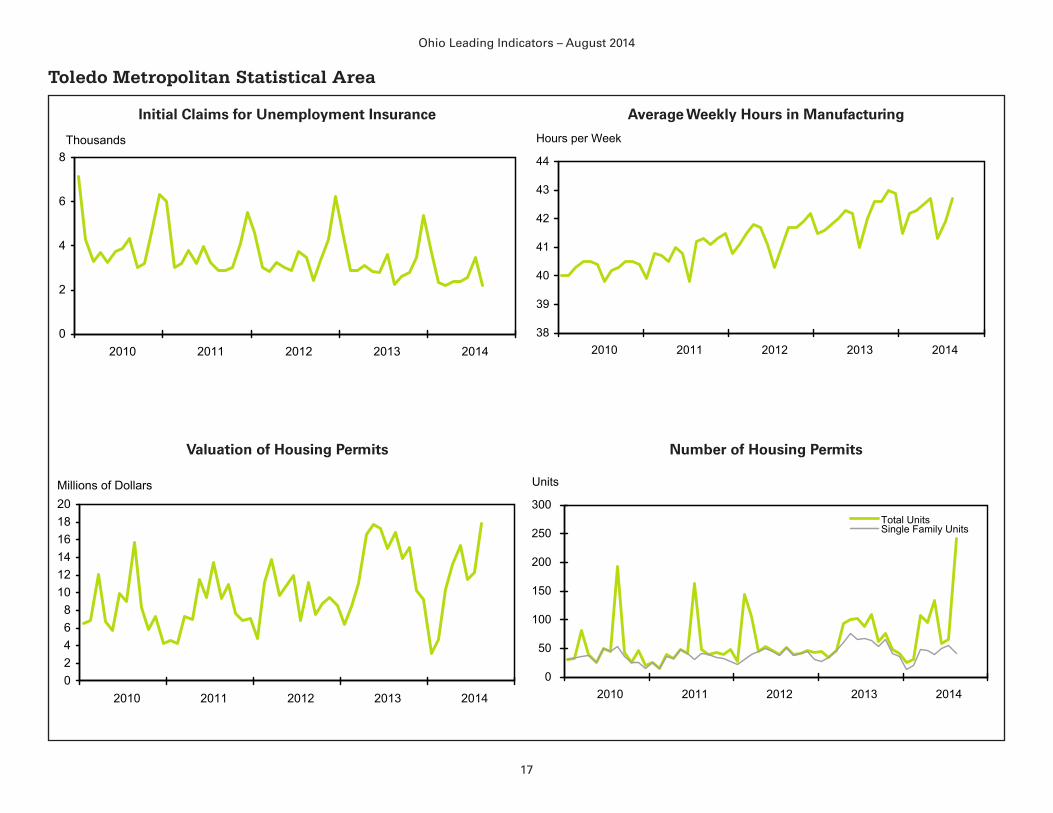
The leading indicator index for the Toledo metropolitan area dropped 0.3 percent to 90.8 in August. This drop indicates moderate employment declines through the coming months. Nonfarm payroll employment, on a seasonally adjusted basis, decreased this month to 310,300 jobs.
The number of initial claims for unemployment insurance fell in August to 2,210 claims, this is 36.1 percent lower than last month. The valuation of permits for new housing construction increased 45.0 percent to $17.847 million. The total number of housing permits increased 270.8 percent this month. 81
8283848586878889909192
2010 2011 2012 2013 2014
Employment(thousands)
280
285
290
295
300
305
310
315
Leading Indicator(2000 = 100)
Leading Indicator
Employment (seasonally adjusted)
ToledoAug Sep Oct Nov Dec Jan Feb Mar Apr May Jun Jul Aug Percent Change
2013 2013 2013 2013 2013 2014 2014 2014 2014 2014 2014 2014a 2014b Month Yearc
Nonagricultural Wage and Salary Employment 310.2 310.7 311.1 310.2 308.3 310.3 310.8 309.8 309.7 310.7 311.7 312.8 310.3 -0.8% 0.0%
Leading Indicator Index (2000=100) 90.1 90.1 90.1 90.0 89.7 89.8 90.0 90.2 90.3 90.5 90.9 91.1 90.8 -0.3% 0.8%
Components of Index:
Initial Claims for Unemployment Insurance 2,264 2,631 2,794 3,477 5,391 3,717 2,337 2,222 2,366 2,400 2,563 3,459 2,210 -36.1% -2.4%
Average Weekly Hours for Manufacturing 42.0 42.6 42.6 43.0 42.9 41.5 42.2 42.3 42.5 42.7 41.3 41.9 42.7 1.9% 1.7%
Valuation of Housing Permits (millions of dollars) 16.789 13.927 15.101 10.220 9.244 3.086 4.666 10.365 13.163 15.344 11.446 12.311 17.847 45.0% 6.3%
Total Number of Housing Permitsd109 63 76 48 42 25 30 108 95 133 58 65 241 270.8% 121.1%
Single Family Units 64 53 65 41 36 13 20 49 47 39 50 55 41 -25.5% -35.9%
Multiple Units 45 10 11 7 6 12 10 59 48 94 8 10 200 1900.0% 344.4%
Leading Indicator and Employment
a Revised b Preliminary c Month-to-month comparison d Not a component of leading indicators
17
Ohio Leading Indicators – August 2014
Toledo Metropolitan Statistical Area
0
2
4
6
8
2010 2011 2012 2013 2014
Thousands
38
39
40
41
42
43
44
2010 2011 2012 2013 2014
Hours per Week
0
50
100
150
200
250
300
2010 2011 2012 2013 2014
Units
Total UnitsSingle Family Units
02468
101214161820
2010 2011 2012 2013 2014
Millions of Dollars
Initial Claims for Unemployment Insurance Average Weekly Hours in Manufacturing
Valuation of Housing Permits Number of Housing Permits
18
Ohio Leading Indicators – August 2014
Youngstown-Warren-Boardman Metropolitan Statistical Area Mahoning and Trumbull Counties in Ohio and Mercer County in Pennsylvania
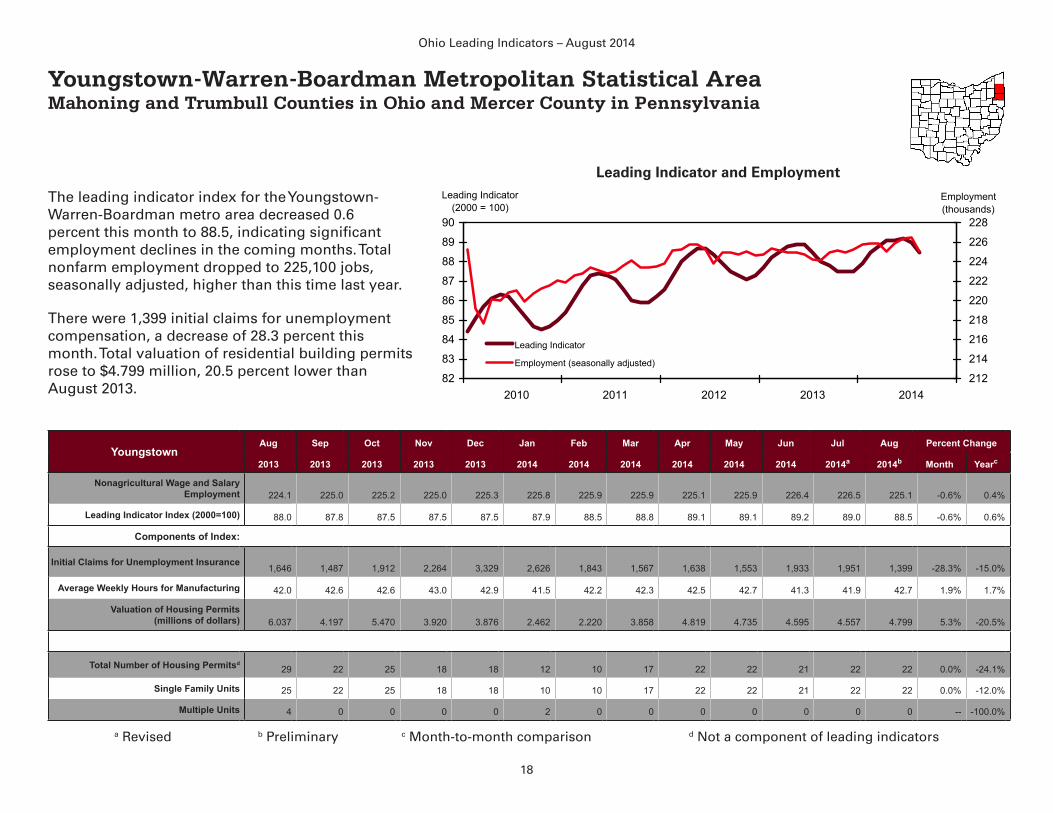
The leading indicator index for the Youngstown-Warren-Boardman metro area decreased 0.6 percent this month to 88.5, indicating significant employment declines in the coming months. Total nonfarm employment dropped to 225,100 jobs, seasonally adjusted, higher than this time last year.
There were 1,399 initial claims for unemployment compensation, a decrease of 28.3 percent this month. Total valuation of residential building permits rose to $4.799 million, 20.5 percent lower than August 2013.
82
83
84
85
86
87
88
89
90
2010 2011 2012 2013 2014
Employment(thousands)
212
214
216
218
220
222
224
226
228
Leading Indicator(2000 = 100)
Leading Indicator
Employment (seasonally adjusted)
YoungstownAug Sep Oct Nov Dec Jan Feb Mar Apr May Jun Jul Aug Percent Change
2013 2013 2013 2013 2013 2014 2014 2014 2014 2014 2014 2014a 2014b Month Yearc
Nonagricultural Wage and Salary Employment 224.1 225.0 225.2 225.0 225.3 225.8 225.9 225.9 225.1 225.9 226.4 226.5 225.1 -0.6% 0.4%
Leading Indicator Index (2000=100) 88.0 87.8 87.5 87.5 87.5 87.9 88.5 88.8 89.1 89.1 89.2 89.0 88.5 -0.6% 0.6%
Components of Index:
Initial Claims for Unemployment Insurance 1,646 1,487 1,912 2,264 3,329 2,626 1,843 1,567 1,638 1,553 1,933 1,951 1,399 -28.3% -15.0%
Average Weekly Hours for Manufacturing 42.0 42.6 42.6 43.0 42.9 41.5 42.2 42.3 42.5 42.7 41.3 41.9 42.7 1.9% 1.7%
Valuation of Housing Permits (millions of dollars) 6.037 4.197 5.470 3.920 3.876 2.462 2.220 3.858 4.819 4.735 4.595 4.557 4.799 5.3% -20.5%
Total Number of Housing Permitsd29 22 25 18 18 12 10 17 22 22 21 22 22 0.0% -24.1%
Single Family Units 25 22 25 18 18 10 10 17 22 22 21 22 22 0.0% -12.0%
Multiple Units 4 0 0 0 0 2 0 0 0 0 0 0 0 -- -100.0%
Leading Indicator and Employment
a Revised b Preliminary c Month-to-month comparison d Not a component of leading indicators

19
Ohio Leading Indicators – August 2014
Youngstown-Warren-Boardman Metropolitan Statistical Area
0
2
4
6
8
2010 2011 2012 2013 2014
Thousands
38
39
40
41
42
43
44
2010 2011 2012 2013 2014
Hours per Week
05
1015202530354045
2010 2011 2012 2013 2014
Units
Total UnitsSingle Family Units
0123456789
2010 2011 2012 2013 2014
Millions of Dollars
Initial Claims for Unemployment Insurance Average Weekly Hours in Manufacturing
Valuation of Housing Permits Number of Housing Permits

20
Ohio Leading Indicators – August 2014
Technical NotesThe leading indicator indexes for Ohio and the eight large metropolitan statistical areas (MSAs) are designed to anticipate changes in the local economy based on changes in six component data series. At the national level, the Gross National Product is an acceptable measure of general levels of economic activity, but no monthly measure of the dollar value of goods and services produced at the state level exists. Therefore, seasonally adjusted employment estimates are used to evaluate how well the local economy, in each respective metropolitan area, is performing. The amount of variability in the composite indexes has been reduced by computing a six-month moving average.
The components chosen to form the composite indicator for each area were based on the following criteria:
• Economic plausability as a leading indicator,• Ability to explain employment variation over the business cycle, and• Timely availability of monthly observations.
Five components consistently conformed to the criteria cited above and explained a large portion of employment variation and business cycle movement in each of the geographic areas. Two of these, the national composite index of leading indicators and domestic auto production, are national components. One, average weekly hours in manufacturing, is a statewide statistic. The remaining components are specific to each metropolitan area. The following list provides information on each component indicator:
• Valuation of housing authorized by building permits (in millions of dollars). Source: U.S. Census Bureau, Construction Reports: Housing Authorized by Building Permits and Public Contracts.
• Initial claims for unemployment insurance. Claims for the Cincinnati-Middletown and Youngstown-Warren-Boardman MSAs include out-of-state commuter claims filed with Ohio. Source: Unemployment Compensation Reports UC 236.C-M (Monthly), Ohio Department of Job and Family Services, Bureau of Labor Market Information.
• Average weekly hours of production workers in manufacturing. Source: Published data from the Current Employment Statistics (CES) program, Ohio Department of Job and Family Services, Bureau of Labor Market Information. Data prior to 2003 were not reconstructed.
• U.S. domestic automobile production (annualized in millions of units). Source: Ward’s, Dearborn, MI.• National composite index of leading indicators. Source: Business Cycle Indicators, The Conference Board.
An econometric approach to determining the weight of each component is employed. The weights are chosen to maximize the out-of-sample ability of the index to detect changes in economic activity. It should be noted that these weights, unlike some other methods, are dynamic; that is, they change slowly over time as new projections are made each month. In addition to smoothing and seasonally adjusting the data, each of the moving average composite indicators is normalized to the 2000 average employment level in the respective geographic areas.
21
Ohio Leading Indicators – August 2014
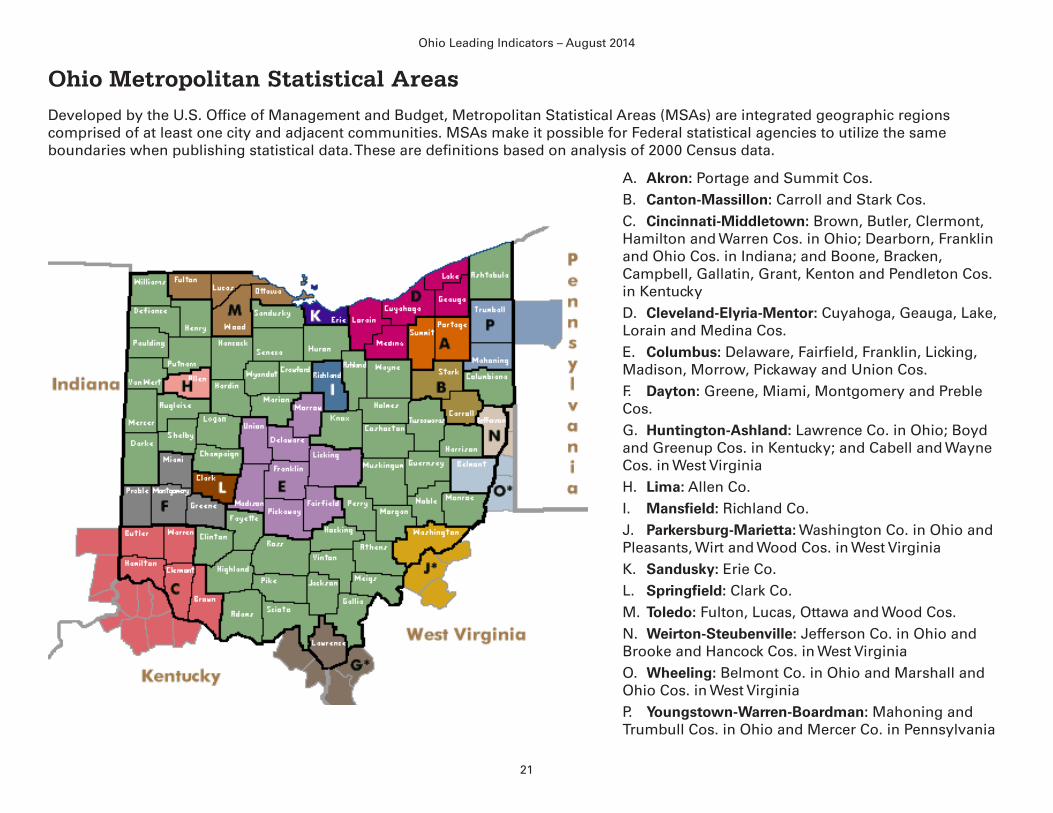
Ohio Metropolitan Statistical AreasDeveloped by the U.S. Office of Management and Budget, Metropolitan Statistical Areas (MSAs) are integrated geographic regions comprised of at least one city and adjacent communities. MSAs make it possible for Federal statistical agencies to utilize the same boundaries when publishing statistical data. These are definitions based on analysis of 2000 Census data.
A. Akron: Portage and Summit Cos.B. Canton-Massillon: Carroll and Stark Cos.C. Cincinnati-Middletown: Brown, Butler, Clermont, Hamilton and Warren Cos. in Ohio; Dearborn, Franklin and Ohio Cos. in Indiana; and Boone, Bracken, Campbell, Gallatin, Grant, Kenton and Pendleton Cos. in KentuckyD. Cleveland-Elyria-Mentor: Cuyahoga, Geauga, Lake, Lorain and Medina Cos.E. Columbus: Delaware, Fairfield, Franklin, Licking, Madison, Morrow, Pickaway and Union Cos.F. Dayton: Greene, Miami, Montgomery and Preble Cos.G. Huntington-Ashland: Lawrence Co. in Ohio; Boyd and Greenup Cos. in Kentucky; and Cabell and Wayne Cos. in West VirginiaH. Lima: Allen Co.I. Mansfield: Richland Co.J. Parkersburg-Marietta: Washington Co. in Ohio and Pleasants, Wirt and Wood Cos. in West VirginiaK. Sandusky: Erie Co.L. Springfield: Clark Co.M. Toledo: Fulton, Lucas, Ottawa and Wood Cos.N. Weirton-Steubenville: Jefferson Co. in Ohio and Brooke and Hancock Cos. in West VirginiaO. Wheeling: Belmont Co. in Ohio and Marshall and Ohio Cos. in West VirginiaP. Youngstown-Warren-Boardman: Mahoning and Trumbull Cos. in Ohio and Mercer Co. in Pennsylvania
Ohio Department of Job and Family Services P.O. Box 1618 Columbus, Ohio 43216-1618
Bureau of Labor Market Information Business Principles for Workforce Development
Partner with the workforce and economic development community.
Develop and deploy new information solution tools and systems for the workforce and economic development community.
Provide products and services that are customer and demand driven.
Be known as an important and reliable source for information solutions that support workforce development goals and outcomes.
This periodical is published monthly by the Ohio Department of Job and Family Services, Office of Workforce Development, Bureau of Labor Market Information. It is posted on the Internet at http://ohiolmi.com/proj/LeadingIndicators.htm. If you would like to receive e-mail notification when a new issue is released or if you have any questions, please contact Paul Konicek at (614) 644-1063 or [email protected].
John R. Kasich, Governor State of Ohio
http://www.ohio.gov
Cynthia C. Dungey, Director Department of Job and Family Services
http://jfs.ohio.gov
Office of Workforce Development http://jfs.ohio.gov/owd
Bureau of Labor Market Information http://ohiolmi.com