05 HCM 2010 Procedure - Kittelson & Associates, Inc.
39
HCM 2010 Analysis Procedure Roundabout Traffic Operations Analysis Short Course
Transcript of 05 HCM 2010 Procedure - Kittelson & Associates, Inc.
HCM 2010 Analysis ProcedureRoundabout Traffic Operations AnalysisShort Course
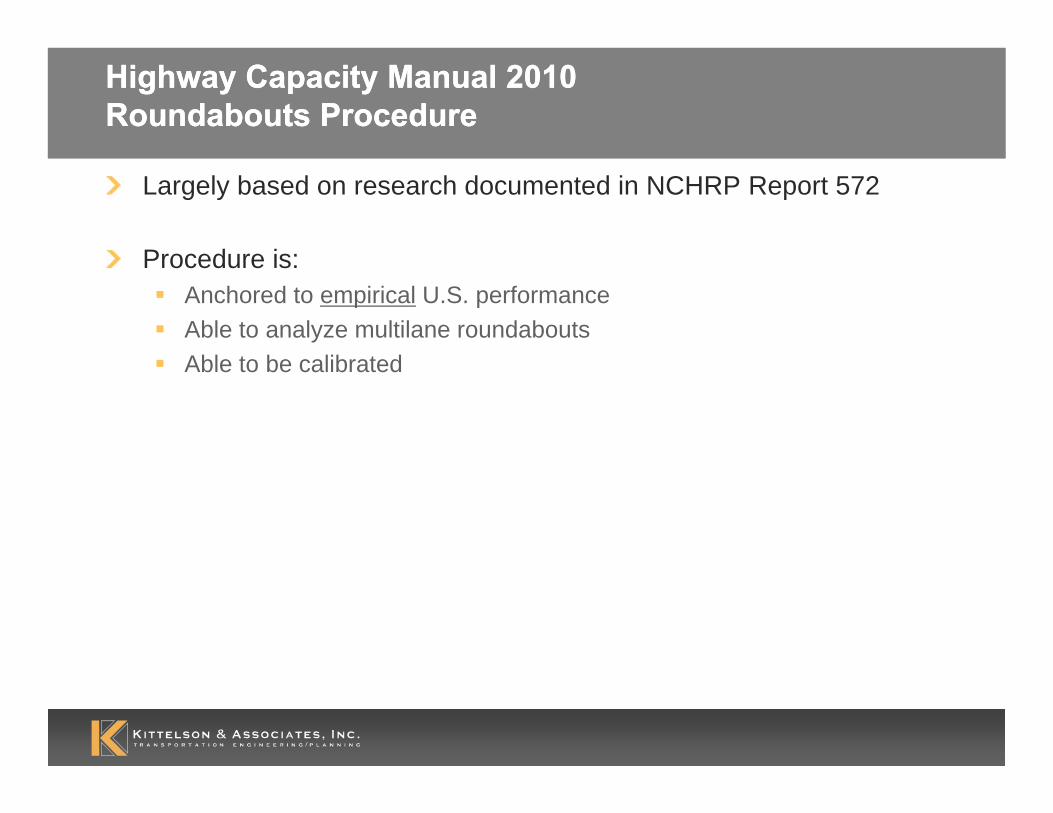
Highway Capacity Manual 2010Roundabouts ProcedureHighway Capacity Manual 2010Roundabouts Procedure
Largely based on research documented in NCHRP Report 572
Procedure is:Anchored to empirical U.S. performanceAble to analyze multilane roundaboutsAble to be calibrated
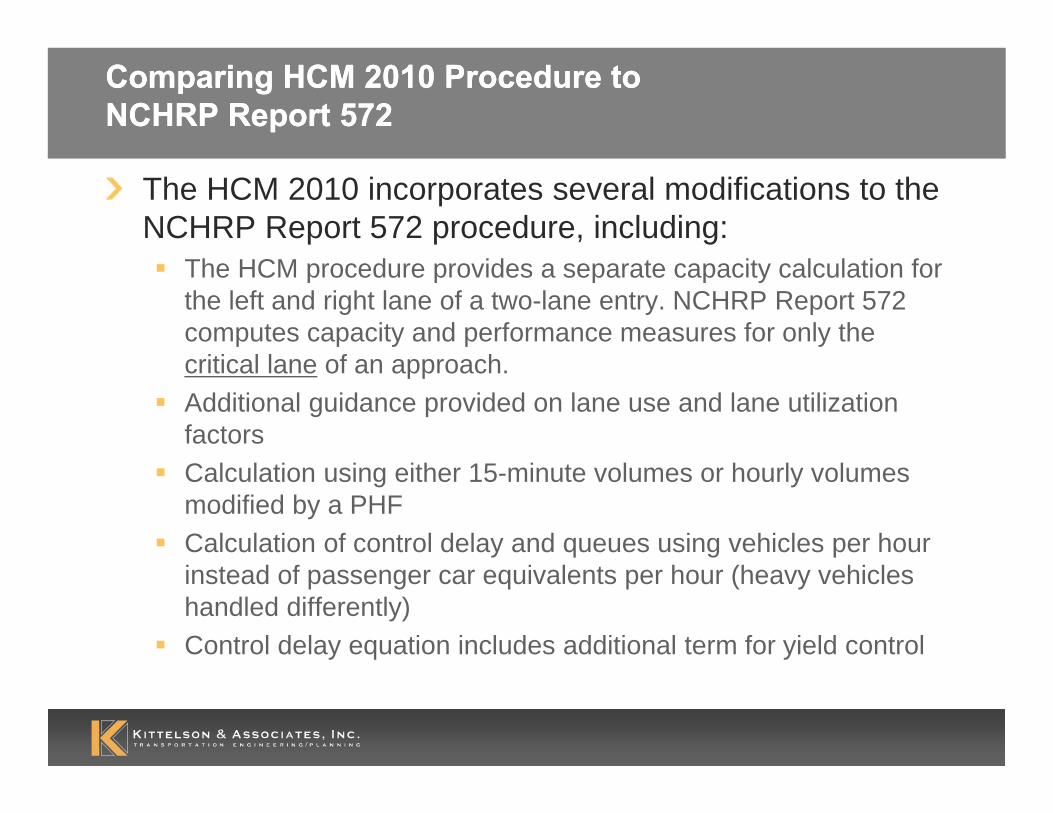
Comparing HCM 2010 Procedure to NCHRP Report 572Comparing HCM 2010 Procedure to NCHRP Report 572
The HCM 2010 incorporates several modifications to the NCHRP Report 572 procedure, including:
The HCM procedure provides a separate capacity calculation for the left and right lane of a two-lane entry. NCHRP Report 572 computes capacity and performance measures for only the critical lane of an approach.Additional guidance provided on lane use and lane utilization factorsCalculation using either 15-minute volumes or hourly volumes modified by a PHFCalculation of control delay and queues using vehicles per hour instead of passenger car equivalents per hour (heavy vehicles handled differently)Control delay equation includes additional term for yield control
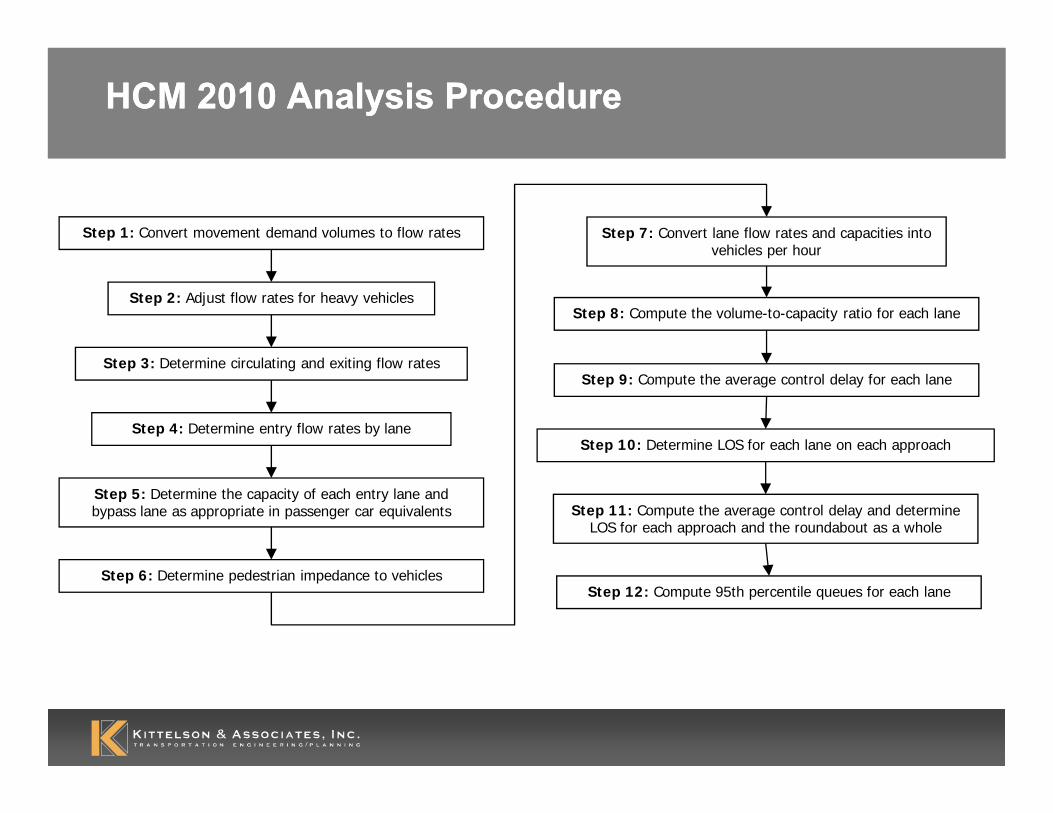
HCM 2010 Analysis ProcedureHCM 2010 Analysis Procedure
Step 1: Convert movement demand volumes to flow rates
Step 2: Adjust flow rates for heavy vehicles
Step 5: Determine the capacity of each entry lane and bypass lane as appropriate in passenger car equivalents
Step 8: Compute the volume-to-capacity ratio for each lane
Step 9: Compute the average control delay for each lane
Step 10: Determine LOS for each lane on each approach
Step 11: Compute the average control delay and determine LOS for each approach and the roundabout as a whole
Step 12: Compute 95th percentile queues for each lane
Step 3: Determine circulating and exiting flow rates
Step 4: Determine entry flow rates by lane
Step 7: Convert lane flow rates and capacities into vehicles per hour
Step 6: Determine pedestrian impedance to vehicles
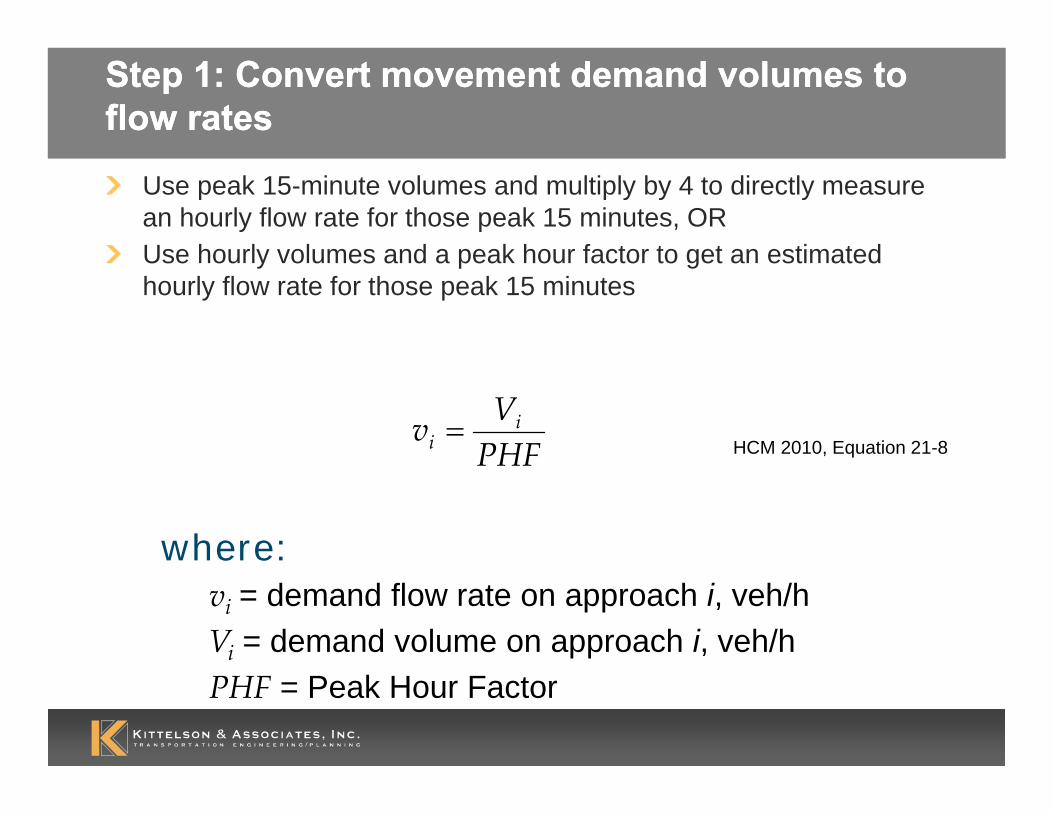
Step 1: Convert movement demand volumes to flow ratesStep 1: Convert movement demand volumes to flow rates
Use peak 15-minute volumes and multiply by 4 to directly measure an hourly flow rate for those peak 15 minutes, ORUse hourly volumes and a peak hour factor to get an estimated hourly flow rate for those peak 15 minutes
PHFVv i
i =
where:vi = demand flow rate on approach i, veh/hVi = demand volume on approach i, veh/hPHF = Peak Hour Factor
HCM 2010, Equation 21-8
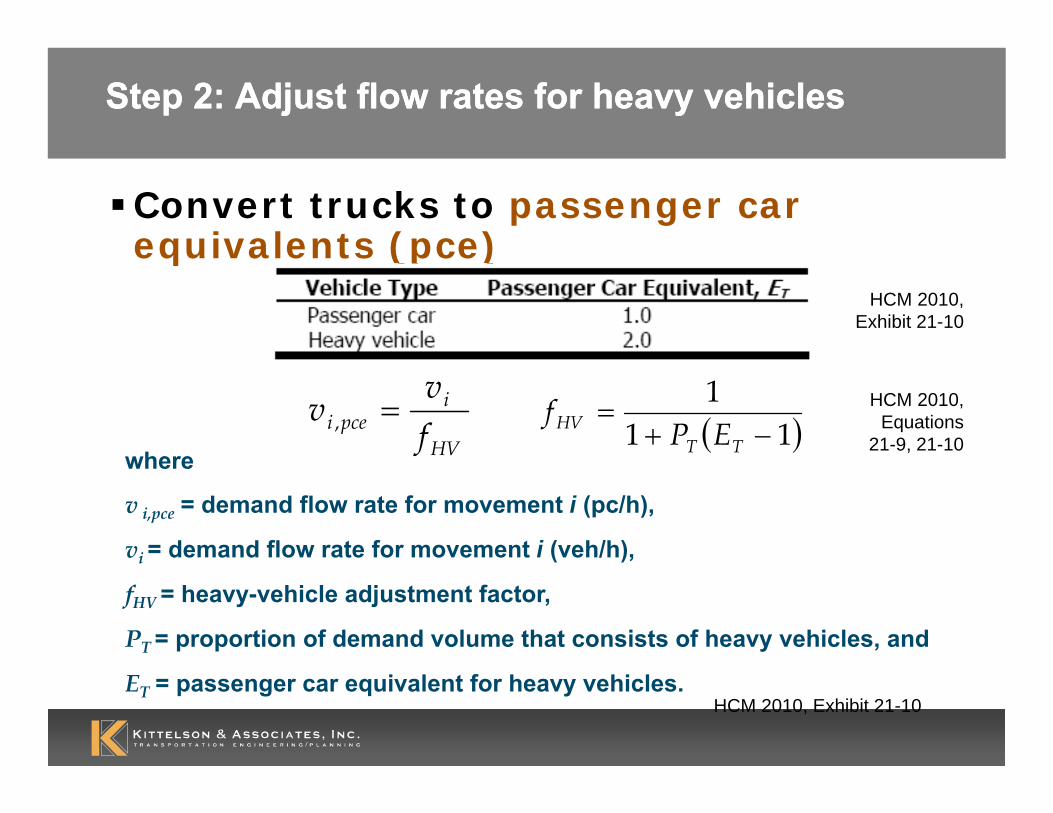
Step 2: Adjust flow rates for heavy vehiclesStep 2: Adjust flow rates for heavy vehicles
Convert trucks to passenger car equivalents (pce)
HCM 2010, Exhibit 21-10
HV
ipcei f
vv =, ( )111
−+=
TTHV EPf
where
v i,pce = demand flow rate for movement i (pc/h),
vi = demand flow rate for movement i (veh/h),
fHV = heavy-vehicle adjustment factor,
PT = proportion of demand volume that consists of heavy vehicles, and
ET = passenger car equivalent for heavy vehicles.
HCM 2010, Exhibit 21-10
HCM 2010, Equations
21-9, 21-10
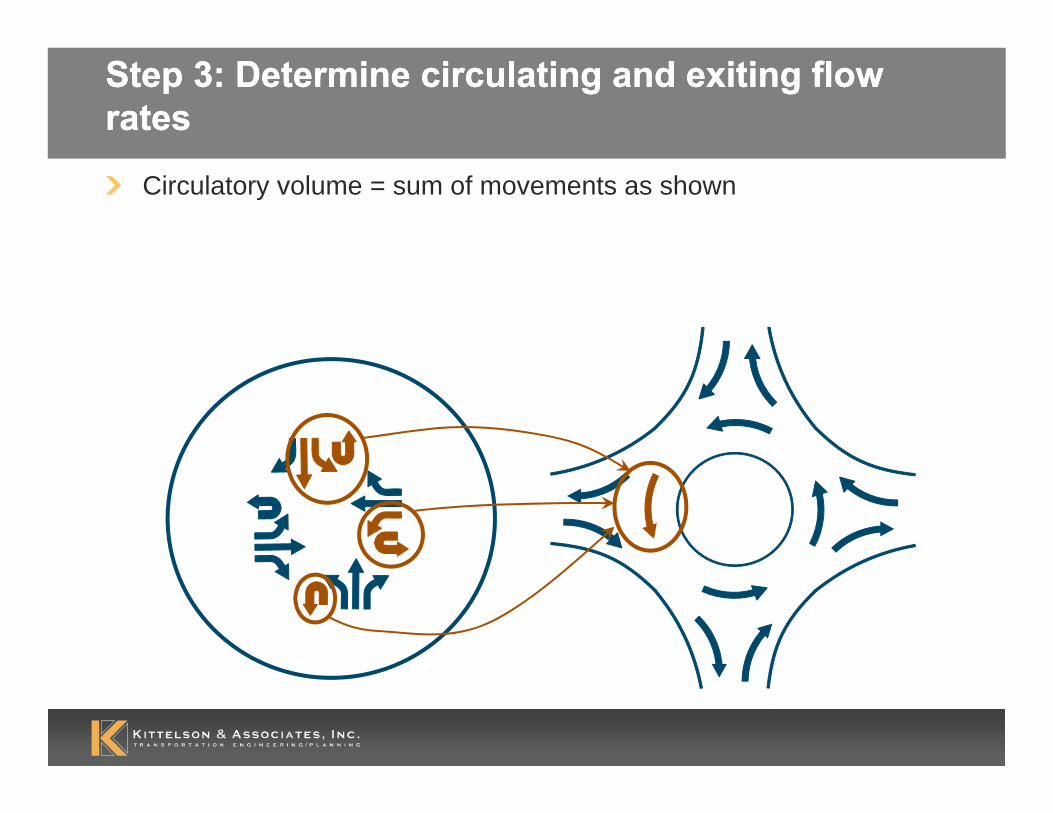
Step 3: Determine circulating and exiting flow ratesStep 3: Determine circulating and exiting flow rates
Circulatory volume = sum of movements as shown
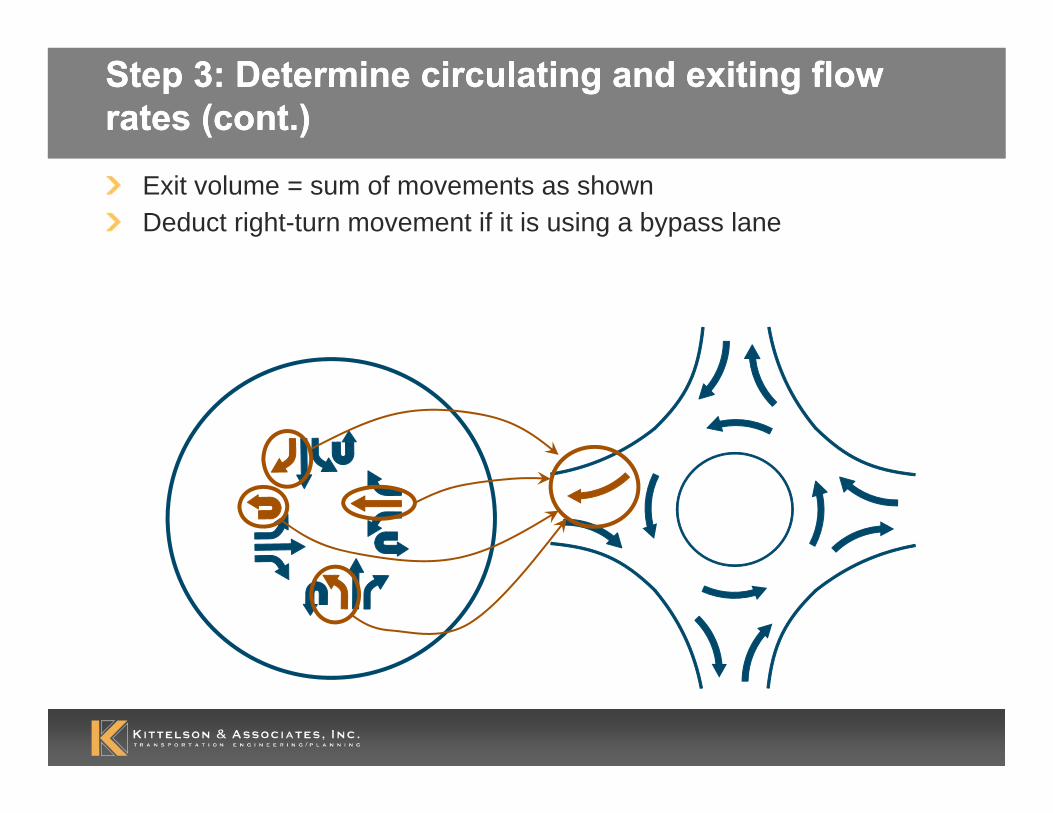
Step 3: Determine circulating and exiting flow rates (cont.)Step 3: Determine circulating and exiting flow rates (cont.)
Exit volume = sum of movements as shownDeduct right-turn movement if it is using a bypass lane
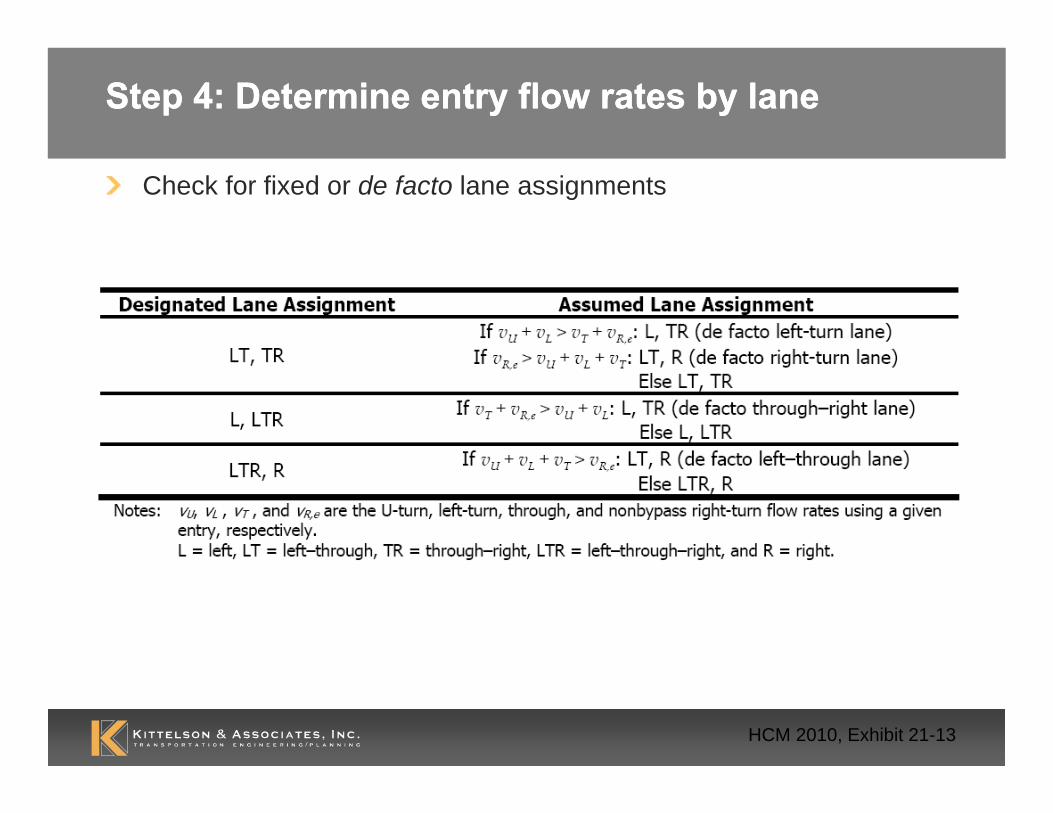
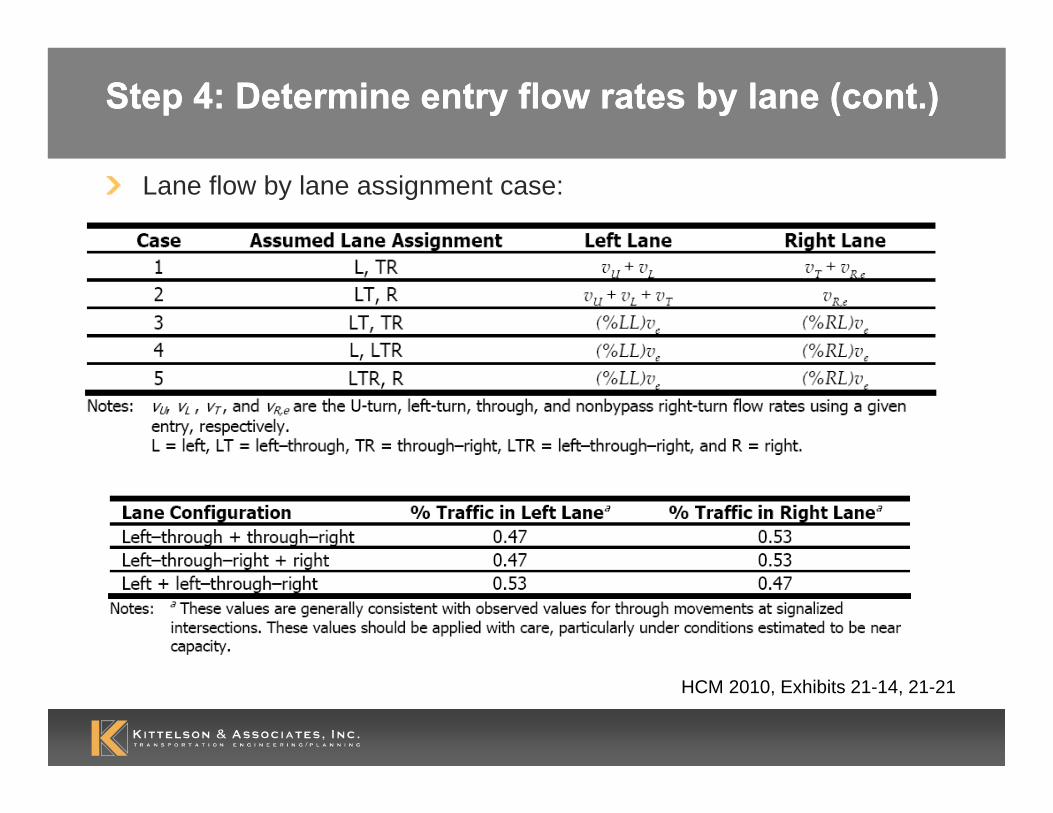
Step 4: Determine entry flow rates by laneStep 4: Determine entry flow rates by lane
Check for fixed or de facto lane assignments
HCM 2010, Exhibit 21-13
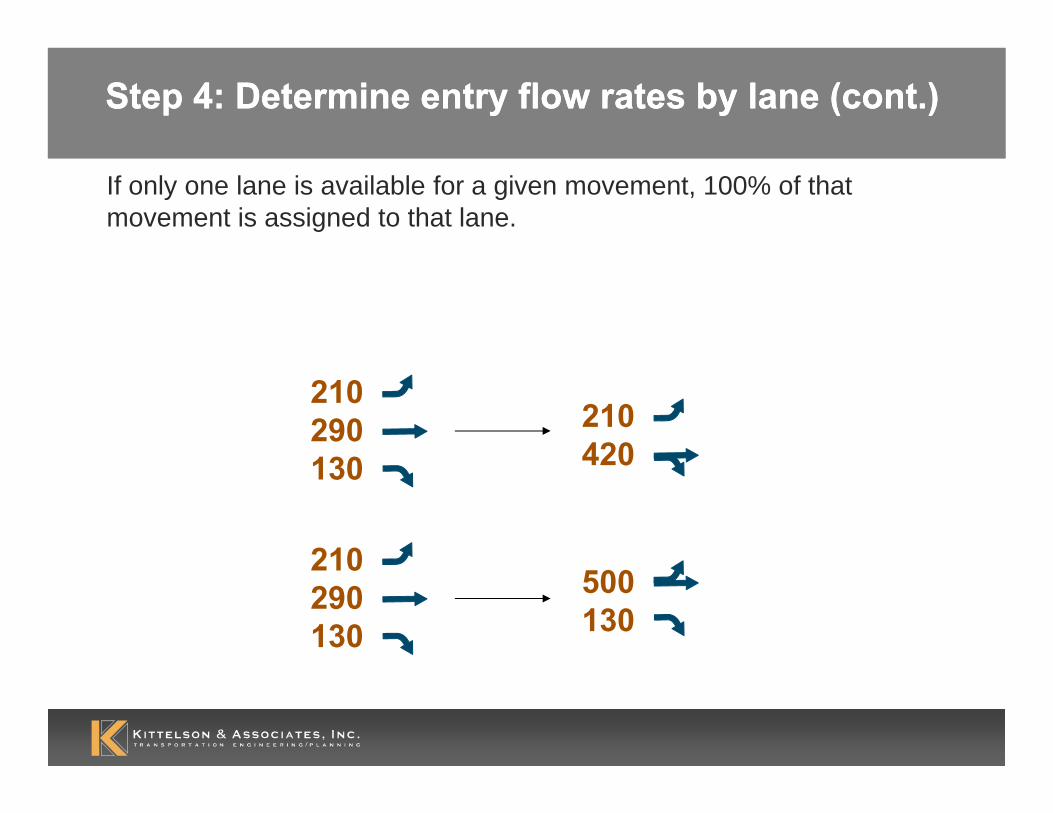
Step 4: Determine entry flow rates by lane (cont.)Step 4: Determine entry flow rates by lane (cont.)
If only one lane is available for a given movement, 100% of that movement is assigned to that lane.
210290130
210420
210290130
500130
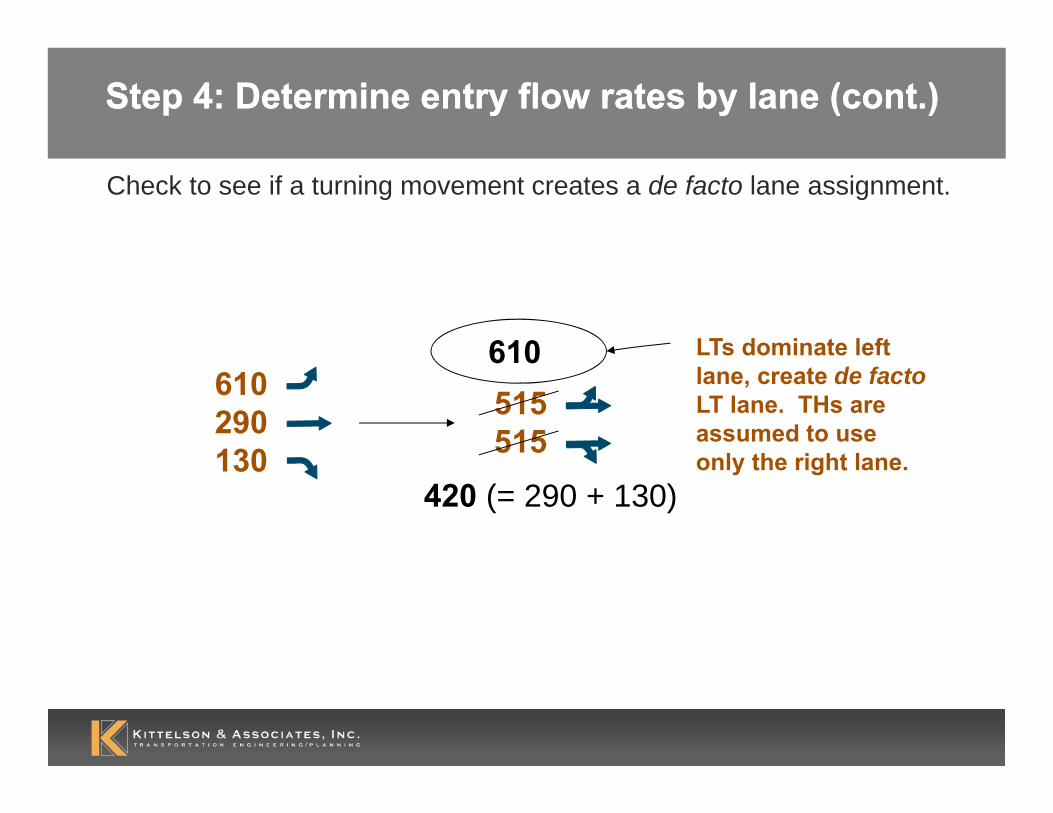
Step 4: Determine entry flow rates by lane (cont.)Step 4: Determine entry flow rates by lane (cont.)
Check to see if a turning movement creates a de facto lane assignment.
610290130
LTs dominate left lane, create de factoLT lane. THs are assumed to use only the right lane.
515515
420 (= 290 + 130)
610
Step 4: Determine entry flow rates by lane (cont.)Step 4: Determine entry flow rates by lane (cont.)
Lane flow by lane assignment case:
Default values for %LL, %RL:
HCM 2010, Exhibits 21-14, 21-21
Step 4: Determine entry flow rates by lane (cont.)Step 4: Determine entry flow rates by lane (cont.)
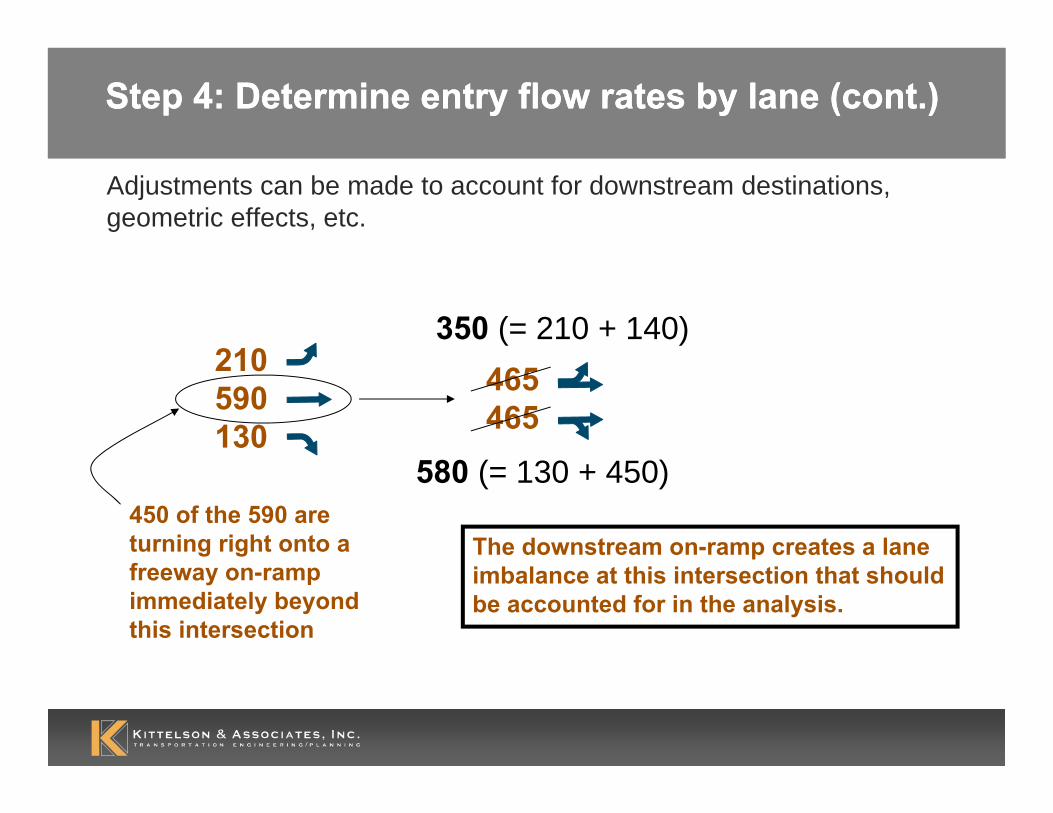
Adjustments can be made to account for downstream destinations, geometric effects, etc.
210590130
465465
The downstream on-ramp creates a lane imbalance at this intersection that should be accounted for in the analysis.
450 of the 590 are turning right onto a freeway on-ramp immediately beyond this intersection
580 (= 130 + 450)
350 (= 210 + 140)

0
200
400
600
800
1,000
1,200
1,400
0 200 400 600 800 1,000 1,200 1,400 1,600 1,800 2,000
Conflicting Flow Rate (pc/h)
Cap
acit
y (p
c/h
)
Dashed regression extrapolated beyond the data
Capacity of one-lane entry or right lane of two-lane entry against two conflicting lanes
Capacity of left lane of two-lane entry against two conflicting lanes
Capacity of one-lane or either lane of two-lane entry against one conflicting lane
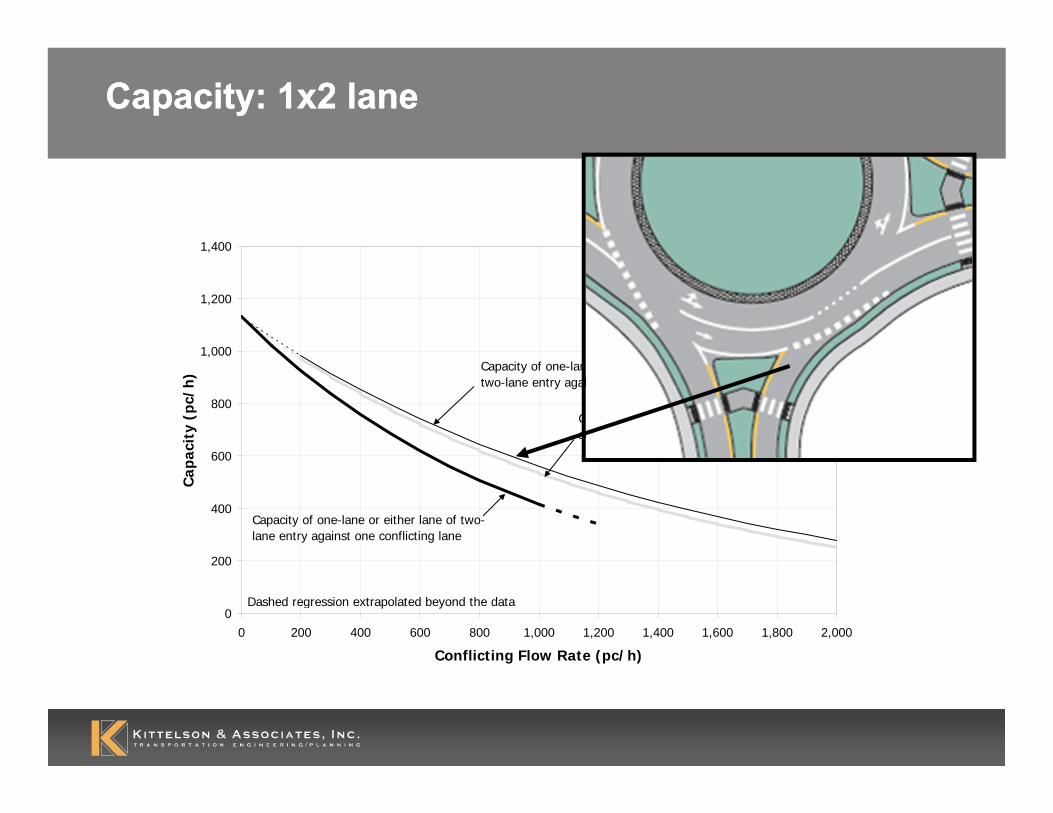
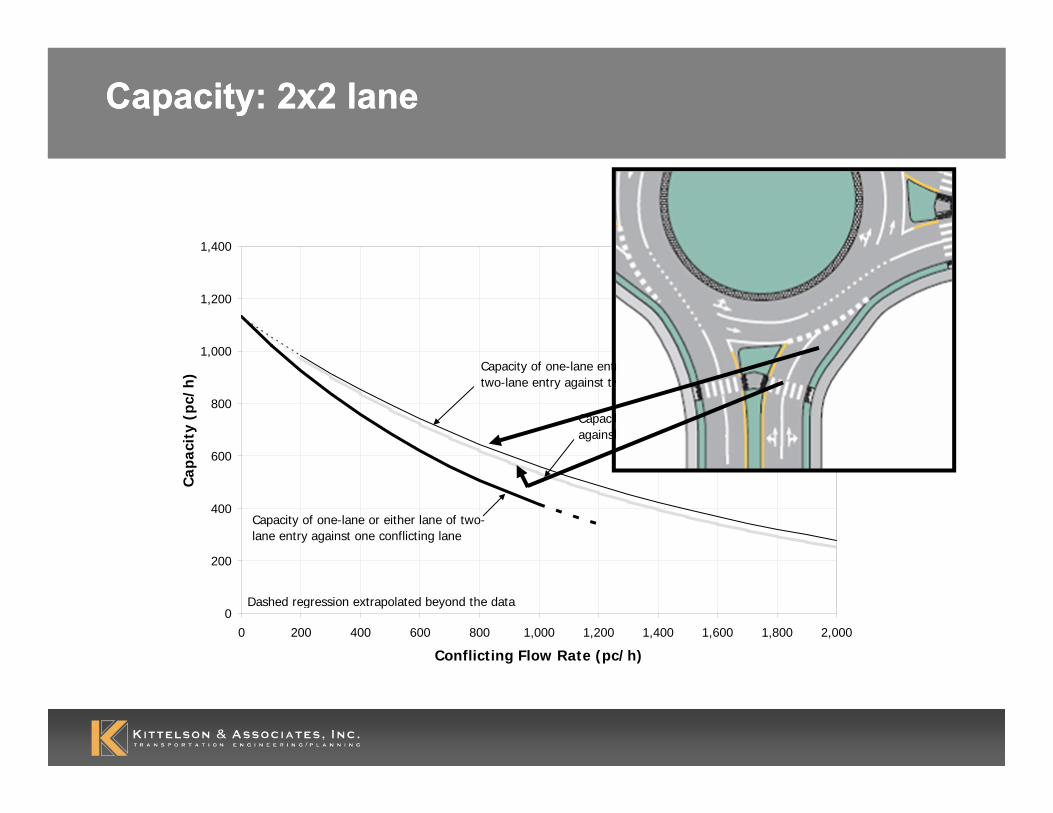
Step 5: Determine capacity of each entry lane and bypass laneStep 5: Determine capacity of each entry lane and bypass lane
HCM 2010, Exhibit 21-7

0
200
400
600
800
1,000
1,200
1,400
0 200 400 600 800 1,000 1,200 1,400 1,600 1,800 2,000
Conflicting Flow Rate (pc/h)
Cap
acit
y (p
c/h
)
Dashed regression extrapolated beyond the data
Capacity of one-lane entry or right lane of two-lane entry against two conflicting lanes
Capacity of left lane of two-lane entry against two conflicting lanes
Capacity of one-lane or either lane of two-lane entry against one conflicting lane
Capacity: 1 laneCapacity: 1 lane

0
200
400
600
800
1,000
1,200
1,400
0 200 400 600 800 1,000 1,200 1,400 1,600 1,800 2,000
Conflicting Flow Rate (pc/h)
Cap
acit
y (p
c/h
)
Dashed regression extrapolated beyond the data
Capacity of one-lane entry or right lane of two-lane entry against two conflicting lanes
Capacity of left lane of two-lane entry against two conflicting lanes
Capacity of one-lane or either lane of two-lane entry against one conflicting lane
Capacity: 2x1 laneCapacity: 2x1 lane
0
200
400
600
800
1,000
1,200
1,400
0 200 400 600 800 1,000 1,200 1,400 1,600 1,800 2,000
Conflicting Flow Rate (pc/h)
Cap
acit
y (p
c/h
)
Dashed regression extrapolated beyond the data
Capacity of one-lane entry or right lane of two-lane entry against two conflicting lanes
Capacity of left lane of two-lane entry against two conflicting lanes
Capacity of one-lane or either lane of two-lane entry against one conflicting lane
Capacity: 1x2 laneCapacity: 1x2 lane
0
200
400
600
800
1,000
1,200
1,400
0 200 400 600 800 1,000 1,200 1,400 1,600 1,800 2,000
Conflicting Flow Rate (pc/h)
Cap
acit
y (p
c/h
)
Dashed regression extrapolated beyond the data
Capacity of one-lane entry or right lane of two-lane entry against two conflicting lanes
Capacity of left lane of two-lane entry against two conflicting lanes
Capacity of one-lane or either lane of two-lane entry against one conflicting lane
Capacity: 2x2 laneCapacity: 2x2 lane
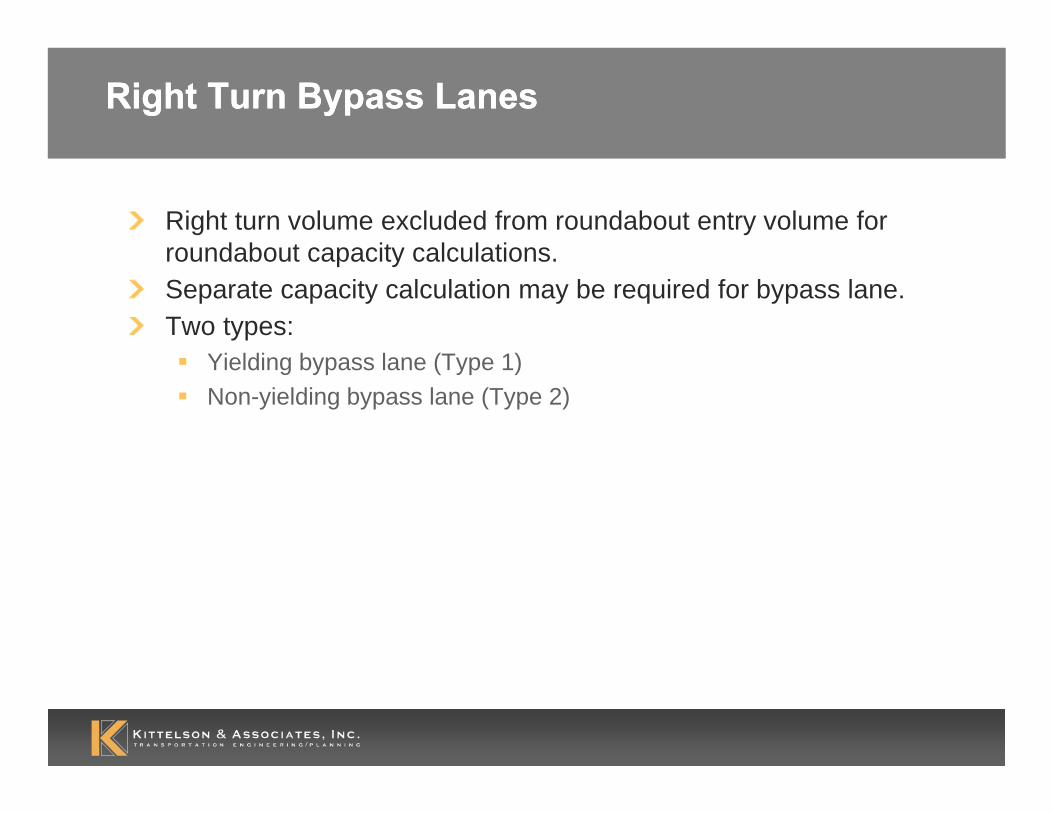
Right Turn Bypass LanesRight Turn Bypass Lanes
Right turn volume excluded from roundabout entry volume for roundabout capacity calculations.Separate capacity calculation may be required for bypass lane.Two types:
Yielding bypass lane (Type 1)Non-yielding bypass lane (Type 2)
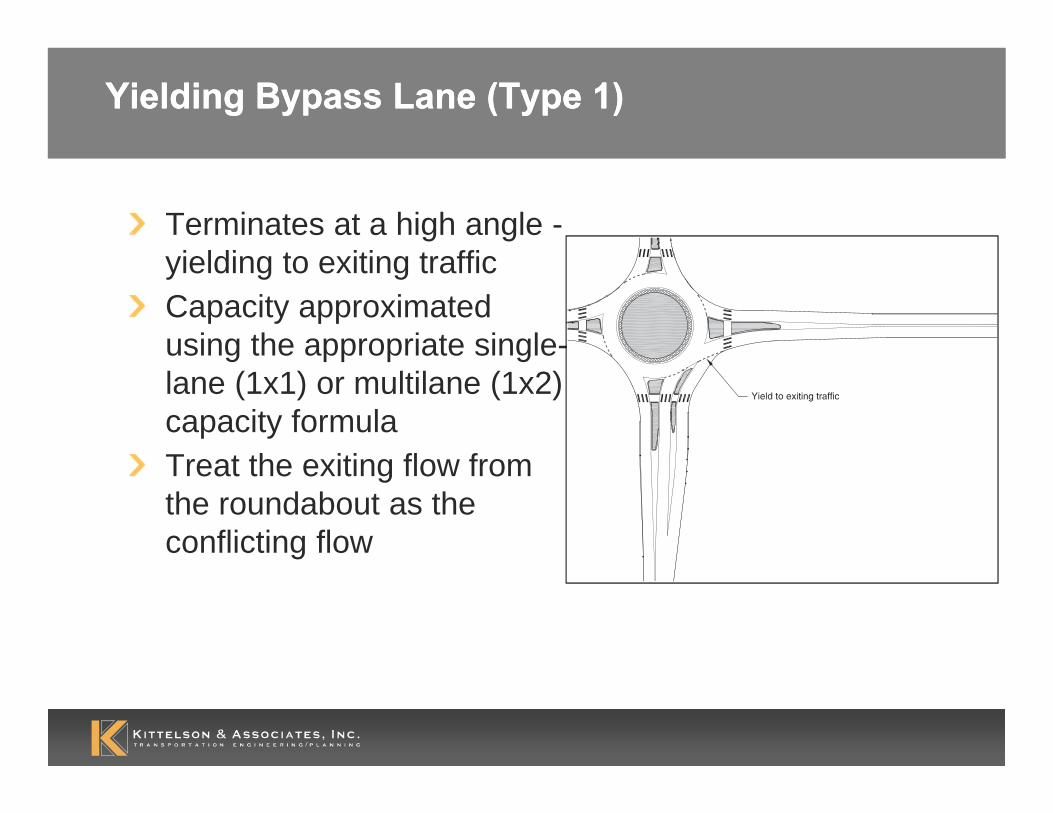
Yielding Bypass Lane (Type 1)Yielding Bypass Lane (Type 1)
Terminates at a high angle -yielding to exiting trafficCapacity approximated using the appropriate single-lane (1x1) or multilane (1x2) capacity formulaTreat the exiting flow from the roundabout as the conflicting flow
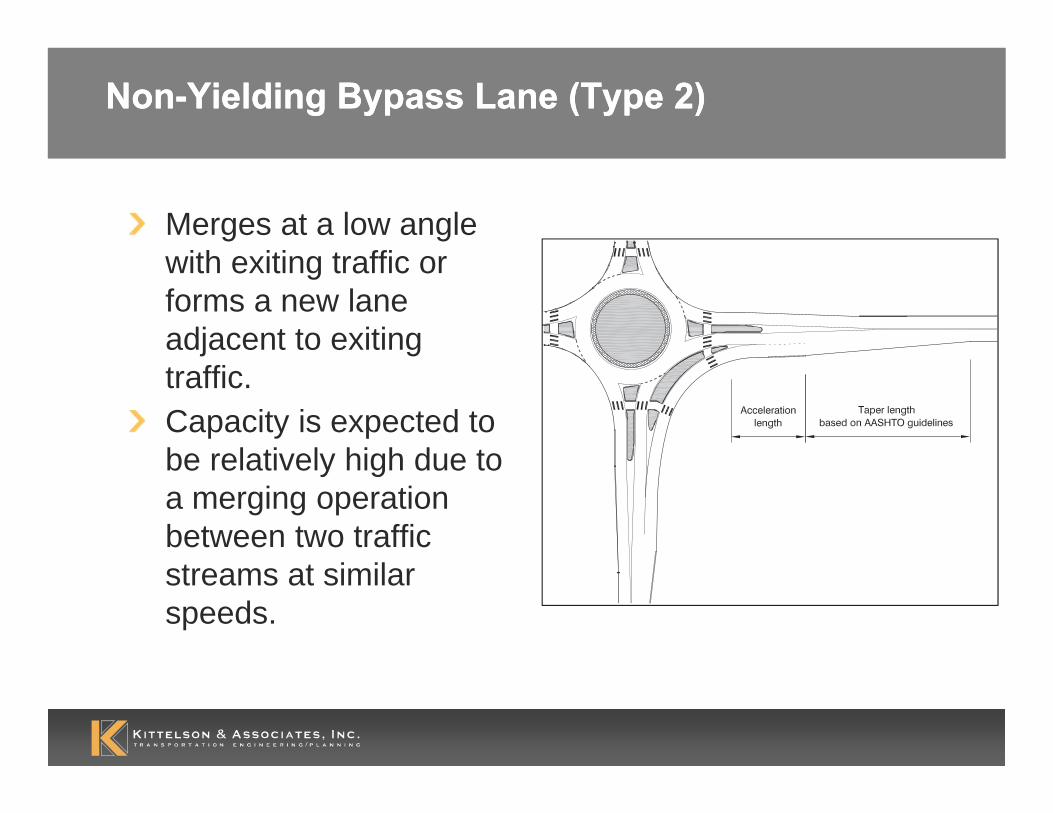
Non-Yielding Bypass Lane (Type 2)Non-Yielding Bypass Lane (Type 2)
Merges at a low angle with exiting traffic or forms a new lane adjacent to exiting traffic. Capacity is expected to be relatively high due to a merging operation between two traffic streams at similar speeds.
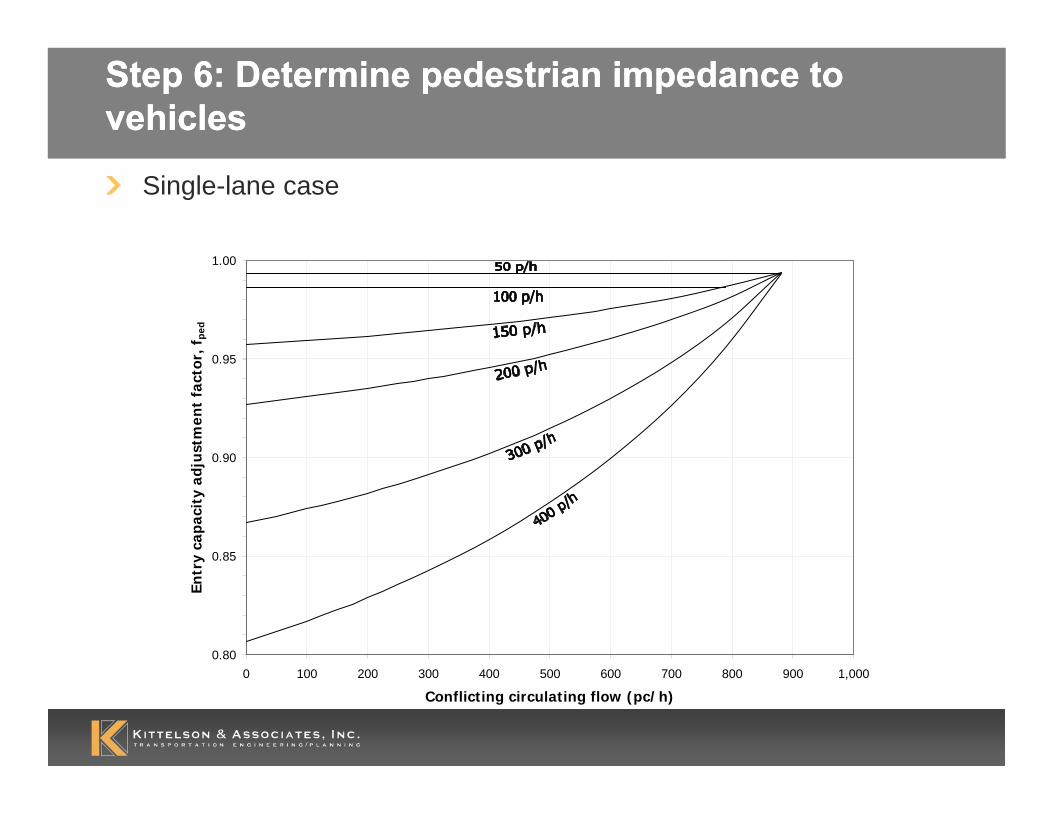
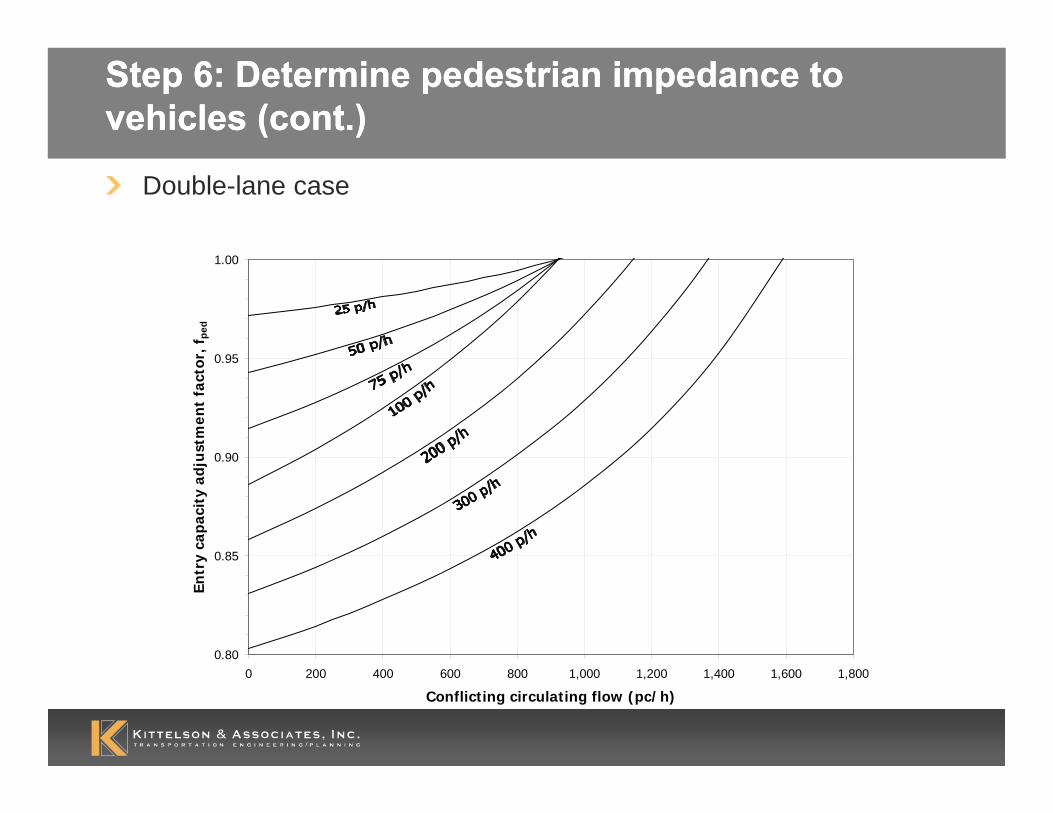
Step 6: Determine pedestrian impedance to vehiclesStep 6: Determine pedestrian impedance to vehicles
Single-lane case
0.80
0.85
0.90
0.95
1.00
0 100 200 300 400 500 600 700 800 900 1,000
Conflicting circulating flow (pc/h)
Entr
y ca
paci
ty a
dju
stm
ent
fact
or, f
ped
Step 6: Determine pedestrian impedance to vehicles (cont.)Step 6: Determine pedestrian impedance to vehicles (cont.)
Double-lane case
0.80
0.85
0.90
0.95
1.00
0 200 400 600 800 1,000 1,200 1,400 1,600 1,800
Conflicting circulating flow (pc/h)
Entr
y ca
paci
ty a
dju
stm
ent
fact
or, f
ped
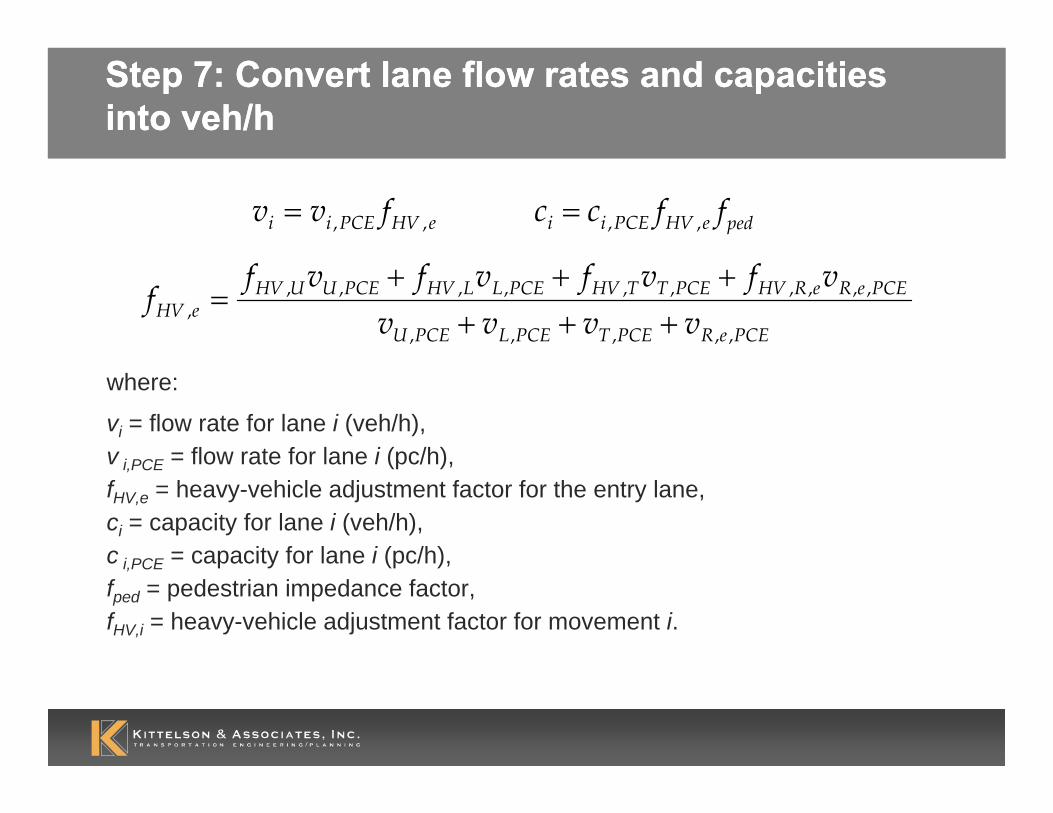
Step 7: Convert lane flow rates and capacities into veh/hStep 7: Convert lane flow rates and capacities into veh/h
where:
vi = flow rate for lane i (veh/h),v i,PCE = flow rate for lane i (pc/h),fHV,e = heavy-vehicle adjustment factor for the entry lane,ci = capacity for lane i (veh/h),c i,PCE = capacity for lane i (pc/h),fped = pedestrian impedance factor,fHV,i = heavy-vehicle adjustment factor for movement i.
eHVPCEii fvv ,,= pedeHVPCEii ffcc ,,=
PCEeRPCETPCELPCEU
PCEeReRHVPCETTHVPCELLHVPCEUUHVeHV vvvv
vfvfvfvff
,,,,,
,,,,,,,,,,, +++
+++=
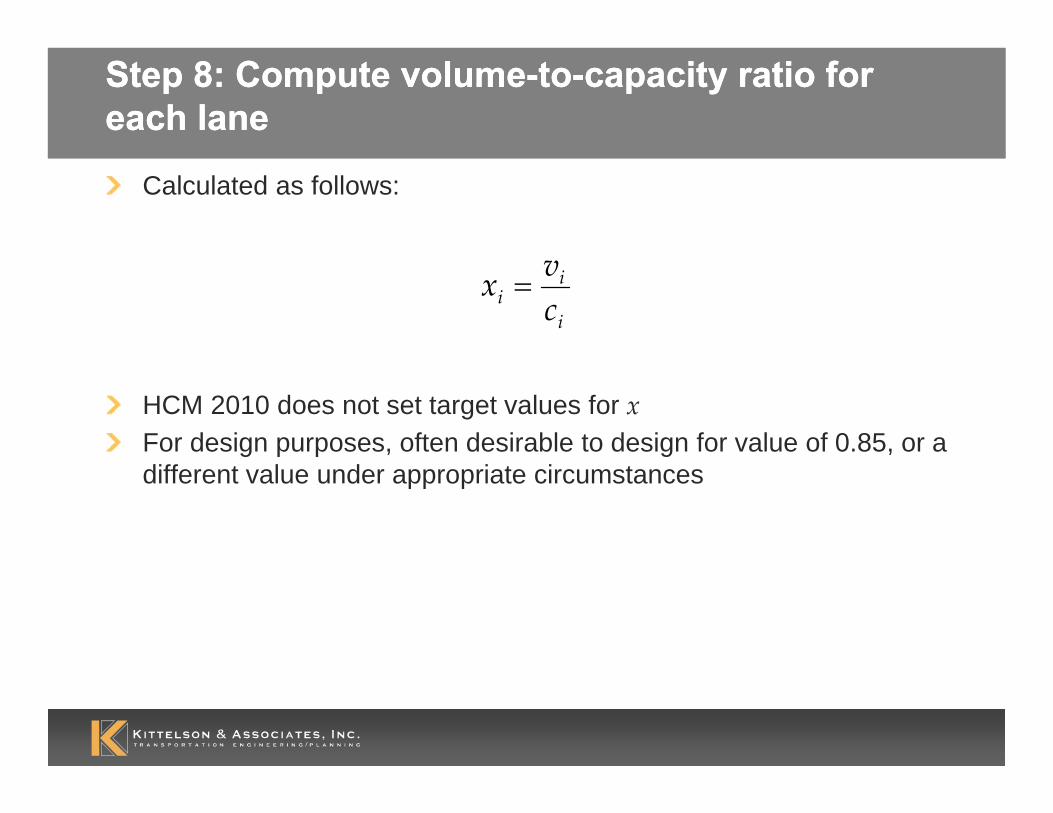
Step 8: Compute volume-to-capacity ratio for each laneStep 8: Compute volume-to-capacity ratio for each lane
Calculated as follows:
HCM 2010 does not set target values for xFor design purposes, often desirable to design for value of 0.85, or a different value under appropriate circumstances
i
ii cvx =
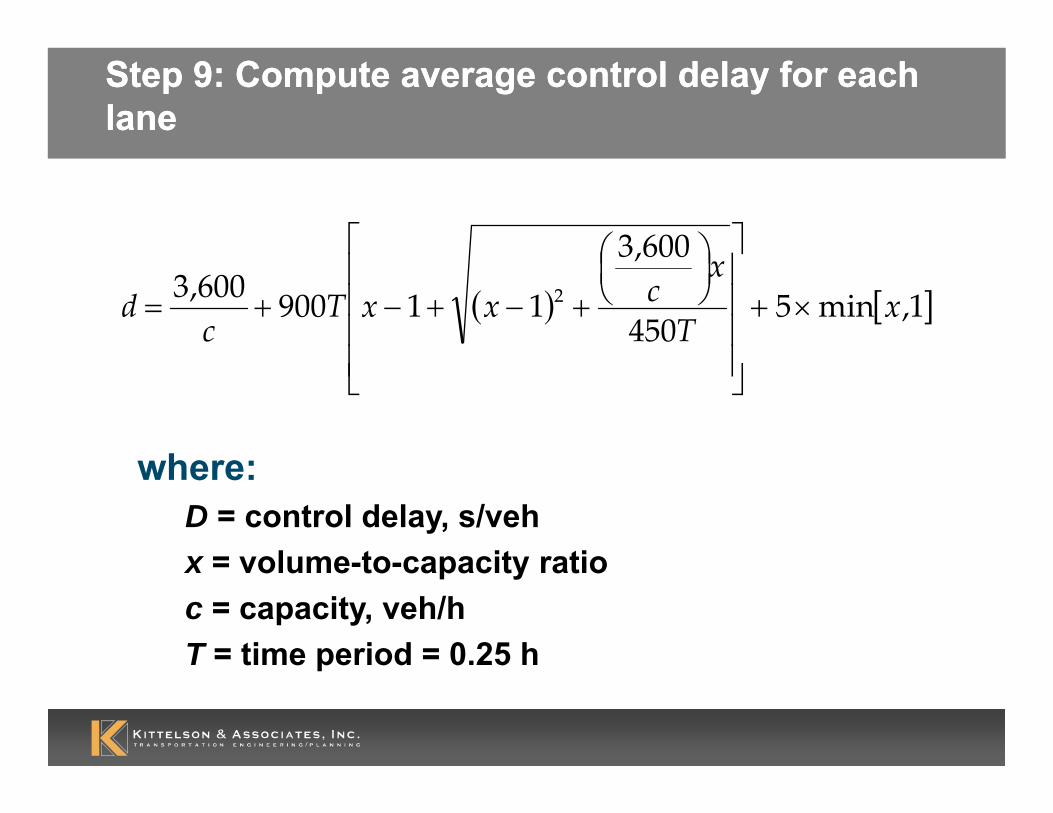
Step 9: Compute average control delay for each laneStep 9: Compute average control delay for each lane
where:D = control delay, s/vehx = volume-to-capacity ratioc = capacity, veh/hT = time period = 0.25 h
( ) [ ]1,min5450
600,3
11900600,3 2 xT
xcxxT
cd ×+
⎥⎥⎥⎥
⎦
⎤
⎢⎢⎢⎢
⎣
⎡⎟⎠⎞
⎜⎝⎛
+−+−+=
0
10
20
30
40
50
60
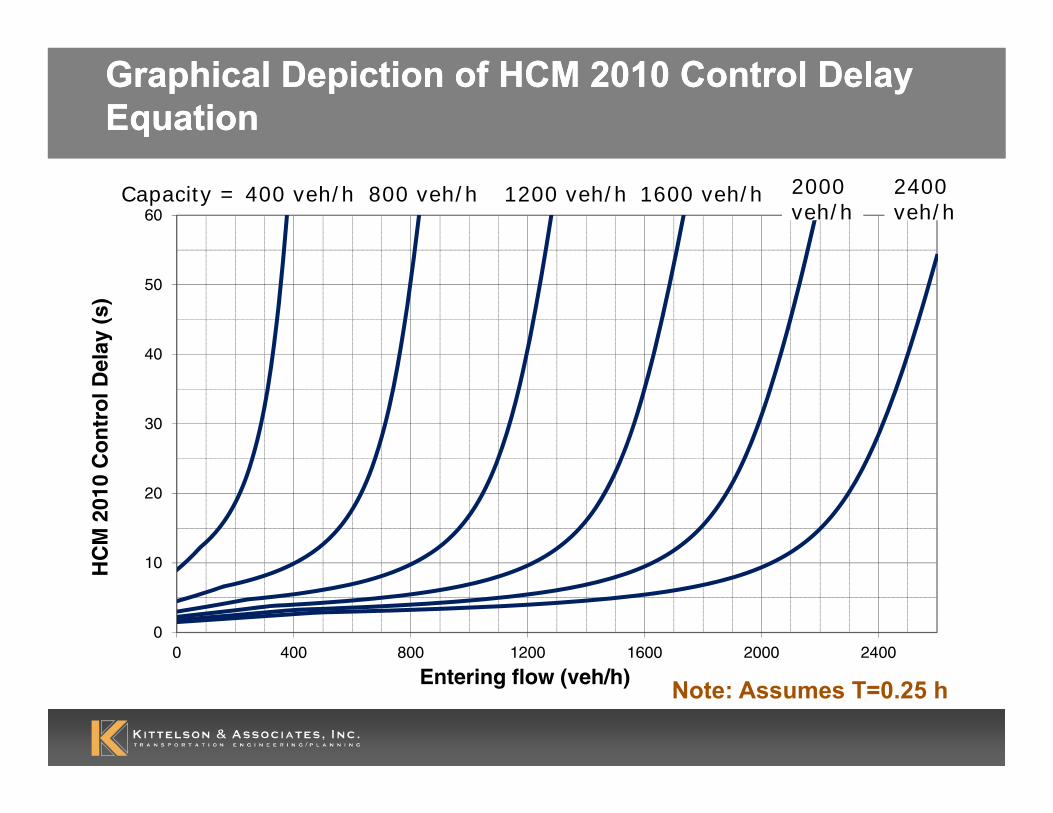
0 400 800 1200 1600 2000 2400
HC
M 2
010
Co
ntr
ol D
elay
(s)
Entering flow (veh/h)
Capacity = 400 veh/h 800 veh/h 1200 veh/h 1600 veh/h 2400veh/h
2000veh/h
Graphical Depiction of HCM 2010 Control Delay EquationGraphical Depiction of HCM 2010 Control Delay Equation
Note: Assumes T=0.25 h
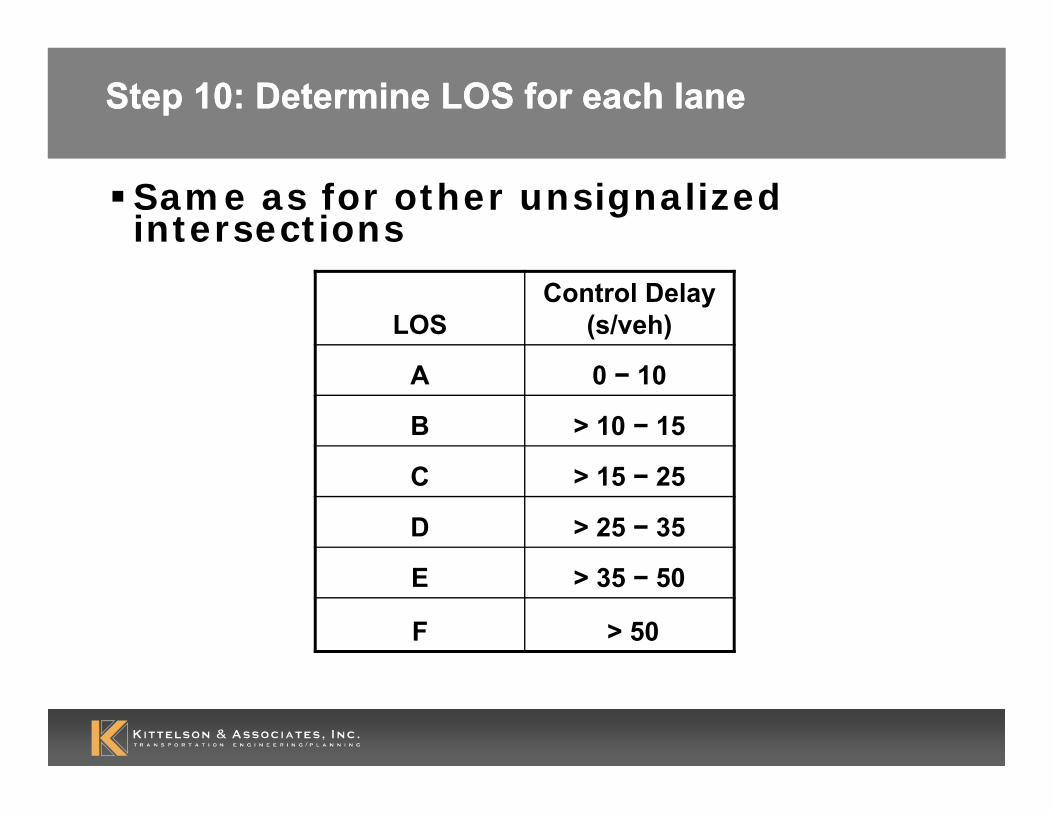
Step 10: Determine LOS for each laneStep 10: Determine LOS for each lane
LOSControl Delay
(s/veh)
A 0 − 10
B > 10 − 15
C > 15 − 25
D > 25 − 35
E > 35 − 50
F > 50
Same as for other unsignalized intersections
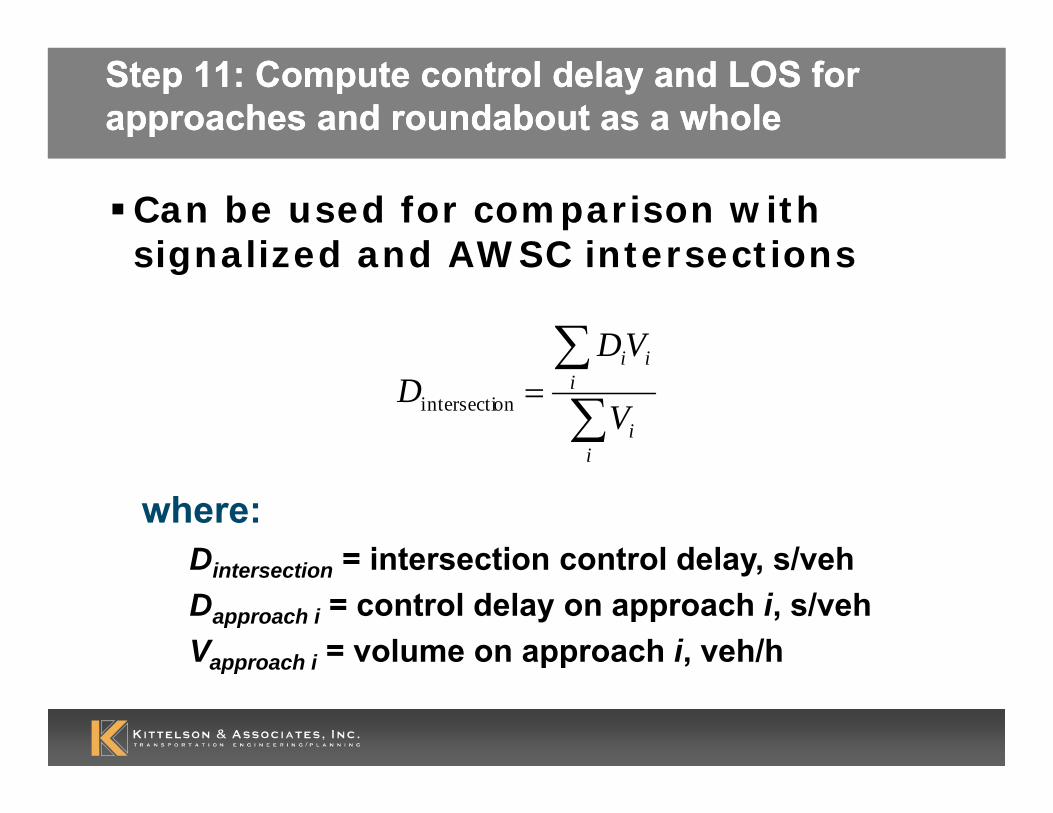
Step 11: Compute control delay and LOS for approaches and roundabout as a wholeStep 11: Compute control delay and LOS for approaches and roundabout as a whole
Can be used for comparison with signalized and AWSC intersections
∑∑
=
ii
iii
V
VDD onintersecti
where:Dintersection = intersection control delay, s/vehDapproach i = control delay on approach i, s/vehVapproach i = volume on approach i, veh/h
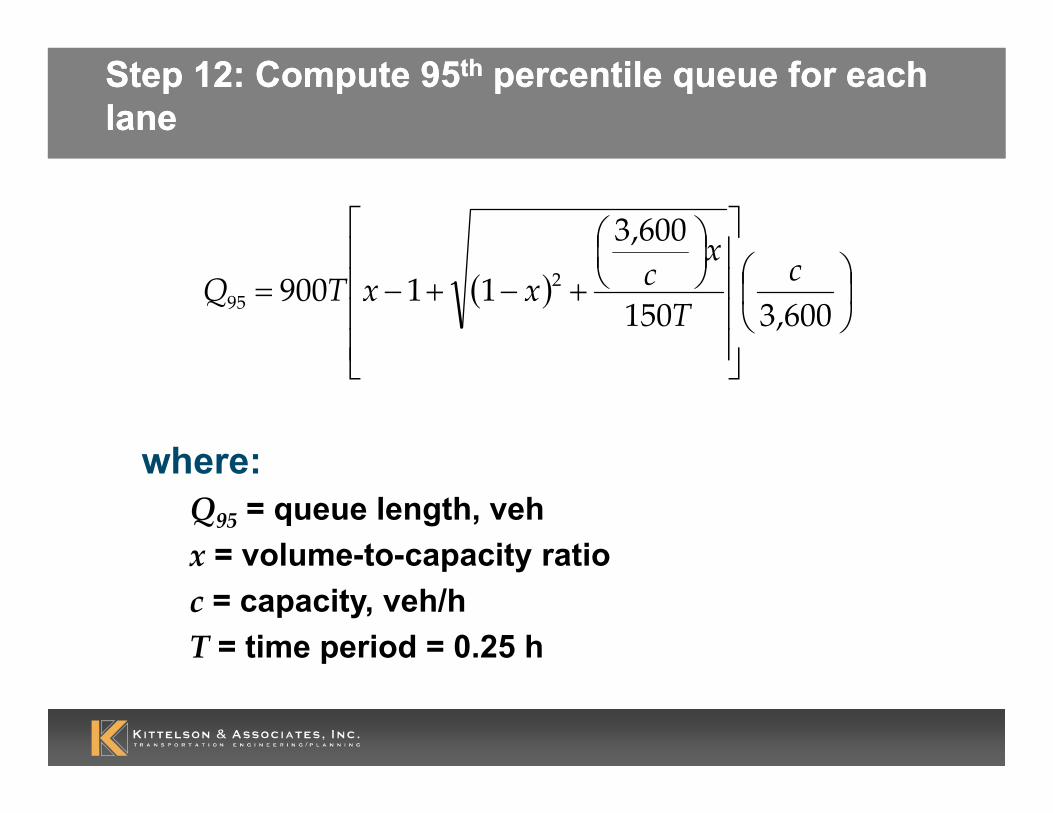
Step 12: Compute 95th percentile queue for each laneStep 12: Compute 95th percentile queue for each lane
where:Q95 = queue length, vehx = volume-to-capacity ratioc = capacity, veh/hT = time period = 0.25 h
( ) ⎟⎠
⎞⎜⎝
⎛
⎥⎥⎥⎥
⎦
⎤
⎢⎢⎢⎢
⎣
⎡⎟⎠⎞
⎜⎝⎛
+−+−=600,3150
600,3
11900 295
cT
xcxxTQ
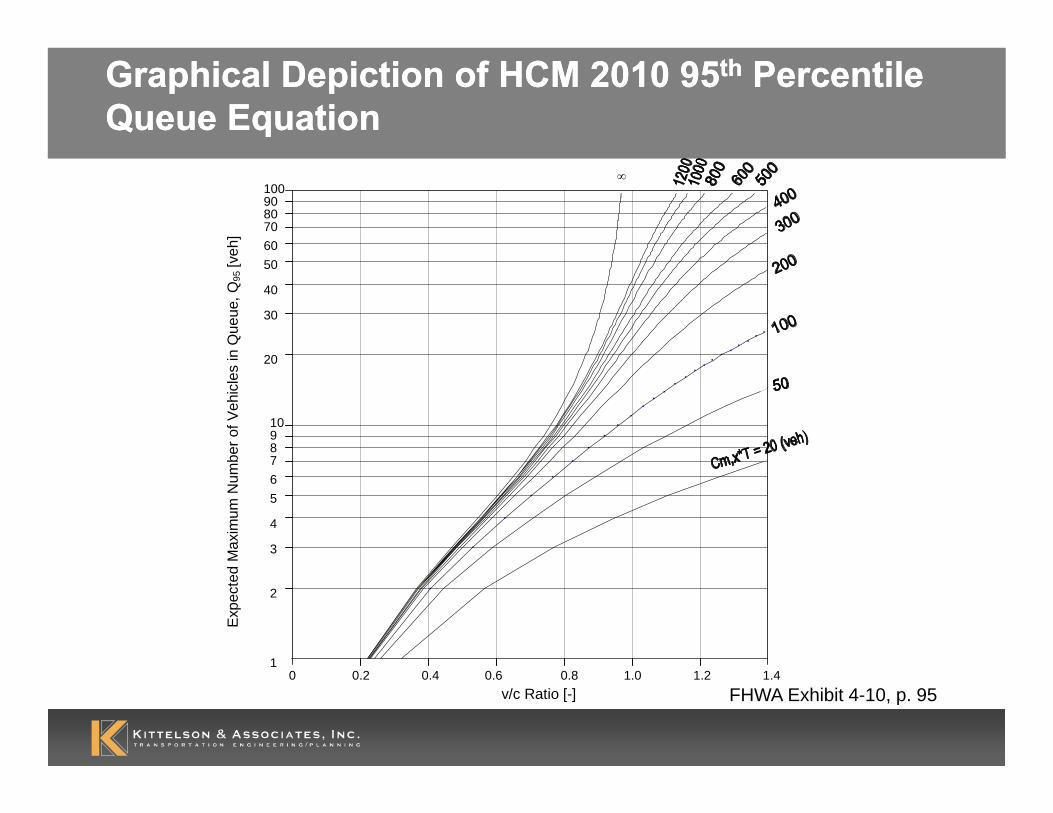
Graphical Depiction of HCM 2010 95th Percentile Queue EquationGraphical Depiction of HCM 2010 95th Percentile Queue Equation
0 0.2 0.4 0.6 0.8 1.0 1.2 1.41
2
3
4
5678910
20
30
40
5060708090100
∞
Exp
ecte
d M
axim
um N
umbe
r of V
ehic
les
in Q
ueue
, Q95
[veh
]
v/c Ratio [-] FHWA Exhibit 4-10, p. 95
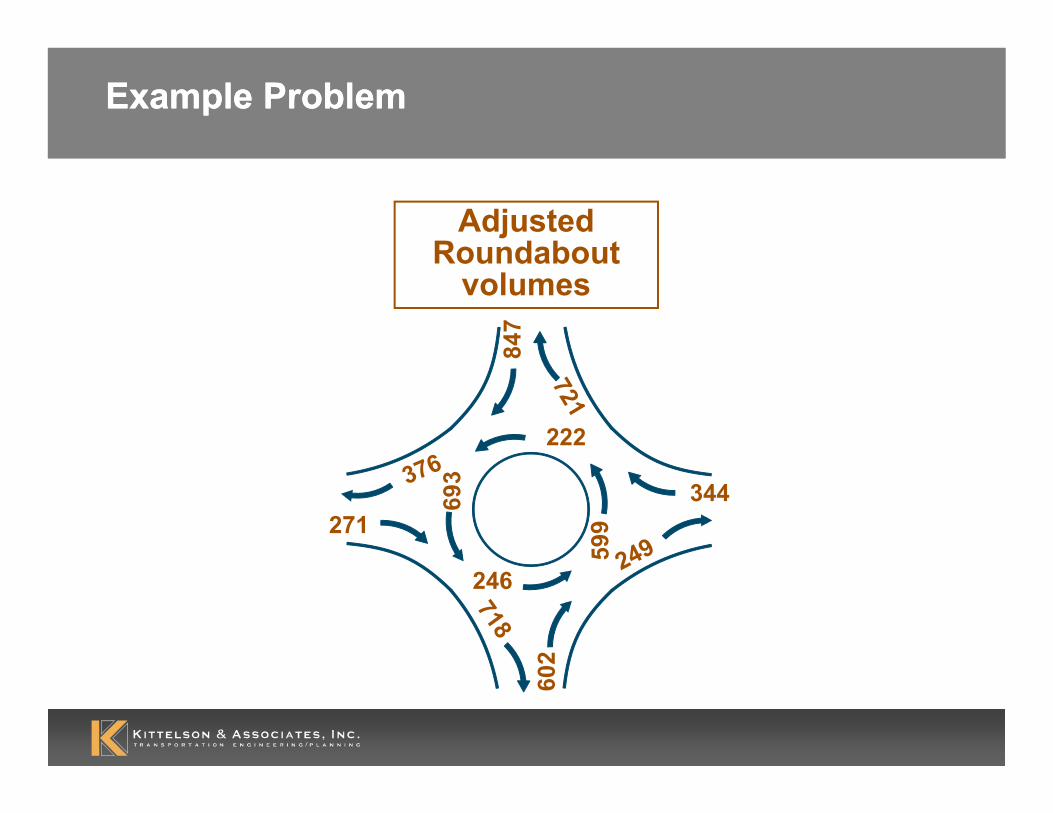
Example ProblemExample Problem
Adjusted Roundabout
volumes
271
246
693
222
847
344
602
0
200
400
600
800
1,000
1,200
1,400
0 200 400 600 800 1,000 1,200 1,400 1,600 1,800 2,000
Conflicting Flow Rate (pc/h)
Cap
acit
y (p
c/h
)
Dashed regression extrapolated beyond the data
Capacity of one-lane entry or right lane of two-lane entry against two conflicting lanes
Capacity of left lane of two-lane entry against two conflicting lanes
Capacity of one-lane or either lane of two-lane entry against one conflicting lane
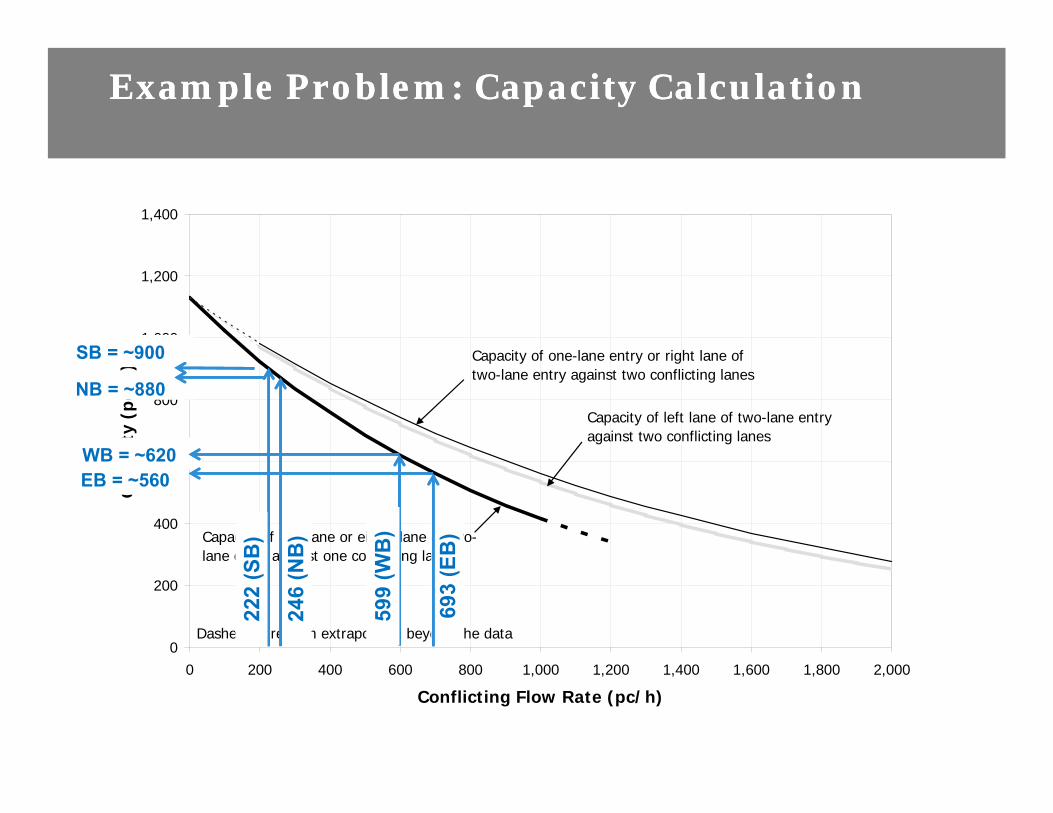
Example Problem: Capacity CalculationExample Problem: Capacity Calculation
246
(NB
)
NB = ~880
SB = ~900
222
(SB
)
WB = ~620
599
(WB
)
EB = ~56069
3 (E
B)
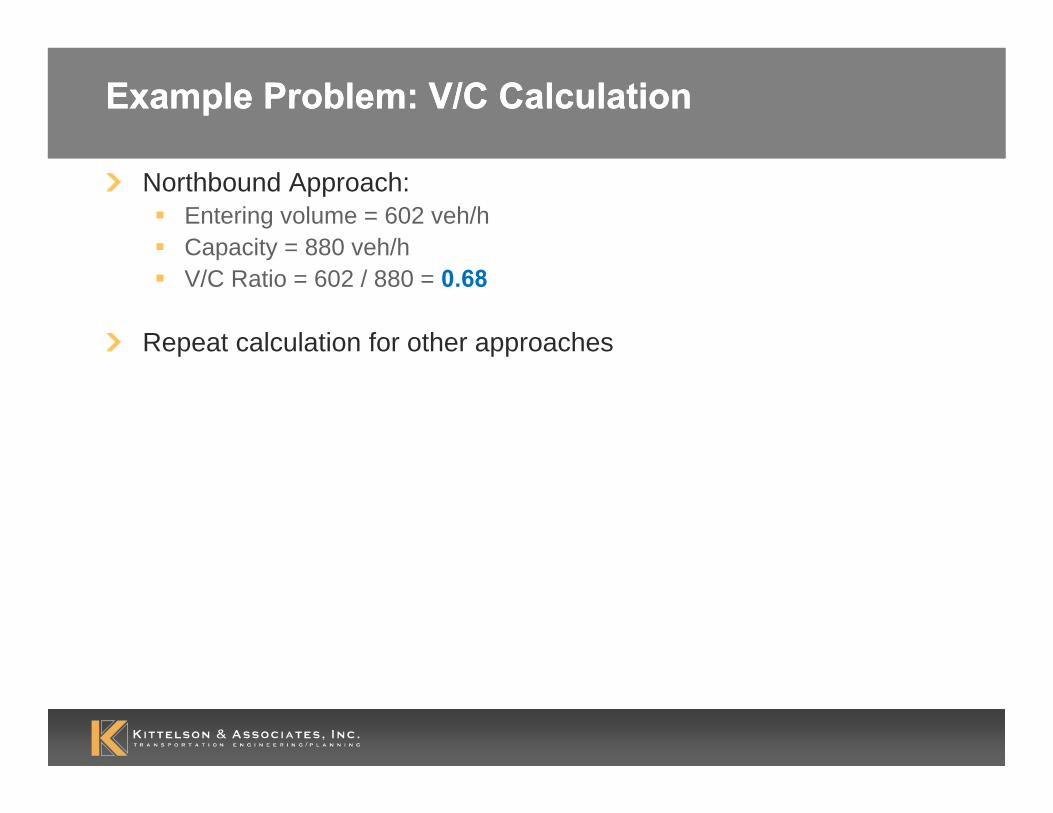
Example Problem: V/C CalculationExample Problem: V/C Calculation
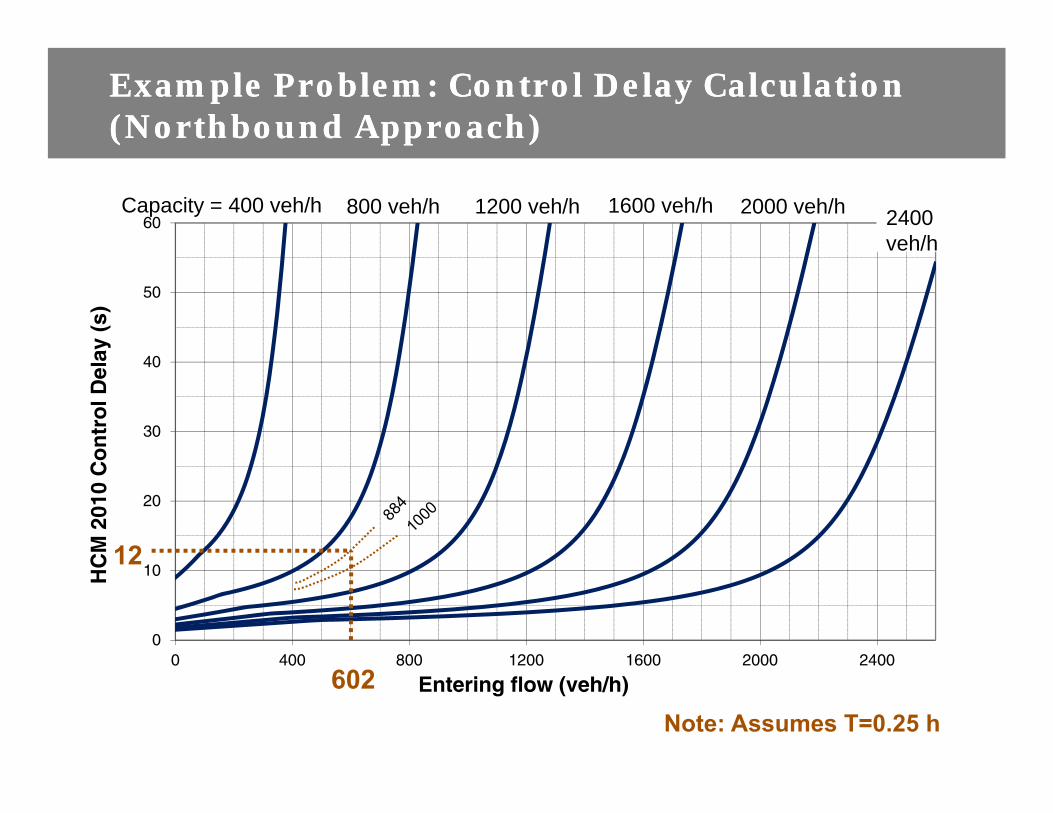
Northbound Approach:Entering volume = 602 veh/hCapacity = 880 veh/hV/C Ratio = 602 / 880 = 0.68
Repeat calculation for other approaches
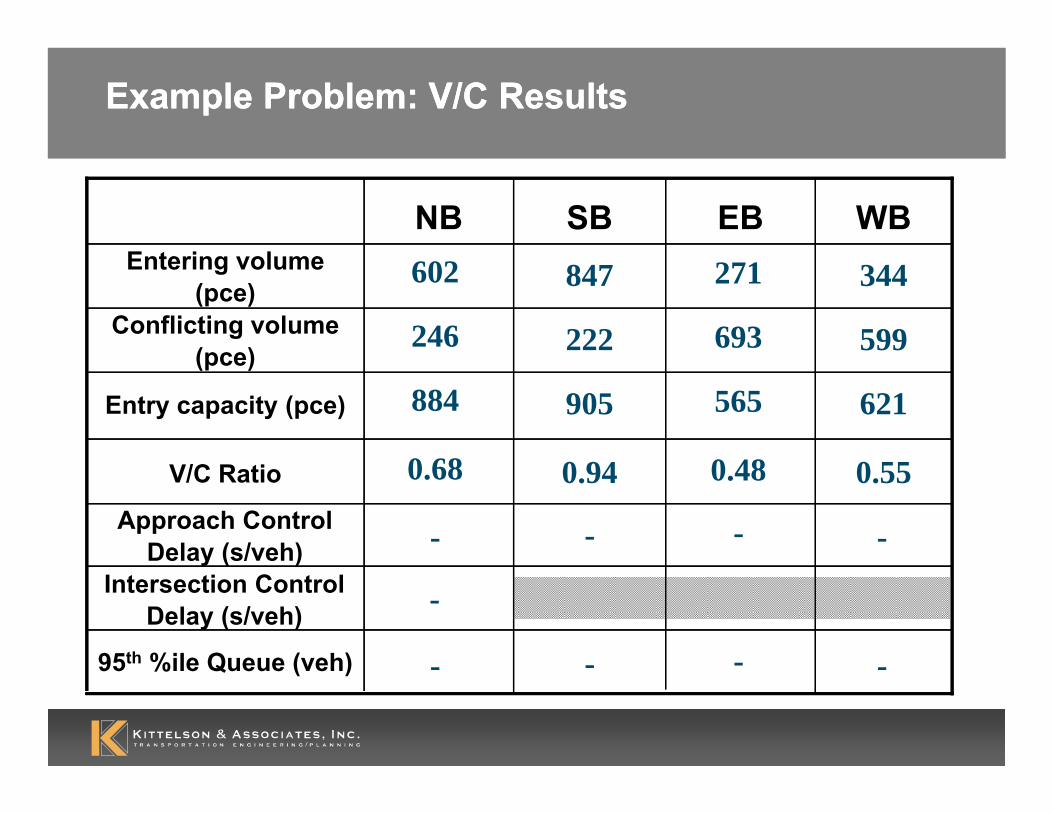
Example Problem: V/C ResultsExample Problem: V/C Results
V/C Ratio
Entry capacity (pce)
Conflicting volume (pce)
Entering volume (pce)
WBEBSBNB
Approach Control Delay (s/veh)
Intersection Control Delay (s/veh)
95th %ile Queue (veh)
0.550.94
621905
599222
344847
0.68
884
246
602
-
-
-
-
-
-
-
0.48
565
693
271
-
-
0
10
20
30
40
50
60
0 400 800 1200 1600 2000 2400
HC
M 2
010
Co
ntr
ol D
elay
(s)
Entering flow (veh/h)
Capacity = 400 veh/h 800 veh/h 1200 veh/h 1600 veh/h 2000 veh/h 2400veh/h
602
12
Example Problem: Control Delay Calculation (Northbound Approach)Example Problem: Control Delay Calculation (Northbound Approach)
Note: Assumes T=0.25 h
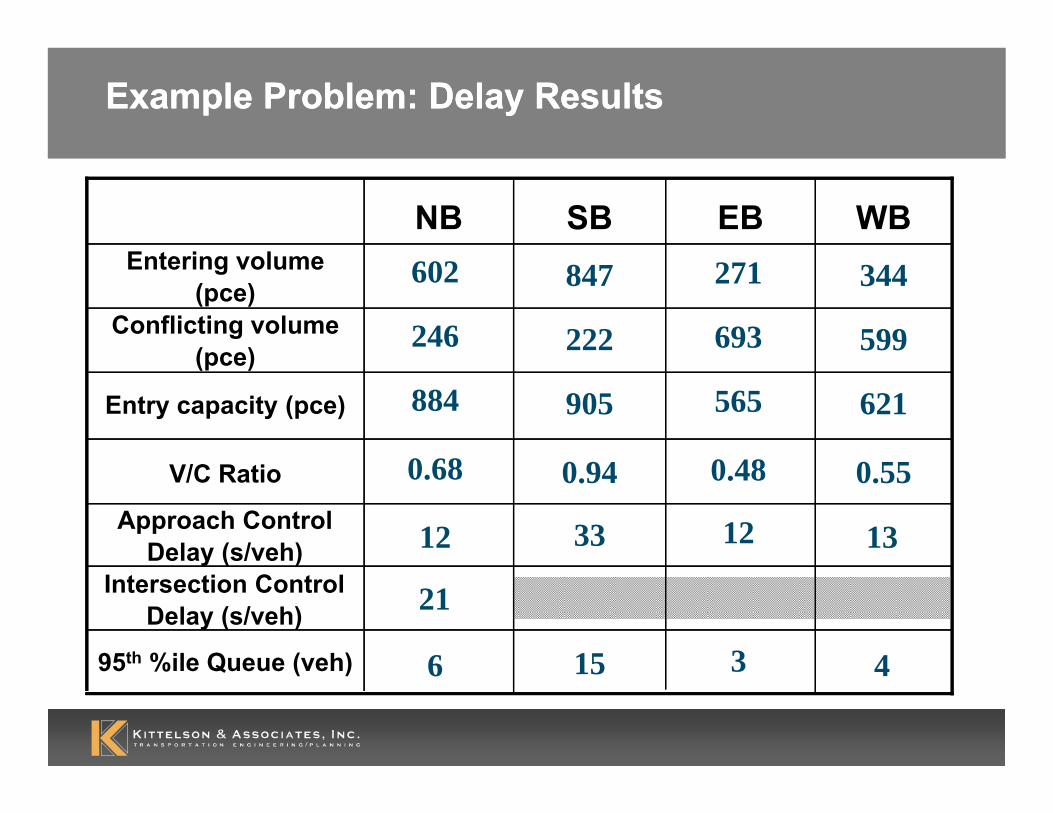
Example Problem: Delay ResultsExample Problem: Delay Results
V/C Ratio
Entry capacity (pce)
Conflicting volume (pce)
Entering volume (pce)
WBEBSBNB
Approach Control Delay (s/veh)
Intersection Control Delay (s/veh)
95th %ile Queue (veh)
0.550.94
621905
599222
344847
0.68
884
246
602
-
12
-
33
-
13
21
0.48
565
693
271
-
12
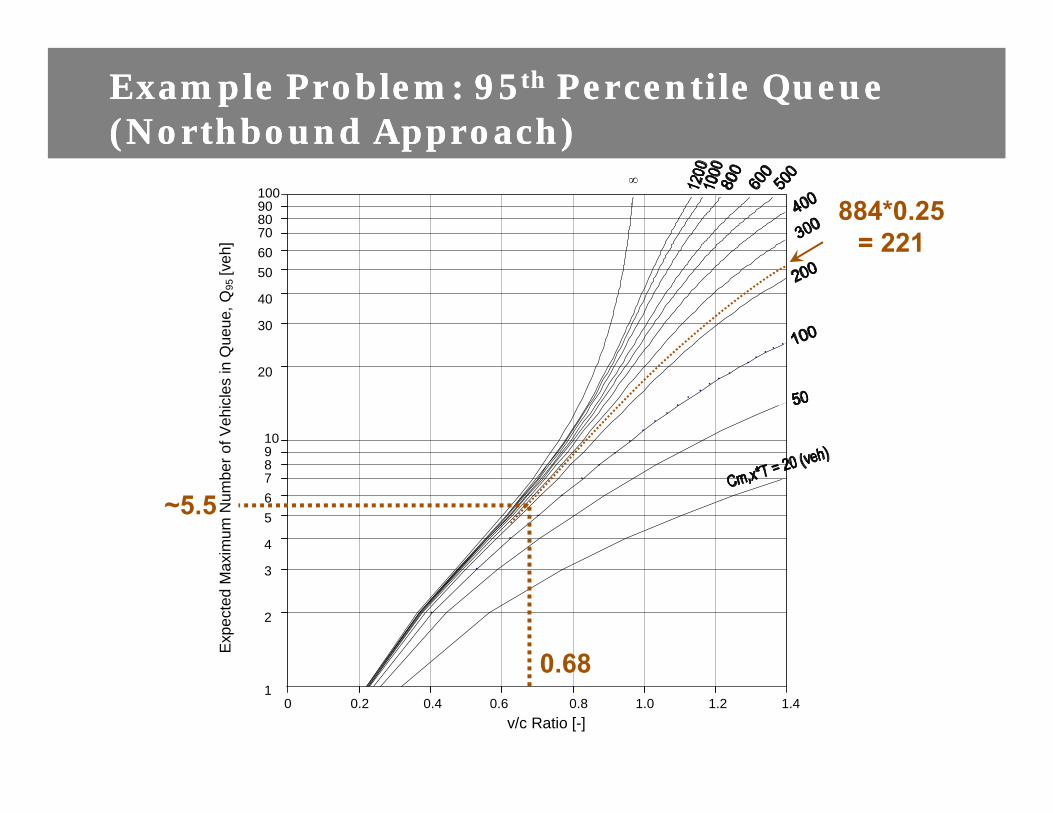
Example Problem: 95th Percentile Queue (Northbound Approach)Example Problem: 95th Percentile Queue (Northbound Approach)
0 0.2 0.4 0.6 0.8 1.0 1.2 1.41
2
3
4
5678910
20
30
40
5060708090100
∞
Exp
ecte
d M
axim
um N
umbe
r of V
ehic
les
in Q
ueue
, Q95
[veh
]
v/c Ratio [-]
0.68
~5.5
884*0.25 = 221
Example Problem: Delay ResultsExample Problem: Delay Results
V/C Ratio
Entry capacity (pce)
Conflicting volume (pce)
Entering volume (pce)
WBEBSBNB
Approach Control Delay (s/veh)
Intersection Control Delay (s/veh)
95th %ile Queue (veh)
0.550.94
621905
599222
344847
0.68
884
246
602
6
12
15
33
4
13
21
0.48
565
693
271
3
12