San Mateo US 101 Express Lane Feasibility...
22
San Mateo US 101 Express Lane Feasibility Study C/CAG Presentations - February, 2015 Kittelson & Associates Draft Report
Transcript of San Mateo US 101 Express Lane Feasibility...

San Mateo US 101 Express Lane Feasibility Study
C/CAG Presentations - February, 2015 Kittelson & Associates
Draft Report

Why Are We Here?
US 101 in San Mateo is the longest and most congested stretch of freeway in Bay Area without an HOV lane
C/CAG, MTC, Caltrans Studies
2
?

Study Limits
HOV/HOT Lane Limits Study Limits Extension Beyond Study
Limits to Capture Effects of Queues
3
Existing HOV Lane
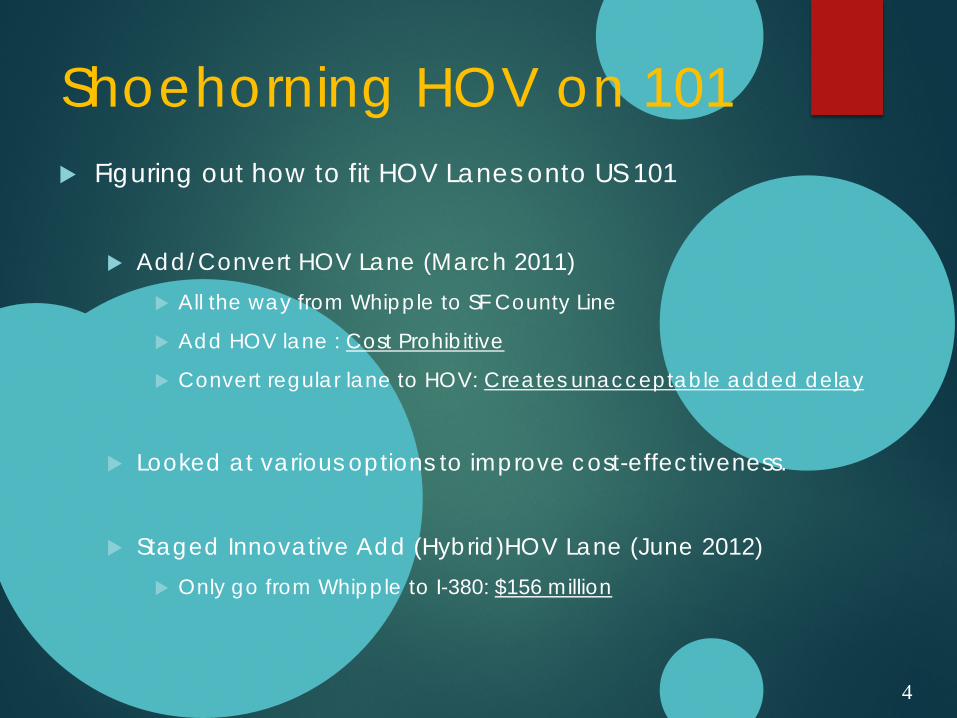
Shoehorning HOV on 101 Figuring out how to fit HOV Lanes onto US 101
Add/Convert HOV Lane (March 2011)
All the way from Whipple to SF County Line
Add HOV lane : Cost Prohibitive
Convert regular lane to HOV: Creates unacceptable added delay
Looked at various options to improve cost-effectiveness.
Staged Innovative Add (Hybrid)HOV Lane (June 2012) Only go from Whipple to I-380: $156 million
4

Latest Study – Go beyond HOV to HOT Purpose of Latest Study
Preliminary High Level Express Lane Feasibility Assessment
Two Concepts Concept 1: HOV-to-HOT (Innovative Add HOT Lane)
$259 million $156 million to build HOV lanes
$103 million to convert to express lane operation
Concept 2: GP-to-HOT (Convert HOT Lane) $108 million to convert to express lane operation
Traffic diversion or mode shift needed to mitigate travel delay impacts.
5
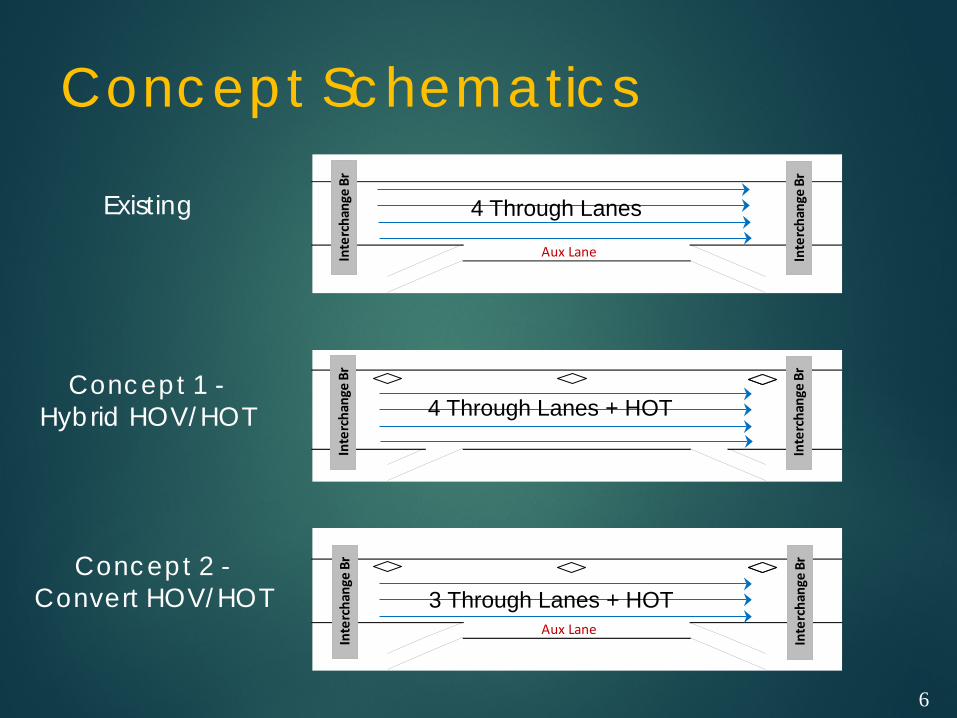
Concept Schematics
Existing
Concept 1 - Hybrid HOV/HOT
Concept 2 -
Convert HOV/HOT
Aux LaneInte
rcha
nge
Br
Inte
rcha
nge
Br
Inte
rcha
nge
Br
Inte
rcha
nge
Br
Aux Lane
Inte
rcha
nge
Br
Inte
rcha
nge
Br
6
4 Through Lanes
4 Through Lanes + HOT
3 Through Lanes + HOT
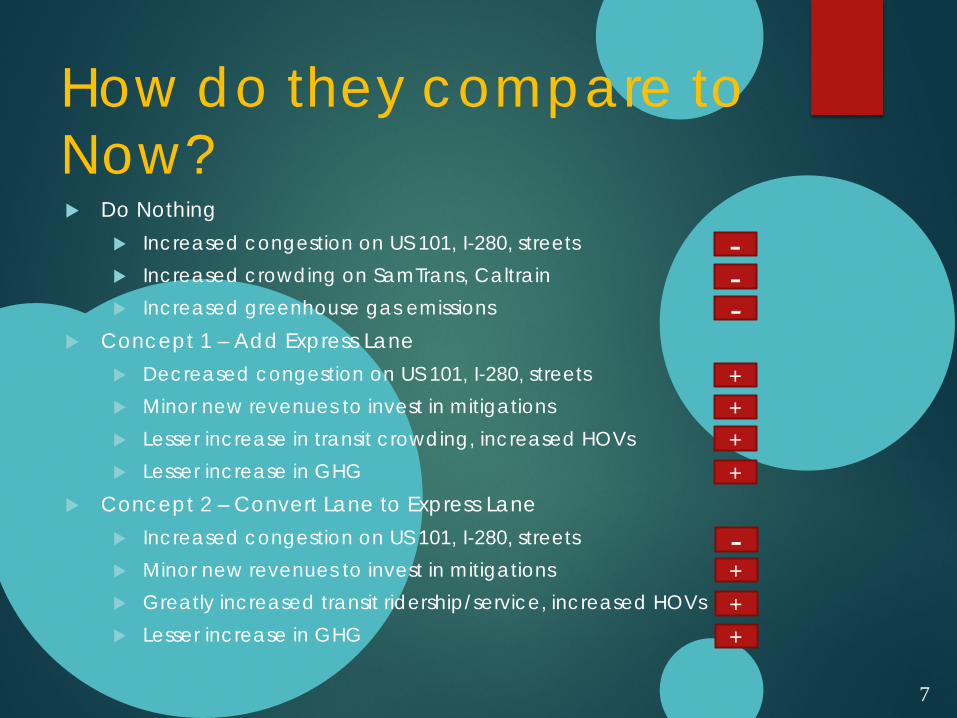
How do they compare to Now? Do Nothing
Increased congestion on US 101, I-280, streets Increased crowding on SamTrans, Caltrain Increased greenhouse gas emissions
Concept 1 – Add Express Lane Decreased congestion on US 101, I-280, streets Minor new revenues to invest in mitigations Lesser increase in transit crowding, increased HOVs Lesser increase in GHG
Concept 2 – Convert Lane to Express Lane Increased congestion on US 101, I-280, streets Minor new revenues to invest in mitigations Greatly increased transit ridership/service, increased HOVs Lesser increase in GHG
7
- -
- + + + +
+ + +
-
The Bottom Line
Find some way to do the Express Lane. It is better than doing nothing.
8

How to do the Express Lane?
Depends on your objectives, and tolerance for pain.
If increased GP Lane auto congestion OK (worse than now) Then concept 2, Convert Lane
If increased GP Lane auto congestion not OK Then concept 1, Add Lane
9

Can we make congestion better on 101 with Concept 2?
What would it take in transit investments to make Concept 2 as good as Concept 1, in terms of auto congestion on US 101? Can we carry all of the people that would need to
be diverted from US 101, in order to make Concept 2 = Concept 1.
$238 million for 20 years of transit service. This does not include capital costs to buy the extra
buses and train sets. This assumes enough people would switch, does not
take into account what it might take to “attract” new riders
10

The Details
Vehicle Capacity Freeway Congestion Freeway Performance Mixed Flow Lane travel times
11
Caveats: - Its tough modeling how people react to extreme congestion. - Numbers may change (cheap gas?)

Available Capacity for Tolled Vehicles
12
Concept 1 and Concept 2 Similar
Northbound More Capacity Available in Shoulder Hours
6:00-7:00 and 9:00-10:00 AM
2:30-3:30 and 6:30-7:30 PM
Southbound
No Capacity south of Holly

Freeway Congestion
13
AM PM
Concept 1 Congestion Similar to Hybrid HOV Longer Queues with Concept 2

Freeway Performance Measures
Performance
Measures Staged
Hybrid HOV Concept 1 - Hybrid HOT
Concept 2 - Convert
HOT
Concept 1 vs Staged
Hybrid HOV
Concept 2 vs Staged
Hybrid HOV
Vehicle Miles Travelled 5,145,600 5,166,500 4,836,400 0.4% -6.0%
Vehicle Hours Travelled 187,000 184,000 187,400 -1.6% 0.2%
Vehicle Hours of Delay 107,800 104,400 113,000 -3.2% 4.7%
Person Miles Travelled 5,839,900 5,901,700 5,573,000 1.1% -4.6%
Person Hours of Delay 109,200 105,800 113,400 -3.2% 3.8%
Average Vehicle Speed 27.5 28.1 25.8 2.1% -6.2%
Average Person Speed 29.3 30.0 28.0 2.3% -4.6%
14

Mixed-Flow Lane Travel Times
Concept 1 vs Staged Hybrid HOV Concept 2 vs Staged Hybrid HOV Concept 2 vs Concept 1
% (mins.) % (mins.) % (mins.)
Northbound AM 0% (-0.1) 16% (17.2) 16% (17.3)
Northbound PM -1% (-1.8) 24% (32.5) 26% (34.3)
Southbound AM -10% (-6.4) 25% (16.2) 39% (22.6)
Southbound PM -1% (-0.7) -17% (-17.3) -17% (-16.6)
Comparison of Mixed-Flow Travel Times
Average Peak Period Travel Time
Direction/Peak Period
15
Concept 1 Slightly better travel times than Hybrid HOV
Concept 2 Up to 32 minutes longer travel time (NB PM), 17 minutes shorter travel time for SB PM
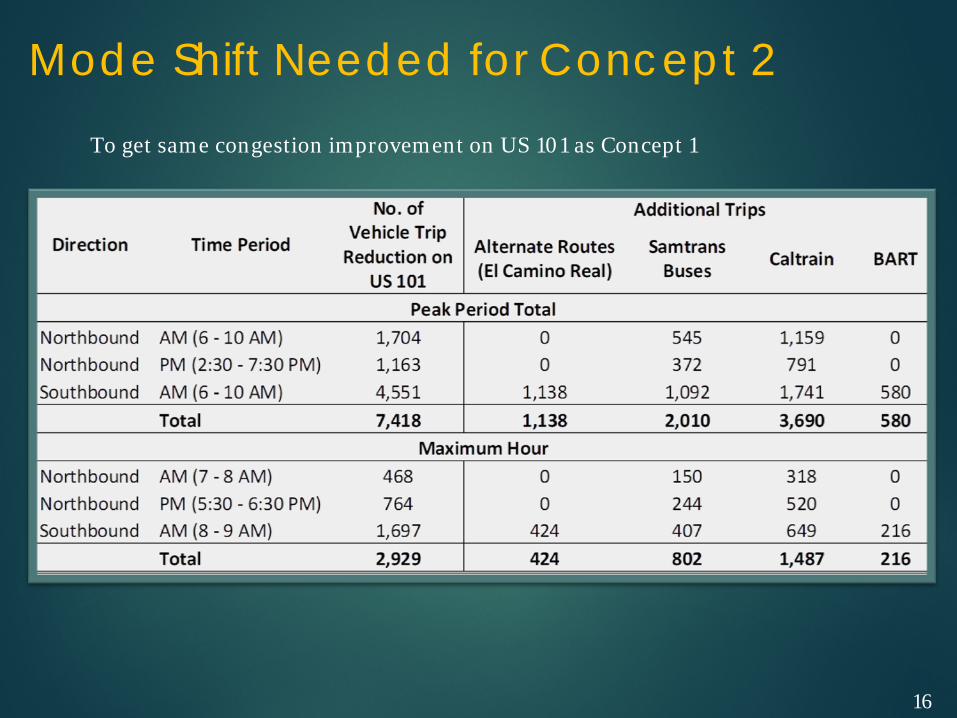
Mode Shift Needed for Concept 2
16
To get same congestion improvement on US 101 as Concept 1

Mode Shift Analysis – Transit Costs
Transit Operator Additional Daily Riders Operating Expense per Passenger Trip
Additional Annual Operating Expense
BART
580 $4.12 $622,000
Caltrain
3,690 $7.50 $7,196,000
Samtrans
2,010 $7.73 $4,039,000
Total 6,280 $11,900,000
20-Year Operating Cost $238,000,000
17
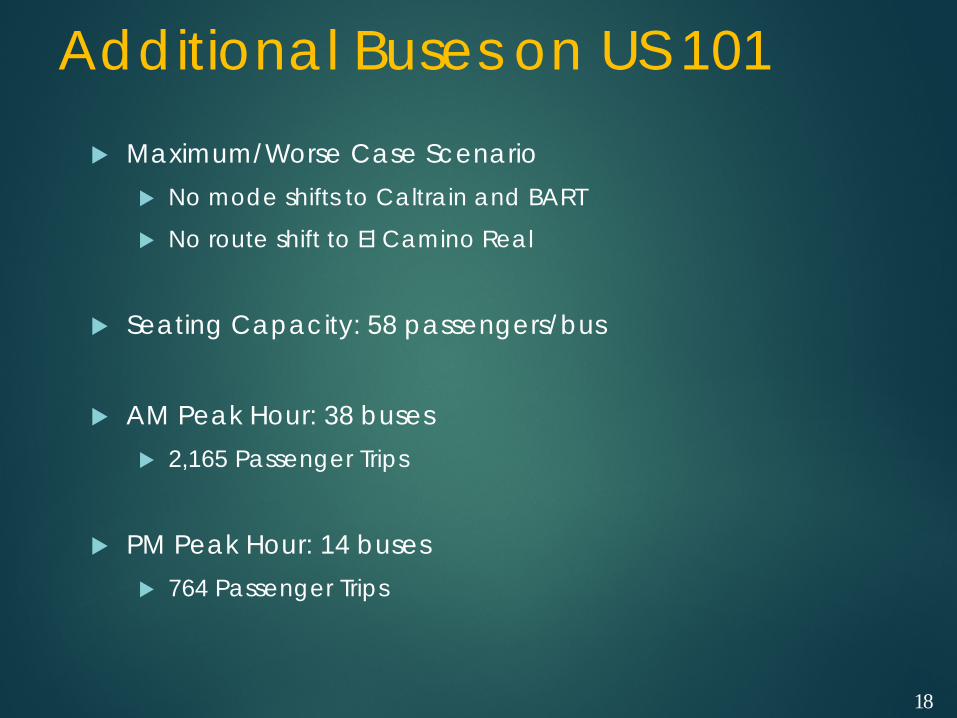
Additional Buses on US 101
Maximum/Worse Case Scenario
No mode shifts to Caltrain and BART
No route shift to El Camino Real
Seating Capacity: 58 passengers/bus AM Peak Hour: 38 buses
2,165 Passenger Trips
PM Peak Hour: 14 buses 764 Passenger Trips
18
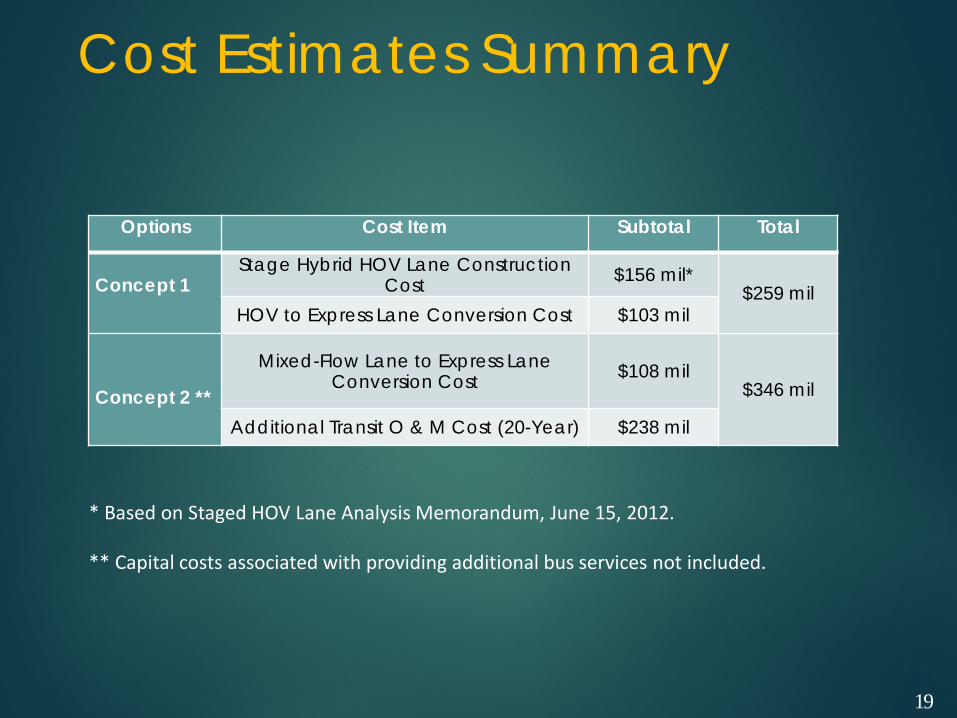
Cost Estimates Summary
Options Cost Item Subtotal Total
Concept 1
Stage Hybrid HOV Lane Construction Cost $156 mil*
$259 mil HOV to Express Lane Conversion Cost $103 mil
Concept 2 **
Mixed-Flow Lane to Express Lane Conversion Cost $108 mil
$346 mil
Additional Transit O & M Cost (20-Year) $238 mil
* Based on Staged HOV Lane Analysis Memorandum, June 15, 2012. ** Capital costs associated with providing additional bus services not included.
19

Further Considerations
A. Update Existing Conditions B. Update Traffic Forecasts C. Expand Operations Analysis to include Alternate Routes D. Provide Capital Cost Estimates for Additional Transit Service E. Logistics for Support Services for Transit (PNR, Shuttles, etc.) F. Transit Trips Origin/Destination Analysis G. Private Shuttles H. Express Lanes O&M and Revenue Analysis
20
General Conclusions
21
Concept 1 performs better than both Hybrid HOV and Concept 2
Concept 2 performs worse than Concept 1 due to loss of freeway capacity
Concept 2 requires additional transit capital and operating costs
Further mode shift analysis is required for Concept 2 Further operational analysis is required for Concepts 1
and 2 Next steps for study to be determined

Cost Estimates – Assumptions Continuous Access to/from Express Lane Costs include:
Staged Hybrid HOV Lane Construction (Concept 1)
Roadway Signage and Traffic Delineation
Toll System Infrastructure
Additional Soft Costs for Preliminary Engineering, Design, and Construction Administration
20-year Additional Transit O&M Costs (Concept 2)
Costs exclude: Backhaul Network
Tolling System O&M
Transit Capital
22