005192-AusAID PRMF - ARRB Technical Review Final...
115
CONTRACT REPORT Final Report - Technical review & whole of life cycle cost analysis of the Philippines Provincial Road Management Facility Project No: 005192 by Tyrone Toole & Ron Roper for AusAID
Transcript of 005192-AusAID PRMF - ARRB Technical Review Final...

CONTRACT REPORT
Final Report - Technical review & whole of life cycle cost analysis of the Philippines Provincial Road Management Facility Project No: 005192 by Tyrone Toole & Ron Roper
for AusAID

July 2012
Final Report - Technical review & whole of life cycle cost analysis of the Philippines Provincial Road Management Facility
ARRB Group Ltd
ABN 68 004 620 651
Victoria
500 Burwood Highway
Vermont South VIC 3133
Australia
P: +61 3 9881 1555
F: +61 3 9887 8104
Western Australia
191 Carr Place
Leederville WA 6007
Australia
P: +61 8 9227 3000
F: +61 8 9227 3030
New South Wales
2-14 Mountain St
Ultimo NSW 2007
Australia
P: +61 2 9282 4444
F: +61 2 9280 4430
Queensland
123 Sandgate Road
Albion QLD 4010
Australia
P: +61 7 3260 3500
F: +61 7 3862 4699
South Australia
Level 5, City Central,
Suite 507, 147 Pirie Street
Adelaide SA 5000
Australia
P: +61 8 7200 2659
F: +61 8 8223 7406
Luxmoore Parking Consulting
Ground Floor
12 Wellington Parade
East Melbourne, VIC 3002
P: +61 3 9417 5277
F: +61 3 9416 2602
International offices:
Dubai, United Arab Emirates
Xiamen, People’s Republic of China
for AusAID
Reviewed
Project Leader
Adam Ritzinger
Quality Manager
Tim Martin
005192-2 July 2012

- i - July 2012
Although the Report is believed to be
correct at the time of publication,
ARRB Group Ltd, to the extent lawful,
excludes all liability for loss (whether
arising under contract, tort, statute or
otherwise) arising from the contents of
the Report or from its use. Where
such liability cannot be excluded, it is
reduced to the full extent lawful.
Without limiting the foregoing, people
should apply their own skill and
judgement when using the information
contained in the Report.
SUMMARY
This final report documents the findings of the technical review component of the Independent Progress Review of the AusAID-funded Provincial Road Management Facility (PRMF).
The report has been informed by visits to the Philippines by members of the study team, including meetings with Department of Interior and Local Government (DILG), Ausaid and the Facility Management Contractor (FMC) in Manilla, field visits and discussions in the provinces of Agusan De Sur, Bohol, Bukidnon, Misamis Occidental and Misamis Oriental. It was also informed by a review of documentation on the PRMF, a whole of life cycle cost (WOLCC) analysis and a wider technical review.
Main findings
The main conclusions from the study are as follows:
� Objective A – WOLCC analysis of gravel versus other surface types: On the basis of the available evidence, the break even traffic for upgrading to concrete lies between a nominal average annual daily traffic (AADT) of 250 and 750 (including motorcycles), or a mean nominal AADT of 500, equivalent to an adjusted AADT of 225 (as defined in the report). This is reasonably consistent with international studies and local guidelines from DILG and the Department of Public Works and Housing (DPWH).
Traffic should be based on post improvement estimates, with evidence of a 200% increase in traffic on many projects.
A framework for selecting surfacing options has been defined, and selection should be tailored to specific locations and maintenance capacity. It should also take into account the risks associated with very high rainfall, and the potential for very heavily loaded vehicles.
� Objective B – Is PRMF’s premise sound? The findings support the appropriate use of gravel and concrete. The optimum solution differs mainly in response to the availability of future maintenance treatments, traffic and material properties, and for different terrain/climate combinations.
� Objective C – Can the core roads be maintained beyond PRMF? There is a significant risk that the core networks of provincial gravel roads cannot be maintained by at least a number of the provinces beyond the lifetime of PRMF for a variety of reasons. This includes the absence of categorical stakeholder support and low levels of funding, with the annual funding in some cases being almost 20% of the need for routine and periodic maintenance without considering the increasing traffic demand or any backlog.

- ii - July 2012
There is however a number of provinces where overall commitment and funding levels are sufficient, despite technical challenges, and this led to the following classification:
Least at risk Intermediate Most at risk
,Bukidnon Agusan Del Sur, Bohol,
Guimaras
Misamis Occidental, Surigao,
Misamis Oriental
Whilst recognising the progress achieved and the commitment in a number of provinces, a significant challenge exists and a proactive approach to addressing this is recommended including the assignment of appropriate access levels across the whole network. This would help minimise life cycle costs and could maximise the access to basic services for communities.
� Objective D - Benchmarking costs. The average rehabilitation and maintenance costs were considered reasonable for the treatments they delivered. However, the appropriateness of the costs incurred needs to be challenged to ensure resources are best used; variations in costs between projects were significant. Annual (maintenance) cost rates were also approximately half those in neighbouring countries, with this in part reflecting the mix of road surface types prevalent in the Philippines. However, their adequacy is questionable particularly if a substantial increase in Maintenance by Contract occurs. There is a need for an average cost rate closer to the international norm based on the gravel road options investigated in the life cycle analysis.
Recommendations
The report contains specific recommendations to support the findings above with an emphasis on:
� Improved planning to better address surfacing selection, with particular emphasis on trip generation as a result of the improved roads as this is a key contributor to future traffic levels.
� Improved data collection to better inform needs and therefore costs, and determining current and future use. This should include appropriate field techniques to identify (critical) locations requiring different levels of treatment, with particular attention given to the selection of surfacing options, drainage and essential earthworks, greater use of mechanised and instrument based surveys to supplement and verify visual survey data, and sufficiently reliable traffic surveys.
� Maximising program benefits and impact by leveraging Provincial Government resources, and through appropriate access standards.
� Addressing funding constraints by marketing the benefits of roads, and applying different funding models.
� Performance monitoring of the PRMF projects and other roads to provide a sounder basis to the setting of standards in the future, and demonstrations of alternative low cost surfacing techniques.
� Further technical analysis to strengthen the conclusions drawn from this study to aid their application, including a more comprehensive post evaluation which should include determining overall benefits of improved access, rather than incremental differences between the technical options which were assessed by this study. The post evaluation should also account for possible wider impacts, and take account of Green House Gas emissions and other environmental impacts in treatment selection.
� Dissemination and training in best practice in rural transport planning, design and management.

- iii - July 2012
CONTENTS
1 INTRODUCTION ................................................................................................................... 1
1.1 Background ........................................................................................................................... 1
1.2 Activity Purpose and Objectives ............................................................................................. 1
1.3 Objectives .............................................................................................................................. 1
1.4 Structure and contents of this report ...................................................................................... 2
2 APPROACH .......................................................................................................................... 3
2.1 Objective A – WOLCC analysis of gravel versus other surface types ..................................... 3
2.2 Objective B – Is PRMF’s premise sound? .............................................................................. 3
2.3 Objective C – Beyond PRMF ................................................................................................. 4
2.4 Objective D – Construction and maintenance costs ............................................................... 4
3 OUTCOMES FROM THE VISIT PROGRAM ......................................................................... 5
3.1 Data availability ...................................................................................................................... 5
3.2 Observations from field visits and associated meetings ......................................................... 5
Feedback ................................................................................................................. 5 3.2.1 Technical issues ....................................................................................................... 6 3.2.2
4 WHOLE OF LIFE CYCLE COST ANALYSIS METHOD ........................................................ 7
4.1 Basic principles ...................................................................................................................... 7
4.2 Modelling ............................................................................................................................... 7
Procedure ................................................................................................................ 7 4.2.1 Optimisation ............................................................................................................. 8 4.2.2
4.3 Representative road sections ............................................................................................... 10
Overview ................................................................................................................ 10 4.3.1 Traffic volume ........................................................................................................ 11 4.3.2 Vehicle fleet ........................................................................................................... 12 4.3.3 Terrain ................................................................................................................... 12 4.3.4 Road condition ....................................................................................................... 12 4.3.5 Climate ................................................................................................................... 13 4.3.6 Existing surfacing materials and deterioration rate ................................................. 13 4.3.7
4.4 Road treatments .................................................................................................................. 14 Overview ................................................................................................................ 14 4.4.1 Road treatment classification ................................................................................. 15 4.4.2 Unit costs of treatments .......................................................................................... 16 4.4.3
5 RESULTS OF THE WHOLE OF LIFE CYCLE COST ANALYSIS AND RELATED INVESTIGATIONS .................................................................................... 21

- iv - July 2012
5.1 Road performance ............................................................................................................... 21
5.2 Estimated treatment frequency ............................................................................................ 26
5.3 Selection of optimal options ................................................................................................. 27
5.4 Proposed solutions and applications framework .................................................................. 32
5.5 Implications of the proposed framework ............................................................................... 33
6 ROAD NETWORK CONDITIONS AND FUNDING .............................................................. 35
6.1 General ................................................................................................................................ 35
6.2 Road condition ..................................................................................................................... 35
6.3 Basis for estimating funding demand and supply ................................................................. 35 Asset value and measures of need ........................................................................ 36 6.3.1 Measures of demand versus supply ....................................................................... 38 6.3.2
6.4 Discussion ........................................................................................................................... 40
7 SUMMARY OF FINDINGS .................................................................................................. 42
Objective A – WOLCC analysis of gravel versus other surface types ..................... 42 7.1.1 Objective B – Is PRMF’s premise sound? .............................................................. 43 7.1.2 Beyond PRMF ........................................................................................................ 44 7.1.3 Benchmarking costs ............................................................................................... 46 7.1.4
7.2 Broader policy oriented advice ............................................................................................. 47
8 CONCLUSIONS AND RECOMMENDATIONS .................................................................... 48
8.1 Conclusions ......................................................................................................................... 48
8.2 Recommendations ............................................................................................................... 49 Performance monitoring and demonstrations ......................................................... 49 8.2.1 Data collection........................................................................................................ 49 8.2.2 Further technical analysis ....................................................................................... 50 8.2.3 Best practice in rural transport planning ................................................................. 50 8.2.4
REFERENCES ............................................................................................................................. 52 APPENDIX A SITE INSPECTION NOTES - BOHOL PROVINCE .................................. 53
APPENDIX B SITE INSPECTION NOTES - MISAMIS ORIENTAL PROVINCE ............. 76 APPENDIX C SITE INSPECTION NOTES - BUKIDNON PROVINCE ............................ 86 APPENDIX D SITE INSPECTION NOTES – MISAMIS OCCIDENTAL PROVINCE ....... 98
APPENDIX E SITE INSPECTION NOTES – ARGUSAN DEL SUR PROVINCE .......... 101

- v - July 2012
TABLES
Table 4-1: Road characteristics and categories used in defining design standards ...................... 10 Table 4-2: Traffic volume ........................................................................................................ 12
Table 4-3: Geometry characteristics by terrain type ................................................................ 12 Table 4-4: Road condition ....................................................................................................... 13 Table 4-5: Climate ................................................................................................................... 13
Table 4-6: Properties of existing surface materials .................................................................. 14 Table 4-7: Concrete pavement properties ............................................................................... 15
Table 4-8: List of treatments .................................................................................................... 16 Table 4-9: Unit costs of alternative treatments ........................................................................ 16 Table 4-10: Distribution of year 1 project costs by division ........................................................... 17
Table 5-1: Initial lives of gravel surfacings (years) for moderate rainfall ................................... 26 Table 5-2: Selected optimum economic treatment option (*) for each representative
section for low rainfall and initial poor condition ...................................................... 28 Table 5-3: Selected optimum economic treatment option for each representative
section for moderate rainfall and initial poor condition ............................................ 28 Table 5-4: Selected optimum economic treatment option for each representative
section for high rainfall and initial poor condition .................................................... 29
Table 6-1: Length of road by surface type and condition ......................................................... 35 Table 6-2: Estimate of funding demand and network value ..................................................... 37
Table 6-3: Estimate of annual average gravel road maintenance costs for different maintenance treatments for low traffic volumes in rolling terrain and for moderate rainfall .................................................................................................... 37
Table 6-4: Funding demand versus supply .............................................................................. 38 Table 7-1: Assessment of major risks to gravel and road maintenance sustainability .............. 46
FIGURES
Figure 4-1: The modelling procedure ............................................................................................. 8
Figure 4-2: Optimisation of TTC: the underspend case .............................................................. 9 Figure 4-3: Optimisation of TTC: the overspend case ............................................................... 10
Figure 4-4: Composition of the representative road network ........................................................ 11 Figure 4-5: Types of road treatment ............................................................................................. 14 Figure 4-6: Distribution of total costs for Year 1 projects .......................................................... 17
Figure 4-7: Relationship between total project costs and the average annual rainfall ................... 18 Figure 4-8: Relationship between total project costs and % length of mountainous
terrain ..................................................................................................................... 19 Figure 4-9: Effect of terrain and rainfall on project costs............................................................... 19 Figure 4-10: Relationship between drainage infrastructure costs and % length of
mountainous terrain ............................................................................................... 20 Figure 4-11: Effect of terrain and rainfall on drainage infrastructure costs .................................. 20
Figure 5-1: Roughness trends for rolling terrain and moderate rainfall ......................................... 22 Figure 5-2: Roughness trends for mountainous terrain and moderate rainfall .............................. 23 Figure 5-3: Roughness trends for rolling terrain and high rainfall ................................................. 24
Figure 5-4: Roughness trends for mountainous terrain and high rainfall ....................................... 25 Figure 5-5: Roughness trends for the asphalt mix option 09 and other options for
medium traffic ........................................................................................................ 26 Figure 5-6: Gravel loss trends for alternative gravel loss models ................................................. 27 Figure 5-7: Total transport costs for medium traffic and moderate rainfall .................................... 30
Figure 5-8: Total transport costs for low traffic and moderate rainfall ........................................... 30 Figure 5-9: Comparison of a selection of options at different traffic levels .................................... 31
Figure 5-10: Desirable solutions considering TTC and regravelling frequency ............................. 32

- vi - July 2012
Figure 5-11: Per cent length of PRMF Year 1 gravel roads by province meeting proposed selection criteria considering pre and post PRMF traffic data ................. 34
Figure 5-12: Per cent change in AADT from 2008 – 2011 for year 1 PRMF ................................. 34
Figure 6-1: Relationship between average network condition and annual maintenance costs to deliver a desirable level of service ....................................... 38

- vii - July 2012
List of Acronyms AADT Average annual daily traffic ADB Asian Development Bank ARRB ARRB Group Ltd (formerly Australian Road Research Board) ARV Asset replacement value AusAID Australian Agency for International Development DFID Department for International Development, United Kingdom DILG Department of Interior and Local Government of the Republic of the
Philippines DPWH Department for Public Works and Housing of the Republic of the
Philippines FMC Facility Management Contractors for the PRMF GDP Gross Domestic Product HDM-4 Highway design and maintenance standards model, version 4, a road
investment analysis tool and knowledge base owned by the World Road Association and developed from earlier tools owned by the World Bank and DFID.
IPR Independent Progress Review of the PRMF, and to which this study contributes
MBA Maintenance by administration, involving direct government-owned units MBC Maintenance by contract, involving private sector companies PCU Passenger car unit, a parameter which represents the PEO Provincial Engineers Office, responsible for road management affairs PRMF Provincial Road Management Facility, an AusAID supported program RAC Road Agency Costs, being the total economic costs of road provision and
maintenance RUC Road User Costs, being the total economic costs incurred by road users
including costs of vehicle maintenance and operation, travel time, etc SEACAP South East Asia Community Access Programme, a technology
development program funded by the UK’s DFID in Cambodia, Laos and Vietnam
TA Technical Assessment component of the IPR (this study) TRL TRL Ltd (formerly the Transport Research Laboratory) of the UK TTC Total Transport Costs, being the sum of RAC and RUC WOLCC Whole of life cycle cost analysis, an analytical technique closely associated
with cost benefit analysis which generates economic costs, such as RAC and RUC through the application of technical models and associated assumptions embodied in the HDM-4 decision support tool.

Final Report - Technical review & whole of life cycle cost analysis of the Philippines
Provincial Road Management Facility 005192-2
- 1 - July 2012
1 INTRODUCTION
1.1 Background
The Provincial Road Management Facility (PRMF) is a $100 million, five-year bilateral grant facility which started implementation in September 2009. It seeks to promote economic growth and improved public access to infrastructure services in the southern Philippines. The Facility contributes to this goal by:
a) rehabilitating and maintaining a core road network in selected provinces, and
b) through strengthening provincial government systems.
To achieve these complementary development objectives PRMF is focused on two components:
� Component 1: Capacity Building for Road Sector Planning and Management has the intended outcome that partner provinces have the institutional capacity and systems to develop and implement road sector plans
� Component 2: Road Network Rehabilitation and Maintenance has the intended outcome that provincial roads are rehabilitated to a maintainable condition and are sustainably maintained on an annual basis.
Two key features of PRMF are:
i) an incentive program based on progress of provincial governments in meeting mutually agreed reform targets
ii) the emphasis on strengthening and using Philippine government systems to deliver PRMF activities as much as possible.
1.2 Activity Purpose and Objectives
This technical review is part of the Independent Progress Review (IPR) process. It comprised a technical assessment (TA) of PRMF design assumptions regarding provincial governments’ investment choices in road rehabilitation and maintenance, and a whole of life cycle cost analysis in order to identify lessons and implications for AusAID’s future sub-national programming and strategy development in the Philippines.
1.3 Objectives
The objectives of the technical assessment were:
(a) To undertake a whole of life cost analysis for gravel versus other road surface types in all 10 PRMF provinces.
(b) Considering whole life cycle costs including initial capital cost and routine annual and periodic maintenance costs, review whether:
♦ PRMF’s basic premise substantiated that for Philippines’ provincial roads located in rural settings and carrying low traffic volumes, the most suitable and cost effective form of road paving is unsealed gravel construction, considering whole life cycle costs including initial capital cost and routine annual and periodic maintenance costs?

Final Report - Technical review & whole of life cycle cost analysis of the Philippines
Provincial Road Management Facility 005192-2
- 2 - July 2012
♦ If the perception remains that concrete roads are better than gravel roads what are the influencing factors and is it based on verifiable and substantiated evidence?
(c) To assess the likelihood that the core networks of provincial gravel roads can be maintained by the province beyond the lifetime of PRMF.
♦ Are rehabilitation and periodic maintenance activities to a PRMF appropriate standard likely to be sustained after the program ends?
♦ Is the program’s approach to rehabilitation and maintenance of provincial gravel roads helping to change perceptions regarding road maintenance and rehabilitation?
(d) Analyse construction and maintenance costs and benchmark these costs with other countries in the region.
1.4 Structure and contents of this report
This report represents the final report under this technical assessment, and is structured as follows:
Section 1, Introduction, which sets out the background to and objectives of the PRMF and the specific objectives of this technical assessment.
Section 2, Approach, which describes our approach to the task, including each sub-task in section 1.3 above.
Section 3, Outcomes from the visit program, which comments on data availability, documents feedback received from officials and communities, and summarises some of the main observations on technical issues from the field visits and associated meetings.
Section 4, Whole of life cycle cost analysis method, describes the principles of the approach, and the modelling procedures, selection of optimum solutions, and the characteristics of the representative road sections used in the analysis, and details of the road treatments investigated.
Section 5, Results of the whole of life cycle cost analysis and related investigations, illustrates the performance of a sample of sections, estimated treatment frequency, and describes the selection of optimal options and associated economic indicators, and the implications of the proposed solutions.
Section 6, Road network conditions and funding, which reports data on the condition of the provincial road networks, funding levels from a selected number of provinces, both before and after PRMF commenced, and an estimate of funding requirements. It has informed a discussion on appropriate standards.
Section 7, Summary of findings and recommendations, summarises the main findings on the key questions addressed to the IPR TA and in a number of related areas which impact the sustainability of gravel roads and the delivery of service levels to the community and road users.
Section 8, Conclusions and recommendations.
The report is also accompanied by a number of appendices. These include notes and a photographic record of the site visits (Appendices A, B, C, D and E).

Final Report - Technical review & whole of life cycle cost analysis of the Philippines
Provincial Road Management Facility 005192-2
- 3 - July 2012
2 APPROACH
2.1 Objective A – WOLCC analysis of gravel versus other surface types
Objective A was met by:
i) Assembling all necessary data to allow an HDM-4 (standard international road investment tool) analysis to be performed on a sample of representative gravel, concrete and other surface types which cover the range of topographical, climate, engineering materials, design standards, traffic (composition, characteristics and numbers) and maintenance resource conditions in the study regions. This was informed by data supplied by AusAID, DILG, the Provincial Engineers Office (PEO) and FMC in response to a data specification prepared by ARRB.
ii) Collating summary performance data on the road network, including typical surface and pavement lives, maintenance and construction history and current condition data, for each surface type.
iii) Evaluating a single alternative option to gravel or concrete, namely asphalt on a granular base (AMGB), this being considered as a possible viable alternative and for which experience exists in the Philippines. Other alternatives are also possible and these are discussed later in the report.
iv) Obtaining construction and maintenance cost data through AusAID and the FMC, and typical vehicle operating cost unit rates based on previous HDM-4 studies.
v) Collecting information on regional road performance studies from other sources, e.g. UK-DFID’s South East Asia Community Access Program (SEACAP), to inform the analysis and the review of results.
vi) Other considerations:
(a) Use was made of the HDM-4 Strategy analysis module, since this provided flexibility to do a network analysis later if required, whereas sensitivity analysis could be done through multiple analysis runs.
(b) The concrete option was implemented as an immediate improvement to ensure a common condition at the start of the analysis.
(c) A range of gravel road maintenance options were employed.
(d) Representative sections typical of the entire network based on pavement type, traffic, topography and climate were defined and examined as required.
(e) The economic analysis utilised the minimisation of total transport costs (TTC), as the objective function with an analysis period of 20 years and a discount rate of 12%.
2.2 Objective B – Is PRMF’s premise sound?
The starting point was informed by an initial then final technical analysis (Objective A), but required further input to determine the possible impact of the following, amongst other factors:

Final Report - Technical review & whole of life cycle cost analysis of the Philippines
Provincial Road Management Facility 005192-2
- 4 - July 2012
i) Noting that gravel roads are maintenance dependent, and having established optimum frequencies and activities in the WOLCC, what guarantee is there that such resources will be committed to this in future? This required data to be collected and opinions sought on maintenance activities and frequency and any evidence of loss of access or restricted access associated with unsealed roads. Information was sought from both project and non-project roads so that a ‘most likely’ scenario could be considered when assessing the results of the analysis.
ii) Is a compromise needed? Flexibility is always important as different traffic, materials and environments and the range of road operating conditions require different solutions. A stage construction approach could also be valid, rather than ‘one size fits all’. Has this been considered in the PRMF, and do the provincial agencies employ such an approach?
iii) The review was also informed by:
a. extensive documentation related to preliminary assessments conducted prior to the implementation of the PRMF and network development and maintenance plans developed since
b. detailed information on project roads
c. summary data on provincial road networks
d. budget data.
2.3 Objective C – Beyond PRMF
i) Opinions of provincial agencies and communities were sought to assess the extent of ‘buy-in’. This was undertaken both before and after the WOLCC analysis findings were available, with the before information providing a useful input to the initial analysis prior to the second visit. Reasons for favouring different road surface types were sought from provincial agency and community representatives.
ii) The ‘buy-in’ to maintenance was investigated from an analysis of current and historical budgets, and through discussions in the provinces.
2.4 Objective D – Construction and maintenance costs
i) These are an essential part of any analysis, and data was sought through the PEO, AusAID and the FMC, including both PRMF and direct Government supported projects. Factors such as regional cost differences were only considered for PRMF projects as this data was more readily available.
ii) The available data, including computed average (maintenance) cost rates was compared with recent data from neighbouring countries, including Indonesia and Malaysia, and regional cost norms.

Final Report - Technical review & whole of life cycle cost analysis of the Philippines
Provincial Road Management Facility 005192-2
- 5 - July 2012
3 OUTCOMES FROM THE VISIT PROGRAM
3.1 Data availability
A significant amount of data was available which informed the analysis. This was supplemented by field observations, the results of briefings and discussions during field visits, and technical assumptions and judgements made by the team.
Amongst the most significant inputs from the written materials, and the initial briefings were:
� Pre and post PRMF classified traffic counts were available and indicated significant increases in traffic observed and a very high proportion of motorcycle use (of the order of 80%)
� Visual condition data existed, and no machine based survey data were available
� Technical papers and policies established on paving of steep gradients
� GIS data available for most provinces
� Cost data available, noting significant differences in the project costs reported between locations
� Pre-PRMF assessments available for each province
� Availability of current provincial road network development plans and maintenance strategies, and budget data.
3.2 Observations from field visits and associated meetings
Field visits and discussions were held in the provinces of Agusan Del Sur, Bohol, Bukidnon, Misamis Occidental and Misamis Oriental, and a full review made of documentation on the PRMF.
These provided the opportunity to assess conditions first hand and receive opinions from provincial officials and communities. Much of the discussions focused on comments on the suitability of the different surface types. Feedback and observations are noted below.
Feedback 3.2.1
As a general point, support for the PRMF was voiced at all levels, by the respective Governors, provincial engineers and communities. Specific comments received are summarised below related to some of the key questions the study is aiming to address.
� How do provinces see the gravel versus concrete issue?
— General feeling among engineering and administrative levels is a preference for concrete, although at least three provinces visited believe they can sustain gravel in the longer term, two of which would also like to trial alternatives, such as asphalt surfaced pavements.
— The communities are less focussed on concrete as they are already seeing vast access improvements with the new gravel roads. Specific benefits include:
♦ increased school attendances
♦ reduced childbirth-related mortality
♦ greater access to markets and for income earning activities

Final Report - Technical review & whole of life cycle cost analysis of the Philippines
Provincial Road Management Facility 005192-2
- 6 - July 2012
♦ more frequent public transport.
� Are they all in favour of concrete?
— The feelings varied at the engineering/administration level as noted above but communities were supportive of the improved gravel roads.
• How strong is the feeling?
— Instances of poor performance of upgraded gravel on steep grades and in wet weather reinforce the preference for concrete, as would be expected, but examples of reasonably well performing gravel roads were also evident.
Technical issues 3.2.2
These are summarised below, and described further and illustrated in Appendices A to E.
� Very significant motorcycle volumes
� Level of gradient that currently triggers paving (> 10%) is still associated with considerable scour damage, and may need to be relaxed to 6 or 7% in specific locations.
� The crown height of the upgraded roads, in most cases, is too flat although it is compliant with the specification of 2.5% to 3%. This is too low and should be of the order of 4 to 6%.
� Whilst little interest was shown in other surface types, such as asphalt or spray sealing, asphalt plants do exist in some of the provinces, and are used on national road work. These resources could potentially be shared with the provinces if capacity exists. Where asphalt was used, performance seemed adequate.
� A standout issue was the lack of a system on a large number of projects to maintain the newly gravelled roads during the 12 month defect liability period. This needs addressing through the AusAID contracts. Evidence suggests that in many cases almost the entire 150 mm gravel surface has been lost during the defect liability period. Bukidnon realised this problem and obtained approval from PRMF to undertake repairs to the surface during the first year. A good pro-active response.
� As noted above, the communities are currently seeing significant benefits, and this provides a powerful incentive for more gravel surfacing. However, this is when the gravel roads are at their best, and so the communities are unaware of the effect of insufficient maintenance. As later identified in the WOLCC analysis, gravel could serve the task under certain circumstances, and provide a longer length of improved access to support the communities. However, it needs to be shown to work, or be supplemented with paving of critical sections and where higher traffic levels exist. Monitoring of condition and opinions would be advisable to validate any recommendations and establish sustainable practices.

Final Report - Technical review & whole of life cycle cost analysis of the Philippines
Provincial Road Management Facility 005192-2
- 7 - July 2012
4 WHOLE OF LIFE CYCLE COST ANALYSIS METHOD
4.1 Basic principles
The basic principles behind whole of life cycle costs (WOLCC) analysis as applied to a road network, and its components sections, is that the task of constructing and operating it should be undertaken in the most efficient manner possible.
Efficiency in this context means that every road section should ideally be constructed and operated in such a way that net social benefit is maximised. An efficient road is built to a standard that is neither too high nor too low. A road built to too high a standard uses up resources that would generate bigger benefits elsewhere, and one built to too low a standard could make better use of resources that are being spent elsewhere. Either way a potential benefit is being forgone.
The road design and maintenance standards for the PRMF should embody this principle: they should be such that the level of expenditure is optimal - neither too high nor too low.
There is no single optimal design standard, however. The optimal design depends on the type of road, design parameters, the traffic it carries, its location (affected by terrain/geometry and climate) and how it is to be maintained. All other things being equal, a high-volume road merits a higher level of service provision than a low-volume one.
It was the purpose of the technical assessment to identify the optimal surfacing standards for representative PRMF roads through undertaking a whole of life cost analysis (Objective A), and therefore the above considerations are very relevant. In so doing, it considered the initial capital cost and routine annual and periodic maintenance costs.
This component of the overall task:
(a) describes the modelling procedure and basis for interpretation
(b) sets out a method for defining representative road sections
(c) specifies the design parameters for each surfacing standard
(d) specifies the routine maintenance, periodic maintenance and rehabilitation treatments applied to each surfacing standard
(e) reports the unit costs used for each treatment
(f) reports relationships between a number of planning parameters.
Alternative treatments were applied to each representative section with the treatments triggered based on a schedule (initial treatment timing, annually or at intervals of several years) or at different intervention levels1. The optimum is selected based on minimising total transport costs.
4.2 Modelling
Procedure 4.2.1
Figure 4-1 sets out the logic of the modelling procedure.
1 Intervention level is a set of conditions, including such measures as surface distress, loss of material, roughness,
pavement strength, pavement or surface age, when a treatment is triggered. In this study a wide range of alternative treatments were applied at different condition states and for different traffic levels to determine the optimum treatment for a given set of conditions.

Final Report - Technical review & whole of life cycle cost analysis of the Philippines
Provincial Road Management Facility 005192-2
- 8 - July 2012
Central to the procedure is a model for predicting the costs of a specified road treatment2 on a specified road section for a specified vehicle fleet. The HDM-4 (version 2) modelling package was used for this purpose (Kerali and Odoki, 2006). It was by means of this computational tool that cost estimates were generated, and it is these cost estimates that furnished the raw data to feed into the optimisation process.
Figure 4-1: The modelling procedure
The costing model required data describing
� the vehicle fleet (composition, loading, vehicle performance etc)
� roads (traffic, condition, terrain, climate etc)
� treatments (new construction or upgrading, periodic maintenance/rehabilitation, and routine maintenance).
From these inputs the model computed the costs borne by both the road agency and by road users.
Optimisation 4.2.2
The costing model computed the cost of implementing stipulated treatments on roads with user-determined characteristics carrying traffic. Two types of optimisation were considered:
� the trade-off between road agency cost (RAC) and road user cost (RUC)
� the trade-off between the capital component of RAC and the recurrent component.
Similar principles govern both. Figure 4-2 and Figure 4-3 illustrate the optimisation procedure as applied to the trade-off between RAC and RUC. It applies analogously to the trade-off between the capital and recurrent components of RAC. However, because there is a mixture of capital and maintenance funding, the procedures recommended in the Australian Transport Council’s
2 In this report, ‘treatment’ refers to the construction of new roads, improvements to existing roads, and maintenance.

Final Report - Technical review & whole of life cycle cost analysis of the Philippines
Provincial Road Management Facility 005192-2
- 9 - July 2012
Guidelines for the Appraisal of Maintenance Initiatives (ATC 2010) have been employed. These aim to compute the total transport costs savings of alternatives, irrespective of the source of funds, and are therefore consistent with the proposed approach. They are also founded on estimating the marginal benefit of initiatives, this recognising the fact that resources will be spent in both the ‘with project’ and ‘without project’ cases. Where appropriate a marginal or incremental benefit cost ratio (MBCR) can be computed. This provides a good rule of thumb for ranking purposes (between sections) where a budget constraint exists.
However, in this study an unconstrained analysis has been performed for the purpose of identifying ideal standards, including the break-even conditions of traffic, terrain etc. which justify changing from one standard to another. Constrained analysis, with prioritisation of road sections, will however be an important tool when considering how to maximise benefits across the whole of PRMF, and the Government funded program, but this is outside the scope of the analysis. The same objective should be applied, namely to minimise total transport costs within the whole program or network.
In the example given, alternative treatments are reflected in the ‘level of service’ they offer (where average roughness or ride quality can be considered a proxy for level of service). The greater the level of service (or the lower the roughness or surface damage/distress), the higher the road agency cost (RAC) and the lower the road user cost (RUC). Thus a low-roughness/lightly damaged road costs the road agency more to build and maintain over its life, but imposes lower costs on users as vehicle operating costs and travel time are reduced.
There is a trade-off between the two types of cost. The optimal treatment (or combination of treatments) is the one that minimises the sum of both RAC and RUC (shown as ‘Optimal’ on Figure 4-2 and Figure 4-3), i.e. the most technically efficient solution was sought for each representative section. Any departure from the optimum, either by under spending (that is, providing too low a level of service - Figure 4-2), or overspending (that is, providing too high a level of service - Figure 4-3), increases total transport cost (TTC), being the sum of RAC and RUC.
Figure 4-2: Optimisation of TTC: the underspend case

Final Report - Technical review & whole of life cycle cost analysis of the Philippines
Provincial Road Management Facility 005192-2
- 10 - July 2012
Figure 4-3: Optimisation of TTC: the overspend case
4.3 Representative road sections
Overview 4.3.1
Total transport cost is affected by numerous road characteristics, and to take all of them into account when defining design and intervention standards would result in unmanageable complexity. Instead five characteristics were identified that between them are believed to capture enough of the variation in road environment for this analysis (see Table 4-1) to define a road treatment that is optimal or close to it.
Table 4-1: Road characteristics and categories used in defining design standards
Characteristic Categories
1 2 3 4 5
Traffic volume Very low Low Medium High Very high
Current condition Bad Poor Fair Good ...
Terrain Mountainous Hilly Rolling ... ...
Climate (rainfall) High Moderate Low
Initial surface material Coarse (301) Medium (201) ... ... ...
Each relevant road characteristic is expressed in category terms, there being up to five categories per characteristic. This gives a total of 360 representative sections for this final analysis.
This is illustrated in Figure 4-4 for 60 representative sections for each initial surface material and three climates.

Final Report - Technical review & whole of life cycle cost analysis of the Philippines
Provincial Road Management Facility 005192-2
- 11 - July 2012
The surface materials represented included a stony material with few fines to bind the surface (represented by DPWH specification 201), and a less coarse material with moderate fines and plasticity (represented by DPWH specification 300).
Figure 4-4: Composition of the representative road network
Traffic volume 4.3.2
Five levels of traffic volume were defined. They are expressed as initial AADT (Table 4-2), with:
• a nominal AADT based on the total (five-vehicle) fleet and a representative composition
• an adjusted AADT where the motorcycle (MC) component is reduced to 5% of its nominal value, and the remainder replaced by passenger cars based on a Passenger Car Unit (PCU) value of 0.33.
The nominal and adjusted AADT value were initially represented in two separate cases studies, with the adjusted values being considered more realistic.
The traffic categories span the range of traffic volumes on nearly all PRMF provincial roads. Other traffic characteristics are discussed under Vehicle fleet.
3 This was decided as a means of better replicating the modelling of unsealed roads where initial trials which employed
the full number of motorcycles over-predicted road deterioration. This is because the models respond to total vehicle numbers, and therefore axle passes, yet they were not derived with the level of MC composition prevalent in the provincial network.

Final Report - Technical review & whole of life cycle cost analysis of the Philippines
Provincial Road Management Facility 005192-2
- 12 - July 2012
Table 4-2: Traffic volume
Traffic volume Initial Nominal AADT Initial Adjusted AADT
Very low 100 45
Low 250 112.5
Medium 500 225
High 2500 1125
Very high 7500 3375
Vehicle fleet 4.3.3
The characteristics of the vehicle fleet required the definition of:
• fleet composition and loading. Five vehicle types were defined used in the analysis.
• vehicle damage factors (the number of Equivalent Standard (8.2 tonne) Axles per vehicle, to be applied in design and planning models). Typical vehicle damage factors have been obtained from regional studies in Indonesia (Toole and Rockliffe 2011) and were considered typical of conditions in the Philippines.
• vehicle-related costs and associated data (average life, annual distance travelled, consumable parts, labour and crew, depreciation, performance etc.). These were also based on the results of regional studies, e.g. Toole and Rockliffe 2011.
• traffic growth. In developing and emerging regions, traffic is expected to grow roughly in line with growth in Gross Domestic Product (GDP). However, this is currently approximately 7.6%, whereas growth rates immediately post the Global Financial Crisis (GFC) were considerably lower. In the absence of any firm data, traffic has been assumed to grow at 5% p.a. for the first 20 years, the selected analysis period.
Terrain 4.3.4
The characteristics of the three terrain types employed are shown in Table 4-3 .
Table 4-3: Geometry characteristics by terrain type
Terrain
Rise and fall (m/km)
Number of rises and falls (per km)
Super elevation or crossfall
(%)
Curvature (degrees/km)
Maximum travel speed (km/h)
RF NUM_RFS SUPERELEV CURVATURE SPEED_LIM
Rolling 25 2 3 75 50
Hilly 100 3 5 200 50
Mountainous 175 4 7 500 50
Road condition 4.3.5
Four levels of the condition of the existing unsealed road were defined. They are expressed in terms of both roughness (ride quality) and gravel thickness (Table 4-4). An age of the surface (last regravelling) was also provided.

Final Report - Technical review & whole of life cycle cost analysis of the Philippines
Provincial Road Management Facility 005192-2
- 13 - July 2012
Table 4-4: Road condition
Condition Roughness
(IRI) Gravel
thickness (mm)
Last Regravel
Good 6 100 2008
Fair 9 75 2006
Poor 12 50 2004
Bad 16 25 2002
Climate 4.3.6
Three climates were defined and used in the analysis (Table 4-5).
Table 4-5: Climate
Descriptor Low Rainfall Moderate rainfall High rainfall
Moisture classification Humid Per-Humid Per Humid
Temperature type Tropical Tropical Tropical
Days over 32 deg C 90 days 90 days 90 days
Annual temperature range 5 °C 5 °C 5 °C
Thornthwaite Moisture Index +60 +100 +170
Mean monthly precipitation 175mm 190mm 300mm
Mean temperature 27 °C 27 °C 27 °C
Length of dry season 3 months 2 months 1.2 months
Proportion of time driven on wet roads 20% 25% 30%
Existing surfacing materials and deterioration rate 4.3.7
Two surfacing materials were defined which relate to existing specifications, one being coarse and stony (201) and the other having medium sized gravel materials and some plastic fines (300). The main characteristics of each are shown in Table 4-6 . Following the initial analysis, the calibration factors which alter the predicted performance of the mechanically compacted surface were reviewed and in some cases adjusted as follows:
i) a calibration factor of 1.5 was applied to the roughness after grading (Ka) to represent the quality of work
ii) a roughness progression factor of 1.5 (Kc) was applied to represent typical deterioration rates
iii) gravel loss factors were left as default values following a review of the results and comparison with alternative models (see section 5.2).

Final Report - Technical review & whole of life cycle cost analysis of the Philippines
Provincial Road Management Facility 005192-2
- 14 - July 2012
Table 4-6: Properties of existing surface materials
Materials
Maximum particle size (mm)
% material passing 2.0 mm sieve
% material passing 0.425 mm sieve
% material passing 0.075 mm sieve
Plasticity index
D95 P2.00 P0.425 P0.075 PI
Coarse gravel (201) 100 20 12 2 2
Medium gravel (300) 50 50 25 12 7
4.4 Road treatments
Overview 4.4.1
TTC is affected by the nature of the treatment applied to the road in question. ‘Treatment’ is broadly defined to comprise all options for constructing new roads, improving existing roads, and maintaining roads. The following definitions have been used:
• Improvements, including such actions as widening, addition of lanes and realignment, and upgrading or changing the pavement type, for instance replacing a gravel surface with concrete
• Maintenance, comprising routine and periodic, the latter including regravelling and pavement rehabilitation.
Figure 4-5 shows how treatments are represented in the costing model used for this study.4
Figure 4-5: Types of road treatment
4 Some of this nomenclature is specific to the tools employed, mainly HDM-4, but where appropriate, treatments will be
described in engineering terms using the terminology employed by DILG.

Final Report - Technical review & whole of life cycle cost analysis of the Philippines
Provincial Road Management Facility 005192-2
- 15 - July 2012
Road treatment classification 4.4.2
Road treatments in this study were classified as follows:
• Routine maintenance treatments, with a standard policy performed within an annual cycle in response to minor defects on the carriageway and adjacent shoulders, and scheduled maintenance on other areas, including drains and vegetation
• Spot regravelling at a defined remaining gravel thickness
• Grading of the road surface at intervals of between six months and one year to restore surface shape
• Regravelling treatments, with these applied as a standard 150 mm layer, with replacement taking place when the original depth has reached 50 mm
• Rehabilitation treatments, none specified for the concrete pavements for the analysis period, with pavement reconstruction at 6 IRI for asphalt mix on granular base
• Improvement treatments, with these varying depending on whether an unsealed (gravel) or concrete pavement was provided, as follows:
o Gravel – new 150 mm layer with mechanical compaction, and with the properties as per the 201 and 300 material specifications
o Concrete – jointed plain reinforced concrete with dowels, as per properties in Table 4-7.
Table 4-7: Concrete pavement properties
Characteristic Traffic volume
Very low & Low Medium High & Very high
Concrete modulus (GPa) 28 28 28
Slab thickness (mm) 150 200 250
Base modulus (MPa) 300 300 300
Base thickness (mm) 200 200 200
Subgrade modulus 50 50 50
� Source: Thickness design based on Austroads (2010)
The list of treatments investigated is shown in Table 4-8 . The treatment combination from Options 02 - 09, i.e. initial treatment plus associated maintenance strategy, which generated the lowest total transport costs was selected as optimal. Option 01 was not selected in the final analysis for this purpose as it represented an unimproved road, although it could be used to help inform different access standards if such a policy was adopted (see later) and a full cost benefit analysis of the projects.
Option 09 represented an extension to the main analysis and comprised an asphalt surfaced option, composed of an asphalt mix on a granular base (AMGB); with the analysis limited to medium traffic.

Final Report - Technical review & whole of life cycle cost analysis of the Philippines
Provincial Road Management Facility 005192-2
- 16 - July 2012
Table 4-8: List of treatments
Option Description Short description
01 Spot regravelling at 50 mm remaining gravel and routine
maintenance (RM)
01 Base Alternative
02 Upgrade to 201 gravel with minimum maintenance (as 01) 02 Upgrade to 201 Gravel w Min Maint
03 Upgrade to 300 gravel with minimum maintenance (as 01) 03 Upgrade to 300 Gravel w Min Maint
04 Upgrade to 201 gravel with full regravelling at 50 mm and RM 04 Upgrade to 201 Gravel w RG @ 50mm
05 Upgrade to 300 gravel with full regravelling at 50 mm and RM 05 Upgrade to 300 Gravel w RG @ 50mm
06 Upgrade to concrete with RM 06 Upgrade to Concrete
07 Upgrade to 201 gravel with full regravelling at 50 mm, heavy
grading at 6 monthly intervals and RM
07 Upgrade to 201 Gravel w RG @ 50mm + HG @ 6 mth
08 Upgrade to 200 gravel with full regravelling at 50 mm, heavy
grading at 12 monthly intervals and RM
08 Upgrade to 201 Gravel w RG @ 50mm + HG @ 1 year
09 Upgrade to AMGB with RM and thin overlay at 10 year intervals 09 Upgrade to AMGB
Unit costs of treatments 4.4.3
Unit costs were derived from recent projects, and are listed in Table 4-9. These values were applied to all projects. This was because a number of factors affect specific projects and in this strategic analysis, which is expected to be used for general application, it was not believed that the influence of different factors on total costs could be explained to a sufficient degree with the available data to warrant different costs being applied to different circumstances. This is because the relatively small number of projects reviewed, namely 18 from Year 1, is also too small to draw general conclusions, although comments are given below on the distribution of costs and relationships which were explored.
Table 4-9: Unit costs of alternative treatments
Type Treatment Financial cost (PhP)
Routine Surface repairs and off carriageway 90,000 per km per year
Grading of unsealed road with compaction 38,400 per km
Periodic Regravelling 201 337 per m2
Regravelling 300 500 per m2
Thin asphalt overlay (50mm) 495 per m2
Improvement Gravel (7 m surface width plus side works) 5,110,000 per km
Concrete (5.5 m surface width plus side works) 11,540,000 per km
Asphalt (5.5 m surface width plus side works) 8,680,000 per km
The range of average costs per kilometre for the 18 gravel road improvement projects is presented in Figure 4-6, where the distribution of total costs and the contribution by cost division are shown. Table 4-10 shows the percentage distribution of project costs by division. For a number of projects, additional works and general costs exist.
Overall, pavement costs are highest (mean 38%), whereas both drainage and earthworks show a greater variation, ranging between 5% and 47% (mean 21%) and 9% and 49% (mean 21%) of project costs respectively.

Final Report - Technical review & whole of life cycle cost analysis of the Philippines
Provincial Road Management Facility 005192-2
- 17 - July 2012
Figure 4-6: Distribution of total costs for Year 1 projects
Table 4-10: Distribution of year 1 project costs by division
Project code
Concrete structures
Drainage & erosion works
Earthworks Miscellaneous
structures
Sub-base
& base course
Surface course
Additional works
General
ADS-01 4% 12% 13% 18% 31% 23% 0% 0%
ADS-02 7% 9% 25% 1% 37% 21% 0% 0%
BHL-01 0% 21% 34% 9% 17% 18% 0% 0%
BOH-02 12% 26% 26% 1% 18% 17% 0% 0%
BOH-03 13% 20% 23% 1% 32% 12% 0% 0%
BUK-01 6% 10% 18% 13% 24% 24% 0% 6%
BUK-02 8% 31% 10% 21% 22% 7% 0% 0%
GUI-01 0% 15% 49% 3% 13% 19% 0% 0%
GUI-02 11% 8% 36% 4% 21% 15% 4% 1%
GUI-03 27% 27% 13% 2% 14% 12% 4% 0%
GUI-04 10% 20% 18% 2% 21% 20% 9% 0%
MOC-01 8% 21% 14% 12% 28% 16% 0% 0%
MOC-02 0% 47% 26% 3% 19% 5% 0% 0%
MOC-03 0% 22% 24% 4% 37% 12% 0% 0%
MOR-01 6% 19% 9% 11% 29% 11% 14% 0%
SDN-01 13% 13% 30% 2% 22% 7% 13% 0%
SDN-02 9% 28% 31% 7% 16% 8% 0% 0%
SDN-03 24% 20% 17% 9% 13% 10% 0% 7%
ALL 9% 21% 21% 8% 24% 14% 3% 1%
0
1,000,000
2,000,000
3,000,000
4,000,000
5,000,000
6,000,000
7,000,000
8,000,000
9,000,000
10,000,000
Co
st (
Ph
ilip
pin
es
Pe
sos)
SURFACE COURSE
SUBBASE & BASE
COURSE
MISCELLANEOUS
STRUCTURES
GENERAL
EARTHWORKS
DRAINAGE & EROSION
WORKS
CONTINGENCIES
CONCRETE STRUCTURE
ADDITIONAL WORKS

Final Report - Technical review & whole of life cycle cost analysis of the Philippines
Provincial Road Management Facility 005192-2
- 18 - July 2012
Total project costs are plotted in Figure 4-7 and Figure 4-8 respectively against the % length of project which is classified as mountainous and the average annual rainfall. Figure 4-9 separates the two effects, by identifying moderate and high rainfall locations, defined as being below or above 3,000 mm of rainfall per annum.
Whilst there is an increasing trend for higher costs with a greater length of mountainous terrain or with higher rainfall, and the combined effect is illustrated for a small sample of data in Figure 4-9, the scatter is large and the correlation is relatively poor. This is probably a consequence of differences in road condition, drainage, structures and other local requirements which make up the costs at individual sites. For these reasons, it is also not recommended that a regional cost factor approach is applied. However, a general relationship could be developed for network level planning, and would benefit from using a larger data set, e.g. by including Year 2 PRMF projects when outcome data is available.
As noted earlier, differences in the costs of drainage works are also significant and this has been investigated for the same group of projects. Figure 4-10 and Figure 4-11 suggest drainage costs are highly correlated with terrain conditions, with a 3 – 4 fold increase in cost per km from flat terrain to mainly mountainous, and less so with rainfall. It is apparent that drainage standards have been set and applied fairly consistently, with only one significant outlier (MOC02) the reasons for which warrant further investigation. The relationship could provide a useful basis for planning estimates, but is not a causal relationship.
Figure 4-7: Relationship between total project costs and the average annual rainfall
y = 619.39x + 3E+06
R² = 0.1384
0
2,000,000
4,000,000
6,000,000
8,000,000
10,000,000
1,000 1,500 2,000 2,500 3,000 3,500 4,000 4,500 5,000
Co
st p
er
km
Annual rainfall (mm)
Cost per km
Linear (Cost per km)

Final Report - Technical review & whole of life cycle cost analysis of the Philippines
Provincial Road Management Facility 005192-2
- 19 - July 2012
Figure 4-8: Relationship between total project costs and % length of mountainous terrain
Figure 4-9: Effect of terrain and rainfall on project costs
y = 3E+06x + 4E+06
R² = 0.3723
0
2,000,000
4,000,000
6,000,000
8,000,000
10,000,000
0% 20% 40% 60% 80% 100%
Co
st p
er
km
% mountainous terrain
Cost per km
Linear (Cost per km)
0
2,000,000
4,000,000
6,000,000
8,000,000
10,000,000
0% 20% 40% 60% 80% 100%
Co
st p
er
km
% mountainous terrain
High rainfall
Moderate rainfall

Final Report - Technical review & whole of life cycle cost analysis of the Philippines
Provincial Road Management Facility 005192-2
- 20 - July 2012
Figure 4-10: Relationship between drainage infrastructure costs and % length of mountainous terrain
Figure 4-11: Effect of terrain and rainfall on drainage infrastructure costs
Those sites inspected in the 2nd ARRB visit appeared not to have been over-engineered on drainage, namely MOC01, MOC03, ADS01 and ADS02, but each were in flat to rolling terrain. Whether over-investment has taken place is less certain than appeared based on initial advice. The overall average is approximately 20% and is considered reasonable. However, the significant differences warrant a detailed assessment for future projects. This should aim to assess existing performance on a representative selection of existing roads, including earth and gravel tracks, to quantify the need for drainage improvements and identify critical sections. This would also provide important input to the assessment and costing of different access standards, and should aim to ensure cost effective use of resources and limit over-investment.
y = 2E+06x + 689118
R² = 0.6204
0
500,000
1,000,000
1,500,000
2,000,000
2,500,000
3,000,000
0% 20% 40% 60% 80% 100%
Dra
ina
ge
on
ly -
Co
st p
er
km
% mounainous terrain
Drainage cost rate
Linear (Drainage cost rate)
0
500000
1000000
1500000
2000000
2500000
3000000
1,000 1,500 2,000 2,500 3,000 3,500 4,000 4,500 5,000
Dra
ina
ge
on
ly -
Co
st p
er
km
Annual rainfall (mm)
Flat/Rolling
Mountainous

Final Report - Technical review & whole of life cycle cost analysis of the Philippines
Provincial Road Management Facility 005192-2
- 21 - July 2012
5 RESULTS OF THE WHOLE OF LIFE CYCLE COST ANALYSIS AND RELATED INVESTIGATIONS
5.1 Road performance
The roughness trend for a selection of traffic levels, a single (typical) initial condition of the existing roads, two terrains and different treatment options is shown in Figure 5-1, Figure 5-2, Figure 5-3 and Figure 5-4 for moderate and high rainfall. These figures show the maintenance options 01 to 08.
The roughness trend for the concrete option remains lowest for most levels of traffic, although differences in the rate of change are evident.
For the gravel options, including the base alternative comprising the existing road, performance trends vary for the following reasons:
i) For options 01 to 05, the trends are distinctly different with a relatively modest rate of increase at very low traffic, but with an almost immediate return to maximum roughness levels for very high traffic. For the example shown, little difference is evident between the two gravel materials.
ii) For options 07 and 08, where grading of the surface is performed with mechanical compaction, the roughness is kept substantially lower. These options were added since it was observed on site in Agusan Del Sur that they could be reasonably effective even on surfaces with oversize gravel. However, as noted earlier, the roughness improvement factor and roughness progression have been adjusted to reflect the poorer materials and therefore less effective maintenance.
iii) Differences also exist between different terrain, but in this case the maximum roughness for mountainous terrain is constrained. This is a function of the model including internal software factors which constrain the roughness to a limit of approximately 12 IRI where a combination of high horizontal curvature and high rainfall (in HDM-4 terms) occurs5. This is counter-intuitive, and therefore in identifying optimum surface maintenance the results have been interpreted to produce a more appropriate response. A similar effect does not impact gravel loss, as noted below.
In investigating what alternative materials could be employed, a case study was developed involving a single alternative pavement option, namely an asphalt surface on a granular base (AMGB). The resulting deterioration trend is shown in Figure 5-5 where the option was compared with concrete and seven gravel road options. In this example the asphalt option (09) remains below most other options for its lifecycle, with periodic shape correction/resurfacing applied at ten year intervals, which is typical of such treatments.
5 The internal model constraints on maximum roughness have been investigated by coding the original models in a
Spreadsheet and therefore confirm that the software is operating correctly. The origin of the limits should be investigated, and proposals made if necessary to change the software. Alternatively, the suite of options should be limited to those that can maintain a roughness below the internal limits. This could be easily implemented in any further analysis.

Final Report - Technical review & whole of life cycle cost analysis of the Philippines
Provincial Road Management Facility 005192-2
- 22 - July 2012
Rolling terrain, High traffic, AADT nominal = 2,500, AADT adjusted = 1,125
Rolling terrain, Medium traffic, AADT nominal = 500, AADT adjusted = 225
Rolling terrain, Low traffic, AADT nominal = 250, AADT adjusted = 112
Figure 5-1: Roughness trends for rolling terrain and moderate rainfall

Final Report - Technical review & whole of life cycle cost analysis of the Philippines
Provincial Road Management Facility 005192-2
- 23 - July 2012
Mountainous terrain, High traffic, AADT nominal = 2,500, AADT adjusted = 1,125
Mountainous terrain, Medium traffic, AADT nominal = 500, AADT adjusted = 225
Mountainous terrain, Low traffic, AADT nominal = 250, AADT adjusted = 112
Figure 5-2: Roughness trends for mountainous terrain and moderate rainfall

Final Report - Technical review & whole of life cycle cost analysis of the Philippines
Provincial Road Management Facility 005192-2
- 24 - July 2012
Rolling terrain, High traffic, AADT nominal = 2,500, AADT adjusted = 1,125
Rolling terrain, Medium traffic, AADT nominal = 500, AADT adjusted = 225
Rolling terrain, Low traffic, AADT nominal = 250, AADT adjusted = 112
Figure 5-3: Roughness trends for rolling terrain and high rainfall

Final Report - Technical review & whole of life cycle cost analysis of the Philippines
Provincial Road Management Facility 005192-2
- 25 - July 2012
Mountainous terrain, High traffic, AADT nominal = 2,500, AADT adjusted = 1,125
Mountainous terrain, Medium traffic, AADT nominal = 500, AADT adjusted = 225
Mountainous terrain, Low traffic, AADT nominal = 250, AADT adjusted = 112
Figure 5-4: Roughness trends for mountainous terrain and high rainfall

Final Report - Technical review & whole of life cycle cost analysis of the Philippines
Provincial Road Management Facility 005192-2
- 26 - July 2012
Figure 5-5: Roughness trends for the asphalt mix option 09 and other options for medium traffic
5.2 Estimated treatment frequency
Whereas road roughness is a good guide to the overall condition of gravel roads, the burden which they place on road authorities, is the frequency at which regravelling takes place.
The rate of regravelling typically varies by traffic level, material properties, terrain and climate, predominantly rainfall. In Figure 5-1 to Figure 5-5, the significant drops in roughness for the gravel treatments coincide with regravelling, with the average lives of the initial gravel surfacing based on the HDM-4 analysis presented in Table 5.1 for moderate rainfall.
Table 5-1: Initial lives of gravel surfacings (years) for moderate rainfall
Traffic volume Rolling terrain, material 201
Rolling terrain, material 300
Mountainous terrain, material 201
Mountainous terrain, material 300
Very low 6 6 3 3
Low 6 6 3 3
Medium 6 6 3 3
High 5 6 2 2
Very high 4 6 1 2
Frequent regravelling is both a financial burden, and depletes non-renewable resources. It also consumes significant management time and therefore can render gravel roads unsustainable in particular circumstances. For this reason, the use of gravel roads in other countries in the region is often restricted, particularly where the interval between regravelling falls below 4-5 years (Kackada and Cook 2009).
Because of the criticality of this, the model estimates produced using the HDM-4 models were compared with those from TRL studies in tropical climates (Jones 1984) (Figure 5-6) to provide a separate, independent estimate of the modelled results from this study.
The results show a greater effect of rainfall and terrain within the HDM-4 models, these both being major factors in parts of the Philippines, but with a slightly lesser effect of traffic at lower traffic levels. The net effect, however, is the estimates of regravelling frequency by each model are broadly similar and therefore use of the HDM-4 models provides a conservative result.

Final Report - Technical review & whole of life cycle cost analysis of the Philippines
Provincial Road Management Facility 005192-2
- 27 - July 2012
Figure 5-6: Gravel loss trends for alternative gravel loss models
5.3 Selection of optimal options
The selected optimum economic treatment, based on an existing gravel surface of material 201 in poor condition in a moderate rainfall area, is shown in Table 5-2, Table 5-3 and Table 5-4.
The results show that a gravel surface option is the best economic treatment for very low, low and medium traffic, whereas a concrete pavement option is preferred for high and very high traffic.
This suggests that the break even traffic for upgrading to concrete lies towards the upper end of a nominal AADT range of 250 and 750, or an adjusted AADT of between 110 and 330. This is broadly consistent with the findings of international studies (SADC 2003).
In the example shown the gravel option with grading of the surface at six monthly intervals is the best option for medium traffic. The challenge is whether this level of maintenance will take place, or whether a lower level of gravel road maintenance would occur in practice.
0
50
100
150
200
100 250 500 2500
An
nu
al
gra
ve
l lo
ss (
mm
)
Nominal AADT
HDM -
Low rainfall
Rolling
Hilly
Mountainous
0
50
100
150
200
100 250 500 2500
An
nu
al
gra
ve
l lo
ss (
mm
)
Nominal AADT
TRL -
Low rainfall
Rolling
Hilly
Mountainous
0
50
100
150
200
100 250 500 2500
An
nu
al
gra
ve
l lo
ss (
mm
)
Nominal AADT
HDM - Typical
rainfall
Rolling
Hilly
Mountainous
0
50
100
150
200
100 250 500 2500
An
nu
al
gra
ve
l lo
ss (
mm
)
Nominal AADT
TRL - Typical
rainfall
Rolling
Hilly
Mountainous
0
50
100
150
200
100 250 500 2500
An
nu
al
gra
ve
l lo
ss (
mm
)
Nominal AADT
HDM -
High
rainfallRolling
Hilly
Mountainous
0
50
100
150
200
100 250 500 2500
An
nu
al
gra
ve
l lo
ss (
mm
)
Nominal AADT
TRL -
High
rainfallRolling
Hilly
Mountainous

Final Report - Technical review & whole of life cycle cost analysis of the Philippines
Provincial Road Management Facility 005192-2
- 28 - July 2012
A number of factors can influence this, and an indication of their effect on option selection can be sought by comparing the total transport costs of the different options, since the optimum option is simply the alternative which minimises total costs.
Table 5-2: Selected optimum economic treatment option (*) for each representative section for low rainfall and initial poor condition
Terrain Very low Low Medium High Very High
Rolling 02 Upgrade to 201
Gravel w Min Maint
04 Upgrade to 201
Gravel w RG @ 50mm
04 Upgrade to 201
Gravel w RG @
50mm
06 Upgrade to
Concrete
06 Upgrade to
Concrete
Hilly 02 Upgrade to 201
Gravel w Min Maint
04 Upgrade to 201
Gravel w RG @ 50mm
04 Upgrade to 201
Gravel w RG @
50mm
06 Upgrade to
Concrete
06 Upgrade to
Concrete
Mountainous 02 Upgrade to 201
Gravel w Min Maint
04 Upgrade to 201
Gravel w RG @ 50mm
04 Upgrade to 201
Gravel w RG @
50mm
06 Upgrade to
Concrete
06 Upgrade to
Concrete
Note: * see Table 4.8 for description of treatments
Table 5-3: Selected optimum economic treatment option for each representative section for moderate rainfall and initial poor condition
Terrain Very low Low Medium High Very High
Rolling 02 Upgrade to 201
Gravel w Min Maint
04 Upgrade to 201
Gravel w RG @ 50mm
04 Upgrade to 201
Gravel w RG @ 50mm
06 Upgrade to
Concrete
06 Upgrade to
Concrete
Hilly 02 Upgrade to 201
Gravel w Min Maint
04 Upgrade to 201
Gravel w RG @ 50mm
04 Upgrade to 201
Gravel w RG @ 50mm
06 Upgrade to
Concrete
06 Upgrade to
Concrete
Mountainous 02 Upgrade to 201
Gravel w Min Maint
04 Upgrade to 201
Gravel w RG @ 50mm
04 Upgrade to 201
Gravel w RG @ 50mm
06 Upgrade to
Concrete
06 Upgrade to
Concrete

Final Report - Technical review & whole of life cycle cost analysis of the Philippines
Provincial Road Management Facility 005192-2
- 29 - July 2012
Table 5-4: Selected optimum economic treatment option for each representative section for high rainfall and initial poor condition
Terrain Very low Low Medium High Very High
Rolling 02 Upgrade to 201
Gravel w Min Maint
04 Upgrade to 201
Gravel w RG @ 50mm
04 Upgrade to 201
Gravel w RG @ 50mm
06 Upgrade to
Concrete
06 Upgrade to
Concrete
Hilly 02 Upgrade to 201
Gravel w Min Maint
04 Upgrade to 201
Gravel w RG @ 50mm
02 Upgrade to 201
Gravel w RG @ 50mm
+ HG @ 6 mths
06 Upgrade to
Concrete
06 Upgrade to
Concrete
Mountainous 02 Upgrade to 201
Gravel w Min Maint
04 Upgrade to 201
Gravel w RG @ 50mm
02 Upgrade to 201
Gravel w RG @ 50mm
+ HG @ 6 mths
06 Upgrade to
Concrete
06 Upgrade to
Concrete
For the medium and low traffic cases for moderate rainfall, the TTC of the treatments tested are shown in Figure 5-7 and Figure 5-8.
For all medium traffic cases the results are very close and therefore whilst a gravel option may theoretically minimise costs, the margin of difference is very small. However, can the province undertake the required gravel road maintenance? Furthermore, as noted earlier the AMGB pavement could provide an alternative less costly option.
For the low traffic case, the concrete option is clearly significantly more expensive, and therefore the choice is between various gravel options.

Final Report - Technical review & whole of life cycle cost analysis of the Philippines
Provincial Road Management Facility 005192-2
- 30 - July 2012
Figure 5-7: Total transport costs for medium traffic and moderate rainfall
Figure 5-8: Total transport costs for low traffic and moderate rainfall
0
5
10
15
20
25
02 Upgrade to
201 Gravel w
Min Maint
03 Upgrade to
300 Gravel w
Min Maint
04 Upgrade to
201 Gravel w
RG @ 50mm
05 Upgrade to
300 Gravel w
RG @ 50mm
06 Upgrade to
Concrete
07 Upgrade to
201 Gravel w
RG @ 50mm +
HG @ 6 mth
08 Upgrade to
201 Gravel w
RG @ 50mm +
HG @ 1 year
To
tal
tra
nsp
ort
co
sts
(Ph
P m
illi
on
pe
r k
m)
Medium traffic - moderate rainfall
0
2
4
6
8
10
12
14
16
18
20
02 Upgrade to
201 Gravel w
Min Maint
03 Upgrade to
300 Gravel w
Min Maint
04 Upgrade to
201 Gravel w
RG @ 50mm
05 Upgrade to
300 Gravel w
RG @ 50mm
06 Upgrade to
Concrete
07 Upgrade to
201 Gravel w
RG @ 50mm +
HG @ 6 mth
08 Upgrade to
201 Gravel w
RG @ 50mm +
HG @ 1 year
To
tal
tra
nsp
ort
co
sts
(Ph
P m
illi
on
pe
r k
m)
Low traffic - moderate rainfall

Final Report - Technical review & whole of life cycle cost analysis of the Philippines
Provincial Road Management Facility 005192-2
- 31 - July 2012
The gross differences in TTC of three of the options investigated are illustrated in Figure 5-9 for the options of very low traffic, medium and very high traffic for rolling terrain.
Significant differences in total transport costs (TTC) are shown for the very high traffic option, with approximately 80 million Pesos per km saved if the optimum concrete option is selected, or a TTC saving of 32%. This is achieved by a modest additional investment of less than 2% of TTC, noting that the cost of the concrete option is approximately double that of the gravel option both in terms of initial costs and economic costs.
Figure 5-9: Comparison of a selection of options at different traffic levels
In Figure 5-9 the overall size of the TTC and the net savings dramatically reduce as traffic level decreases. Correspondingly, the agency costs increase as a proportion of TTC from approximately 2% and 6% at very high traffic for the gravel and concrete options respectively, to approximately 27% and 52%, and 67% and 84% for medium and very low traffic respectively.
The take home message here is it becomes more difficult to justify additional investment at lower traffic levels because there is little opportunity to offset increases in agency costs with savings in road user costs6. Furthermore, whilst the differences in TTC between options narrow, the life cycle road agency costs of gravel roads are some 50% of those for concrete roads. This means that if these deliver a minimum service standard, they could offer the most suitable option until traffic levels increase sufficiently to justify additional investment. Because of their lower costs, almost twice the length of low volume gravel roads could be provided with corresponding improved access to services and markets for local communities and industry.
On the other hand, for the medium traffic option noted above, the differences in economic costs are relatively small, and if gravel roads are considered too risky for such conditions, concrete could be a less risky option.
6 Note, for this strategic analysis, this does not consider any generated traffic benefits from the without project case.
These could be sizeable for a number of specific projects under PRMF and should be considered in a final post evaluation.
-
50.00
100.00
150.00
200.00
250.00
300.00
Very Low
traffic -
04
Upgrade
to 201
Gravel
Very low
traffic -
Upgrade
to
Concrete
Medium
traffic -
Upgrade
to 201
Gravel
Medium
traffic -
Upgrade
to
Concrete
Very high
traffic -
Upgrade
to 201
Gravel
Very high
traffic -
Upgrade
to
Concrete
Life
cy
cle
co
sts
pe
r k
m
RAC
RUC

Final Report - Technical review & whole of life cycle cost analysis of the Philippines
Provincial Road Management Facility 005192-2
- 32 - July 2012
Thus, whilst useful, the outcomes of the analysis can only act as a general guide, and a pragmatic view needs to be taken in option selection.
5.4 Proposed solutions and applications framework
There are clearly a significant number of factors which influence option selection for different circumstances, of which the following have been shown to have a significant influence:
i) Traffic, with high and very high traffic levels consistently favouring a concrete, or alternative, paved surface, whereas gravel provides the least cost option at low and very low traffic.
ii) Climate, primarily rainfall, which increases the rate of gravel loss and, along with traffic, can lead to some surfaces having a life of only a few years.
iii) Terrain, which requires greater tractive forces from vehicles and increases surface run-off and the potential for erosion.
iv) Maintenance of gravel roads, including periodic grading, cannot be assumed to be a given, and if unlikely the next best option for medium traffic would be a permanent paved surface.
Such considerations have contributed to a proposed framework (Figure 5-10) for selecting the desirable surface type where budget and other factors allow. The solutions were chosen based on a combination of minimising TTC and a regravelling frequency (in years) of no less than 4 years, and are appropriate for rainfall conditions up to approximately 3,000 mm per annum.
Where rainfall is higher than 3,000 mm per annum a permanent surface is desirable where traffic levels exceed 250 vehicles per day, i.e. for medium traffic and above.
Terrain Very low Low Medium High Very High
Flat/Rolling
Hilly
Mountainous
Gravel - minimises WOLCC and sustainable
Concrete/sealed - Gravelling unlikely to be sustainable
Concrete/sealed - minimises WOLCC
Figure 5-10: Desirable solutions considering TTC and regravelling frequency
The above proposals therefore support PRMF’s basic premise provided the solution is limited to roads carrying less than 500 vehicles per day (including motorcycles), or an adjusted AADT of approximately 225 vehicles per day (as defined earlier), and that the paving of steep sections and those subject to flooding is undertaken. The gradient at which this is undertaken may however need to be lowered to below the current value of 10% with a gradient of 6% identified as a possible alternative upper limit for gravel roads especially in the highest rainfall areas.
The findings therefore support the appropriate use of gravel and concrete. The optimum solution differs mainly in response to the availability of future maintenance treatments, traffic and material properties, and for different terrain/climate combinations.

Final Report - Technical review & whole of life cycle cost analysis of the Philippines
Provincial Road Management Facility 005192-2
- 33 - July 2012
The traffic levels referred to are post improvement/rehabilitation, and it is essential that these are estimated to a reasonable degree of accuracy, with post improvement traffic levels being observed to be up to four times previous levels. This is likely to have seriously impacted the sustainability of a number of the PRMF projects, as discussed below.
Care also needs to be taken where commercial vehicles are overloaded, as premature failure of the pavement and gravel surface will occur. To mitigate against this, the first resort should be to enforce axle load limits. However, the legal limit in the Philippine, at 13.5 tonnes per axle, is very high. On the basis of the classical 4th power law (AASHTO 1972), the damaging power per axle is some 3.3 times typical limits in neighbouring countries. This should be considered in any planning studies, and in the thickness design of both gravel and concrete pavements. It would also be pragmatic to apply higher roughness progression factors for gravel roads in such circumstances, noting that a factor of 1.5 was applied in this study on the basis of the non-standard materials used and the difficulty in effectively maintaining them.
5.5 Implications of the proposed framework
The implications of the proposed framework has been determined by selecting the treatments which could have been chosen for the Year 1 PRMF projects if the framework was available at this time. This involved considering the following three cases:
i) Use of pre-PRMF traffic and known rainfall and terrain conditions as a guide to treatment selection.
ii) Use of post-PRMF traffic and known rainfall and terrain conditions as a guide to treatment selection.
iii) Requiring all roads with medium traffic and above to receive a permanent, concrete surface where the rainfall exceeds 3,000 mm per annum.
The results, in terms of % of PRMF project length (for year 1 roads), for each case are shown in Figure 5-11. Where a change is shown between case i) and case ii), the traffic band has changed, otherwise it has not. A change between case ii) and case iii) means that the stricter (high) rainfall criteria apply for the particular projects. For example, Agusan Del Sur has a reported rainfall of almost 4,000 mm per annum, and therefore case iii) applies.
Overall, based on the 2008 traffic data, approximately 75% of the length of PRMF project roads meet the criteria for a gravel surface, whereas this figure drops to 60% using the 2011 traffic data. If the criterion for high rainfall is considered this number reduces further to approximately 25%.
The significance of the changes in traffic is shown in Figure 5-12, with approximately 50% of the projects showing an increase in traffic of 200% or more. In a few cases the results show a decrease, but the general trend is evident. It demonstrates that considerable trip generation has taken place. It is essential therefore that a reliable estimate is made of the post-improvement traffic, this reinforcing the belief that PRMF roads are restoring, if not opening, access to many communities.
Finally, because of the coarseness of the assessment, the extent of project lengths suitable for gravel has probably been under estimated, i.e. the analysis is conservative. A more detailed analysis would involve reviewing the length of road by gradient. However, it illustrates the main issue, namely careful planning is needed using good quality data to ensure appropriate selection of surface type and therefore help ensure the sustainability of the road improvements delivered

Final Report - Technical review & whole of life cycle cost analysis of the Philippines
Provincial Road Management Facility 005192-2
- 34 - July 2012
through PRMF. It also emphasises the need for a sustainable maintenance regime to be applied across all project roads as soon as possible.
Figure 5-11: Per cent length of PRMF Year 1 gravel roads by province meeting proposed selection criteria considering pre and post PRMF traffic data
Figure 5-12: Per cent change in AADT from 2008 – 2011 for year 1 PRMF
0%
20%
40%
60%
80%
100%
% l
en
gth
of
gra
ve
l ro
ad
Case i) - 2008 % sustainable gravel
Case i) - 2011 % sustainable gravel
Case iii) - 2011 % sustainable gravel &
high rainfall
-100%
0%
100%
200%
300%
400%
500%
600%
700%
% c
ha
ng
e i
n A
AD
T f
rom
20
08
2010 - Per cent change from 2008
2011 - Per cent change from 2008

Final Report - Technical review & whole of life cycle cost analysis of the Philippines
Provincial Road Management Facility 005192-2
- 35 - July 2012
6 ROAD NETWORK CONDITIONS AND FUNDING
6.1 General
Road network conditions and funding were assessed and reported prior to the start of PRMF and during the annual Provincial Road Network Development Plan and Road Maintenance Strategy development process initiated with the support of the PRMF. Discussions were also held with the PEO in the provinces visited, and with provincial administrators, and this has contributed to the independent assessment of the financial capacity of the provinces to support maintenance which is reported here. It has been used to inform the assessment of sustainable capacity beyond PRMF, with a focus on annual maintenance needs and restoring roads to an appropriate surface condition. It is limited in a number of respects, for instance it does not take road capacity fully into account, and this should be addressed if comprehensive plans are to be developed.
6.2 Road condition
Road condition statistics are summarised in Table 6-1.
Table 6-1: Length of road by surface type and condition
Province Road length by surface type (km) Pre-PRMF 2011
Concrete Asphalt Gravel Earth Total Poor/Bad (*) Poor/Bad (*)
Misamis Occidental 41 6 260 199 506 34% 30%
Agusan del Sur 57 8 292 291 648 34% 70%
Bohol 145 10 763 0 918 64% 35%
Bukidnon 19 0 818 10 847 49% 15%
Guimaras 52 0 70 0 122 33% 12%
Misamis Oriental 137 0 450 370 957 70% 14%
Surigao del Norte 50 0 226 36 312 18% 24%
Source: Pre-PRMF Provincial Assessment Reports (circa 2009) and PRMF Road maintenance strategy reports for individual provinces (circa 2011).
Note: * condition limits and descriptors described in Table 4.4
The reported data varies considerably with the exception of the Misamis Occidental data. The level of detail also varies, with the level of reporting varying from province to province. On average the data suggests an overall improvement in road condition from 43% in a poor/bad condition Pre-PRMF to 29% in a poor/bad condition in 2011.
Whether this is realistic is unknown, and reasons for any possible discrepancies, such as the substantial increase in poor/bad roads in Agusan del Sur, have not been determined, but they are a concern. As noted in Table 6.1, there are both significant decreases in the proportion of poor/bad roads (3 cases) and a significant increase. Understanding this should be a priority, and should involve a reappraisal of data collection methods and capability to ensure greater consistency in future. Notwithstanding this, use has been made of the 2011 data as the basis for an estimate of funding demand.
6.3 Basis for estimating funding demand and supply
The network condition and financial data obtained has been used to calculate:
i) derived financial performance measures to value the assets and determine needs

Final Report - Technical review & whole of life cycle cost analysis of the Philippines
Provincial Road Management Facility 005192-2
- 36 - July 2012
ii) measures of demand versus supply to assess the adequacy of current funding.
Asset value and measures of need 6.3.1
The following measures have been used to value assets and determine needs:
• Asset replacement value (ARV), where this is the full value of reconstruction of the pavement, surfacing and ancillary asset features. For the networks concerned, costs (excluding earthworks and land) are of the order of PhP 10,000,000/km for a concrete surfaced road, PhP 7,500,000/km for an asphalt surfaced road, PhP 4,000,000/km for a gravel road and PhP 2,000,000/km for a formed earth track. The values for concrete and asphalt are of the same order of the reconstruction cost rates used in this study, whereas those for gravel roads and earth roads are an estimate based on the figures for the project roads in this study, and comparable roads in neighbouring countries.
• Unit cost rate based on a percentage of asset value, where the annual unit cost of maintenance investment is estimated as a proportion of the asset replacement value (ARV). The European Union recommends that a target of between 2% and 2.5% of the value of current assets should be allocated annually to routine and periodic maintenance and has been applied in regional studies (Wood and Metschies 2006). A similar value has been used in studies in Indonesia (Robertson and Toole 2010).
On the basis of ARV, an acceptable average annual cost rate would range between approximately PhP 50,000 per km and PhP 250,000 per km for an earth or concrete road respectively. The actual average value for a network of provincial roads will however vary depending on the characteristics of the network.
• Estimated backlog, representing the value of the renewal works required to bring poor and very poor roads into an as-new condition. For this, an assumption has been made that roads in a poor condition require a treatment equal to 1/3rd of their ARV, whereas a road in a bad (or very poor) condition requires 2/3rd of their ARV to be invested. The reported backlog is based on the assumption that only gravel and earth roads are in a poor or bad condition, with little reference made in the PRMF documents to paved roads being in a poor/bad condition. Whilst this may not be true, it is considered that its effect on the outcomes are likely to be modest given the vastly greater extent of unpaved roads and the unit costs applied in determining asset replacement values.
• Additional backlog, representing the value of improvement works to upgrade earth roads to all-weather gravel roads, this being considered desirable for provincial roads to allow reliable year round travel on most days of the year. A further reason for defining an additional backlog could be where the road is at capacity, and needs to be widened or upgraded say from gravel to concrete. However, this has not been applied here because of the lack of comprehensive traffic data, but it should be considered in developing medium term plans.
• Ratio of Backlog to ARV, this provides a broad indicator of the proportional value of the network relative to its replacement value. It is reported for both the condition related backlog and for the total backlog, with the latter including the additional backlog.
An estimate of the funding demand and network value based on the above measures is given in Table 6-2 . An estimate of the annual average financial cost of maintenance for three gravel road options is also given in Table 6-3 based on the life cycle analysis.

Final Report - Technical review & whole of life cycle cost analysis of the Philippines
Provincial Road Management Facility 005192-2
- 37 - July 2012
Table 6-2: Estimate of funding demand and network value
Province
Asset
replacement
value
(PhP)
Total annual
maintenance
demand
(PhP)
Unit cost
rate per km
per year
(PhP)
Backlog
(condition
only)
(PhP)
Additional
backlog
(PhP)
Total backlog
(PhP)
Backlog/ARV (%)
Condition
only Total
Misamis
Occidental 1,803,355,000 45,083,875 106,367 254,700,000 995,000,000 1,249,700,000 12% 58%
Agusan del
Sur 2,641,000,000 66,025,000 103,086 511,490,000 1,455,000,000 1,966,490,000 19% 74%
Bohol 5,340,000,000 133,500,000 145,425 667,747,500 - 667,747,500 13% 13%
Bukidnon 4,300,000,000 107,500,000 126,919 306,772,500 50,000,000 356,772,500 7% 8%
Guimaras 870,000,000 21,750,000 178,279 21,014,400 - 21,014,400 2% 2%
Misamis
Oriental 4,360,000,000 109,000,000 113,898 157,519,600 1,850,000,000 2,007,519,600 4% 46%
Surigao del
Norte 1,702,000,000 42,550,000 136,378 135,657,600 180,000,000 315,657,600 8% 19%
Source: Pre-PRMF Provincial Assessment Reports (2009) and PRMF Road maintenance strategy reports for individual provinces (2011).
Table 6-3: Estimate of annual average gravel road maintenance costs for different maintenance treatments for low traffic volumes in rolling terrain and for moderate rainfall
Gravel with regravelling @
50mm and minimum
maintenance
Gravel with regravelling @
50mm + Heavy Grading @
12 mth intervals and routine
maintenance
Gravel with regravelling @
50mm + Heavy Grading @ 6
mth intervals and routine
maintenance
PhP 160,000 per km PhP 240,000 per km PhP 320,000 per km
The available data has also been examined to establish whether any general relationship exists between estimates of total annual maintenance demand and road condition. For example, should Agusan del Sur which has the most poor/bad roads post PRMF have a higher maintenance demand than, say, Misamis Oriental whose roads are in much better condition?
Whilst this would seem reasonable, it is complicated by the composition of the network as well as condition. In the cases quoted, concrete roads occupy a significant proportion of the Misamis Oriental budget and the proportion of earth roads are less. Using the ARV based method, this leads to a higher maintenance demand.
The annual (sustainable) need is also based on roads in a good or fair condition, but this cannot be considered in isolation. For those roads which are not in a good/fair condition then the backlog needs to be considered to account for the proportion of roads in a poor/bad condition. The need therefore is to consider both the average cost rate calculated on a per km basis, and accounting for the nature of the roads, i.e. gravel, earth etc., terrain, traffic and the backlog. However, formulated in this way it is a single figure for a single year, unless it is decided to smooth the budget and remove the backlog over a period of years.
To determine whether any general relationship exists, a simple plot of condition versus the average cost for both annual maintenance needs and backlog removal was computed for a five year period, and is shown in Figure 6-1. The cost rate has been determined in two ways, namely a)

Final Report - Technical review & whole of life cycle cost analysis of the Philippines
Provincial Road Management Facility 005192-2
- 38 - July 2012
considering the annual need and the condition related backlog, and b) considering the annual need and the total backlog. The resulting relationship seems plausible, although the sample is small and the positive slope is driven by a single point, i.e. Agusan del Sur. Furthermore, it is not a causal relationship and there is no substitute for a case by case analysis of needs based on the specific composition and condition of each individual network.
Figure 6-1: Relationship between average network condition and annual maintenance costs to deliver a desirable level of service
Measures of demand versus supply 6.3.2
The available data has been compared with budget data to estimate funding demand versus supply measures for each of the PRMF provinces drawing on the information contained in Table 6-2 and Table 6-4.
Table 6-4: Funding demand versus supply
Province
Average annual road maintenance
budget excluding PRMF
(PhP)
Total annual roads budget
excluding PRMF
(PhP)
Average Cost Rate
(PhP/km/year)
Average Total road funding
per year
(PhP/km/year)
Maintenance Funding
Demand/Supply Ratio
(MFDS)
Maintenance Need/Roads Funding Ratio (%)
Total Funding Demand/Supply
Ratio
(TFDS)
Misamis Occidental 4,400,000 13,500,000 8,699 26,691 12.2 399% 22.9
Agusan del Sur 41,000,000 126,000,000 63,272 194,444 1.6 53% 4.6
Bohol 44,545,000 126,545,000 48,524 137,849 3.0 105% 6.3
Bukidnon 70,000,000 72,000,000 82,645 85,006 1.5 149% 5.8
Guimaras 6,000,000 8,200,000 49,180 67,213 3.6 265% 5.2
Misamis Oriental 23,900,000 36,800,000 24,974 38,454 4.6 296% 7.2
Surigao del Norte 10,500,000 12,500,000 33,654 40,064 4.1 340% 14.3
y = 670183x + 222449
R² = 0.4604
y = 146257x + 178381
R² = 0.4124
0
200,000
400,000
600,000
800,000
0% 20% 40% 60% 80%
Co
st p
er
km
% poor/bad condition
Average annual cost per km with
total backlog
Average annual cost per km with
condition backlog
Linear (Average annual cost per
km with total backlog)
Linear (Average annual cost per
km with condition backlog)

Final Report - Technical review & whole of life cycle cost analysis of the Philippines
Provincial Road Management Facility 005192-2
- 39 - July 2012
The definitions used in Table 6-4 are as follows:
• Average Cost Rate, calculated as
LengthNetwork Road
type)emaintenanc(per eExpenditur eMaintenanc Annual RateCost Average =
The Average Cost Rate can be used as an indicator of maintenance efficiency that can be compared against international norms. Typical average cost rates for South East Asian economies for paved roads are in the range USD 2,000 per km to USD 3,000 per km for routine maintenance, and USD 4,000 per km to USD 6,000 per km for periodic maintenance. These are equivalent to a median value per km per year of approximately PhP 100,000 and PhP 200,000 for routine and periodic maintenance respectively. For the provinces concerned the budget data was not available by maintenance type and therefore a single average value is reported per province, with a regional norm of approximately PhP 300,000 per km.
• Maintenance Funding Demand/Supply Ratio, calculated as
(Supply) eExpenditur eMaintenanc
(Demand) Need Funding eMaintenancRatio MFDS =
High ratio values (greater than 1) indicate that funding demand exceeds supply, implying that maintenance needs are not being fully met each year, and that a maintenance backlog exists, noting that the figure does not include the backlog of works to bring a rod to a sustainable condition. Ratio values less than 1 indicate that the expenditure level is higher than known maintenance needs. This can occur if unpredictable emergent expenditure is required or if expenditure budget is being inefficiently allocated.
• Maintenance Need/Roads Funding Ratio, calculated as
Funding Road Total
Need Funding eMaintenancRatio Needs eMaintenanc =
The Needs Ratio represents the proportion (as a percentage) of total road sector funding that is needed to meet all maintenance requirements in any year. Similar to the MFDS, it does not account for the cost of removing the backlog. A Needs Ratio of 100% means that all road sector funding is needed for maintenance. Values greater than 100% indicate the extent of unmet road maintenance need.
• Total Funding Demand/Supply Ratio, calculated as
(Supply) Funding Road Total
(Demand) Backlog and Need Funding eMaintenanc of SumFDSR Total =
This is similar to the MFDS where high ratio values (greater than 1) indicate that funding demand exceeds supply, implying that the sum of maintenance needs and the cost of the removing the backlog are not being fully met each year from the total road sector funding. The number is an indication of the number of years of funding at current levels to remove

Final Report - Technical review & whole of life cycle cost analysis of the Philippines
Provincial Road Management Facility 005192-2
- 40 - July 2012
the backlog and bring the network into a maintainable condition.
In applying these figures to actual real situations, consideration should be given to the issue of whether a backlog exists, whether there is a lack of adequate quality roads and the mix of paved versus unpaved roads with the international norms being typical of a network with predominantly paved roads. The norms also assume the roads in question are in a reasonably stable state, and are fit for purpose in terms of access standards, which is clearly not the case here.
6.4 Discussion
On the basis of the data in Table 6-2, Table 6-3 and Table 6-4, the following observations have been made:
i) The average cost rate, i.e. for the sum of routine and periodic maintenance, is approximately 30% of the estimated unit cost rate accounting for the mix of road surface types in the provinces concerned, and approximately 15% of the international norm, with this in part reflecting the mix of road surface types prevalent in the Philippines. This low level of funding is a major concern, particularly if a substantial increase in Maintenance by Contract (MBC) occurs. This will require average cost rates to be closer to the international norm based on the gravel road options investigated in the life cycle analysis (Table 6.3).
ii) The maintenance funding demand supply ratios (MFDS) (Table 6-4), also vary significantly, from a low of approximately 1.5 (Bukidnon) to a high of approximately 10 (Misamis Occidental), and an average of approximately 4. Both Bukidnon and Agusan del Sur are close to a sustainable maintenance budget, provided the overall network is fit for purpose, e.g. in terms of the appropriateness of the surface type.
iii) The maintenance needs ratio, which utilises the total roads budget as the denominator also confirms Agusan del Sur is in a reasonably good position, with Bohol and Bukidnon next best.
iv) However, the total funding demand/supply ratio, which accounts for a condition related backlog, suggests it will take a number of years even for the best funded provinces to establish sustainable maintenance. In the worst cases, specifically Misamis Occidental and Surigao del Norte, the challenge is very significant, with this caused by the low investment in roads.
v) The variation in investment levels is well illustrated by the almost 6-fold difference in total road funding (per km of road) between Agusan del Sur (PhP194,000 per km per year) and Surigao del Norte. Misamis Occidental and Misamis Oriental (average of PhP 35,000 per km per year). The latter are clearly unsustainable with the annual funding almost 1/5th the average cost rate for routine and periodic maintenance without considering actual demand or any backlog. The values also reflect the proportion of development funds allocated to roads in the provinces concerned, e.g Misamis Occidental only allocates 8% of its fund whereas Agusan del Sur allocates approximately 50% of development funds in addition to a significant proportion of general funds.
vi) Total backlog values (Table 6-2) as a percentage of asset value vary significantly. A reasonable value would be between 5% and 10%, representing typical asset lives of 10 years to 20 years and a network which is fit for purpose in terms of surface types and

Final Report - Technical review & whole of life cycle cost analysis of the Philippines
Provincial Road Management Facility 005192-2
- 41 - July 2012
traffic use. Where the assessment is based on the total backlog only three provinces lie close to this range (Bohol, Bukidnon and Guimaras), one is slightly high (Surigao del Norte), whereas three are extremely high (Agusan del Sur, Misamis Occidental and Misamis Oriental). For the latter three networks, the backlog is substantially affected by the large length of earth roads, which accounts for between 50% and 90% of the backlog. Where the assessment only considers the condition related backlog, most provinces are close to the desirable range, with the exception of Agusan del Sur. This has the potential to alter the latter provinces position as one of the better funded provinces, the risk being that maintenance funds could be diverted to fund surface upgrading and the removal of the condition related backlog.

Final Report - Technical review & whole of life cycle cost analysis of the Philippines
Provincial Road Management Facility 005192-2
- 42 - July 2012
7 SUMMARY OF FINDINGS
Objective A – WOLCC analysis of gravel versus other surface types 7.1.1
The evaluation first involved defining a matrix of representative design and operating conditions in terms of condition (4 levels), traffic (5 levels), terrain (3 types), initial surface material (2 types) and climate (3 types). The second step involved defining a range of possible maintenance and improvement treatment options. In all, a total of seven gravel options and a concrete option were chosen and applied to each representative unpaved road section in a 20 year life cycle economic analysis. In addition, a single asphalt pavement option was tested as an example of an alternative paving option.
The optimum treatment option for each representative section was chosen on the basis of minimising total transport costs (TTC), these being defined as the sum of discounted economic road agency costs (RAC) and road user costs (RUC) for a 20 year analysis period. These results were then reviewed in terms of their practicality, this drawing on field observations and discussions with DILG, PEO, AusAID and FMC staff. For example, whereas gravelling can be shown to minimise economic costs in many situations, it can prove unsustainable as a result of the need for frequent interventions which may consume scarce financial resources and non-renewable natural resources, and engage human and equipment resources disproportionately. The choice therefore needs to be a balance considering a range of factors.
Gravel surfacings were shown to be consistently favoured for very low and low traffic volumes (< 250 vehicles per day, including motorcycles), whereas concrete was the optimum solution at high and very traffic volumes (> 750 vehicles per day), and in mountainous areas and sections with a steep grade. At moderate traffic levels, the choice varies for a number of reasons, including terrain, rainfall and the type and feasibility of gravel road maintenance options. On the basis of the available evidence, the break even traffic for upgrading to concrete lies between a nominal AADT of 250 and 750 (including motorcycles), or a mean AADT of 500, equivalent to an adjusted AADT7 of 225, and is reasonably consistent with international studies and local guidelines from DILG and DPWH.
For high rainfall (> 3000 mm per year) a lower adjusted AADT of 150 vehicles per day should be considered.
Finally, in a limited analysis of the possible use of alternative surfacings, an asphalt surfaced granular road base option was examined and this was found to minimise TTC for medium traffic and a typical set of operating conditions. The solution was priced at approximately 70% of the cost of the concrete pavement option. Subject to verification of the costing and other assumptions employed, the solution provides a potential alternative to concrete and could prove useful in
7 The analysis presented in this report uses a typical mix of 80% motorcycles and 20% other vehicles. To account for
different proportions of motorcyles, the Adjusted AADT should be determined, as follows: Adjusted AADT = Sum of light and heavy vehicles per day + 0.3 * sum of motorcycles per day. The adjustment is based on the concept of a notional passenger car unit (PCU) value (TRB 1992), which though specifically derived for traffic capacity situations has been applied here as a basis for estimating an equivalent rate of wear.

Final Report - Technical review & whole of life cycle cost analysis of the Philippines
Provincial Road Management Facility 005192-2
- 43 - July 2012
extending the length of permanent all weather roads. A sprayed chip and seal, or surface dressing option, would be cheaper still and worth trialling (see later)8.
Objective B – Is PRMF’s premise sound? 7.1.2
The findings confirm the PRMF’s basic premise provided the solution is limited to roads carrying less than an adjusted AADT of 225 vehicles per day, and that the paving of steep sections and those subject to flooding is undertaken. The gradient at which this is undertaken may however need to be lowered to below the current value of 10% with a gradient of 6% identified as a possible alternative upper limit for gravel roads especially in the highest rainfall areas.
The gravel surface solution, however, is currently at risk due to the lack of surface maintenance during the defects liability period, and the very flat camber which was specified. It is also at risk if sustainable maintenance regimes cannot be established. The latter will require greater capacity in undertaking mechanised grading with this being required at intervals of between 6 months and one year, preferably the former. More frequent grading may also be justifiable, but is likely to be unattainable.
The challenge of gravel road options was also put in perspective in relation to the proposed new criteria, this showing that if applied at the start of PRMF only 80% of the length of project roads would fulfil requirements based on the original 2009 traffic data. However, this reduces to 60% if current traffic data is used, with increases in traffic of more than 200% being common. If a stricter requirement is applied which requires paving all roads with medium traffic and above in all high rainfall areas (>3,000mm per annum), only 25% of the length of project roads meet the criteria. This criterion may, however, be too strict, and draws solely on international studies. However, it serves to highlight the risks associated with gravel roads,
The findings therefore support the appropriate use of gravel and concrete. The optimum solution differs mainly in response to the availability of future maintenance treatments, traffic and material properties, and for different terrain/climate combinations.
The traffic levels referred to are post improvement/rehabilitation, and it is essential that these are estimated to a reasonable degree of accuracy, with significant increases in traffic levels post improvement having been observed. This is likely to have seriously impacted the sustainability of a number of the PRMF projects.
Furthermore, care also needs to be taken where commercial vehicles are overloaded, as premature failure of the pavement and gravel surface will occur. To mitigate against this, the first resort should be to enforce axle load limits. However, the legal limit in the Philippine is very high, equivalent to some 3 times the damaging power of legal limits in neighbouring countries, and this should be anticipated in planning and design studies through the application of appropriate deterioration factors, and the use of realistic traffic loading assumptions.
8 Other alternative surfacings, or surface treatment options such as including chemical additives in gravel surfacing
materials may be worth testing. Such treatments include lignin sulphonates which are a waste product from the paper industry. However, they are highly water soluble and less effective on non-plastic materials, this being typical of the river gravels used widely in the Philippines, and in cases where road gradients would accelerate leaching. Reapplication, typically at annual intervals, is also required although they have proven to be cost effective in appropriate circumstances at traffic levels over 150 AADT. For further information see Western Cape Provincial Administration (2006), Global Transport Knowledge Partnership (2008) and Andrews and Sharp (2010).

Final Report - Technical review & whole of life cycle cost analysis of the Philippines
Provincial Road Management Facility 005192-2
- 44 - July 2012
Beyond PRMF 7.1.3
There is, however, a need to qualify the above because there is a continuing risk that the core networks of provincial gravel roads cannot be maintained by the province beyond the lifetime of PRMF for the following reasons:
i) There is an absence of categorical stakeholder support and therefore there is a need to continue to convince and encourage an appropriate mix of gravel and concrete surfaced roads supported by rational analysis. Perceptions are at least changing amongst communities, and they are already seeing the immediate benefit, including through increased school attendances, reduced childbirth-related mortality, greater access to markets and for income earning activities, and more frequent public transport. The benefits shown, and the level of increase in traffic, suggest the interventions are essentially opening access, and not simply leading to a marginal reduction in road user costs. It is important that this is widely communicated.
ii) In a number of provinces funding for roads, and road maintenance, is both low and displays significant annual variation. The main findings were:
• The average cost rate, i.e. for the sum of routine and periodic maintenance, is approximately 1/3rd of the estimated unit cost rate accounting for the mix of road surface types in the provinces concerned, and approximately 1/6th of the international norm, with this in part reflecting the mix of road surface types prevalent in the Philippines.
• Total backlog values as a percentage of asset value vary significantly. A reasonable value would be between 5% and 10%, with this achieved by three provinces, whereas the backlog in three provinces was found to lie between 47% and 73% of the total asset value.
• The total road funding demand/supply ratio, which takes account of the backlog, suggests it will take between 4 and 7 years for even the best funded provinces to both establish sustainable maintenance and remove surface condition related backlogs. In two cases the backlog would take between 14 and 22 years to remove without accounting for growth in demand, and therefore the challenge is very significant.
• The challenge which the provinces face largely related to an under investment in road maintenance and roads in general, with an almost six-fold difference in total funding (per km of road) between the best resourced provinces and the least resourced provinces. The values reflect the proportion of development funds allocated to roads in the provinces concerned, which ranged between a low of 8% and more than 50%.
iii) Whereas statements by senior provincial officials in terms of budget allocation are supportive in a few cases, suggesting a positive trend towards sustainable funding, in reality as indicated above, budget resources can in specific cases be woefully inadequate. This requires a stronger dialogue between the main PRMF partners, DILG and AusAID, and provincial authorities, and should be a condition for the level of grant support.
A further concern is, whereas addressing the core network is important, access conditions for communities on significant parts of the networks are very poor and are likely to remain so for a

Final Report - Technical review & whole of life cycle cost analysis of the Philippines
Provincial Road Management Facility 005192-2
- 45 - July 2012
considerable number of years unless a significant change in design and maintenance standards is applied. There is therefore a need for a more in-depth analysis covering the total needs of the network, not just core roads. Whilst this has been recognised by AusAID and forms part of the PRMF concept, it requires the provinces to take responsibility for their entire network, whilst recognising that PRMF will only fund activities on the core network. It also requires longer term trends in road use on different parts of the network to be quantified, as considerable traffic generation has been observed.
Ignoring the overall network has significant risks, and may lead to budgets being reallocated as a result of community and political pressure. An alternative, proactive approach could involve:
a) Setting appropriate access levels across the whole network. For example, full access standards would be appropriate to minimise life cycle costs on the most important and highly trafficked roads, this being typical of the WOLCC analysis reported by the IPR TA, whereas a basic access standard delivered at minimum cost could maximise the access to basic services for communities (Lebo and Schelling 2000 and Toole et al 2001).
b) Adopting a basic access approach would require program objectives to be clarified, including whether reliable all-weather access is an appropriate objective for any part of the core network. Such an approach also requires any infrastructure provision to be reviewed considering the criticality, or added value, of the intervention and its components. It would be supportive of maximising community and economic outcomes, and is appropriate where traffic levels are very low and future use uncertain. Such an approach could deliver a significantly greater length (of at least double or more) of improved and maintained gravel road access than would be the case if the current high standard gravel option was adopted across the board.
The study also identified examples of over and under investment. These should be addressed in order to better target spending and optimise use of available funds, and should be considered in finalising any guidelines. The danger is bad habits can become entrenched, and it is better to address such issues as soon as possible and clarify specific cases and mainstream acceptable solutions.
On the basis of the WOLCC analysis and reviews undertaken as part of this study, an assessment of risk has been made (Table 7-1) considering a) the suitability of a gravel surfacing solution based on pre-project and post-project traffic, and climate (Figure 5-11), and b) funding capacity/commitment. Taking one example, whereas Agusan del Sur was initially judged to be a low risk in terms of commitment to maintenance, the extent of the total backlog is very significant, and this places it at greater risk of the possible reallocation of funds from maintenance to the upgrading of earth roads.

Final Report - Technical review & whole of life cycle cost analysis of the Philippines
Provincial Road Management Facility 005192-2
- 46 - July 2012
Table 7-1: Assessment of major risks to gravel and road maintenance sustainability
Maintenance funding
capacity/commitment
Gravel surfacing solution (project related)
Least at risk Intermediate Most at risk
Least at risk Bukidnon
Intermediate Bohol Agusan Del Sur
Guimaras
Most at risk Misamis Occidental Surigao Misamis Oriental
The classification combines both the province wide funding and commitment, and PRMF project specific assessments. A different selection of roads could therefore produce a different result, and therefore it is recommended that maintenance funding/commitment is used as the primary basis for classifying risk. This is because such factors are harder to overcome and are therefore more critical. on the other hand, technical factors can be assessed and addressed through appropriate resources and quality and governance improvements, if resources are very limited the possibility of applying appropriate solutions will be severely compromised.
Benchmarking costs 7.1.4
The average rehabilitation and maintenance costs were considered reasonable for the treatments they delivered. However, the appropriateness of the costs incurred needs to be challenged to ensure resources are best used. Variations in costs between projects were significant, with a relationship between projects costs and the effects of rainfall and terrain being illustrated although the correlation coefficients were weak. Whilst pavement costs accounted for the highest proportion of all costs (mean 38%), significant variations in drainage and earthworks costs was also evident and represented the highest cost divisions on particular projects.
Annual (maintenance) cost rates were approximately half those in neighbouring countries, with this also reflecting the nature of the network, namely a significant proportion of gravel and earth roads. However, the adequacy of these cost rates is questionable particularly if a substantial increase in MBC occurs, and the estimated need for an average cost rate closer to the international norm based on the gravel road options investigated in the life cycle analysis.
If an access standard based approach is adopted, differences in costs per km will vary more significantly (by 3 or 4 times) than the marginal differences from a benchmarking exercise. This requires consideration of specific treatment details and their appropriateness for different locations.

Final Report - Technical review & whole of life cycle cost analysis of the Philippines
Provincial Road Management Facility 005192-2
- 47 - July 2012
7.2 Broader policy oriented advice
The review also highlighted the need for more policy oriented advice to ensure road standards were appropriate for anticipated use, and to encourage an output and outcome based approach to road planning and delivery. This should aim to maximise the accountability of provincial government and delivery units, and offer the opportunity to determine the additionality9 provided by AusAID grant support, and leverage provincial government resources. The focus on access standards would also help ensure community outcomes are maximised, and considered in network planning. Too close a focus on project outcomes should be resisted as this will not maximise network benefits. Work in this area by the AusAID supported Indonesian Infrastructure Initiative should be consulted, as it is highly relevant. Both Maintenance by Administration (MBA) and Maintenance by Contract (MBC) should be pursued, with MBA providing an opportunity to leverage local resources. Good examples of simple rehabilitation and maintenance measures were observed and discussed with the PEO. These included reduced scope of works to minimise access costs, a solution which could be more widely applied as discussed above. DILG guidelines for maintenance and rehabilitation were also reviewed. They are simple and concise, and found to be suited to widespread application. They are, however, limited in scope and could usefully be extended to include sealed (or paved) roads, and strategic network planning. Training in these topics and best practice in rural road planning and engineering would help maximise the impact of any funds, and should be pursued in the continuation of this program. Discussions with DILG also revealed their efforts to promote greater allocation of funds to provincial and local government roads from nationally collected vehicle licence charges. An example technical formula for such was demonstrated, but could be extended to help inform a change in policy which is more equitable to rural communities and road users. AusAID is understood to be supportive of this, and are currently discussing a possible analytical and research study of 'Quality of service indicators for the delivery and management of local road services' with DILG.
9 Additionality in this context refers to a circumstance where additional output, over and above current output by a road
authority, is delivered as a result of grant support. This is based on the concept that grant should not be used as a substitute for local funds.

Final Report - Technical review & whole of life cycle cost analysis of the Philippines
Provincial Road Management Facility 005192-2
- 48 - July 2012
8 CONCLUSIONS AND RECOMMENDATIONS
8.1 Conclusions
i) Technical solutions
On the basis of the available evidence, the break even traffic for upgrading to concrete lies between a nominal AADT of 250 and 750 (including motorcycles), or a mean nominal AADT of 500, equivalent to an adjusted AADT of 225. This is reasonably consistent with international studies and local guidelines from DILG and DPWH. A framework for selecting a surfacing option has been defined, and selection should be tailored to specific locations and maintenance capacity. It should also take into account the risks associated with very high levels of rainfall, and the potential for very heavily loaded vehicles.
ii) Improved planning
A significant risk to sustainability exists because of the very substantial levels of generated traffic on a number of sections, of the order of 200% or more. For the sample of projects investigated, based on the 2008 traffic data, approximately 75% of the length of PRMF project roads meets the criteria for a gravel surface, whereas this figure drops to 60% using the 2011 traffic data. If the criterion for high rainfall is considered this number reduces further to approximately 25%. Future projects need to carefully evaluate future traffic, and consider this fully in planning, design and in assigning maintenance.
iii) Maximising program benefits and impact
There is a need to clarify program objectives for different roads, such as delivering reliable all weather basic access, minimising transport costs for the majority of users in the medium term or meeting strategic long term network needs. Solutions to these different strategic aims can differ, and will require detailed information on road conditions, transport needs of local communities and the role of different road links in the overall network. A comprehensive planning approach to this and the required funding needs should form part of the future program.
iv) Addressing funding constraints
Significant funding constraints exist overall, although there are a number of examples where the provinces are providing significant funds. Examples include a group of three provinces where the funding to maintenance is almost 15% of the total funding (per km of road) of the best resourced provinces. The backlog of works is also very high in a number of cases, and accounts for more than 50% of the total asset replacement value. Allocations from development funds also vary by a factor of 6 or more. These conditions will challenge the sustainability of the PRMF roads, and lead to a declining level of service and asset base. A case is needed to strengthen funding to roads in many provinces.

Final Report - Technical review & whole of life cycle cost analysis of the Philippines
Provincial Road Management Facility 005192-2
- 49 - July 2012
Whilst technical challenges can be overcome by a variety of means and accommodated in planning and design, low commitment and funding levels put gravel roads and maintenance in general at risk. This led to the following classification of risk across the different provinces:
Least at risk Intermediate Most at risk
,Bukidnon Agusan Del Sur, Bohol,
Guimaras
Misamis Occidental, Surigao,
Misamis Oriental
These constraints could be partly addressed through greater integration with Government programs in order to help maximise community and economic benefits by combining resources and promoting the mainstreaming of appropriate solutions.
The opportunity should also be taken to introduce alternative output based funding models. Similar such models have been applied previously by DILG, and should be promoted with qualification for grants dependent on meeting agreed eligibility criteria, and delivering improved transport outcomes.
8.2 Recommendations
Performance monitoring and demonstrations 8.2.1
This study is limited by the fact that it was a combination of a desk based exercise using the best knowledge available and limited field observations. The findings should therefore be used with an understanding of their origin, and taking note of the specific caveats with respect to the effect of gravel road maintenance and need to account for future traffic in selecting an appropriate road surface type. They would be considerably strengthened through a program of time-series observations over a minimum of two to three years and demonstration trials of alternative practices specifically to show the effectiveness of alternative surfacing options and maintenance techniques which are not widely practiced in the Philippines. These include surfacing options and maintenance treatments which have been shown to perform well in Vietnam, Cambodia and Laos under the UK DFID SEACAP (Kackada and Cook 2009).
Demonstration trials should involve gravel road maintenance and restoration techniques, and the use of alternative all-weather surfacings such as asphalt concrete on granular or cemented road bases, and sprayed bituminous seal coats on granular or cemented road bases and granular or penetration Macadam road bases. Some experience with these techniques already exists at a provincial level, and asphalt is widely used on National roads, but it is not widely applied to local roads. Local studies are examining this at a desk study level for national roads, and discussions were held with the University of the Philippines, but performance data is lacking. Consideration could also be given to the use of chemical additives to improve the performance of gravel roads, including waste products from the paper making industry, but this should be approached with caution because of the challenging performance environment and the cost of such treatments.
Furthermore, any future analysis should consider the contributions to Green House Gases and other environmental impacts of the different solutions, with this becoming an increasing concern both in the Philippines and worldwide.
Data collection 8.2.2
The review has demonstrated the importance of data in assessing needs and therefore costs, and determining current and future use. The areas deserving early attention include:

Final Report - Technical review & whole of life cycle cost analysis of the Philippines
Provincial Road Management Facility 005192-2
- 50 - July 2012
i) Determination of maintenance and improvement needs by applying appropriate field data collection techniques to identify (critical) locations requiring different levels of treatment with attention given to the selection of surfacing options, drainage and essential earthworks. A drive over (with frequent stopping) or walk over reconnaissance should be undertaken to inform treatment selection and design, rather than incurring significant design costs and then revising these following site visits. Procedures exist from various sources to inform these, e.g. Toole et al 2001, and could be used to augment or modify current procedures.
ii) Supplementing i) above with a mechanised ride quality method, and a GPS trace of the horizontal and vertical alignment. The former would help verify visual survey data, whereas the latter would help inform surfacing selection and planning estimates by providing geometry data and allowing a quantitative basis to terrain classification.
iii) Traffic survey procedures should be reviewed to help ensure reasonably reliable estimates of traffic numbers and composition, this being an issue for low volume roads where seasonal traffic movements and other effects lead to a high variation in traffic volumes. The approach to traffic surveys should also take account of current and potential road use as part of a comprehensive approach to assessing future demand.
Further technical analysis 8.2.3
The analysis performed for this study could be usefully extended in the following areas irrespective whether any performance monitoring or demonstrations proceeded:
i) Investigating and proposing suitable improvements to address the identified modelling constraints which affect the effectiveness of grading operations on hilly and mountainous terrain.
ii) Applying the results of i) in proposing surface maintenance strategies taking account of the available resources for maintaining the PRMF projects.
iii) Extending the analysis of project costs to include Year 2 projects, and developing a suitable basis for estimating project costs at a planning level.
iv) Undertaking a pilot assessment of introducing different access standards in one or two provinces.
v) Further technical analysis to strengthen the conclusions drawn from this study to aid their application, including a more comprehensive post evaluation which should include determining overall benefits of improved access.
vi) Consolidating technical recommendations and proposing revisions to the draft DILG guidelines on the maintenance of gravel roads.
Best practice in rural transport planning 8.2.4
It is evident that there is limited awareness of best practice in rural transport planning. Whereas DILG has been proactive in developing appropriate guidelines for design and maintenance, adding the planning dimension and associated social/economic aspects could considerably help mainstream appropriate standards. A best practice workshop program to support this is currently being considered by the ADB as part of its forthcoming Transport Forum. The event is likely to draw on earlier work under the UK DFID SEACAP and by the World Bank, and could potentially

Final Report - Technical review & whole of life cycle cost analysis of the Philippines
Provincial Road Management Facility 005192-2
- 51 - July 2012
draw on other recent studies including those for the AusAID sponsored Indonesia Infrastructure Initiative. The aim is to facilitate the establishment of an active network of rural transport practitioners within Asia, and provide a means of communicating best practice. Support to this initiative is recommended, with this being seen as a complement to DILG activities in developing a community of rural road practitioners within the Philippines
Funding models and standards
A specific study of funding needs, alternative output based funding models and revenue raising potential is necessary since the current shortage of funds is unlikely to be resolved by the current suite of solutions. The proposed study of 'Quality of service indicators for the delivery and management of local road services' would complement such work and its support is recommended.

Final Report - Technical review & whole of life cycle cost analysis of the Philippines
Provincial Road Management Facility 005192-2
- 52 - July 2012
REFERENCES
AASHTO 1972, AASHO interim guide for design of pavement structures, American Association of State Highway and Transportation Officials, Washington DC, USA
ATC 2010, National Guidelines on Transport System Management in Australia, Volume 3: Appraisal of initiatives, Australian Transport Council, Canberra, Australia
Austroads 2010, Guide to Pavement Technology, Part 2: pavement structural design, Austroads, Sydney, Australia
Jones, T E 1984, The Kenya road maintenance study: research on road deterioration, TRL Laboratory Report 1111, Transport Research Laboratory, Crowthorne, UK
Kackada H and Cook, J R 2009, Economic evaluation of low volume rural road upgrading, Project Record 019, South East Asia Community Access Programme, TRL, Crowthorne, United Kingdom
Kerali H R G and Odoki J B 2006, Overview of the HDM-4 System, Volume 1, The Highway Development and Management Series, International Study of Highway Development and Management (ISOHDM), Paris: World Road Association (PIARC), France
Lebo, J and Schelling D 2000, The design and evaluation of rural transport infrastructure, Technical Paper, The World Bank, Washington DC, USA
Robertson N and Toole T 2010, Provincial and Kabupaten Road maintenance Management Planning: Phase 1 report – Review of current practice and opportunities, Final Report Activity 176, Australia Indonesia Partnership, Indonesia Infrastructure Initiative (IndII), Indonesia, Jakarta, Indonesia
SADC 2003, SADC Guideline on low volume sealed roads, Southern Africa Transport Communications Commission, Gaborone, Botswana
Toole T, Morosiuk G, Petts R C and Done D, 2001, Management guidelines for unsealed roads, TRL project report PR/INT/230/00, Crowthorne, U K
Toole T and Rockliffe N, 2011, Review of Road Design Standards and Review of Procurement and Contracting: Life-cycle cost analysis, Part B - Results of maintenance and rehabilitation analysis and network wide budget analysis, Working Paper 3b Activity 201, Australia Indonesia Partnership, Indonesia Infrastructure Initiative (IndII), Indonesia, Jakarta, Indonesia
TRB 1992, Highway capacity manual, Transportation Research Board, Washington DC
Wood W G and Metschies G, 2006, Road Asset Management , Technical Assistance Consultant’s Report for the Asian Development Bank, Manilla, Philippines

Final Report - Technical review & whole of life cycle cost analysis of the Philippines
Provincial Road Management Facility 005192-2
- 53 - July 2012
APPENDIX A SITE INSPECTION NOTES - BOHOL PROVINCE
Site BOH101 Road: San Isidro – Catigbian via Cambiang Location: Caimbang village
• Section located within village of Caimbang
• Heavy rain during inspection
• Short grade section approx. 100m long
• Grade approx. 10%
• Channelling of water
• Signs of scouring
• Deep drain on low side, shallower on high side. Some minor blockages.
• Ride quality fair. Minimal rutting in wheel tracks
Short 100m grade at 10% through village
Water channelling during heavy rain
Deep drains on one side
Shallower and partially blocked on other side

Final Report - Technical review & whole of life cycle cost analysis of the Philippines
Provincial Road Management Facility 005192-2
- 54 - July 2012
Site BOH102 Road: San Isidro – Catigbian via Cambiang Location: Caimbang village
• Immediately adjacent to site BOH101 above.
• Flat section
• Surface appears in sound condition
• Ride quality good
• Large U concrete drain one side only
• Contractor advises surface is item 300 gravel
• Some ponding during visit indicating insufficient crown height
• Barangay captain comments;
o Better access to hospitals and farms
o Local community hep to clear vegetation from road edges
o Good community support for the PRMF program
o Has created jobs for locals, and easier to get to jobs
o Access and income from craft buyers has increased
o Property values have increased
o Three busses each week when previously none
o Overall the Captain is happy with the result
• Contractor is happy with the result achieved
Ponding due to low crown height
U shaped drains on one side with vegetation on shoulder

Final Report - Technical review & whole of life cycle cost analysis of the Philippines
Provincial Road Management Facility 005192-2
- 55 - July 2012
Site BOH103 Road: San Isidro – Catigbian via Cambiang Location: Station 3 + 220
• Very steep and sharp bend with culvert at one end of bend
• Unprotected culvert at bend
• 21% grade
• Soft edges on outside of bend
• Scouring down to natural rock surface underneath on steepest section
• Large, loose gravel is prevalent
• 6 accidents in 1 year since rehabilitation
• Most crashes occur as run-off to left coming down the grade
• Poor traction uphill demonstrated by vehicle passing during inspection
• Scheduled for conversion to concrete under PRMF
Unprotected culvert on bend
Soft edges
Loose gravel
Scouring down to base

Final Report - Technical review & whole of life cycle cost analysis of the Philippines
Provincial Road Management Facility 005192-2
- 56 - July 2012
Site BOH104 Road: San Isidro – Catigbian via Cambiang Location: Station 1 + 830
• Two culverts approx. 20m apart
• One culvert is new, the other was deemed too dangerous to remove due river flows
• 16% grade beyond 2nd culvert
• Both culverts unprotected
• Surface on flat in good condition
• Scouring on 16% grade section
• 16% grade section scheduled to be concreted under rectification
• River overtopped the road between the 2 culverts twice in 2011
16% grade beyond one of the culverts
Soft edges with steep shoulder and drop
Original culvert deemed too dangerous to replace
View of both culverts from the 16% grade

Final Report - Technical review & whole of life cycle cost analysis of the Philippines
Provincial Road Management Facility 005192-2
- 57 - July 2012
Site BOH105 Road: San Isidro – Catigbian via Cambiang Location: 500m from Catigbian
• Approx first 500m of this road from Catigbian excluded from PRMF because existing pavement is
concrete
• 20 year old concrete
• No maintenance undertaken in 20 years
• Poor condition
• Very badly cracked
• Collapsed in places
• Ponding in collapsed areas
• Drains non-existent
Collapsed sections of pavement
Severe cracking and ponding
Better section of the 20 year old concrete
Beginning of the section showing PRMF sign

Final Report - Technical review & whole of life cycle cost analysis of the Philippines
Provincial Road Management Facility 005192-2
- 58 - July 2012
Site BOH106 Road: Catigbian to Sagbayan Road Location: Approx 5km SW of Sagbayan
• Provincial non-PRMF road
• New in 2011
• Good concrete section
Start of new concrete Provincial funded road
New section on flat terrain
Interface between new section and older 2008 section

Final Report - Technical review & whole of life cycle cost analysis of the Philippines
Provincial Road Management Facility 005192-2
- 59 - July 2012
Site BOH107 Road: Catigbian to Sagbayan Road Location: Approx 5km SW of Sagbayan
• Provincial non-PRMF road
• Adjacent to site 6 above
• Built 2008
• One side of road is good
• Other side has embedded debris in concrete and small holes developing in surface
Holes appearing in 2008 concrete pavement
Embedded debris in same section
Quality appears different between the two sides of the 2008 pavement

Final Report - Technical review & whole of life cycle cost analysis of the Philippines
Provincial Road Management Facility 005192-2
- 60 - July 2012
Site BOH108 Road: Catigbian to Sagbayan Road Location: Approx 3km SW of Sagbayan
• Provincial non-PRMF road
• Cut from year 3 of PRMF
• Nominally gravel road, but gravel is mostly embedded leaving an earth surface
• Approx 7m wide but in poor condition
• Potholes
• Poor drainage
• Will be paved by Provincial government
Soft edges with poor drainage
Provincial grader on site

Final Report - Technical review & whole of life cycle cost analysis of the Philippines
Provincial Road Management Facility 005192-2
- 61 - July 2012
Site BOH109 Road: Catagbian Road to Canmano Year 3 PRMF road Location: Approx 3km west of Canmano
• Year 3 PRMF road
• Very rough
• Very deep ruts
• Poor drainage
• No gravel left
Original gravel surface embedded into earth
Serious rutting dominates
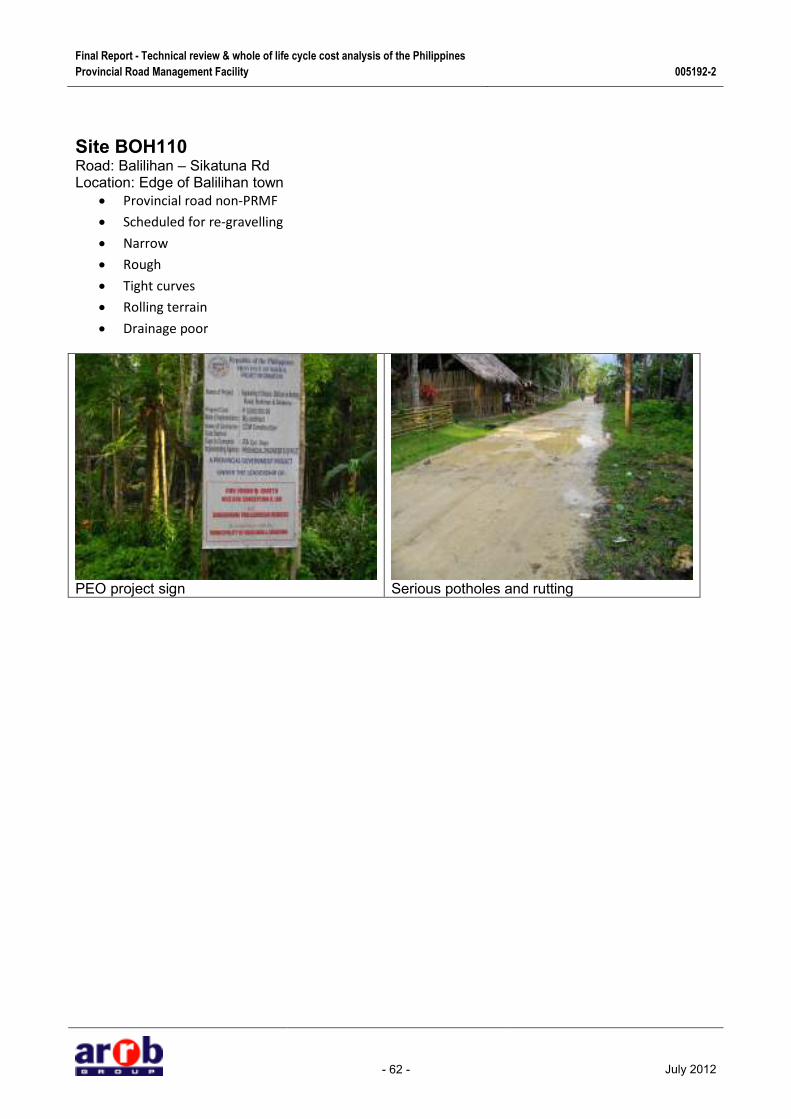
Final Report - Technical review & whole of life cycle cost analysis of the Philippines
Provincial Road Management Facility 005192-2
- 62 - July 2012
Site BOH110 Road: Balilihan – Sikatuna Rd Location: Edge of Balilihan town
• Provincial road non-PRMF
• Scheduled for re-gravelling
• Narrow
• Rough
• Tight curves
• Rolling terrain
• Drainage poor
PEO project sign
Serious potholes and rutting

Final Report - Technical review & whole of life cycle cost analysis of the Philippines
Provincial Road Management Facility 005192-2
- 63 - July 2012
Site BOH111 Road: Unknown Provincial road Location: Midway between Sikatuna and Alburquerque
• First Provincial road maintained by contract
• Contract is 1 year old
• Similar condition to site 10 above
• Very rough, probably greater than 10 IRI
• Drainage varies
Variable drainage conditions
Drainage blocked by debris and material displaced by grader

Final Report - Technical review & whole of life cycle cost analysis of the Philippines
Provincial Road Management Facility 005192-2
- 64 - July 2012
Site BOH112 Road: Unknown Provincial road Location: Next street to the east of E Alas Street off Tagbiliran East Road
• One of the few asphalt roads in Bohol
• 760m long
• Cost PhP3 million to construct
• 50mm thick
• Completed April 2010
• Carries approx. 20 trucks of at least 10 tonnes each per day
• Edge drop almost full depth of asphalt
• Located close to asphalt batching plant
• 4.5m wide
• Some patching evident
• Further patching required on failed sections
Large edge drop to shoulder
Uneven edges
Patching evident and failed sections

Final Report - Technical review & whole of life cycle cost analysis of the Philippines
Provincial Road Management Facility 005192-2
- 65 - July 2012
Site BOH113 Road: Old Provincial road Location: 400m east of Quezon Street junction
• Another of the few asphalt roads in Bohol
• Approx 5.5m wide
• Completed in 2011
• No edge drop
• 367m long
• 50mm thick
• Cost PhP3 million
• Overall looks better quality than site 12
Surface in good condition
No edge drop

Final Report - Technical review & whole of life cycle cost analysis of the Philippines
Provincial Road Management Facility 005192-2
- 66 - July 2012
Site BOH201 Road: Sagbayan to Danao National road Location: Approx 3km North of Sagbayan
• Formerly a gravel provincial road, now re-nationalised
• New concrete construction underway

Final Report - Technical review & whole of life cycle cost analysis of the Philippines
Provincial Road Management Facility 005192-2
- 67 - July 2012
Site BOH202 Road: Danao-Jct (LIR) – Mahayag Road Location: First 200m from southern or western end
• This part excluded from PRMF as it is nominally a concrete surface
• 200m long, 20 year old concrete that has had no maintenance
• Approx 8 % grade
• First few meters are ok, then gradually deteriorates further down the grade
• Concrete has deteriorated to loose gravel and many large stones
• Erosion between the more sound sections
• This section is beyond its useful life
• PRMF upgraded section starts immediately after this 200m length
Better part of section near top of hill, some cracking
Cracking increases in middle section
No drainage, vegetation to edge of surface
Surface disintegrated near bottom of hill

Final Report - Technical review & whole of life cycle cost analysis of the Philippines
Provincial Road Management Facility 005192-2
- 68 - July 2012
Site BOH203 Road: Danao-Jct (LIR) – Mahayag Road Packages 3A & 3B Location: Adjacent BOH201 above
• Gravel PRMF upgrade finished March 2011
• Condition variable. Some good areas, some needing attention
• Some large stones visible in base, indicating much of surface has been lost
• Potholes beginning to appear
• Defect rectification works have been flagged
• Large trapezoidal shaped drains are not popular with local communities. The 1.6m gap is too hard
to cross safely
• Later sections of this road have smaller U shaped drains instead
Interface between old deteriorated concrete and upgraded gravel surface
Shallow drains blocked with vegetation
Graded material blocking drainage from surface
Poor drainage against slope

Final Report - Technical review & whole of life cycle cost analysis of the Philippines
Provincial Road Management Facility 005192-2
- 69 - July 2012
Large stones in base protruding
Trapezoidal drains later discontinued

Final Report - Technical review & whole of life cycle cost analysis of the Philippines
Provincial Road Management Facility 005192-2
- 70 - July 2012
Site BOH204 Road: Danao-Jct (LIR) – Mahayag Road Packages 3A & 3B Location: Site of temporary deviation around river crossing
• Temporary deviation was washed away during a flash flood
• Concrete edge barriers added to bridge for safety reasons
• This section used U shaped concrete drains rather than the trapezoidal shape
• 300 spec gravel surface thrown to edge on uphill section past bridge. 150mm lost in 1 year
Potholes on culvert section
Safety barriers added to culvert
Site of temporary deviation
General view of culvert

Final Report - Technical review & whole of life cycle cost analysis of the Philippines
Provincial Road Management Facility 005192-2
- 71 - July 2012
Straight side U shaped drains adopted Large stones thrown to edge of roadway

Final Report - Technical review & whole of life cycle cost analysis of the Philippines
Provincial Road Management Facility 005192-2
- 72 - July 2012
Site BOH205 Road: Road: Danao-Jct (LIR) – Mahayag Road Packages 3A & 3B Location: Bridge works adjacent village
• Bridge not part of PRMF
• New road through village is in good condition, mostly flat
• Some vegetation in shoulders
• Comments from daughter of Barangay captain:
o Dust is less now than before when road was just earth
o Social and economic benefits
o Better access to schools, markets
o Regular buses when before there were none
Approaching Provincial bridge works
Improved road has generated heavier buses and trucks to route requiring bridge strengthening
Centre of the village, mostly flat, some vegetation in drains
Village buildings have generous setback from road, reducing any dust issues

Final Report - Technical review & whole of life cycle cost analysis of the Philippines
Provincial Road Management Facility 005192-2
- 73 - July 2012
Site BOH206 Road: Road: Road: Danao-Jct (LIR) – Mahayag Road Packages 3C & 3D Location: 6km + 000
• Boundary of second contract, different contractor
• U drains with small concrete braces to stop collapse. Not in contract bud added by contractor
• Guard rails needed in many places
• Curvy rolling terrain
• Shape of road looks good with visible crown height
• Drains look shallow in many places
• Large stones visible in surface, gravel thrown to edges
• Some water channelling visible
Cross braces on U shaped drains
Little surface material remains, guard rails needed due to steep drop at edge
Shallow drains with few turn outs
Most of surface material thrown to side of road on bends

Final Report - Technical review & whole of life cycle cost analysis of the Philippines
Provincial Road Management Facility 005192-2
- 74 - July 2012
Site BOH207 Road: Road: Road: Danao-Jct (LIR) – Mahayag Road Packages 3C & 3D Location: 9km + 656
• Sharp bend on curvy but flat section
• Traffic cuts corner very close to inside culvert. Vibration has caused cracks in concrete and rock
retaining wall around culvert structure
• Initial repairs with epoxy have also cracked
• Further rectification works planned
• Surface on bend is very wide, approx. 8 meters, outside of bend is not used by traffic
• Ample space to install guard rail on inside of bend to keep traffic away from retaining wall
Cracks in retaining wall due to vibration
Vehicles cut very close to top of retaining wall
Enough space to add guard rail near retaining wall to force traffic towards outside of bend
Base exposed on inside of bend, unused surface on outside line

Final Report - Technical review & whole of life cycle cost analysis of the Philippines
Provincial Road Management Facility 005192-2
- 75 - July 2012
Site BOH208 Road: Road: Road: Danao-Jct (LIR) – Mahayag Road Location: First 400m of road at eastern end
• Not part of PRMF
• Concrete built in 2005
• Generally good condition
• Deep grooving
• Some cracks showing
Some cracking evident in the grooved surface
Shoulder are used for crop drying

Final Report - Technical review & whole of life cycle cost analysis of the Philippines
Provincial Road Management Facility 005192-2
- 76 - July 2012
APPENDIX B SITE INSPECTION NOTES - MISAMIS ORIENTAL PROVINCE
Site MOR101 Road: Laguindingan - Lourdes - Kalabaylabay Location: Barangay poblacion laguindingan at junction Butuan – Cagayan de Oro road
• Non-PRMF provincial road passing through town area
• Concrete constructed 2005, 600m length
• Start of road at intersection with national road
• Significant cracking and failures
• Sand and base material poor quality
• Contractor paid only 50%
• Problems became evident just 1 month after completion. First time such failure has occurred in
MOR
Some cracks through town area
Holes appearing in surface
Condition worsens, large failure areas
One side of road carries most of the damage

Final Report - Technical review & whole of life cycle cost analysis of the Philippines
Provincial Road Management Facility 005192-2
- 77 - July 2012
Site MOR102 Road: Laguindingan - Lourdes - Kalabaylabay Location: Barangay poblacion laguindingan
• Non-PRMF provincial road beyond main town area
• Gravel section continuation of MOR101 above
• Currently under maintenance. Stockpiles of mountain gravel on roadside
• Quarry is located 10km from site
• Stockpile gravel not graded, includes very large stones
• Stockpiled gravel is used for surfacing. Largest of stones are removed by contractor before and
during maintenance
• Last maintenance 2 years ago
• Very rough ride quality, 8-10 IRI
• Drains poor
Large ruts adjacent stockpiles. No drains on left
Best surface in this section
Shallow drains on right side hindered by material build up at edge
Large stone size in quarry gravel

Final Report - Technical review & whole of life cycle cost analysis of the Philippines
Provincial Road Management Facility 005192-2
- 78 - July 2012
Site MOR103 Road: Laguindingan - Lourdes - Kalabaylabay Location: Barangay Lapad
• Non-PRMF provincial road beyond main town area
• New concrete section under construction by province
• 150mm x 5m wide concrete used for low volume road
• 400m long costing P2 million
• No apparent provision for drainage at this time
New 150mm concrete section
One side of concrete completed
Visible voids along longitudinal edge
Road junction immediately beyond new concrete section

Final Report - Technical review & whole of life cycle cost analysis of the Philippines
Provincial Road Management Facility 005192-2
- 79 - July 2012
Site MOR104 Road: Opol – Awang Location: Barangay Poblacion Opol
• PRMF year 1 project. Still within 1 year defect liability period
• Completed April 2011
• Item 301 gravel used for surface, but very little remains
• Large stones visible in surface. Either original surface material not up to specification or base
material is now the surface
• Contractor claims defect liability applies only to structure, culverts and PCP only, not surface.
Considered wear and tear
• Very shallow drains, blocked by vegetation in parts
• Slope very close to road edge in places
• Moderate ride quality 6-7 IRI
Most of surface material gone, large stones visible
Shallow drainage
Steep slope almost at road edge
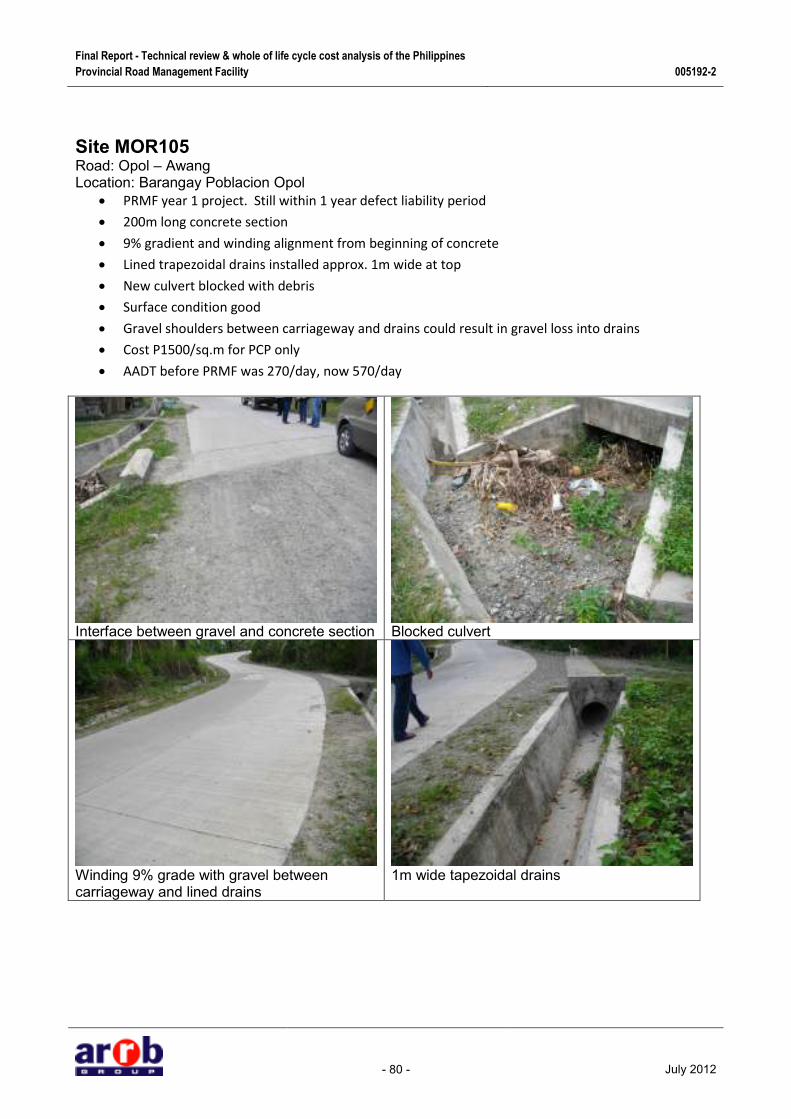
Final Report - Technical review & whole of life cycle cost analysis of the Philippines
Provincial Road Management Facility 005192-2
- 80 - July 2012
Site MOR105 Road: Opol – Awang Location: Barangay Poblacion Opol
• PRMF year 1 project. Still within 1 year defect liability period
• 200m long concrete section
• 9% gradient and winding alignment from beginning of concrete
• Lined trapezoidal drains installed approx. 1m wide at top
• New culvert blocked with debris
• Surface condition good
• Gravel shoulders between carriageway and drains could result in gravel loss into drains
• Cost P1500/sq.m for PCP only
• AADT before PRMF was 270/day, now 570/day
Interface between gravel and concrete section
Blocked culvert
Winding 9% grade with gravel between carriageway and lined drains
1m wide tapezoidal drains
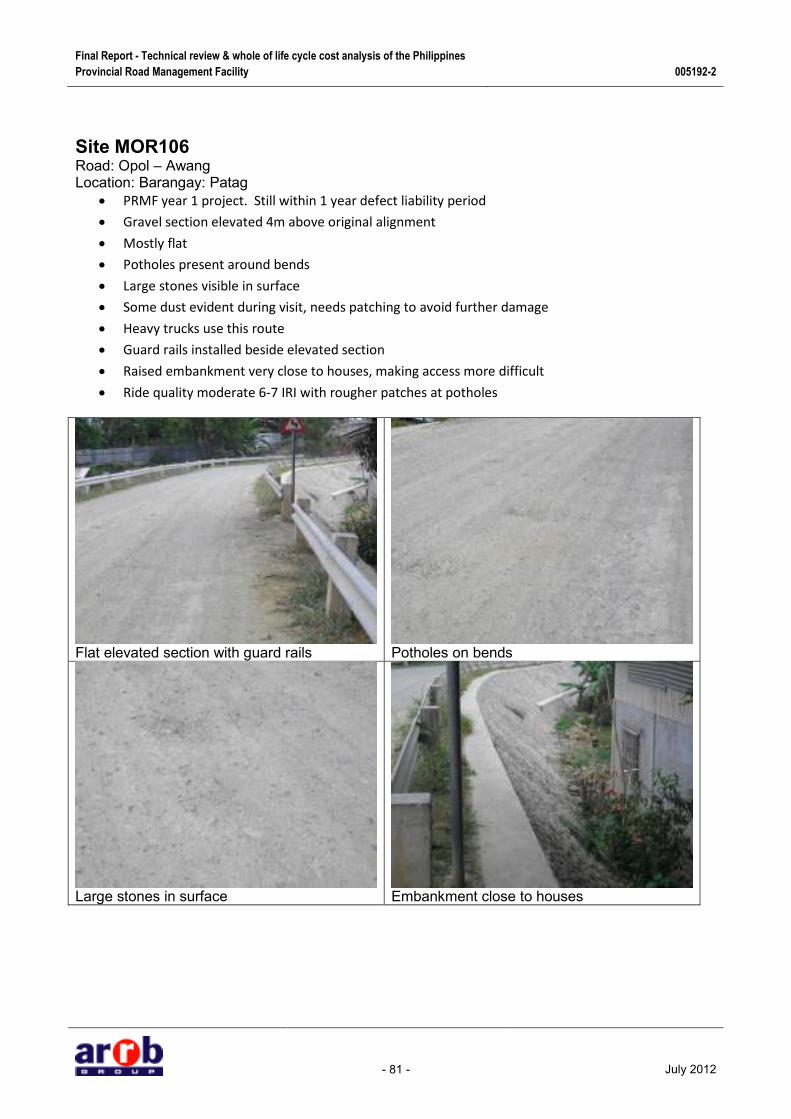
Final Report - Technical review & whole of life cycle cost analysis of the Philippines
Provincial Road Management Facility 005192-2
- 81 - July 2012
Site MOR106 Road: Opol – Awang Location: Barangay: Patag
• PRMF year 1 project. Still within 1 year defect liability period
• Gravel section elevated 4m above original alignment
• Mostly flat
• Potholes present around bends
• Large stones visible in surface
• Some dust evident during visit, needs patching to avoid further damage
• Heavy trucks use this route
• Guard rails installed beside elevated section
• Raised embankment very close to houses, making access more difficult
• Ride quality moderate 6-7 IRI with rougher patches at potholes
Flat elevated section with guard rails
Potholes on bends
Large stones in surface
Embankment close to houses

Final Report - Technical review & whole of life cycle cost analysis of the Philippines
Provincial Road Management Facility 005192-2
- 82 - July 2012
Site MOR107 Road: Opol – Awang Location: Barangay Patag in village
• PRMF year 1 project. Still within 1 year defect liability period
• Wide gravel section through village
• Gravel right to edge of lined drains
• Large stones present, reasonable surface and ride quality
• Drains could be a hazard for vehicles falling off edge of carriageway
• Barangay chairman comments
o Travel time saving to get goods and craft to market
o Less dust than previous road surface
o More heavy trucks causing some vibration
o Regular Jeepney service now 5 per week, previously none
o Chairman is happy with drainage treatment
o School children can now attend school during rainy periods where previously they were
often unable to travel due to road impassability
o Decrease in mother/infant mortality during childbirth. Zero since upgrade, previously
several each year
o Better access to farms, some 80km away
o Chairman prefers longer gravel treatment compared to option of shorter length of concrete
o Barangay ‘Roadwatch’ monitoring group help to keep drains clear and report more serious
problems
Upgraded gravel road through village with lined drains at edge of carriageway
Reasonable surface with some large stones. Most of original surface lost

Final Report - Technical review & whole of life cycle cost analysis of the Philippines
Provincial Road Management Facility 005192-2
- 83 - July 2012
Site MOR108 Road: Opol – Awang Road Location: Barangay Patag . Site of landslip
• PRMF year 1 project. Still within 1 year defect liability period
• Landslip occurred Jan-Feb 2011 after continuous heavy rain
• Possibly a spring under road
• Culvert is not at lowest point of the road. Current culvert simply replaced old one at same location
• Capacity of culvert looks inadequate
• New culvert to be installed further down at lowest point
• Scouring on grades approaching landslip and culvert
• Very rough ride 8-9 IRI, very large stones visible
Site of landslip on low side of road
Culvert is too far from low point on road
Culvert capacity may be inadequate
Repairs are still to take place

Final Report - Technical review & whole of life cycle cost analysis of the Philippines
Provincial Road Management Facility 005192-2
- 84 - July 2012
Site MOR109 Road: Opol – Awang Location: Barangay Patag
• PRMF year 1 project. Still within 1 year defect liability period
• Last gravel section of this package
• Gravel surface completely lost.
• Many very large stones present
• Frequent potholes
• Lined drains used in places
• Gravel and vegetation in drains
• Very rough ride quality 8-10 IRI
Large stones and potholes
Interface with concrete section
Generally rough surface
U shaped drains with debris and vegetation

Final Report - Technical review & whole of life cycle cost analysis of the Philippines
Provincial Road Management Facility 005192-2
- 85 - July 2012
Site MOR110 Road: Opol – Awang Location: Barangay: Patag
• PRMF year 1 project. Still within 1 year defect liability period
• Last concrete section
• Serious erosion at bottom of grade adjacent beginning of concrete
• Lined drains blocked at end and turn sharply. Likely that water overtops the drains to cause erosion
• Some epoxy repairs to concrete have occurred during defect period
Erosion at bottom of grade
End of drain blocked, probably overtopped
Epoxy repairs to cracks
New embankment wall near top of 200m section

Final Report - Technical review & whole of life cycle cost analysis of the Philippines
Provincial Road Management Facility 005192-2
- 86 - July 2012
APPENDIX C SITE INSPECTION NOTES - BUKIDNON PROVINCE
Site BUK101 Road: Bagontaas-Lurugan Rd Location: Close to Sayre Hwy junction
• Non-PRMF Provincial maintained road
• 1.2km of Asphalt
• 6m wide, 2 x 50mm asphalt laid at time of construction
• Built in 2000
• Raining at time of visit
• Water flowing over part of road, both sides
• Shallow open drains, probably partially blocked
• Ride quality good, surface in good condition
• Maintenance budget includes drainage channels
• Vegetation to edge in places
• Shoulder width variable
Good condition asphalt surface
50-100mm edge drop
Shallow or no drainage
Water flows across full width of shoulders

Final Report - Technical review & whole of life cycle cost analysis of the Philippines
Provincial Road Management Facility 005192-2
- 87 - July 2012
Water across road after moderate rainfall
Variable width shoulders and vegetation
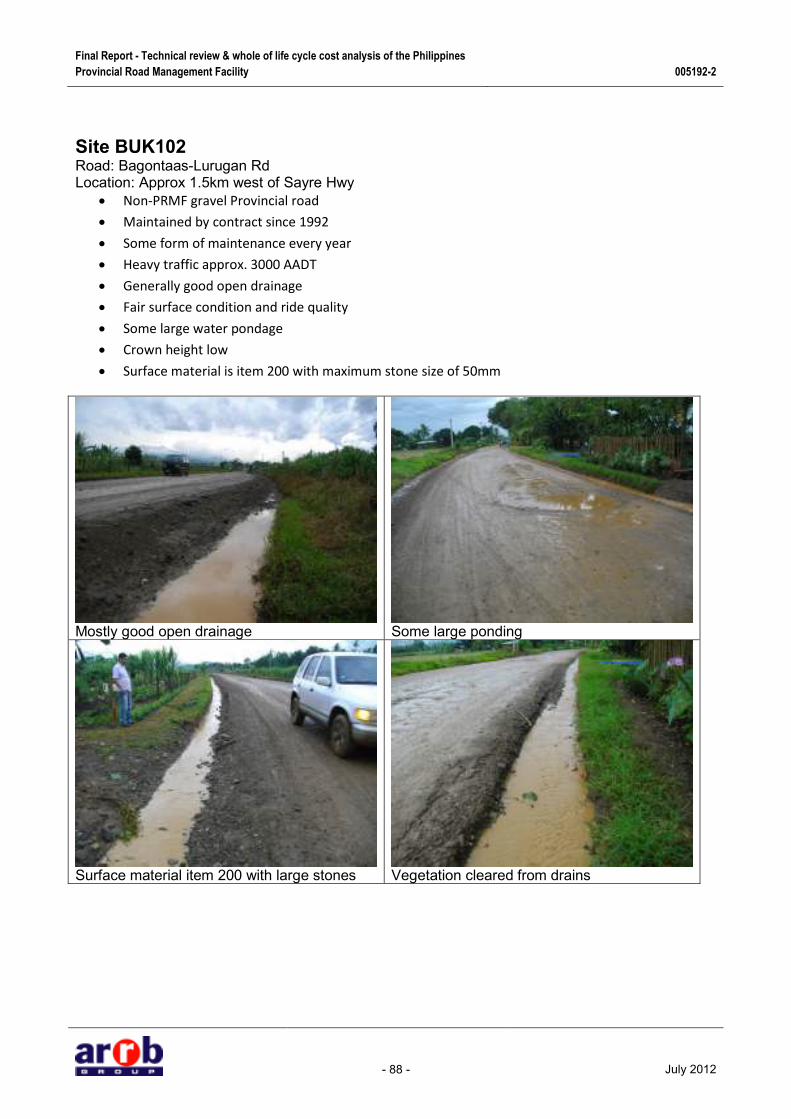
Final Report - Technical review & whole of life cycle cost analysis of the Philippines
Provincial Road Management Facility 005192-2
- 88 - July 2012
Site BUK102 Road: Bagontaas-Lurugan Rd Location: Approx 1.5km west of Sayre Hwy
• Non-PRMF gravel Provincial road
• Maintained by contract since 1992
• Some form of maintenance every year
• Heavy traffic approx. 3000 AADT
• Generally good open drainage
• Fair surface condition and ride quality
• Some large water pondage
• Crown height low
• Surface material is item 200 with maximum stone size of 50mm
Mostly good open drainage
Some large ponding
Surface material item 200 with large stones
Vegetation cleared from drains

Final Report - Technical review & whole of life cycle cost analysis of the Philippines
Provincial Road Management Facility 005192-2
- 89 - July 2012
Low crown height
Poorer drainage in places

Final Report - Technical review & whole of life cycle cost analysis of the Philippines
Provincial Road Management Facility 005192-2
- 90 - July 2012
Site BUK103 Road: Sayre Hwy Location: Near Old Sayre Hwy junction
• National road under reconstruction
• Example of concrete construction method
Newly finished concrete
Concrete laying equipment

Final Report - Technical review & whole of life cycle cost analysis of the Philippines
Provincial Road Management Facility 005192-2
- 91 - July 2012
Site BUK104 Road: Kalabugao Road Location: Between Sayre Hwy and river crossing
• Non-PRMF section
• Narrow, steep and winding concrete constructed 1996
• Steel deck bridge constructed 1997
• Surface in good condition
Steep approach to a Bailey bridge
Interface between concrete and steel deck
Tight bends on steep grade
Wide steel Bailey built 1997

Final Report - Technical review & whole of life cycle cost analysis of the Philippines
Provincial Road Management Facility 005192-2
- 92 - July 2012
Steep terrain surrounding road and river Concrete surface in generally good condition
Site BUK105 Road: Kalabugao Road Location: Approx 500m past bridge
• Year 3 PRMF section, not yet rehabilitated
• 8 to 10% grade
• Bad ride quality, very rough
• Large boulders and rock visible in surface
• No defined drainage
• Very deep ruts and holes
• Serious erosion, rock subgrade exposed
• Typical of entire road before PRMF
Deep ruts
Scouring and erosion
Rock subgrade visible
No effective drainage

Final Report - Technical review & whole of life cycle cost analysis of the Philippines
Provincial Road Management Facility 005192-2
- 93 - July 2012
Site BUK106 Road: Kalabugao Road
• Location: Approx 4km from Sayre Hwy junctionYear 3 PRMF section, not yet rehabilitated
• Approx. 6% grade through village
• Very rough surface
• Large rocks visible
• Poor drainage condition for most of section
Large loose rocks present
Ineffective drainage
Rock subgrade visible
No effective drainage
Wheel tracks show many large stones
Housing close to roadway

Final Report - Technical review & whole of life cycle cost analysis of the Philippines
Provincial Road Management Facility 005192-2
- 94 - July 2012
Site BUK107 Road: Kalabugao Road Location: Start of year 1 PRMF section approx 4km from Sayre Hwy junction
• Approaching second village
• Item 300 specification mountain quarry surface material used
• Completed under PRMF July 2011
• Almost flat profile, needs higher crown
• Tyre tracks very visible but not rutted
• Surface material still visible between tyre tracks
• Guard rails present, but end treatments not ideal
• Trapezoidal and U shaped lined drains installed. Drain lips higher than surface in places
Guard rail end treatments not ideal
Drain lip higher than current road surface
Large stones in base layer visible in wheel tracks
Surface material still present at edge of road

Final Report - Technical review & whole of life cycle cost analysis of the Philippines
Provincial Road Management Facility 005192-2
- 95 - July 2012
Trapezoidal drains
Describe photo
U shaped straight sided drains
Surface material thrown to outside of bend
Transition from lined to unlined drain

Final Report - Technical review & whole of life cycle cost analysis of the Philippines
Provincial Road Management Facility 005192-2
- 96 - July 2012
Site BUK108 Road: Kalabugao Road Location: Land slip site beyond second village
• Item 300 specification mountain quarry surface material used
• Completed under PRMF July 2011
• Very large boulders from land slip at edge of road
• Larger rocks still in danger of falling
• Ride quality is fair to good
• Some large stones in surface, but little rutting
• Considerable material testing done to get plasticity and CBR right
• Testing done by contractor
Remnants of land slip
Large boulders beside road
Further land slips likely
Large stones loose and embedded in surface

Final Report - Technical review & whole of life cycle cost analysis of the Philippines
Provincial Road Management Facility 005192-2
- 97 - July 2012
Site BUK109 Road: Kalabugao Road Location: Beyond land slip site
• Part of package D of PRMF rehabilitation
• Steep grade > 10% on tight bend
• Completed January 2011
• Some rutting visible
• Large rocks in surface
• Scouring and erosion
• Vegetation growing in less used surface near drains
Large rocks in surface
Erosion near inside bend
Steep grade and tight bend combination
U shaped drains and gravel at road edge

Final Report - Technical review & whole of life cycle cost analysis of the Philippines
Provincial Road Management Facility 005192-2
- 98 - July 2012
APPENDIX D SITE INSPECTION NOTES – MISAMIS OCCIDENTAL PROVINCE
Site MOC03 Road: ALORAN- MAULAR-MONTERICO ROAD, Location: Aloran, Weather: Dry
• Section runs from close to National road inland on slightly inclined, rolling terrain
• It connects a number of Barangays, and terminates in production area, i.e. it does not connect
municipalities
• Gravel (stone) surface with extensive lengths of lined (square section) drains and unlined earth
drains (50:50)
• Badly damaged earth road ahead, with low crown height and bathtub shape and some boulders
placed to improve passability
• Passability maintained through reshaping at 1 – 2 year intervals, but unlikely to work in wet
conditions (need for a minimum of an all-weather gravel surface)
Original earth road ahead of MOC3 showing poor cross section and shape, with very poor access conditions in the wet
Improved section of MOC3 looking east towards origin in Aloran

Final Report - Technical review & whole of life cycle cost analysis of the Philippines
Provincial Road Management Facility 005192-2
- 99 - July 2012
Site: Farm to Market road (near MOC3) Road: VV., Location: Aloran, Weather: Dry
• Provincial road improved with input by
Department of Agriculture and Barangay
• Concrete road for first km from National
road, then gravel road
• Mostly with unlined earth drains
• Concrete would benefit with wider cross
section and lined drains through village
areas
• Fair condition but with classic low
camber

Final Report - Technical review & whole of life cycle cost analysis of the Philippines
Provincial Road Management Facility 005192-2
- 100 - July 2012
Site MOC01 Road: BALIANGAO-LUMIPAC-MABINI-PUNTA SULONG ROAD, Location: Baliangao, Weather: Dry/Raining
• Section is accessed from National road via a provincial gravel road built and maintained by PEO
which is in fair condition, but with no substantial culverts. This causes difficulty and has limited use
by heavy vehicles leading to longer haul for construction traffic on MOC01
• PRMF road heads east and west from junction near village of Mabini in flat/rolling terrain
• Road in reasonable condition but like others suffers through high proportion of oversize, and low
fines
• Camber too flat and ruts forming at edge of shoulder – requires better shape with finer material
• Mix of lined and unlined drains
• Lack of formal traffic signs, particularly near villages
• Speed limits important if gravel loss to be reduced
o Junction at Tuloc includes an Earth track going east (Provincial road), Concrete going south
through village, and Earth (formed) to quarry (done by PEO)
Example of prior condition of earth road leading from Tuloc
Shaped earth road used as haul route from PEO quarry
MOC01 looking towards Mabina at end of project
MOC01 midway towards Mabina showing flat camber under wet conditions

Final Report - Technical review & whole of life cycle cost analysis of the Philippines
Provincial Road Management Facility 005192-2
- 101 - July 2012
APPENDIX E SITE INSPECTION NOTES – ARGUSAN DEL SUR PROVINCE
Site ADS01 (1a and 1b) and Year 2 locations Road: Pisaan – Borbon Road, Location: San Francisco, Weather: Dry
• Section runs from National road across flat/rolling slightly raised terrain and flood prone areas.
• Connects two municipalities
• Gravel (stone) surface with short lengths of lined drains through housing and in cuttings. Smaller
cross section than usual.
• Earth drains almost non-existent with mounds from grubbing at outer edge.
• Badly damaged gravel road ahead, with major failed areas.
• Regular maintenance still not implemented on Year 1 project, with two bid failures so far.
Barangays not taking up maintenance except through villages (near Council Hall).
• Solution for Year 2 includes 1 metre high embankment with rip rap on sides and concrete
pavement (PCCP). Funding from incentive funds.
• PEO improving Year 1 area on bridge approaches with reinstated gravel and PCCP.
Year 2 area ahead of ADS 01 showing badly detriorated road (gravel remaining) but with crater sized failures in flood prone area
Further example of area subject to Year 2 repairs and improvement to be constructed with limestone embankment, rip rap and PCCP.
Year 1 gravel road leading to river crossing showing rough oversize gravle surface damaging by traffic and through flooding
Moderate condition but stoney Year 1 surface (now > 16 months old). No maintenance being undertaken.

Final Report - Technical review & whole of life cycle cost analysis of the Philippines
Provincial Road Management Facility 005192-2
- 102 - July 2012
ADS01 Year 1 showing gravel road in moderate condition and blocked drains. No maintenance initiated
ADS01 Year 1 showing blocked drains. No maintenance initiated.
Condition adjacent to Barangay Hall on ADS01 Year 1 – this is what can hppen with maintenance
Condition adjacent to Barangay Hall on ADS01 Year 1 – with maintenance

Final Report - Technical review & whole of life cycle cost analysis of the Philippines
Provincial Road Management Facility 005192-2
- 103 - July 2012
Site PEO Road at Parin-Ay Road: Parin-Ay, Location: Parin-Ay, Weather: Dry
• Concrete pavement for 500m funded by PG, with gravel road beyond to Barangays, and link to San Francisco (ADS01), although bridge is inadequate for other than pedestrians and habel-habel.
• PEO MBA maintaining road with spot regravelling and machine grading, culverts and routine works. Area is flood prone with overtopping of road by 1 m and overtopping of suspension bridge (pedestrians and motorcyles only) on main river.
Timber bridge at termination of provincial road Timber deck and inside, all good condition
Suspension bridge at Village by major river, with boards missing but useful for pedestrians and motorcycles. No road at other end.
Oblique view of suspension bridge

Final Report - Technical review & whole of life cycle cost analysis of the Philippines
Provincial Road Management Facility 005192-2
- 104 - July 2012
Passable gravel road in flood prone area Culvert and watercourse in flood prone area
View of gravel road in flood area Oversize material approximately 30 – 40 cm
Gravel section on ridge near Barangap centre – well formed and good
Concrete pavement at Parin-Ay

Final Report - Technical review & whole of life cycle cost analysis of the Philippines
Provincial Road Management Facility 005192-2
- 105 - July 2012
Site ADS02 (2a and 2b) at NRJ Crossing – Luna Duangan (PRMF road) and PEO activities Road: NRJ Crossing – Luna Duangan, Location: Various, Weather: Dry
• PRMF gravel road, open 16 months. Previously condition extremely bad.
• Fair – good performance, with good shape.
• MBA is being applied towards Guadalope and other Barangays with team doing spot regravelling and grading. Biggest weakness is lack of drainage canals and culverts.
Well shaped gravel road Even the ducks are happy!
Good conditions in village with no canals New Bailey bridge (2006)

Final Report - Technical review & whole of life cycle cost analysis of the Philippines
Provincial Road Management Facility 005192-2
- 106 - July 2012
PEO MBA team spot regravelling/reshape PEO MBA team spot regravelling/reshape
MBA team with excess boulders and coarse gravel, on black clay soil
Partly completed work with good shape, but lacking continuous drainage and culverts


![[T6] ARRB Introduction to Road Safety Audit Training - Day 2](https://static.fdocuments.us/doc/165x107/577ce4221a28abf1038dc6c7/t6-arrb-introduction-to-road-safety-audit-training-day-2.jpg)