- Brake Professional Work-related road risk: some thoughts on how and why to manage it well Dr Shaun...
43
www.trl.co.uk Work-related road risk: some thoughts on how and why to manage it well Dr Shaun Helman – Head of Transport Psychology – TRL
Transcript of - Brake Professional Work-related road risk: some thoughts on how and why to manage it well Dr Shaun...

www.trl.co.uk
Work-related road risk: some thoughts on how and why to manage it well
Dr Shaun Helman – Head of Transport Psychology – TRL

The scale of work-related road risk in GB
‘Good practice’
WRRS and H&S
Evidence-based interventions
Conclusions 5
1
3
2
4

The scale of work-related road risk in GB
‘Good practice’
WRRS and H&S
Evidence-based interventions
Conclusions 5
1
3
2
4

Health and Safety Executive (HSE) estimated 30% of road deaths involve someone at work (1999 data)
Work-related Road Safety Task Group (WRSTG) estimated 25% road accidents involve someone at work (c2000)
Scale of the problem
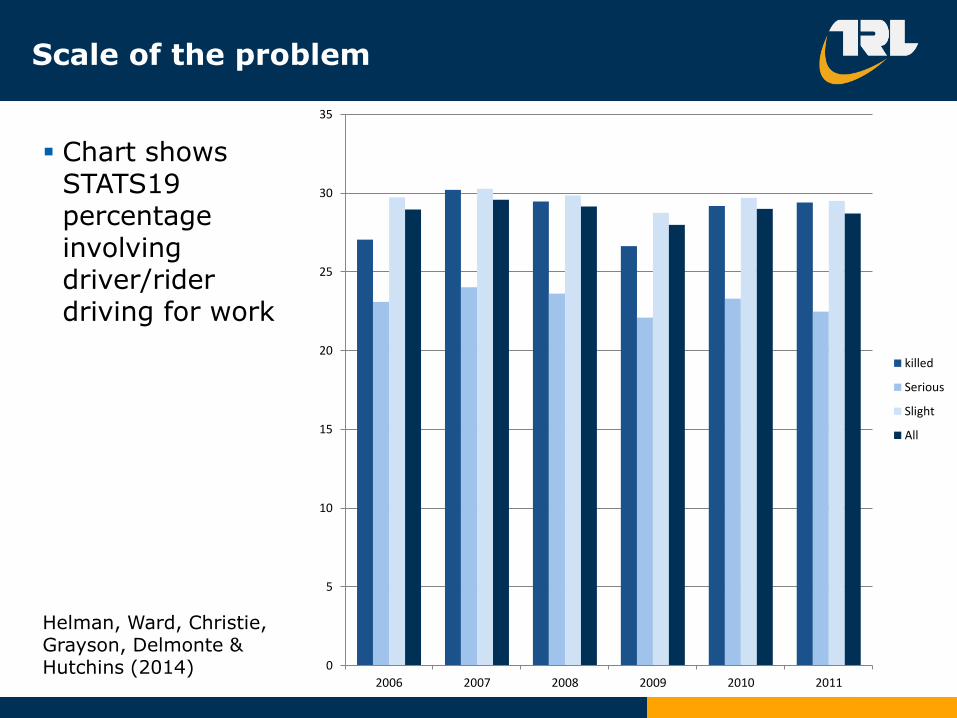
Chart shows STATS19 percentage involving driver/rider driving for work
Helman, Ward, Christie, Grayson, Delmonte & Hutchins (2014)
0
5
10
15
20
25
30
35
2006 2007 2008 2009 2010 2011
killed
Serious
Slight
All
Scale of the problem

This is the minimum – around ¾ of non-commercial vehicles have journey purpose listed as ‘unknown’ in latest data
Delmonte (2015)
Scale of the problem

It is not just the at-work driver or their passenger who is injured
It is mostly other casualties either in other vehicles or vulnerable road users
Helman et al. (2014)
0
10
20
30
40
50
60
70
80
fatal serious slight all severities
Driver/rider driving for work
Passengers of drivers driving forwork
Other casualties in collisionswhere a driver was driving forwork
Who is injured?

The scale of work-related road risk in GB
‘Good practice’
WRRS and H&S
Evidence-based interventions
Conclusions 5
1
3
2
4

Roads, H&S, and other modes

A recent inquiry into UK transport safety found that “the level of risk we face on the roads would not be tolerated in aviation, railways or…the workplace.”
PACTS (2015, p.7)
An imbalance

There is no regulator and no investigator
There is not always a requirement to demonstrate competence
Driving for work is still not perceived as risky
It is not managed as well as H&S
There are fewer reporting requirements
Data on journey purpose is poor
Public awareness and data are low
Despite the risk/injury burden of WRRR…
Delmonte (2015)

Research by the HSE shows that a company can realise a number of benefits by managing work-related road safety, no matter the company size
Benefits include:
- Fewer days lost due to injury
-Reduced work-related illness
-Reduced stress and improved morale
- Lower insurance premiums
- Fewer vehicles off the road for repair
But there are still benefits to managing WRRR!

The scale of work-related road risk in GB
‘Good practice’
WRRS and H&S
Evidence-based interventions
Conclusions 5
1
3
2
4

You need data!
Ideally good data!
“You cannot manage what you don’t measure”
(attributed to, but probably not said by, William Edwards Deming)
Data

Incidents and near misses
Exposure data
- Mileage
- Additional information such as time of day, road types, number of trips
Data (ideally by vehicle and driver)
Other data on drivers
- Demographics/driving experience (novices?)
- Behaviour even if just simple things like speed choice, and seat-belt use
- Attitudes (e.g. from surveys)

Example of how not to do it…

Leadership is needed right at the top, and through the middle layers of management
- If the CEO is not ‘bought in’ then nothing happens
- Divisional and line managers can also be a failure point
Note – leadership is necessary, but not sufficient by itself
Leadership

The basic risks
Driving for work is more likely to involve:
- High mileage
- Fatigue/sleepiness
- Distraction
- Time pressure
Salminen and Lähdeniemi (2007), Robb et al. (2008), Fort et al. (2010), Broughton et al. (2003)

There are often risk factors specific to individual sectors or companies
- Interactions with VRUs
- Staff as VRUs
The basic risks

LOADS of guidance out there, but Helman et al. (2014) found a lack of awareness/use of this
Guidance

Best place to start…
- http://www.hse.gov.uk/pubns/indg382.pdf
Best place to start?

Fleet Safety Benchmarking Project
-Benchmarking tool hosted at various sites:
fleetsafetybenchmarking.net
Will permit mechanism to compare processes and performance – good practice and resources
Benchmarking

Based on Helman et al. (2012)
- Collect data
- Have management system based on ‘plan-do-check-act’
- Simple ‘baseline’ good practice (licence checks, induction, seat belts)
- Measures to reduce driving per se
- Measures to reduce driving during highest risk periods related to sleepiness (2-6am, 2-4pm)
- Measures to reduce driving while distracted
- Measures to reduce driving while under time pressure
- Measures focused on specific risk factors for a given sector or business
TRL recommended ‘good practice’

The scale of work-related road risk in GB
‘Good practice’
WRRS and H&S
Evidence-based interventions
Conclusions 5
1
3
2
4

Evidence?

Evidence!
Glad (1988)

Probably the most successful intervention (GDL) which works largely through STOPPING PEOPLE DRIVING in the highest risk group we know of (young novice drivers) tends to achieve perhaps a 20-40% reduction in crashes
How then are we to interpret claims such as:
“Our system/product/service has shown collision reductions of 80% in
businesses that use it”*
How big a claim shall we make?

TRL focuses its WRRS interventions in the following areas
- TRL recommended good practice
-Hazard Perception training
-Behaviour change techniques
-Specific areas of expertise (in-car training, roadside working training)
TRL’s approach

Based on Helman et al. (2012)
- Collect data
- Have management system based on ‘plan-do-check-act’
- Simple ‘baseline’ good practice (licence checks, induction, seat belts)
- Measures to reduce driving per se
- Measures to reduce driving during highest risk periods related to sleepiness (2-6am, 2-4pm)
- Measures to reduce driving while distracted
- Measures to reduce driving while under time pressure
- Measures focused on specific risk factors for a given sector or business
TRL recommended ‘good practice’

Evans (1991; 2008)
- Driver performance (what the driver CAN do)
- Driver behaviour (what the driver DOES do)
In ‘normal driving’ driver behaviour seems to be more important than driver performance in determining risk
Is hazard perception the exception?
Hazard perception training

Hazard perception…
-…discriminates between high- and low-risk groups (e.g. inexperienced and experienced drivers)
-…is related to collision risk
-…can be trained
McKenna and Horswill (1999), McKenna and Crick (1994), Maycock, Lockwood and Lester (1991), Wells, Tong, Sexton, Grayson and Jones (2008), Hull and Christie (1993), Quimby, Maycock, Carter, Dixon and Wall (1986), Crick and McKenna (1991).
Hazard perception training

These principles used by TRL to design HP test in GB
Wells et al. (2008) show test has reduced crashes in novice drivers (around 11% overall for on-road non-low-speed crashes)
Higher performance on video hazard perception test is associated with lower crash risk in GB and in Australia
Wells et al. (2008), Boufous, Ivers, Senserrick and Stevenson (2011)
Hazard perception training

Behaviour change techniques (BCTs)
Provide information on:
- Behaviour-health link
- Consequences
- Others’ approval
Set graded tasks
Model or demonstrate behaviour
Teach or use prompts as cues
Agree on behavioural contract
Provide:
- Contingent rewards
- Social comparison
- General encouragement
- Instruction
- Feedback
Use follow-up prompts
Plan social support or social change
Relapse prevention
Management of:
- Time
- Stress
Prompt
- Identification as a role model
- Self-talk
- Intention formation
- Barrier ID
- Specific goal setting
- Review of behavioural goals
- Self-monitoring
- Practice
Motivational interviewing

Different techniques…
Albarracín et al. (2005) – interventions designed to promote use of condoms

Bespoke content developed by TRL and Driver Instructors Association (DIA)
-Hazard Perception
-Driving style
Delivered in-car by professional local instructors and examiners, accredited by DIAmond (DIA’s training arm)
Access over 10,000 professionally qualified and government regulated driver trainers with coverage across the UK and overseas – able to train across all vehicle classes and licence categories
DIA/TRL Training

In-car training
Initial screening – risk, theory and learning style profilers
and questionnaires
Hazard perception
training and behaviour change
Practical training – in classroom, in-vehicle, e-
learning, simulator
Driver training and assessments in-car – DVSA accredited and
globally respected

Plan for, and work safely at, the roadside
- Understand and manage risks
- Plan working day to avoid fatigue
- Understand they are largely responsible for their own safety
- Content developed from TRL research
Colas/TRL Roadside Working Course

The scale of work-related road risk in GB
‘Good practice’
WRRS and H&S
Evidence-based interventions
Conclusions 5
1
3
2
4

WRRS is the ‘poor relation’ of H&S in terms of regulation, and culture
It is still a big problem, and companies can benefit from managing it properly
Good practice focuses on using good data to manage risk factors
Specific interventions need to be based on evidence
Conclusions

Thank you Work-related road risk: some thoughts on how and why to
manage it well
Presented by Shaun Helman Head of Transport Psychology – 26/05/2016
Tel: 01344 770650 Email: [email protected]

Broughton J., Baughan C, Pearce L, Smith L and Buckle G. Work-related road accidents. TRL Report 582. Crowthorne: Transport Research Laboratory, 2003.
Boufous, S., Ivers, R., Senserrick, T. and Stevenson, M. (2011). Attempts at the practical on-road driving test and the hazard perception test and the risk of traffic crashes in young drivers. Traffic Injury Prevention, 12(5), 475-482.
Crick, J. L., & McKenna, F. P. (1991). Hazard perception: can it be trained? In G. B. Grayson (Ed.) Behavioural Research in Road Safety II. Crowthorne: Transport and Road Research Laboratory.
Delmonte, E. (2015). Investigating the safety imbalance: comparing work-related road safety and workplace safety. TRL Report (RPN3548). Crowthorne: Transport Research Laboratory.
Evans, L. (1991). Traffic Safety and the Driver. New York: Van Nostrand Reinhold.
Evans, L. (2008). Traffic Safety. Michigan: Science Serving Society.
Fort E, Pourcel L, Davezies P, Renaux C, Chiron M and Charbotel B. Road accidents, and occupational risk. Safety Science 2010: 48, 1412-1420.
Glad, A. (1988). Phase 2 driver education, effect on accident risk. Oslo, Norway: Transport Institute.
Helman, S., Christie, N., Ward, H., Grayson, G., Delmonte, E. and Hutchins, R. (2014). Strategic review of the management of occupational road risk. Published Project Report (PPR699). Crowthorne: Transport Research Laboratory.
Helman, S., Delmonte, E. & Stannard, J. (2013). Construction logistics and cyclist safety: summary report. Published Project Report PPR640. Crowthorne: Transport Research Laboratory.

House of Commons Transport Committee (2008). Ending the scandal of complacency: Road safety beyond 2010. House of Commons: The Stationery Office Limited, London.
HSE (2009). HSE’s role in the investigation of work-related road accidents and advice on responding to enquiries on managing work-related road safety. Available at http://www.hse.gov.uk/foi/internalops/oms/2009/002.htm
Hull, M. A., & Christie, R. J. (1993). The hazard perception test: the Geelong trial and future developments. VicRoads Report GR 93–113.
Maycock, G., Lockwood, C. R. & Lester, J. (1991). The accident liability of car drivers. TRRL Report RR315. Crowthorne: Transport and Road Research Laboratory.
McKenna, F. P. & Horswill, M. S. (1999). Hazard perception and its relevance for driver licensing. IATSS Research, 23, 36–41.
McKenna, F. P. & Crick, J. L. (1994). Hazard perception in drivers: a methodology for testing and training. TRRL Report CR313. Crowthorne: Transport and Road Research Laboratory.
PACTS (Parliamentary Advisory Council for Transport Safety) (2015). Transport Safety Commission – UK Transport Safety: Who is Responsible? Available at http://www.pacts.org.uk/wp-content/uploads/sites/2/TSC%20Responsibility%20report%20-%20PrepubFINAL%202015-03-23.pdf
Quimby, A. R., Maycock, G., Carter, L. D., Dixon, R. & Wall, J. G. (1986). Perceptual abilities of accident involved drivers. TRRL Report RR27. Crowthorne: Transport and Road Research Laboratory.
Robb G, Sultana S, Ameratunga S and Jackson R. A systematic review of epidemiological studies investigating risk factors for work-related road traffic crashes and injuries. Injury Prevention 2008: 14, 51-58.

Salminen S and Lähdeniemi. Risk factors in work-related traffic. Transportation Research Part F 2007: 77-86.
TUC (2013). Transport and work related road safety (online excerpt from ‘Hazards at Work: Organising for safe and healthy workplaces). Available at https://www.tuc.org.uk/workplace-issues-33
Wells, P., Tong, S., Sexton, B., Grayson, G. & Jones, E. (2008). Cohort II: a study of learner and new drivers. Volume 1: main report. Road Safety Research Report No. 81. London: Department for Transport (DfT).