
© 2002 Prentice Hall Publishing Company Introduction to Financial Accounting, 8th EditionHorngren,...
73
entice Hall Publishing Company Introduction to Financial Accounting, 8th Edition Horngren, Sundem, an 13 - 1 Chapter 13 Financial Statement Analysis
-
Upload
bartholomew-matthews -
Category
Documents
-
view
215 -
download
1
Transcript of © 2002 Prentice Hall Publishing Company Introduction to Financial Accounting, 8th EditionHorngren,...

© 2002 Prentice Hall Publishing Company Introduction to Financial Accounting, 8th Edition Horngren, Sundem, and Elliott
13 - 1
Chapter 13
Financial StatementAnalysis
© 2002 Prentice Hall Publishing Company Introduction to Financial Accounting, 8th Edition Horngren, Sundem, and Elliott
13 - 2
Learning ObjectivesAfter studying this chapter, you should be able to: Locate and use the many sources of information about
company performance. Analyze the components of a company using trend
analysis and other techniques. Use the basic financial ratios to guide your thinking. Evaluate corporate performance using ROA, ROE, and
EVA. Calculate EPS under complex circumstances. Adjust for nonrecurring items.

© 2002 Prentice Hall Publishing Company Introduction to Financial Accounting, 8th Edition Horngren, Sundem, and Elliott
13 - 3
Sources of InformationAbout Companies
Financial statement analysis - using financial statements to assess a company’s performance
Information about publicly traded companies comes in many forms and may be found in many places.• Annual reports• SEC filings and databases• Company press releases• Articles that appear in the financial press
© 2002 Prentice Hall Publishing Company Introduction to Financial Accounting, 8th Edition Horngren, Sundem, and Elliott
13 - 4
Sources of InformationAbout Companies
The annual report is important to investors because of its completeness and its reliability due to the audit performed by an independent auditor.• The annual report includes:
– Financial statements
– Footnotes to the financial statements
– A summary of accounting principles used
– Management’s discussion and analysis of the financial results
– The auditor’s report
– Comparative financial data for a series of years
– Narrative information about the company

© 2002 Prentice Hall Publishing Company Introduction to Financial Accounting, 8th Edition Horngren, Sundem, and Elliott
13 - 5
Sources of InformationAbout Companies
Publicly traded companies must also prepare reports for the Securities and Exchange Commission (SEC).• Form 10-K - presents financial statement data in
greater detail than the financial statements in annual reports
• Form 10-Q - includes quarterly financial statements that provide more timely but less complete information than annual reports

© 2002 Prentice Hall Publishing Company Introduction to Financial Accounting, 8th Edition Horngren, Sundem, and Elliott
13 - 6
Sources of InformationAbout Companies
Company press releases provide the basis for articles in the financial press such as The Wall Street Journal and Business Week.
Services such as Value Line, Moody’s Investors Services, Standard and Poor’s Industrial Surveys, and Dun & Bradstreet provide useful information to investors.

© 2002 Prentice Hall Publishing Company Introduction to Financial Accounting, 8th Edition Horngren, Sundem, and Elliott
13 - 7
Sources of InformationAbout Companies
The Internet is changing the way that people make investments.• Many investors now buy and sell securities without
the help of a broker.• Much of the market information
is available electronically, usually for free from various sources.

© 2002 Prentice Hall Publishing Company Introduction to Financial Accounting, 8th Edition Horngren, Sundem, and Elliott
13 - 8
Sources of InformationAbout Companies
Large investors often require pro forma statements which are carefully formulated expressions of predicted results.
Any investor should take the time to gather as much information about potential investments as possible.• There are many sources of information for investors
to use.

© 2002 Prentice Hall Publishing Company Introduction to Financial Accounting, 8th Edition Horngren, Sundem, and Elliott
13 - 9
Objectives of FinancialStatement Analysis
Although different investors demand different returns, they all use financial statement analysis for common reasons.• To predict their expected returns• To assess the risks associated with those returns
Financial statement analysis focuses on past performance to predict future performance.

© 2002 Prentice Hall Publishing Company Introduction to Financial Accounting, 8th Edition Horngren, Sundem, and Elliott
13 - 10
Objectives of FinancialStatement Analysis
Creditors want to know about short-term liquidity and long-term solvency.• Short-term liquidity - an organization’s ability to meet
current payments as they become due• Long-term solvency - an organization’s ability to
generate enough cash to repay long-term debts as they mature
© 2002 Prentice Hall Publishing Company Introduction to Financial Accounting, 8th Edition Horngren, Sundem, and Elliott
13 - 11
Objectives of FinancialStatement Analysis
Equity investors are more concerned with returns in the form of dividends and increased market price of the stock.• These investors are naturally more interested in
profitability.• Profits spur both dividends and
increased stock prices.

© 2002 Prentice Hall Publishing Company Introduction to Financial Accounting, 8th Edition Horngren, Sundem, and Elliott
13 - 12
Evaluating Trends and Components of the Business
Evaluating trends and components of a business are two ways of looking at financial information.• Trend analysis involves comparing financial trends
from one year to another.• Evaluating components of a business can be done in
more than one way.– Relationships among elements of the financial statements
may be examined.
– Components may also be thought of as separate business units or segments. These components may be examined.
© 2002 Prentice Hall Publishing Company Introduction to Financial Accounting, 8th Edition Horngren, Sundem, and Elliott
13 - 13
Trend Analysis Trends are predictable patterns that have been
observed in the past and are expected to continue into the future.• A pattern must be identified, and expectations of
whether the trend will continue must be formed.• Trends can be shown as changes in amounts from
year to year or as percentage changes from year to year.

© 2002 Prentice Hall Publishing Company Introduction to Financial Accounting, 8th Edition Horngren, Sundem, and Elliott
13 - 14
Trend Analysis The dollar amount of the change is simply the
current year minus the previous year.
The percentage change is computed as follows:
100amountyear Prior
change ofAmount Change %

© 2002 Prentice Hall Publishing Company Introduction to Financial Accounting, 8th Edition Horngren, Sundem, and Elliott
13 - 15
Trend AnalysisSTELLAR CORPORATION
Income Statementsfor the Years Ended December 31, 2002 and 2001
Increase % Increase 2002 2001 (Decrease) (Decrease)
Sales $98,600 $89,500 $9,100 10.2%Expenses: Wages expense 45,800 42,900 2,900 6.8 Rent expense 12,000 12,000 0 0.0 Utilities expense 6,500 6,450 50 0.8 Depreciation expense 5,000 5,900 (900) (15.3) Total expenses 69,300 67,250 2,050 3.0Net Income $29,300 $22,250 $7,050 31.7
============= ============= ===========
© 2002 Prentice Hall Publishing Company Introduction to Financial Accounting, 8th Edition Horngren, Sundem, and Elliott
13 - 16
Trend Analysis Changes in dollar amounts and percentage terms
help to expose patterns.• Understanding these patterns is most important.• The answers to why items changed tell a lot about
how a company is run, how it will perform in the future, and whether or not it would be a good investment.
Analysts generally look at several years’ worth of financial information to discover trends.

© 2002 Prentice Hall Publishing Company Introduction to Financial Accounting, 8th Edition Horngren, Sundem, and Elliott
13 - 17
Common-Size Statements Common-size statements - financial statements
expressed in component percentages• The income statement is expressed as a percentage of
sales.– This makes it easy to compare percentages to those of other
companies because percentages are a common index.
• The balance sheet is expressed as a percentage of total assets.
– This is often referred to as component percentages because they measure each component as a percentage of the total.

© 2002 Prentice Hall Publishing Company Introduction to Financial Accounting, 8th Edition Horngren, Sundem, and Elliott
13 - 18
Common-Size Statements For the income statement, sales is set at 100%
and each other element is expressed as a percentage of the sales figure.
For the balance sheet, the total assets amount is set at 100%, and each other element is expressed as a percentage of the total assets figure.

© 2002 Prentice Hall Publishing Company Introduction to Financial Accounting, 8th Edition Horngren, Sundem, and Elliott
13 - 19
Common-Size StatementsSTELLAR CORPORATION
Income Statementsfor the Years Ended December 31, 2002 and 2001
Sales 98,600$ 100% 89,500$ 100%Expenses Wages expense 45,800 46% 42,900 48% Rent expense 12,000 12% 12,000 13% Utilities expense 6,500 7% 6,450 7% Depreciation expense 5,000 5% 5,900 7% Total expenses 69,300 70% 67,250 75%Net income 29,300$ 30% 22,250$ 25%
2002 2001

© 2002 Prentice Hall Publishing Company Introduction to Financial Accounting, 8th Edition Horngren, Sundem, and Elliott
13 - 20
Management’s Discussionand Analysis
Management’s discussion and analysis - a required section of the annual report that concentrates on explaining the major changes in the income statement, liquidity, and capital resources• Management’s discussion often
includes a discussion of trends and analysis of components.

© 2002 Prentice Hall Publishing Company Introduction to Financial Accounting, 8th Edition Horngren, Sundem, and Elliott
13 - 21
Segment Reporting Many large companies are involved in more than
one type of business activity or market.• Each individual type of business activity or market
may be considered a segment.
The FASB requires information on a business segment to be reported based on the way it is reported to management.• The information is reported consistent with the way
the company manages the business.
© 2002 Prentice Hall Publishing Company Introduction to Financial Accounting, 8th Edition Horngren, Sundem, and Elliott
13 - 22
Segment Reporting When analyzing segment data, two things should
be considered.• Evaluating segment data forces us to ask important
questions that help us to truly understand the business.• Truly understanding the business means not only
understanding what is sold and how much is made but also interpreting how financial reports summarize dynamic changes in the business.
© 2002 Prentice Hall Publishing Company Introduction to Financial Accounting, 8th Edition Horngren, Sundem, and Elliott
13 - 23
Financial Ratios The cornerstone of financial statement analysis is
the use of ratios.
Financial ratios are sometimes grouped into four categories:• Short-term liquidity ratios• Long-term solvency ratios• Profitability ratios• Market price and dividends ratios
© 2002 Prentice Hall Publishing Company Introduction to Financial Accounting, 8th Edition Horngren, Sundem, and Elliott
13 - 24
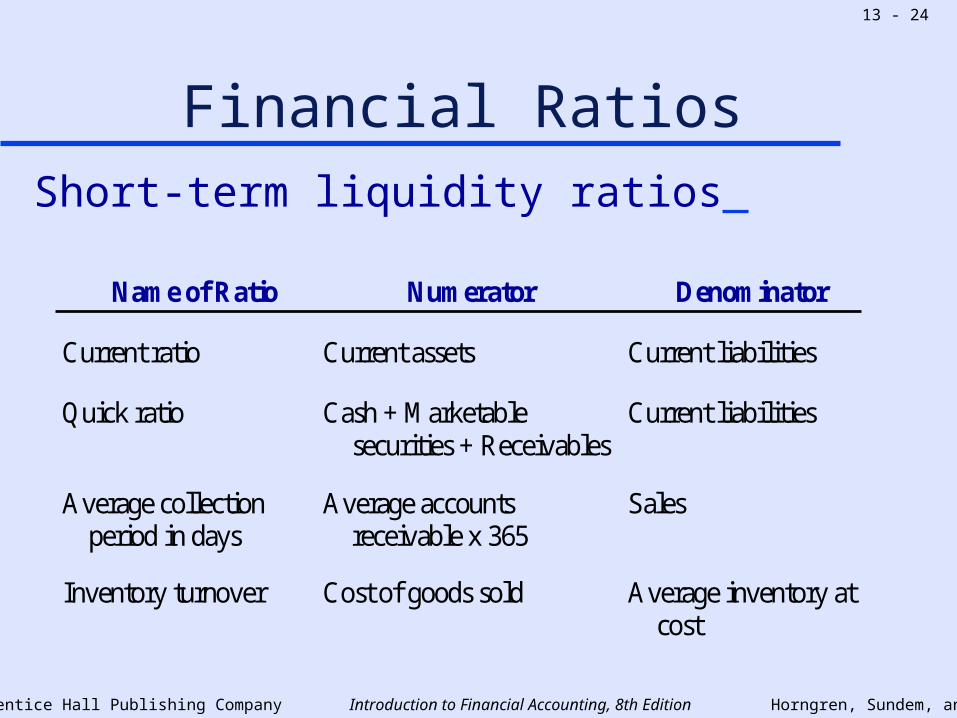
Financial RatiosShort-term liquidity ratios
Name of Ratio Numerator Denominator
Current ratio Current assets Current liabilities
Quick ratio Cash + Marketable securities + Receivables
Current liabilities
Average collection period in days
Average accounts receivable x 365
Sales
Inventory turnover Cost of goods sold Average inventory at cost

© 2002 Prentice Hall Publishing Company Introduction to Financial Accounting, 8th Edition Horngren, Sundem, and Elliott
13 - 25
Financial RatiosLong-term solvency ratios
Name of Ratio Numerator Denominator
Total debt to total assets Total liabilities Total assets
Total debt to equity Total liabilities Stockholders' equity
Interest coverage Income before interest and taxes
Interest expense

© 2002 Prentice Hall Publishing Company Introduction to Financial Accounting, 8th Edition Horngren, Sundem, and Elliott
13 - 26
Financial RatiosProfitability ratios
Name of Ratio Numerator Denominator
Return on stockholders' equity
Net income Average stockholders' equity
Gross profit rate or percentage
Gross profit or gross margin Sales
Return on sales Net income Sales
Asset turnover Sales Average total assets available
Pretax return on operating assets
Operating income Average total assets available
Earnings per share Net income less dividends on preferred stock, if any
Average common shares outstanding

© 2002 Prentice Hall Publishing Company Introduction to Financial Accounting, 8th Edition Horngren, Sundem, and Elliott
13 - 27
Financial RatiosMarket price and dividend ratios
Name of Ratio Numerator Denominator
Price-earnings Market price of common stock
Earnings per share
Dividend yield Dividends per common share
Market price of common stock
Dividend-payout Dividends per common share
Earnings per share

© 2002 Prentice Hall Publishing Company Introduction to Financial Accounting, 8th Edition Horngren, Sundem, and Elliott
13 - 28
Evaluating Financial Ratios Financial ratios are evaluated using three types of
comparisons.• Time-series comparisons - comparisons of a
company’s financial ratios with its own historical ratios
• Benchmarks - general rules of thumb specifying appropriate levels for financial ratios
• Cross-sectional comparisons - comparisons of a company’s financial ratios with the ratios of other companies or with industry averages

© 2002 Prentice Hall Publishing Company Introduction to Financial Accounting, 8th Edition Horngren, Sundem, and Elliott
13 - 29
Ratios Financial analysis using ratios is useful to
investors because the ratios capture critical dimensions of the economic performance of the company.
Managers use ratios to guide, measure, and reward workers.• Often companies base employee bonuses on a specific
financial ratio or a combination of some other performance measure and a financial ratio.

© 2002 Prentice Hall Publishing Company Introduction to Financial Accounting, 8th Edition Horngren, Sundem, and Elliott
13 - 30
Ratios Ratios mean different things to different groups.
• A creditor might think that a high current ratio is good because it means that the company has the cash to pay the debt.
• However, a manager might think that a high current ratio is undesirable because it could mean that the company is carrying too much inventory or is allowing its receivables to get too high.

© 2002 Prentice Hall Publishing Company Introduction to Financial Accounting, 8th Edition Horngren, Sundem, and Elliott
13 - 31
Ratios Because financial ratios may be interpreted
differently by different users, the users of the financial ratios must understand the company and the business before drawing conclusions.
© 2002 Prentice Hall Publishing Company Introduction to Financial Accounting, 8th Edition Horngren, Sundem, and Elliott
13 - 32
Operating Performance andFinancial Performance
Measures of profitability are affected by both financing and operating decisions.• Financial management is concerned with where the
company gets cash and how it uses that cash.• Operating management is concerned with the day-to-
day activities that generate revenues and expenses.
Ratios that assess operating efficiency should not be affected by financial management performance.

© 2002 Prentice Hall Publishing Company Introduction to Financial Accounting, 8th Edition Horngren, Sundem, and Elliott
13 - 33
Operating Performance Rate of return on investment - evaluates the
overall success of an investment by comparing what the investment returns with the amount of investment initially made
capital Invested
IncomeRate of return
on investment

© 2002 Prentice Hall Publishing Company Introduction to Financial Accounting, 8th Edition Horngren, Sundem, and Elliott
13 - 34
Operating Performance Income may be defined differently for alternative
purposes.• Net earnings• Pretax income from operations• Earnings before interest and taxes (EBIT)
Invested capital may also be defined differently.• Stockholders’ equity• Total capital provided by both debt and equity sources

© 2002 Prentice Hall Publishing Company Introduction to Financial Accounting, 8th Edition Horngren, Sundem, and Elliott
13 - 35
Operating Performance Operating performance is best measured by
pretax operating rate of return on total assets, often referred to as return on total assets.
available assets totalAverage
income Operating
Pretax operatingrate of returnon total assets

© 2002 Prentice Hall Publishing Company Introduction to Financial Accounting, 8th Edition Horngren, Sundem, and Elliott
13 - 36
Operating Performance The right side of the previous equation is actually
composed of two more important ratios.
This equation may also be expressed as:
assets totalAvg.
Sales
Sales
income Operating
assets totalAvg.
income Operating
Operating incomepercentage on sales
Total assetturnover
Pretax operating rate of return on
total assets=

© 2002 Prentice Hall Publishing Company Introduction to Financial Accounting, 8th Edition Horngren, Sundem, and Elliott
13 - 37
Operating Performance The expanded expression of pretax operating rate
of return on total assets highlights that operating income percentage and asset turnover will each increase the rate of return on assets.• Using these two ratios allows manipulation of either
one to determine what happens to the rate of return under different scenarios.

© 2002 Prentice Hall Publishing Company Introduction to Financial Accounting, 8th Edition Horngren, Sundem, and Elliott
13 - 38
Operating Performance
Pretax Returnon Total Assets
Operating Income% on Sales
Total AssetTurnover
OperatingIncome
Sales
Sales
Average TotalAssets
x
© 2002 Prentice Hall Publishing Company Introduction to Financial Accounting, 8th Edition Horngren, Sundem, and Elliott
13 - 39
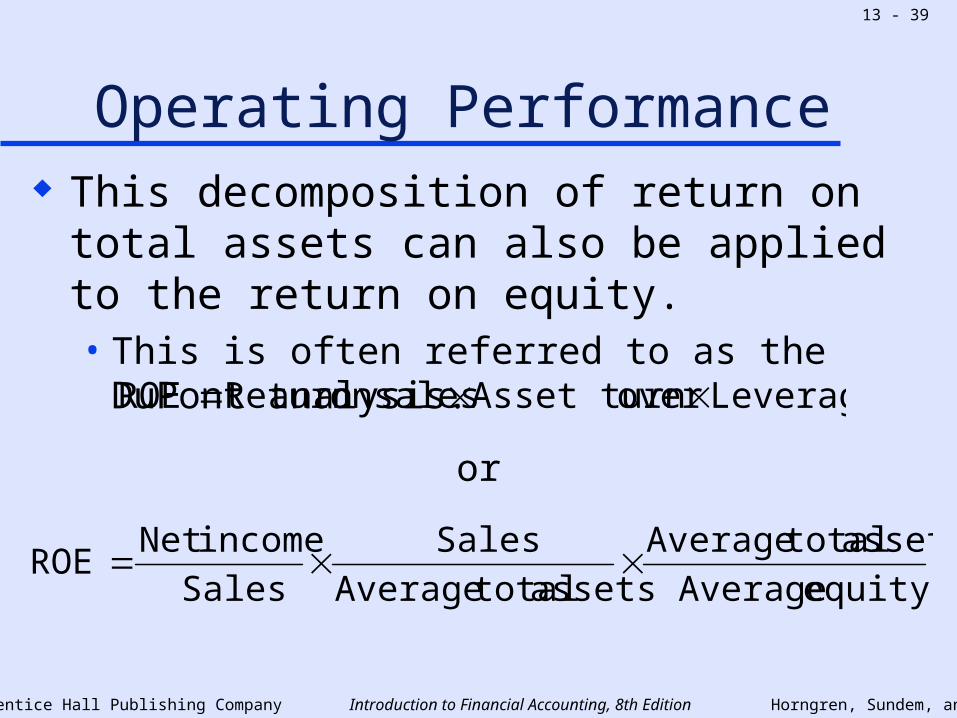
Operating Performance This decomposition of return on total assets can
also be applied to the return on equity.• This is often referred to as the DuPont analysis.
equity Average
assets totalAverage
assets totalAverage
Sales
Sales
incomeNet ROE
LeverageoverAsset turnsaleson Return ROE
or

© 2002 Prentice Hall Publishing Company Introduction to Financial Accounting, 8th Edition Horngren, Sundem, and Elliott
13 - 40
Financial Performance Debt and equity financing must be balanced in
order to achieve good financial performance.• Firms must choose how much debt is appropriate.• The firms must also choose how to split
their debt between short-term debt and long-term debt.
The prudent use of debt is a major part of intelligent financial management.

© 2002 Prentice Hall Publishing Company Introduction to Financial Accounting, 8th Edition Horngren, Sundem, and Elliott
13 - 41
Financial Performance Short-term debt must be repaid or refinanced in a
short period of time.• If a company has trouble repaying the debt, it will
also generally have trouble refinancing the debt.• Naturally, lenders like healthy borrowers, not troubled
borrowers.
© 2002 Prentice Hall Publishing Company Introduction to Financial Accounting, 8th Edition Horngren, Sundem, and Elliott
13 - 42
Financial Performance Long-term debt or equity are generally used to
finance long-term investments.• Debt financing is more attractive than equity
financing because:– Interest payments are deductible for income tax purposes,
but dividends are not deductible.
– The ownership rights to voting and profits are kept by the present shareholders.

© 2002 Prentice Hall Publishing Company Introduction to Financial Accounting, 8th Edition Horngren, Sundem, and Elliott
13 - 43
Trading on the Equity Capitalization (capital structure) - the total of a
company’s long-term financing• Owners’ equity plus long-term debt
Trading on the equity (financial leverage, leveraging) - using borrowed money at fixed interest rates with the objective of enhancing the rate of return on common equity

© 2002 Prentice Hall Publishing Company Introduction to Financial Accounting, 8th Edition Horngren, Sundem, and Elliott
13 - 44
Trading on the Equity There are costs and benefits to the shareholders
from leveraging.• Costs:
– Interest payments
– Increased risk
• Benefits:– Larger returns to the common shareholders, as long as
overall income is large enough to cover the increased interest payments

© 2002 Prentice Hall Publishing Company Introduction to Financial Accounting, 8th Edition Horngren, Sundem, and Elliott
13 - 45
Trading on the Equity General comments about leveraging:
• A debt-free, or unleveraged, company has identical return on assets (ROA) and return on equity (ROE).
• When a company has a ROA greater than the interest rate it is paying its lenders, ROE exceeds ROA.
– This is called favorable financial leverage.
• When a company is unable to earn at least the interest rate on the money borrowed, the return on equity will be lower than it would be for a debt-free company.
• The more stable the income, the less dangerous it is to trade on the equity.

© 2002 Prentice Hall Publishing Company Introduction to Financial Accounting, 8th Edition Horngren, Sundem, and Elliott
13 - 46
Economic Value Added The idea behind economic value added (EVA) is
that a company must earn more than it must pay for capital if it is to increase in value.• Capital is considered both debt and equity.• The cost of capital in EVA is a weighted average of
interest cost and the returns required by equity investors.
If a company has positive EVA, the company is adding value; if a company has negative EVA, the company is losing value and might be better off liquidating.

© 2002 Prentice Hall Publishing Company Introduction to Financial Accounting, 8th Edition Horngren, Sundem, and Elliott
13 - 47
Income Tax Effects If all things are equal, debt financing is less
costly to a corporation than equity financing because interest payments are deductible for income tax purposes.• Dividends paid on stock are not deductible.• Also, dividend rates on stock are generally higher
than interest rates on debt because of the increased risk associated with stock.

© 2002 Prentice Hall Publishing Company Introduction to Financial Accounting, 8th Edition Horngren, Sundem, and Elliott
13 - 48
Income Tax Effects General comments on debt financing versus
equity financing:• Because interest is deductible for income tax purposes,
net income attributable to common shareholders can be higher if debt is used because taxes are lower.
• Book net income is higher if equity financing is used because there are no interest payments to be deducted as expenses.
• Failure to pay interest is an act of bankruptcy, which gives creditors the right to control the company; failure to pay dividends has less severe consequences.

© 2002 Prentice Hall Publishing Company Introduction to Financial Accounting, 8th Edition Horngren, Sundem, and Elliott
13 - 49
Measuring Safety Investors in debt securities want assurance that
the company in which they have invested will be able to make the scheduled interest and principal payments.• These investors want to avoid the trouble of
recovering their investments through bankruptcy of the company.
• They would much rather a steady stream of income from a healthy company.
© 2002 Prentice Hall Publishing Company Introduction to Financial Accounting, 8th Edition Horngren, Sundem, and Elliott
13 - 50
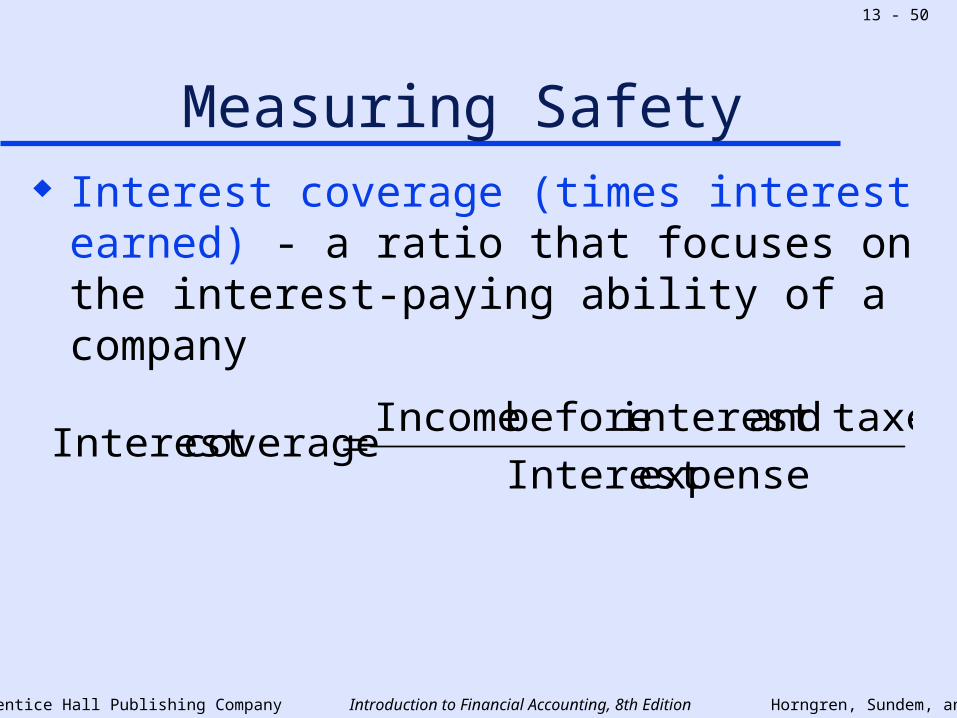
Measuring Safety Interest coverage (times interest earned) - a ratio
that focuses on the interest-paying ability of a company
expenseInterest
taxesandinterest before Income coverageInterest
© 2002 Prentice Hall Publishing Company Introduction to Financial Accounting, 8th Edition Horngren, Sundem, and Elliott
13 - 51
Measuring Safety A rule of thumb for debt investors
is that the interest coverage should be at least five times even in the
poorest year in a span of 7 to 10 years.
The tax deductibility feature of interest is a major reason why debt financing is used more than equity financing using preferred stock.

© 2002 Prentice Hall Publishing Company Introduction to Financial Accounting, 8th Edition Horngren, Sundem, and Elliott
13 - 52
Prominence of Earnings Per Share Earnings per share is a basic reporting element in
the financial statements.
Some issues tend to complicate the calculation of earnings per share.• Use of a weighted-average number
of shares of common stock• Outstanding shares of nonconvertible
preferred stock• Changes in capitalization structure such as stock splits
and stock dividends

© 2002 Prentice Hall Publishing Company Introduction to Financial Accounting, 8th Edition Horngren, Sundem, and Elliott
13 - 53
Weighted-Average Shares and Preferred Stock
If all shares outstanding are common shares, the biggest complication is the use of a weighted-average number of shares of common stock.
The following formula is used in this case.
shares ofnumber average- Weighted
incomeNet Earning per share
of common stock

© 2002 Prentice Hall Publishing Company Introduction to Financial Accounting, 8th Edition Horngren, Sundem, and Elliott
13 - 54
Weighted-Average Sharesand Preferred Stock
Earnings per share is calculated as net income divided by weighted-average number of shares outstanding during the period.• The weighted-average number of shares is based on
the number of months that the shares were outstanding during the year.

© 2002 Prentice Hall Publishing Company Introduction to Financial Accounting, 8th Edition Horngren, Sundem, and Elliott
13 - 55
Weighted-Average Sharesand Preferred Stock
Online, Inc., has 750,000 shares of common stock outstanding at the beginning of the calendar year, and 200,000 additional shares were issued on October 1. What is the weighted-average number of shares outstanding during the year?

© 2002 Prentice Hall Publishing Company Introduction to Financial Accounting, 8th Edition Horngren, Sundem, and Elliott
13 - 56
Weighted-Average Sharesand Preferred Stock
The weighted-average number of shares is computed as follows:
750,000 x weighting of 12/12 = 750,000
200,000 x weighting of 3/12 = 50,000
800,000 =================
OR
750,000 x 9/12 = 562,500
950,000 x 3/12 = 237,500
800,000 =================
© 2002 Prentice Hall Publishing Company Introduction to Financial Accounting, 8th Edition Horngren, Sundem, and Elliott
13 - 57
Weighted-Average Sharesand Preferred Stock
Another complication arises if there are shares of nonconvertible preferred stock outstanding.• The dividends on preferred stock for the current
period, whether or not paid, should be deducted in calculating EPS because those dividends are not available to be paid to common shareholders.
shares ofnumber average- Weighted
dividends Preferred - incomeNet
Earning per shareof common stock
© 2002 Prentice Hall Publishing Company Introduction to Financial Accounting, 8th Edition Horngren, Sundem, and Elliott
13 - 58
Basic and Diluted EPS When a company has convertible securities, stock
options outstanding, or other financial instruments that can be converted to common shares, the calculation of EPS becomes even more complicated.• When convertible securities exist, EPS is calculated
using the assumption that any and all convertible shares are turned into common stock at the beginning of the period.

© 2002 Prentice Hall Publishing Company Introduction to Financial Accounting, 8th Edition Horngren, Sundem, and Elliott
13 - 59
Basic and Diluted EPS The presence of convertible securities increases
the number of common shares to the highest possible number considering the convertible securities and stock options outstanding.• If the number or shares outstanding is increased,
earnings per share is decreased.• These convertible securities are said to dilute (reduce)
earnings per share.

© 2002 Prentice Hall Publishing Company Introduction to Financial Accounting, 8th Edition Horngren, Sundem, and Elliott
13 - 60
Disclosure of Nonrecurring Items Financial statement analysis focuses on normal
recurring items of the financial statements, not nonrecurring items.
Four major categories of nonrecurring items:• Special items• Extraordinary items• Discontinued operations• Accounting changes

© 2002 Prentice Hall Publishing Company Introduction to Financial Accounting, 8th Edition Horngren, Sundem, and Elliott
13 - 61
Special Items Special items - expenses that are large enough
and unusual enough to warrant separate disclosure• Companies generally have flexibility in deciding
when to treat something as a special item.• Special items appear as separate line items among
operating expenses on the income statement.• Any necessary discussion must be included in the
footnotes to the financial statements.

© 2002 Prentice Hall Publishing Company Introduction to Financial Accounting, 8th Edition Horngren, Sundem, and Elliott
13 - 62
Extraordinary Items Extraordinary items - items that are unusual in
nature and infrequent in occurrence that are shown separately, net of tax, in the income statement• Unusual in nature means that an item is different from
the typical or normal operating activities of a business.
• Infrequent in occurrence means that an event should not be expected to recur often.
© 2002 Prentice Hall Publishing Company Introduction to Financial Accounting, 8th Edition Horngren, Sundem, and Elliott
13 - 63
Extraordinary Items Examples of extraordinary items are the financial
effects of natural disasters such as earthquakes or hurricanes and government expropriations.• Whether an item is extraordinary sometimes depends
on where the event occurs.– For example, losses from damage resulting from a
hurricane on the coast of Louisiana would not be considered extraordinary, but losses from damage resulting from a hurricane in South Dakota would be extraordinary.

© 2002 Prentice Hall Publishing Company Introduction to Financial Accounting, 8th Edition Horngren, Sundem, and Elliott
13 - 64
Extraordinary Items Extraordinary items must be shown separately on
the income statement.
They must also be shown net of tax, which means that the amount on the income statement includes any tax effect the item might have.
© 2002 Prentice Hall Publishing Company Introduction to Financial Accounting, 8th Edition Horngren, Sundem, and Elliott
13 - 65
Discontinued Operations Discontinued operations - the termination
(closing or sale) of a business segment reported separately, net of tax, in the income statement• Any gain or loss from the actual disposal of the
segment must be disclosed along with the results of operations (income or loss) for that segment during the period before the disposal.

© 2002 Prentice Hall Publishing Company Introduction to Financial Accounting, 8th Edition Horngren, Sundem, and Elliott
13 - 66
Accounting Changes Accounting changes occur when the FASB
requires a new way of accounting for a particular item.• When the FASB changes its rules, it often requires a
major one-time recognition (revenue or expense).• Accounting changes are shown separately and are
shown net of tax.

© 2002 Prentice Hall Publishing Company Introduction to Financial Accounting, 8th Edition Horngren, Sundem, and Elliott
13 - 67
Accounting Changes The presentation of nonrecurring items on the
income statement is as follows:
Income from continuing operations before income taxes Deduct income taxesIncome from continuing operations Discontinued operations, net of taxIncome before extraordinary items Extraordinary items, net of taxIncome before cumulative effect of an accounting change Cumulative effect of an accounting change, net of taxNet income
© 2002 Prentice Hall Publishing Company Introduction to Financial Accounting, 8th Edition Horngren, Sundem, and Elliott
13 - 68
International Considerations Financial statement analysis may be complicated
by several factors when companies carry on operations in different countries.• Differences in accounting methods• Language in which the results
are reported• Currency in which results are reported• Different securities markets, tax
structures, and local customs

© 2002 Prentice Hall Publishing Company Introduction to Financial Accounting, 8th Edition Horngren, Sundem, and Elliott
13 - 69
Price-Earnings Ratios and Growth The P-E ratio is helpful for relating the price of a
stock to the earnings it is generating.• Value investors look for stocks with low P-E ratios
because they feel these stocks are undervalued.• Growth investors feel that stocks with high P-E ratios
are likely to be high growth stocks.– The price is high because investors see strong growth
ahead.

© 2002 Prentice Hall Publishing Company Introduction to Financial Accounting, 8th Edition Horngren, Sundem, and Elliott
13 - 70
Price-Earnings Ratios and Growth One way to relate P-E ratios to growth is the
price-earnings growth (PEG) ratio.• It is a tool to help focus attention on certain stocks
and to help moderate knee-jerk reactions to other ratios.
Price-earnings growth ratio
=P-E ratio
Earnings growth rate
© 2002 Prentice Hall Publishing Company Introduction to Financial Accounting, 8th Edition Horngren, Sundem, and Elliott
13 - 71
Relating Cash Flowand Net Income
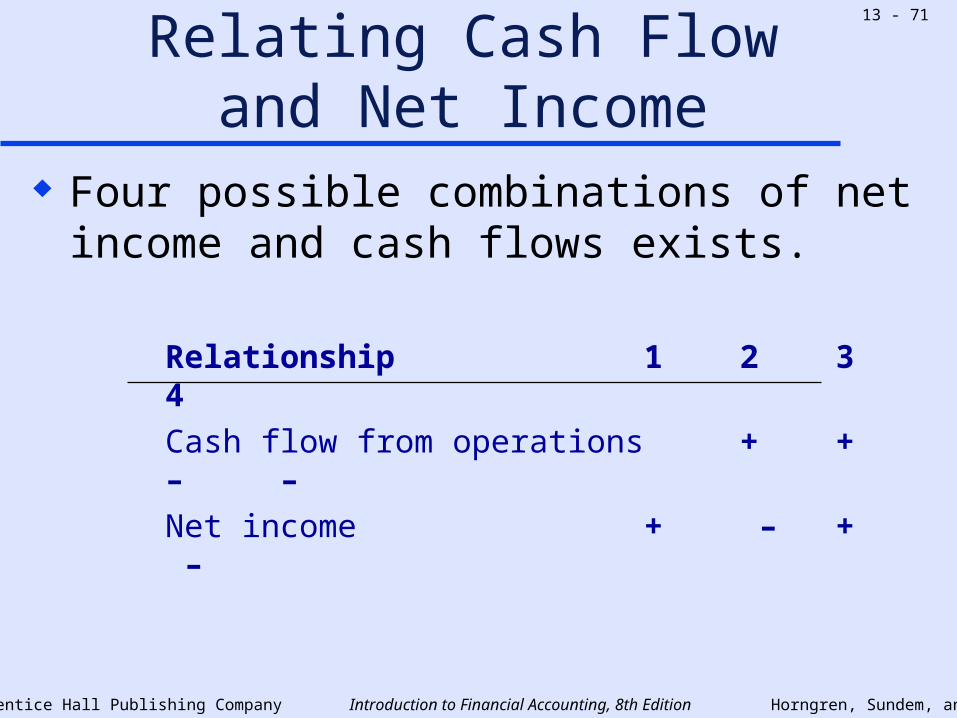
Four possible combinations of net income and cash flows exists.
Relationship 1 2 3 4
Cash flow from operations + + – –
Net income + – + –

© 2002 Prentice Hall Publishing Company Introduction to Financial Accounting, 8th Edition Horngren, Sundem, and Elliott
13 - 72
Relating Cash Flowand Net Income
Four possible situations:• Situation 1 confirms the profitability of the company.• Situation 2 can occur where a company has large
noncash expenses such as depreciation.• Situation 3 is often an indication of trouble but may
also be an indication of a rapidly growing company.• Situation 4 confirms the lack of profitability of the
company.

© 2002 Prentice Hall Publishing Company Introduction to Financial Accounting, 8th Edition Horngren, Sundem, and Elliott
13 - 73
Introduction to Financial Accounting
8th EditionPowerPoint Presentation
Developed by:
Eddie Metrejean, MTAX, CPAUniversity of Mississippi
Images provided by New Vision Technology1-800-387-0732
nvtech.com