


Languages
Pages
Legal


UNIVERSITI PUTRA MALAYSIA
ELECTROCHEMICAL SYNTHESIS OF TIN SULPHIDE IN AQUEOUS MEDIA
ARNIZA GHAZALI
FSAS 2000 42

ELECTROCHEMICAL SYNTHESIS OF TIN SULPHIDE IN AQUEOUS MEDIA
By
ARNIZA GBAZALI
Thesis Submitted in Fulfilment of the Requirement for the Degree of Master of Science in the
Faculty of Science and Environmental Studies Universiti Putra Malaysia
October 2000

Abstract of thesis presented to the Senate of Universiti Putra Malaysia in fulfilment of the requirement for the degree of Master of Science
ELECTROCHEMICAL SYNTHESIS OF TIN SULPHIDE IN AQUEOUS MEDIA
By
ARNIZA GHAZALI
October 2000
Chairman Associate Professor Zulkarnain Zainal, Ph. D.
Faculty Science and Environmental Studies
Chalcogenide semiconductor of the type tin sulphide or stannous sulphide
(SnS) has been synthesised in aqueous media under the presence and absence of
EDT A complexing agent. It was found that electrodeposition performed in the
presence of EDTA is more reproducible, better adhered to titanium substrate,
more leveled, more crystalline and offers better photoconductivity properties in
comparison to electrodeposition carried out without EDT A. These were
determined by means of Energy Dispersive Analysis of X-ray (EDAX), Scanning
Electron Microscopy (SEM), X-ray Diffraction (XRD), IN-visible Spectroscopy,
Linear Scan Photovoltammetry (LSPV) and in special cases, X-ray Photoelectron
Spectroscopy (XPS). The main improvement in photoconductivity property which
is a basic requirement for any solar energy materials and semiconductor was due
II

to factors that stem from good adhesion, crystallinity, surface coverage and
composition.
Optimisation of the electrodeposition condition was the prerequisite of
synthesising an outstanding SnS quality. In the optimisation study, the optimum
amount of thiosulphate, EDTA and tin source (stannous ions) has been
determined based upon the degree of reproducibility of Sn/S values from analysis
of stoichiometry (via EDAX) and degree of reproducibility of deposits quantity
(up to XRD detection limit for SnS deduction) at a fixed deposition time. The
optimum deposition potential of --O.7V (vs. SeE) was clear cut from microscopic
analysis by means of scanning electron micrographs and quantification by way of
EDAX. Under the optimum condition, an average SniS found from the study was
1.12 ± 0.05, which is within the expected stoichiometry found in literature. The
average energy gap estimated on samples prepared on ITO substrate was 1.29 ±
0.29 eV for a direct optical transition and 0.74 ± 0.20 eV for indirect optical
transition. In terms of proportion, this correlates with an advanced study on SnS
property via valence band spectra by Ettema et al. published in Physical Review
B, 1992,46(12): 7363-7386, which reported the optical transitions to be 1.39 eV
for direct transition and 0.2-0.4 eV for indirect transition.
iii

Examination of the effect of sodium dodecylsulphate (SDS) on the
electrodeposit shows a significant adverse effect on the electrodeposits. SDS was
suspected to cause electrode poisoning and had resulted in raise of pH, which was
non favourable for cathodic electrodeposition of SnS.
As in the case of tartaric acid, however, the leveling effect expected of it
might be insignificant and this could have been the masking effect of EDT A. To
ascertain the slight enhancement of crystal growth following addition of tartaric
acid into the electrodeposition bath, further investigation may be required.
IV

Abstrak tesis yang dikemukakan kepada Senat Universiti Putra Malaysia sebagai memenuru keperluan untuk ijazah Master Sains.
SINTESIS ELEKTROKIMIA TIMAH SULFIDA DI DALAM LARUTAN AKUEUS
Oleh
ARNIZA GHAZALI
Oktober 2000
Pengerusi Profesor Madya Zulkarnain Zainal, Ph. D.
Fakulti Sains dan Alam Sekitar
Semikonduktor kalkogenida, timah sulfida (SnS), telah disintesis di dalam
larutan akueus dengan kehadiran dan tanpa kehadiran agen pengkompleks EDT A.
Elektroenapan, yang dilakukan dengan kehadiran EDT A didapati mempunyai
kebolehulangan yang lebih baik, di mana enapan dapat melekat pada titanium
dengan lebih kuat, Iebih rata, mempunyai kehabluran yang lebih baik dan
mempamerkan sifat fotokonduksi yang lebih baik. lni telah diperhatikan daripada
analisis penyerakan tenaga sinaran-X (EDAX), mikroskopi elektron imbasan
(SEM), pembelauan sinaran-X (XRD), spektroskopi ultra lembayung nampak
(UV-visible), imbasan linear fotovoltametri (LSPV), dan di dalam kes-kes
tertentu, spektroskopi fotoelektron sinar-X (XPS). Penigkatan dalam fotokonduksi
yang merupakan satu sifat asas penting bagi peranti sel suria atau semikonduktor:
v

telah berjaya dicapai hasil daripada penambahbaikan daya lekatan, kehabluran,
pelitupan pennukaan dan komposisi.
Pengoptimuman pengelektroenapan adalah perlu bagi mendapatkan SnS
yang berkualiti. Amaun optimum bagi tiosulfat, EDT A dan ion timah telah
ditentukan berdasarkan pemerhatian kepada darjah keterulangan pada nisbah SniS
daripada analisis stoikiometri (daripada EDAX), daya lekatan kepada substrat
titanium, kehabluran dan sifat fotokonduksi yang baik. Keupayaan
pengelektroenapan -D.7 V (terhadap SeE) telah dipilih keupayaan optimum
berdasarkan mikroskopi elektron imbasan dan stoikiometri. Enapan yang
dihasilkan pada keadaan optima ini menghasilkan nisbah stoikiometri pada nilai
l.12 ± 0.05 SnlS, iaitu terlingkung di dalam julat nilai SnJS yang boleh
diterimapakai. Nilai luang tenaga, Eg bagi enapan yang disediakan di atas ITO di
bawah keadaan optima ini ialah 1.29 ± 0.29 eV bagi peralihan terus dan 0.74 ±
0.20 eV bagi peralihan tidak terus. Ini bersesuaian dengan yang dilaporkan oleh
Ettema et al. pada tahun 1992 di dalam jurnal Physical Review B, jilid 46,
nombor 12, yang menjumpai jurang tenaga bagi peralihan terns 1.39 eV dan bagi
peralihan tidak terus 0.2-0.4 eY.
VI
Kehadiran bahan aktif permukaan SDS didapati menunjukkan kesan
negatif kepada pengelektroenapan SnS. SDS tidak membantu pengelektroenapan
sebaliknya menyebabkan keracunan elektrod. Keracunan ini dijangka berpunca
daripada peningkatan pH, yang tidak sesuai untuk pengelektroenapan SnS.
Keupayaan asid tartarik untuk meratakan permukaan tidak dapat dilihat
dengan j elas dan ini mungkin disebabkan kesan kehadiran EDT A di dalam larutan
pengelektroenapan. Penambahan saiz yang dapat dilihat pada hablur
menunjukkan kemungkinan asid tartarik mampu meningkatkan kadar
pengelektroenapan. Kajian lanjut diperlukan bagi melihat kesan ini dengan lebih
terperinci.
VB

ACKNOWLEDGEMENTS
I wish to thank the Chainnan of the M. Sc. project, Assoc.
Prof Dr Zulkamain Zainal for his continuous assistance and
motivation, without which this project might not have come to
completion. I like to also acknowledge the help and guidance from
my co-supervisors; Assoc. Prof Dr Mohd Zobir Mohd Hussein
and Assoc. Prof Dr Anuar Kassim.
Also worthy of acknowledgement, are the staff of
Department of Chemistry (UPM), Puan Aminah, Mr Ho and Cik
Azilah of Veterinary Department (UPM), the technicians at XRD
laboratory of Department of Geology (UKM), Assoc. Prof Dr
Hamzah of Department of Geology (UKM) and Prof Ambar
Yarmo of Department of Materials and Applied Sciences (UKM).
Among others who deserve of this acknowledgement are
my respected parents and siblings who had been a constant push
when I had oftentimes wanted to quit. I also wish to thank an old
friend, Khairul Niza Abdul Razak for popping in from time to
time, reminding of this long-awaited task to be completed.
viii

It is a must for me to thank my husband who had been so
understanding and supportive during this course of study and who
had made the M. Sc. thesis write-up enjoyable and challenging at
the same time. Also to be acknowledged are the friends of my
husband at School of Physics, Universiti Sains Malaysia for their
technical assistance.
Finally, I must thank all the kind help of the staff at GSO,
Universiti Putra Malaysia. It is the help of you people that makes
graduating possible.
Thanking Allah, the Cherisher and the Sustainer of the Universe, for He is the Best of Helpers.
IX

I certify that an Examination Committee met on 27th October 2000 to conduct the final examination of Amiza Ghazali on her Master of Science thesis entitled "Electrochemical Synthesis of Tin Sulphide in Aqueous Media" in accordance with Universiti Pertanian Malaysia (Higher Degree) Act 1980 and Universiti Pertanian Malaysia (Higher Degree) Regulations 1981. The Committee recommends that the candidate be awarded the relevant degree. Members of the Examination Committee are as follows:
MOHD. ZAIZI DESA, Ph. D. Associate Professor, Faculty of Science and Environmental Studies Universiti Putra Malaysia (Chairman)
ZULKARNAlN ZAlNAL, Ph. D. Associate Professor, Faculty of Science and Environmental Studies Universiti Putra Malaysia (Member)
MOHD ZOBIR HUSSEIN, Ph. D. Associate Professor, Faculty of Science and Environmental Studies Universiti Putra Malaysia (Member)
ANUAR KASSIM, Ph. D. Associate Professor, Faculty of Science and Environmental Studies Universiti Putra Malaysia (Member)
GRAULI MORA YIDIN, Ph. D. ProfessorlDeputy Dean of Graduate School, Universiti Putra Malaysia.
Date: 1 5 DEC 2000

This thesis submitted to the Senate of Universiti Putra Malaysia has been accepted as fulfilment of the requirement for the degree of Master of Science.
Xl
KAMIS" A ANG, Ph. D. Associate Professor Dean of Graduate School, Universiti Putra Malaysia.
Date: 1 1 JAN 2001

DECLARA TION
I hereby declare that the thesis is based on my original work except for quotations and citations which have been duly acknowledged. I also declare that it has not been previously or concurrently submitted for any other degree at UPM or other institutions.
xii
(ARNIZA GHAZALI)
Date: I Gil �l>ooo

TABLE OF CONTENTS
Page
ABSTRACT ................................................................. . . . .................. 11 ABSTRAK .................................................................... .................... v ACKNOWLEDGMENTS ............................................................... VIII )lJ»J»It()"1\� •.•..•..•..•..•..•....•..•..•..••••.•..••..•..•..••.•......•..•.. )( DECLARATION FORM . .. . . . . . . ........ . .. . . . . . . .. . . . . . . . . ... . . .. . . . . .. Xl LIST OF TABLES ........................................................................... XVI LIST OF FIGURES ......................................................................... XVIII LIST OF PLATES ........................................................................... XXI LIST OF ABBREVIA TIONS .......................................................... XXII
CHAPTER
I
D
INTRODUCTION .............................................. . .... .
LITERATURE REVIEW ....................................... .
Semiconductors Band Model of Solids
1
6 6 6
Band Model of Semiconductors 7
Conductivity Type in Extrinsic Semiconductor 10 Transition Type 12
Semiconductor Varieties 15
Commercialisation Prospects 16
Phase Transition in Tin Chalcogenides 19
a and f3 Transition in Tin Sulphide 21
Chemical Solution Process 26
Eiectrodeposition vs. Electroless Deposition 27 Desirability of Electrodeposition 29 Anodic and Cathodic Electrodeposition 30
Electrodeposition in Aqueous Media 3 1 Other Works on Deposition ofSnS 33
DI. MATERIALS AND METHODOLOGy............ . ........... 42 � � Electrodes 44
Working Electrode 44 Reference Electrode 46
Auxillary Electrode 47
Electrodeposition 47
Characterisation of Deposits 51
Energy Dispersive Analysis of X-ray (EDAX) 51
Xlll

Photoelectrochemical Study (PEC) 56 Scanning Electron Microscopy (SEM) 57 X-ray Diffraction (XRD) 61 X-ray Photoelectron Spectroscopy (XPS) 63 UV-Visible Spectroscopy 65
IV RESULTS AND DISCUSSION ..................... . ................ 68 Optimisation 68
Transient in Thiosulphate Concentration 69 Transient in Stannous Ion Concentration 76 Transient in Sn-EDTA Complex Concentration 82 Transient in EDT A Concentration 88 Transient in Electrodeposition Potential 92 Photoresponse and the Optimum Condition 99 Overall
Electrosynthesis of SnS With and Without EDT A 103 Analysis of Stoichiometry 103 Morphology 104 Optical Property 110 Structural Analysis 113 Photoactivity 115 Adhesion 116 Bath Longevity 116
Effect of Tartaric Acid and Sodium Dodecyl Sulphate 117 (SDS) on the Optimised Condition
Analysis of Stoichiometry 117 Morphology 118 Structural Analysis 121
V SUMMARY AND RECOMMENDATION ...... . . . . ........ 125
�����<:�� .................................................. 129
XlV

APPENDICES ......................... . ......... . ..................... 134 Appendix A: SniS Values for Analysis of 134
Stoichiometry Appendix B: X·ray Diffractogram 141 Appendix C: XPS Results 155 Appendix D: In-situ Examination of Deposits: 160
Analysis of Photoresponse Appendix E: Estimation of Thickness 165 Appendix F: UV-visible Spectroscopy for 167
Determination of Band Energy
VITA.. ............................................................. 222
xv

LIST OF TABLES
Table Page
1.1 Bandgap of Sn Binary Compounds Rendering Semi conductive 2 Property.
2.1 Elementary, Binary and Ternary Semiconductors with Some Showing 15 Distinguished Properties of Narrow-gap Semiconductor.
2.2 Bond Length and Strength of (1, - and /3-SnS. Reproducedfrom [38j. 23
2.3 Difference in Lattice Parameters as a Result of Phase Transition. 23 Reproducedfrom [38j.
2.4 Dual Property of Optical Transition. 25
2.5 Deduction of Reaction Corresponding to Signals at a Specific 38 Potential.
2 .6 Deduction of Reaction Corresponding to a Signal at a Specific 40 Potential.
3.1 Quantity of Each Solution in the Electrodeposition Bath and 48 Photoelectrochemical (PEC) Test Bath (No. 3).
3.2 Variation of Parameters Selected for Systematic Study 50
3 .3 Recognition of Peaks in an EDAX Chart. 53
3 .4 Determining Sn:S Stoichiometry at xlOO Magnification Based Upon 54 Peak Maximum Height and Peak Area.
3 .5 Demonstrating an Outlier, Q. 55
3.6 Eight Important Regions for Characterisation of a Diffractogram 62
3.7 Specific Binding Energy of Compounds Possibly Present in the Thin 64 Film.
4.1 EDAX Analysis for SnJS Ratios. 69
4.2 Eight Regions of Interest for Characterisation of a Diffractogram 74
XVI

4.3 Signal Intensity for Characterisation of Deposits. 75
4.4 EDAX Data for Sn/S Ratio. 78
4.5 Signal Intensity for Characterisation of Deposits. 8 1
4 .6 Signal Intensity for Characterisation of Deposits. 87
4.7 Signal Intensity for Characterisation of Deposits. 9 1
4.8 Sn/S Ratio from EDAX with Respect to Various Magnifications. 92
4.9 Signal Intensity for Characterisation of Deposits. 98
4. 10 Sn/S for Samples Prepared With and Without EDTA 1 03
4. 1 1 Comparison of Composition from XPS Analysis. 1 06
4. 1 2 Comparison ofEg to Optical Tansition. 1 10
4. 1 3 SnJS Ratio from EDAX. 1 1 7
4. 14 XRD Signal Intensity for Characterisation of Deposits. 1 24
XVII
LIST OF FIGURES
Table Page
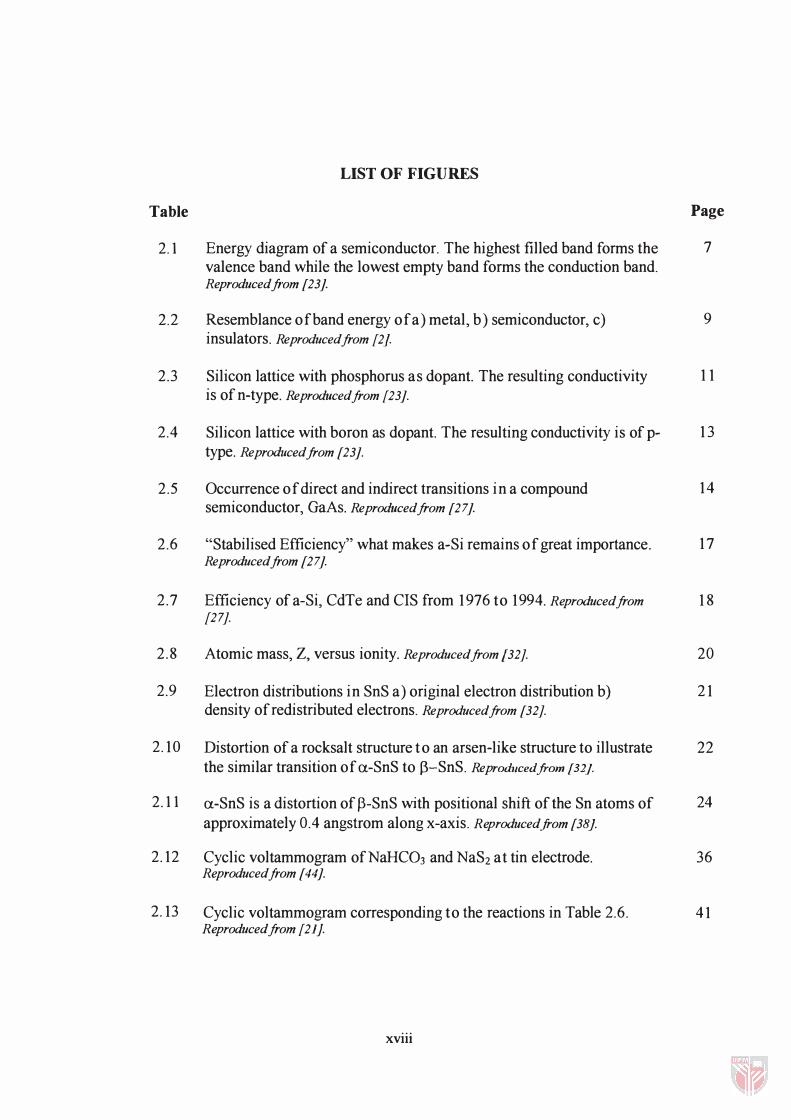
2.1 Energy diagram of a semiconductor. The highest filled band forms the 7 valence band while the lowest empty band forms the conduction band. Reproducedfrom [23J.
2.2 Resemblance of band energy of a) metal, b) semiconductor, c) 9 insulators. Reproduced from {2 J.
2.3 Silicon lattice with phosphorus as dopant. The resulting conductivity 1 1 is of n-type. Reproducedfrom {23].
2.4 Silicon lattice with boron as dopant. The resulting conductivity is of p- 1 3 type. Reproducedfrom [23].
2.5 Occurrence of direct and indirect transitions in a compound 14 semiconductor, GaAs. Reproducedfrom [27J.
2.6 "Stabilised Efficiency" what makes a-Si remains of great importance. 1 7 Reproducedfrom [27J.
2.7 Efficiency of a-Si, CdTe and CIS from 1 976 to 1994. Reproducedfrom 1 8 {27].
2 .8 Atomic mass, Z, versus ionity. Reproducedfrom (32]. 20
2.9 Electron distributions in SnS a) original electron distribution b) 2 1 density of redistributed electrons. Reproducedfrom [32].
2. 1 0 Distortion of a rocksalt structure t o an arsen-like structure to illustrate 22 the similar transition of a-SnS to B-SnS. Reproducedfrom [32].
2.11 a-SnS is a distortion of p-SnS with positional shift of the Sn atoms of 24 approximately 0.4 angstrom along x-axis. Reproducedfrom [38}.
2. 12 Cyclic voltammogram ofNaHC03 and NaSz at tin electrode. 36 Reproducedfrom [44J.
2. 13 Cyclic voltammogram corresponding to the reactions in Table 2.6. 4 1 Reproduced from {2l J.
xviii

3 1 SIde VIew of the electrodepositlon cell shoWing the relatIve positlon of 43 all electrodes
3 2 Expenmental setup for electrodepositlon of SnS 43
3 3 Front VIew and cross-sectIOnal VieW of the holder of titamum substrate 45
3 4 EDAX chart of SnS standard of 96% punty 53
3 5 Top VIew of the sample deposIt prepared on titamum substrate and 57 regIOns of analysIs With respect to magmficatIOn
3 6 Cleft and tIlted tltamum substrate placed on the stub In the 59 mIcroanalytIC umt
3 7 DIfferentiatIOn between a) dIrect and b) IndIrect optIcal transItIOns 67 from the A versus A output Note the dIfferent A range Reproducedfrom
[20J
4 1 Dotplot of Sn/S ratios The two thIOsulphate concentratIon extremes 70 render values beyond the border of acceptable range
4 2 Control chart shOWing Sn/S ratIos versus stannous Ion concentratIOn 77 m the electrodeposlt1on bath
4 3 Control chart shOWing Sn/S ratIOS versus Sn-EDT A concentratIOn In 83 the electrodeposltlon bath
4 4 Large dIfference m composItIOn when regIOn of analysIs IS extended 83
4 5 Sn/S dIstnbutIOn at vanous magmficatlon 84
4 6 Control chart showmg Sn/S ratIOS versus EDT A concentratIOns m the 89 electrodepositton bath
4 7 Sn/S ratIos from EDAX agamst electrodepositIOn potentIal 93
4 8 Cychc voltammogam of an earlIer study by Zulkamam and co- 97 workers Reproducedfrom [21J
4 9 The graph of lmax-1dk® For method of DetenmnatlOn, refer Appendix 100 D2
XIX
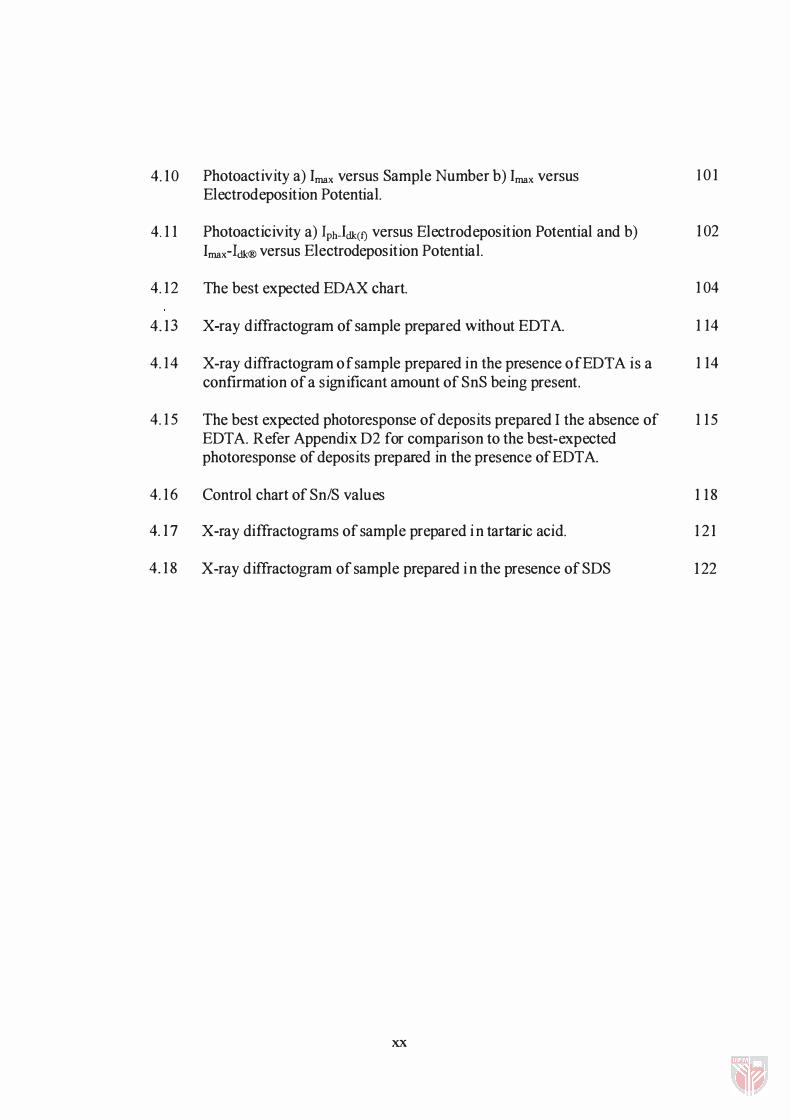
4. 1 0 Photoactivity a) lmax versus Sample Number b) lmax versus 1 0 1 Electrodeposition Potential.
4. 1 1 Photoacticivity a) IphJdk(f) versus Electrodeposition Potential and b) 1 02 lmax-1dk® versus Electrodeposition Potential.
4. 12 The best expected EDAX chart. 1 04
4. 13 X-ray diffractogram of sample prepared without EDTA. 1 14
4. 14 X-ray diffractogram of sample prepared in the presence of EDT A is a 1 14 confirmation of a significant amount of SnS being present.
4. 1 5 The best expected photoresponse of deposits prepared I the absence of 1 1 5 EDT A. Refer Appendix D2 for comparison to the best-expected photoresponse of deposits prepared in the presence of EDT A.
4. 1 6 Control chart of SnlS values 1 1 8
4. 1 7 X-ray diffractograms of sample prepared i n tartaric acid. 1 2 1
4. 1 8 X-ray diffractogram of sample prepared i n the presence of SDS 122
xx

LIST OF PLATES
Table Page
3.1 Different undeposited electrode surface 46
3.2 Amount of deposits with variation in deposition period 52
3.3 The cleft Ti surface of deposited titanium at x230 magnification. 60 Thickness was estimated between 10-100 J..lm. This uncertainty is due to insufficient contrast between TilTi( 45°)/SnS( 45°)/SnS surface layers.
4.1 SEM of samples prepared at thiosulphate concentration extremes. 73
4.2 SEM captured at xl 000 magnification. 80
4.3 SEM at xl 000 and x6500 magnifications of samples prepared at three 86 Sn-EDTA concentrations; a) and b) 0.85 mM, c) and d) 1.35 mM, e) and f) 2.55 mM.
4.4 SEM of deposits prepared at three different EDT A concentrations 90 captured at x20 000 magnification.
4.5 SEM of sample prepared at varying potential. 96
4.6 Difference in morphology of deposits synthesised in the presence of 109 EDTA (a, b and c) and deposits synthesised in the absence of EDT A (d, e and f).
4.7 SEM of deposits prepared in the presence «i), (ii) and (iii» and 120 absence «iv), (v) and (vi» of tartaric acid.
4.8 SEM of Deposits prepared in SDS. 121
xxi

A
AE
a-Si
CE
CIS
CV
E
Edep
EDAX
EDTA
Eg
eV
FF
Lwk Imax
Iphoto
ITO
JCPDS
LCL
LSV
LIST OF ABBREVIATIONS
Absorbance
Auxilary electrode
Amorphous silicon
Counter electrode
Copper indium diselenide
Cyclic voltammetry/voltammogram
Potential in volts
Deposition potential
Energy dispersive analysis of x-ray
Ethyl diamine tetra acetic acid
Energy gap
Electron volts
Fill factor
Dark current
Current maximum
Photocurrent
Indium doped tin oxide
Joint committee on Powder Diffraction Standard
Lower control limit
Linear scan voltammetry/voltammogram
XXII

LSPV
PEe
PVC
Q
a
SCE
SDS
SEM
J.l
J.lpdsm
UCL
UKM
UM
UPM
USM
28
WE
Wp
XPS
XRD
Linear scan photovoltammetry
Metal ion with n charge, where n=1,2,3, etc.
Photoelectrochemical analysis
Polyvinyl chloride
Outlier (statistical term)
Standard deviation (statistical term)
Saturated calomel electrode
Sodium dodecyl sulfate
Scanning electron microscopy
Mean (Statistical term)
Micro powder data search match
Upper control limit
Universiti Kebangsaan Malaysia
Universiti Malaya
Universiti Putra Malaysia
Universiti Sains Malaysia
Two theta
Working electrode
Watt power
X-ray photoelectron spectroscopy
X-ray diffraction
xxiii
CHAPTER I
INTRODUCTION
The era of science and technology will be left for the ionic and protonic
technology, by which this work is motivated. Reducing the dimensions of devices is
one of the aspects in focus [1]. One of the works prompted by this is the development
of thin films from which the idea of electrochemical technique stems for the synthesis
of tin sulphide, SnS. This phase of Sn-S compounds reveals the features of an ideal
semiconductor with Eg falling in the range of 1-2 eV (Table 1.1), making it suitable for
photoelectrochemical, photovoltaic and optoelectronic applications, for instance.
The thin film form of SnS and other more common binary compounds such as
CdS, GaAs, ZnS, ZnSe and CdSe, capture a significant interest of scientists in many
fields, vis-a-vis Energy, Solar Cell Devices, Silicon and Tin Technology, Materials,
Chemistry Electronic Industry and etceteras. In Malaysia, thin film technology is one
of the most important technologies in the electronic industry to account for its being
world's third largest exporter of semiconductor. With Sn and Si abundance, Malaysia
is in even better position for the world market ofUSDlOO billion for thin film [ 1 ] .
1
Top Related