


Languages
Pages
Legal

The Digital Economy and Social Media
Amit Kapoor

India’s Digital Leap
1.2 b people enrolled in the world’s largest unique identity digital programmeN
o. 1
In 2018, India was second only to China in its mobile and internet usage
12.3 bapp downloads
1.17 bwireless phone
subscribers
350 msocial media
users
560 minternet subscribers
1.2 b 870 m Indians have digital banks accounts for online service delivery
No.
2
spent by Indians on social media on an average; more
than either Americans or the Chinese
17 hrsper week
AADHAR
MOBILE

Digital India and Public Digital PlatformsAcceleration Digital Adoption
AADHAR UID12 digit unique identification number based on biometric and demographic data
26.7 b Aadhar-based authentications as of January 2019
UNITED PAYMENTS INTERFACEEnables all bank account holders to send and receive money instantly using smartphones
3.7 b cumulative transactions between during Jan – Dec 2018
DIGILOCKERPlatform for issuing and verifying documents digitally using cloud storage
17.4 m users of the service as of January 2019
GSTNUnified indirect tax administration platform for the entire country to handle invoices, registrations and payments
10.3 m businesses registered as of March 2018

0
10
20
30
40
50
60
70
80
90
100
0
200
400
600
800
1000
1200
1400
2002 2003 2004 2005 2006 2007 2008 2009 2010 2011 2012 2013 2014 2015 2016 2017 2018 2019
Tele
dens
ity
Subs
crib
er B
ase
(in m
illio
ns)
Wireless Wireline Teledensity
894 944
1191
2011 2014 2018
Mobile Subscriptions (in millions)
22
267
560
2011 2014 2018
Internet Subscriptions (in millions)
Large-Scale Digital Adoption in India Driven by Government and Market Forces
Source: TRAI Reports

Large-Scale Digital Adoption in India Driven by Government and Market Forces
0
0.2
0.4
0.6
0.8
1
1.2
1.4
GB
per M
onth
(Bill
ion)
Wireless Data Usage Over Time
0.26
0.91
1.73
2.22
2.47
2.99
3.5
3.79
6.66
6.96
9.89
12.02
12.37
15.12
20.22
0 5 10 15 20 25
India
Russia
Italy
Nigeria
Australia
France
Brazil
Spain
United Kingdom
Germany
China
Canada
United States
South Korea
Switzerland
Cost of Mobile Internet Around the World (in $)Source: Mary Meeker/Kleiner PerkinsSource: cable.co.uk (2019)
0500
1000150020002500300035004000
2016 2017 2018Pa
ymen
ts in
Vol
ume
(INR
Mill
ion)
Growth in Digital Payments Over Time
UPI Mobile Wallet Debit Card
Source: RBI, NPCI

But Immense Scope for Improvement Remains…
5.5 26.2
95.8
India2014
India2018
Sweden2017
Number of Smartphones(per 100 people)
0.09
8.3
15.5
India2014
India2018
Finland2017
Average Mobile Data Consumption (per user per month in Gigabytes)
5.4 34.3
144.4
India2014
India2018
Singapore2017
Mobile Broadband Subscriptions(per 100 people)
2.2 18
802
India2014
India2018
Singapore2017
Number of Cashless Transactions (per person per year)
Source: MGI Report

Impact of Internet Access on the Indian EconomyA Regression Analysis
In order to test the impact of internet penetration on GDP per capita levels of regions, a fixed effects panel data regression was estimated. The data pertains to 18 Indian states for the period 2004-2014.
The model used is as follows:
Log GDPit = α + β Lit + γ GCFit + δ Log IPenit + ε
Log GDPit is the logarithmic value of state GDP per capita in ith state in year t;Lit is the labour population of the state in ith state in year t;
GCFit is the gross capital formation of the state excluding investment in telecom;IPenit is the logarithmic value of internet penetration within the state in ith state in
year t
The model shows that
increase in internet penetration leads to10%
an increase in GDP by
10%
3.9%keeping all other factors constant

E-GovernanceApplications
Gove
rnan
ce
Government to Government
(G2G)
Government to Business (G2B)
Government to Citizens(G2C)
A number of services are being offered by the government agencies to the citizens that can range from a simple request resolution to anything useful to both the parties.
Policy Examples: JAM Trinity; e-Services like Passport, Birth and Death Registration; DBT Bharat; e-Kranti; UPI.
Government departments need to interact with various business houses. The conduct of online transactions simplifies the regulatory processes and help the businesses to become
more competitive. Policy Examples: Goods and Services Tax Network; Ease of Doing Business
like e-tendering, e-procurement.
Online interaction between central government departments, state government authorities and government organisations enhance the efficiency and evoke greater innovation.
Policy Examples: Data Smart Cities, Control and Command Centre

Government to Business
422
5885
17325
0
5000
10000
15000
20000
2016-17 2017-18 2018-19
Rs. C
rore
s
Government e-Marketplace (GeM) Transations• 25 percent of average savings across
transactions. This can be used for other development projects.
• 42 percent of the transactions by volume are done by MSME. Efforts can be made to bring start-ups, small artisans and SHGs on this platform.
Target Transactions in 2019-20
₹ 50,000 Cr.
Buyer Organizations
Government e-Marketplace
• India’s government spends 20 percent of GDP on public procurement.
• To tackle the issues of decentralized procurement, GoIset up Government e-Marketplace (GeM).
• It is the National Public Procurement Portal for providing procurement of goods and services required by Central & State Government organizations.
• The platform reduces manual process inefficiencies and human interventions in procurement and enables increased coverage, access, and efficiency of faceless standardised public procurement.
E-Marketplace
Sellers & Service Providers
35,935 2,35,630From 30-60 days to 10-15 days
Fall in delivery time

Government to CitizensJandhan Aadhar Mobile (JAM)
The combination of 32.94 crore Jandhan bank Accounts, 121 Crore mobile phones and digital identity through 122 crore Aadhaar is helping the poor receive the benefits directly into their bank account
85% of Indian citizens now having abank account, compared to 45% in2014.
Residents have a unique biometricidentity card and a digital platform toauthenticate anywhere and anytime.
1191 million mobilesubscriptions and 560 millioninternet subscriptions.
2. Enhancing Financial Inclusion 3. Empowering citizens economically 4. Improving Ease of Living1. Improving public delivery

Government to CitizensDirect Benefit Transfers: Addressing Public Welfare Delivery
0
10,000
20,000
30,000
40,000
50,000
60,000
70,000
PAHA
L
PDS
MG
NRE
GS
Aang
anw
adi
Serv
ices
Fert
ilize
rSu
bsid
y
Oth
ers
INR
Cror
e
Cumulative Savings in different Schemes(Up to March 2019)
• Over the last two years, DBT has significantly picked up. In 2018-19, ₹2 trillion (around 8% of total government expenditure) was delivered through DBT into beneficiary accounts according to the DBT Mission.
• The DBT Mission estimates that Aadhaar and DBT have helped save the government around ₹1.2 trillion since 2014.
Year-Wise Fund Transfer Across Different Schemes Through DBT Source: DBT India
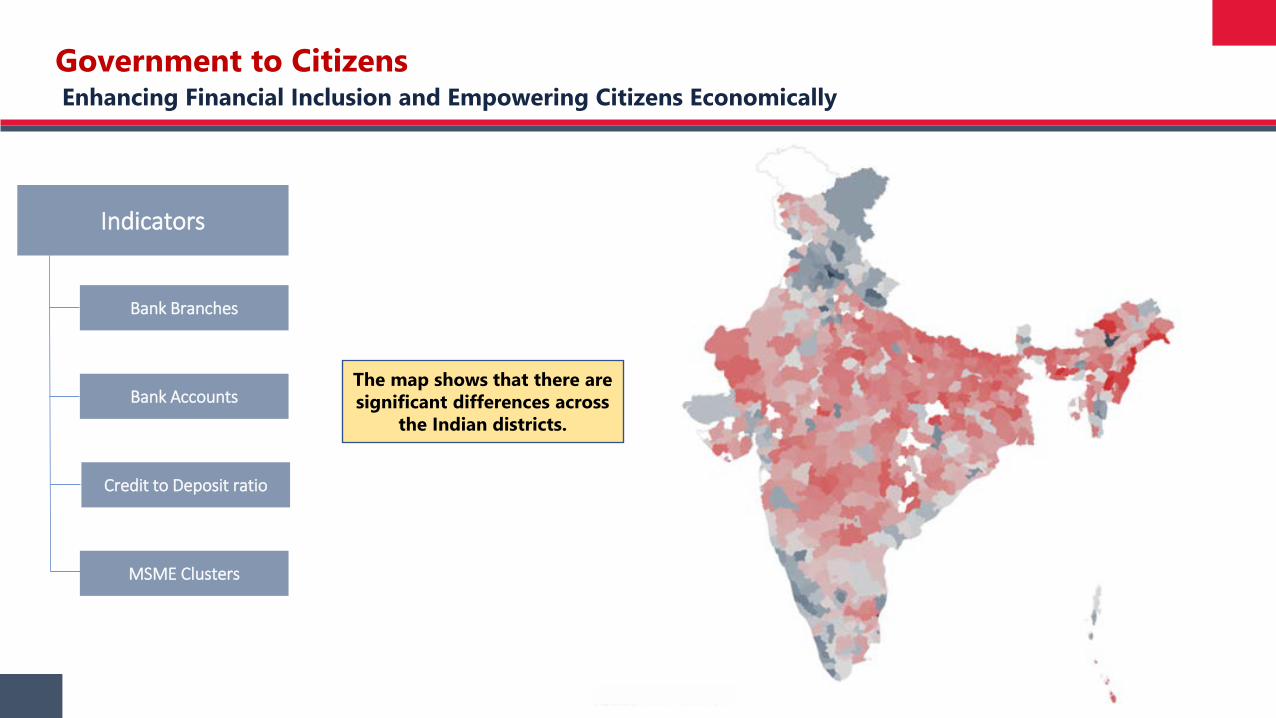
Government to CitizensEnhancing Financial Inclusion and Empowering Citizens Economically
Indicators
Bank Branches
Bank Accounts
Credit to Deposit ratio
MSME Clusters
The map shows that there are significant differences across
the Indian districts.

Social Progress Framework

Social Progress and Economic Development
First, there is a positive and strong relationship between NSDP (Net State Domestic Product) per capita and the Social Progress Index. For instance, Bihar with a per capita NSDP of 15,506 scores 44.89 on the Social Progress Index, States of India. On the other hand, Goa with NSDP per capita of 137,401 has a Social Progress Index score of 63.39. At an aggregate level, a one percent increase in NSDP per capita is associated with a 0.08-point increase in Social Progress Index score.
Second, the relationship between social progress and NSDP (economic development) is not linear. At lower levels of income, a small change in NSDP leads to great advancements in social progress scores. However, as income levels rise, the rate of change slows.
Third, despite the correlation between NSDP per capita and the Social Progress Index, a considerable amount of variability in social progress is observed among states with comparable levels of NSDP per capita. Hence, economic performance alone does not fully explain social progress. This fact, which was empirically established by the Global Social Progress Index holds true for the Indian states as well. The model has an R-squared value of 0.54 i.e. only 54% of the changes in social progress can be explained by the NSDP per capita.

Social Progress and Economic Development
0
100
200
300
400
500
600
700
0 100 200 300 400 500 600 700
Soci
al P
rogr
ess R
ank
Economic Density Rank
District Level Relationship

How Social Progress has improved over the years

Social Progress Scorecard

Access to Information & Communication and Economic Development
Indicators
Mobile Phones
Television
Internet

Government to CitizensMeasuring Ease of Living across Indian Districts
The framework captures Ease of Living by looking at three main pillars: Basic Needs, Elements of Welfare and Scope of Human Betterment.
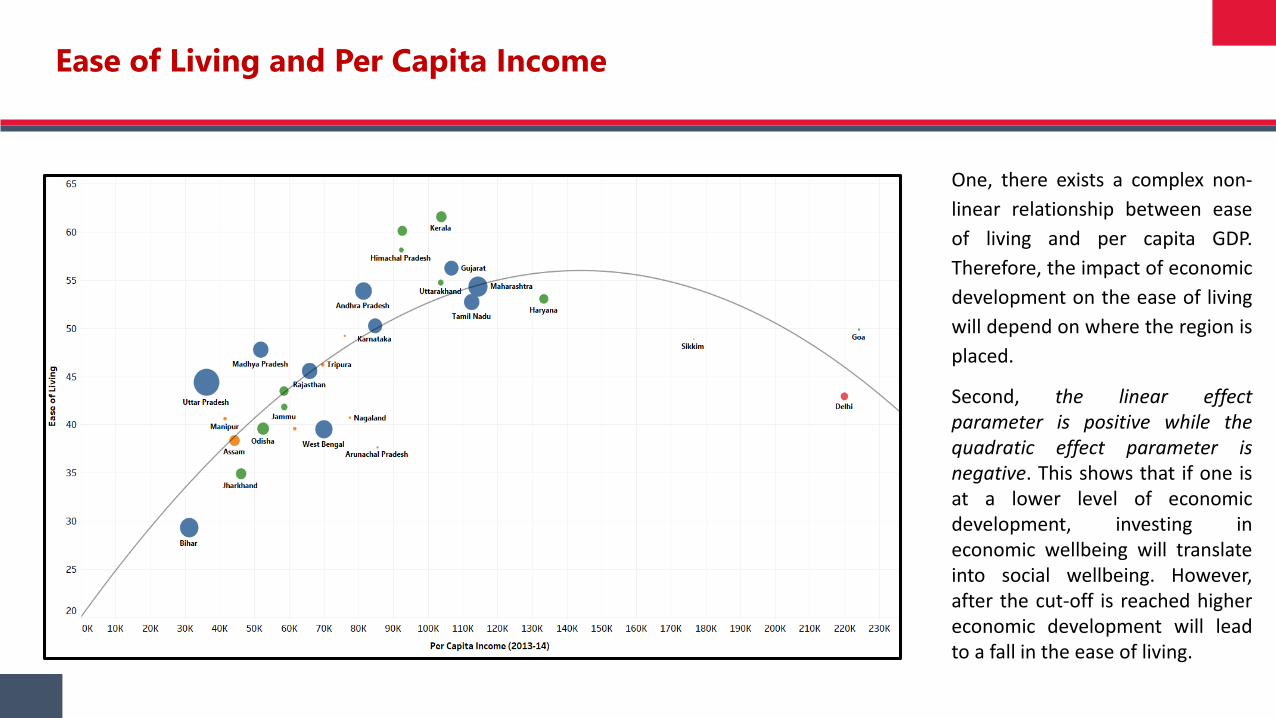
Ease of Living and Per Capita Income
One, there exists a complex non-linear relationship between easeof living and per capita GDP.Therefore, the impact of economicdevelopment on the ease of livingwill depend on where the region isplaced.
Second, the linear effectparameter is positive while thequadratic effect parameter isnegative. This shows that if one isat a lower level of economicdevelopment, investing ineconomic wellbeing will translateinto social wellbeing. However,after the cut-off is reached highereconomic development will leadto a fall in the ease of living.
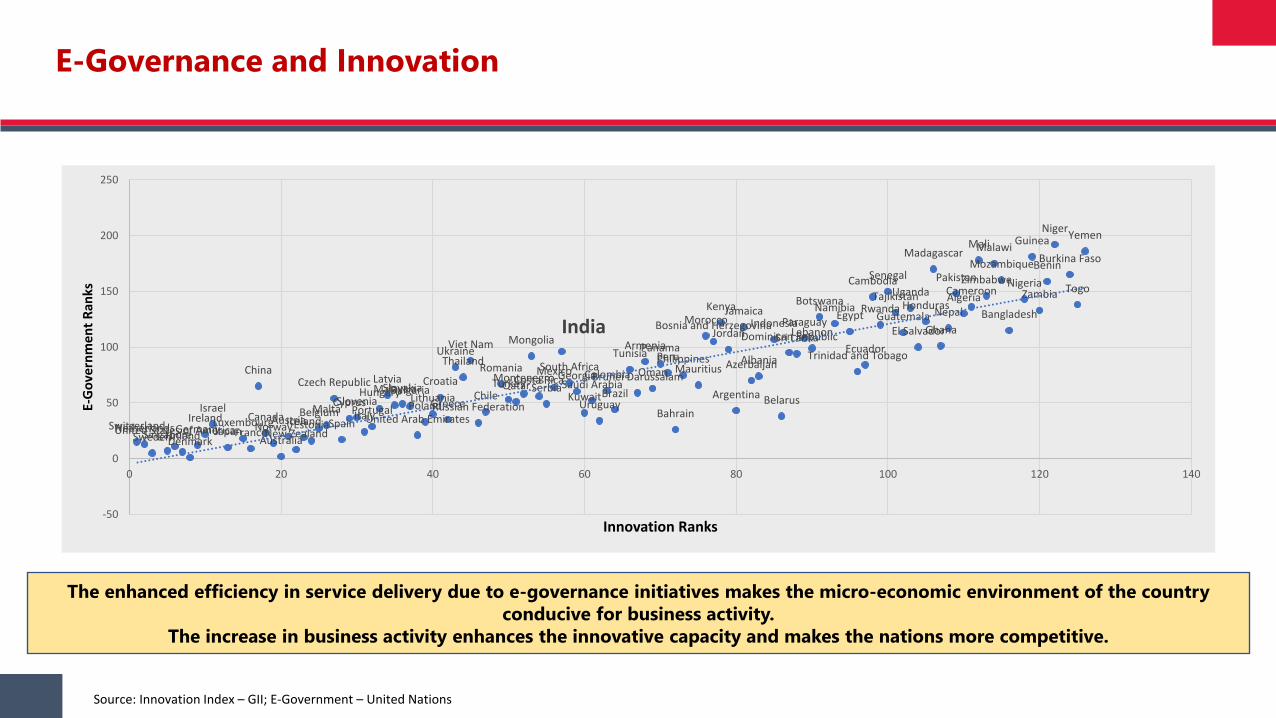
E-Governance and Innovation
SwitzerlandNetherlandsSwedenSingaporeUnited States of AmericaFinlandDenmark
GermanyIreland
Israel
JapanLuxembourg
France
China
CanadaNorwayAustralia
AustriaNew Zealand
IcelandEstoniaBelgiumMalta
Czech Republic
Spain
CyprusSloveniaItalyPortugalHungary
LatviaMalaysiaSlovakiaBulgaria
United Arab EmiratesPolandLithuania
Croatia
Greece
UkraineThailand
Viet Nam
Russian FederationChile
RomaniaTurkeyQatarMontenegro
Mongolia
Costa RicaSerbiaMexico
India
South AfricaGeorgia
KuwaitSaudi Arabia
Uruguay
Colombia
Brazil
Tunisia
Brunei Darussalam
Armenia
Oman
PanamaPeru
Bahrain
PhilippinesMauritius
MoroccoBosnia and Herzegovina
Kenya
Jordan
Argentina
Jamaica
AzerbaijanAlbania
Indonesia
Belarus
Dominican RepublicSri LankaParaguay
Lebanon
BotswanaNamibiaEgypt
Trinidad and TobagoEcuador
Cambodia
Rwanda
Senegal
Tajikistan
Guatemala
Uganda
El Salvador
Honduras
Madagascar
GhanaNepal
Pakistan
AlgeriaCameroon
Mali
Zimbabwe
MalawiMozambique
Bangladesh
Nigeria
Guinea
Zambia
Benin
Niger
Burkina Faso
Togo
Yemen
-50
0
50
100
150
200
250
0 20 40 60 80 100 120 140
E-G
over
nmen
t Ran
ks
Innovation Ranks
The enhanced efficiency in service delivery due to e-governance initiatives makes the micro-economic environment of the country conducive for business activity.
The increase in business activity enhances the innovative capacity and makes the nations more competitive.
Source: Innovation Index – GII; E-Government – United Nations

Innovation and Competitiveness
When firms innovate, they derive prosperity by creating value adding products through realization of the resources. This ability to innovate increases the productivity and in turn enhances the competitiveness. So, innovation should be considered as the basis of
creating prosperity.
Global and State Level Relationship
Switzerland
India
Yemen
30
40
50
60
70
80
90
100
10 20 30 40 50 60 70 80
Glo
bal C
ompe
titiv
enes
s Ind
ex 2
018
Scor
es
Global Innovation Index 2018 Scores
ANDHRA PRADESH
ARUNACHAL PRADESHASSAMBIHAR
CHHATTISGARH
DELHIGOA
GUJARAT
HARYANAHIMACHAL PRADESH
JAMMU & KASHMIRJHARKHAND
KARNATAKA
KERALA
MADHYA PRADESH
MAHARASHTRA
MANIPURMEGHALAYA
MIZORAMNAGALAND
ODISHA
PUNJAB
RAJASTHAN
SIKKIM
TAMIL NADU
TELANGANA
TRIPURA
UTTARAKHAND
UTTAR PRADESH
WEST BENGALR² = 0.7506
15
20
25
30
35
40
45
50
55
0 5 10 15 20 25 30 35 40 45 50
Stat
e C
ompe
titiv
enes
s In
dex
Scor
es
India Innovation Index Scores

Social Media Growth in IndiaThe Problem of Fake News
Source: Statista 2019
142.23
168.1
296.3
326.1
351.4
0 50 100 150 200 250 300 350 400
2015
2016
2017
2018
2019
Number of Social Network Users in India (in millions)
260 million users
200 million users
35 million users
78 million users

Creative EconomyTechnology, Talent and Tolerance
Creative Economy of Indian CitiesTechnology, Talent, and Tolerance are the three most crucial factors that are neededto explain the rise and fall of cities. A confluence of all these 3Ts of economicdevelopment determines the economic potential and capability of cities to attractand retain the Creative Class.
Technology is a critical component that a city needs to have in place for achievingeconomic growth and prosperity. It improves the competitiveness of a region byaddressing societal needs in an efficient, cost-effective manner. Robert Solow andTrevor Swan showed in their Nobel Prize-winning work how varying rates oftechnological progress could explain the differences in the standard of livingbetween different countries.
Talent is another crucial element that determines regional development. Talentedindividuals generate innovative ideas that lead to the development of technologies,which stimulate economic growth. Apart from investing in people to develop talent,cities need to attract and retain talent as well to maintain a competitive edge.
Tolerance of diverse group of people is imperative for the development of cities. Anopenness to diversity can provide an economic stimulus to nations, regions, andcities due to low entry barriers for talented individuals. It boosts the ability ofnations and regions to mobilize their creative capacities and compete for creativetalent, i.e. the more tolerant or open a country or region is, the more talent it is ableto mobilize and attract. Unfortunately, tolerance is nearly absent from conventionaleconomic models.

Competitiveness and Creative Economy

DOES LACK OF TRUST UNDERMINE COMPETITIVENESS?
• Lower level of trust in market competition leads to collusion and illegal cartels as well as corruption.
• Low trust also results in negative perception of the regulators.
• Trust in regulators and rule of law also critical for smooth functioning.
• Independent regulators critical for institutional trust.
Related, Supporting Industries And Institutions
Demand ConditionsFactor Conditions
Context for Firms Strategy And Rivalry
• Trust is critical in factor markets for appropriate resource allocation.
• Rent seeking reduces trust and creates an atmosphere of corruption.
• Inadequate/arbitrary policy design leads to erosion of trust.
• Risk of the market is in the form of trust that the goods and services produces will be consumed.
• Lower level of trust in institutions undermines the rule of law. • Low level of trust leads to non sharing of know how resulting in
lesser network externalities of agglomerations. • Trust in institutions undermined when they harass companies. • Vicious cycle also leads to poor quality services as nobody is
willing to provide them in an over-regulated economy.
• Quality, price and differentiation are the main considerations essential for the consumer to trust the producer.
• If the consumer does not trust the producer sale may not happen.
• Effect is a slowing down economy with low level of consumption and investments.
• Safeguards in the economy include quality certifying institutions as well as branding of the product.

Digital ToolsBoon or Bane for democracy?
Digital Communication Technologies
were supposed to be a boon for democracy
A discussion platform that cannot be influenced by
authoritarian powers
Direct and Unfiltered access to information impacts quality of public deliberation
Inexpensive platform for leaders to engage with
citizens
Examples include downfall of oppressive regimes in Libya, Tunisia and Egypt
However, during the last decade, negative aspects of digital tools have become apparent. Democratic processes are being influenced in three ways.
Spreading Fake News by conducting disinformation campaigns.
Examples: Bots and Sock - puppets
Conducting Cyber Attacks on government’s and political party’s data
Examples: Leaking data of Emanuel Macron two days before 2017 French Presidential elections
Using Big data and micro targeting techniques to disseminate messages
Example: BrexitThe Leave party was assisted by companies in micro-targeting advertisement
The best way to tackle this challenge is that greater access to information must be accompanied by digital literacy programs to educate citizens how to discern genuine from fake news.

The Rise of Populism
Number of countries ruled by populist leaders
Source: Kyle, J., & Gultchin, L. (2018). Populist in Power Around the World
• We can trace the origin of the term populism back to agrarian protests in the late 1800s in the United States and Russia.
• In the early 1900s, the idea spread its footprint in Latin America, starting with Brazilian leader Getúlio Vargas assuming power in 1930.
• Next door to Brazil, populism also fueled the political movement that developed around Argentina’s Carlos Menem. Yet, until the 2000s, populism was a limited phenomenon.
• The recent evidence of populism we see in the headlines is not unexpected; rather, it has been building up for the last two decades. Since 2000 the number of populist leaders has more than doubled.

The Rise of Populism
The world is moving away from from globalization towards individually stronger nation-states, and the rise of populist parties, a sign of a dynamic democracy, is a product of this movement.
We can trace the factors driving this shift back to the decades of building resentment among the masses.
0%
50%
100%
150%
200%
250%
300%
1948
1950
1952
1954
1956
1958
1960
1962
1964
1966
1968
1970
1972
1974
1976
1978
1980
1982
1984
1986
1988
1990
1992
1994
1996
1998
2000
2002
2004
2006
2008
2010
2012
2014
2016
Hourly compensation Productivity
1948-1973:Productivity: 96.7%Hourly Compensation: 91.3%
1973-2016:Productivity: 73.7%Hourly Compensation: 12.3%
Stagnation of wage growth for the US economy
0%
2%
4%
6%
8%
10%
12%
14%
16%
18%
20%
22%
24%
1910 1920 1930 1940 1950 1960 1970 1980 1990 2000 2010
SHAR
E O
F TO
P PE
RCEN
TILE
IN T
OTA
L IN
COM
E
U.S. U.K. Canada Australia
Income inequality in Anglo-Saxon countries
Reasons

Brexit
Equation:
Lla = β1* MSla + β2* Perceptionla + β3* Educationla + β4* Agela + ewhere,
L is the dependent variables that shows the share of leave votes;MS is the migration shock;
Perception is the anti-EU sentiment;Education is the percentage of population with Level 4 or more qualification;
Age is the percentage of population within the 18-29 age bracket.
The model together explains 90 percent of the variation in the leave votes.
VariableRelationship with Leave votes
Coefficient p – Value
Migration Shock Positive 0.006 0.001
Perception (Anti-EU sentiment)
Positive 0.695 0.000
Education (Level 4 or more)
Negative -0.603 0.000
Age (18-29)
Negative -0.081 0.079
Insights:
Immigration might have influenced the leave vote in two ways.
• First, by creating resentment towards the European integration. There is vast literature that suggests that if citizens feel their national identity is being threatened by the integration, they will vote to leave to the European Union.
• Second, the influx of immigrants is associated with loss of jobs, especially for the unskilled population. This is captured in the model through the education indicator.

How Indian citizens vote
Wha
t mat
ters
for I
ndia
n Ci
tizen
s Economic theory of Voting
Social Progress
Narrative (Confidence on the party and
leaders)The second crucial factor which dominates the arena of decision making
is the sentiment towards the government and the noteworthy role of media in shaping any political elections in the country.
The analysis brings out that while casting their vote, people keep in mind two major social issues – inclusion and wellbeing.
In India, good economics does not make good politics.Analysis reveals a negative relationship between the growth rate of GDP per capita
and the incumbent party getting re-elected, implying that in most cases despite higher growth incumbent does not get re-elected.

Appendix

IMPACT OF TRUST ON THE VALUE CHAIN OF A FIRM
Source: Michael E. Porter and Institute for Competitiveness Analysis
Lack of trust results in interdepartmental/ inter primary activity conflict and can result in longer lead times and sales cycles at minimum and complete shutdown of operations at maximum.
Trust issues can arise between primary and support functions – Ex R&D and Marketing department of Electrotherm India
With lesser trust, sub-optimal level of support activity is observed both at the firm level and cluster level. Example of low technology adoption rates within small firms in India is a classic case in point.
Firm InfrastructureEg: Financing, Planning, Investor Relations
Human Resource ManagementEg: Recruiting, Training, Compensation System
Technology DevelopmentEg: Product Design, Testing, Process Design
ProcurementEg: Components, Machinery
Inbound Logistics(Eg: Data Collection, Service Customer Access
Operations(Eg: Assembly Components, Fabrication, Branch Operations)
Outbound Logistics(Eg: Order Processing, Warehousing)
After Sale Services(Eg: Installation, Customer Support, Repair)
Marketing & Sales(Eg: Sales Force, Promotion, Advertising, Proposal Writing)
Primary Activities
Support Activities

Ease of Living and Social Progress
y = 0.8199x + 16.639R² = 0.64
20.00
30.00
40.00
50.00
60.00
70.00
80.00
20.0 30.0 40.0 50.0 60.0 70.0 80.0
Soci
al P
rogr
ess
Ease of Living
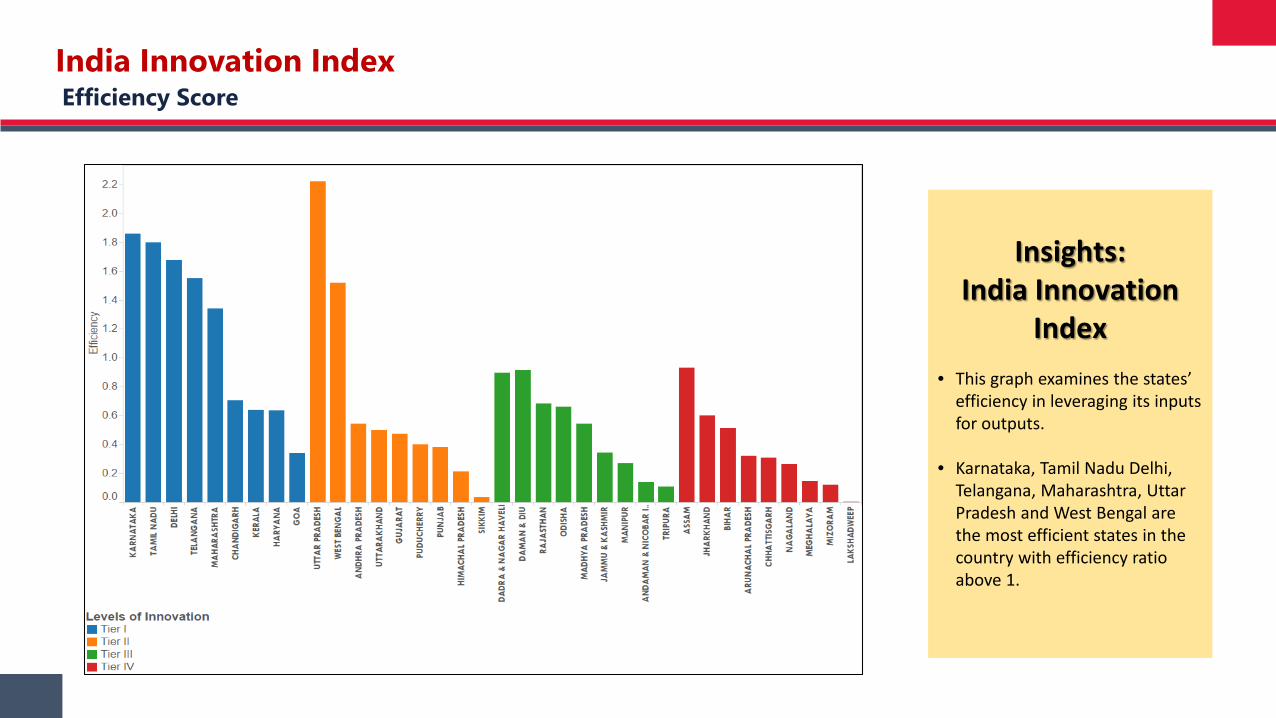
India Innovation IndexEfficiency Score
Insights:India Innovation
Index• This graph examines the states’
efficiency in leveraging its inputs for outputs.
• Karnataka, Tamil Nadu Delhi, Telangana, Maharashtra, Uttar Pradesh and West Bengal are the most efficient states in the country with efficiency ratio above 1.

CitiesThe Drivers of Innovation
India’s Urbanisation
290 million
2001
590 million
2030More than 70 percent of India’s GDP will
be generated by urban areas by 2020
DATA SOURCE: MCKINSEY REPORT
Therefore, cities should lead the way. The first step should be the measurement of the current indicators.
Ease of Living Index
Municipal Performance Index

Ease of Living: Cities
Ease of Living Index
Quality of Life Economic-Ability Sustainability
Education Level of Economic Development EnvironmentHousehold expenditure on education Traded Clusters Water QualityLiteracy Rate Total Tree CoverPupil-Teacher Ratio Economic Opportunities Households using clean fuel for cookingDrop Out Rate Cluster Strength Hazardous waste generationAccess to digital education Credit Availability Air quality index:Professionally Trained Teachers
Number of Incubation Centres / Skill Development centresa. SO2
Nation Achievement Survey Score b. NO2
Gini Coefficient c. PM10Health
Inequality index based on consumption expenditureHousehold expenditure on health Green Spaces and BuildingsAvailability of Healthacre Professionals Availability of Green Spaces
Accredited public health facilities Does the city incentivise green buildings? (Y/N)
Availability of Hospital Beds Green buildings in the cityPrevalance of Water borne DiseasesPrevalance of Vector borne Diseases Energy Consumption
Energy Requirement vs Energy SuppliedHousing and Shelter Energy generated from renewable sourcesHouseholds with electrical connections Number of Energy Parks
Average length of electrical interruptions
Beneficiaries Under PMAY City ResilienceSlum Population
Has the city implemented local disaster reduction strategies? (Y/N)
WASH and SWMNumber of deaths and directly affected persons attributed to disasters
Water Supplied to HouseholdsHouseholds with piped water supplySwachh Survekshan scoreAmount of waste water treatedConnection to Sewerage Network
MobilityAvailability of public transportTransport related fatalitiesRoad Infrastructure:a. Road Densityb. Footpath Density
Safety and SecurityPrevalence of Violent CrimeExtent of crime recorded against women
Extent of crime recorded against children
Extent of crime recorded against elderly
RecreationAvailability of Open SpacesAvailability of Recreation Facilities
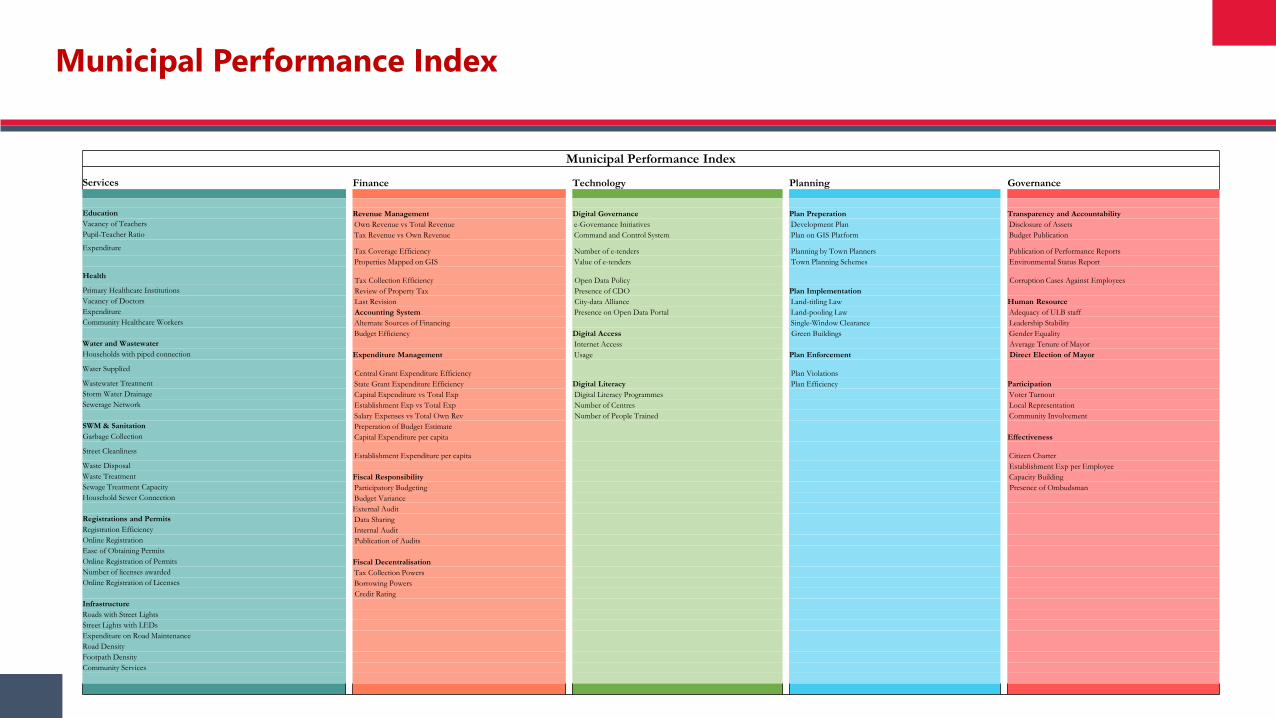
Municipal Performance Index
Municipal Performance Index
Services Finance Technology Planning Governance
Education Revenue Management Digital Governance Plan Preperation Transparency and AccountabilityVacancy of Teachers Own Revenue vs Total Revenue e-Governance Initiatives Development Plan Disclosure of AssetsPupil-Teacher Ratio Tax Revenue vs Own Revenue Command and Control System Plan on GIS Platform Budget Publication
Expenditure Tax Coverage Efficiency Number of e-tenders Planning by Town Planners Publication of Performance ReportsProperties Mapped on GIS Value of e-tenders Town Planning Schemes Environmental Status Report
Health Tax Collection Efficiency Open Data Policy Corruption Cases Against EmployeesPrimary Healthcare Institutions Review of Property Tax Presence of CDO Plan ImplementationVacancy of Doctors Last Revision City-data Alliance Land-titling Law Human ResourceExpenditure Accounting System Presence on Open Data Portal Land-pooling Law Adequacy of ULB staffCommunity Healthcare Workers Alternate Sources of Financing Single-Window Clearance Leadership Stability
Budget Efficiency Digital Access Green Buildings Gender EqualityWater and Wastewater Internet Access Average Tenure of MayorHouseholds with piped connection Expenditure Management Usage Plan Enforcement Direct Election of Mayor
Water Supplied Central Grant Expenditure Efficiency Plan ViolationsWastewater Treatment State Grant Expenditure Efficiency Digital Literacy Plan Efficiency ParticipationStorm Water Drainage Capital Expenditure vs Total Exp Digital Literacy Programmes Voter TurnoutSewerage Network Establishment Exp vs Total Exp Number of Centres Local Representation
Salary Expenses vs Total Own Rev Number of People Trained Community InvolvementSWM & Sanitation Preperation of Budget EstimateGarbage Collection Capital Expenditure per capita Effectiveness
Street Cleanliness Establishment Expenditure per capita Citizen CharterWaste Disposal Establishment Exp per EmployeeWaste Treatment Fiscal Responsibility Capacity BuildingSewage Treatment Capacity Participatory Budgeting Presence of OmbudsmanHousehold Sewer Connection Budget Variance
External AuditRegistrations and Permits Data SharingRegistration Efficiency Internal AuditOnline Registration Publication of AuditsEase of Obtaining PermitsOnline Registration of Permits Fiscal DecentralisationNumber of licenses awarded Tax Collection PowersOnline Registration of Licenses Borrowing Powers
Credit RatingInfrastructureRoads with Street LightsStreet Lights with LEDsExpenditure on Road MaintenanceRoad DensityFootpath DensityCommunity Services
Top Related