


Languages
Pages
Legal

www.ibef.orgwww.ibef.org
T e l e c o m m u n i c aT i o n sDecember 2008

� www.ibef.org
contents
• Telecom industry overview
• Telecom an investment attracting sector
• Regulatory Framework and its impact
• emerging Trends in Telecom market
• major Players in Telecom sector
• Growth avenues
Telecom inDusTRy oveRviewDecember 2008

�
Telecom inDusTRyoveRview
www.ibef.org
� www.ibef.org
indian Telecom industry – a lucrative option
Facts
• Total telecom subscribers – 325.79 million (June 2008)
• Tele density – 28.33 per cent (June 2008)
• Quarterly addition of mobile subscribers (april–June 2008) – 25.80 million
• Telecom subscribers annual growth rate (2007–08) – 44.79 per cent
• one of the biggest telecom markets in the world
• average Revenue Per user (aRPu) for Gsm (June 2008) – us$ 5.6
Telecom inDusTRy oveRviewDecember 2008
Source: Exchange rate as on 30 June 2008; Average exchange rate for the year 2007–08; Voice&Data;

� www.ibef.org
Facts
• more Gsm subscribers than fixed line subscribers
• Telecom equipment market (2007–08) – us$ 23,699 million
• Handset market (2007–08) – us$ 5,962 million
• expected mobile subscriber base (2010) – about 500 million (i.e., more than one phone for every household)
indian Telecom industry – a lucrative option
Telecom inDusTRy oveRviewDecember 2008
Source: Exchange rate as on 30 June 2008; Average exchange rate for the year 2007–08; Voice&Data;

� www.ibef.org
Telephony services (mobile and basic) and internet services dominate the indian telecom services
• The indian telecom industry generated revenues of approximately us$ 32 billion in 2007–08 with a growth rate of 60 per cent in 2007–08 over 2006–07.
• it witnessed a caGR of approximately 29 per cent from 2002–03 to 2007–08.
• The caGR is expected to stabilise at 16 per cent between 2007–08 and 2009–10.
Telecom inDusTRy oveRviewDecember 2008
Revenues of indian Telecom industry: 2002-10
10
us$ billion
Sources: Average exchange rate for the year 2007–08; TRAI Report
2009-10 (e)
2006-07
2005-06
2004-05
2003-04
2002-03
43
20
15
11
10
9
30 40 500 20
� www.ibef.org
Telephony services (mobile and basic) and internet services dominate the indian telecom services
Telecom inDusTRy oveRviewDecember 2008
Telecom services in indiaInternet
PMRTS
VSATs
Radio Paging
GMPCS
Basic Services
Mobile Services
Source: TRAI
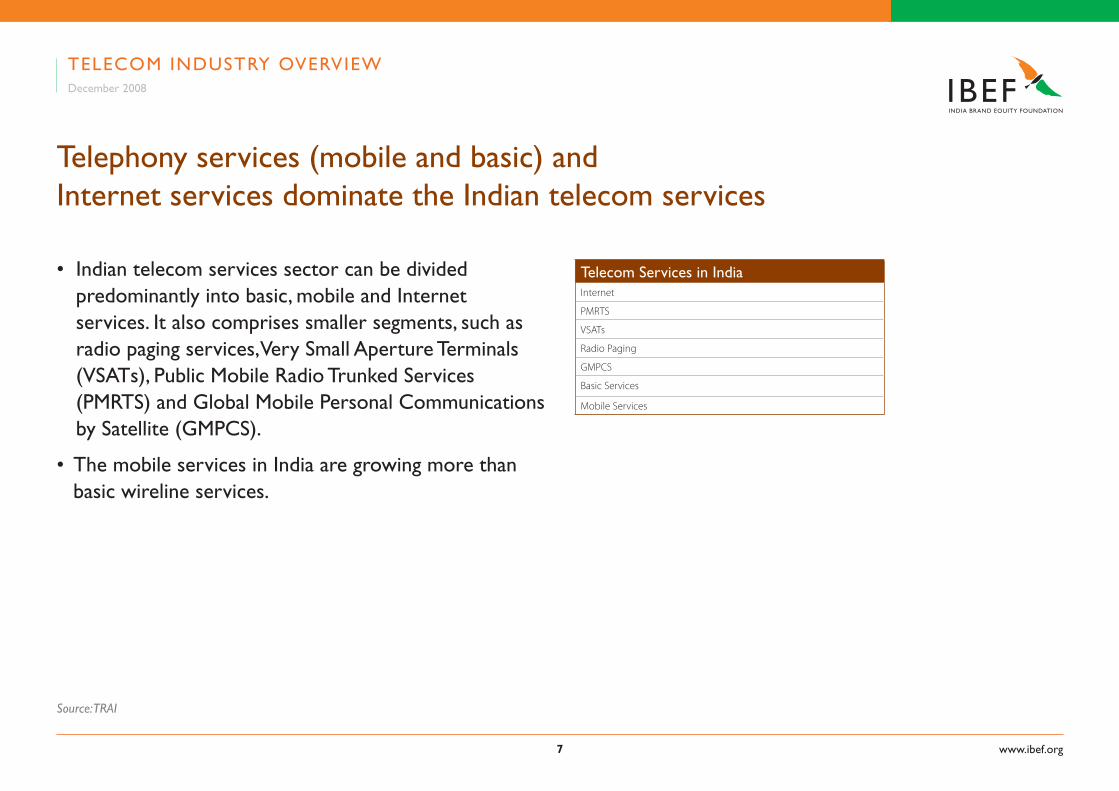
• indian telecom services sector can be divided predominantly into basic, mobile and internet services. it also comprises smaller segments, such as radio paging services, very small aperture Terminals (vsaTs), Public mobile Radio Trunked services (PmRTs) and Global mobile Personal communications by satellite (GmPcs).
• The mobile services in india are growing more than basic wireline services.

� www.ibef.org
Private players account for highest subscriber base growth in the basic telephony services segment
Basic Services
• Basic services include fixed wireline and wireless in local loop (wll-fixed).
• Fixed wireline services hold a major market share of 88 per cent in basic services.
market share of Basic services segments in india (2007–08)
n Fixed n WLL (F)
88%
12%
Telecom inDusTRy oveRviewDecember 2008
Source: TRAI

� www.ibef.org
market share of wireline service operators in india (2007–08)
0
mTnl
other Private Players
Bsnl79
119
n As of 30 June, 2007 n As of 30 June, 2008 Percentage
Private players account for highest subscriber base growth in the basic telephony services segment
Telecom inDusTRy oveRviewDecember 2008
Source: TRAI
• Government-owned Bharat sanchar nigam ltd. (Bsnl) and mahanagar Telephone nigam ltd. (mTnl) are the two largest operators in the wire line segment, whereas Bharti airtel ltd. is the leader in wireless segment.
• mTnl has presence in Delhi and mumbai, whereas Bsnl covers the rest of the country.
• Though private players, such as Bharti airtel and Reliance, have registered notable growth, Bsnl still dominates the segment in terms of wire line subscriber base.
10 7060 8050403020
82
99
90
10 www.ibef.org
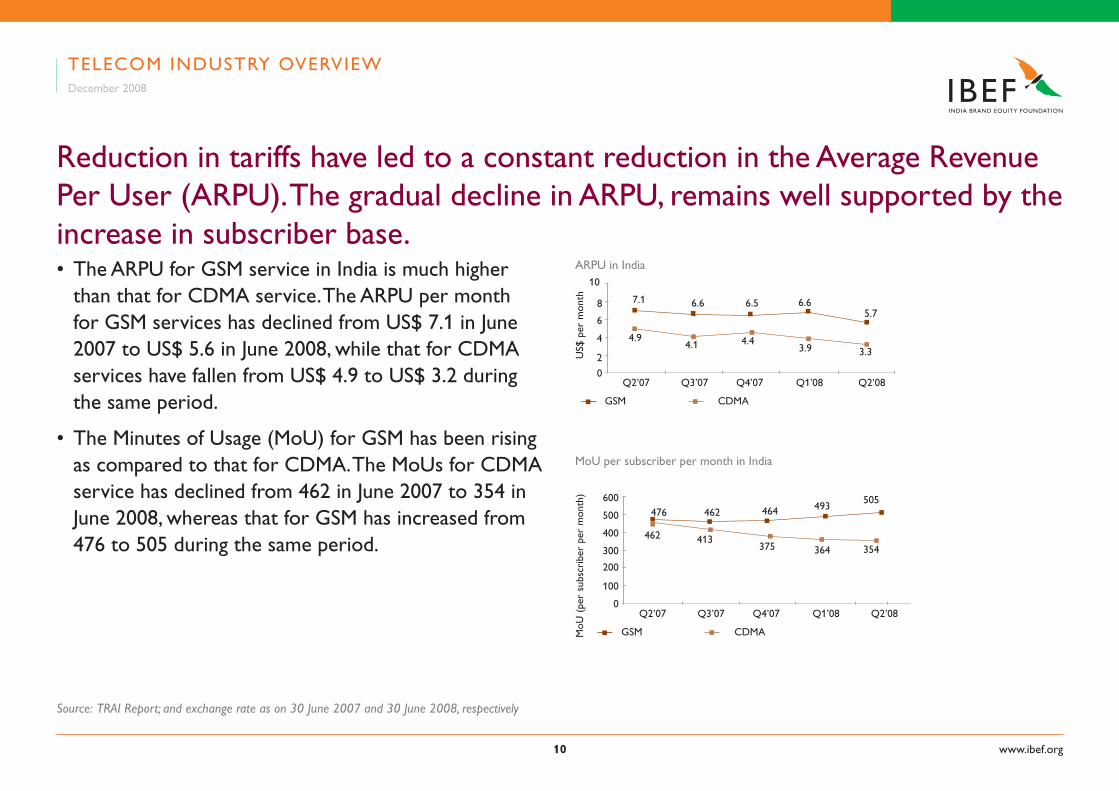
• The aRPu for Gsm service in india is much higher than that for cDma service. The aRPu per month for Gsm services has declined from us$ 7.1 in June 2007 to us$ 5.6 in June 2008, while that for cDma services have fallen from us$ 4.9 to us$ 3.2 during the same period.
• The minutes of usage (mou) for Gsm has been rising as compared to that for cDma. The mous for cDma service has declined from 462 in June 2007 to 354 in June 2008, whereas that for Gsm has increased from 476 to 505 during the same period.
Reduction in tariffs have led to a constant reduction in the average Revenue Per user (aRPu). The gradual decline in aRPu, remains well supported by the increase in subscriber base.
Telecom inDusTRy oveRviewDecember 2008
mou per subscriber per month in india
Source: TRAI Report; and exchange rate as on 30 June 2007 and 30 June 2008, respectively
aRPu in india
Gsm cDma
Q2’07 Q3’07 Q4’07 Q1’08 Q2’08
10
8
6
4
2
0
us$
per
mon
thm
ou (
per
subs
crib
er p
er m
onth
)
Gsm cDma
Q2’07 Q3’07 Q4’07 Q1’08 Q2’08
600
500
400
0
100
200
300
462 413375 364 354
493505
464462476
3.33.94.44.1
4.9
7.1 6.6 6.5 6.65.7

11 www.ibef.org
The mobile subscriber base in india is likely to reach 500 million by 2010.
• The subscriber base grew to 325.79 millions on June 2008, registering a growth of approximately 45 per cent over last year. The subscriber base grew at a caGR of 43.6 per cent from June 2004 to June 08.
• Teledensity in india is still low in india as compared to that in some countries. as on June 2008, india had a teledensity of 28.33 per cent as compared to the previous year’s figure of 19.86 per cent.
Telecom subscriber Base in india
Telecom inDusTRy oveRviewDecember 2008
Source: TRAI
100 200 3503002500 50
2007
2008
subscribers in million
2004 76.53
2005
2006
325.79
225.01
104.22
153.42
150
Teledensity in india
Per
cent
2004 2005 2006 2007 2008
30
25
20
0
5
10
15
7.049.61
13.96
19.8628.33
1� www.ibef.org
Private players account for highest subscriber base growth in the basic telephony services segment
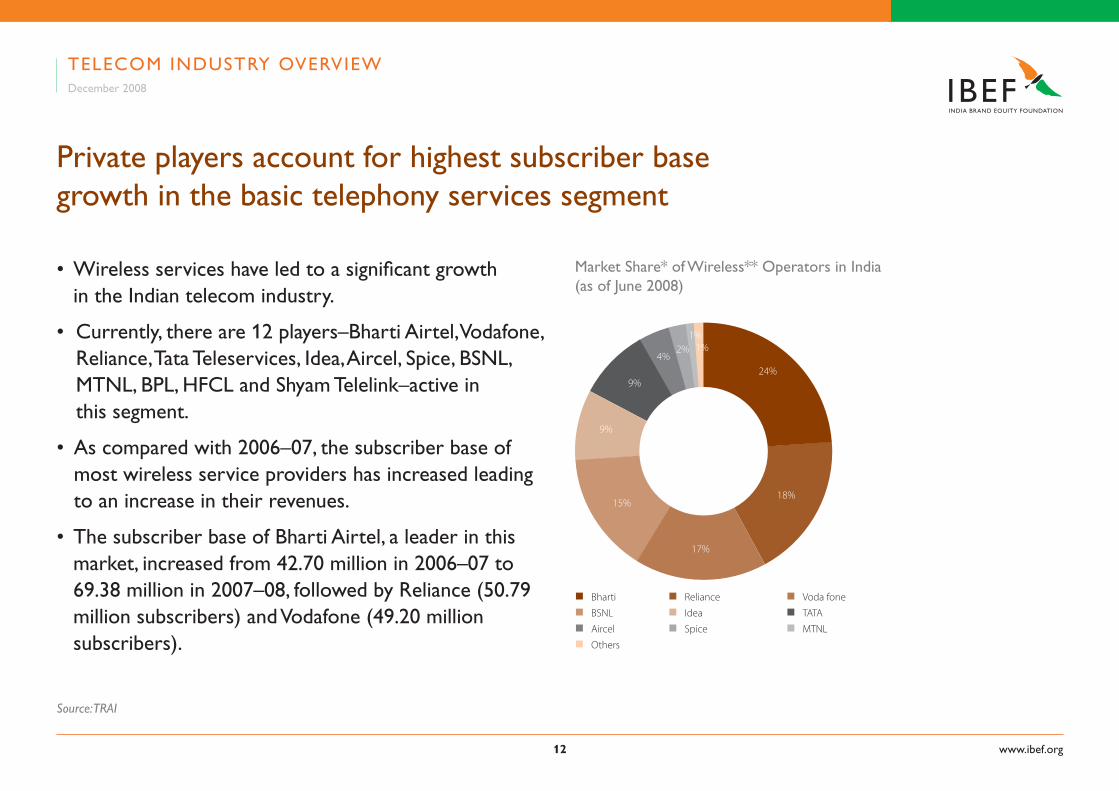
• wireless services have led to a significant growth in the indian telecom industry.
• currently, there are 12 players–Bharti airtel, vodafone, Reliance, Tata Teleservices, idea, aircel, spice, Bsnl, mTnl, BPl, HFcl and shyam Telelink–active in this segment.
• as compared with 2006–07, the subscriber base of most wireless service providers has increased leading to an increase in their revenues.
• The subscriber base of Bharti airtel, a leader in this market, increased from 42.70 million in 2006–07 to 69.38 million in 2007–08, followed by Reliance (50.79 million subscribers) and vodafone (49.20 million subscribers).
market share* of wireless** operators in india (as of June 2008)
n Bharti n Reliance n Voda fone
n BSNL n Idea n TATA
n Aircel n Spice n MTNL
n Others
Telecom inDusTRy oveRviewDecember 2008
Source: TRAI
24%
18%
17%
15%
9%
9%
4%2%
1%1%

1� www.ibef.org
india is one of the few countries in the world to have more Gsm subscribers than fixed-line subscribers.
Gsm preferred to cDma segment by a large margin in terms of subscriber numbers.
indian mobile service market share (as on June 2008)
74%26%
n CDMA n GSM
Telecom inDusTRy oveRviewDecember 2008
Source: TRAI

1� www.ibef.org
market share cDma service Providers(as of June 2008)
n Reliance n Tata Teleservices n BSNL
n MTNL n HFCL n Shyam Telelink
Gsm preferred to cDma in number of additions to subscriber base
market share Gsm service Providers (as on June 2008)
n Bharti Airtel n Vodafone n BSNL
n Idea n Aircel n Reliance
n Spice n MTNL n BPL
• Bharti airtel has the largest market share in the Gsm segment. During 2007–08, out of the total subscriber base of 212.51 million, the private players accounted for more than 80 per cent, whereas, the public sector operators (Bsnl and mTnl) accounted for the remaining share (20 per cent).
• Reliance communications dominates the indian cDma mobile services segment with a subscriber base of 42.71 million.
Telecom inDusTRy oveRviewDecember 2008
Source: TRAI
32.65%
23.5%
18%
13%
6%4%
2%2%
1%
57.44%
35.41%
6.17%
0.38% 0.45% 0.15%

1� www.ibef.org
various other services emerged by leveraging the telecom services industry
Radio Paging Services
Radio paging services were launched in india in 1995. These services, however, could not compete well with cellular services in general and sms technology in particular and is shrinking continuously. at present, all but four radio paging service providers have been marginalised in the indian market.
Very Small Aperture Terminals (VSATs)
at present, there are 9 vsaT service providers in india including Bsnl, Bharti airtel, Hughes communication and Hcl comnet. The number of subscribers of vsaT services increased on a quarterly basis by 8,473 to 89,868 in June 2008. The market for vsaT services registered a 10.41 per cent growth for the quarter ending June 2008. Hughes communication is the market leader, with a market share of 30 per cent, followed by Hcl comnet with 27 per cent.
Telecom inDusTRy oveRviewDecember 2008
Source: TRAI
1� www.ibef.org
Public Mobile Radio Trunked Services (PMRTS)
PmRTs services have been showing a negative growth. PmRTs’ subscriber base decreased by 2.99 per cent during the quarter ending June 2008. High license fee for this service leaves low margin for services providers, thereby inhibiting its growth. in india, 12 operators are offering this service to total of more than 35,000 subscribers.
Global Mobile Personal Communication by Satellite (GMPCS)
GmPcs2 services were launched in india in 1999. These services allow a subscriber to communicate with others from any point on earth through a hand-held terminal. moreover, the telephone number remains unchanged, irrespective of the subscriber’s location. iridium india Telecom limited is the pioneer in GmPcs services in india. The Government of india has restricted foreign equity participation in this segment to 74 per cent.
various other services emerged by leveraging the telecom services industry
Telecom inDusTRy oveRviewDecember 2008
Source: TRAI

1� www.ibef.org
• in india, there has also been significant growth in the subscriber base for wireless internet, which stood at 75.97 million for the year 2007–08 with mobile internet penetration at 1.8 per cent. more than 56 per cent of indian mobile subscribers own a web-enabled handset at present.
• The total number of internet subscribers increased at a caGR of approximately 21.17 per cent from 2000–01 to 2007–08.
Despite a slow penetration rate, internet services segment embodies huge growth potential in india
internet subscribers: 2000-2008
Telecom inDusTRy oveRviewDecember 2008
Source: TRAI
inte
rnet
sub
scri
ber
(in m
illio
n)
2000-01 2004-052003-042002-032001-02 2007-082006-072005-060
12
10
8
6
4
14
2
3.04 3.42 3.64 4.55 5.55
6.94
9.22
11.66

1� www.ibef.org
Despite a slow penetration rate, internet services segment embodies huge growth potential in india
• The total number of internet subscribers grew from 9.22 million in June 2007 to 11.66 million in June 2008, primarily attributed to an increase in broadband subscriber base from 2.42 million in June 2007 to 4.38 million at the end of June 2008.
• Bsnl is the biggest player in this market with 5.94 million subscribers, followed by mTnl, Bharti airtel, Reliance and sify Technologies.
• internet services can also be accessed through mobile phones (cDma and Gsm). Bharti airtel is the leader in wireless internet operators with a market share of approximately 24 per cent.
Telecom inDusTRy oveRviewDecember 2008
Source: TRAI
Top Five internet service Providers by market share (as on June 2008)
n BSNL n MTNL n Bharti Airtel
n Reliance n Sify
50.96%
16.49%
7.47%
7.07%
4.84%

1� www.ibef.org
The sales for Gsm-based handsets have been growing in india as compared to cDma-based handsets
• The handset market in india, consisting of mobile and fixed handsets, registered a growth of 33 per cent with the sales volume of 95.6 million over 2007–08.
• The expansion of wireless networks and an increase in subscriber base, both in urban and rural areas, led to a boost in the sale of mobile handsets across india. The mobile handsets sale grew by 12 per cent and that of fixed handsets declined by 41 per cent over 2007–08.
• out of the total number of handsets sold in 2007–08, 68.3 million were based on Gsm technology and the remaining (27.3 million) on cDma. The sales for Gsm handsets grew by 34 per cent as compared to 28 per cent for cDma phones.
Telecom inDusTRy oveRviewDecember 2008
mobile Handset market in india
Source: VoicenData.com, TRAI
value us$ million
1,000 2,0000 5,0004,0003,000
1,6102003-04
2004-05
2005-06
2006-07
1,966
3,231
4,750
2007-08
6,000
5,761

�0 www.ibef.org
nokia, sony ericsson, samsung, and Reliance mobile phones are most popular across the country
• nokia continues to dominate the handsets market. its market share increased from 53.6 per cent in 2006–07 to 62.5 per cent in 2007–08. sony ericsson has the second highest market share (12.8 per cent) in 2007–08.
• lG, motorola, ZTe and Haier witnessed a decline in their market share in 2007–08 as compared to that in 2006–07.
Telecom inDusTRy oveRviewDecember 2008
market share of Gsm and cDma Handset manufacturers: 2006–07
n Nokia n Sony Ericsson n Samsung
n LG n Motorola n ZTE
n Huawei n Haier n Others
Source: Voice & Data
62.50%
12.80%
6.20%
6.20%
5.00%
3.50%
1.20% 1.00%

�1
Telecom – an iDeal invesTmenT secToR
www.ibef.org

�� www.ibef.org
india – an ideal investment Destination
• world’s largest democracy
• independent judiciary
• skilled and competitive labour force
• Fifth-largest telecom network in the world; second- largest among the emerging economies after china
• on an average, approximately 8 million users are added per month, making india the world’s fastest growing wireless services market
• liberal Foreign investment Regime: FDi limit increased from 49 per cent to 74 per cent; the rural telecom equipment market also open to large investments
• among the countries offering the highest rates of return on investment
Telecom – invesTmenT aTTRacTinG secToRDecember 2008
Source: TRAI
�� www.ibef.org
• The large untapped potential in india’s rural markets revealed by 9.21 per cent teledensity in rural markets as compared to the national level of 28 per cent.
• The government promoting telecom manufacturing by providing tax sops and establishing telecom-specific special economic Zones
• Fully repatriable dividend income and capital invested in telecom equipment manufacturing
india – an ideal investment Destination
Telecom – invesTmenT aTTRacTinG secToRDecember 2008
Source: TRAI

�� www.ibef.org
since india’s telecom sector trails that of other asian economies by about 10 years, growth is a certainty.
• india is currently the second-largest mobile market in the world in terms of mobile subscribers.
• The indian telecom market generated revenues of approximately us$ 32 billion in 2007–08. Further, the industry is expected to register a caGR of approximately 16 per cent from 2007-08 to 2009–10 and scale to us$ 43 billion by 2010.
• it is also expected that by 2012, fixed line revenues will reach us$ 12.2 billion and mobile revenues will reach us$ 39.8 billion.
• several foreign companies are making large investments in india..
Telecom – invesTmenT aTTRacTinG secToRDecember 2008
Source: TRAI
Proposed investments By Telecom companies in india (us$ Billion)
BSNL 1.3
Idea 2.4
Reliance 5.7
Aircel 5
Quippo Telecom Infrastructure (QTIL)
3
Vodafone 6

��
ReGulaToRy FRamewoRk anD iTs imPacT
www.ibef.org

�� www.ibef.org
Regulatory framework provides level-playing field for all operators • The Department of Telecommunications (DoT) of the
Government of india is the main governing body for the industry
• Telecom Regulatory authority of india (TRai) assists the Government of india to take timely decisions and introduce new technologies
• The Telecom Disputes settlement and appellate Tribunal (TDsaT) was also established in the same year.
ReGulaToRy FRamewoRk anD iTs imPacTDecember 2008
Source: Regulate Online, Fitch Report and TRAI

�� www.ibef.org
ReGulaToRy FRamewoRk anD iTs imPacTDecember 2008
Indian Telecom Industry Framework
Source: Regulate Online, Fitch Report and TRAI
WPC spectrum management
DoT licensor and Frequency management for Telecom
GoT–IT Handles ad–hoc issues
TRAI
independent Regulator
TDSAT
Disputes settlement Body
indian Telecom industry
Framework
Integrated Fixed Line Bsnl mTnl
Private CDMA Reliance
TTsl
GSM Operators Hutch/vodafoneairtel/
Bhartiidea/spice
ILD Players
vsnl

�� www.ibef.org
ReGulaToRy FRamewoRk anD iTs imPacT
Regulatory framework provides level-playing field for all operators Unified Access Licensing Regime (UALR)
The establishment of the ualR (2003) eliminated the need for separate licences for different services. This regime allowed players to offer both mobile and fixed-line services under a single licence after paying an additional entry fee. The regime does not take into account the national and international long-distance services and internet access services.
Between February and march 2008, DoT granted 120 new licences to provide unified access services to various companies, including Datacom solutions Pvt. ltd., aska Projects ltd., swan Telecom Pvt. ltd., loop Telecom Pvt. ltd. and s Tel ltd.
TelecommunicaTionDecember 2008
�� www.ibef.org
ReGulaToRy FRamewoRk anD iTs imPacT
Regulatory framework provides level-playing field for all operators Universal Service Obligations (USO)
The uso policy was implemented along with nTP ’99 to widen the reach of telephony services in rural india. all telecom operators are bound to contribute five per cent of their revenues to this fund. This system was put in place to bridge the wide gap between urban and rural teledensity, bringing it down from the current 31 per cent. initially, only basic service providers were under the purview of uso. later, its scope was expanded to include mobile services also. although it increases the cost burden for telecom companies, uso helps in building the telecommunication infrastructure in rural areas.

�0 www.ibef.org
0
100
150
200
250
50
important regulations and their impact on the indian telecom industry
Unified Access Service License Regime (UASL)
• The establishment of the ualR (2003) eliminated the need for separate licences for different services. This regime allowed players to offer both mobile and fixed-line services under a single licence after paying an additional entry fee. The regime does not take into account the national and international long-distance services and internet access services.
• Between February and march 2008, DoT granted 120 new licences to provide unified access services to various companies, including Datacom solutions Pvt. ltd., aska Projects ltd., swan Telecom Pvt. ltd., loop Telecom Pvt. ltd. and s Tel ltd.universal service obligation (uso)
impact of Policy change on indian Telecom industry
ReGulaToRy FRamewoRk anD iTs imPacTDecember 2008
Source: Regulate Online, Fitch Report and TRAI
1998 1999 2000 2001 2002 2003 2004 2005 2006 2007 20080
4
8
12
16
Removal of aDclowering of aDc
uaslcPP
wllwll
Tariff orderTelecom
nTP’99
Total cellular subscribers cellular Tariff
cellu
lar
tari
ff (c
ents
per
min
ute)
num
ber
of s
ubsc
ribe
rs (
mill
ion)

TelecommunicaTionDecember 2008
�1 www.ibef.org
Universal Service Obligations (USO)
The uso policy was implemented along with nTP ’99 to widen the reach of telephony services in rural india. all telecom operators are bound to contribute five per cent of their revenues to this fund. This system was put in place to bridge the wide gap between urban and rural teledensity, bringing it down from the current 31 per cent. initially, only basic service providers were under the purview of uso. later, its scope was expanded to include mobile services also. although it increases the cost burden for telecom companies, uso helps in building the telecommunication infrastructure in rural areas.
important regulations and their impact on the indian telecom industry

�� www.ibef.org
important regulations and laws passed
Private players were allowed in value added services
independent regulator, TRai, was established
Bsnl was established by DoT
ilD services were opened to competition
Go-ahead to cDma technology
calling Party Pays (cPP) was implemented
intra-circle merger guidelines were established
measures to boost rural telephony
number portability was proposed (pending)
national Telecom Policy (nTP) was formulated
nTP-99 led to migration from high-cost fixed licence fee to low-cost revenue sharing regime
Reduction of license fees
internet telephony initiated
Reference interconnect order was issued
unified access licensing (uasl) regime was introduced
Broadband Policy 2004 was formulated—targeting 20 million subscribers by 2010
FDi limit was increased from 49 to 74 per cent
3G policy announced, spectrum auction awaited
1992 1997
1994 1999
2000
2002 2003 2004 2005
2006
2008
ReGulaToRy FRamewoRk anD iTs imPacTDecember 2008
DoT is the main body formulating laws and regulations for the indian telecom industry.
ilD-international long DistanceSource: TRAI; 2) Fitch Report
��
key TRenDs in THe Telecom inDusTRy
www.ibef.org

�� www.ibef.org
meRGeRs anD acQuisiTions (m&a)
Recent Mergers and Acquisitions in the Indian Telecom Industry
Etisalat – Swan Telecomemirates Telecommunications corp. acquired 45 per cent stake in swan Telecom Pvt. ltd. by paying us$ 900 million.NTT DoCoMo – Tata TeleservicesnTT Docomo, the Japanese phone company bought 26 per cent stake in Tata Teleservices by paying us$ 2.7 billion.RCom – Yipes HoldingsReliance communications ltd. acquired us-based yipes Holdings inc., a leading provider of ethernet services in us for us$ 300 million.Idea – Spiceidea cellular acquired 48.2 per cent stake in spice communications in order to expand its services in Punjab.
The market is witnessing several m&a activities that are resulting in consolidations in the industry. This trend has assisted companies in expanding their reach in the indian telecom market to offer better services to customers.
emeRGinG TRenDs in Telecom maRkeTDecember 2008
Source: TRAI and Grant Thornton India

�� www.ibef.org
FDi in the indian Telecom sector
The indian government allows FDi of up to 74 per cent, subject to licensing and security requirements, in the following categories:
• Basic and cellular services
• national/international long distance
• value-added services such as PmRTs and GmPcs
• Radio paging service
• internet services (providing service gateway)
• infrastructure providers (category-ii)
FDi in Telecommunication sector
emeRGinG TRenDs in Telecom maRkeTDecember 2008
Source: TRAI and Grant Thornton India
300 900 150012006000
1162003-04
1292004-05
4782006-07
2005-06 624
us$ million
12612007-08
3152008-09 (till July 08)

�� www.ibef.org
FDi in the indian Telecom sector
The indian government allows FDi of up to 100 per cent in the following categories:
• manufacturing of telecom equipment
• internet services (not providing international gateways)
• infrastructure providers providing dark fibre, right of way, duct space, tower (iP category-i)
• electronic mail
• voice mail
emeRGinG TRenDs in Telecom maRkeTDecember 2008
Source: TRAI and Grant Thornton India

��
GRowTH avenues
www.ibef.org

�� www.ibef.org
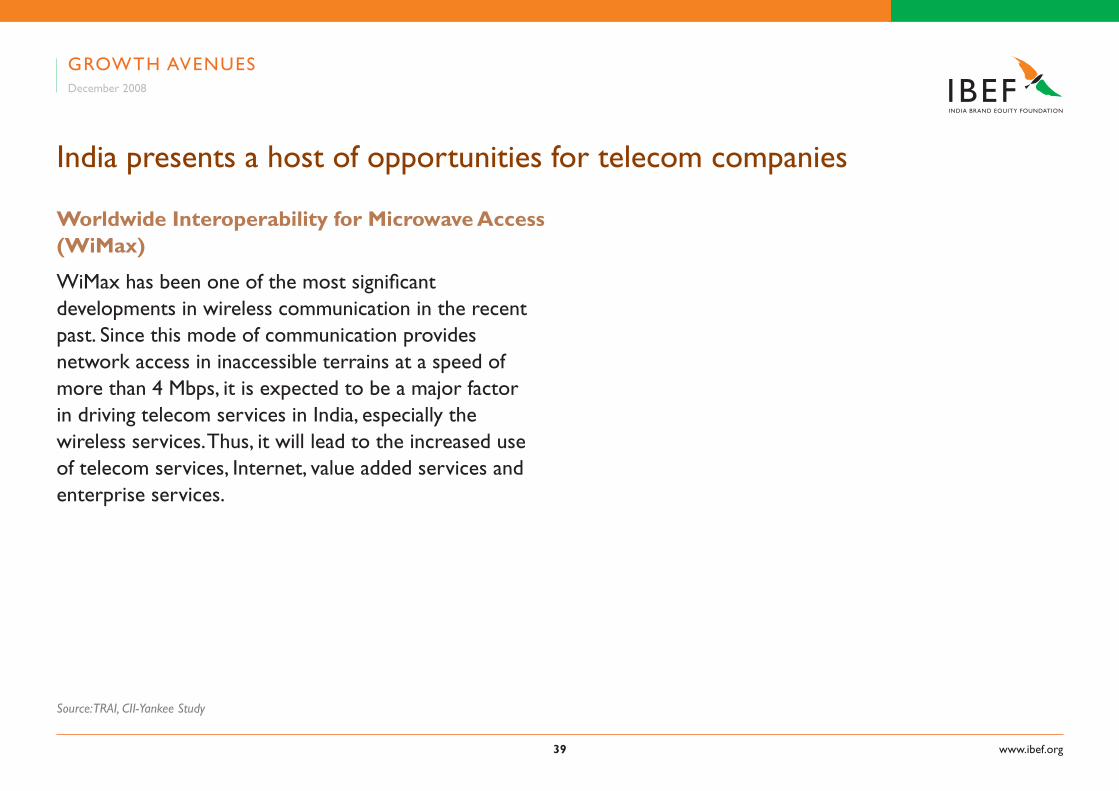
india presents a host of opportunities for telecom companies
RuralTelephony
value addedservices
virtual Privatenetwork
managedservices
infrastructuresharing
enterpriseTelecom services 3G
wimaX
Growth avenues
�G Services
The indian government plans to auction the spectrum for 3G services by inviting bids from domestic as well as foreign players. The 3G spectrum is among the major investment opportunities and is expected to attract investments worth us$ 8–10 billion during 2008–11.
international and foreign players can enter this segment through joint-ventures with indian companies with a stake of not more than 74 per cent. They will also have to pay an additional entry fee of us$ 328 million to acquire unified services access licence (usal). companies such as aT&T and nTT Docomo are planning to enter in this sector.
GRowTH avenues December 2008
Source: TRAI, CII-Yankee Study
�� www.ibef.org
india presents a host of opportunities for telecom companies
Worldwide Interoperability for Microwave Access (WiMax)
wimax has been one of the most significant developments in wireless communication in the recent past. since this mode of communication provides network access in inaccessible terrains at a speed of more than 4 mbps, it is expected to be a major factor in driving telecom services in india, especially the wireless services. Thus, it will lead to the increased use of telecom services, internet, value added services and enterprise services.
GRowTH avenues December 2008
Source: TRAI, CII-Yankee Study

�0 www.ibef.org
Managed Service
managed service is another segment that is attracting telecom companies. on account of the rapidly growing subscriber base, service providers find it difficult to manage their infrastructure and network. in such cases, they completely or partially outsource their infrastructure or network management operations.
Virtual Private Network
virtual Private network is a private data network that provides connectivity within closed user groups (cuG) via public telecommunication infrastructure. it is similar to leasing/owning lines and yet getting exclusive access.
india presents a host of opportunities for telecom companies
GRowTH avenues December 2008
Source: TRAI, CII-Yankee Study

�1 www.ibef.org
Enterprise Telecom Services
Telecom service providers are increasingly targeting enterprises by providing them dedicated services. some of the key services include voiP, dedicated telecom communication systems; iT infrastructure-enabled unified communication services, etc. This segment is expected to witness major developments as the demand for enhanced telecom infrastructure is increasing along with the growth in the information and communication technology (icT) industry.
india presents a host of opportunities for telecom companies
GRowTH avenues December 2008
Source: TRAI, CII-Yankee Study

�� www.ibef.org
Value-Added Services
The vas industry in india generated revenue of us$ 1.2 billion in 2007–08 and is expected to reach us$ 4.0 billion by 2015.
major growth drivers for vas in india
• increasing focus on localisation and availability of content in local languages
• Development of m-commerce applications, such as booking tickets and making bill payments
• availability of mobile Tv and development of shows, films, etc., for the same
n Person to Person SMS n Ringtone Download
n Person to Application & Application to Person SMS
n Games & Data n Others (MMS etc.)
GRowTH avenues December 2008
Source: TRAI, CII-Yankee Study and IMRB Report
india presents a host of opportunities for telecom companies
value-added services in india (2007–08)
44%
25%
17%
10%
4%

�� www.ibef.org
• availability of complete subscriber data has helped in reaching niche audience leading to a growth in advertising revenue through m-marketing
• Development of video-based applications, such as video sms and podcasts
GRowTH avenues December 2008
Source: TRAI, CII-Yankee Study and IMRB Report
india presents a host of opportunities for telecom companies

�� www.ibef.org
Rural Telephony
• under the Bharat nirman Programme, the government will invest us$ 2 billion, from 2008 to 2009, to set up about 100,000 community service centres in rural areas to provide broadband connectivity.
• with the teledensity in rural areas at less than 10 per cent against the national teledensity of approximately 28 per cent, there seems to be huge untapped potential for mobile phone penetration in rural india.
value-added services and Rural Telephony hold large market potential in india
GRowTH avenues December 2008
Source: TRAI, CII-Yankee Study and IMRB Report
urban-Rural Disparity in india
2007 2008
Tele
dens
ity (
%)
urban Rural Total
60
50
2006200520042003200220012000
40
30
20
10
0 0.7 0.9 1.2 1.5 1.7 1.7 1.9 5.0
9.24.3 5.1 7.0
12.9
2.93.6
19.9
28.3
8.2
10.412.2
21.3
26.2
14.3
38
49
57.7
9.1

TelecommunicaTionDecember 2008
��
This presentation has been prepared jointly by the india Brand equity Foundation (“iBeF”) and evalueserve.com Pvt. ltd., evalueseRve (‘authors’).
all rights reserved. all copyright in this presentation and related works is owned by iBeF and the authors. The same may not be reproduced, wholly or in part in any material form (including photocopying or storing it in any medium by electronic means and whether or not transiently or incidentally to some other use of this presentation), modified or in any manner communicated to any third party except with the written approval of iBeF.
This presentation is for information purposes only.
while due care has been taken during the compilation of this presentation to ensure that the information is accurate to the best of the author’s and iBeF’s knowledge and belief, the content is not to be construed in any manner whatsoever as a substitute for professional advice.
The author and iBeF neither recommend or endorse any specific products or services that may have been mentioned in this presentation and nor do they assume any liability or responsibility for the outcome of decisions taken as a result of any reliance placed in this presentation.
neither the author nor iBeF shall be liable for any direct or indirect damages that may arise due to any act or omission on the part of the user due to any reliance placed or guidance taken from any portion of this presentation.
DisclaimeR
www.ibef.org
Top Related