


Languages
Pages
Legal

Study of parametric optimization of
fused deposition modelling
process using response surface methodology
A thesis submitted in partial fulfilment of
the requirements for degree in
Bachelor of Technology
in
Mechanical Engineering
By
Ashutosh Chouksey
Department of Mechanical Engineering
National Institute of Technology
Rourkela
2012
NATIONAL INSTITUTE OF TECHNOLOGY
ROURKELA
CERTIFICATE
This is to certify that the thesis entitled Study of parametric optimization of
Fused Deposition Modelling using response surface methodology justified by
Mr. Ashutosh Chouksey in partial fulfilment of the requirements for the degree
of Bachelor of Technology in Mechanical Engineering at National Institute of
Technology, Rourkela.This is an authentic work carried out by him under my
supervision .
To the best of my knowledge the matter embodied in the thesis has not been
submitted to any University/Institute for award of any degree or diploma.
Prof.S.S.Mahapatra
Dept. of Mechanical Engg.
National Institute of Technology
Rourkela-769008

ACKNOWLEDGEMENT
I avail this opportunity to extend my deep sense of gratitude
to my Prof.S.S.Mahapatra for his academic and professional
guidance and help at different stages of my B.Tech Final Year
Project.
I would also like to appreciate the cooperation of
Prof.K.P.Maity for providing valuable departmental facilities
and Prof.S.K.Sahoo for justifying my efforts and constantly
giving me invaluable advice.
Submitted By:
Ashutosh Chouksey
Roll:108ME031
Mechanical Engg.
NATIONAL INSTITUTE OF TECHNOLOGY
ROURKELA-769008
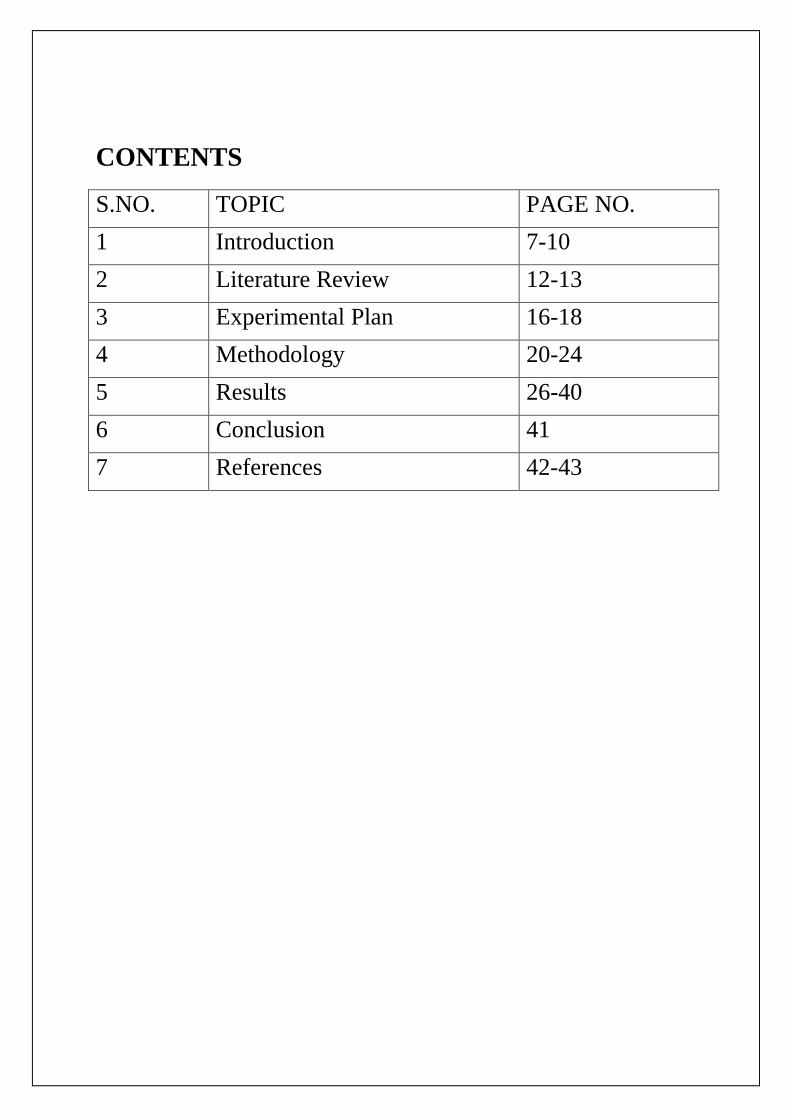
CONTENTS
S.NO. TOPIC PAGE NO.
1 Introduction 7-10
2 Literature Review 12-13
3 Experimental Plan 16-18
4 Methodology 20-24
5 Results 26-40
6 Conclusion 41
7 References 42-43
ABSTRACT
FDM(fused deposition modelling) is a RP(rapid prototyping)technique used to
manufacture prototypes on additive manufacturing technology.The material
used is ABS(acronitirile butadiene styrene) plastic.The prototypes are made
layer by layer addition of semi molten plastic and their joining by diffusion
welding.In the present study effect of different parameters on response is
studied.RSM(response surface methodology) is used to build a regression model
which can represent response in terms of different parameters.
Influence of the process parameters on each factor is essentially studied and
regression equation is built for each of strength under study.By using ANOVA
analysis significant factors are considered and unsignificant factors are left out.
After getting regression equation an optimized solution is obtained for each
strengthby using a suitable mathematical software.

INTRODUCTION
INTRODUCTION
RAPID PROTOTYPING
FDM(fused deposition modelling) Model works on the principle of Rapid
Prototyping(RP methodology).Rapid Prototyping is a group technology which
is used to quickly fabricate a scale model of part or assembly using
computational drawing techniques like CAD/CAM.These 3-D Printing
technology enables user to quickly create prototypes of design compared to
earlier technology which only created 2 D pictures.It has several uses like:
1. excellent visual aids for communicating ideas with co-workers or
customers.
2. prototypes can be used for design testing.
3. Cheap and quick process
4. Used to make tooling and product quality parts.
In rapid prototyping the term rapid is deceptive as many prototypes require
many hours and even days for manufacturing prototype .However when
compared to actual manufacturing process it is comparatively much faster
process. Rapid Prototyping is also known as solid free form
fabrication,compuer automated manufacturing or layered manufacturing as it is
increasingly being used in non prototyping applications . This technique slices
3d model into a number of 2d layers which are built on top of each other.The
3d part is a laminate composite with vertically stacked layers consisting of a
number of material fibres with interstitial voids. The bonding between different
layers is done by diffusion welding .Non uniform bonding and irregular
temperature distribution results in brittle and anisotropic nature of the
specimen.
THE BASIC PROCESS
All rapid prototyping techniques consists of following basic steps:
1.Formulation of CAD model of the design.
2.Convesion of CAD model into STL format.
3.Slice the STL model into a number of thin layers.
4.Construct the model one above the other so that layers are
approximation of model.
5.Clean and finish the model.
FORMULATION OF CAD MODEL
First the object is modelled using a CAD software package.Solid modellers like
STAD PRO and CATIA are preferred over wire frame modellers like
AUTOCAD.CATIA is used for our analysis purpose.
CAD MODEL TO STL FORMAT
Since different CAD softwares use different algorithms for creation of 3d model
STL format is used as a standard by all the prototyping applications .It consists
of a number of triangle shaped planar structure which when together stacked on
one another are used to approximate the model.This format also stores all
information about the coordinates and normal vectors of all the planar surfaces.
CREATION OF THIN LAYERS FROM STL FORMAT
In this step build orientation is decided in which layers will be built.Properly
orienting the model helps in reducing the build time .Pre –Processing software
slices the STL format according to requirement .
CONSTRUCTION OF AN APPROXIMATE MODEL
The fourth step is actual construction of model in which one of the several rapid
prototyping techniques is used for building the model.The process uses one of
the several techniques for building the model
FINISHING OF MODEL
This is the final post processing step used for fabrication of the prototype.It
involves removal of model from the structure and removal of any extra
supports. It also involves treatment of the prototype for removal of any
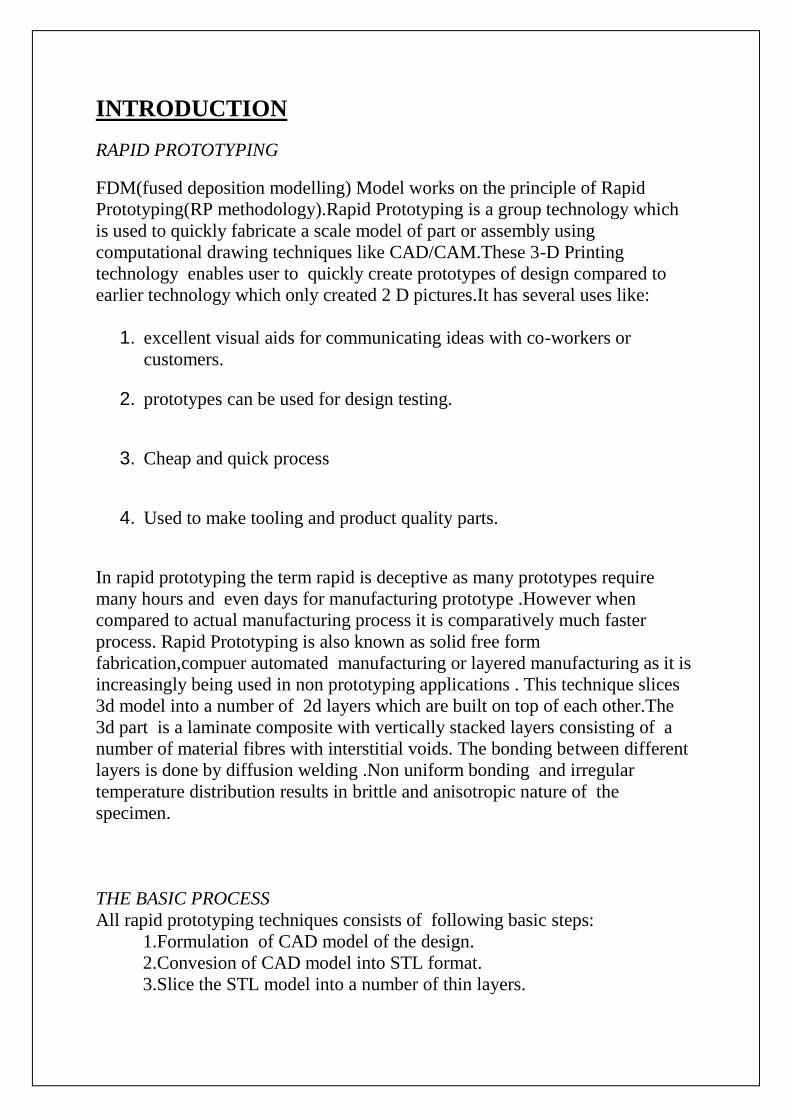
irregularities.Following figure shows the various steps involves in rapid
prototyping.
FIGURE 1:FLOW CHART OF RAPID PROTOTYPING
MATERIAL USED FOR FORMATION OF PROTOTYPE
The material used in prototype formation is ABS plastic.ABS (acronitrile
butadiene styrene)is a carbon chain copolymer .It is made by dissolving
butadiene styrene copolymer in a mixture of acronitrile and styrene
monomers.Acronitrile is responsible for providing heat resistance ,butadiene
responsible for impact strength and styrene responsible for providing rigidity.
Manufacturing of specimen is done by diffusion welding. This results is non
uniform distribution of material as welding is non continuous.These non
uniformity affect the strength of the specimen and it is therefore necessary to
study impact of different process parameters on different types of
strength.DOE(design of experiment) helps in reducing the cost and improving
the quality of experiment.RSM(response surface methodology)helps in
deteming the regression equation which governs different paramaters taken in
the experiment.After getting the regression equation an optimized solution is
obtained using various optimization techniques like PSO(particle swarm
optimization),artificial neural network,genetic algorithm etc.For our purpose we
are using genetic algorithm as it is easily comprehensible and understood.
FUSED DEPOSITION MODELLING
Fused deposition modelling is gaining distinct advantage in manufacturing
industries because of its ability to manufacture parts with complex shapes
without any tooling requirement and human interface. Fused deposition
modeling is an additive manufacting technology commonly used for modeling,
prototyping, and production applications. FDM works on an "additive" principle
by laying down material in layers. A plastic filament is uncoiled from a coil
and supplies material to an extrusion nozzle which can be used depending on
requirement. The nozzle is heated to melt the material and can be moved in both
horizontal and vertical directions by a automated computational mechanism,
directly controlled by a computer-aided manufacturing (CAM) software
package. The model or part is produced by extrusion of thermoplastic material
to form layers as the material hardens immediately after extrusion from the
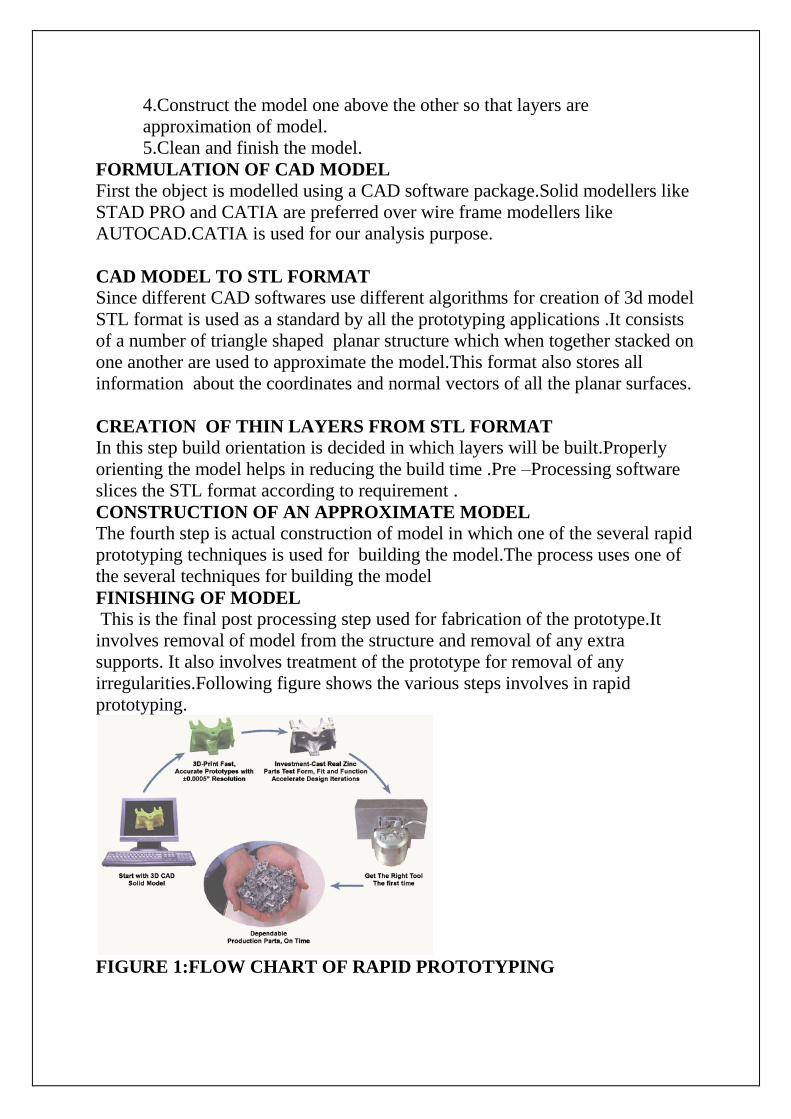
nozzle.A schematic layout of the nozzle and platform arrangement is as shown
in figure
FIGURE 2 :FLOW CHART OF FDM PROCESS
This technology was developed by S.Scott crumo in the 80s.The FDM
technology is marketed comerially by Stratasys.Apart from ABS several
material are available on which FDM technology can be used .It can be used on
polycarbonates.polycaprolactone,polyphenylsulphones and waxes.For providing
support during manufacturing a water soluble material is generally used.It is
sold by Stratasys under the brand name waterworks.This soluble material is
quickly dissolved with metal agitators utilizing a solution of sodium hydroxide
as solvent.
Applications:
-conceptual modelling
-Fit,form applications and models for further manufacturing process
-investment casting and injection moulding
Advantages :
-Quick and cheap generation of models
-no worry of exposure to toxic chemicals
Disadvantages:
-limited accuracy due to shape of material used wire is 1.27mm in diameter.
The main benefit rapid prototypoing technologies offer is its ability to
manufacture parts of compex geometry without any tooling requirement just by
tracing the cad model layer by layer.The ability to manufacture complex parts
helps us to substantially reduce production cost ,a concept not possible in
traditional manufacturing where complexity in design directly resulted in
increased cost due to increased cost of machining.One of the other advantages
of RP technologies is their ability to produce functional assemblies by
consolidating sub assemblies into one unit thereby reducing the part count
,handling time storage requirement.Inspite of such added advantages it is not
possible to implement on a full scale at industrial level because os its limitations
in terms of type of product manufactured.To overcome such limitations new
materials have to be developed which can be used in RP technologies. Also the
parameter controlling the specimen can be optimized to get maximum
utilization of properties of existing products. Since mechanical strength is an
important parameter governing the properties of material , therefore in our
present study we have made an attempt to study different t types of strength
like tensile strength ,flexural strength , impact strength and compressive
strength .After studying behavor of different types of strength an optimum
solution is obtained to get the optimum values of the parameter which govern
different types of strength.

LITERATURE REVIEW
LITERATURE REVIEW
Anitha et al[1],by use of taguchi method influence of road width,layer
thickness and speed of deposition at three different levels on surface roughness
of part produced by the process of FDM is determined.From the results it is
indicated that layer thickness is the most influencing factor greatly affecting
surface roughness followed by road width and speed of deposition
Sood et al[2],the effect of orientation,layer thickness,raster angle,raster
width,raster raster to raster gap is studied with the help of taguchi method on
dimensional acuuracy.Significant factors and their interaction are found out
using taguchi method.The optimum settings of the parameters are found out so
that all the three dimensions show minimum deviation from actual value
settings simultaneously and the common factor settings needs to be explored.
Pradhan et al[3],study shows that quality of product considerably influences
the properties of the material.Method of response surface methodology is used
to analyze the influence of process parameters on surface roughness.By the use
of RSM a correlation between process variable and response is established.A
second order response model of these parameters is established and deduced
that pulse current ,discharge time and interaction term of pulse current with
other parameters significantly affect the surface response.
Carley et al[4],various situations are studied in which response surface
methodology consists of experimental strategy that can be applied and desired
results can be obtained
Lee et al[5],Performed experiments on cylindrical parts using three RP process
FDM 3D printer and nano composite deposition(NCDS) to study the effect of
build direction on compressive properties.Experimental results show that
compressive strength is 11.6% is higher for axial FDM specimen as compared
to transverse FDM specimen.In 3D printing diagonal specimen posseses
maximum compressive strength in comparison to axial specimen.For,NCDS
axial specimen showed compressive strength 23.6% higher than that of
transverse specimen.Out of the three RP technologies parts built by NCDS are
most affected by build direction.
Khan et al[6],concluded that layer thickness ,raster angle and air gap are found
to significantly effect elastic properties of FDM ABS prototype.
Bellehumeur[7],experimentally assessed the bond quality between adjacent
fibres and their failure under flexural loading.Experimental results show that
both the envelope temperature and variations in convective conditions within
the building chamber have strong effect on the meso structure and overall
quality of bond strength.On line measurement of cooling temperature profile
reveals that temperature profile of the bottom layer rises above the glass away
from the position of placement of thermostat and minimum temperature
increase with the number of layers.Micrograph of the cross sectional area shows
that diffusion of adjacent filaments is more in upper layers as compared to
upper layers for the face of specimen with higher number of layers.
Chattoraj et al[8],In this study method of GA is used for optimization of
magnetized FMSA.A code of genetic algorithm for magnetized ferro microstrip
antenna is developed using C++ and fitness function is obtained.The
comparison of the optimized results obtained using GA optimizer of MATLAB
is done.
Sood et al[9] In this study five parameters orientation,layer thickness,raster
angle.air gap and raster width effect is studied on different mechanical strengths
like tensile,flexural,,impact strength is done.Response surface plots for each
plot is analyzed and weak strength is attributes to distortion between layers.

EXPERIMENTAL PLAN
EXPERIMENTAL PLAN
FDM machines build prototypes on additive manufacturing technology.It has
two nozzles ,one for building of the prototype and other for building of support
structure.The experiment is conducted for three parameter based model.Main
process parameters used in the experiment are :
1.Layer thickness: It is the thickness of layer deposited by the nozzle and its
configuration dependon the shape of prototype and type of nozzle.
2.Orientation:It refers to the inclination of the part in build platform with
respect to X,Y,Z axis.The platform is taken as X and Y axis plane and Z axis is
taken along build direction.
3.Raster angle:It is the direction of raster build with respect to X axis.
CATIA V5 is used to design the model and it is finally converted to
STL(stereolithography) format.STL format is imported to FDM
software.CCD(central composite design) is used to design the experimental runs
and empirical modelling of the process.In order to model the experiment it is
conducted based on CCD.A CCD of second order polynomial is used because it
takes into account all the interaction factors.Maximum and minimum value of
each factor is coded into -1 and +1 according to the following equation:
Where i=1,2,...K and j=1,2
Uncoded values for all the codes of the three factors is shown in the table given
below.FCCD(face central composite design) is considered for the design of
experiment to counteract the effect of machine constraints.
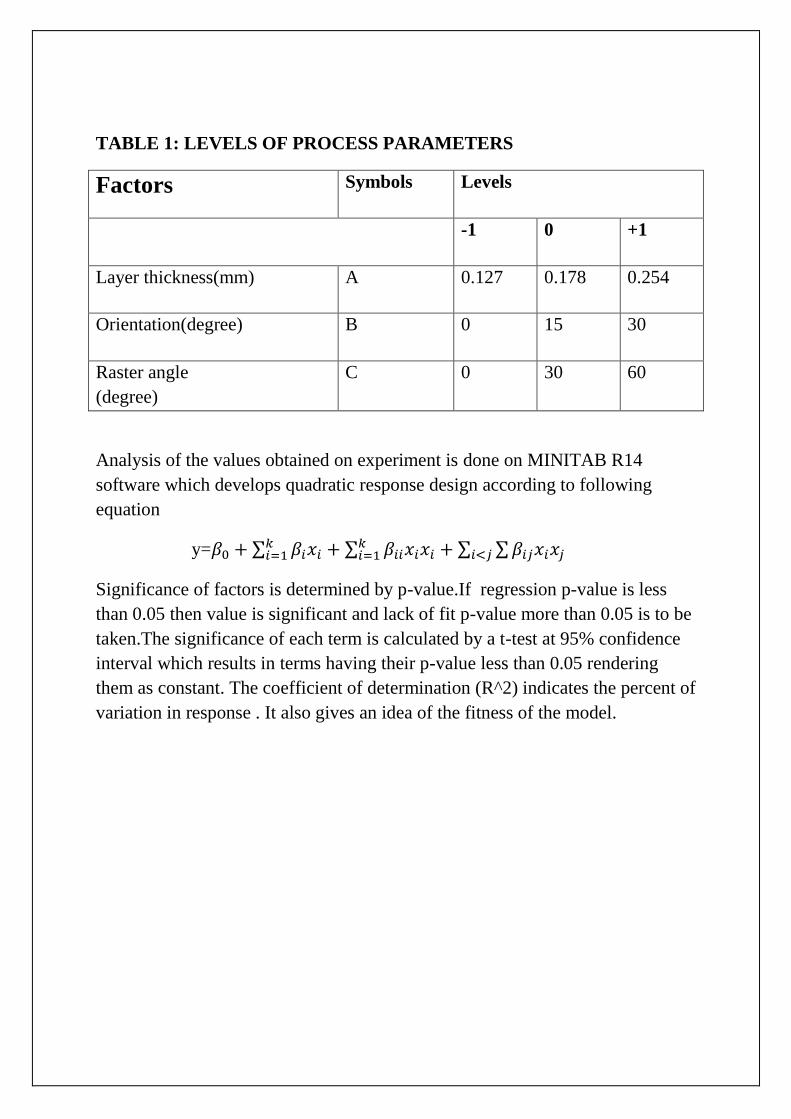
TABLE 1: LEVELS OF PROCESS PARAMETERS
Factors Symbols Levels
-1 0 +1
Layer thickness(mm) A 0.127 0.178 0.254
Orientation(degree) B 0 15 30
Raster angle
(degree)
C 0 30 60
Analysis of the values obtained on experiment is done on MINITAB R14
software which develops quadratic response design according to following
equation
y=
Significance of factors is determined by p-value.If regression p-value is less
than 0.05 then value is significant and lack of fit p-value more than 0.05 is to be
taken.The significance of each term is calculated by a t-test at 95% confidence
interval which results in terms having their p-value less than 0.05 rendering
them as constant. The coefficient of determination (R^2) indicates the percent of
variation in response . It also gives an idea of the fitness of the model.
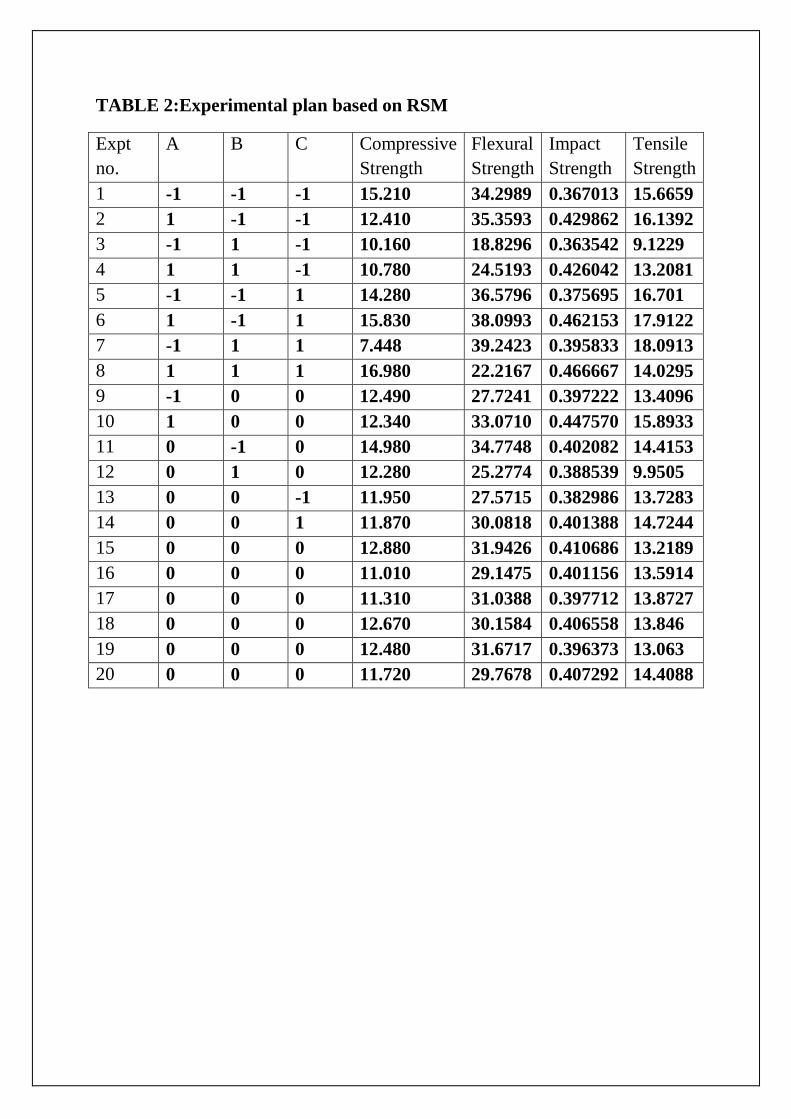
TABLE 2:Experimental plan based on RSM
Expt
no.
A B C Compressive
Strength
Flexural
Strength
Impact
Strength
Tensile
Strength
1 -1 -1 -1 15.210 34.2989 0.367013 15.6659
2 1 -1 -1 12.410 35.3593 0.429862 16.1392
3 -1 1 -1 10.160 18.8296 0.363542 9.1229
4 1 1 -1 10.780 24.5193 0.426042 13.2081
5 -1 -1 1 14.280 36.5796 0.375695 16.701
6 1 -1 1 15.830 38.0993 0.462153 17.9122
7 -1 1 1 7.448 39.2423 0.395833 18.0913
8 1 1 1 16.980 22.2167 0.466667 14.0295
9 -1 0 0 12.490 27.7241 0.397222 13.4096
10 1 0 0 12.340 33.0710 0.447570 15.8933
11 0 -1 0 14.980 34.7748 0.402082 14.4153
12 0 1 0 12.280 25.2774 0.388539 9.9505
13 0 0 -1 11.950 27.5715 0.382986 13.7283
14 0 0 1 11.870 30.0818 0.401388 14.7244
15 0 0 0 12.880 31.9426 0.410686 13.2189
16 0 0 0 11.010 29.1475 0.401156 13.5914
17 0 0 0 11.310 31.0388 0.397712 13.8727
18 0 0 0 12.670 30.1584 0.406558 13.846
19 0 0 0 12.480 31.6717 0.396373 13.063
20 0 0 0 11.720 29.7678 0.407292 14.4088

METHODOLOGY
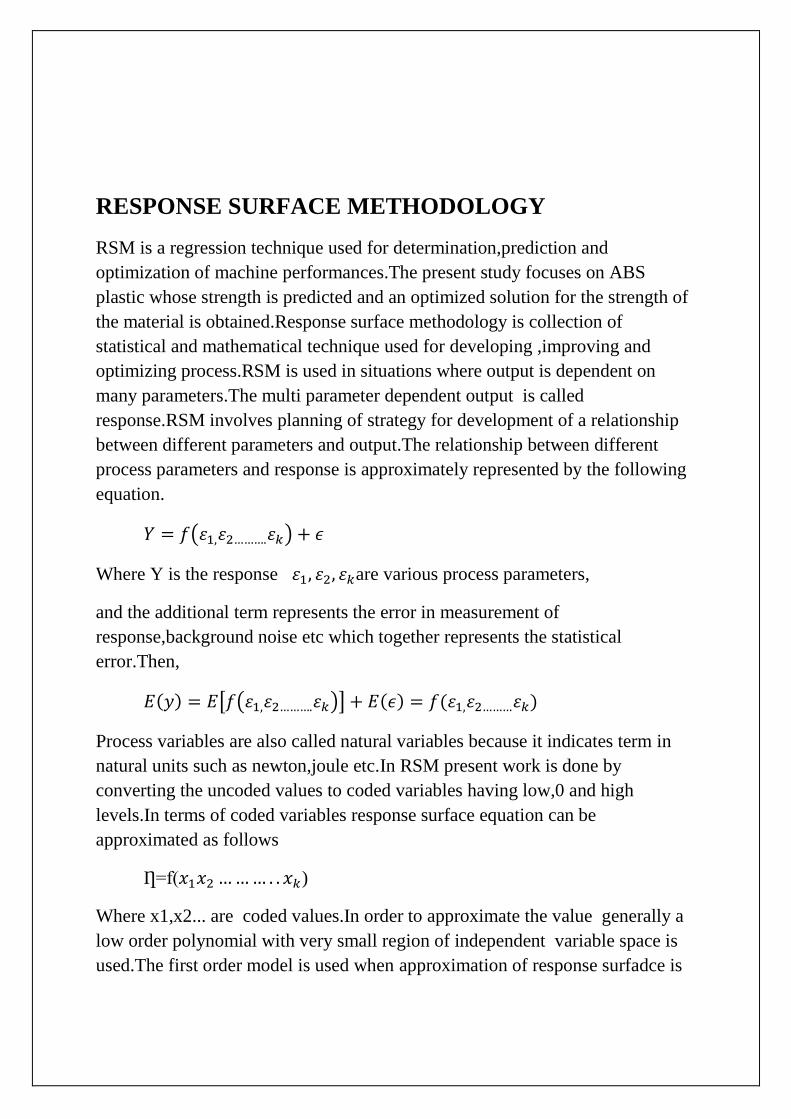
RESPONSE SURFACE METHODOLOGY
RSM is a regression technique used for determination,prediction and
optimization of machine performances.The present study focuses on ABS
plastic whose strength is predicted and an optimized solution for the strength of
the material is obtained.Response surface methodology is collection of
statistical and mathematical technique used for developing ,improving and
optimizing process.RSM is used in situations where output is dependent on
many parameters.The multi parameter dependent output is called
response.RSM involves planning of strategy for development of a relationship
between different parameters and output.The relationship between different
process parameters and response is approximately represented by the following
equation.
Where Y is the response are various process parameters,
and the additional term represents the error in measurement of
response,background noise etc which together represents the statistical
error.Then,
Process variables are also called natural variables because it indicates term in
natural units such as newton,joule etc.In RSM present work is done by
converting the uncoded values to coded variables having low,0 and high
levels.In terms of coded variables response surface equation can be
approximated as follows
Ƞ=f( )
Where x1,x2... are coded values.In order to approximate the value generally a
low order polynomial with very small region of independent variable space is
used.The first order model is used when approximation of response surfadce is
done on a relatively small region of the independent variable space when there
is little curvature in the response surface.
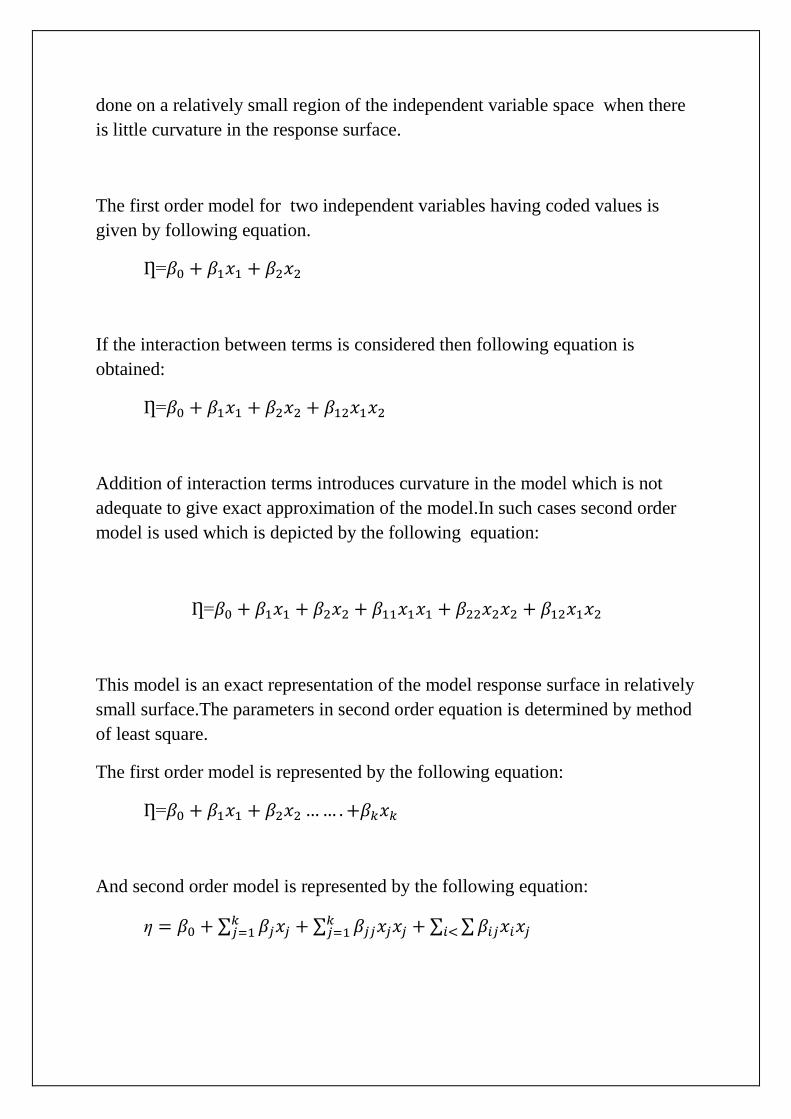
The first order model for two independent variables having coded values is
given by following equation.
Ƞ=
If the interaction between terms is considered then following equation is
obtained:
Ƞ=
Addition of interaction terms introduces curvature in the model which is not
adequate to give exact approximation of the model.In such cases second order
model is used which is depicted by the following equation:
Ƞ=
This model is an exact representation of the model response surface in relatively
small surface.The parameters in second order equation is determined by method
of least square.
The first order model is represented by the following equation:
Ƞ=
And second order model is represented by the following equation:
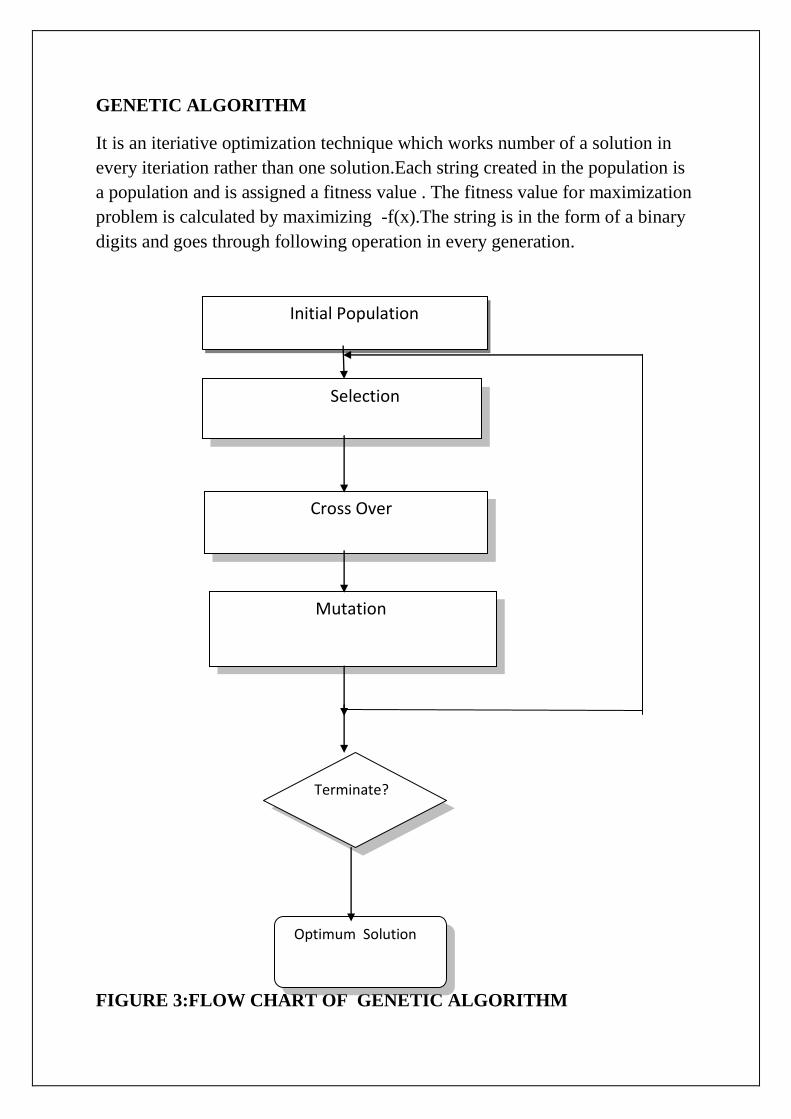
GENETIC ALGORITHM
It is an iteriative optimization technique which works number of a solution in
every iteriation rather than one solution.Each string created in the population is
a population and is assigned a fitness value . The fitness value for maximization
problem is calculated by maximizing -f(x).The string is in the form of a binary
digits and goes through following operation in every generation.
FIGURE 3:FLOW CHART OF GENETIC ALGORITHM
Initial Population
Selection
Cross Over
Mutation
Terminate?
Optimum Solution
Every iteriation consists of following steps:
1.Reproduction:It is a procedure of selecting good parents from initial
population with best fitness value to produce offspring for the next
generation.Population is selected by different selection procedures like
proportionate selection method,ranking selection method and tournament
selection method.In proportionate selection parents are selected having
probability proportional to their fitness values.In ranking selection method
parents are selected by arranging strings in ascending order of their fitness
values and then selecting parents with best fitness value.In tournament selection
two populations are randomly selected and then their fitness values are
compared.
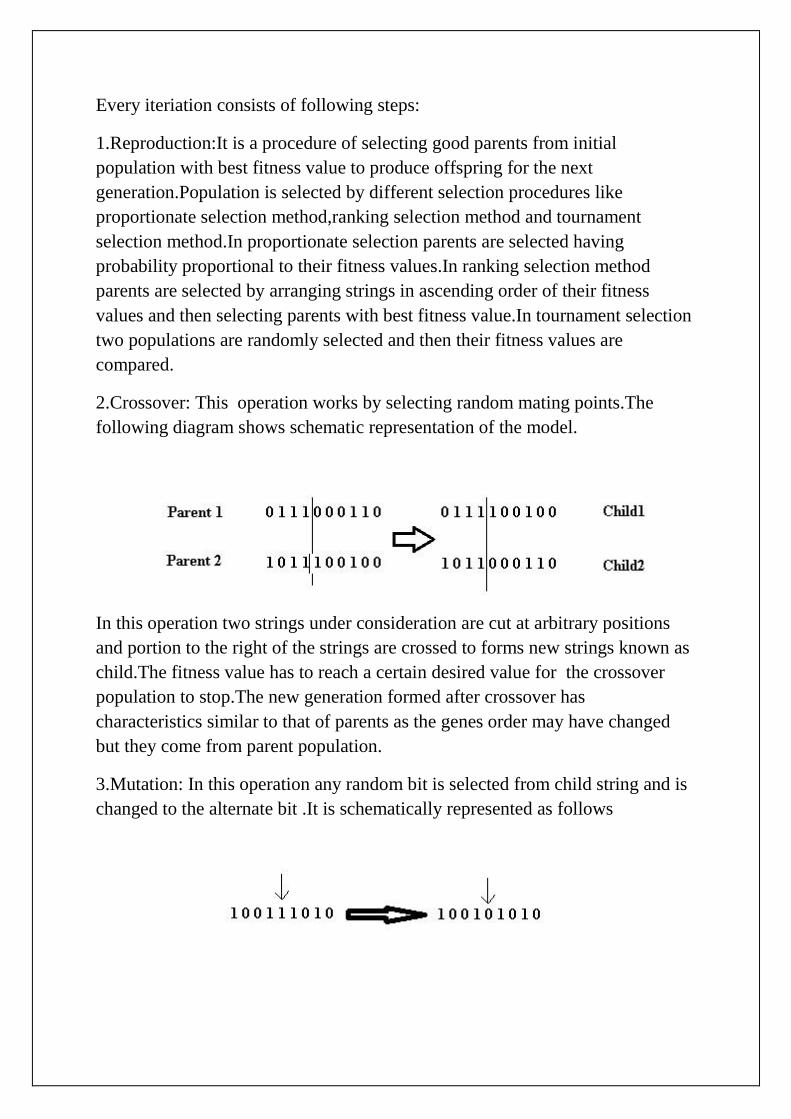
2.Crossover: This operation works by selecting random mating points.The
following diagram shows schematic representation of the model.
In this operation two strings under consideration are cut at arbitrary positions
and portion to the right of the strings are crossed to forms new strings known as
child.The fitness value has to reach a certain desired value for the crossover
population to stop.The new generation formed after crossover has
characteristics similar to that of parents as the genes order may have changed
but they come from parent population.
3.Mutation: In this operation any random bit is selected from child string and is
changed to the alternate bit .It is schematically represented as follows

As soon as the mutation is over fitness is evaluated and new generation with
better finess replace parents with poor fitness values.It brings diversity in the
population which would otherwise result in inbreeding.The genetic algorithm is
stopped after population is reached certain desired fitness value.

RESULTS AND
DISCUSSIONS
RESULTS AND DISCUSSIONS
Analysis of experimental data obtained from FCCD design is done on minitab
r14 software.The model used is a full quadratic response model and is
represented by the following equation
y=
Where xi is the ith factor and Y is the response.
Significance of the values is calculated from F-values of ANOVA table.The
significance of any term is established if p-value is less than 0.05 for regression
coefficients and more than 0.05 for lack of fit values.An insignificant lack of fit
is desirable because it indicates that any term left out of the model is not
important and model fits well.
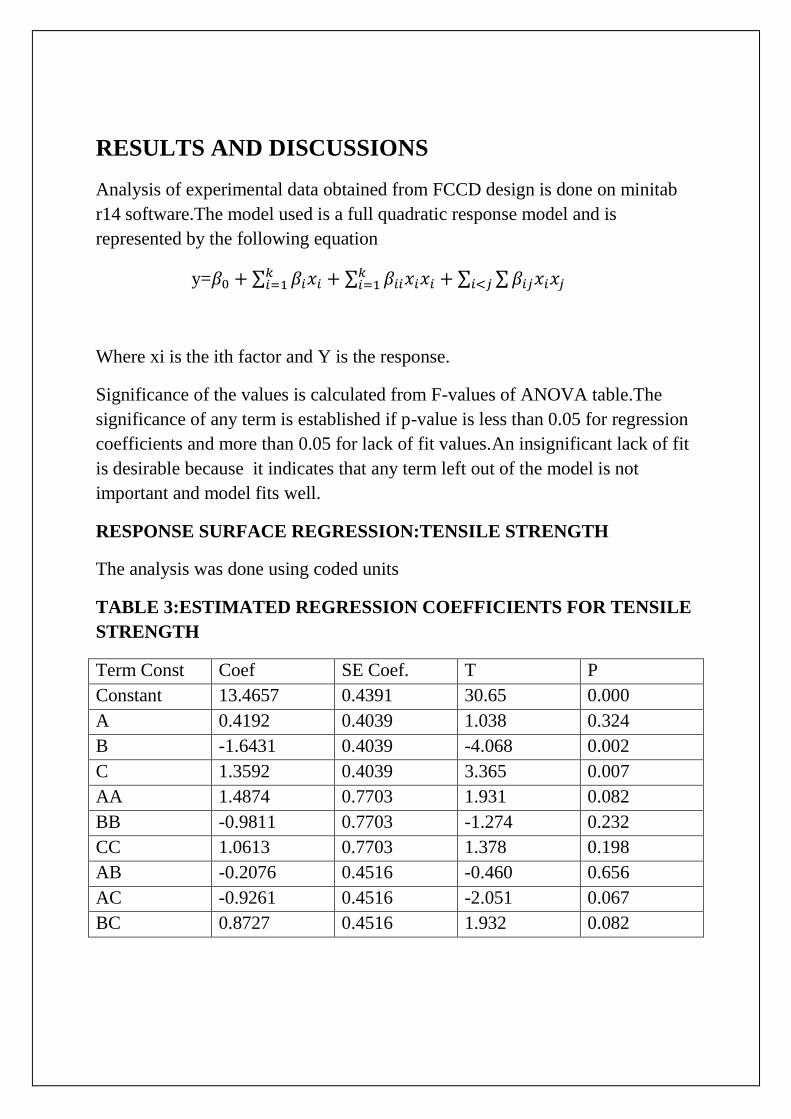
RESPONSE SURFACE REGRESSION:TENSILE STRENGTH
The analysis was done using coded units
TABLE 3:ESTIMATED REGRESSION COEFFICIENTS FOR TENSILE
STRENGTH
Term Const Coef SE Coef. T P
Constant 13.4657 0.4391 30.65 0.000
A 0.4192 0.4039 1.038 0.324
B -1.6431 0.4039 -4.068 0.002
C 1.3592 0.4039 3.365 0.007
AA 1.4874 0.7703 1.931 0.082
BB -0.9811 0.7703 -1.274 0.232
CC 1.0613 0.7703 1.378 0.198
AB -0.2076 0.4516 -0.460 0.656
AC -0.9261 0.4516 -2.051 0.067
BC 0.8727 0.4516 1.932 0.082
Regression equation for tensile strength
T=13.4657+0.4192*A -1.6431*B +1.3592*C+1.4874*A*A-
0.9811*B*B+1.0613*C*C-0.2076*A*B-0.9261*A*C+0.8727*B*C.
TABLE 4: ANALYSIS OF VARIANCE FOR TENSILE STRENGTH
Source DF Seq SS Adj SS Adj MS F P
Regression 9 76.505 76.505 8.5006 5.21 0.008
Linear 3 47.230 47.230 15.7433 9.65 0.003
Square 3 15.976 15.976 5.3252 3.26 0.068
Interaction 3 13.300 13.300 4.4333 2.72 0.101
Residual
Error
10 16.316 16.316 1.6316
Lack of Fit 5 15.120 15.120 3.0241 12.64 0.007
Pure Error 5 1.196 1.196 0.2392
Total 19 92.822
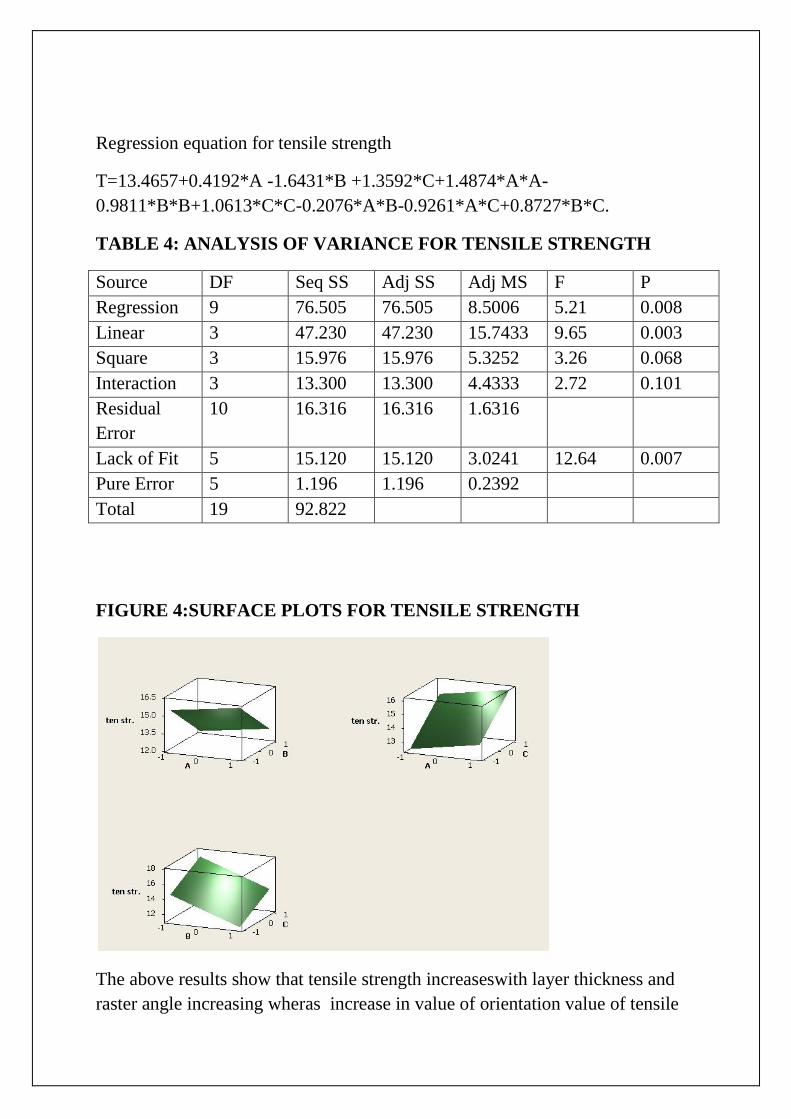
FIGURE 4:SURFACE PLOTS FOR TENSILE STRENGTH
The above results show that tensile strength increaseswith layer thickness and
raster angle increasing wheras increase in value of orientation value of tensile
strength decreases.For layer thickness reason may be better heat conduction
with increased thickness.For orientation non uniform overlapping is the reason
for decresing values.
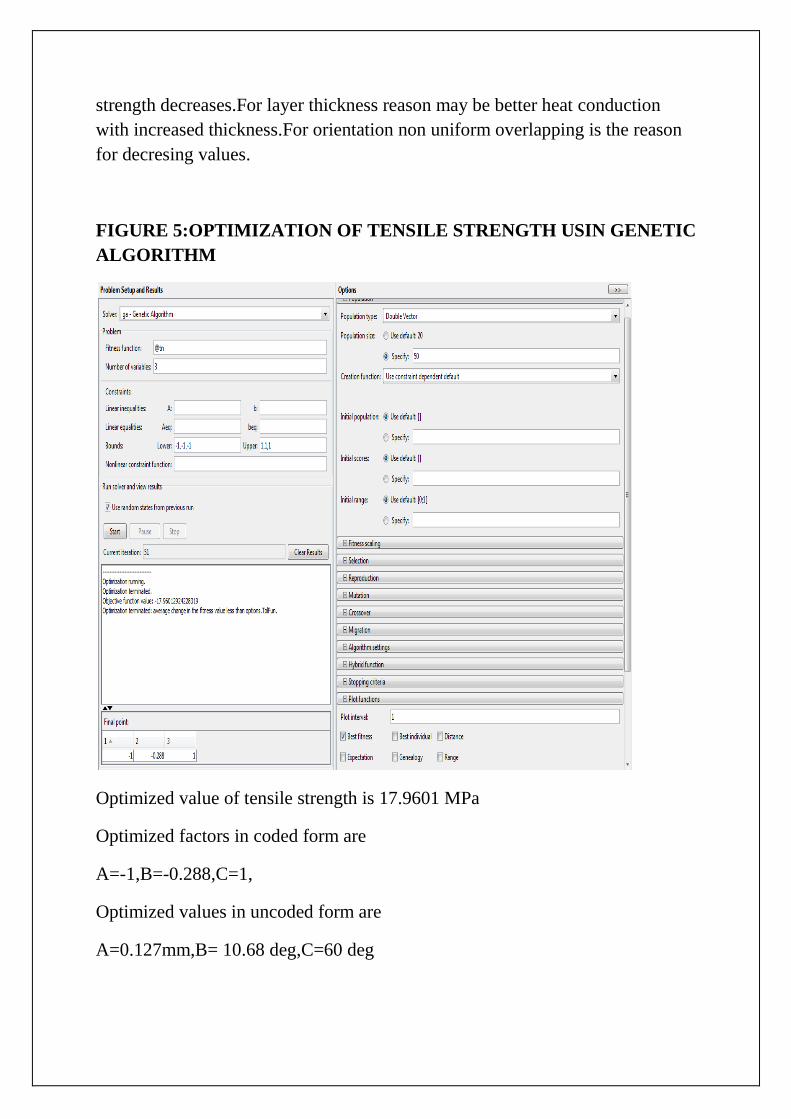
FIGURE 5:OPTIMIZATION OF TENSILE STRENGTH USIN GENETIC
ALGORITHM
Optimized value of tensile strength is 17.9601 MPa
Optimized factors in coded form are
A=-1,B=-0.288,C=1,
Optimized values in uncoded form are
A=0.127mm,B= 10.68 deg,C=60 deg
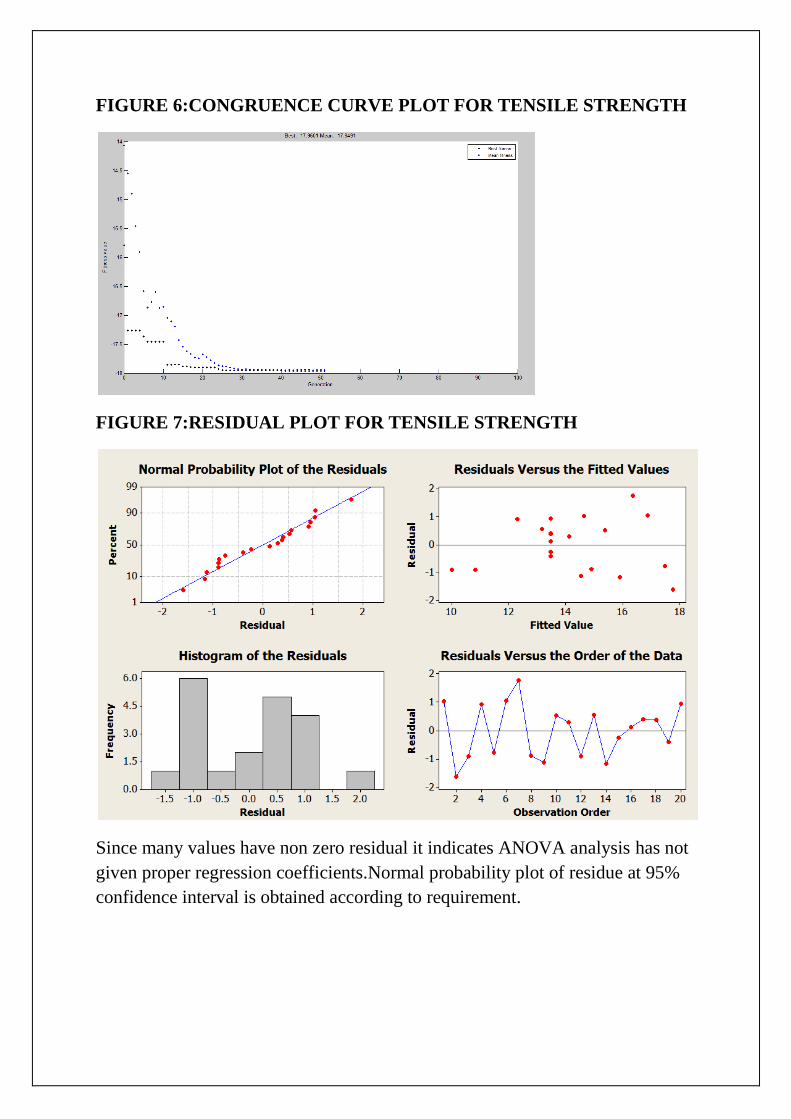
FIGURE 6:CONGRUENCE CURVE PLOT FOR TENSILE STRENGTH
FIGURE 7:RESIDUAL PLOT FOR TENSILE STRENGTH
Since many values have non zero residual it indicates ANOVA analysis has not
given proper regression coefficients.Normal probability plot of residue at 95%
confidence interval is obtained according to requirement.
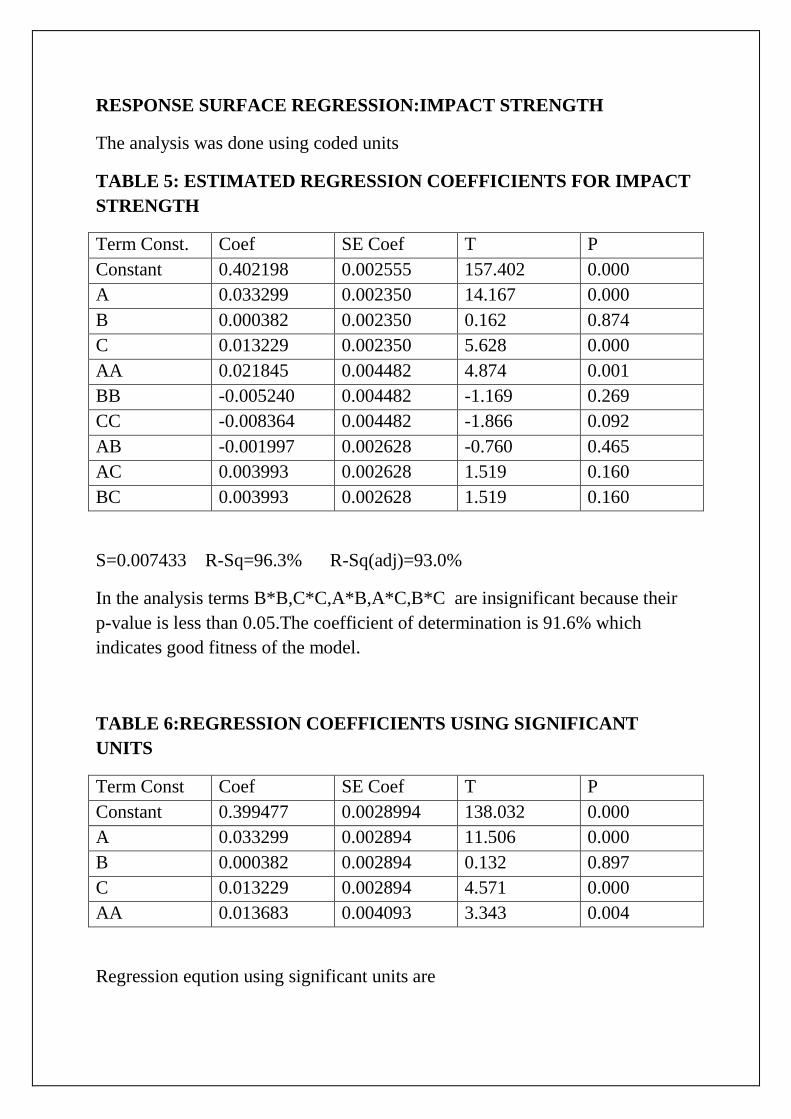
RESPONSE SURFACE REGRESSION:IMPACT STRENGTH
The analysis was done using coded units
TABLE 5: ESTIMATED REGRESSION COEFFICIENTS FOR IMPACT
STRENGTH
Term Const. Coef SE Coef T P
Constant 0.402198 0.002555 157.402 0.000
A 0.033299 0.002350 14.167 0.000
B 0.000382 0.002350 0.162 0.874
C 0.013229 0.002350 5.628 0.000
AA 0.021845 0.004482 4.874 0.001
BB -0.005240 0.004482 -1.169 0.269
CC -0.008364 0.004482 -1.866 0.092
AB -0.001997 0.002628 -0.760 0.465
AC 0.003993 0.002628 1.519 0.160
BC 0.003993 0.002628 1.519 0.160
S=0.007433 R-Sq=96.3% R-Sq(adj)=93.0%
In the analysis terms B*B,C*C,A*B,A*C,B*C are insignificant because their
p-value is less than 0.05.The coefficient of determination is 91.6% which
indicates good fitness of the model.
TABLE 6:REGRESSION COEFFICIENTS USING SIGNIFICANT
UNITS
Term Const Coef SE Coef T P
Constant 0.399477 0.0028994 138.032 0.000
A 0.033299 0.002894 11.506 0.000
B 0.000382 0.002894 0.132 0.897
C 0.013229 0.002894 4.571 0.000
AA 0.013683 0.004093 3.343 0.004
Regression eqution using significant units are
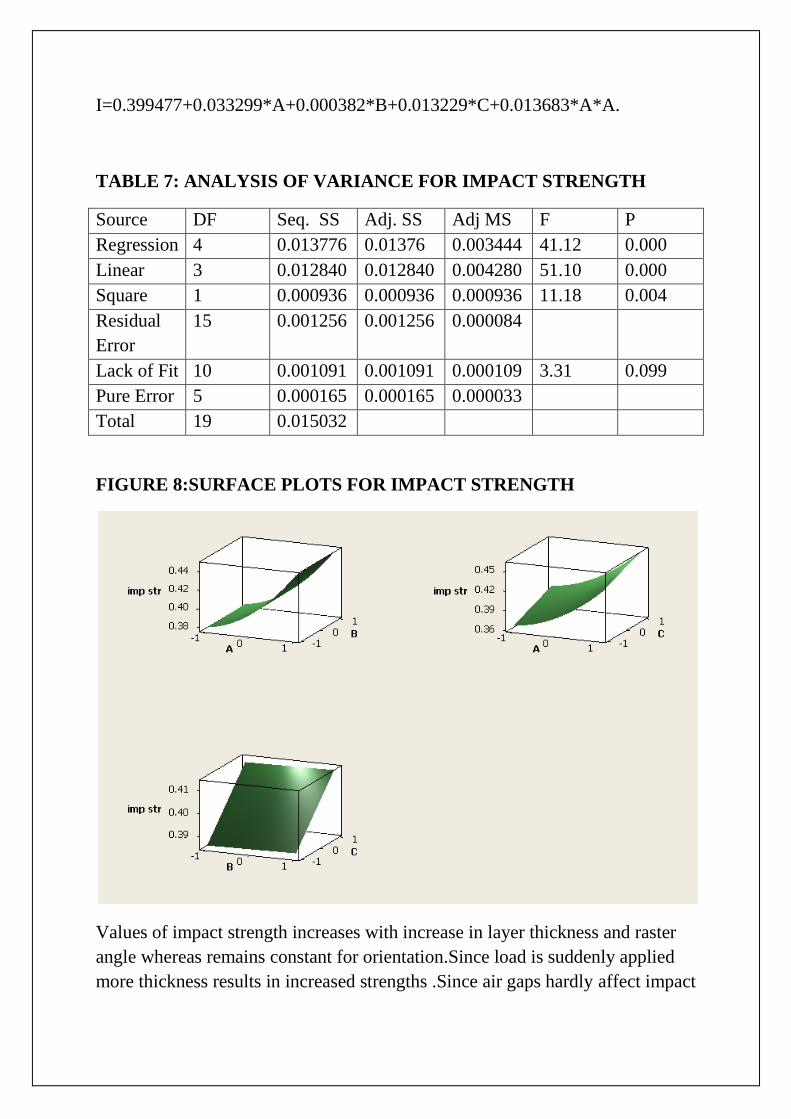
I=0.399477+0.033299*A+0.000382*B+0.013229*C+0.013683*A*A.
TABLE 7: ANALYSIS OF VARIANCE FOR IMPACT STRENGTH
Source DF Seq. SS Adj. SS Adj MS F P
Regression 4 0.013776 0.01376 0.003444 41.12 0.000
Linear 3 0.012840 0.012840 0.004280 51.10 0.000
Square 1 0.000936 0.000936 0.000936 11.18 0.004
Residual
Error
15 0.001256 0.001256 0.000084
Lack of Fit 10 0.001091 0.001091 0.000109 3.31 0.099
Pure Error 5 0.000165 0.000165 0.000033
Total 19 0.015032
FIGURE 8:SURFACE PLOTS FOR IMPACT STRENGTH
Values of impact strength increases with increase in layer thickness and raster
angle whereas remains constant for orientation.Since load is suddenly applied
more thickness results in increased strengths .Since air gaps hardly affect impact
strength its values remains constant.With increase in raster angle length of
individual raster is more resulting in increased strengths at higher values.
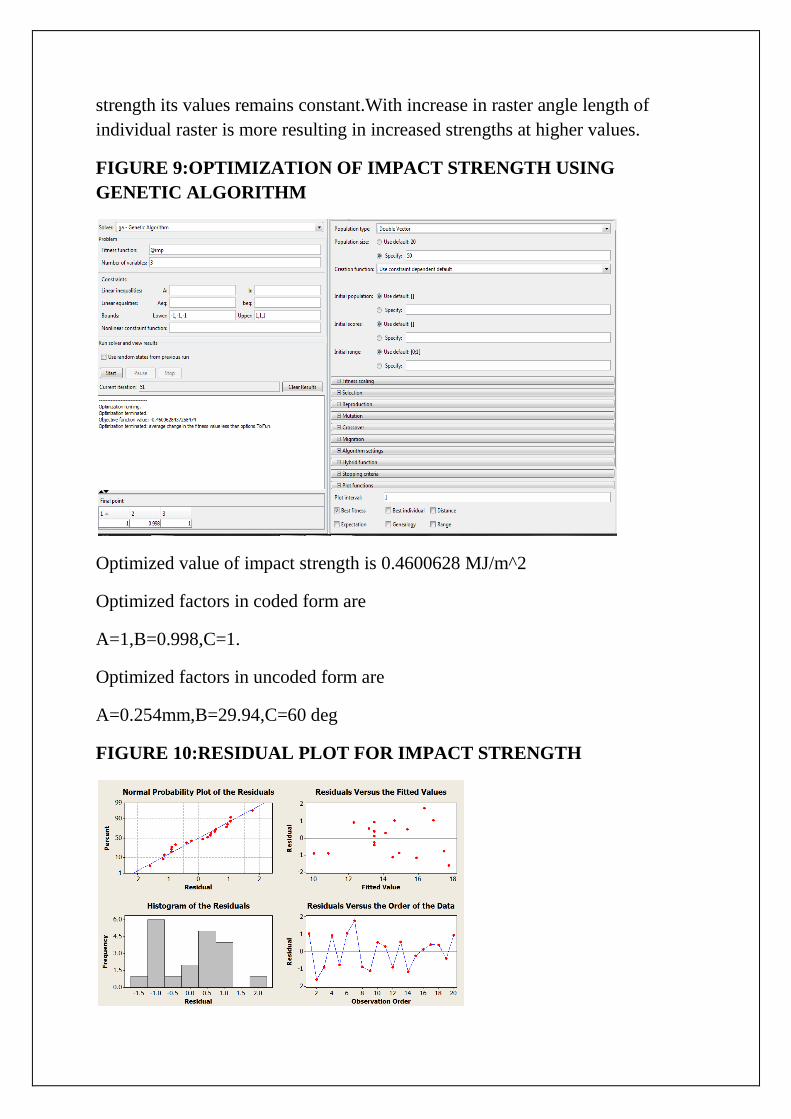
FIGURE 9:OPTIMIZATION OF IMPACT STRENGTH USING
GENETIC ALGORITHM
Optimized value of impact strength is 0.4600628 MJ/m^2
Optimized factors in coded form are
A=1,B=0.998,C=1.
Optimized factors in uncoded form are
A=0.254mm,B=29.94,C=60 deg
FIGURE 10:RESIDUAL PLOT FOR IMPACT STRENGTH
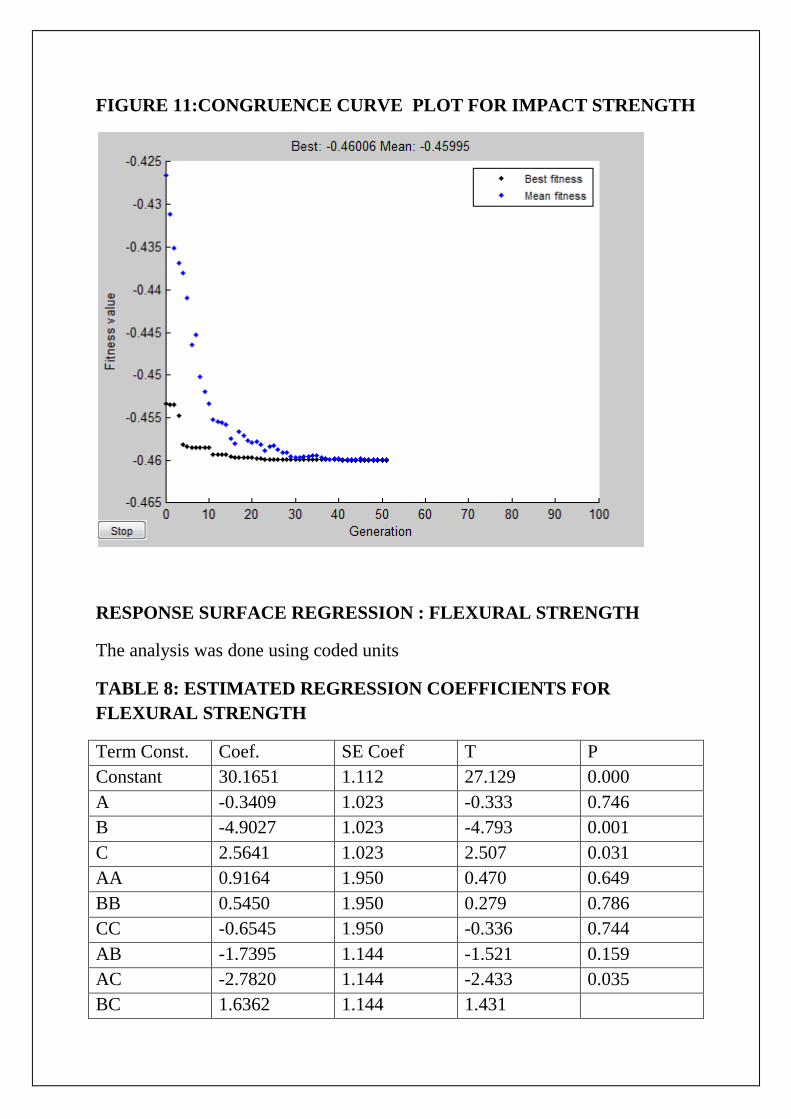
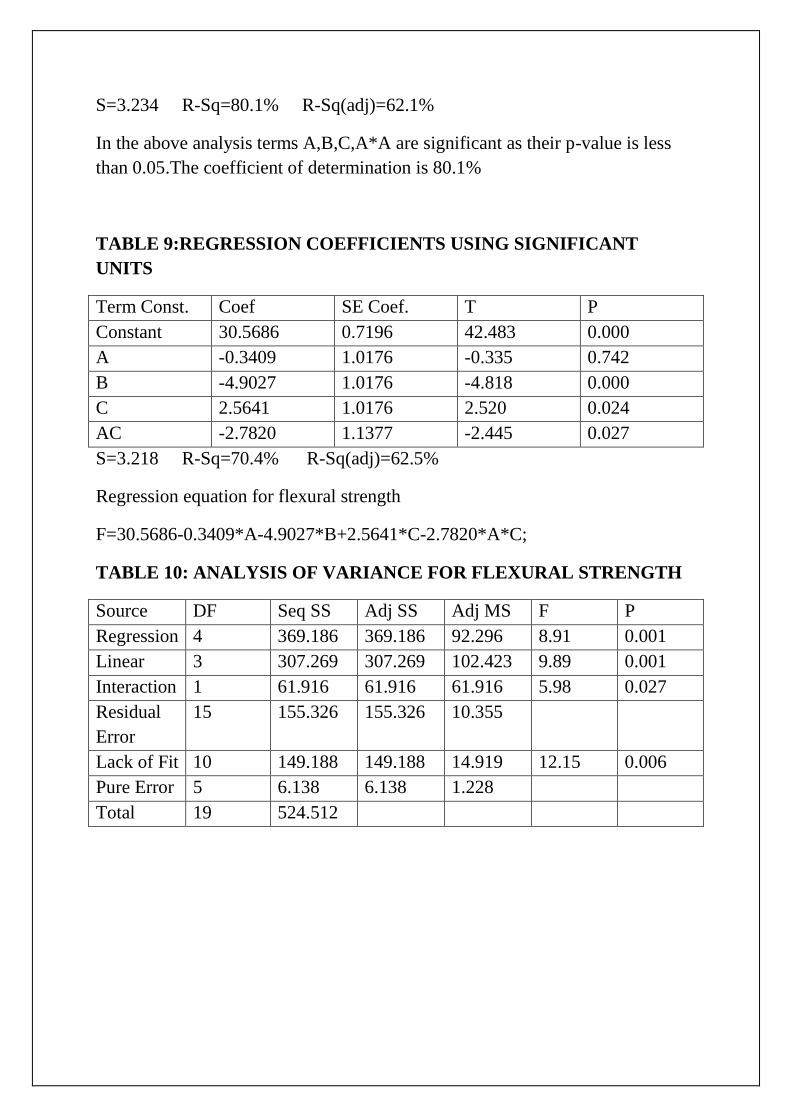
FIGURE 11:CONGRUENCE CURVE PLOT FOR IMPACT STRENGTH
RESPONSE SURFACE REGRESSION : FLEXURAL STRENGTH
The analysis was done using coded units
TABLE 8: ESTIMATED REGRESSION COEFFICIENTS FOR
FLEXURAL STRENGTH
Term Const. Coef. SE Coef T P
Constant 30.1651 1.112 27.129 0.000
A -0.3409 1.023 -0.333 0.746
B -4.9027 1.023 -4.793 0.001
C 2.5641 1.023 2.507 0.031
AA 0.9164 1.950 0.470 0.649
BB 0.5450 1.950 0.279 0.786
CC -0.6545 1.950 -0.336 0.744
AB -1.7395 1.144 -1.521 0.159
AC -2.7820 1.144 -2.433 0.035
BC 1.6362 1.144 1.431
S=3.234 R-Sq=80.1% R-Sq(adj)=62.1%
In the above analysis terms A,B,C,A*A are significant as their p-value is less
than 0.05.The coefficient of determination is 80.1%
TABLE 9:REGRESSION COEFFICIENTS USING SIGNIFICANT
UNITS
Term Const. Coef SE Coef. T P
Constant 30.5686 0.7196 42.483 0.000
A -0.3409 1.0176 -0.335 0.742
B -4.9027 1.0176 -4.818 0.000
C 2.5641 1.0176 2.520 0.024
AC -2.7820 1.1377 -2.445 0.027
S=3.218 R-Sq=70.4% R-Sq(adj)=62.5%
Regression equation for flexural strength
F=30.5686-0.3409*A-4.9027*B+2.5641*C-2.7820*A*C;
TABLE 10: ANALYSIS OF VARIANCE FOR FLEXURAL STRENGTH
Source DF Seq SS Adj SS Adj MS F P
Regression 4 369.186 369.186 92.296 8.91 0.001
Linear 3 307.269 307.269 102.423 9.89 0.001
Interaction 1 61.916 61.916 61.916 5.98 0.027
Residual
Error
15 155.326 155.326 10.355
Lack of Fit 10 149.188 149.188 14.919 12.15 0.006
Pure Error 5 6.138 6.138 1.228
Total 19 524.512
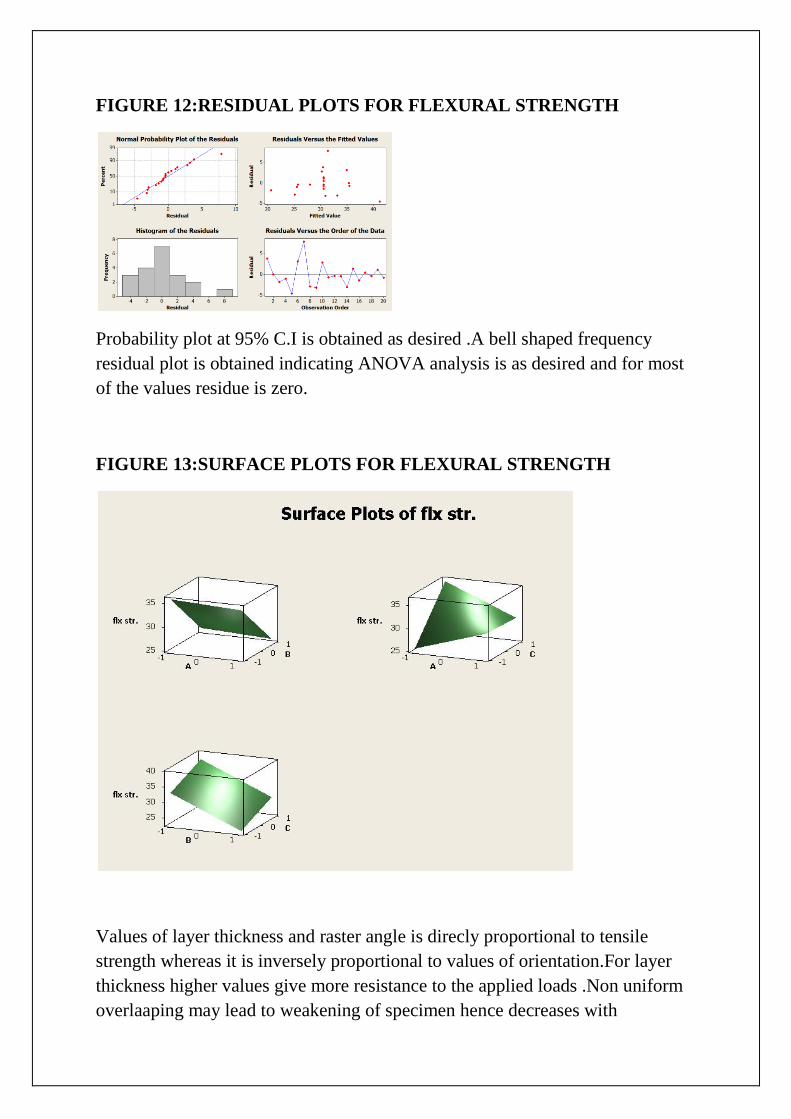
FIGURE 12:RESIDUAL PLOTS FOR FLEXURAL STRENGTH
Probability plot at 95% C.I is obtained as desired .A bell shaped frequency
residual plot is obtained indicating ANOVA analysis is as desired and for most
of the values residue is zero.
FIGURE 13:SURFACE PLOTS FOR FLEXURAL STRENGTH
Values of layer thickness and raster angle is direcly proportional to tensile
strength whereas it is inversely proportional to values of orientation.For layer
thickness higher values give more resistance to the applied loads .Non uniform
overlaaping may lead to weakening of specimen hence decreases with
orientation.At lower raster angles length of the individual raster is more and
inclination along the length of the specimen is also more resulting in increased
strength with increase in values of raster angle.
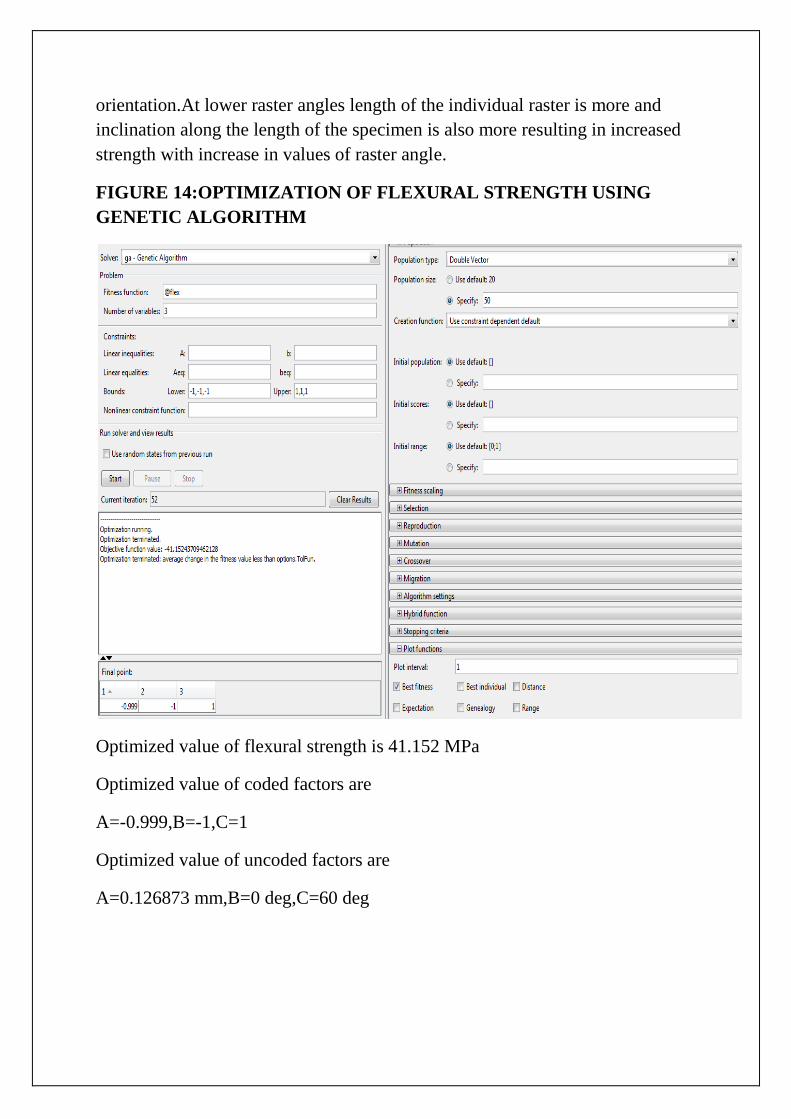
FIGURE 14:OPTIMIZATION OF FLEXURAL STRENGTH USING
GENETIC ALGORITHM
Optimized value of flexural strength is 41.152 MPa
Optimized value of coded factors are
A=-0.999,B=-1,C=1
Optimized value of uncoded factors are
A=0.126873 mm,B=0 deg,C=60 deg
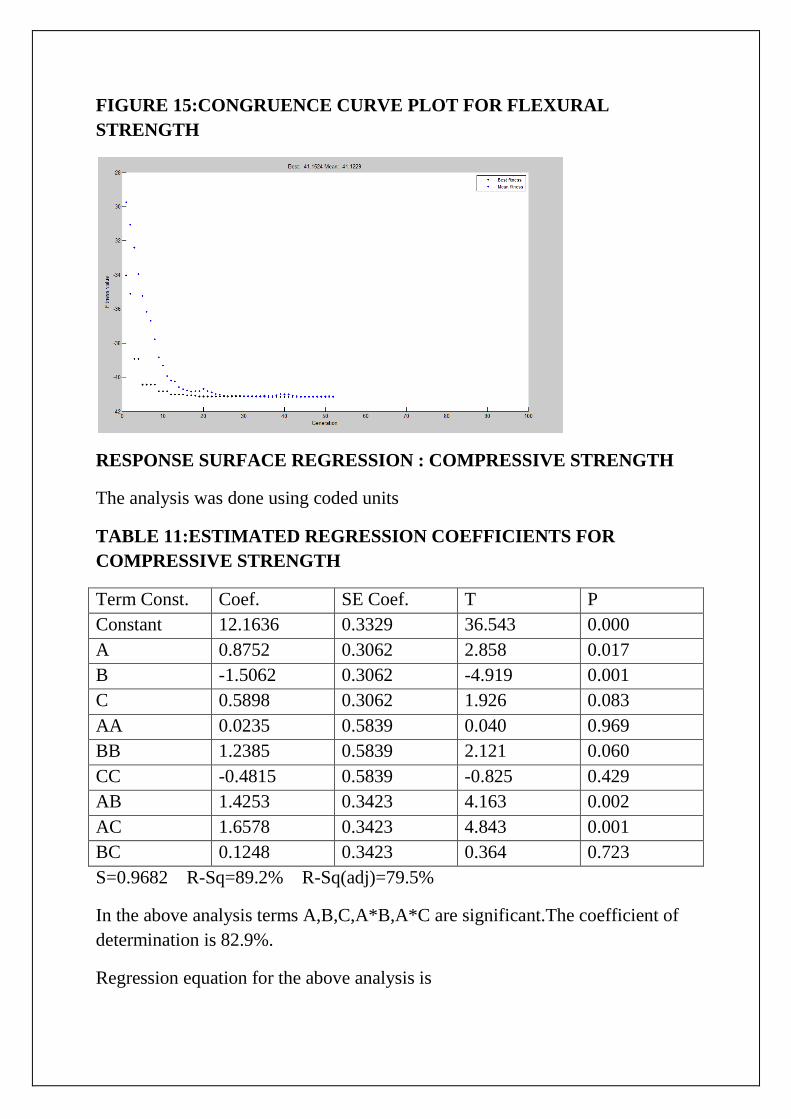
FIGURE 15:CONGRUENCE CURVE PLOT FOR FLEXURAL
STRENGTH
RESPONSE SURFACE REGRESSION : COMPRESSIVE STRENGTH
The analysis was done using coded units
TABLE 11:ESTIMATED REGRESSION COEFFICIENTS FOR
COMPRESSIVE STRENGTH
Term Const. Coef. SE Coef. T P
Constant 12.1636 0.3329 36.543 0.000
A 0.8752 0.3062 2.858 0.017
B -1.5062 0.3062 -4.919 0.001
C 0.5898 0.3062 1.926 0.083
AA 0.0235 0.5839 0.040 0.969
BB 1.2385 0.5839 2.121 0.060
CC -0.4815 0.5839 -0.825 0.429
AB 1.4253 0.3423 4.163 0.002
AC 1.6578 0.3423 4.843 0.001
BC 0.1248 0.3423 0.364 0.723
S=0.9682 R-Sq=89.2% R-Sq(adj)=79.5%
In the above analysis terms A,B,C,A*B,A*C are significant.The coefficient of
determination is 82.9%.
Regression equation for the above analysis is
C=12.5539+0.8752*A-1.5062*B+0.5898*C+1.4253*A*B+1.6578*A*C.
TABLE 12:REGRESSION COEFFICIENTS USING SIGNIFICANT
UNITS
Term Coef SE Coef T P
Constant 12.5539 0.2304 54.494 0.000
A 0.8752 0.3258 2.686 0.018
B -1.5062 0.3258 -4.623 0.000
C 0.5898 0.3258 1.810 0.092
AB 1.4253 0.3643 3.913 0.002
AC 1.6578 0.3643 4.551 0.000
S=1.030 R-Sq=82.9% R-Sq(adj)=76.8%
TABLE 13: ANALYSIS OF VARIANCE FOR COMPRESSIVE
STRENGTH
Source DF Seq SS Adj SS Adj MS F P
Regression 5 72.061 72.061 14.4121 13.58 0.000
Linear 3 33.825 33.825 11.2749 10.62 0.001
Interaction 2 38.236 38.236 19.1179 18.01 0.000
Residual
Error
14 14.860 14.860 1.0614
Lack of Fit 9 11.873 11.873 1.3192 2.21 0.198
Pure Error 5 2.987 2.987 0.5975
Total 19 86.921
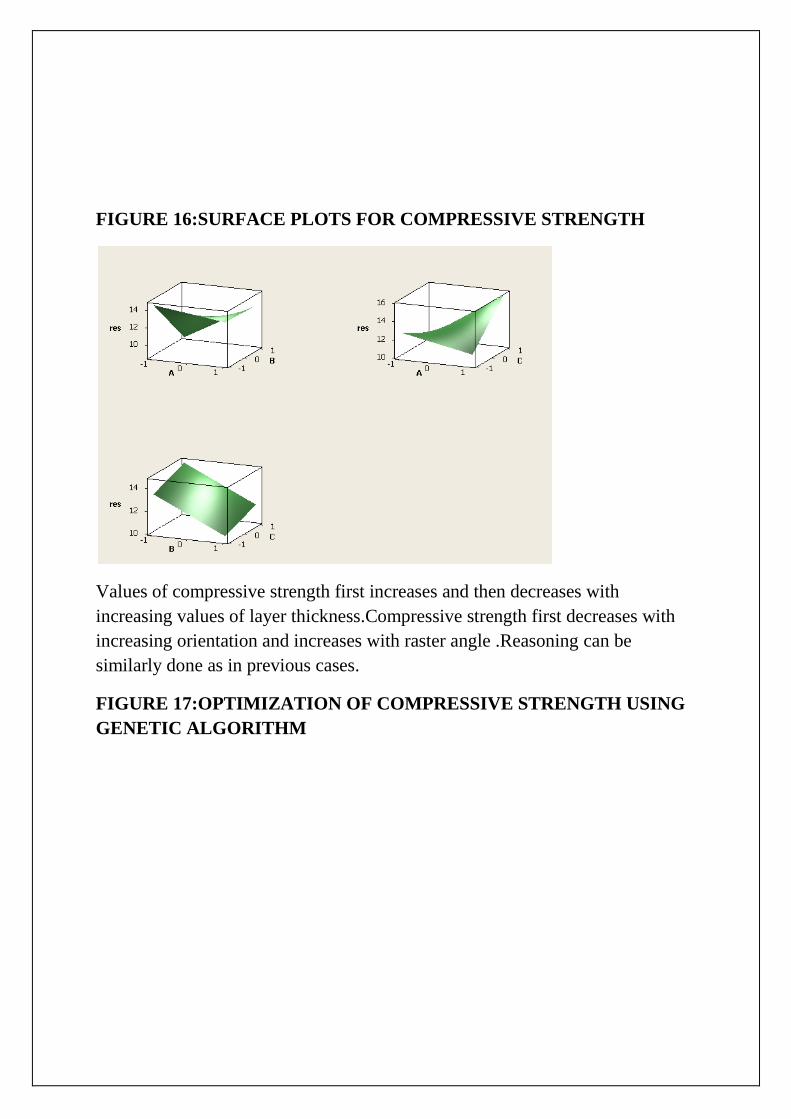
FIGURE 16:SURFACE PLOTS FOR COMPRESSIVE STRENGTH
Values of compressive strength first increases and then decreases with
increasing values of layer thickness.Compressive strength first decreases with
increasing orientation and increases with raster angle .Reasoning can be
similarly done as in previous cases.
FIGURE 17:OPTIMIZATION OF COMPRESSIVE STRENGTH USING
GENETIC ALGORITHM
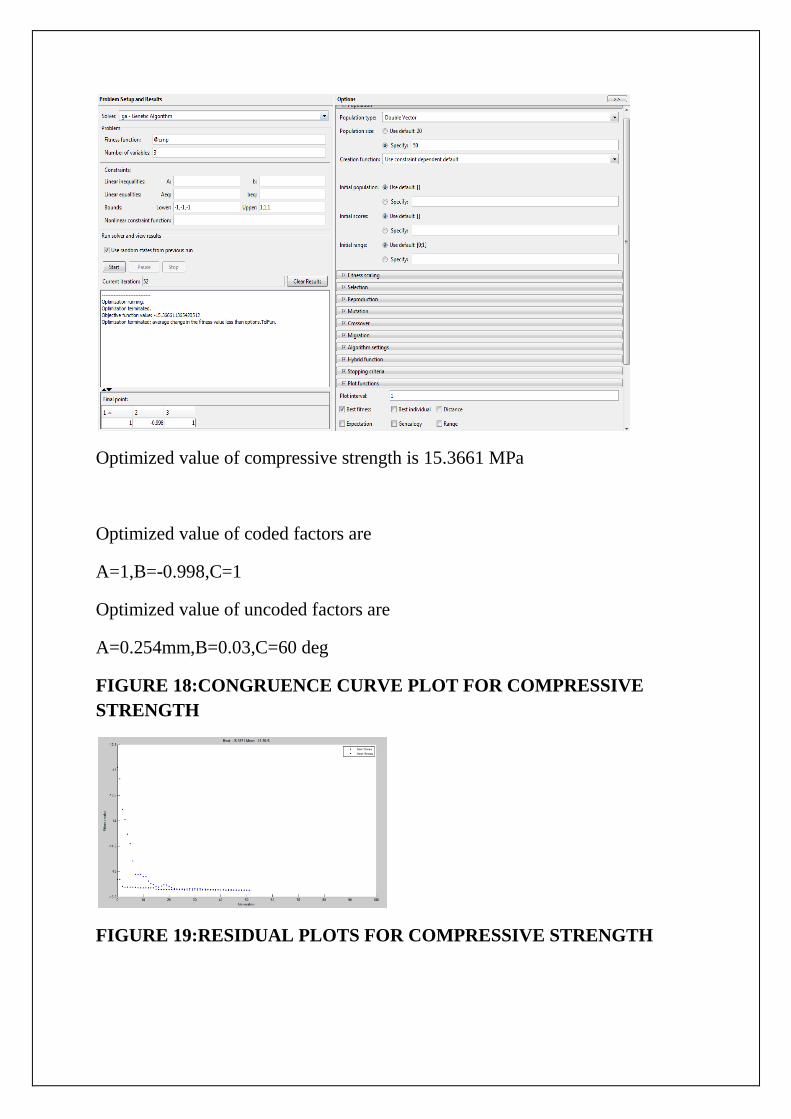
Optimized value of compressive strength is 15.3661 MPa
Optimized value of coded factors are
A=1,B=-0.998,C=1
Optimized value of uncoded factors are
A=0.254mm,B=0.03,C=60 deg
FIGURE 18:CONGRUENCE CURVE PLOT FOR COMPRESSIVE
STRENGTH
FIGURE 19:RESIDUAL PLOTS FOR COMPRESSIVE STRENGTH

A bell shaped curve is obtained for frequency residue plot indicating less
variation from actual values.Probability plot is obtained as per requirement.
CONCLUSION
CONCLUSION
Effect of three process parameters i.e. layer thickness , orientation, raster angle
is studied on four types of responses i.e. tensile strength, impact strength,
flexural strength, compressive strength . Design of experiment for doing the
experiments makes use of face central composite design (FCCD).Empirical
relationship between response and different process parameters is established
and its validity is checked using ANOVA analysis. Residual surface plots are
obtained using MINITAB R14 and it shows variability between actual response
and predicted response. Response surface plots are also obtained between
different parameters which gives an idea of behaviour of output on varying two
parameters simultaneously. It shows that output at any point depends on
value of different process parameters at that point. The weak strength of the
processed parts can be attributed to weak bonding between different layers.

REFERENCES
REFERENCES
1.Anitha R,Arunachalam S,Radhakrishnan P,(2001)”Critical parameters
influencing the quality of prototypes in fused deposition modelling”,Journal of
material science technologies,Vol 118pp(385-388).
2.Sood A.K,Ohdar R.K , and Mahapatra S.S ,(2009)”Improving dimensional
acuuracy of processed part using grey taguchi method”,Journal of materials and
design.Vol30(9),pp(4243-4252).
3.Pradhan M.K and Biswas C.K(2009)”Modelling and analysis of process
parameters on surface roughness in EDM of AISI D2 tool steel by RSM
approach”,International jounal of Engineering and Applied Science.5(1).
4.Upcraft Steve and Fletcher Richard(2003).The Rapid Protoyping
Technologies.The rapid prototyping journal,23(4):318-330.
5.Lee C.S. , Kim S.G.,Kim H.J.Ahn S.H.(2007)”Measurement of anisotropic
compressive strength of rapid prototyping parts”.Journal of material processing
technology,187-188,637-630.
6.Khan Z.A. ,Lee B.H,Abdullah J(2005)”Optimization odf rapid prototyping
parameters for production of flexible ABS object”,Journal of material
processing technology.169:54-61
7.BellehumeurC.T.,Gu P,SunQ,Rizvi G.M.(2008)”Effect of processing
conditions on bonding quality of FDM polymer filaments”,Rapid prototyping
jouranal,14(2),72-80.
8.Chattoraj N and Roy J.S.(2007),”Application of genetic algorithm to the
optimization of gain of magnetized ferrostrip microstrip antenna”,Engineering
letters,14:2.EL14_2_15(Advance online publication 2007)
Top Related