


Languages
Pages
Legal

ROADMAP FOR DEMOCRACY AND
SUSTAINABLE SOCIO-ECONOMIC
DEVELOPMENT
2010-2014
A Better Fiji for All
MINISTRY OF NATIONAL PLANNING
DECEMBER 2009

i
FOREWORD
I am pleased to present to the people of Fiji, Government‘s Roadmap for Democracy and
Sustainable Socio-Economic Development 2010-2014. The key foundation of the Roadmap is
the Peoples Charter for Change, Peace and Progress which was compiled through an
unprecedented nationwide consultation process and endorsed by His Excellency the President in
December 2008 for implementation. The Roadmap outlines in more detail Government‘s agenda
from now until 2014 as captured in my address on the Strategic Framework for Change delivered
on 1st July 2009.
Carrying the theme of ‗A Better Fiji for All‘, the Roadmap brings together in a holistic manner,
the range of reforms and sectoral policy mix that are needed to successfully deliver on the
mandate handed down by His Excellency the President in 2007. The Roadmap is the outcome of
extensive consultations with the private sector, civil society and within the public sector, and
takes on board current political, social and economic developments, both on the domestic and
international fronts.
The mandate of my Government is to ensure that true democratic, non-communal, equal suffrage
based elections for parliamentary representation are held by September 2014. Prior to the
elections the formulation of a new Constitution, one which is fair and just and provides a solid
foundation and framework for the rebuilding of our nation is critical for Fiji. To ensure
ownership of the Constitution by the citizens of Fiji, a participatory process will be undertaken,
involving the political parties, private sector, civil society, non-government organizations, and
citizens of Fiji.
A number of reforms will be implemented under the Roadmap. These include electoral and
parliamentary reforms, public service reforms, land reforms, and reforms in the education and
health sectors. Successful implementation of these reforms is necessary to give reality to the
mandate of His Excellency the President and the objectives of the Peoples Charter.
Higher economic growth is critical to achieve the objectives set out in the Roadmap, to create
more income earning opportunities and lift more people out of poverty. More concerted focus
will be placed on boosting our export sector as well as promoting the use of local produce as
substitutes to imports. These goals are not new and my Government recognizes that they must be

ii
earned through hard work, sacrifice and political will in order to produce the prosperity which is
essential to building better lives for all of the people of Fiji.
Government will continue to improve the environment for private sector investment. Major
reforms will include revamping laws such as those that affect town and country planning, land
development process and approvals. Government will expand its capital investment programme,
including through projects funded by bilateral and multi lateral development partners.
Achieving the vision of the Roadmap will require the collective effort of every citizen. For far
too long, Fiji‘s people and our leaders have been focused on their sectoral interests rather than
the interest of the nation. For far too long, we have allowed our cultural, religious and ethnic
differences to cause division among the community.
The overwhelming nation wide support received for the Peoples Charter in 2008 is testimony of
the ordinary grassroot citizens support for real changes in the way Fiji has been governed. To
ignore such an overwhelming voice for the sake of convening elections would be grossly
irresponsible and not in the spirit of good governance. The Roadmap sets out the framework to
achieve sustainable democracy, good and just governance, socio-economic prosperity and
national unity.
I call on the international community to respect Fiji‘s sovereignty and the path that we have
chosen as contained in this Roadmap. I look forward to future engagement with the international
community based on the priorities that Government has set out in the Roadmap.
I call on the support of each citizen of Fiji to apply themselves more positively and productively
in whatever area they are involved in to better their lives.
My Government is committed to delivering on each goal set out in the Roadmap and it is only
through our collective efforts can we build Fiji into a peaceful, multiracial and prosperous home
for which we can all be proud.
I take this opportunity to thank all those who have contributed in the preparation of this
important document, and I look forward to your continued support in its implementation.
Commodore Josaia Voreqe Bainimarama
Prime Minister and Minister for Public Service, Peoples Charter for Change, Information, Sugar,
Finance, National Planning, Indigenous and Multi Ethnic Affairs and Provincial Development

iii
Abbreviations
ADB Asian Development Bank
ADR Alternative Dispute Resolution
ALP Alternative Livelihood Project
ALTA Agricultural Landlord and Tenant Act
AMA Agriculture Marketing Authority
ASA Air Services Agreement
BFHI Baby Friendly Hospital Initiatives
BNPL Basic Needs Poverty Line
BQA Bilateral Quarantine Agreement
CAAFI Civil Aviation Authority of the Fiji Islands
CFB Customary Fisheries Bill
CFC Chlorofluorocarbons
CHARM Comprehensive Hazard and Risk Management
CID Criminal Investigations Division
CIDA Coconut Industry Development Authority
CITES
Convention on International Trade in Endangered Species of Wild
Fauna and Flora
CMDA Capital Markets Development Authority
CO2 Carbon Dioxide
COIFS Commission of Inquiry into Financial Services
CSO Civil Society Organisations
DNR Department of National Roads
DPP Director of Public Prosecutions
EEO Equal Employment Opportunity
EEZ Exclusive Economic Zone
EFF Export Finance Facility
EGM Emperor Gold Mining Company Limited
EIA Environmental Impact Assessment
EMA Environment Management Act
ERP Employment Relations Promulgation 2007
EU European Union
FASANOC Fiji Association of Sports and National Olympic Committee
FDB Fiji Development Bank
FDI Foreign Direct Investment
FEA Fiji Electricity Authority
FHCL Fiji Hardwood Corporation Limited
FIC Forum Island Country
FICL Fiji Investment Corporation Limited
FIMSA Fiji Islands Maritime Safety Administration

iv
FIRCA Fiji Islands Revenue and Customs Authority
FIT Fiji Institute of Technology
FIU Financial Intelligence Unit
FMF Flour Mills of Fiji
FNPF Fiji National Provident Fund
FOI Freedom of Information
FSAP Financial Sector Assessment Programme
FSC Fiji Sugar Corporation
FSFE Fiji Seventh Form Examination
FSLC Fiji School Leaving Certificate
FSMed Fiji School of Medicine
FSN Fiji School of Nursing
FTIB Fiji Islands Trade and Investment Bureau
FTR Financial Transactions Reporting
GDP Gross Domestic Product
GEM Gender Empowerment Measure
GWh Giga Watts per hour
HA Housing Authority
HACCP Hazard Analysis and Critical Control Point
HART Housing Assistance Relief Trust
HASAWA Health and Safety at Work Act 1996
HIES Household Income & Expenditure Survey
HRIS Human Resource Management Information System
ICAO International Civil Aviation Organization
ICT Information & Communication Technology
IHR International Health Regulation
IHRDPEP Integrated Human Resource Development Programme for
Employment Promotion
ILO International Labour Organization
IMCI Integrated Management of Childhood Illnesses
IPP Independent Power Producers
IRB International Rugby Board
ISO International Organisation for Standardisation
ISPS International Ships and Ports Facility Security
IT Information Technology
ITC Information Technology & Computing
KM Kilometers
KPI Key Performance Indicator
LNG Liquefied Natural Gas
LPG Liquefied Petroleum Gas
LTA Land Transport Authority

v
MoA Ministry of Agriculture
MDG Millennium Development Goal
MFI Micro-finance Institutions
MLA Mutual Legal Assistance
MoE Ministry of Environment
MoH Ministry of Health
MPA Marine Protected Areas
MSME Micro, Small and Medium Enterprises
MT metric tonnes
NAS National Adaptation Strategy
NCCC National Coordinating Committee on Children
NCD Non Communicable Diseases
NCSMED National Center for Small & Micro Enterprise Development
NEC National Environment Council
NEP National Energy Policy
NGO Non Governmental Organizations
NLTB
NPCC
Native Lands Trust Board
National Peoples Charter Council
NRSC National Road Safety Council
NSFC National Sports Funding Commission
NSP National Sports Policy
NZ New Zealand
ODS Ozone Depleting Substances
PACER Pacific Agreement on Closer Economic Relations
PALP Pacific Anti-Money Laundering Programme
PDCs Provincial Development Committees
PIB Prices and Incomes Board
PICTA Pacific Island Countries Trade Agreement
PMTCT Prevention of Maternal To Child Transmission
PPP Public Private Partnership
PRB Public Rental Board
PSIP Public Sector Investment Programme
RBF Reserve Bank of Fiji
RFMF Republic of Fiji Military Forces
ROI Rural and Outer Island
RTGS Real Time Gross Settlement
SCARF Seed Capital Revolving Fund
SCGC Sugar Cane Growers Council
SME Small and Medium Enterprise
SMME Small, Medium and Micro Enterprises
SOPAC South Pacific Applied Geo-science Commission

vi
SPARTECA South Pacific Regional Trade and Economic Cooperation
Agreement
SRU Squatter Resettlement Unit
TAC Total Allowable Catch
TCF Textile, Clothing and Footwear
TCTS Tonnes of Cane per Ton of Sugar
TPAF Training & Productivity Authority of Fiji
TVET Technical and Vocational Education and Training
UGMP Urban Growth Management Plan
UN United Nations
UNCEDAW United Nation Convention on the Elimination of All Forms of
Discrimination Against Women
UNCRC United Nations Convention of the Rights of the Children
UNDP United Nations Development Programme
UPAP Urban Policy Action Plan
USP University of the South Pacific
VCCT Voluntary Counselling and Confidential Testing
WHO World Health Organization
WOSED Women's Socio-Economic Development
WSSD World Summit on Sustainable Development
WTO World Trade Organisation

vii
Executive Summary
The Roadmap for Democracy and Sustainable Socio-economic Development (RDSSED) 2010-
2014 sets out a strategic framework to achieve sustainable democracy, good and just governance,
socio-economic development and national unity. The key foundation of the Roadmap is the
Peoples Charter for Change Peace and Progress (PCCPP) which was compiled through an
unprecedented nationwide consultation process, involving a wide range of stakeholders. The
Roadmap is logically aligned to the mandate handed down by His Excellency, the President in
2007, as well as to the Strategic Framework for Change announced by the Prime Minister on 1st
July 2009.
In order to ensure an inclusive approach, ownership and successful implementation, the
Roadmap has been compiled in consultation with private sector, civil society and government to
take on board the current political, social and economic situation, both on the international and
domestic fronts.
The vision of the Roadmap together with the Mission and Guiding Principles are described in
Chapter 1. Chapter two reviews governance issues and challenges and sets out the policies,
strategies and key performance indicators. Similarly, reviews and policies, strategies and key
performance indicators for economic and socio-cultural development are addressed in Chapters 3
and 4 respectively. Chapter 5 outlines the implementation and monitoring framework.
Vision, Mission and Guiding Principles
The objective of the Roadmap is to implement policies to achieve the Vision of “A Better Fiji
for All” which is consistent with the Peoples Charter. To achieve this vision, the overarching
objective is to rebuild Fiji into a non-racial, culturally vibrant and united, well governed, truly
democratic nation that seeks progress and prosperity through merit-based equality of opportunity
and peace.
Strategic Policy Direction
The medium term strategic focus of the Roadmap is to strengthen good and just governance,
raise economic growth and improve socio-cultural development. Under good governance, the
key strategic priorities include formulation of a new constitution, electoral reforms,
strengthening law and justice, ensuring effective, enlightened and accountable leadership,
enhancing public sector efficiency, effectiveness and service delivery, developing an integrated
development structure at divisional level. The key strategic priorities for economic development
include maintaining macroeconomic stability, export promotion, import substitution, raising
investment levels, making more land available for productive and social purposes, enhancing
global integration and international relations. The focus under social development will be on
reducing poverty to a negligible level, making Fiji a knowledge based society, improving health
service delivery and developing a common national identity and building social cohesion.

viii
Strengthening Good Governance
Fiji needs to entrench a culture of democratic good governance such that it becomes the
dominant political thinking and behaviour of the people of Fiji. Principles of good governance
need to be applied to both the formal governance framework, to the institutions within it, and to
how the country is governed on a daily basis in terms of policy formulation and decision making.
The United Nations Economic and Social Commission for Asia and the Pacific (ESCAP), and
several other UN bodies, describe good governance as having eight major characteristics. It is
participatory, consensus oriented, accountable, transparent, responsive, effective and efficient,
equitable and inclusive, and follows the rule of law. It assures that corruption is minimised; the
views of minorities are taken into account; and that the voices of the most vulnerable in society
are heard in decision-making. It is also responsive to the present and future needs of society.
A major short term priority of Government is to formulate a new Constitution. Following the
appeals court ruling, His Excellency the President abrogated Fiji‘s Constitution on 10 April
2009. In order to maintain continuity in the implementation of the mandate handed down to the
Government in January 2007 for an equal, just and fair Fiji, His Excellency reappointed the
Interim Government. The State is now re-established under Presidential Decrees, which
continues to respect the independence of the judiciary and accountability institutions and the
operation of other key arms of the State.
Fiji‘s single member (majority) electoral system, which has been in place since Independence,
has always provided for communal representation. Besides the excessive use of communal or
reserved representation in violation of basic human rights principles, this electoral and voting
system is unfair due to the:
lack of equal suffrage given the disproportional number of voters between single member
constituencies;
use of preferences producing results that do not accurately reflect the will of the people,
as evidenced by the lack of representation for certain political parties who have received
a fair proportion of first preference votes;
communal voting and representation using a single member constituency or
majority/plurality electoral system has also made it impossible to encourage a move away
from race-based politics as political parties only need to appeal to specific ethnic interests
to secure seats; and
the complexity of the current system requires a high level of literacy, which has led to an
unusually high proportion of invalid votes (9% in 1999, 12% in 2001, and 9% in 2006).
The accountability framework comprises the institutions and processes that exist to ensure open
and transparent Government. It involves the operations of many state institutions namely,
Parliament, through its committee system and other processes, and independent institutions like
the Auditor-General, Fiji Human Rights Commission (FHRC) and the Fiji Independent
Commission Against Corruption (FICAC). A key function of many of these institutions is to
hold Government to account for their actions; a necessary step in maintaining public confidence
in the governance system.

ix
The effectiveness of Government‘s internal processes to ensure enforcement of the public service
code of conduct and compliance with financial rules and regulations is another key component of
the accountability framework. It also requires commitment to allowing the public to access
public information and independent enforcement of conduct standards for holders of high public
office. A free and independent media and the work of non-government and civil society
organisations are also a vital part of the accountability framework.
Public perception is that there is little or no accountability for public officials, from holders of
high public office to ordinary civil servants, who behave improperly. In the absence of
accountability, people are unable to ensure that their Government acts wisely, lawfully and fairly
in serving the national interest. Accountability issues are continually raised in the Annual Audit
Reports of the Auditor-General on the public accounts of the State and Local Government bodies
and by the media.
Fiji‘s national security concerns encompass a broad range of areas including protecting the
country‘s sovereignty from attack, ending the cycle of coups and maintaining law and order. It
also encompasses Fiji‘s interests in protecting its tourism industry or offshore environment;
border security; protective security; emergency management and effective coordination of
disaster relief. Essentially the functions of security agencies are interlinked. Effectively
addressing these areas provides the platform for peace and stability that is vital for socio-
economic growth and national development.
The effectiveness of the Law and Justice Sector in part depends on the ability of the different
institutions to operate together in a coherent, coordinated and mutually supportive way. In a
technical sense, the Law and Justice Sector is operating reasonably well. In many areas of the
legal system where significant problems existed a few years ago, progress has been or is being
made. The Australia/Fiji Law and Justice Programme was starting to achieve modest successes
in improving the operation of different institutions in the sector, including smoothing out the
operation of the criminal justice system and overcoming delays in prosecutions, reduce case back
logs; improve the treatment of juvenile offenders; to expand access to legal aid; and to establish a
Family Court and associated counselling service, and community policing.
The Public Service remains the key institution for the implementation of Government‘s visions
and policies including its plans and programmes. Its performance, professionalism, productivity,
accountability, cost and commitment has been heavily criticised in recent years. The current consensus
is thus that Public Sector Reform matters a great deal for national development, and in at least
two ways: first, it will lead to better delivery of the basic public services that affect the living
standards of the poor; and second, it will create a climate conducive to private sector
development.
Coordination of all development efforts at the local level remains fragmented and ineffective
resulting in duplication and wastage. Enhancement of development cooperation will directly
contribute to rural development and revitalization of economic activities resulting in growth, and
limiting rural-urban drift.
x
Formulating a
New Constitution
Electoral and
Parliamentary
Reforms
Addressing the issue of leadership is of great importance to the future of the country. At all
levels, the type of leadership in Fiji is seen as a contributing factor to many of the country‘s
problems. Leadership at the national level has always been a subject of debate. One point of
view is that the style of political leadership in Fiji has, and continues to be, dominated by ethnic
issues solely focused on protecting the interests of one‘s own ethnic community. The need for
Fiji‘s leaders to display selflessness is a major challenge – that is, to lead for the common good
and not through self-interest.
Strategic Priorities for Good Governance
The formulation of a new Constitution, one which is fair and just and provides
a solid foundation and framework for the rebuilding of our nation in accord
with the vision and principles of the Peoples Charter, is critical for Fiji. To
ensure ownership of the Constitution, a participatory process will be undertaken, involving the
political parties, civil society, non-government organizations, and citizens of Fiji. The new
Constitution will recognise the basic constitutional principles, which have existed in Fiji since
independence such as sovereignty, parliamentary democracy, the separation of powers and the
protection of basic human rights under a Bill of Rights and supremacy of the rule of law.
Government will also ensure that the underlying principles of the Peoples Charter in particular
the principle of equal opportunity and equality under the law for all citizens regardless of race,
gender or circumstance in all areas of Government and society are also recognised. To ensure
public confidence the new Constitution will include major reforms under the Peoples Charter
including:
i. adoption of an Open List Proportional Representation electoral and voting system;
ii. adoption of the common name ―Fijian‖ for all citizens and to change the official name of
the country to ―Fiji‖;
iii. enhancing and clarifying the role of the military and the country‘s national security
framework;
iv. stronger protections for the application of the Bill of Rights such as adoption of CEDAW
definitions for discrimination against women and the girl-child; and
v. proposals to strengthen the operation of state services and the accountability framework.
Our electoral process will be reviewed to promote racial tolerance and unity and eliminate
ethnic-based politics, a serious impediment to national development. Necessary steps will be
taken to formulate the appropriate constitutional and legal framework to facilitate
the adoption of the country‘s electoral and parliamentary system under the new
Constitution in 2012. Further ancillary issues to be addressed include: the size and
composition of Parliament; compulsory voting; the voting age; eligibility of
candidates; residency restrictions on the right to vote; electoral rules and
regulations to ensure a free and fair general election; and strengthening the capacity of electoral
administration bodies.
Government‘s commitment to the maintenance of law and order will
continue. Measures will be implemented to strengthen the independence and Strengthening
Law and Justice
xi
accountability of the judiciary. This involves the adoption and enforcement of conduct standards
for judges, magistrates and other judicial officers will be carried out in accordance with the
Administration of Justice Decree 2009. The police force shall be strengthened with upgrading of
communications, transport and forensic tools. Government recognizes that policing is important
to also instill public and investor confidence. As part of the reforms the archaic Penal Code shall
also be revamped.
Accountable and transparent process of government as the hallmark of
effective sustainable democratic governance will be a goal that Fiji will aspire
to achieve in the medium and long term. It is, therefore, imperative that
relevant governance systems, structures and institutions are strengthened
whilst at the same time ensuring the maintenance of law and order. This will
be addressed through the provision of adequate resources and capacity building initiatives to
ensure the effectiveness of the various governance frameworks. Freedom of Information
legislation will be decreed to enhance transparency and wider access to the public of government
information.
Effective and visionary leadership is critical for Fiji. We need leaders with
progressive vision that is uplifting, motivating, inspiring and most
importantly unifying. Leadership training and development at all levels will
be a priority so that good leadership is realized sooner than later. Women
and youth leadership will also be strengthened. Conduct of public leaders
including parliamentarians and other category of leaders will be addressed
through the enforcement of Code of Conduct legislation. Leadership models with clearly defined
legitimate roles of elected and non-elected leaders will also be developed and implemented. The
active promotion of sound values and ethics, including honesty, fair play, respect, dedication to
cause, and the need to work hard to earn a living, particularly in young people will assist to build
integrity among the future generation of leaders.
As a result of the reform programmes, the public service must
become efficient and effective in both capacity and performance in
the 21st Century in order to meet the needs of the people in the most
cost effective way. It will instill a new performance and service-
oriented culture – one that values high productivity, smarter and effective work systems and
enforces merit based appointments. It will be lean and accountable to those that it serves. The
well being and good governance of the indigenous population will be addressed through the
implementation of good governance practices in indigenous institutions.
Integration of i-taukei development interests into national development
plans and programmes, and the devolution of decision making powers
to the divisional levels will be pursued. Partnerships with Non
Government and Community Based Organizations (CBOs) will be
strengthened to complement Government‘s outreach programmes and projects. These are critical
to ensure local participation and to improve delivery of development programmes to raise living
standards of people in the rural areas. This will assist communities in identifying resources and
Ensuring Effective,
Enlightened and
Accountable
Leadership
Enhancing Public Sector
Efficiency, Effectiveness
and Service Delivery
Developing an Integrated
Development Structure at
Divisional Level
Strengthening
Accountability and
Transparency

xii
formulate community development plans directed at income generating skills and initiatives that
maximize the returns from available resources.
Economic Development
The world economy has performed relatively well between 2001 and 2007 with exceptional
performance from emerging markets such as Russia, China and India for some time. However,
since the second half of 2008, the global economy started slowing down which eventually led to
a recession towards the end of the year, spilling over to 2009.
Economic activity in Fiji has remained relatively weak since 2001 averaging only 1.5 percent
growth until 2008. The sluggish growth in recent history has largely been a result of
underperforming exports, recent declining trend of remittances, lower tourism receipts, reduced
investment levels and increasing imports which have affected Fiji‘s foreign reserve and balance
of payments position.
The financial and economic recession experienced worldwide compounded by the high
occurrence of natural disasters, including the flash floods in early 2009. Our vulnerability to
these situations adversely affected Fiji‘s economy causing below par performance. A contraction
of 2.5 percent is expected in 2009 with modest recovery projected for the medium term.
The Reserve Bank devalued Fiji‘s currency in April 2009 to protect the foreign reserve position
and improve the competitiveness of our exports and services, particularly tourism. In addition,
it was to encourage use of local goods to substitute foreign produce which would have become
expensive. The Reserve Bank also made interest rate policy announcements on the weighted
average interest rate and interest rate spreads for commercial banks. Subsequently, commercial
banks lending and interest rates have started to fall, deposit rates have risen and banking system
liquidity, that is, the amount of money available for banks to lend, has increased considerably
from very low levels early in the year. This itself will see credit conditions easing up further in
the coming months and will assist greatly in businesses being able to borrow additional amounts
to grow their businesses and to start new projects.
In the tourism industry, visitor arrivals are recovering. Tourist numbers are expected to improve
in coming months assisted by the devaluation of the Fijian dollar and strong marketing which
have made Fiji a competitive destination. Exports of gold and fish have increased. However,
performances of other industries, such as garments, timber and mineral water have been affected
by the weak demand from our trading partner economies.
Investment which is around 15 percent of GDP is expected to rise with the recent investments by
Government and public enterprises such as the Fiji Electricity Authority and the Housing
Authority. Government has given increased priority to the implementation of its capital
programme for the year, in addition to meeting the flood rehabilitation demands. The Reserve
Bank has made allowances for priority sector lending, as well as for export finance. The Bank
has also established a Flood Rehabilitation Facility to assist businesses recover from the effects
of the floods.

xiii
The planned infrastructure upgrading through the EXIM Bank China, EXIM Bank Malaysia and
Asian Development Bank will further boost investment. Greater infrastructural support from
Government and restructuring of the public sector, which essentially transfers assets and business
opportunities to private sector, will also induce higher levels of private investment.
Exports have been less that $1 billion; however, imports in recent years have exceeded $3 billion
resulting in trade deficits in excess of $2 billion. Imports have been rising continuously, mainly
due to Fiji‘s low production based and exacerbated by the growing demand from the tourism
industry as well as rising food and fuel prices.
Foreign reserves have steadily risen to more than $1 billion (as at 18 November 2009), from
around $440 million before the devaluation. However, the foreign reserves position must be
improved to meet the medium term target of 3-5 months of import cover.
As a result of the devaluation, an increase in the inflation rate is expected in the coming months,
with the year-end inflation forecast at 9.5 percent. However, prices are expected to start easing
after April next year, towards an inflation of around 2 percent by the end of 2010.
The key macroeconomic issues that need to be addressed include maintaining macroeconomic
stability; increasing exports, raising domestic production, raising foreign and domestic
investment; and making more land available for social and economic development.
Strategic Priorities for Economic Development
The major priority for the medium term is to maintain prudent monetary and
fiscal management in order to protect exchange reserves, reduce inflation to low
levels, and ensure sustainable fiscal deficits and debt levels. The medium-term
objective of Government is consolidating fiscal policy, increasing export
earnings and minimizing imports to reduce the widening trade account deficits
of the balance of payments.
Export promotion will be targeted through the implementation of the National
Export Strategy together with support for natural resource based industries.
Also critical is the implementation of the sugar industry reforms including co-generation and the
establishment of the bio-fuel industry. Import substitution strategies, including local value
addition, will be supported to increase self sufficiency, increase food security and reduce
imports.
Government will ensure greater cohesion and effective implementation of
import substitution programmes to increase self reliance and reduce imports.
The demand driven approach both for export and import substitution commodities will involve
commercialization and strengthening industry organizations and agri-business networks,
promotion of young farmer training, recognition of industry priorities by Government and the
provision of support to medium sized entrepreneurs and exporters with existing market
protocols.
Export Promotion
Maintaining
Macroeconomic
Stability
Import Substitution

xiv
Although investment has risen in recent years, it remains below the average
of 20% of GDP for developing countries and below the Roadmap target of
25% of GDP. Of particular concern has been the low rate of private sector
investment. Major reforms will include revamping laws such as those that affect town and
country planning, land development process and approvals. Government will raise its capital
programme for the year, including those projects funded through the bilateral and multi lateral
development partners.
The key issue regarding land in Fiji is one of access and improving
utilization and not ownership. Land is in abundance in Fiji, and
ownership rights are well defined. What is lacking is a mutually
beneficial system that encourages the leasing of land for all purposes, sets
incentives to ensure productive utilization of the land, and ensures
equitable returns for both tenants in the use of the land and landowners in the leasing of their
land. Enduring solutions on the issue of access to land for productive economic and social
purposes will be developed. Major land reform will be pursued through a genuine consultative
process with all stakeholders. Critical will be the need to ensure that the interests of landowners
and tenants are addressed in a holistic and equitable manner. Land reforms will not compromise
the interests of the landowners.
Fiji recognizes that it must reassert itself to regain its rightful place
in the regional and international family of nations. Improved
foreign and international relations are essential for achieving this.
Our representations overseas will be strengthened to ensure that Fiji‘s vision and aspirations is
well understood by our trading and development partners. Enhanced global and regional
integration and partnerships will result in increased trade and cooperation including technical
assistance and aid for trade. Bilateral, regional and multilateral arrangements will be actively
pursued with our development and trading partners. Fiji will strengthen its investment and trade
facilitation through enhanced negotiation capacity and improved trade infrastructure.
Socio-Cultural Development
Most of the social indicators have worsened in Fiji over the past three decades. These include the
Human Development Index (HDI) and the Millennium Development Goals (MDGs) in relation
to the proportion of the people living in poverty, maternal and child mortality rates.
The HDI is a widely accepted measure of a country‘s progress in attaining satisfactory levels of
education, health and income. Fiji‘s ranking was 42nd
in 1975 but dropped to 61st in 1997. Its
position further eroded in the late 1990s. Based on the 2007/08 UNDP Human Development
Index, Fiji currently is placed 92nd
out of 177. Samoa and Tonga — which had rankings similar
to those of Fiji in the 1970s — have performed much better than Fiji in recent years, with
rankings of 77th
and 55th
in 2007/08 respectively.
The MDGs and their associated targets and indicators, which were endorsed by 189 countries
including Fiji in the 2000 Millennium Summit, provide a recognised set of indicators that can be
used to judge the key elements of social progress.
Making More Land
Available for Productive
and Social Purposes
Enhancing Global Integration
and International Relations
Raising Investment
Levels

xv
Income redistribution is the most difficult challenge facing Fiji and its people and the greatest
obstacle to pursuit of sustainable socio-economic growth. On the basis of the 2002/03 Household
Income Expenditure Survey (HIES), 34.4% of the population lived below the Basic Needs
Poverty Line (BNPL), indicating a 5% increase from the 1990-91 HIES. The poverty gap was
estimated to have been $2,616.64 per year for an average household. Fiji remains a society with
deep income inequalities. The 2002-03 HIES shows that the poorest 20% of the household
received 5.9% of the national income while the top 20% of the households received 47.9% of the
national income. Results of the 2008-09 HIES, which will be available by the end of 2009, will
provide vital information on the poverty situation in the countries.
The key issues inhibiting poverty reduction include a lack of political commitment; political
instability (weak governance); insufficient access to economic assets, markets and social
services; ineffective coordination, implementation, and monitoring; lack of participation by all
stakeholders vis-à-vis Government, the private sector and civil society; absence of sustainability
mechanisms in programmes and projects; and lack of involvement of beneficiaries in project
design, implementation, monitoring, and evaluation.
Access to basic education is a right of all Fijians. Education, up till secondary level, is well
established in Fiji with ownership and management of schools being in partnership between state
and community. The 2004/2005 Employment and Unemployment Survey revealed that 90% of
the persons aged 5 to 14 were attending school, with the proportion a slightly higher (92%) for
Indo-Fijians compared to 89% for Fijians.
The large number of students dropping out early from school is a critical problem since it is one
of the major contributing factors to the growing incidence of poverty. In turn, poverty impacts
so adversely on the socio-economic development of this country. With limited skills and
knowledge to improve their livelihoods, early school leavers make up a large number of the
unemployed and subsequently they contribute disproportionately to the rising tide of crime and
violence occurring in most urban centres.
Health continues to be a growing and increasingly complex field of competing priorities from all
perspectives – from the individuals to governments, businesses, health professionals and the
health services system. A healthy and productive population is a key for sustainable economic
development. Despite consuming a major portion of governments budget (>3% of GDP and 9%
of total budget), health care funding continues to be lower as compared to other countries in the
region.
The key development constraints and challenges in the health sector include: efficient and
effective use of resources in health service delivery; responding to the increasing numbers of
HIV/AIDS and STIs cases; reversing the deteriorating rates of child mortality, infant mortality
and maternal mortality; reduction in the incidence of Non-Communicable and life-style diseases;
emigration of skilled health care professionals; limited capacity for policy analysis and research;
improving physical and financial access to good-quality health services in depressed domestic
and global economy; the increasing demand and cost for health care; the need to improve
stewardship over policy formulation, health legislation, regulation, resource mobilization,

xvi
coordination, monitoring, and evaluation, strengthen the national health system and improve its
management, and to improve the availability and management of health resources (financial,
human, infrastructure, and so forth); reducing the disease burden attributable to priority diseases
and health problems; increasing consumers‘ awareness of their health status and poor lifestyle,
and fostering effective collaboration and partnership with all health actors, NGOs and CSOs.
Women's higher risk of poverty and destitution is associated with labor force discrimination,
increasing divorce and separation rates and problems in collecting maintenance payments from
departed spouse. Women constitute the majority of beneficiaries under the Social Welfare
Department's Family Assistance Scheme. Female unemployment increased slightly from 7.8%
in 1996 to 8.7% in 2005, perhaps as a result of loss of jobs in the garment and other industries.
The major challenges to enhancing the development of women include implementation and
monitoring of the Equal Employment Opportunity Policy in all workplaces, presence of
occupational discrimination and gender segregation in labor markets; monitoring the compliance
of laws and administrative practices and procedures to CEDAW Articles; maintaining effective
social safety nets for the employed in particular training and investment to promote alternative
livelihoods for women displaced from the manufacturing sector; promoting rural women's
advancement in economic activities without destroying sustainability of women's fisheries and
therefore household food security; continuing social impact analysis of trade agreements on
impact on women's health of imported, low quality foods; increasing incidence of domestic
violence; decreasing fertility of women especially rural Fijian women; spreading of HIV/AIDS
as an epidemic; and collection and analysis of gender-sensitive data.
Fiji is a multi-racial, multi-cultural and pluralistic country with a multiplicity of languages,
religions and ways of living. However, the country is a fragmented society because there is no
unity amongst the citizens of this nation. There is an absence of a National Identity. At present
the citizens of Fiji identify themselves more strongly with their religions, ethnicity and by their
various community or province than by nationality.
These differences have been utilised by many of our political leaders to gain political mileage.
During the past thirty eight years, political leadership played a key role in dividing the citizens of
Fiji rather than uniting us. The division was derived from the colonial system of leadership of
divide and rule. Our leaders have failed to unite our various communities in a form that truly
reflects our diversity.
The lack of social cohesion has contributed to exclusiveness and lower economic growth. One of
the main challenges we face is uniting people who comprise several ethnic communities with
diverse social, economic and cultural backgrounds. It is this diversity which requires a symbol
that is acceptable for the whole population, as a basis for the development of national identity
that creates firm allegiance. This allegiance can be constructed, made concrete, communicated
and maintained over time. The process to negotiate a national identity is a continuous one which
demands inclusiveness and the fair representation of people and cultures. The end results ought
to be a shared conviction that people are socialized into believing its essence, resulting in its
internalization.

xvii
A process needs to be designed and facilitated that can include the participation of Fiji‘s peoples
and our leaders need to be focused on our nation rather than their sectional interests. We need to
build Fiji into a non-racial, culturally-vibrant and united, well-governed, truly democratic nation
that seeks progress, and prosperity through merit-based equality of opportunity, justice and
peace. Establishing a national identity through a common name is of utmost importance.
Education, religion, and culture have important roles to play in our peaceful co-existence, social
cohesion and nation building.
Strategic Priorities for Social Development
Expanding the national and local economies is vital to create more
economic opportunities and to underpin improved well-being and more
sustainable livelihoods. Emphasis will be placed on directing adequate
resources to core priority sectors of health, education, housing, micro
finance initiatives and infrastructure development, particularly in depressed and under-developed
regions, in both rural and urban areas. To enhance their effectiveness, poverty reduction
strategies and programmes will be based on needs assessment, targeted to the intended
beneficiaries and coordinated with relevant stakeholders. National Minimum Wage and the
enhancement of productivity will be addressed. Communities and Community Based
Organizations will be empowered through capacity building programs. Local plans will be
developed and implemented to enable greater access to social services and economic
opportunities.
Access to quality education for all will remain a priority for Fiji.
Improved quality of teaching supplemented by progressive and
responsive curriculum will ensure the achievement of an educated and
skilled workforce. School dropouts and skills gaps will be addressed through initiatives such as
the strengthening of the National Youth Service Scheme, enhancement of vocational and
community based informal education, and alignment of training to national priorities. Critical
will be the need to establish a Modular System of education at secondary schools to provide
broad based education for all students while at the same time giving students choice to develop
their potential along their areas of interest.
Fiji‘s progress towards the achievement of the health related Millennium
Development Goals (MDGs) has not been encouraging. Health service
delivery will be a nation-wide effort to bring it to acceptable levels. In order to
enhance health service delivery the areas to be targeted are evidence-based resource allocation
and meeting manpower needs. The need for more private sector involvement, the identification
of alternative sources of health financing and outsourcing of non-essential services will be
pursued.
National identity through a common name is critical for building
social cohesion and for elimination of racial discrimination in Fiji. To
change for the common good, civic and cultural education will be
pursued with vigor, and will focus on developing our strength
through our common shared values and interests. As a long term
Reducing Poverty to a
Negligible Level
Making Fiji a Knowledge
Based Society
Improving Health
Service Delivery
Developing a Common
National Identity and
Building Social Cohesion

xviii
commitment, the initiatives for building social cohesion and national unity will continue well
beyond 2014. These include civic and multicultural education, establishment of a Commission
for Healing, Reconciliation, Truth and Justice, promulgation of the Anti-Discrimination Act, the
teaching of vernacular languages and comparative studies on religion for better appreciation and
understanding of other cultures.
Implementation and Monitoring Framework
The successful implementation of the Roadmap will depend to a large extent on a robust and
effective implementation and monitoring framework. All stakeholders and implementing
agencies including Ministries and Departments will ensure that all key initiatives and major
outputs are achieved within the timeframe. The framework to ensure a systematic and coherent
approach to implementation will include the following:
(i) Roadmap - based on the Strategic Framework for Change and will outline the outputs and
respective strategies and programmes;
(ii) Action Plans - based on the Roadmap, Ministries and Departments are required to
develop Action Plans which will be basis for the formulation of their Annual Corporate
Plans;
(iii) Nationwide Effort - all stakeholders including Ministries and Departments will contribute
positively to the implementation programme; and
(iv) Implementation and Monitoring – an implementation and monitoring framework will be
established to ensure systemic and effective implementation.
The RDSSED monitoring mechanism will involve the National Peoples Charter Council
(NPCC), sub-committees, a secretariat, Ministries and Departments, private sector and civil
society. The members of the NPCC will be inclusive and representative of the people of Fiji.
Therefore, members will be drawn from the Government of the day, recognised private sector
organisations, Non Government Organisations, religious organisations, provincial councils,
advisory councils and other community-based organisations.
In light of this necessity and the need for greater public inclusiveness, dialogue and participation,
the NPCC, shall be actively engaged in performing the role of facilitator, setting and shaping the
ongoing agenda for change.
The NPCC will monitor the outputs and their respective Key Performance Indicators (KPIs), as
contained in this Roadmap. The NPCC and sub-committees will not limit themselves to
assessing progress against the KPIs: an important function of the sub-committees will be to
assess the continuing relevance of outcomes and KPIs and the quality of information they are
providing so that the adequacy of all KPIs is kept under review.
The functions of the NPCC shall include:
Monitor Roadmap implementation focusing on the outputs and key performance
indicators;

xix
Provide forums for consultation and dialogue for consensus building on national
development issues;
Carry out civic education on governance issues, national identity and other issues
considered relevant and important;
Evaluate and review performance of implementing agencies;
Review of the Roadmap when necessary for the purpose of updating and adjustment; and
Provide policy advice and support to the Prime Minister and Cabinet on issues pertaining
to the Roadmap.

xx
Table of Contents
Chapter 1 Vision, Mission and Guiding Principles ...................................................... 1
1.1 Introduction ........................................................................................................ 1
1.2 Vision: “A Better Fiji for All” ........................................................................... 1 1.2.1 Good Governance and a Truly Democratic Nation ........................................ 1 1.2.2 Progress and Prosperity for All ....................................................................... 2 1.2.3 Peaceful, Non-Racial and United Society ....................................................... 3
1.3 Mission and Guiding Principles ........................................................................ 3
Chapter 2 Good Governance.......................................................................................... 5
2.1 Review of Issues and Challenges....................................................................... 5 2.1.1 Constitution ..................................................................................................... 6 2.1.2 The Electoral and Parliamentary System ........................................................ 7 2.1.3 National Security ............................................................................................ 8 2.1.4 Law and Justice ............................................................................................. 11 2.1.5 The Accountability Framework .................................................................... 19 2.1.6 Public Sector Reform .................................................................................... 21 2.1.7 Indigenous Institutions .................................................................................. 26 2.1.8 Leadership ..................................................................................................... 29
2.2 Policy Objectives, Strategies and Key Performance Indicators ................. 32 2.2.1 Electoral & Ancillary Reforms ..................................................................... 32 2.2.2 National Security .......................................................................................... 33 2.2.3 Law and Justice ............................................................................................. 34 2.2.4 Enhancing the Accountability Framework ................................................... 36 2.2.5 Public Sector Reform .................................................................................... 38 2.2.6 Indigenous Institutions .................................................................................. 40 2.2.7 Leadership ..................................................................................................... 41
Chapter 3 Economic Development .............................................................................. 43
3.1 Macroeconomic Performance ........................................................................ 43 3.1.1 International Economy .................................................................................. 43 3.1.2 Regional Economy ........................................................................................ 43 3.1.3 Domestic Economy ....................................................................................... 44 3.1.4 Private Consumption ..................................................................................... 45 3.1.5 Inflation ......................................................................................................... 45 3.1.6 Investment ..................................................................................................... 45 3.1.7 Interest Rates ................................................................................................. 46 3.1.8 Government Revenue and Expenditure ........................................................ 47 3.1.9 Debt Position ................................................................................................. 47 3.1.10 Trade ......................................................................................................... 48 3.1.11 Foreign Reserves and the Exchange Rate ................................................. 48
xxi
3.2 Sectoral Developments.................................................................................... 49 3.2.1 Macroeconomic Management ....................................................................... 49 3.2.2 Tourism ......................................................................................................... 49 3.2.3 Manufacturing and Commerce ..................................................................... 50 3.2.4 Information and Telecommunications .......................................................... 51 3.2.5 Micro, Small and Medium Enterprises ......................................................... 53 3.2.6 International Relations and External Trade .................................................. 53 3.2.7 Employment and the Labour Market ............................................................ 54 3.2.8 Land Resources Development and Management .......................................... 56 3.2.9 Sugar ............................................................................................................. 57 3.2.10 Non-Sugar Agriculture and Livestock ...................................................... 60 3.2.11 Forestry ..................................................................................................... 61 3.2.12 Fisheries Resources ................................................................................... 63 3.2.13 Mineral and Groundwater ......................................................................... 65 3.2.14 Financial Services ..................................................................................... 67 3.2.15 Transport ................................................................................................... 68 3.2.16 Energy ....................................................................................................... 69 3.2.17 Water and Sewerage ................................................................................. 71
3.3 Policy Objectives, Strategies and Key Performance Indicators ................. 72 3.3.1 Macroeconomic Management ....................................................................... 72 3.3.2 Tourism ......................................................................................................... 73 3.3.3 Manufacturing and Commerce ..................................................................... 75 3.3.4 Information and Telecommunications .......................................................... 76 3.3.5 Micro, Small and Medium Enterprises ......................................................... 78 3.3.6 International Relations and External Trade .................................................. 79 3.3.7 Employment and the Labour Market ............................................................ 80 3.3.8 Land Resources Development and Management .......................................... 82 3.3.9 Sugar ............................................................................................................. 83 3.3.10 Non-Sugar Agriculture and Livestock ...................................................... 84 3.3.11 Forestry ..................................................................................................... 85 3.3.12 Fisheries Resources ................................................................................... 86 3.3.13 Mineral and Groundwater ......................................................................... 88 3.3.14 Financial Services ....................................................................................... 89 3.3.15 Transport ................................................................................................... 93 3.3.16 Energy ....................................................................................................... 96 3.3.17 Water and Sewerage ................................................................................. 98
Chapter 4 Socio-Cultural Development .................................................................... 100
4.1 Review of Social Development ..................................................................... 100 4.1.1 Human Development Index and Millennium Development Goals ............. 100 4.1.2 Global Partnership for Development .......................................................... 100 4.1.3 National Identity and Social Cohesion ....................................................... 102 4.1.4 Poverty Reduction ....................................................................................... 103 4.1.5 Housing and Urban Development ............................................................... 106 4.1.6 Social Justice ............................................................................................... 108 4.1.7 Education and Training ............................................................................... 109

xxii
4.1.8 Health .......................................................................................................... 110 4.1.9 Gender Equality and Women in Development ........................................... 112 4.1.10 Children and Youth ................................................................................. 115 4.1.11 Sports Development ................................................................................ 117 4.1.12 Environmental Sustainability .................................................................. 118 4.1.13 Culture and Heritage ............................................................................... 121 4.1.14 Disaster Risk Reduction and Disaster Management ............................... 122 4.1.15 Rural and Outer Island Development ..................................................... 124
4.2 Policy Objectives, Strategies and Key Performance Indicators ............... 126 4.2.1 Building National Identity and Social Cohesion ........................................ 126 4.2.2 Poverty Alleviation ..................................................................................... 127 4.2.3 Housing and Urban Development ............................................................... 128 4.2.4 Social Justice ............................................................................................... 130 4.2.5 Education and Training ............................................................................... 131 4.2.6 Health .......................................................................................................... 133 4.2.7 Gender Equality and Women Development ............................................... 135 4.2.8 Children and Youth ..................................................................................... 138 4.2.9 Sports Development .................................................................................... 139 4.2.10 Environmental Sustainability .................................................................. 140 4.2.11 Culture and Heritage ............................................................................... 141 4.2.12 Disaster Risk Reduction and Disaster Management ............................... 142 4.2.13 Rural and Outer Islands Development .................................................... 143
Chapter 5 Implementation and Monitoring Mechanism ........................................ 145
5.1 The Implementation Framework................................................................... 145
5.2 The Monitoring Mechanism .......................................................................... 146 5.2.1 Composition and Functions of the NPCC ................................................... 146 5.2.2 Management Information System ............................................................... 149

CHAPTER 1

1
Chapter 1 Vision, Mission and Guiding Principles
1.1 Introduction
The Roadmap for Democracy and Sustainable Socio-economic Development (RDSSED) 2010-
2014 sets out a strategic framework to achieve sustainable democracy, good and just governance,
socio-economic development and national unity. The key foundation of the Roadmap is the
Peoples Charter for Change, Peace and Progress (PCCPP) which was compiled through an
unprecedented nationwide consultation process, involving a wide range of stakeholders. The
Roadmap is logically aligned to the mandate handed down by His Excellency, the President in
2007, as well as the Strategic Framework for Change announced by the Prime Minister on 1 July
2009.
In order to ensure an inclusive approach, ownership and successful implementation, the
Roadmap has been compiled in consultation with private sector, civil society and government to
take on board the current political, social and economic situation, both on the international and
domestic fronts.
This chapter outlines the Vision of the Roadmap, together with the Mission and Guiding
Principles that Government will follow in implementing policies. The Vision is a statement of
Fiji‘s aspirations in the short, medium and long term. The Mission and Guiding Principles
summarize the approach and philosophy that Government will adopt in designing and
implementing policies to achieve the Vision.
Chapter 2 reviews governance issues and challenges and sets out the policies, strategies and key
performance indicators for the next five years. Similarly, reviews and policies, strategies and key
performance indicators for economic and socio-cultural development are addressed in chapters 3
and 4 respectively. Chapter 5 outlines the implementation and monitoring framework of the
Roadmap.
1.2 Vision: “A Better Fiji for All”
The objective of the Roadmap is to identify and implement policies to take the country forward
to achieve the collective vision of ―A Better Fiji for All‖. This vision should be shared by all
citizens of Fiji. A better Fiji is one that is well governed, truly democratic, progressive,
prosperous, non-racial, united and peaceful.
1.2.1 Good Governance and a Truly Democratic Nation
Fiji needs to entrench a culture of good governance in particular a greater commitment to
equality under the law for all people regardless of race, gender or circumstance in all areas of
Government and throughout society in order to end the cycle of coups and achieve sustainable
democracy. The formulation of a new Constitution, which is fair and just, will provide a solid
foundation and framework for rebuilding the nation, is a fundamental component of this
Roadmap. Equally important is electoral reform to bring about fair and free elections. The

2
current electoral system will be reviewed to promote racial tolerance and unity and eliminate
ethnic based elections, a major impediment for national development.
To improve the accountability framework, improve access to justice and strengthen the operation
of the rule of law, key governance institutions responsible for maintaining law and order and
holding Government accountable will be enhanced in the medium to long term. Code of Conduct
and Freedom of Information Decrees will lead to greater accountability on the part of holders of
high public office and to wider access by our citizens to Government information and processes.
Further legal reforms will be implemented to enhance accountability, and maintain freedom of
the media in Fiji.
Good governance of the indigenous population will be addressed through the implementation of
good governance practices in indigenous institutions. A new national security framework will be
adopted to enhance coordination and improve the State‘s response to security threats to the
nation, including a re-defined role for the military that incorporates the concept of human
security to improve its relationship with civilian Governments and the people.
It is imperative that the Public Service must be efficient and effective in both capacity and
performance in the 21st Century. It will instill a new performance and service – oriented culture –
one that values high productivity, smarter and effective work systems and enforces merit based
appointments. It will be lean and accountable to those it serves.
1.2.2 Progress and Prosperity for All
Progress, prosperity and decent living standards can only be achieved when the economy is
growing. The financial and economic recession experienced worldwide, compounded by high
occurrence of natural disasters and flash floods and our vulnerability have adversely affected
Fiji‘s economy causing below par performance. The pro-growth and pro-poor measures
announced in the 2009 Budget in relation to raising exports, enhancing domestic production,
increasing private sector investment and infrastructure development, are in progress and these
are expected to contribute to positive growth in 2010 and beyond.
Enduring solutions on the issue of access to land for productive economic and social purposes
will be developed. Major land reforms will be pursued through a genuine consultative process
with all stakeholders. Of major importance will be the need to ensure that the interests of
landowners and tenants are addressed in a holistic and equitable manner.
Prosperity also means making sure that all people share in the benefits of growth and in the
opportunities which it generates for improving living standards. Particular emphasis will be
placed on directing adequate resources to core priority sectors of health, education, housing,
micro finance initiatives and infrastructure development, particularly in depressed and under-
developed regions, in both rural and urban areas. National Minimum Wage and the enhancement
of productivity will be addressed. Communities and Community Based Organizations will be
empowered through capacity building programs. Local plans will be developed and implemented
to enable greater access to social services and economic opportunities.

3
Narrowing the income and opportunity disparities that exist in society will also contribute to a
greater sense of national identity and social cohesion. This is important in achieving stability and
peace in the country. Peace, stability and a feeling of security are essential to achieve sustained
high economic growth, and prosperity.
In sharing the benefits of growth, we must ensure that development does not impact negatively
on the environment in order that our future generations may also enjoy the benefits of our natural
resources.
1.2.3 Peaceful, Non-Racial and United Society
Achieving peace, racial tolerance and unity in our multi-cultural country is a long term
commitment that must be vigorously pursued through building understanding amongst leaders
and communities at all levels - from local to national, as well as through recognising and
appreciating the contribution by the different communities, to nation building. This is essential
for peaceful co-existence and social cohesion in our multi-cultural society.
National identity through a common name is critical for building social cohesion, elimination of
racial discrimination and developing a united society. To change for the common good, civic and
cultural education will be pursued with vigor, focusing on our shared values and interests. As a
long term commitment, the initiatives for building social cohesion and national unity will
continue well beyond the duration of the Roadmap. These include civic and multicultural
education, the teaching of vernacular languages and comparative studies on religion for better
appreciation and understanding of other cultures.
Government recognizes, accepts and deeply respects that the i-taukei and other communities in
Fiji have their cultures, histories and sense of identities that they deeply cherish and that these
qualities have enabled them to contribute effectively, in great measure to the development of Fiji
as a multicultural, progressive democratic nation.
For the people of Fiji to build and develop a deeper sense of multicultural nationhood into the
future, we must ensure that all communities‘ interests that give each of them their identities and
sense of place and belonging to Fiji must be recognized and respected in our relationship and
mutual conduct.
1.3 Mission and Guiding Principles
Government‘s Mission is to develop and implement the best political, social and economic
policies in order to advance the goals of Good Governance, Prosperity, Peace and National
Unity. Government has consulted widely with the private sector and with non-government
organizations to identify the policies appropriate to the current social and economic situation in
Fiji. Based upon these shared priorities, the Roadmap will best serve the needs of national unity,
peace and harmony.
In pursuing its Mission, Government will abide by a number of Guiding Principles. These are:
Equality and dignity of all citizens;

4
Respect for the diverse cultural, religious and philosophical beliefs;
Unity among people driven by a common purpose and citizenship;
Good and just governance;
Sustainable economic growth;
Social and economic justice;
Equitable access to the benefits of development including access to basic needs and
services;
Merit- based equality of opportunity for all; and
Complying with international commitments.

CHAPTER 2

5
Chapter 2 Good Governance
2.1 Review of Issues and Challenges
Deteriorating governance has been a major problem in Fiji since Independence. An
electoral system that is race-based, the lack of accountability, inefficient service delivery
throughout the public sector and a weak national security framework have all contributed
to political instability, the cycle of coups, and a general lack of public confidence in the
system of Government. The vast majority of the population desperately wants to see Fiji
put an end to the cycle of coups. A wide range of factors have been identified as
contributing to the coups in their own different ways from the complex relationship
between ethnicity and politics, which has led to tension and political instability to socio-
economic conditions giving rise to political grievances. Weak and unjust systems of
governance including the role of the military have also heightened conflict as have other
sources of power in Fiji, traditional leadership arrangements, such as the churches and the
media.
There is a need to entrench a culture of democratic good governance such that it becomes
the dominant political thinking and behaviour of the people of Fiji. Principles of good
governance need to be applied to both the formal governance framework, to the
institutions within it, and to how the country is governed on a daily basis in terms of
policy formulation and decision making. The United Nations Economic and Social
Commission for Asia and the Pacific (ESCAP), and several other UN bodies, describe
good governance as having eight major characteristics. It is participatory, consensus
oriented, accountable, transparent, responsive, effective and efficient, equitable and
inclusive, and follows the rule of law. It assures that corruption is minimised; the views
of minorities are taken into account; and that the voices of the most vulnerable in society
are heard in decision-making. It is also responsive to the present and future needs of
society.
Various indicators have been constructed to measure various aspects of government
activities and governance quality. These include the Worldwide Governance Indicators
(WGI), the University of the South Pacific‘s Composite Governance Index and
Transparency International‘s Corruption Perception Index. The WGI measures six
aggregate governance indicators: (i) Voice and Accountability; (ii) Political Stability and
Absence of Violence; (iii) Government Effectiveness; (iv) Regulatory Quality; (v) Rule
of Law; and (vi) Control of Corruption.

6
The 2008 WGI survey
showed that Fiji‘s
percentile rank had
worsened for all but two
dimensions of
governance, which
improved only slightly
from 2007 figures.
Overall very low ranks
were recorded for all
governance indicators
Generally since 2006
most of the indicators have worsened, with a majority falling below the 50th
percentile
rank. In comparison, Fiji ranked well below Samoa, Vanuatu, American Samoa, Kiribati
and Tuvalu in almost all governance indicators in 2008.
2.1.1 Constitution
On 10 April 2009 His Excellency the President abrogated the 1997 Constitution to allow
the Government to implement the reforms aimed at entrenching a culture of equal
opportunity as envisaged under the Peoples Charter. The State is now re-established
under Presidential Decree[s], which continues to respect the independence of the
judiciary and accountability institutions and the operation of other key arms of the State,
except for Parliament.
The adoption of a new Constitution is now a major priority for Government. Any new
Constitution will of course have to recognise the basic constitutional principles, which
have existed in Fiji since Independence such as sovereignty, parliamentary democracy,
the separation of powers and the protection of basic human rights under a Bill of Rights
and supremacy of the rule of law. Government will also ensure that the underlying
principles of the Peoples Charter in particular the principle of equal opportunity and
equality under the law for all citizens regardless of race, gender or circumstance in all
areas of Government and society are also recognised. To ensure public confidence the
new Constitution is likely to retain many of the non-contentious provisions of the 1997
Constitution and will incorporate major reforms proposed under the Peoples Charter
including:
i. adoption of an Open List Proportional Representation electoral and voting system;
ii. adoption of the common name ―Fijian‖ for all citizens and to change the official
name of the country to ―Fiji‖;
iii. provision that no coup can abrogate the Constitution;
iv. enhancing and clarifying the role of the military and the country‘s national
security framework;
v. stronger protection for the application of the Bill of Rights such as adoption of
CEDAW definitions for discrimination against women and the girl-child; and
Table 1: Five Year Comparison of WGIs (Percentile Rank 0-100)
Governance
Indicator
2004 2005 2006 2007 2008
Voice and
Accountability
51.4 56.7 27.9 35.6 29.3
Political Stability 57.7 59.6 44.2 45.2 41.1
Government
Effectiveness
37.9 55.5 53.1 37 16.1
Regulatory Quality 24.4 39.5 36.1 33.5 24.6
Rule of Law 51 51.9 52.4 33.8 35.9
Control of Corruption 55.3 35.4 44.7 44.9 46.4

7
vi. proposals to strengthen the operation of State services and the accountability
framework.
2.1.2 The Electoral and Parliamentary System
Fiji‘s single member (majority) electoral system has been in place since Independence in
1970 and has always provided for communal representation. In 1990, the system was
altered to guarantee indigenous Fijians control of the House of Representatives. General
elections in Fiji between 1972 and 1994 were conducted under the First-Past-The-Post
(FPTP) electoral system. In 1996, the system was subjected to extensive review as part
of the overall review of the 1990 Constitution by the Reeves Commission. In 1998,
based on recommendations made by the Reeves Commission and also the Parliamentary
Select Committee, the electoral system was changed to implement the Alternative Vote
(AV) system.
None of the three general elections (1999, 2001, 2006) held under the AV system have
been fair. They have all yielded highly distorted results where certain parties win far too
many seats considering their support, while others languish with few or no seats even
with reasonable support. If Fiji wants to be a genuine democracy, it cannot employ
electoral arrangements that violate democratic principles.
While Fiji‘s political problems cannot all be laid at the door of the present electoral
system, there is no doubt that it has had seriously negative effects on Fiji‘s political life.
According to the Reeves Constitution Review Report, race-based politics have become
inevitable in Fiji as a direct result of communal voting and representation in Parliament.
Furthermore, the 2008 Peoples Charter for Change, Peace and Progress, State of the
Nation and Economy (PCCPP & SNE) Report noted that this system has directly
contributed to the political instability leading to the coups and at times the complete
breakdown in law and order.
The communal voting and representation system set out under the 1997 Constitution is
flawed in a number of areas because:
it does not conform to the United Nations Declaration on Human Rights and the
Convention for the Elimination of All Forms of Racial Discrimination;
it has led to political instability. The complex relationship between ethnicity and
politics has led to tension and contributed to Fiji‘s coups;
it has not achieved the objective of drawing the country together or of protecting
the interests of identified ethnic groups. In fact, socio-cultural factors and issues
relating to identity and culture have become politicised and become the basis for
mobilization; which is one of the contributing factors to Fiji‘s coups; and
the demographic change whereby the indigenous people now form the majority
population does not warrant any special arrangement to protect their interests.
Besides the excessive use of communal or reserved representation in violation of basic
human rights principles, this electoral and voting system is unfair due to the:

8
lack of equal suffrage given the disproportional number of voters between single
member constituencies;
use of preferences producing results that do not accurately reflect the will of the
people, as evidenced by the lack of representation for certain political parties who
have received a fair proportion of first preference votes;
communal voting and representation using a single member constituency or
majority/plurality electoral system has also made it impossible to encourage a
move away from race-based politics as political parties only need to appeal to
specific ethnic interests to secure seats; and
the complexity of the current system requires a high level of literacy, which has
led to an unusually high number of invalid votes (9% in 1999, 12% in 2001, and
9% in 2006).
Fiji needs an electoral and voting system that more accurately reflects the will of the
people to enable ‗government of the people, by the people, for the people‘ based on
principles of equal suffrage and equal opportunity for all voters regardless of race, gender
or circumstance.
In the short term, steps will be taken to formulate the appropriate constitutional and legal
framework to facilitate the adoption of the country‘s electoral and parliamentary system
under the new Constitution in 2012.
Further ancillary issues to be addressed include:
a. the size and composition of Parliament;
b. compulsory voting;
c. the voting age;
d. eligibility of candidates;
e. residency restrictions on the right to vote;
f. electoral rules and regulations to ensure free and fair elections; and
g. strengthening the capacity of electoral administrative bodies.
Action will be taken to strengthen the effectiveness of the country‘s electoral
administrative bodies and processes to enable the holding of free and fair elections. The
continued development of an effective voter registration system is an immediate to short
term measure. Furthermore, an ideal organisational structure for the Elections Office will
need to be in place by 2012 to facilitate preparations for the next general election in 2014.
2.1.3 National Security
Fiji‘s national security concerns encompass a broad range of areas including protecting
the country‘s sovereignty from attack, ending the cycle of coups and maintaining law and
order. It also encompasses Fiji‘s interests in protecting its tourism industry or offshore
environment; border security; protective security; emergency management and effective
coordination of disaster relief. Essentially the functions of security agencies are

9
interlinked. Effectively addressing these areas provides the platform for the peace and
stability that is vital for socio-economic growth and national development.
On a broader perspective, the Ministry of Defence, National Security & Immigration
formulates and implements policies relating to the nation‘s security in the areas of
counter terrorism, border control, emergency management, defence, and law and order.
The implementing agencies consist of the Republic of Fiji Military Forces (RFMF), Fiji
Police Force, Department of Immigration, Fiji Islands Customs Service, Department of
Emergency Management and the Financial Intelligence Unit (FIU). Serious threats to
public health and the environment may also require input from other agencies such as the
Ministry of Health and Department of Environment.
The RFMF is primarily responsible for defence and plays a supportive role to the Police
on internal security. In pursuing its foreign policy, Government has engaged the RFMF
and the Police on international peacekeeping duties, while the RFMF has been engaged in
subsidiary roles such as nation building, youth training & infrastructure development in
rural areas, protection of Fiji‘s 200 mile Exclusive Economic Zone (EEZ), support
operations during disasters, emergencies and maritime search and rescue.
The security and management of Fiji‘s border, administration of citizenship and
facilitation of migration and control functions at our major ports and airports are
important issues to be addressed. This is more so in light of the global rise in people and
drug trafficking, identity fraud, money laundering, prostitution and illegal immigrants.
The collaborative effort of the Departments of Immigration, Quarantine, Customs and the
Border Police is critical in this regard.
Counter terrorism activities have also become a permanent feature of global, regional and
national consideration. The growing sophistication of terrorism could continue to
dramatically change the security landscape globally; and the need for cooperation of
inter-agency stakeholders in future security operations, including on a regional basis, is
vital.
Related to terrorist activities and also to corruption and wider economic crimes is the
need to monitor flow of funds through the financial system, both domestically and
internationally. In this regard, the Financial Intelligence Unit (FIU) plays a critical role in
monitoring the flow of funds through the financial system to identify and investigate
suspicious transactions related to money laundering, corruption and other illegal activities
and provide this information to investigation and enforcement agencies.
Fiji is prone to natural disasters and it demonstrates the need for having effective disaster
management policies and a more effective legal framework and action plan. So far,
opportunities to gauge the effectiveness of disaster management plans only arise during a
natural disaster and more is needed in terms of providing for disaster management drills
at the national and local level in relation to the use of State resources to provide
assistance.

10
The vast majority of Fiji‘s population wants to see an end to the cycle of coups as it ruins
lives; destroys social and economic opportunity; and leaves lasting fissures within
society. The Peoples Charter proposes a set of 14 key principles and specific
recommendations that require comprehensive action towards ending the cycle of coups.
The key principles are aimed at:
improving national security coordination through a national security framework
that provides for the formal establishment of a National Security Council (NSC)
to effectively control and coordinate appropriate responses to all national security
threats and allow for greater public accountability for national security; and
realigning the role of the military to place greater emphasis on the concept of
human security to facilitate greater involvement by the RFMF in providing for
basic needs and improving its relationship with the people.
This national security framework needs to be established under the new Constitution to
strengthen coordination and improve the State‘s response in all areas. The NSC will
control and respond to national security threats.
The composition and role of the RFMF as a security institution will remain the same
given the very real potential for disruptive politics leading to conflict and instability.
However, this role will be redefined under the national security framework and expanded
along the human security paradigm. Formal measures will also be put in place to ensure:
the Police remain the primary law and order institution and the point at which the
military can intervene is clarified;
there is provision for the clear accountability of the military to civilian
governments through a redefined relationship; and
the military remains politically neutral at all times.
Internal reviews will be carried out by the Ministry of Defence and other national security
agencies including the RFMF and Police Force in the implementation of these
recommendations. Subject to formal adoption of these recommendations, a plan of action
will be developed to facilitate implementation from 2010 onwards particularly in relation
to the incorporation of a human security framework into the operations of the RFMF.
The adoption of formal counter-terrorism measures remains a priority and progress will
be made towards the revival of a national intelligence agency. The National Intelligence
Agency (NIA) is expected to become operational in 2010. Another priority is the on-
going implementation of the Disaster Management Act beginning with the establishment
and subsequent merger of the Emergency Management Unit with the National Disaster
Management Office. Border control systems will be strengthened beginning with a
review of the operational machinery. It is also imperative that institutions charged with
national security responsibilities are adequately resourced to facilitate the effective
execution of their roles and functions.

11
2.1.4 Law and Justice
The rule of law must be a basic feature of an effective system of democratic governance.
For there to be effective and efficient rule of law, the different parts of the legal system
need to operate and interact in the following way:
i Constitutional Rule: the existence of a set of basic rules and principles by which the
people of Fiji have agreed to be bound;
ii Government and other State institutions are subject to the law;
iii The law making functions vested in an independent legislature whereby laws can
only be changed by an established process that is transparent and accountable;
iv Impartial and independent courts exist to interpret the law;
v Laws are transparent and accessible, particularly for the most vulnerable;
vi Laws are enforced and interpreted consistently and their application is efficient and
timely; and
vii Laws uphold and protect basic human rights in particular that all citizens are equal
under the law and should not be discriminated against on the grounds of race,
gender or circumstance.
The effectiveness of the Law and Justice Sector in part depends on the ability of the
different institutions to operate together in a coherent, coordinated and mutually
supportive way.

12
Box 2.1: Fiji’s Law and Justice Sector
Legal Framework:
As provided for under the Constitution, Acts of Parliament, Regulations and Decrees, and the
common law of Fiji.
The Courts:
Consisting of the Supreme Court, Court of Appeal, High Court, Magistrates Court and Small
Claims Tribunal.
Law Enforcement:
The Fiji Police Force, public agencies that enforce specific laws like FIRCA, FICAC, LTA etc.
and non-government policing initiatives like private security firms.
State Law Officers Fiji‘s Attorney-General and the Solicitor-General and all Government lawyers.
Prosecution Services:
The Director of Public Prosecutions and Police Prosecution Service plus some of the other
agencies referred to above.
Parliament:
This includes the Justice, Law & Order Sector Standing Committee of the House of
Representatives.
Mediators and Arbitrators:
Chief Tribunal – Employment Tribunal, Agricultural Tribunal, Commerce Commission.
The Penal System:
Fiji Prisons and Corrections Service.
Legal Profession:
Members of the Bar and the Fiji Law Society. The work of the Legal Aid Commission is also
relevant in this regard.
Human Rights and Law Reform Bodies:
Fiji Law Reform Commission and Fiji Human Rights Commission.
Civil Society Organisations:
Non-Government organisations and community bodies focused on the promotion of human rights
and other matters related to the administration of justice.
Technically, the Law and Justice Sector is operating reasonably well. In many areas of
the legal system where significant problems existed a few years ago, progress has been or
is being made. The Australia/Fiji Law and Justice Programme, now suspended, was
starting to achieve modest successes in improving the operation of different institutions in
the sector. For the first time, it was starting to function and operate as a sector and at a
more strategic level in addressing problems such as smoothing out the operation of the
criminal justice system and overcoming delays in prosecutions. The program had assisted
Fiji courts and other agencies to reduce case back logs; improve the treatment of juvenile
offenders; expand access to legal aid; and to establish a Family Court and associated
counselling service. It was also instrumental in improving community policing and the
operation of the prosecution service. The law revision project is near completion.
Departments are now vetting revised laws relevant to their portfolios. Upon completion,
the laws will be made available on-line.
The cycle of coups has adversely affected the operation of the rule of law requiring
reform measures to the criminal justice system to strengthen the sanctions against coups.
Preventing further coups is now a priority for the law and justice sector and action is
13
needed to implement the 14 key principles for ending the coup culture, in particular
measures that strengthen the penalties and operation of criminal law in relation to
offences related to coups, particularly convictions for treason.
There is scope for further improvement in overcoming the impact of the coups;
accountability in the judiciary; giving effect to law reform recommendations;
strengthening the effectiveness of law enforcement; ensuring greater public awareness of
the law and access to justice for all citizens.
The Courts System
A number of key issues have been identified as being relevant to the effective and
efficient disposal of cases (both civil and criminal) by the courts, some of which are
highlighted below:
a. Size of the Judiciary: the number of Judges, Magistrates and other judicial
officers (including the creation of new positions like Master of the High Court);
b. Court Administration: improved case management in relation to pre-trial motions;
c. Jurisdiction: specialised courts and related matters;
d. Legal Profession: the performance and conduct of all legal practitioners including
Government lawyers and prosecutors; and
e. The availability of alternative Dispute Resolution and more formal settlement
procedures.
Court congestion and a backlog of cases is currently the major hindrance to providing
equal access to justice and ensuring the effective enforcement of law through the court
system. The Beattie Report (1994) highlighted some reasons for delays in the ―disposal of
the business of the Courts‖, which is still valid today. This mainly relate to the conduct
of the legal profession and court administration in the performance of its functions.
Statistics for 2006 indicate that of the total number of contested cases set down for
hearing in a court of law, 62.5% were either adjourned or withdrawn and that on average
it takes 18 months to dispose of civil cases (particularly in the Magistrates Court).
However, the implementation of some of the recommendations of the Beattie Report in
relation to case management by the courts are showing signs of improving the
effectiveness of the courts particularly in relation to the disposal of civil actions by the
High Court of Fiji. Delays in the court system, particularly in the High Court, have been
reduced with most cases now being disposed of within a calendar year. Prior to the
implementation of these measures, it could take up to three to five years to bring a civil
action to trial. However, there are still some long outstanding cases that have been heard,
but where judgements have not yet been handed down.
Efforts are on-going to address these issues many of which are set out in the Reports on
Fiji‘s Law and Justice Sector. Measures to be taken call for greater cooperation and
coordination between major stakeholders namely the Judiciary, the Director of Public
Prosecutions, and also the Fiji Law Society particularly in relation to the development of

14
standards that need to be met to ensure cases are handled properly and disposed of
efficiently.
The efficient disposal of civil cases is of particular importance for private sector activity
and the development of a market economy that recognises enforceable contracts and
enforceable property rights. In many jurisdictions legal and administrative reforms have
or are being pursued to improve the efficiency and effectiveness of court systems, which
include the implementation of alternative dispute resolution mechanisms that promote
conciliation, mediation and arbitration. In Fiji, foreign investors already enjoy access to
alternative dispute resolution mechanisms under the Foreign Investment Act 1999 and the
legal framework for industrial relations has always provided alternative dispute
resolution, which the new Employment Relations Promulgation (2007) seeks to improve
on.
The issue of judicial independence is a continuing concern to the general public. The
need for fiscal autonomy and the provision of adequate resources to enable the effective
performance of its functions is one particular area that does require consideration. The
UN Basic Principles on the Independence of the Judiciary provides that it ―is the duty of
each Member State to provide adequate resources to enable the judiciary to properly
perform its functions.‖ The Commonwealth Latimer House Principles also set out
guidelines for member States on issues to preserve the independence of the judiciary that
relate to court administration.
While allegations of corruption within the judiciary (the magistracy) and the public sector
as a whole remain a pressing issue – the establishment of the Fiji Independent
Commission Against Corruption (FICAC) and creation of new criminal offences which
deal with all issues of corruption, appear largely sufficient at this stage to address this
issue. However, the adoption of the conduct standards recommended above should also
have some impact on addressing these concerns.
The issue of creating specialised courts has also been raised as one way of assisting the
people of Fiji by giving particular and specialised attention to particular types of legal
cases. There is already a specialised division of the courts to deal with family and
juvenile matters, and the recent Employment Relations Promulgation establishes a
separate division for employment matters. FICAC supports the creation of a corruption
division of the High Court.
In addition to the adoption of a new Constitution to put in place the basic framework for
the operation of the rule of law, many more specific measures are needed to strengthen
the law and justice sector. The people of Fiji not only need to know what the law is, they
also need to be assured that they live in a society where the law is respected, honoured
and obeyed by all; and where all citizens are treated equally by the courts and other legal
and State institutions.
To achieve this, measures will be implemented to strengthen the independence and
accountability of the judiciary. This involves the adoption and enforcement of conduct
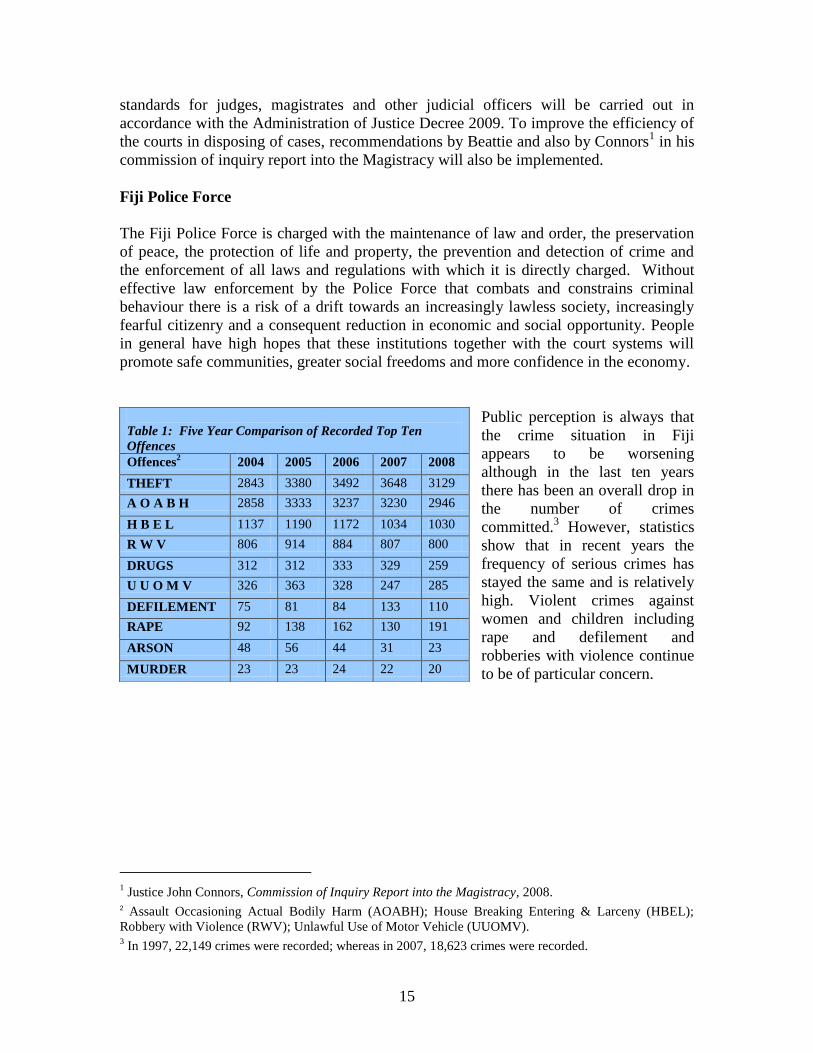
15
standards for judges, magistrates and other judicial officers will be carried out in
accordance with the Administration of Justice Decree 2009. To improve the efficiency of
the courts in disposing of cases, recommendations by Beattie and also by Connors1 in his
commission of inquiry report into the Magistracy will also be implemented.
Fiji Police Force
The Fiji Police Force is charged with the maintenance of law and order, the preservation
of peace, the protection of life and property, the prevention and detection of crime and
the enforcement of all laws and regulations with which it is directly charged. Without
effective law enforcement by the Police Force that combats and constrains criminal
behaviour there is a risk of a drift towards an increasingly lawless society, increasingly
fearful citizenry and a consequent reduction in economic and social opportunity. People
in general have high hopes that these institutions together with the court systems will
promote safe communities, greater social freedoms and more confidence in the economy.
Public perception is always that
the crime situation in Fiji
appears to be worsening
although in the last ten years
there has been an overall drop in
the number of crimes
committed.3 However, statistics
show that in recent years the
frequency of serious crimes has
stayed the same and is relatively
high. Violent crimes against
women and children including
rape and defilement and
robberies with violence continue
to be of particular concern.
1 Justice John Connors, Commission of Inquiry Report into the Magistracy, 2008.
2 Assault Occasioning Actual Bodily Harm (AOABH); House Breaking Entering & Larceny (HBEL);
Robbery with Violence (RWV); Unlawful Use of Motor Vehicle (UUOMV). 3 In 1997, 22,149 crimes were recorded; whereas in 2007, 18,623 crimes were recorded.
Table 1: Five Year Comparison of Recorded Top Ten
Offences
Offences2 2004 2005 2006 2007 2008
THEFT 2843 3380 3492 3648 3129
A O A B H 2858 3333 3237 3230 2946
H B E L 1137 1190 1172 1034 1030
R W V 806 914 884 807 800
DRUGS 312 312 333 329 259
U U O M V 326 363 328 247 285
DEFILEMENT 75 81 84 133 110
RAPE 92 138 162 130 191
ARSON 48 56 44 31 23
MURDER 23 23 24 22 20

16
While the number of crimes
committed has reduced, the
detection rate needs much
improvement. The nature, scope and
complexity of crime is also changing
with transnational crimes such as
drug trafficking and money
laundering on the increase; as well
as signs emerging of a growing sex
trade. Illegal immigrants have
played a part in these trends. The
unlikely but still real threat of
terrorism is an ominous spectre that has changed the way that Police Forces world wide
go about their job.
Increased concern about crime has led to changes in lifestyles aimed at ensuring greater
self-protection and efforts to make the family home and businesses more secure. Private
expenditure on security has increased markedly over the last ten years. However, as
public surveys suggest, there is still room for raising public awareness on issues related to
the avoidance of crime.
The Police on their own cannot solve all the problems of law and order in society and
partnerships at the national and local levels are essential to the well being of
communities. Initiatives such as the Neighbourhood Watch Schemes, Crime Prevention
Consultative Committees, Crime Prevention Community Initiated Projects and Police and
Citizens Youth Clubs are making helpful and lasting contributions to addressing crime
prevention issues. At the school level, the crime prevention initiative in the form of
Scholastic Program has been introduced in some secondary and primary schools. The
large scale involvement of members of the public in community policing and
neighbourhood watch zones throughout the country has added to the success of the Police
in reducing crime.
Nevertheless, the Police Force sees itself as under serious challenge. Crime remains at a
high level, with detection rates on crime not improving. While there is recognition of the
need to reorient the Force, its budget, human resources, the need for enhanced training
and equipment deficiencies need to be addressed.
A key challenge faced by the Police is the changing nature of criminal activities,
including the threat of terrorism. This threat is real and although it may not directly
affect Fiji, it can influence criminal activities, especially at the borders. The growing
scope and complexity of criminal activities such as white collar crime has tested the
competence of the law enforcement agencies.
The growing scope and complexity of criminal activities such as white collar crime has
tested the competence of the law enforcement agencies. The Fiji Police Force, in
Table 2: Five Year Comparison of Crime Detection Rate
Year No. of Crime
Reports
No. of Reports Detected
% Detection
Rate
2003 16,949 8602 51
2004 16,574 8,662 52
2005 19,050 11,017 58
2006 19,143 8,187 43
2007 18,623 8,525 46
17
particular, with limited resources, lacks the capability to tackle serious crimes effectively.
The pace of societal and technological changes presents a continually evolving set of
challenges for the Police Force.
The Force is currently undertaking major projects to reform and modernize the service.
This includes organisational restructuring, setting up of the Ready Action Group, Border
Police, and equipping of the Forensic Division. There are also ongoing efforts to address
the composition of the Force through recruitment of Indo Fijians and women. These
initiatives are aimed at improving the effectiveness of the Force. The Force also needs to
be fully equipped and resourced to rise completely to the challenge they face.
To ensure that Fiji Police continues to meet new challenges, the Force needs to transform
itself. Transformation by way of changes in how it does business, in mind set, in culture
and in attitude. Changes in society cannot be ignored as they will continue to influence
and determine how the Force does its business.
For the medium term, focus will be directed towards improving law enforcement through
the setting up of task forces to clean up serious and/or prevalent criminal behaviour;
through using more advanced policing techniques; extending community policing across
Fiji and allowing for greater community involvement in law enforcement. In addition, a
stronger focus will be placed on crime prevention at the national level by establishing a
Crime Prevention Board. As part of the transformation process for the FPF, leadership
capacity and professionalism will also be developed and enhanced.
Fiji Prisons and Correction Services
The Fiji Prisons and Correction Services (FPCS) is responsible for the safe, secure and
humane treatment of persons in custody by providing opportunities to correct offending
behaviour, develop work and life skills, and to perform community service. Its two main
functions are the provision of safe custody and humane treatment of inmates; and the
provision of rehabilitation programmes to those in lawful custody.
The FPCS is an important aspect of the justice system. Its existence institutionalizes the
end process of our criminal justice system. It is deemed that justice is not carried out until
a person who is convicted of any crime has fully served his/her sentence. A good prison
system will not only serve its purpose as a penal or custodial institution, but more so, be a
deterrent to the commitment of offences.
The Prisons Service has 13 institutions nationwide and faces problems of low staff ratios
per prisoner population (1:10 compared to the world standard of 1:4), capacity, budget
problems and old unhygienic facilities. Most prisoners are relatively young and belong to
the 16 to 39 age group. . Recidivism continues to be a major problem, at 56% of all
prisoners. The prison population per 100,000 population for Fiji was 131 in 2005. Out of
the 20 countries of the Oceania Region for which data is available, only 4 had a higher
rate than Fiji.
18
The Prisons Service does not have sufficient resources to cater for the increased number
of prisoners entering the system - prisons are crowded; and the Prisons Service cannot
deliver quality rehabilitation programs. Crowding affects the ability of prison wardens to
rehabilitate and focus on prisoners. To address this issue, the FPCS has also started to
encourage other forms of imprisonment in collaboration with other stakeholders like the
Police, non government organizations, and the general community.
An initiative undertaken by the Australia/Fiji Law & Justice Program (now suspended)
was the development of a cross sector agency Community Based Corrections Framework.
This effort was enhanced with the support of the current government and has been piloted
in selected localities including Ba and Navua. About 120 prisoners are serving their
sentences under the Community Work Act 1996 in selected locations. These offenders
are supervised on a voluntary basis by retired civil servants and prominent citizens
including chiefs and church leaders.
The new Prisons and Corrections Act 2006 provides a new focus for the future
development of the Service. It emphasises the need to shift the focus from the traditional
philosophy of containment to corrections. The new legislation requires the adoption of
new, innovative and effective programmes to ensure that the offenders change, do not re-
offend nor return to prison.
As part of this new philosophy, the Department has launched the Yellow Ribbon Project
(YRP), which is essentially about acceptance, forgiveness and giving ex-offenders a
second chance. It is about community action in assisting people coming out of prison to
reintegrate successfully back into society. The aftercare aspects when offenders are
released from prisons have been identified as the weak link in the rehabilitation process
of offenders. The YRP is now an integral part of Prison Service and the FPCS will be
working closely with key stakeholders on its implementation.
A case management framework is also being piloted in prison, with the ultimate objective
to carry out an assessment of prisoners based on social and psychological principles in
order to better understand the prisoners and mete appropriate rehabilitation programme.
Other Components of the Law and Justice Sector
Many people living at village and settlement levels still do not have a good understanding
of the law and access to justice and other legal services for ordinary citizens remains a
concern. Action is needed to further strengthen the awareness of basic legal rights such
as the right to counsel and emphasising the right not to incriminate oneself and making
the country‘s laws and other legal services more accessible for ordinary people.
Improvements in these areas relate to completion of the revision of the country‘s laws,
access to legal representation for the most vulnerable and strengthening the law reform
process.
To address the accountability of the legal profession, recent amendments were made to
the Legal Practitioners Act to establish a Legal Services Commissioner to handle

19
complaints against lawyers. Putting in place this new independent enforcement
mechanism of conduct standards for lawyers is expected to resolve the many outstanding
complaints against lawyers and enhance the accountability of the profession. The new
independent disciplinary process for legal practitioners will be actively enforced to
maintain their accountability.
In addition, work will continue on extending the services of the Legal Aid Commission
throughout the country. Formal administrative measures will also be adopted to allow for
greater involvement from civil society and bodies like the Fiji Law Society to assist and
complement the work of the Legal Aid Commission in terms of promoting public
awareness of these basic legal rights. Law revision will be completed and easier access to
written laws provided with long term strategies put in place to enhance the role of the Fiji
Law Reform Commission. Other on-going strategies to improve access to justice in Fiji
include ensuring all legal registries such as those administered by the Registrar of Titles,
Registrar-General, Registrar of Companies and Public Trustee continue to make
improvements in the provision of their services. This mainly involves capacity building
to upgrade facilities to enhance efficiency.
2.1.5 The Accountability Framework
The accountability framework comprises the institutions and processes that exist to
ensure open and transparent Government. Without these processes there is no public
sector accountability. This involves the operations of many state institutions namely,
Parliament, through its committee system and other processes, and independent
institutions like the Auditor-General, Fiji Human Rights Commission (FHRC) and the
Fiji Independent Commission Against Corruption (FICAC). A key function for many of
these institutions is to hold Government to account for its actions; a necessary step in
maintaining public confidence in the system.
The effectiveness of Government‘s internal processes to ensure enforcement of the public
service code of conduct and compliance with financial rules and regulations is another
key component of the accountability framework. It also requires commitment to allowing
the public to access public information and independent enforcement of conduct
standards for holders of high public office. A free and independent media and the work of
non-government and civil society organisations are also a vital part of the accountability
framework.
Public perception is that there is little or no accountability for public officials, from
holders of high public office to ordinary civil servants, who behave improperly. In the
absence of accountability, people are unable to ensure that their Government acts wisely,
lawfully and fairly in serving the national interest. Accountability issues are continually
raised in the Annual Audit Reports of the Auditor-General on the public accounts of the
State and Local Government bodies and by the media. Findings in reports of the Auditor-
General regularly highlight non-compliance with public service rules and regulations
relating to the poor collection of government revenue; abuse of procurement procedures;

20
irregularities in project management; abuse of resources and facilities; poor cash
management; employee misconduct; and inadequate record keeping.
The absence of an effective legal framework that guarantees the public a right to access
public information, enforces conduct standards for holders of high public office, and
maintains the accountability of the media have all contributed to the weakness in the
accountability framework. An analysis of investigations carried out by the FICAC shows
that corruption occurs throughout the public sector at all levels and has become systemic
in certain areas.
Presently, the weakness of the accountability framework requires major capacity
building, in terms of financial and human resources across the board to strengthen
democratic and accountability institutions at a time when downsizing the operating costs
of the public sector is a major reform priority. Another area of weakness is the non-
performance of functions that require office holders in the accountability framework to be
pro-active. There are functions throughout the accountability framework, whereby office
holders are required to initiate action in pursuing matters to uphold the accountability of
the public sector either through parliamentary scrutiny and the operation of its committee
system to investigations being initiated by the Auditor-General. FICAC has been
assigned general functions to identify areas of public administration that are susceptible
to corruption and recommend measures that need to be taken to strengthen these areas.
Institutional memory in terms of how many of these functions are to be carried out needs
to be developed.
An effective anti-corruption framework that complies with the United Nations
Convention Against Corruption (UNCAC) is another area of focus. In 2005, Fiji ranked
57th
out of 159 countries in Transparency International‘s Corruption Perception Index
(CPI) and it scored below the borderline figure for distinguishing countries that do and do
not have a serious problem with corruption.4 Since 2006, Fiji has not been listed on the
CPI making it difficult to gauge the impact of significant efforts in recent years such as
ratification of UNCAC and the establishment of FICAC, which has led to an increase in
arrests and prosecutions for corruption related offences. However, when considering the
Worldwide Governance Index aggregate indicator on ―control of corruption‖, our
percentile rank has started to improve slightly; from 35.4 in 2005 to 46.4 in 2008,
however it is still below the 50th
percentile rank.
The number of complaints received by FICAC relating to maladministration indicates a
high level of dissatisfaction with service delivery throughout the public sector. In 2008,
2,367 complaints were received, a slight increase from the previous year. A little over
half of these complaints were corruption related with the majority relating to abuse of
office, forgery of documents with intent to defraud and extortion and fraud by public
officers. Other complaints received related to delays in the processing of applications and
service delivery complaints, which were then referred to relevant authorities.
4 TI considers a score of 5.0 to be the borderline figure distinguishing countries that do and do not have a
serious problem with corruption. Fiji‘s score was 4.0.

21
A report by a UNCAC Observer Team on the country‘s progress towards meeting its
obligations under the convention will provide the basis for measures that need to be taken
to fully develop the country‘s anti-corruption framework. In the meantime efforts to
strengthen the capacity of FICAC to enable the effective performance of its functions will
continue.
Generally, the accountability framework needs to be strengthened to address the concerns
highlighted above. This includes capacity strengthening of the country‘s democratic and
accountability institutions to entrench a culture of sustainable democracy and good and
just governance. This can only be achieved when systems designed to prevent abuse of
office, the misuse of public resources and maladministration across the public sector are
working efficiently and effectively. Reforms are also necessary for ending the coup
culture noting Principle 9 of the 14 Key Principles, which requires the adoption of
measures to: ―strengthen the accountability and transparency of State institutions, the
private sector and civil society organisations in particular to enhance their adherence to
the rule of law.‖ Reforms to the accountability framework will focus on:
a. entrenching a culture of democratic good governance through education and
broadcast programmes on the principles of democracy and good governance;
b. strengthening the capacity of democratic and accountability institutions to ensure
effective performance of their accountability functions;
c. the adoption of Freedom of Information and Code of Conduct laws to provide for
open, transparent and accountable Government; and
d. media reforms to enhance industry regulation, protect media freedoms and
maintain the accountability of media organisations and journalists.
2.1.6 Public Sector Reform
The Public Sector in Fiji is in a serious predicament. Its performance, professionalism,
productivity, accountability, cost and commitment have been heavily criticised in recent
years. While many public servants try hard to do their jobs as honestly and as effectively
as possible, the impact of four coups, weak leadership, the politicisation of the service
itself, a massive exodus abroad of skills, competencies and institutional memory, and
various other constraints have taken their toll.
Pressures for Public Sector Reform (PSR) are emanating from the economic and fiscal
performance of the nation, the need to build a service culture that is committed to provide
effective and efficient service to the public, the need to modernise work systems, external
pressures from international development partners and donor funding communities, and a
vocal private sector and civil society.
The core paradigm for reforms has been that the quality of governance affects people‘s
lives. In other words, where the Public Sector through its institutional structure offers
inefficient, ineffective and poor quality programmes, support for national development is
likely to be constrained, possibly compromised or even undermined. The World Bank
concluded recently that PSR has ‗great potential to reduce poverty‘ and that ‗good

22
government institutions are associated with higher income growth, national wealth, and
social achievements‘. The current consensus is thus that PSR matters a great deal for
national development, and in at least two ways: first, it will lead to better delivery of the
basic public services that affect the living standards of the poor; and second, it will create
a climate conducive to private sector development.
Civil Service Reform
The Civil Service Reform (CSR) Programme commenced in 1994 and was aimed at
improving efficiency, productivity, accountability and transparency in the civil service.
The three key components of the CSR program are in the areas of: (i) Human Resources
Management; (ii) Productivity Management; and (iii) Organizational Management.
Major milestones achieved include the restructuring of the Public Service Commission
(PSC) in 1997 and 1998; the enactment of the Public Service Act and subsidiary
regulations; the development of the Senior Executive Services (SES) Programme; the
contracting of Chief Executive Officers (which was later terminated in early 2007); the
introduction of three-year industrial relations agreements; the development of the
Performance Management System; and the development and implementation of the
Service Excellence Awards Framework.
Current reform initiatives being undertaken include the review of the government
machinery, restructuring/reorganization of government agencies, right sizing, reduction
in the retirement age, development of a Human Resource Information System, review and
implementation of the Service Excellence Award Framework and business process re-
engineering. Other initiatives include the review of disciplinary procedures to speed up
the process and the proposed setting up of a Government Information and Referral Centre
to become the focal point for information and referral to all other Ministries/Departments.
The main priorities with regards to CSR are restructuring, modernising human resource
management and remuneration, rebuilding the capacity of the Public Service, and E-
government.
The restructure of the Public Service, which necessitates the functional reviews of all
agencies, is vital to remove duplication and enable human resources and structures to be
aligned to serving the public better. Leadership development will also be enhanced to
rebuild a committed, visionary, highly competent and more accountable leadership group.
Public service leaders will need to play an important role in efforts to rebuild
professionalism within the service. Contracting-out opportunities will be further
explored as a means of cutting costs. Remuneration systems also need to be modernized,
based on demonstrated productivity increases, to reward competent and committed
individuals, while at the same time penalizing non-performers. Contract employment
arrangements for all members of the SES would be pursued to be completed by the end of
2009.

23
The capacity of the Public Service needs to be rebuilt to a new service-orientated, more
accountable and ethical culture in the Public Service. Focus should be placed on human
resource planning to meet the Public Service‘s future needs and succession planning by
selecting, managing and fast-tracking the careers of promising graduates and middle-
level staff. Selected e-government opportunities will continue to be identified and
pursued to improve service delivery and internal management in Government Ministries.
Public Enterprise Reform
The Public Enterprise Reform (PER) policy was first introduced in 1993 as part of an
economic reform package. The reform program focused on ensuring that public
enterprises provide the maximum benefit to taxpayers through improved management of
the enterprises. It was hoped that many of the loss-making enterprises when re-organized
and commercially focused would be in a position to provide the Government with a
higher return on public investment.
The goals of the PER program are to ensure public entities: (i) become more efficient,
productive, accountable and better organized; (ii) provide optimum return on investment;
and (iii) to establish an appropriate legal framework for each re-organized enterprise.
The Public Enterprise Act (1996) provides a comprehensive legal framework for
implementing the reform program. Its coverage extends to all Public Sector commercial
activities, including those of fully owned companies, statutory authorities and
government departments.
There are currently 11 Government Commercial Companies GCCs) (including a
subsidiary) and 4 Commercial Statutory Authorities (CSAs) under the public enterprises
portfolio. GCCs have the sole objective of being profitable while the CSAs in addition to
having commercial objectives also have non commercial objectives which can be
regulatory or technical in nature, under the line Ministry legislations. In addition, the
Ministry also monitors 2 majority owned GCCs, namely the Pacific Fishing Company
Limited (PAFCO) and Fiji Hardwood Corporation Limited.
Financial performance indicators show that State owned enterprises have performed quite
poorly in the last ten years. Returns on Shareholder‘s Funds of existing public enterprises
have continued to be about 3% in aggregate. Few public enterprises are able to finance
their investments from internally generated funds and the modest target of a 10% return
on assets is rarely achieved, overall returns are some 3% and well below the opportunity
cost of capital. The government has capital equivalent to 30% of GDP tied up in largely
unprofitable public enterprises. In 10 years they have returned only a total of $14m to
government through dividends.
In part, the variability in performance can be attributed to the political agenda of past
governments who had varied perceptions of reforms that led to several ―start stop
approaches‖ in the reform process. Other factors include the provision of social service
obligations which are not fully paid for, absence of commercial oriented culture and
attitudes in the reorganised entities and management not having full commercial

24
autonomy in running the operations. Good corporate governance and management
requires the separation and clarification of the powers and responsibilities of ownership,
governance and management in public enterprises. Political involvement in the running
of enterprises should be limited to priority policy directions that are required to be
published.
Efforts will be made to reform existing Public Enterprises to ensure their improved
performance in readiness for privatization. Public Enterprises involved in food
production will be supported to improve our national food security.
The reform process under the Public Enterprises Act is in itself a lengthy procedure
resulting in planned reform timelines having had to be revised regularly. The Department
of Public Enterprise has revised the procedures with the intention to speed up the process
so that planned returns are realised early.
Apart from the 17 entities under the PE portfolio, work is in progress to reorganise,
corporatise and privatise a host of other entities. A set of priorities have been established
for the accelerated programme with an indicative work plan up to 2011 which includes:
re-organisation of: (i) Department of Quarantine; (ii) Ministry of Agriculture; (iii)
Fiji Islands Maritime Safety Authority; (iv) Management of Government
Quarters; (v) Fiji Film and TV Unit; (vi) Coconut Industry Development
Authority;
corporatisation of: (i) Department of Water and Sewerage; (ii) Mechanical
Engineering and Electrical Sections of the Public Works Department; (iii)
Department of Government Supplies; (iv) Department of National Roads; (v)
Trade and Manufacturing Accounts (TMA); and
divestment/privatisation of: (i) Food Processors Ltd; (ii) Fiji Tannery; (iii) Ports
Terminal Ltd; (iv) Fiji Hardwoods Corporation Ltd; (v) Batiri; (vi) Fiji Ships and
Heavy Industries Ltd; (vii) Rewa Rice Ltd; (viii) Government Printing.
This can be considered an ambitious, stretch target which recognises the scale of the
challenge. But it is achievable. And the greater the extent to which it is achieved the
greater the benefits which will be gained for Government and for national economic
development.
The Public Private Partnerships (PPP) Act 2006 establishes a range of legal options for
ownership and operation of entities which fall between full public or private ownership.
PPPs are arrangements which, irrespective of the corporate or legal form, bring together
State assets or expertise and private sector assets or expertise to provide infrastructure or
services at competitive prices. It has the potential to increase the overall efficiency of
public infrastructure and service provision whilst reducing demands on Government
resources, thus allowing it to concentrate public funds on provision of those goods and
services which cannot generate adequate financial returns but do create the social and
economic outcomes which Government seeks.

25
Financial Management Reform
The Financial Management Reform (FMR) programme which re-commenced in 2001 is
geared towards enabling Government to better implement its policies, and deliver public
goods and services more efficiently and effectively. The reforms provide the institutional
framework for more accountability and transparency, and better management in the use
of public resources. It is intended to strengthen and modernize the management of
government finances to: (i) better align government policy priorities with budget
resources; (ii) adopt a performance focus; (iii) provide more effective control over public
spending; and (iv) strengthening accountability and transparency in financial
management.
The FMR has four key components; namely the (1) Financial Legislation and FMR
Policies; (2) the development and implementation of the Financial Management
Information System (FMIS); (3) the introduction of Performance Budgeting; and (4)
Change Management.
The new Financial Management Act and its associated policies and regulations have been
in place since January 2004. A progressive approach is being adopted in devolving
financial authorities and incentives to Permanent Secretaries, in line with their ability to
manage their financial allocations. The automated processes brought about through the
FMIS have brought about changes to accounting procedures and processes, resulting in
the review of the Finance Instructions.
The FMIS implementation was completed in October 2007 with all ministries and
departments now ―live‖ with the FMIS. Functional and technical support continues to be
provided to all agencies to ensure that all FMIS processes are fully complied with.
Ongoing FMIS training is provided for all users, particularly the special user groups such
as accounting heads and super-users which focuses on their different areas of
responsibilities. The FMIS post implementation activities will mainly focus on agencies
retraining, system support, monitoring, development of further system reports and
capacity building.
Ongoing training and capacity building program continues across government. In
addition, Performance Budgeting is being gradually implemented across government,
with agencies reporting on the implementation results of one or two budget funded
programmes. Over the years, this reporting will gradually extend to cover more
programmes as expertise and skills in the area is built up.
The implementation of the new FMIS provides opportunities now to ensure better
reporting and monitoring of government expenditure and to enhance accurate expenditure
management; to improve financial management capacity across all Ministries and
agencies; to introduce further improvements to performance measurement of the outputs
of each Ministry or agency; and to ensure greater involvement in, and accountability for,
financial management by senior managers. More action is needed to better link the
budget, financial management, corporate planning and planning reforms to give effect to

26
the Government‘s priorities under the Peoples Charter; to achieve the Government‘s
policy objectives; to support the overall Public Sector Reform; and to further improve on
the outputs to be delivered by each Government Ministry or agency.
Reform Challenges
The PSR Programme is aimed at ultimately improving service delivery and the efficiency
and effectiveness of the public service. However, challenges abound.
The public sector needs a new vision to challenge and inspire its performance. The new
vision for rebuilding Fiji‘s Public Sector for the 21st Century should be enunciated in the
twelve points highlighted in the SNE, which amongst other things promotes a new
workplace culture, a commitment to delivering excellent service to the public, making
effective and efficient use of resources. It also emphasizes adopting a leadership style
that is inclusive, visionary, professional and empowering.
The management of the reform process needs to be improved and strengthened. Proper
coordination is required so that reform efforts are balanced and appropriately sequenced.
A related concern is that public service unions seem to have developed a lasting
antagonistic relationship over PSR issues and have quite effectively undermined much
needed changes in the Public Sector from time to time.
Another issue that needs to be addressed relates to the unsatisfactory manner in which the
relationship between the Government and the Public Sector has developed. Some of this
role confusion has happened because of lack of clarity and political involvement which
undermines morale and professionalism. It is essential that the independence and
professionalism of the Public Sector be restored. A clear demarcation between political
roles and Public Sector roles is needed. This demarcation requires that the Minister‘s
policy-making and strategic management roles are defined by law, with the Public Sector
responsible for delivering outputs and outcomes in accordance with Government
priorities. Legal provision should also be made for removal of political involvement in
day-to-day management of the Public Sector, and a prohibition placed on interference in
merit based selection.
2.1.7 Indigenous Institutions
The Fijian Administration is charged under the Fijian Affairs Act to be responsible for
the good governance and well being of the indigenous people. Good governance in
relation to indigenous Fijian administration is concerned with the application of
principles such as accountability, rule of law, transparency, equity, consensus orientation,
participation, effectiveness and efficiency and responsiveness.
A number of institutions were established to support the advancement of the interests of
indigenous Fijians. Its structure and systems were been designed for this purpose.
However, questions have been raised about whether they are adequate to meet the

27
concerns, needs and aspirations of all indigenous Fijians, including those residing in
urban areas and who have adopted an urban lifestyle.
These institutions include: the (i) Bose Levu Vakaturaga (BLV) (Great Council of
Chiefs); (ii) Fijian Affairs Board (FAB); (iii) Native Land Trust Board; (iv) Ministry of
Indigenous Affairs; (v) Ministry of Provincial Development; (vi) Provincial Councils;
and (vii) business development initiatives such as Yasana Holdings, Vanua Development
Corporation, the Fijian Trust Fund and Fijian Holdings Limited.
Numerous reviews of the Fijian Administration were commissioned by past governments
to examine ways in which the performance of these institutions can be improved. One
such review included the PricewaterhouseCoopers Review in 2000. The
recommendations of this review were not accepted by the Great Council of Chiefs and as
such were not implemented by Government.
A study commissioned by the FAB in 2005 made substantial recommendations on the
institutional strengthening of the Board and the Provincial Councils. These
recommendations were endorsed by Government in 2005 but implementation was
staggered because of the prohibitive cost of the exercise. Questions were also raised on
the effectiveness of the proposed recommendations to address the concerns, needs and
aspirations of all indigenous Fijians.
The Interim Government commissioned the Independent Investigation of Institutions
Fijian (IIIF) in early 2007 to review the roles and to recommend reforms in the Native
Land Trust Board, Fijian Affairs Board, Provincial Councils, and business development
initiatives such as Yasana Holdings. The report by the IIIF has been adopted by the Fijian
Affairs Board. The Board has further examined the report to determine recommendations
that are to be implemented, delayed or eliminated.
In addition, the Interim Government appointed a six member taskforce in 2008 to review
the role of the Great Council of Chiefs (GCC) in its traditional and national role. The
review made recommendations to changes to the membership structure of the Council
and the direction it should take in its traditional and national roles. This was facilitated
through changes to appropriate legislations.
A review of the 2005 restructure proposals for the FAB and the Provincial Councils was
also undertaken in 2008 and there are new recommendations adopted from the report for
implementation. Funding constraints has delayed the implementation of new proposals.
The Ministry of Indigenous Affairs has also put in place a 3 year phased implementation
plan for its re-organization which has been approved and endorsed by the Public Service
Commission.

28
Challenges/Constraints
Most reviews undertaken on Indigenous Institutions suggest significant problems of
underperformance. In a number of institutions there has been low observance of financial
protocols and low participation by stakeholders. Accountability and transparency have
been noticeably lacking across institutions. At Provincial Council level, the style of
operation is top down rather than truly participative. Tikinas have lacked autonomy in
decision-making at grassroot level. The Ministry of Indigenous Affairs recognizes the
need for change but is caught between two mindsets that it must deal with in the
indigenous population. Due to the lack of practice in good governance, in particular
transparency and accountability, as well as a traditional culture of silence, it is not clear
what impact some of the indigenous Fijian institutions are having on the indigenous
population.
The benefits received from these institutions are at times perceived to be unfairly or
unevenly distributed. There are many who express suspicion that in the past, in some
indigenous Fijian institutions, large amounts of money have been lost, either through
mismanagement, corruption, waste or channelling to a small number of elite
beneficiaries. The suspicions are further fuelled by the lack of proper audited accounts -
in some cases for more than 10 years. While some indigenous owned companies such as
Fijian Holdings Ltd and Yasana Holdings Ltd are prosperous, questions remain as to the
degree to which this wealth trickles down to ordinary Fijians.
The indigenous Fijian Administration‘s operating principles are drawn from colonial
times. Then the institutions were concerned with regulation and control of natives in a
society that was used to taking direction rather than making decisions that involved
business judgments. This has far too often created a state of learned powerlessness and
dependency rather than assisting social and economic advancement. This operating
paradigm has also created a lack of initiative and drive.
Leadership values and capacity are also acknowledged to be part of the problem.
Leadership values have tended to favour supporting self-interest and the interests of elites
rather than advancing the common interests of local communities. They have also
favoured autocracy over more participative decision-making. Some of the other
traditional values do not sit well with modern market values. The competitive and work
ethics of capitalism also challenge those with laid back attitudes to life. There is also a
lack of capacity and understanding of the values of business cultures. Arising from such
changes in capacity and culture will come business opportunities.
The dual system of indigenous Fijian Administration is no longer justified. The creation
of a more integrated organisational structure for indigenous Fijian Administration is
warranted rather than continuing with dual bodies, with integrated roles and functions to
be identified in relation to advancing the well-being of the indigenous Fijian people and
their good governance.

29
Strategic Priorities
The adoption of an integrated organizational structure would enable the combining of the
best of traditional culture with the modern values needed to promote economic and social
advancement and good governance. The new institutional framework should be
democratic, inclusive, participative, and entrepreneurial in outlook and dedicated to the
practice of good governance.
The operating paradigm within which these institutions operate needs to change so that it
is more concerned with building local capacity, promoting empowerment and
encouraging at least the more enterprising indigenous people to start taking steps towards
a more entrepreneurial culture.
Giving greater attention to good governance issues should be a top priority in respect of
all institutions that are part of the indigenous Fijian administration. This should include
amongst other issues; the adherence to a framework for good corporate governance,
including a code of conduct and customised guidelines for Provincial Councils; strategic
planning involving the setting of published performance targets; participative dialogue
processes with stakeholders; adoption of more participative and responsive business
practices involving regular consultation with clients on their expectations and on what the
institutions have in fact achieved; proper auditing of accounts; proper management of,
and accounting for, expenditure; and appointment of staff on merit with a focus given to
development of sound human resource management practices.
Some role changes are also needed which includes developing a new Vision and related
policy development; leadership in winning the support of the indigenous people for the
new Vision; operationalising the new Vision, including through a good governance
framework; capacity building and the development of entrepreneurial practices.
2.1.8 Leadership
Good leadership and good governance are inter-related; good governance cannot be
achieved without good leadership. Addressing the issue of leadership is therefore of
great importance to the future of the country.
Leadership does not only occur at the State or national level. While Fiji needs good
leaders at national level to guide and steer, leadership also occurs in the villages, in towns
and cities, in the family, in the private sector, civil society and in churches. The lives of
ordinary people are most affected by leadership at this level. Effective leadership is
therefore needed in a variety of contexts.
Various types of leadership interact in Fiji‘s society. On one hand, there are those who
lead by virtue of their birthright: while on the other hand, there are democratically-elected
leaders who hold office by virtue of election by popular vote. Both sources of leadership
are required, although the basis of their legitimacy differs, as does the scope of their
responsibilities.

30
At all levels, the type of leadership in Fiji is seen as a contributing factor to many of the
country‘s deep rooted problems. Leadership at the national level has always been a
subject of debate even during periods of stable Government. One point of view is that
the style of political leadership in Fiji has, and continues to be, dominated by ethnic
issues solely focused on protecting the interests of one‘s own ethnic community. This
style of leadership has contributed to a failure to act in the best interests of the whole
nation.
The country has experienced four coups in a period of 20 years, which resulted in a
decline in economic performance. Significant human capital is leaving the country, and
much land remains under-utilised. The country‘s multi-racial population has maintained
a certain association for 150 years, but it is one in which neither side feels completely
understood or valued by the other, and few leaders at national level have attempted to
bring the races together in more than a perfunctory, politically expedient manner. Most
educational services, professional associations, and even sporting bodies, are formed
along broadly racial lines. Fiji is a country divided ethnically, religiously, politically,
educationally, socially, and economically.
The failure of transactional leadership in Fiji has also meant that successive regimes have
not addressed the fact that more than 60 percent of Fiji‘s people, of whatever race, are
living close to, or below the poverty line. This is a major concern because there are
enough resources in the country for everyone. However, in governance terms, there is a
problem with resource allocation. Fiji has large human resources and physical resources,
yet leaders have failed to use them effectively.
Leaders also face a number of contradictions between the changing expectations of their
responding to the demands of urbanisation and commerce and to the pressures to
transform Fiji into a modern state. These pressures, which include issues like
globalisation and modernisation, have conflicted with a desire to maintain important
aspects of traditional culture.
Fiji needs leaders who demonstrate the following leadership qualities: being trustworthy,
just, honest, accountable, selfless, competent, open and transparent, and unite groups and
communities. They must be better educated and aware of the effect of globalisation and
modernisation. A leader must also be visionary as they set the direction taken by a
country, community, organisation or group. Leaders must also have the moral courage to
make tough decisions in the national interest.
The need for Fiji‘s leaders to display selflessness is a major challenge – that is, to lead for
the common good and not through self-interest. While the issue cannot be readily
resolved there are measures proposed to ensure that those who come forward to serve as
leaders are not coming forward for purely personal motives and gains.
More direct action is needed to ensure Fiji‘s leaders display those qualities. The ideal is
to have leadership that values sustainable democracy, accountability, and other principles

31
of good governance; that society as a whole appreciates and has shared understanding of
what is good leadership and expects its adoption by those who enter public life and
assume public leadership responsibilities.
Generally, there is a need for clear governance processes, and effective governance
institutions, which involve both the State and its citizens. Greater importance must be
placed on having a governance system based on finding selfless leaders. The public has a
role to play too, through being more vocal about their expectations, and their views on
how leaders are performing.
It is necessary to adopt leadership patterns and behaviours more conducive to reaching
the country‘s shared goals. Elements of this include civic education and improved
performance appraisal systems for public leaders, systems that are able to reward
purposeful leadership and inhibit negative practices through adoption of more effective
codes and laws.
Leaders in Fiji need to employ a more transformational style of leadership that
emphasises inclusiveness and seeks improvements in the economic and social
circumstances of all citizens. This type of leadership is the best way forward for Fiji.
Acknowledging the role of different types of leaders in Fiji, including women, youth,
politicians, religious and traditional leaders, and the need for increased dialogue, is also
relevant.
Specific actions to be taken to encourage good and effective leadership include:
(i) the enactment of a Code of Conduct with appropriate enforcement measures,
which also covers local government office holders;
(ii) the development of a new leadership model more suited to Fiji‘s emerging
development ethos;
(iii)leadership training and education at all levels; and
(iv) at the national level, putting in place greater incentives to attract capable
leaders.

32
2.2 Policy Objectives, Strategies and Key Performance Indicators
2.2.1 Electoral & Ancillary Reforms
Goal: An electoral system that allows for free and fair general elections and ensures
appropriate representation in Parliament and Government
Policy Objectives Strategies Key Performance
Indicators
Free and fair general
elections and
appropriate
representation in
Parliament and
Cabinet.
To establish a new legal
framework that provides for:
a. a new electoral system
that does not discriminate
against voters or
candidates on the
grounds of race or
gender;
b. a voting age of 18 years;
c. a 5-year term for
Parliament;
d. the formation of Cabinet
based on Westminster
principles of
parliamentary
democracy; and
e. appropriate limitations on
the size of Cabinet.
To review the need for a
bicameral Parliament, the
functions of the Senate and
appropriate size of the House
of Representatives.
To build the capacity of
electoral administration
bodies.
Adopt stronger electoral
administrative and regulatory
measures as regards the
implementation of key
recommendations of the
2001 and 2006 International
Observer Missions and SNE
Report.
Adoption of a new
electoral system
A credible national voter
list with biometric data
completed for the next
general election.
Establishment of key
positions within the
Elections Office to
enable effective
performance of functions
by 2011.
General elections under
the new system by
September 2014.
Reduction in the number
of invalid votes from an
average of 10% to below
5% for all future general
elections.
Public disclosure on
reconciliation of ballot
papers printed and used
in general elections.
Public disclosure on
campaign financing and
funding of political
parties.
Full compliance with the
IDEA Five Criteria for
Ethical Electoral
Administration.

33
2.2.2 National Security
Goal: Maintaining national security, peace and stability
Policy Objectives Strategies Key performance Indicators
Improved
coordination to
meet national
security
requirements
Formal establishment of a
National Security Council.
Ratify remaining UN
Counter Terrorism
Conventions and implement
all conventions.
Strengthening of networking
between border and security
agencies, including a review
of current airport and seaport
security arrangements.
Policy advice on law
enforcement issues as
regards strengthening key
point management and
legislation in relation to:
a. Complete
implementation of Anti-
Money Laundering and
Mutual Legal Assistance
(MLA) legislation; and
b. Review MLA treaties.
Adoption of appropriate
counter-terrorism laws.
Strengthen coordination and
effective use of financial data
to secure prosecutions.
Strengthen capacity and
capability to enforce and
prosecute for people-
trafficking.
Develop and maintain
effective disaster
communications and early
warning systems.
Improve coordination for
emergency responses to
natural disasters.
Legal framework
establishing new national
security framework by
2012.
Coordination of all national
security matters through
newly established National
Security Council by 2012.
Complete review of
operational machinery for
border control systems by
2010.
Operational framework for
investigating all terrorist
activities within Fiji in
place by 2014, including
establishment of National
Intelligence Agency by
2010.
90% success rate for
investigating and
prosecuting money-
laundering cases.
Increase detection rate for
intended unlawful entry by
15% annually from 2010 to
2014.
15% annual increase in
number of illegal
immigrants removed from
Fiji from 2010 to 2014.
Review of Disaster
Management Act and
National Plan completed in
2011 and implemented by
2012.
At least 4 natural disaster
training programmes
carried out at all levels
each year from 2010 –
2014.

34
Goal: Maintaining national security, peace and stability
Policy Objectives Strategies Key performance Indicators
Redefining the role
of the military Adopt a new legal
framework clarifying the
relationship between the
military and civilian
Governments.
Formulate and implement a
human security framework
for the RFMF.
Improve the racial balance of
the RFMF.
Constitutional framework
setting out the role of the
RFMF by 2012.
Human security framework
for the RFMF adopted by
2011.
Annual increase in
minority composition
within the RFMF from
2010 to 2014.
Ending the cycle of
coups Implementation of Principles
1, 3 and 7 of the 14 Key
Principles for Ending the
Coup Culture as set out in
the Peoples Charter.
Likelihood of coups
substantially reduced – as
per desired and targeted
outcomes set out above.
2.2.3 Law and Justice
Goal: Maintaining law and order and upholding the rule of law effectively and efficiently
Policy Objectives Strategies Key Performance Indicators
Improved response to
law and order issues. Review and reform
disciplinary processes for
the Police Force and Prisons
Service.
Carry out survey to
determine the true nature
and extent of crime in Fiji.
Improve the reporting of
crime.
Reduce serious crimes
annually.
Improve responses to crimes
against women and children
– upgrading of facilities to
deal with these crimes.
Increase in crime prevention
measures – formulation of a
community policing
framework.
Establishment of a National
Crime Prevention Board.
Establishment of rapid
Reduction in complaints and
disciplinary offences against
disciplined service officers
by 50%.
Police Force and Prisons
Service yearly expenditure
remain within budgetary
allocations.
Maintain a detection rate of
at least 70% per year.
Reduction in overall offence
rate by 20% per year.
70% reduction in serious
crime and road fatalities.
Reduction in crimes against
women and children by 20%
per year.
Reduction in prisons
breakouts by 50%.
Reduce recidivism by 50%.
Annual increase in non-
custodial sentences and

35
Goal: Maintaining law and order and upholding the rule of law effectively and efficiently
Policy Objectives Strategies Key Performance Indicators
response units across Fiji.
Prison service and facilities
to meet international
standards by 2020.
Improve programme for
rehabilitation of offenders
community-at-work orders.
Effective operation of
the courts Greater administrative and
financial autonomy for
judiciary.
Improving accountability
for judicial officers.
More efficient disposal of
cases by the courts.
Implementation of the
Beattie recommendations to
provide greater independence
to the judiciary.
Adoption and effective
enforcement of conduct
standards for all judicial
officers.
Adoption of case
management procedures for
the Magistrates Court to
improve efficiency.
Full implementation of the
recommendations of the
Connors Report to improve
the Magistrates Court.
Improved access to
justice and legal
services
Complete the revision of
Fiji‘s laws and make them
readily available.
Law Reform Commission to
be responsible for the
revision of laws.
Extend the work programme
for the Law Reform
Commission to cover more
issues of national
importance.
Improve accountability for
legal practitioners.
Legal Aid services extended
to all major centres
throughout the country.
Increase public awareness of
basic legal rights.
Upgrading of legal registry
facilities to improve
services.
Revised laws available
through the Internet by 2010
and hard copies published by
2014.
Revision of laws undertaken
annually from 2015.
Complaints against legal
practitioners reduced by
50%.
Legal Aid services provided
in all Magistrates Court
locations throughout the
country by 2014.
Achievement of targeted
outcomes to improve the
services of all legal
registries.

36
2.2.4 Enhancing the Accountability Framework
Goal: Productive and transparent democratic and accountability institutions
Policy Objectives Strategies Key Performance Indicators
An entrenched culture
of democratic good
governance
Teaching good governance
in schools through
incorporation into civic
education curriculum.
Development and
broadcasting of
programmes on good
governance through the
public broadcaster.
Increased support for civil
society involved in
promoting and advocating
good governance.
Improve cooperation with
international and regional
agencies on good
governance projects.
Adoption of 2008 CERD
Recommendations for
compliance with the
Convention for the
Elimination of All Forms of
Racial Discrimination.
Increased public awareness
of principles of good
governance and raising
expectations of
performance by public
officials.
Appropriate number of
programmes to be carried
out annually will be
identified after formulation
of strategies.
Adoption of Anti-
Discrimination law by
2012.
Enhanced public sector
accountability and
participation in
governance
Carry out capacity building
for accountability and
democratic institutions like
FICAC, OAG, Judiciary and
Elections Office.
Adopt Freedom of
Information law.
Adopt a Code of Conduct
law to enforce conduct
standards for holders of high
public office.
Adopt measures to improve
parliamentary oversight
immediately following the
next general election.
Public sector mal-
administration reduced by
10% annually.
Audit queries reduced by
10% annually.
FOI law by 2010.
Implementation of FOI
processes – greater public
access to Government
documents and information –
targeted outcomes to be set
when FOI is implemented.
Code of Conduct law by
2010 – targeted outcomes to
be set when Code of Conduct
is implemented.
Stronger parliamentary
committee scrutiny of public
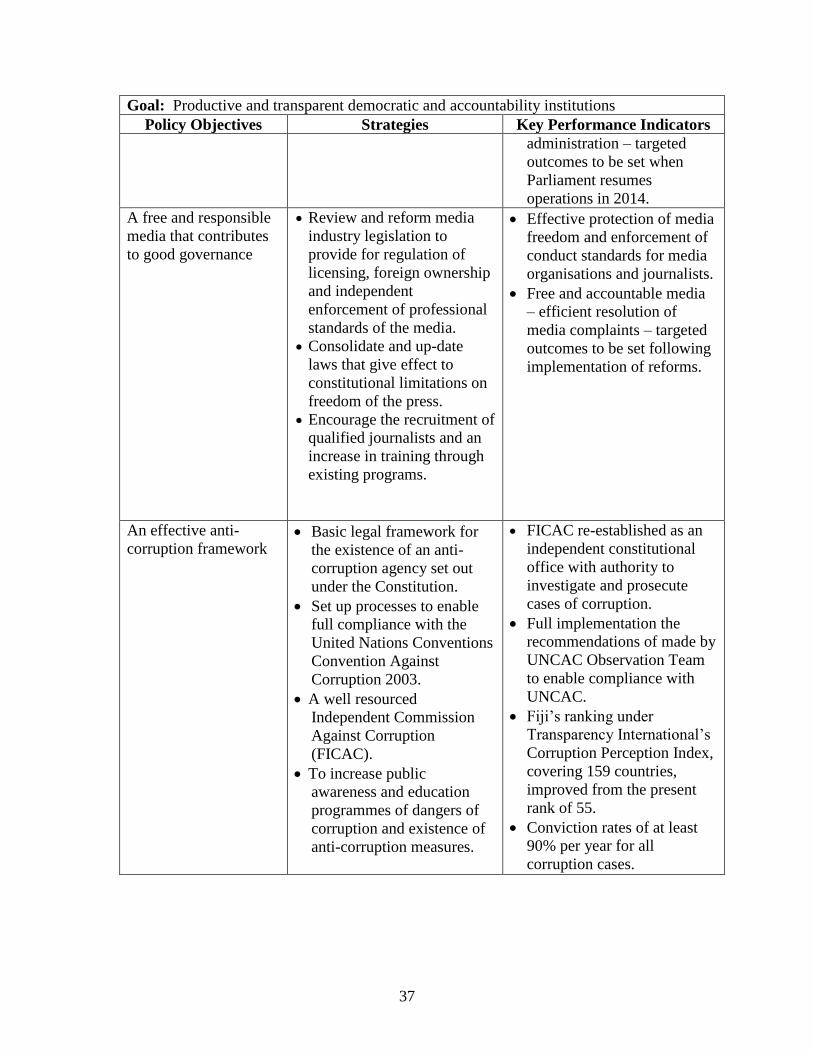
37
Goal: Productive and transparent democratic and accountability institutions
Policy Objectives Strategies Key Performance Indicators
administration – targeted
outcomes to be set when
Parliament resumes
operations in 2014.
A free and responsible
media that contributes
to good governance
Review and reform media
industry legislation to
provide for regulation of
licensing, foreign ownership
and independent
enforcement of professional
standards of the media.
Consolidate and up-date
laws that give effect to
constitutional limitations on
freedom of the press.
Encourage the recruitment of
qualified journalists and an
increase in training through
existing programs.
Effective protection of media
freedom and enforcement of
conduct standards for media
organisations and journalists.
Free and accountable media
– efficient resolution of
media complaints – targeted
outcomes to be set following
implementation of reforms.
An effective anti-
corruption framework
Basic legal framework for
the existence of an anti-
corruption agency set out
under the Constitution.
Set up processes to enable
full compliance with the
United Nations Conventions
Convention Against
Corruption 2003.
A well resourced
Independent Commission
Against Corruption
(FICAC).
To increase public
awareness and education
programmes of dangers of
corruption and existence of
anti-corruption measures.
FICAC re-established as an
independent constitutional
office with authority to
investigate and prosecute
cases of corruption.
Full implementation the
recommendations of made by
UNCAC Observation Team
to enable compliance with
UNCAC.
Fiji‘s ranking under
Transparency International‘s
Corruption Perception Index,
covering 159 countries,
improved from the present
rank of 55.
Conviction rates of at least
90% per year for all
corruption cases.

38
2.2.5 Public Sector Reform
Goal: Improved public sector efficiency, effectiveness and service delivery
Objectives
Strategies
KPI
Improve
performance and
efficiency (cost
effectiveness) of the
Public Service
Public service restructuring
Functional review of
ministries to determine the
most appropriate and
suitable structure
Develop a sequenced PSR
programme for 2010-2014
Strengthen accountability for
performance
Develop leadership capacity
in the Public Service
Promote innovation and best
management practices in
service delivery
Improve policy development
capacity and process
Increased training and
capacity building
programmes
Development and
implementation of a National
Human Resource
Management &
Development Plan
Explore and develop a
performance based pay and
reward systems
Promote public awareness of
benefits of reform
Cost of the public service
reduced by 30% by 2011
(10% annually from 2009-
2011)
Number of civil servants
reduced to 20,000 by 2011
Guideline for the
establishment of Ministries /
Departments
PSR Programme developed by
end 2009
Institutional monitoring and
evaluation frameworks
developed
Leadership Development and
Training Plan by end 2010
Service wide
implementation of the Service
Excellence Framework
National HRMD Plan
developed by December 2009
Introduction of Service
Charters in each agency by
end 2010
Reorganization of public
sector training based on
Capacity Needs Assessment
and addressing specific and
position related skills
development.
Accelerate the public
enterprise reform
programme and
improve profitability
and accountability of
Public Enterprises
Regular reviews and
improvements to PER
processes
Divest public entities
Outsource government
activities
Develop a contracting out
framework
Corporatisation of key
problem areas of water
Simplified public enterprise
restructuring process by June
2009
3-5 public entities sold into
private ownership by 2012
3-5 government activities to
be outsourced by end 2010
Framework developed by end
2009
Water services corporatised by

39
Goal: Improved public sector efficiency, effectiveness and service delivery
Objectives
Strategies
KPI
and roads
Introduce specially
negotiated profit/return
targets for public enterprises
Reward incentives to be
based on achievement of
specially negotiated targets
Develop a National Code of
Corporate Governance
Training and capacity
building programmes for
employees of public
enterprises
Further reform of existing
public enterprises to improve
efficiency and profitability
Improvement in synergies of
public enterprises in
agricultural
production/processing to
ensure food security
end 2010
Roads corporatised by end
2011
Improved returns and profit
generated from each enterprise
Individual profit/return targets
set by March of each year
Code developed by September
2009
3-5 enterprises to be further
reformed annually
10% growth in
production/processing of local
produce
Improve public
financial
management
practices
Strengthen expenditure
control and enhance budget
discipline.
Improve revenue
management and explore
revenue retention by
agencies
Strategic resource allocation
in line with policy priorities
Improve cash planning and
management
Introduce strategic budget
management practices
Strengthen accountability of
Chief Accounting Officers
Improved whole of
government financial controls
and reporting by 2012
Reduced revenue arrears
Revenue retention activated
when feasible
Resources allocated to priority
sectors
Gradual introduction of
performance budgeting
Strengthen financial
accountability clause in PS‘s
annual contracts
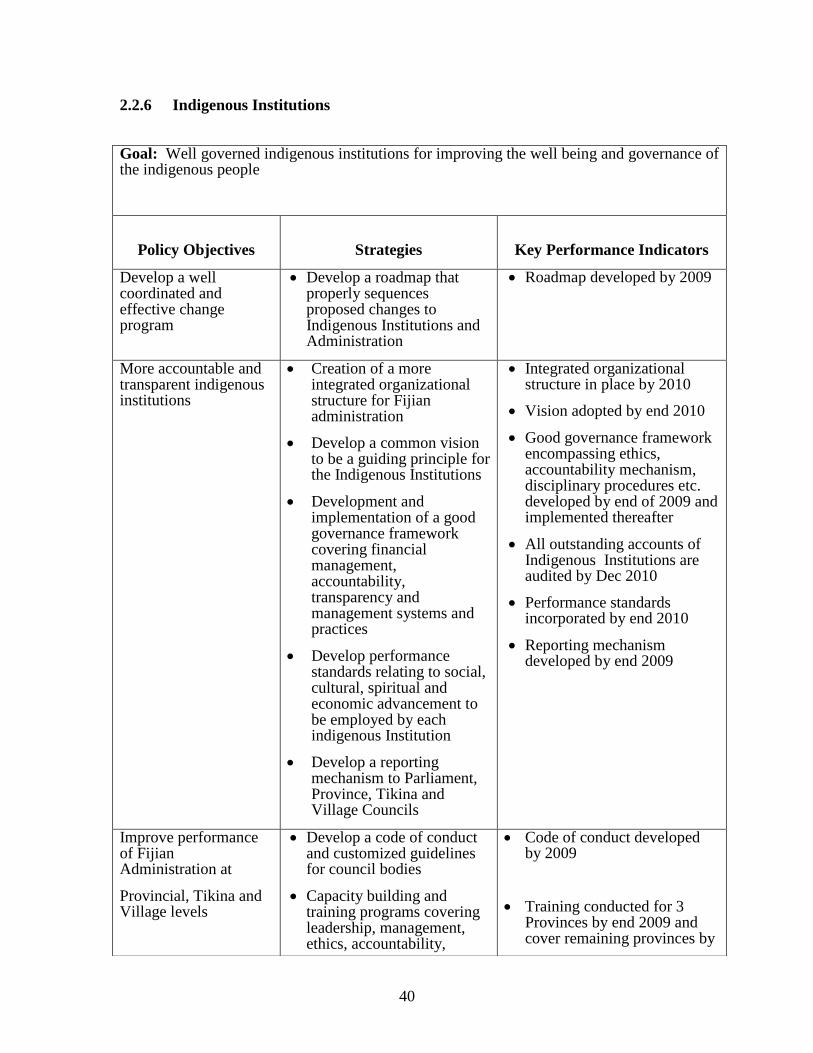
40
2.2.6 Indigenous Institutions
Goal: Well governed indigenous institutions for improving the well being and governance of the indigenous people
Policy Objectives
Strategies
Key Performance Indicators
Develop a well coordinated and effective change program
Develop a roadmap that properly sequences proposed changes to Indigenous Institutions and Administration
Roadmap developed by 2009
More accountable and transparent indigenous institutions
Creation of a more integrated organizational structure for Fijian administration
Develop a common vision to be a guiding principle for the Indigenous Institutions
Development and implementation of a good governance framework covering financial management, accountability, transparency and management systems and practices
Develop performance standards relating to social, cultural, spiritual and economic advancement to be employed by each indigenous Institution
Develop a reporting mechanism to Parliament, Province, Tikina and Village Councils
Integrated organizational structure in place by 2010
Vision adopted by end 2010
Good governance framework encompassing ethics, accountability mechanism, disciplinary procedures etc. developed by end of 2009 and implemented thereafter
All outstanding accounts of Indigenous Institutions are audited by Dec 2010
Performance standards incorporated by end 2010
Reporting mechanism developed by end 2009
Improve performance of Fijian Administration at
Provincial, Tikina and Village levels
Develop a code of conduct and customized guidelines for council bodies
Capacity building and training programs covering leadership, management, ethics, accountability,
Code of conduct developed by 2009
Training conducted for 3 Provinces by end 2009 and cover remaining provinces by

41
2.2.7 Leadership
professionalism etc to be conducted for different levels of administrators
end 2011
Empowerment of Indigenous Fijians to fully utilize their resources for their economic and social advancement
Undertake social audit of life at village level, upon which to base training and capacity building programs
Continuous training and capacity building to develop business and entrepreneurial skills and corporate governance
Increased involvement of the Indigenous population in business and commercial ventures
Social audit conducted
Training programmes implemented
Increase in number of viable businesses registered under the IFBC
Goal: Effective, enlightened and accountable leadership
Policy Objectives
Strategies
Key Performance Indicators
Rebuilding a committed, visionary, highly competent and more accountable leadership group
Develop new models of political, public and traditional leadership
Public Awareness/Civic education programme on leadership qualities
Develop and implement a Public Sector Leadership Development Programme to be mandatory for the varied levels of senior executives in the Civil Service (US04 & above)
Develop Leadership Models
Continuous public awareness
Training programmes developed by June 2009 and implemented by September 2009
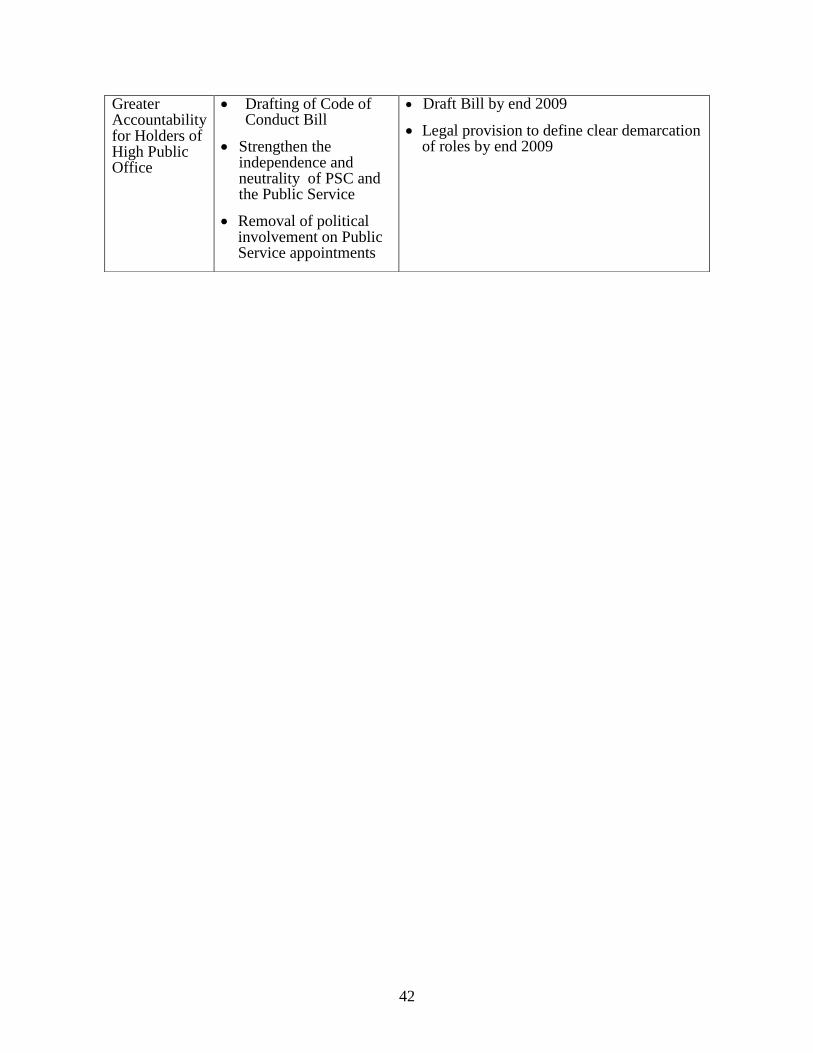
42
Greater Accountability for Holders of High Public Office
Drafting of Code of Conduct Bill
Strengthen the independence and neutrality of PSC and the Public Service
Removal of political involvement on Public Service appointments
Draft Bill by end 2009
Legal provision to define clear demarcation of roles by end 2009

CHAPTER 3

43
Chapter 3 Economic Development
3.1 Macroeconomic Performance
3.1.1 International Economy
The world economy performed relatively
well between 2001 and 2007 with
exceptional performance from emerging
markets such as Russia, China and India.
In 2008, a number of challenges emerged
for the global economy as it started
slowing down. The world economy fell
into a recession in 2009 as problems from
the United States sub-prime mortgage
market spilled into other credit markets.
At the same time prices of food and oil
surged adding to inflationary pressures worldwide creating severe hardships for many low-
income countries. World growth since 2001 and forecasts by IMF until 2011 are reflected in
Figure 3.1.
Global growth prospects continue to remain weak, despite wide range of policy actions taken
by governments. Our major trading partner economies, except China and India are expected
to also contract in 2009 as a result of the financial crisis with global contraction forecasted at
1.4 percent. In 2010 economies are expected to record marginal growth with continued
recovery thereafter. Prices have somewhat declined as a result of global slowdown being
experienced. Commodity prices remain weak; however, crude oil prices are making gains as
demand recovers.
3.1.2 Regional Economy
The GDP performance of major island
economies has generally been positive
since 2001. Fiji‘s economic performance
between 2001 and 2006 was relatively
stable although it performed only better
than Vanuatu and Papua New Guinea.
The Solomon Islands, in particular, has
reported exceptional growth since 2003
and is expected to manage the effects of
the global downturn with relative ease.
The downturn in regional economies from 2009 onwards (Figure 3.2) resulting from the
global financial and economic crisis is likely to be more severe than anticipated as demand
for Pacific export commodities, tourism arrivals and remittances decline.
-2
0
2
4
6
Pe
rce
ntag
e C
hang
e
Figure 3.1: World GDP 2001-2011(Constant Prices - PPP Adjusted)
Source: World Economic Outlook Database April 2009
-10
-5
0
5
10
15
20
01
20
02
20
03
20
04
20
05
20
06
20
07
20
08
20
09
20
10
20
11
Pe
rce
nta
ge C
han
ge
Figure 3.2: Major Regional Economies 2001-2011(Constant Prices)
Fiji
Samoa
Papua New GuineaTonga
Vanuatu
Solomon Islands
Source: World Economic Outlook Database October 2009

44
The recessionary effects in island
economies are more pronounced given the
slowdown in Australia and New Zealand.
These economies are the largest sources of
visitors for Pacific tourism. The actual
and forecast economic growth rates of
Australia and New Zealand for the period
2001 to 2011 are shown in Figure 3.3.
The risks of slowdown in tourism and
lower than expected prices of
commodities for the island economies are expected to remain in the medium term.
3.1.3 Domestic Economy
Fiji‘s economic growth performance has
remained relatively weak since 2001
averaging only 1.7 percent growth until
2008 (Figure 3.4). The sluggish growth in
recent years has largely been a result of
declining contributions from sugar and
garment industries. These declining
contributions have not been offset by
modest growth in other sectors such as
tourism, bottling water and biscuit
manufacturing in recent years. Fiji
economy has continued to contract since
2007 with a 2.5 percent contraction expected in 2009. The economy is expected to recover
from 2010.
Historically, Fiji enjoyed preferential market access to the EU for sugar and the US for
garments. However, with progressive decline and elimination of these preferences, the
performances of sugar and garment industries have declined resulting in lower GDP growth
rates.
Since 1990 Fiji has looked outward for an export led growth strategy; however, economic
growth rates have on average been lower than the preceding period. Since 2007, government
has made efforts to implement institutional reforms to facilitate sustained economic growth.
Setbacks to such efforts have been a result of natural disasters and global economic
slowdown. The socio-economic progress of the nation is dependent on how the domestic and
external challenges are managed in partnership with the private sector.
Government‘s focus in economic development will encompass:
1. Enhancing development cooperation throughout the government machinery;
2. Emphasizing rural development to prevent excessive rural-urban shift of the workforce;
3. Maintaining macroeconomic stability;
4. Implementing the National Export Strategy;
5. Supporting the agricultural sector;
6. Reforming the sugar industry;
7. Developing and strengthening the Financial Sector;
-3
-2
-1
0
1
2
3
4
5
6
20
01
20
02
20
03
20
04
20
05
20
06
20
07
20
08
20
09
20
10
20
11Pe
rce
nta
ge C
han
ge
Figure 3.3: Australia and NZ GDP 2001-2011(Constant Prices)
Australia New Zealand
Source: World Economic Outlook Database October 2009
-4.00
-2.00
0.00
2.00
4.00
6.00
Pe
rce
nta
ge C
han
geFigure 3.4: Domestic GDP 2001-2011
(Constant Prices)
Sources: Fiji Islands Bureau of Statistics and Macro Policy Committee

45
8. Facilitating domestic investment;
9. Encouraging foreign investment; and
10. Making available unused but productive land of all classes while ensuring that returns to
landowners are market based.
3.1.4 Private Consumption
Private consumption has been steadily
increasing since 2001. Figure 3.5 shows
the level of private consumption for the
period 2001-2011. The estimates,
reported for 2006-2011 period have been
based on actual and forecasted VAT
collections.
There is concerted effort from
government to encourage consumption of
locally grown and manufactured products
to provide development opportunities for
local farmers and industries. The recent devaluation of the Fiji dollar with a view to
discourage imports is also expected to raise consumption of domestically grown and
manufactured products.
3.1.5 Inflation
Inflation has been relatively stable apart
from fuel price related increases in 2003
and compounded food and fuel price
increase in 2008 (See Figure 3.6). The
Reserve Bank of Fiji through its prudent
monetary policy measures continues to
maintain inflation at low levels for
pressure emanating from the domestic
front. Low trading partner inflation as
well as softer international commodity
prices has also helped in keeping Fiji‘s
overall inflation low. The global
economic slowdown in late 2008 and
2009 has led to fall in prices in general. In 2009, the May inflation rate was at 0.8 percent.
The rate rose to 6.3 percent in October, reflecting the effect of the 20 percent devaluation of
the Fiji dollar. In the coming months, prices are expected to rise and the year end inflation
rate is projeved at 9.5 percent before moderating to 2.0 percent at the end of 2010.
3.1.6 Investment
Capital accumulation through the investment process is a vital ingredient for economic
growth. In the period 2001 to 2005 total investment averaged over 18 percent of GDP (see
Figure 3.7). This increasing trend is likely to continue with recent increases in investments by
Government and public enterprises such as the Fiji Electricity Authority and the Housing
Authority. Public sector investments of this nature are crucial for the proper functioning of the
-
500,000
1,000,000
1,500,000
2,000,000
2,500,000
3,000,000
3,500,000
Figure 3.5: Private Consumption
Sources: Fiji Islands Bureau of Statistics and Ministry of National Planning
0.0%
2.0%
4.0%
6.0%
8.0%
10.0%
Pe
rce
nta
ge C
han
ge
Figure 3.6: Consumer Prices 2001-2009
Source: Fiji Islands Bureau of Statistics

46
market system to supply social and economic infrastructure to facilitate and implement private
investment plans.
The Government‘s capital expenditure is
expected to be in excess of $300m from
2009 onwards which will provide further
impetus for growth and development.
Private sector investment, which has
greater impacts on job creation and
growth than public sector investment
increased steadily from 2001 to 2005.
Greater infrastructural support from
Government and restructuring of the
public sector, which essentially transfers
assets and business opportunities to
private sector, will also induce higher levels of private investment.
Private investment levels are functions of savings and in recent years real interest rates on
savings have been negative. Savings levels are expected to increase with recent monetary
policy requirement that interest rate spreads be reduced to 4%. Should inflation remain low
positive real interest rates would encourage greater savings behavior.
3.1.7 Interest Rates
Interest rate spreads have historically
been more than four percent in our
domestic market while trends from
trading partner economies indicate that
banks generally have spreads of 2 percent
or even less. In only 2006 did interest
rate spreads reduce significantly but
increased again thereafter. In April 2009,
the RBF took measures to control the
lending rates of banks and other financial
institutions to assist the business sector
have a more conducive and stable interest
rate environment. The weighted average
interest rates of the banks are to be at their December 2008 level by the end of July 2009. The
interest rate spread is to be four percent by the end of 2009. Liquidity in the financial system
reached critical levels in late March 2009; however, measures taken thereafter led to
improvements to sustainable levels.
Although interest rate spreads have been regulated to be no more than four percent before the
end of 2009, the regulated spread is still much higher than international trends. Given the
fallout in the global financial market it has become apparent that earlier citations by
commercial banks that Fiji represented a risky financial market are irrelevant. All bank
lending are backed up with sufficient collateral and the riskiness depends on the banks own
lending procedures.
0
2
4
6
8
10
20
01
20
02
20
03
20
04
20
05
20
06
20
07
20
08
No
v
Inte
rest
Ra
tes
Figure 3.8: Commercial Bank Interest Rates 2001 -Nov 2008
Average Lending RatesTime Deposit Rates
Source: Fiji Islands Bureau of Statistics
0
100
200
300
400
500
600
700
800
900
1000
2001 2002 2003 2004 2005
F$ M
illio
ns
Figure 3.7: Investment 2001-2005
Private Sector
Public Enterprises
Government
Source: Fiji Islands Bureau of Statistics
0.001.002.003.004.005.006.007.008.009.00
10.00
Inte
rest
Ra
tes
Figure 3.8: Commercial Bank Interest Rates 2001 - Aug 2009
Average Lending Rates
Time Deposit Rates
Source: Reserve Bank of Fiji Quarterly

47
Apart from interest rates, the banks also need to establish Local Advisory Boards – who will
advise the banks on matters of national interest. Banks are also expected to have a complaints
process in place which will be monitored by the Reserve Bank. All increases in fees and
charges will need to be fully justified. Banks also need to establish microfinance units in their
branches. The banks and financial institutions‘ operations are expected to align to national
objectives and in the current environment to assist in the recovery process.
3.1.8 Government Revenue and Expenditure
Government revenue has been steadily increasing since 2001, in line with economic activity
and revenue policies. However, significant revenue losses were incurred as a result of
concessions granted by government, generally to large businesses. Concessions and
corporate taxes are being reviewed to ensure equity among all enterprises operating in Fiji.
This will improve compliance and reduce
procedures and costs associated with the
establishment, application and assessment
of concessions. Figure 3.9, shows the
increases in government revenue against
actual and budget expenditure mix. There
is however, a slowdown noted since 2007
as a result of reduced economic activity.
There has been a significant change to
government expenditure composition in
the last few years. There is marked
slowdown in operating expenditure over
the 2007-2009 period with further reductions anticipated in future. This is offset by a greater
emphasis on capital construction, particularly infrastructural development. Although 2010-
2011 capital budgets are yet to be finalized, it is expected to be similar, if not more, in value
to the 2009 capital budget as the importance to increase the capital base for sustainable
economic growth is now being realized. The aging infrastructure has strong cost implications
on the forecast budget surpluses of 2010 and 2011.
3.1.9 Debt Position
Between 2001 and 2006 government debt
as a percent of GDP rose by 4.6
percentage points with nominal value
increase of $1.21 billion. This represents
an annual increase in debt stock by $200
million. Debt as a percentage of GDP
declined over 2007-2008. Further
borrowings are intended in 2009 and
beyond to complete the government‘s
intended infrastructure development
program. Government borrowings will
only be targeted at investment projects so
that developments are able to contribute to
-
500.0
1,000.0
1,500.0
2,000.0
20
01
20
02
20
03
20
04
20
05
20
06
20
07
20
08
20
09
20
10
e
20
11
e
Mil
lio
ns
Figure 3.9: Government Revenue & Expenditure 2001-2011
Operating Expenditure
Capital Expenditure
Source:Governmentof Fiji Budget Estimates
40%
42%
44%
46%
48%
50%
52%
54%
0
500
1000
1500
2000
2500
3000
3500
2001 2002 2003 2004 2005 2006 2007 2008
Pe
rce
nt
of
GD
P
F$
Mil
lio
ns
Figure 3.10: Government Debt Position 2001-2008
Total Debt Debt to GDP Percent
Source: Government of Fiji Budget Supplements
-
200.0
400.0
600.0
800.0
1,000.0
1,200.0
1,400.0
1,600.0
1,800.0
2,000.0
Mil
lio
ns
Figure 3.9: Government Revenue & Expenditure 2001-2011
Capital Expenditure
Revenue
Revenue
0.00%
10.00%
20.00%
30.00%
40.00%
50.00%
60.00%
0
500
1000
1500
2000
2500
3000
3500
Pe
rce
nt
of
GD
P
F$ M
illio
ns
Figure 3.10: Government Debt Position 2000-2008
Total Debt Debt to GDP Percent
Source: Budget Supplement - various years

48
sustained economic growth upon completion. The international borrowing commitments are
expected to increase as a result of our devalued currency but the increases will be sustained
through effective financial management.
3.1.10 Trade
Domestic exports have been declining for
most years since 2001. Further decline is
expected in 2009 with some recovery in
the following years as a result of the
devaluation of the Fiji dollar. The
decline in exports is largely underpinned
by reduced sugar and garment
production. Sugar production is affected
by inherent industry problems
compounded with declining preferential
prices from the EU. Garment
production, on the other hand, has
contracted as a result of declining
preferences under SPARTECA
arrangement and the inability of our
domestic producers to compete with Asian exporters, such as China.
The depressed global conditions have translated into reduced demand for our ground water,
fish and mahogany. Significant efforts would be required in the implementation of the
National Export Strategy to induce growth in domestic exports.
Imports have been rising continuously except in 2007, which coincided with significant
economic decline. The increased importation has been attributed to growing demand from
the tourism industry as well as rising food and fuel prices.
Our exports have been around $1 billion; however, imports in recent years have exceeded $3
billion implying trade deficits in excess of $2 billion (see Figure 3.11). It is envisaged that
the devaluation of the Fiji dollar will result in a shift of demand from imports to local
produce and manufactured goods.
3.1.11 Foreign Reserves and the Exchange Rate
Foreign reserves are necessary for Fiji‘s
transactions with the rest of the world.
The value of foreign reserves is a net
result of foreign demand for our products
and domestic demand for imported
products. Exchange rates are established
accordingly taking into account our
ability to accept all offers of our
currency at the set rate. Except for 2003-
2004 and 2007, reserve levels have been
declining on an annual basis since 2001.
The growing trend in imports is causing
0
500
1000
1500
2000
2500
0
500
1000
1500
2000
2500
3000
3500
4000
20
01
20
02
20
03
20
04
20
05
20
06
20
07
20
08
20
09
20
10
20
11
De
fici
t (m
illi
on
s)
Imp
ort
s a
nd
Ex
po
rts
(mil
lio
ns)
Figure 3.11: Trade and Trade Deficit 2001-2011
Deficit
Imports
Exports
Source: Fiji Islands Bureauof Statistics and Macro Policy Committee
0
1
2
3
4
5
6
7
0
200
400
600
800
1000
1200
20
01
20
02
20
03
20
04
20
05
20
06
20
07
20
08
20
09
Mo
nth
s
F$ M
illio
ns
Figure 3.12: Foreign Reserves 2001 - 2009 (May)
Reserve Level Months of Cover Source: Reserve Bank of Fiji
0.0
500.0
1000.0
1500.0
2000.0
2500.0
0.0
500.0
1000.0
1500.0
2000.0
2500.0
3000.0
3500.0
4000.0
De
fici
t (m
illi
on
s)
Imp
ort
s a
nd
Ex
po
rts
(mil
lio
ns)
Figure 3.11: Trade and Trade Deficit 2001-2011Deficit
Imports
Exports
Source: Fiji Islands Bureau of Statistics and Macro Policy Committee
0
1
2
3
4
5
6
7
0
200
400
600
800
1000
1200
1400
Mo
nth
s o
f C
ov
er
$F
mil
lio
ns
Figure 3.12: Foreign Reserves (2000 - October 2009)
Sources: Fiji Islands Bureau of Statistics and Reserve Bank of Fiji

49
depletion in our reserve levels. Devaluation of 20 percent, undertaken in April 2009, resulted
in improvements in reserve levels. Foreign reserves prior to devaluation were sufficient to
cover only 1.3 months of imports. As a result of adjustments in the value of our currency,
import levels in the following months declined as higher prices translated into the domestic
market and export levels will improve as
a result of improved competitiveness of
our domestic exports.
The foreign reserves were at $1030
million at the end of October 2009. Since
the devaluation in mid April devaluation,
the trend has been rising steadily.
The Fiji dollar is pegged to a basket of
currencies (Australian dollar, New
Zealand dollar, US Dollar, Japanese Yen
and Euro). The weights of the basket are based on Fiji‘s exposure to trade and tourism with
these countries. The Nominal Effective Exchange Rate (NEER) index has remained fairly
stable since 2001 but indicating relative appreciation in value of currency until 2007. The
April 2009 index indicates a post devaluation adjustment to the 2008 indices. The decline in
indices is not as substantial as the percentage devaluation as a result of currency appreciation
in the early months of the year.
3.2 Sectoral Developments
3.2.1 Macroeconomic Management
Macro-economic management in the short term is focused on achieving financial stability and
securing government finances. Key macroeconomic indicators are discussed in Section 3.1.
The major challenges for the medium term are to maintain prudent monetary and fiscal
management in order to protect exchange reserves, continue with low inflation, and ensure
sustainable fiscal deficit and debt levels. The medium-term approach by Government
recognizes the importance of consolidating fiscal policy, increasing export earnings and
minimizing imports to reduce the widening trade deficit.
3.2.2 Tourism
Tourism in Fiji is a myriad of partnerships between a diverse range of private sector
businesses, the communities and government. It has grown steadily over the past few years, it
has recovered from a significant decline following the 2000 coup with growth in visitor
numbers and economic contribution and strong investment in infrastructure.
However, the tourism industry has had to face a number of challenges since 2006 to remain
globally competitive. These include the advent of the Hotel Turnover Tax in 2006, loss of
price competitiveness, global financial crisis and adverse publicity in the major source
markets.
Against this backdrop, the tourism sector recorded the highest number of visitor arrivals of
585,031 visitors in 2008, an increase of 6.6% compared to 2006 visitor arrivals. The
0.00
20.00
40.00
60.00
80.00
100.00
120.00
Ind
ex
Figure 3.13: Real and Nominal Exchange Rates 2001 - April 2009
NEER
REER

50
increased numbers were primarily driven by lucrative packages offered by the industry, with
prices reduced by as much as 40%.
The strong performance is expected to continue into 2009 with Fiji Visitors Bureau
projecting 600,000 visitor arrivals. However, the destruction caused by the floods in early
2009 severely affected arrivals for the 1st quarter with FVB revising the visitor arrivals to
540,000.
The 2007 census recorded that 21,460 people or 2.6% of the total population are working in
the tourism industry. The industry contributes around 18.4 % of GDP, with $741.7 million
earnings in 2006 having estimated tax revenue to government of $140million.
The Tourism Development Plan 2007-2016 was prepared on the basis of two phases: a
recovery period in 2007-2009 in which visitor numbers will recover to at least 550,000
annually. Development of Eco-Tourism will be targeted through various programs and
initiatives within Government.
The recent devaluation of the Fiji Dollar is anticipated to derive more positive economic benefits to the tourism industry. As a result of the devaluation, Fiji holidays will become
relatively cheaper and therefore more competitive against similar destinations.
The devaluation however, may also have an adverse impact in driving up the cost of food and
beverages at hotels, which according to international standards are already highly priced. This
presents an opportunity for the local agriculture sector if they can overcome the constraints of
inconsistent supply and maintain product quality and standard. The Ministry of Agriculture
has been working hard to strengthen this linkage between the tourism industry and the
agriculture sector.
Development Constraints and Challenges
The development constraints and challenges include:
Major and on-going Brand Fiji marketing campaign;
Global financial crisis;
HINI turning into a pandemic;
Major growth in key source markets and at least two new source markets;
Attractive investment incentives and proactive approval process;
Supporting infrastructure and domestic (air, land and sea) transport linkages;
Constant supply of trained staff;
Additional capacity on existing airline routes and new routes established; and
Negative travel advisories from key source markets such as Australia and New
Zealand.
3.2.3 Manufacturing and Commerce
Manufacturing is a major sector, contributing 13% of GDP in 2008. The sector includes
manufacture of textiles, garments, footwear, sugar, beverages and tobacco, food items, wood
and metal-based products. A decline in the manufacturing industry is expected due to the
global financial crisis and subdued domestic demand and in the export markets.

51
The devastation caused by the flash floods in January 2009 has exacerbated the projected
slowdown in the industry creating pessimism in the outlook for trade. However, the dollar
devaluation presents opportunities for our export sector as exports will be competitive and
cheaper in the global marketplace. This will depend on the developments in the global market
and the competitiveness of Fiji‘s products.
The limited investment and technological innovation has constrained the labour absorption
capacity of the manufacturing sector. This lack of capacity has increased poverty and
unemployment, especially in urban areas. Two persistent factors, the transition away from
high-cost industries that are heavily dependent on imports and the impact of globalization on
domestic industries that is unable to compete with imported substitutes, have contributed to
the limited growth of domestic production and employment.
The effective implementation of the National Export Strategy using the opportunities
available from currency devaluation will assist in export growth. Incentives are available to
domestic producers in manufacturing and agriculture to exploit opportunities provided by the
numerous bilateral and multilateral trade agreements.
Development Constraints and Challenges
The manufacturing sector has a lot of growth potential. However, these are constrained by the
following:
delayed reforms of the sugar industry;
the inability to find a resolute way forward for the mahogany industry;
the continuous shrinking of markets for Fiji‘s textile, clothing and footwear industry;
the weak linkages existing between the natural resource sectors and the manufacturing
sector;
time taken to register business is very long due to outdated regulations and legislation;
and
lack of market support for agro-based products.
3.2.4 Information and Telecommunications
Information
Of crucial importance to Government is maximum public awareness of Government‘s plans,
programmes and policies. This awareness is deemed vital as it contributes to an informed
public and ultimately impacts positively on social and economic development of the country.
To this effect, the media plays a vital role in economic development and national unity
through its influence. It is in recognition of this fact, that the media is being co-opted as a
development partner.
Telecommunications
The greater use of Information and Communications Technology (ICT) is essential for social
and economic development in Fiji. The contribution of the communication sector to GDP was
3.4 percent in 2008, an improvement from the 0.2 percent decline noted in 2007. The growth
of the sector is expected to remain around 3.5 percent in 2010. The developments in
communications sector is characterised by the increased usage of cellular phones. This has
been facilitated by the commencement of operations by Digicel (Fiji) Ltd and INKK Mobile
(Fiji) Ltd.

52
Access to traditional ICTs such as radio and television is high. Over 90% of households are
estimated to have a radio and over half the population has access to television. Internet use is
increasing and people are also becoming more exposed to ICTs through their mobile phones
and use of text messages. Electronic transactions in Fiji have also become widespread,
spearheaded by the banks.
ICTs have the potential not only to create new jobs through call centres and other related
activities, but also to empower rural dwellers with information and provide low-cost tele-
services. The adoption of ICT is also the key to improving productivity, especially in the
public sector. Government intends to deliver as many online services as possible and make
greater use of ICT in order to improve internal processes.
The current initiative of Government to develop the ICT sector further and the institution of
the e-Commerce Bill will ensure that the interests of suppliers and buyers engaged in
transactions over the internet are adequately protected. E-community learning centres are
being established in rural areas to enable communities to access information, public services,
and business products and services on the internet.
Recently, an agreement has been reached between Amalgamated Telecom Holdings (ATH)
and Government for new competitors in the telecommunications sector. As a result,
VoiceNetIP (Fiji) Limited has been given the VOIP licence with the intention to bring
maximum benefits and savings to businesses and individuals.
The IT Advisory Council (ITAC), set up in 2001 includes representatives of key Government
ministries, the academic community and the private sector. The ITAC has drafted an ICT
Policy with the vision ―to harness Fiji‘s ideal geographic location, competent workforce and
world-class information technology infrastructure to promote Fiji‘s international
competitiveness and create a dynamic, vibrant and well-connected e-society‖.
A review of frequency transmission has been undertaken by the Communications
Department with a view to allocate bands and frequencies such that it allows greater
transmission activity.
Development Constraints and Challenges
Information
Strengthening long-term partnership with the media industry
Improving the quality of reporting
Adherence to media ethics and professional standards
Expanded coverage of government activities through the mainstream media
Telecommunications
High cost of telecommunications and associated activities
Monopolistic framework for telecommunications
Lack of awareness about the benefits of ICT

53
3.2.5 Micro, Small and Medium Enterprises
The development of Micro, Small and Medium Enterprises (MSMEs) is crucial to national
development especially in improving the quality of life of the people endowed with low
capital. Substantial untapped opportunities remain for the sector to expand and grow,
particularly in rural areas where natural resources remain under-utilized. The Government has
identified MSMEs as a priority area for making development more balanced and broad based.
Through the Small and Micro Enterprise Act of 2002, the National Center for Small and
Medium Enterprise Development (NCSMED) is the primary vehicle through which
Government policies and strategies for MSMEs are implemented. Among other
responsibilities, NCSMED is tasked to provide training in entrepreneurship and management,
business advisory services, support the private sector in developing MSMEs, provide loans
and grants to MSMEs, and develop new business opportunities through pilot projects.
The Microfinance Unit of NCSMED has formed partnerships with various financial
institutions for the delivery of microfinance services. This includes 3 microfinance
institutions and 6 microfinance service providers and together they cover 13 major areas in
Fiji, in which 382 communities/settlements have access to the service. At the end of June
2009, the microfinance program had more than 22,229 savings clients with savings totalling
$988,802.
The Business Incubation Centres (BICs) provide office space for small businesses, support
services such as training, business counselling, networking and specialist advice. BICs have
been set up in Ra and Suva.
The challenge for the MSME sector is to create a facilitative environment where educated
young people, as a first option, choose to operate a micro enterprise and engage in self-
employment than relying on formal sector employment. This requires greater institutional
support and access to financial services.
Development Constraints and Challenges
The development of MSMEs is constrained by the following:
Under developed financial sector to offer the range of services suitable for MSMEs;
Lack of sufficient support services such as business mentoring;
Poor financial management skills of MSME operators;
Lack of knowledge about the existence of MSME service providers; and
Lack of statistics on the MSME sector.
3.2.6 International Relations and External Trade
Fiji‘s relationships with the international community has been challenging given our relative
smallness and isolation from major economies. The relationships have been further
constrained as a result of the recent political developments, particularly with neighbouring
nations like Australia, New Zealand and Samoa and traditional development partners like the
United States of America (USA), the United Kingdom (UK) and the European Union (EU).
Strategic engagement with the international communities and traditional development
partners under the principles of internationalism and sovereign dignity remains critical. A
new legal order exists with a clear framework for change and achieving parliamentary

54
democracy by September 2014 has been presented. It presents a clear foreign policy
framework focused on enhancing global integration and international relations with the
objective of regaining Fiji‘s rightful place in the regional and international family of nations.
The immediate challenge is to regain lost credibility and focus on restoring its traditional
relationships by advocating Fiji‘s interests in regional and international institutions such as
Pacific Islands Forum (PIF) States, the Commonwealth, the Africa, Caribbean & Pacific
(ACP) Group, the EU, and the United Nations (UN).
Global economic conditions and the erosion of the preferences and other constraints for trade
and market access restrictions due to non-tariff barriers applied by many countries have been
key challenges in the areas of trade and investments. Adverse advisories and travel bans on
those assisting with rebuilding Fiji have also had very negative implications. Trade
agreements will be treated with caution to consider first the increasing costs of participation
that at times supersedes the potential benefits. However, limited negotiating capacity will be
efficiently and effectively invested in areas where there are market access and strategic
economic gains to be made. The costs of participation are a result of multiple rules,
obligations, technical standards and requirements for market entry. Despite these, trade will
be facilitated through quarantine protocols and customs, ports and immigration agencies will
be strengthened.
Understanding of our development and trade partners are sought and government will
continue to focus on restoring relationships with the global family through participation in the
international fora, respecting the provisions of international treaties and fostering mutually
beneficial bilateral and multilateral trade and diplomatic relationships .
There is need for Fiji to strengthen Aid for Trade relationships and secure development
assistance through the bilateral and multilateral arrangements. Fiji‘s foreign missions and
trade offices will need to play more proactive roles in securing trade development assistance
and at the same time tapping into supply of labour from Fiji for work overseas.
Development Constraints and Challenges
Inadequate border control
Global economic conditions
Lack of experienced personnel and resources in trade negotiations
Slowness in adapting to changes in trading environment
Constrained relationships with trading and development partners
Lack of capacity in border and trade facilitation agencies
3.2.7 Employment and the Labour Market
Around 130,000 people, or 40 percent of the labour force, is estimated to be in paid or formal
sector employment. With increased investments and future growth in the ICT and audio
visual industries, employment is expected to increase in the medium term. Government still
remains the largest employer with some 27,000 employees, accounting for a large proportion
of total paid employment. There are signs of skill shortages in both the public and private
sectors. However, unemployment in urban areas was estimated at 13.8 percent in 2007 with

55
an overall national rate of 11.9 percent (ILO5 Definition
6), according to the 2007 Census of
Population and Housing.
The challenge is to ensure that economic growth is sufficient to absorb the estimated 16,000
people that enter the labour force each year. With the current relatively low economic growth,
the formal sector is unable to create sufficient jobs. Many are left to make their own
opportunities in the rural economy and in micro, small and medium enterprises.
Government‘s Integrated Human Resource Development Programme for Employment
Promotion (IHRDPEP) and NCSMED are spearheading efforts to support employment
creation in both the informal and formal sectors.
The implementation of 55 years retirement age in the public service also has employment
implications as the retirees need to be replaced by new graduates to ensure consistent public
service delivery. Government is also facilitating faster approval of work permits in sectors
facing skill shortages. The closing date of civil service vacancies is reduced from 21 days to
14 days to allow faster processing of employment opportunities within the public sector.
Employment placement centres, where job seekers have access to information on available
positions and to job-interview training, are to be incorporated into the National Youth Option
Centres. Government‘s Internet-based placement service, CareerNET and the expansion of
the Computerised Human Resources Information System (CHRIS) will also assist in job
creation. The development of a comprehensive accreditation system of qualifications by the
Training and Productivity Authority of Fiji (TPAF) will facilitate improvements in the labour
market.
The Government is working on a performance and productivity based wage-setting
framework. The process will induce higher real incomes and economic growth as
productivity improvement necessitates investment in modern machinery and improved work
methods.
The Labour Market Reform brought about by the Employment Relations Promulgation of
2007 will restore confidence, stability and growth in the labour market and contribute to
creation of a business environment conducive to private sector investment. This will induce
greater employment opportunities. The employment reforms promote the role of women in
development and employment of school leavers. Additionally, the reforms will help improve
maternal health of working mothers, reduce child mortality through enhanced maternity
protection and promote education of children through its child protection policy. The
establishment of the National Employment Centre (NEC) as a ―one stop shop‖ will provide
employment services for the unemployed and school leavers, both locally and in overseas
markets. The NEC will act as the national umbrella framework for all employment creation
initiatives for the unemployed who will be issued with national employment identification
cards. The NEC will actively engage Fiji‘s unemployed in meaningful activities through cost-
effective facilitation, coordination and monitoring of all current activities including the
creation of a new Volunteer Scheme and a Foreign Employment Service.
5 ILO Definition – Includes those that are seeking employment and those are available but not seeking employment; ICLS
Definition – includes only those that are actively looking for employment 6 International Classification of Labour Force Statistics (ICLS) definition based urban unemployment rate = 10.5 percent and
overall rate = 8.6 percent

56
Development Constraints and Challenges
Successful implementation of performance based pay system
Training and retention of individuals in areas of skills shortage.
3.2.8 Land Resources Development and Management
Land is a scarce resource in Fiji and access to land is a prerequisite for any development.
With the current supply of land there is a need to ensure proper management and planning of
land use to ensure efficient utilization. Competing land uses such as infrastructure
development, housing, town and country planning and agriculture all require land both in the
mid term and long term for expansion purposes. Proper land use management and planning is
important in trying to mitigate against any impact that may be directly related to improper
land-use or unsustainable development.
The adoption of an integrated land and water resource management plan is important given
the increase in use of agricultural land beyond its capability, intensive cultivation of steeper
lands, rapid and escalating tourism development along the coastal zone and coastal floodplain
and the loss of good quality agricultural land to other uses. These factors all collectively
threaten the sustainable use of Fiji‘s land and water resources.
The review of the Land Conservation Act is to ensure that the focus and scope of the
legislation covers the sustainable use and conservation of both land and water resources. The
review also ensures the Land Conservation Board is provided with the appropriate legislation,
resources and the political will to fulfill its regulatory role in enforcing proper land use
practices. The review mandates the Land and Water Resource Management Board to develop
a national land and water resource plan of which it will provide the basis for the piloting of
the Nadi Water Catchments project. It will also harness the need for a firm policy
commitment from Fiji Sugar Corporation, NLTB, the Sugar Research Institute, and the
Ministry of Agriculture that their field officers will incorporate a Sustainable Land and Water
Management message into their extension and advisory services.
To promote resource conservation the existing legislations will be provided with provisions
to be applied immediately and comprehensively to control the removal of sand, gravel, rocks
and boulders from the bed and banks of rivers and streams. These will mean that any new
development will be subject to the requirements of the Land Improvement Act and the
Environment Management Act to ensure sustainable management of these resources. With
such plan in place, land will be allocated according to its highest and most suitable use.
To support economic development government intends to create large scale commercial
agricultural subdivisions to improve land utilization and increase productivity of the
agriculture sector. The intention is to identify available arable land and venture into large
scale commercial agriculture farming. These developments will be pursued in partnership
with landowners, private sector/exporters and the NLTB.
Land reform will also be undertaken to ensure that land is made available for economic and
social purposes. Creating a market for leased land is part of the land reform options which is
focused on ensuring better returns to landowners. To effect such a transformation, it is
essential that efficient mechanisms are created to ensure land is made available to potential
users who are willing to pay for its use at a rate set by the market and not by any administered

57
or legislated rate. In trying to make land available for government development use and in
facilitating investment, options such as the purchase of ancestral land, land buy-back schemes
and the reversion of schedule A and schedule B land under NLTB will be pursued to ensure
that these land is available to government and that it generates a good return on investment
both for land owners and NLTB.
Consulation on the establishment of mechanisms such as Landuse Advisory Boards, National
Land Register and a National Landuse Development Plan will be pursued to assist with
overall planning and better decision making on the utilization of land.
Development Constraints and Challenges
Enforcement of the land use policy has not been effective given the lack of understanding and
coordination between key stakeholders on the importance of conservation. The lack of
adherence to the Environment Management Act and the absence of a statutory authority is a
draw back in the implementation of proper land use and the enforcement of proper land
management.
The promulgation of the Land Conservation Act is expected to provide some authority for the
implementation of the land use policy. This will ensure that land user and developers will
adhere to the requirements of the Act and at the same time exercise greater precaution on land
degradation activities.
There is a need to review various legislation that deal with the administration and
development of land in order to ensure land availability and to facilitate access for potential
landusers.
3.2.9 Sugar
The Sugar Industry is in crisis. The full 36% reduction in preferential prices in the EU market
will take effect from 1st October 2009. The EU has indicated that funding under the
Accompanying Measures Programme for 2009 has been cancelled. Funding for 2010 and
beyond remains uncertain. Domestically, there continues to be ominous signs of an industry
on the brink of collapse with lone
fertilizer supplier South Pacific
Fertilizers Ltd being granted a
Government subsidy of $9.8 million to
purchase raw materials to supply the
industry needs for the 2009 season, low
sugarcane production over the past two
seasons averaging 2.4million tons, a far
cry from the 4.2million tons that the
industry reforms are supposed to yield, a
high TCTS7 ratio of 10-12, and continued
reliance of the miller (FSC) on
Government guarantees to enable it to
meet its working capital requirements.
Government recently renewed its
7 Ratio showing how many tons of cane required to produce a ton of sugar
Fig 1: Cane and Sugar Production Trends: 1975-2007
272396 341 408 454 341 289 268
0
500
1000
1500
2000
2500
3000
3500
4000
4500
1975 1980 1985 1990 1995 2000 2005 2007
(E)
To
ns (
'000)
0
2
4
6
8
10
12
TC
TS
Sugar productionCane crushedTon Cane to Ton of Sugar Ratio (TCTS)

58
guarantee to FSC in May 2009 for another year, on this occasion increasing it from
$25million to $70million.
There is no doubt that the sugar industry has been an important lifeline to Fiji‘s economy:
contributing on average some 7 percent of GDP, generating on average 30 percent of total
domestic exports and providing direct and indirect employment to around 51,000 people,
consisting of approximately 18,000 growers, 3,000 FSC employees and 17,000 cutters and
drivers. It is estimated that about 200,000 people are either directly or indirectly dependent on
the industry for their survival. However, it is important to also note that throughout its
existence, the industry has been sustained by preferential access to the UK market, assured
since 1975 under the Sugar Protocol, and sympathetic government subsidies. With such a
legacy, it is no surprise that efforts to reform the industry into a competitive player in the
global sugar market, is proving a challenge.
Data over the last 30 years show a general trend of declining production, more profound from
the mid-1990s. The decline in output of both cane crushed and the resultant sugar content
(particularly the latter) has been much more rapid than that of either the area planted under
cane or the number of growers. This reflects a particularly sharp deterioration in productivity
at the field level, both in terms of cane yield per hectare and in cane quality.
This is best illustrated by the ratio of a ton of cane needed to produce a ton of sugar (TCTS)
which was in the range of 7.9 to 9.8 from 1975 to 1990, and increasing to the range of 9.1 to
11.1 from 1990 to the present. This means that the industry today needs on average at least
15.2 percent more cane to produce a ton of sugar compared to 30 years ago. This translates
into increased cost for both the grower and the miller.
The decline in sugar output has been attributed to the movement of people off farms, the
lower fertility of land due to unsustainable use and the ongoing use of low sugar content
varieties of cane.
Sugar production declined in 2008 to around 208,727 tons, 13% below the 2007 level, from
2.32 million tons of cane. This represents a TCTS ratio of 11.15 which is high and inefficient.
A desirable TCTS ratio for the industry would be around 8.0. The outlook for 2009 is not
positive largely attributed to the devastation of the January 2009 floods. Sugar production
forecasts for 2009 and 2010 currently stand at 208,000 tons and 257,000 tons respectively.
Total sugar exports for 2009 are projected to decline to $176.5m from $248.2m recorded for
2008. Projections for 2010 and 2011 currently stand at $162.2m and $175.6m respectively.
Government has set-up a Task Force comprising of all the stakeholders as its first step
towards expediting the Sugar Industry Reforms. The objective of the Task Force in
revitalizing the Sugar Industry was to formulate and implement an agreed Sugar Industry
Plan to provide a way forward for the Industry. The plan identifies the real solutions in
helping the farmers, addressing the pressing issues of land, fertilizer, cane production and
productivity, harvesting and transportation as well as identifying other farm based activities
to supplement cane incomes. The plan also encourages FSC to be an efficient miller to
enhance the quality and quantity of sugar production and supplemental income through
diversification projects. A draft Industry Plan has been produced and agreed to in principle by
the Industry.

59
With the uncertainty surrounding the support from the EU under the Accompanying
Measures Programme, it falls on Government and the Industry to finance the reforms outlined
in the Industry Plan. Government is committed to ensure that the chosen path of reforms is
successfully carried out.
While programmes targeted at addressing milling inefficiencies through equipment upgrading
and replacement are at an advanced stage, initiatives to improve farm productivity and
transporting efficiency are lagging behind. This is a concern given that improving farm
productivity is crucial to the survival of the industry, as it prepares for exposure to more
competition in the world market. This is the real challenge of globalised trade. The launching
of a new cane variety in August 2009 by the Sugar Research Institute is a welcome
development.
The Ministry of Sugar in conjunction with the Ministry of Primary Industries are also focused
on enhancing diversification projects to ensure a broader income base for cane farmers
through import substitution and export promotions programme. There is a growing lack of
confidence amongst farmers within the cane belt to plant cane. This has seen a mass exodus
of people from the cane farming belts to the towns and cities in search of a more secure
income, education, and livelihood. This presents a major challenge for the Industry, with an
ageing population left to tend the farms. The solution to this is to make sugarcane farming
attractive again.
In an attempt to break the heavy institutional set-up of the Sugar Industry, Government has
carried out major reforms which had seen the dissolution of the Sugar Commission of Fiji
and the winding up of the Fiji Sugar Marketing Company Limited. The responsibilities of the
latter has been taken over by FSC. The Sugar Cane Growers Council has also been dissolved
to ensure that cane farmers are not burdened with additional expenses in the form of
contributions in times of falling sugar cane income levels.
As a short term measure to address the loss of land under sugar, Government set up the
Committee on Better Utilization of Land, which negotiated with landowners on expiring
leases, and through a government subsidy, topped up land rentals received by landowners to
10% of UCV. To date, out of the 5,464 expired leases, CBUL has successfully negotiated the
renewal of 4,139 leases. The subsidy scheme is a 5 year initiative and farmers are expected to
bear the full cost from 2015 onwards. The initiative, however, is a short term solution while
Government progresses to implement reforms in the administration of land in Fiji.
Accountability and confidence needs to be cultivated with the industry being more incentive
driven. In this regard, it is of critical importance to introduce a payment system for cane
based on the sugar content of the cane. There should now be a shift in efforts – at all levels in
the industry – towards maximizing sugar production and not cane production.
Development Constraints and Challenges
Development constraints and challenges include:
Industry viability depends upon the commercial values in all aspects of operation, from
farming and harvesting, to transportation and milling;
Effectiveness of the extension services, research and development work of the Sugar
Research Institute and FSC;
Effectiveness of recapitalisation program;
60
Loss of experienced farmers;
Renewal of productive land leases; and
Support provided by the EU and confirmation of funding.
3.2.10 Non-Sugar Agriculture and Livestock
The agriculture sector, during the last decade grew at an average rate of 0.13% and the
average growth attained is a direct result of low investment in the sector. Projections for
2009-2011 indicate a period of slow growth in the sector. The non-sugar agriculture sector is
still predominantly subsistence and on average contributes 7.8 % of GDP, accounting for
around 3.8 percent of domestic exports. Food imports in 2008 constituted 14.4% of our total
imports, which is of particular concern.
The non-sugar crops constitutes of traditional food crops (taro, cassava, yams, sweet potato,
and kava), tropical fruits (pineapple, pawpaw and mango), vegetables, pulses, ginger,
tobacco, rice, spices, cocoa, and coconut products. The livestock industry includes beef,
dairy, pork, poultry meat, eggs, sheep, goat and bee products. Major contributors to exports
are fruits (pawpaw) and vegetables, including taro. A small but growing volume of certified
organic products, including coconut and fruit products and nutriceuticals are exported.
However, growth in the sector has been volatile.
Food security is a priority given Fiji‘s vulnerability to natural disasters and its susceptibility
to the global food crisis. The FAO‘s Food Import Capability Index (FICI) provides an
indicator of a country‘s level of food security vulnerability. An FICI ratio of above 0.5 is
considered vulnerable, with Fiji having a decade average of 0.17, issues such overliance on
imported food itmes, change in consumer preferences and changes in community lifestyle is
certainly like increase our vulnerability in the near furture. External shocks such as the
impact of currency devaluation on our purchasing power and the erosion of trade preferences
with the European Union is also likely to affect our demand for alternative livelihoods.
Growth in the importation of agricultural produce (live animal, animal products and crops) by
hotels and resorts due to the inability of domestic farmers to provide consistent supply of
quality agricultural products is contributing to the rising import bill. To penetrate this
segment, emphasis will be on putting in place proper programmes and infrastructure to
support the production capacity of local farmers and improving the quality and standards of
agricultural produce. In addition partnership with private sector involved in the supply and
value chain will be harnessed through provision of appropriate incentives and support.
The implementation of the National Export Strategy (NES) provides the platform for
supporting local industry organization on infrastructure development, enhancing market
access opportunities for exports and the penetration of emerging export markets. Synergies
will be considered between NES and other rural development oriented programmes such as
Export Promotion Programme (EPP), Import Substitution Programme (ISP), Sigatoka Valley
Development Programme, Rural and Outer Island Development Programme (ROI) and the
Northern Development Programme (NDP) to ensure greater cohesion and effective
implementation of the Demand Driven Approach (DDA). The Demand Driven Approach
both for export and import substitution commodities involves commercialization and
strengthening industry organizations and agri-business networks, promotion of young farmer
training, recognition of industry priorities by Government and the provision of support to
medium sized entrepreneurs and exporters with existing market protocols.

61
The Import Substitution and the Export Promotion Programme is focused on improving the
quantity and quality of commodities both for domestic consumption and exports. An integral
part is focused on reviving both the crops and livestock component of the agriculture sector
with special focus on import substitution commodities. The reviving of the livestock industry
is targeted at the breeding of genetically superior livestock, provision of training on pasture
feed management, good animal health practices and improve farm management techniques.
Investment in the industry is targeted at the dairy and beef components of the industry. The
introduction of subsidies for the farm gate price for milk is to boost local supply of milk and
also to encourage farmers to supply milk to Rewa Cooperative Dairy Company (RCDC).
Bilateral Quarantine Agreements (BQAs) continue to boost exports significantly. Export
market access for agricultural products cannot be obtained without a BQA. BQA for other
potential export commodities are being pursued, however investment in research and
equipment needs to be prioritised. Market access already secured under BQAs are for
pawpaw, eggplant, chilli, herbs, pineapple, breadfruit, and mango to New Zealand; kava to
Vanuatu; watermelon, yams, and vanilla to Tonga; coffee and copra to Papua New Guinea;
and pawpaw to Australia. Farming techniques and post harvest handling need to be improved
to address the issues of quantity, quality and consistency of supply.
Potentials in rural and outer islands still remain largely untapped. Production in these areas
remains largely subsistence due to lack of infrastructure, adequate transport services, long
distances to markets and the non-availability of incentives in the agriculture sector to induce
greater agricultural production. The Agricultural Marketing Authority provides some form of
market access but its coverage and its ability to absorb supply from remote farmers is limited.
Fiji‘s agricultural sector has enormous development potential given the availability of
productive land and natural resources. The way forward for the sector is dependent on
harmonizing all rural development initiatives to ensure equitable distribution of resources to
less developed areas and the opening up of possibilities for commercial agriculture in remote
rural areas.
Development Constraint and Challenges
Lack of investment in agricultural research especially product development
Development of market access, BQAs and commodity protocols
Agricultural infrastructure and equipment are inadequate to deal with demand
Reinvestment needed from producers
Improved extension services
Capacity building for farmers
Awareness on proper farming techniques, soil suitability and conservation, post
harvest handling, market access and financing
Establishment of Export Insurance Facility
3.2.11 Forestry
The forest sector on average accounts for 1.2% of GDP and 4.1% of export earnings. Fiji has
a total forest cover of 1,054,419 ha, covering 58% of the total land area. This consists of
899,229ha of native forest, 116,488ha of plantation forest (52,419ha of hardwood plantations

62
and 64,068ha of softwood plantations) and 38,742ha of mangrove forest. The native forest
consists of 5,738ha of nature reserves, 16,109ha of forest reserves, and 1,300ha of
recreational parks.
The performance of the sector in the past few years has been poor due to the complex
institutional environment in which the sector operates, exacerbated by low log production,
poor performance of public companies involved in the sector such as FHCL and Fiji Pine
Limited(FPL), and the delays in getting Wairiki port into operation. The sector declined by
1.6% in 2007, 3.4% in 2008 and projected to continue to fall sharply in 2009 by 9.1% mainly
due to woodchips exports, which, based on current orders, is projected to fall by 43.8%.
However, a recovery of 4.3% and 0.9% is currently projected for 2010 and 2011 respectively,
as Government puts in place measures to address the current institutional constraints.
Fiji is a producer and exporter of woodchips, sawn timber and plywood/veneer. Forestry
exports have increased in the past few years with export earnings up by 27% in 2007 to
$47.7m and 24.3% in 2008 to $59.3m. These increases were largely driven by earnings from
export of woodchips which doubled in 2007 from $13.4m in 2006 to $27.1m in 2007 and
later to $27.6m in 2008. A decline of export earnings by 15% is projected for 2009 due the
depressed demand in the global economy. Nevertheless, a recovery in export earnings of 8%
and 4% is projected for 2010 and 2011 respectively.
The National Forest Inventory, the formalization of the Fiji Forest Policy Statement and the
National Forest Program provides the framework for the sustainable management of Fiji‘s
forest resources. These tools represent a paradigm shift in the management focus away from
timber production towards conservation and sustainable management. With emphasis on
sustainable forest management, increased landowner aspirations, expansion in nature
reserves, afforestation, climate change adaptation and globalization, there is more awareness
on the social functions provided by forests to improve water source quality, improve
agricultural land and reduce vulnerability to natural disasters especially flood mitigation.
Total wood production in Fiji is presently approaching 500,000m3 annually with 100,000m
3
from native forests, 100,000m3 from mahogany plantations, and 300,000 m
3 from pine
plantations.
Fiji has a total of 41,000ha of mahogany stocking, which is one of the largest mature
mahogany resources in the world. However, the full benefits of this resource have not been
realized due to stakeholder conflicts creating uncertainties. In order to set a clear direction for
the industry, Cabinet agreed in June 2008 to transfer the ownership of the mahogany
plantations to the indigenous landowners through the Fiji Mahogany Trust (FHT), with the
role of Fiji Hardwood Corporation Ltd (FHCL) redirected to one of forest manager.
There is potential for large denuded forest grasslands to be converted into forest plantations
of sandalwood (Santalum yasi) and teak (Tectona grandis) plantations. Reforestation could
result in the employment of skilled and unskilled people who have been displaced from the
sugar industry. The harvesting of the high value mahogany resource, technology, trade
standards and forest certification are prominent in the National Forest Policy Statements. On
the prospects of resource utilization and business development, there is potential for
development of Wood Energy Industries, Furniture Manufacturing, Coco wood Industry and
Carbon Trading.
Other potential business opportunities that are being pursued include the supply of fuel wood
for the production of power from biomass. FPL has commenced a 100-hectare trial on pine
resin tapping and the viability of such an operations is be evaluated to ensure the current log
supply market is not affected.

63
The Forestry Department is also collaborating with NGOs, regional organisations, and the
Department of Environment through a four year GEF funded project of US$3.7 million on
the conservation of Sovi Basin, located in Naitasiri and Namosi provinces. Landowners of
Sovi Basin are getting an annual proceed of around $200,000 of which about half are paid
directly as lease and compensation on foregone timber royalties.
Development Constraints and Challenges
Development constraints and challenges include:
Absence of comprehensive regional and national land use plans;
Limited protection and enforcement for conservation especially in native forests;
Inadequate knowledge of forest resources;
Inadequate research efforts;
Poor fire protection capabilities and procedures;
Institutional weaknesses and difficult bureaucratic processes;
Outdated forestry legislation;
Absence of detailed forest management and harvesting plans;
Constrained value adding capacity;
Market access and niche marketing; and
Forest certification and trade standards
3.2.12 Fisheries Resources
The fisheries sector accounts on average for 2.7% of GDP and 9.7% of domestic export
earnings. Fish production in Fiji is estimated at around 22,000mt with an average fish
production in the last 10 years of 24,000mt. Tuna contributes 67% of total production in the
industrial fisheries sector whilst artisanal fisheries contributes 28% and aquaculture
contributes 5% of production.Industrial fisheries contributes 84% of total export earning
while artisanal fisheries contributes 16% of export earnings.
The sector declined sharply by 15.9% in 2007 on the back of soaring industry costs, driven
largely by the rise in fuel costs. While there was a slight recovery of 4.5% in 2008, the
outlook for 2009 is a decline of 3.4% as the impact of the global recession takes hold,
affecting mainly the Japanese sashimi market. The devaluation of the Fiji dollar may boost
exports and support growth, but is also expected to adversely affect industry operating costs.
A recovery of 4.1% is currently projected for 2010 followed by a decline of 6.7% in 2011.
The decline in 2011 is expected to be caused by a more pronounced el nino impact.
The management of offshore fisheries has been an area of concern, not only nationally, but
regionally and globally, particularly in the wake of an invasion of State subsidized Asian
fleets. While total catch has increased in the past 2 years from 12,417mt in 2007 to 13,330mt
in 2008, catch in domestic waters is declining. This prompted a reduction in licences issued
for vessels in the Fiji EEZ from 100 in 2003 to 45 in 2008. There are currently 40 licensed
vessels operating in 2009 from a licensing cap of 60. Most of the fish catch is now coming
from high seas and neighboring countries. Resource management, therefore, becomes critical
and mechanisms such as the Tuna Management and Development Plan need to be followed
and enforced at the national level.
Fiji has an expanded value adding industry for tuna, which includes frozen sashimi grade,
yellow fin loins, loining and carbon monoxide treated yellow fin for the US market, fish
smoking for the niche Japanese market and small scale value adding for the local and export
markets. Sustainable development in the fisheries sector will require strengthened policy,

64
institutional and regulatory frameworks which are developed with stakeholder participation.
The revision of the Fisheries Act is planned for 2009 with assistance from the Forum
Fisheries Agency.
In June 2008, Fiji was removed from the list of countries allowed to export fish products to
the EU market because of a failure to put in place a competent authority to ensure compliance
to the EU fish export standards requirements. This has resulted in the loss of around
$5million in value of fish exported to the EU annually. Fish exports to the EU are directed to
the UK, France, Netherlands, Italy and Germany and compose mainly of fresh/frozen tuna
fillets and loins. The EU has since provided technical assistance to Fiji to allow the
competent authority to comply with EU requirements. It is estimated that it will take at most
2 years before access to the EU market is opened again for fish products from Fiji.
The fishing industry has expanded in recent years to include other fisheries such as aquarium
trade, live rock, and live coral. There is an expansion of demand for marine products
supported by health oriented consumers as well as for management and conservation as in
marine parks and marine protected areas (MPA). Development of other areas such as
seaweed farming, aquaculture and recreational fishery for both food security and income
generation is also being encouraged.
Aquaculture programmes have not progressed well despite large investment from
Government and donors. Total aquaculture production is estimated at 500 mt/20,000pcs
valued at about $12 million on the back of the strong results from the pearl industry. Principal
types of aquaculture initiatives consisted of eight (8) aquaculture species, namely, Tilapia,
Carps, Brackish water shrimps, Prawns, Fancy Carps, Gold Fish, Pearl Oysters and Seaweed.
While the objectives were to improve the nutritional status of rural populations, generate
supplementary income and diversify activities, create opportunities to stem the flow of
migration from rural to urban areas, the strategy was also designed to enhance production for
import substitution (prawns, mussels, oysters, fish), and the re-seeding and stocking of our
fisheries water ways. However, more research is needed to improve the quality of fries
(babies) and feed which are key obstacles to commercialization. The current average yield of
1.2mt of fish per hectare needs to be increased to 26mt in order to sustain a viable industry.
Seaweed farming engages the family, community, Government and the private sector, and
offers an alternative livelihood to isolated rural areas, especially in maritime zones where
shipping services is irregular and unreliable. In Ono-i-Lau, this commodity has provided
employment, raised the standard of living and contributed to the drift to urban areas. There
are 198 active farmers producing an average of 60mt of dried seaweed per year around Fiji.
The demand by the current market for Fiji seaweed is 2,000mt per month with projected
export earnings of $36 million per year.
The pearl industry is another potential growth industry with Government working in
partnership with the private sector. This partnership has supported the operation of 11 pearl
farms which have produced an average of 50,000 pieces over the past 2 years valued at
around $1.6million. The industry is worth $7.5 million and government is aiming at
increasing the value to $50 million by 2015. However, increased technical capacity is needed
to develop the industry.
The main constraints preventing sustainable commercial development of this sector are the
lack of technical expertise, lack of appropriate technology and infrastructure, lack of ability
to access appropriate markets and capital, reduction of fishing products, unfavorable
investment climate, declining fisheries resources, transport difficulties and export standards
compliance.

65
Development Constraints and Challenges
Development challenges and constraints include:
Legislative and structural reforms;
Institutional approach to fisheries management;
Management of fish stocks;
Overfishing, illegal and unregulated fishing;
Suitable port facilities and distribution system;
Constrained value adding capacity;
Market access and niche marketing; and
Fisheries certification and trade standards.
3.2.13 Mineral and Groundwater
The mining and quarrying sector on average accounts for 1.5% of GDP, generates on average
8.5% of total domestic exports and at its peak supported a workforce of over 1,700 personnel
as well as 350 directly related contractors. The Vatukoula mine shut down in 2006 because of
rising operational costs and low output which severely affected the viability of its operations.
After placing the mine up for sale, an Australian company, Westech Gold purchased EGM‘s
operations and tenements in Fiji. Production in 2007 was a mere 932 ounces. In 2008, a UK-
based company, River Diamonds, acquired the Vatukoula operation from Westech. With
Vatukoula mine under new management, mining operations gained some momentum with
gold production increasing to 22,496 ounces. For 2009 gold production is expected to
increase to 36,000 ounces, an estimated increase of 60% from 2008. With the increase in
interest shown by investors and number of forecasted mining activities, the sector is expected
to further grow by 38.9% in 2010 and 20% in 2011 respectively.
Fiji has good prospects with regard to epithermal gold (associated with volcanic centres),
porphyry copper-gold (Namosi), and smaller base-metal deposits (Udu, Wainivesi). Mining
and exploration in Fiji has been dominated by gold production from Vatukoula mine however
the existence of several mining prospects such as Tuvatu (gold mine), Wainivesi (copper
mine), Mount Kasi (gold mine) Namosi (copper mine) and other solid mineral deposits could
mean more revenue, foreign exchange, and employment from this sector than from Vatukoula
alone. The potential of Fiji‘s mining industry is enormous given the number of exploration
licences issued and the various types of activities undertaken by each sectors. From 2007 to
2008, a total of 16 exploration licences were issued, with an additional 2 licences issued in
2009. The conversion of these exploration licences to mining leases provides the impetus for
growth and development of the mining industry as a whole.
The groundwater sector consists of development and production of ‗mineral‘ or bottled water.
Export receipts from bottled water plants at Yaqara and in Nadi areas have been experiencing
exponential growth since its inception. Overall growth for the industry is forecasted to
increase as robust growth for Natural Waters of Viti Limited (‗Fiji Water‘) is expected to
continue given its reputation in the US market. There is currently no legislation governing
water resources in Fiji. However, the new mining legislation to be promulgated would
legislate the access, use and management of groundwater resources, until a separate
legislation is formulated. Given the need to have an effective regime for managing water
resources, the National Water Committee has been meeting to develop a water policy. Final
consultations are planned for October 2009 before a Water Policy is considered by Cabinet.
66
Recent studies have indicated that Fiji has a huge potential in geothermal energy. However,
this has yet to be firmly established. In 2008 exploration was carried out in Labasa by the
Asia Pacific Resources Ltd, an Australian company. However, more exploration is needed to
ascertain the viability of the resource.
In addition to geothermal energy, offshore mining has attracted a lot of interest by
prospective investors. Government has, therefore, seen the need to put in place a legislative
framework for offshore mining, given that this is a totally new area for the Fiji mining
industry. Offshore exploration and mining in Fiji has, therefore, been placed under
moratorium until the Offshore Mineral Policy is approved by Cabinet. A workshop on
Offshore Mineral Exploration and Mining in Fiji with all stakeholders has been planned
before the Policy is considered by Cabinet in October 2009.
There has been a lot of focus on mining operations with little attention paid to the potential
economic activity generated through exploration. In order to tap into this segment, the current
fiscal regime needs to be reviewed to be sufficiently attractive for small exploration
companies. In order to develop new mines, an effective exploration industry is required.
Exploration is a high risk capital business and investors enter with the aim of reaping high
rewards. Some key issues to consider when forming a tax package for minerals include the
high capital (and debt) intensiveness of mining ventures, the cyclical nature of metal markets,
and the long and costly period of pre-operational expenditures on exploration and feasibility
studies.
Development Constraints and Challenges
Being a high risk industry, attracting investors to this sector does not necessarily require
political stability, as proven by countries like Papua New Guinea and those in Sub-Saharan
Africa. A facilitative Government process, transparency in legislation and policies, security
of tenure, a competitive tax regime and robust legislation are deemed more important criteria
for attracting mineral investors.
Inadequate technical capacity and under-resourcing of the Mineral Resources Department
(MRD) is a major constraint for the industry. The shortage of technical experts such as
geologists, compromises the Department‘s ability to scrutinize submissions from the industry
or add value to activities in the sector.
Security of land tenure is a critical issue for mineral sector investors. Without transparent and
adequate compensatory policies, landowner grievances can become a significant impediment
to long-term mine operations.
A conducive and sound regulatory environment is needed to support development in the
sector. There needs to be urgency placed on the promulgation of the new Mineral
(Exploration and Exploitation) Decree, as well as the legislation governing groundwater.
There remains no legislation or policy framework that addresses the extraction, use and
management of groundwater in Fiji. The same applies also to the use of surface water for
commercial purposes. The Rivers and Streams Act and the Irrigation Act fall far short of an
appropriate regulatory framework for addressing rights/access to water and its different uses
based on the principles of sustainable development.

67
3.2.14 Financial Services
Financial services are essential in creating an environment conducive to promote the growth
of savings and channel these savings from those who save to those who take risk and invest
in business activities which yield social and economic returns to the economy. Hence well
managed financial services contribute to the strategic priorities of maintaining
macroeconomic stability, restructuring to promote competition and efficiency, raising export
earnings and raising investment levels for jobs and sustainable economic growth.
Resilient and well-regulated financial systems are essential for macroeconomic and financial
stability in a world of increased capital flows. The implementation of the recommendations of
the Commission of Inquiry into Financial Services (COIFS), IMF/ World Bank Financial
Sector Assessment Programme (2007 FSAP), Export Finance Facility (EFF), the
superannuation sector study and the introduction of the Fiji Real Time Gross Settlement
(RTGS), FIJICLEAR are key strategies aimed at achieving a vibrant and efficient financial
sector.
Development also requires the extension of formal retail banking services to rural areas and
outer islands so that those residing there are better able to establish and expand businesses
and meet social needs. This will build upon present development of micro finance - including
savings and credit unions and the Micro Finance Unit - and increased access to rural
commercial banks through the establishment of specialized micro-finance operation. In
addition, the RBF has established a specialized Group to assist and strengthen micro-
financing initiatives in Fiji.
Moreover, such developments may bring out more success to the economic and social
activities in the rural areas, if promotion of accessibility is continued along with transparency
planning, co-ordination and consultation between Government agencies so that rural
‗unbanked‘ areas to be also part of the new modern banking system that is available in the
urban areas. The financial system needs to be supervised. Proper legislation and regulations
need to be in place. Review of the appropriate legislations including the RBF legislations and
the Banking and Insurance legislation coupled with increased data coverage will reflect
performance and standards of the financial sector. There needs to be proper supervision of
financial institutions that are not licensed by the Reserve Bank eg. credit unions, money
lenders, etc.In addition, the RBF will spearhead all new rural banking initiatives that are in
line with the Banking Act (1995) definition to increase the coverage of basic banking in rural
as well as that considered ‗urban‘, but which do not have access at present.. For the
development of the capital markets, appropriate incentives will be considered for companies
to list on the stock exchange.
Development Constraints and Challenges
There have been significant improvements in the financial services sector, however, much is
yet to be accomplished to address the constraints and challenges to make the sector efficient
and manageable/transparent. Such measures include:
improved efficiency in resource allocation and institutional arrangement for
processes of financial intermediation;
on-going alignment of domestic prudential regulation to latest international sound
and best practices;

68
enhanced stability and soundness of the financial system to include prudential
supervision arrangements particularly for deposit- taking institutions like credit
unions;
consistent use of relevant indicators such as Financial Soundness Indicators (FSI) and
stress testing, to assist in the assessment of strengths and vulnerabilities of financial
systems and also serve as critical inputs for policy formulation;
ensure that developments in the financial markets support the ongoing developments
of the real sector;
extending financial services to those living in rural areas and outer islands and the
importance of this to poverty reduction; and
pursuing supervisory arrangements for capital markets.
3.2.15 Transport
Transport plays an critical role in our economy contributing around 10.2% of GDP in the last
three years, (2007-2009). It also employs considerable amount of people in both formal and
informal sectors with the latter most vibrant in the land transport industry. It also links key
social and economic sectors of the economy including resources based industries, education
and health.
The sector‘s contribution to GDP is expected to expand to 20% by 2014 once the impact on
the economy of the support from EXIM Bank China and EXIM Bank Malaysia comes
through.
In the next five years, government will pursue vigorously its transport financing with the
private sector especially in the area of land transport. In the next year or so, government will
be engaging the private sector to go into financing rehabilitation works for existing roads.
Asian Development Bank (ADB) is also assisting government in the establishment of the
multi sector regulator to be adopted soon aimed at promoting competition and minimizing
externalities.
Land Transport
A number of externally financed projects are expected to begin next year such as upgrading
of the Buca Bay Road and Nabouwalu/Dreketi road in Vanua Levu and the Sawani/Serea
Road, Valley Road, and Moto road in Viti Levu. The upgrading of these roads is expected to
provide critical market links for farmers and buyers and substantially reduce costs.
Government has also recognized the momentous task of maintaining existing sealed roads
(1,617km). The 1997 Lee report recommended at least $50million to be available to maintain
road annually based on 865km sealed roads at that time. To this end, government has
promulgated the road user levy in January 2009 to at least collect $14million annually for this
purpose alone. LTA has already put in-place two weighbridges to minimize the effect of
vehicle overloading. Road safety needs to be relooked at to better address its financing needs.
Avoiding the dreadful effects of pollution from vehicles also remains to be dealt with.
The FRUP III project is expected to be completed by early 2012 after the award of the
remaining two contracts to Naim Cendera (Malaysia) and Fairdeal Earthmoving Limited with
the estimated cost of the contracts put at $59.6million.
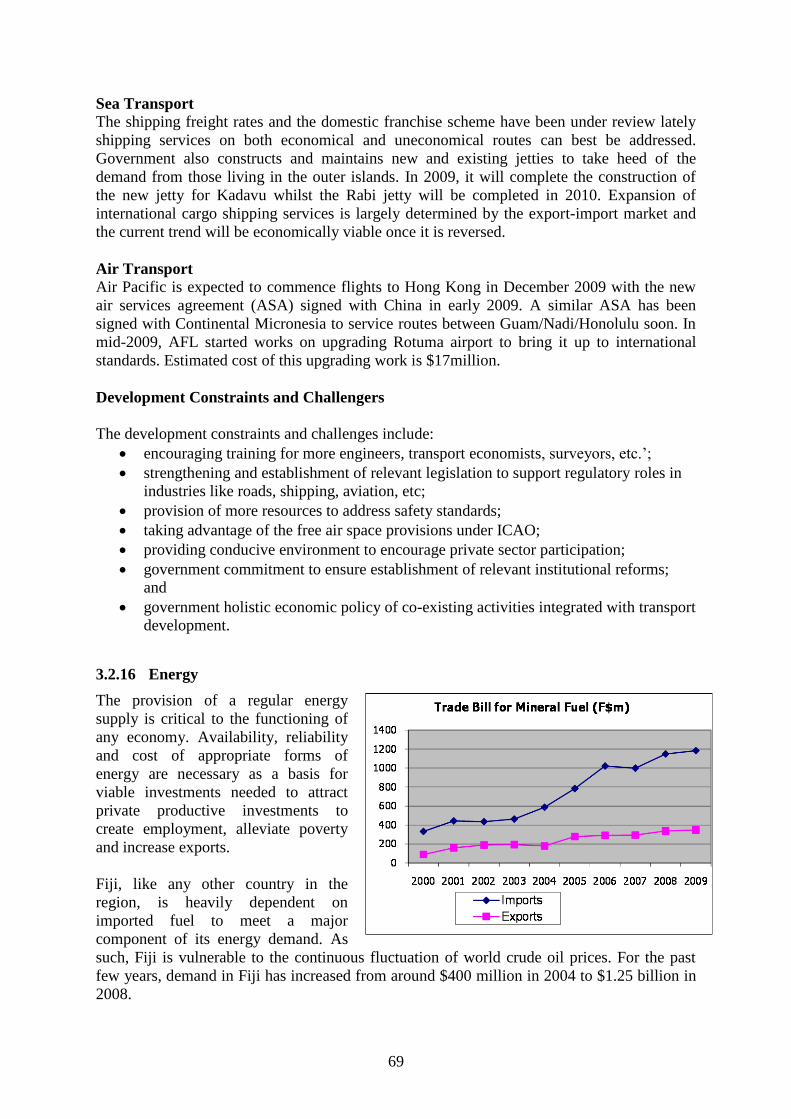
69
Sea Transport
The shipping freight rates and the domestic franchise scheme have been under review lately
shipping services on both economical and uneconomical routes can best be addressed.
Government also constructs and maintains new and existing jetties to take heed of the
demand from those living in the outer islands. In 2009, it will complete the construction of
the new jetty for Kadavu whilst the Rabi jetty will be completed in 2010. Expansion of
international cargo shipping services is largely determined by the export-import market and
the current trend will be economically viable once it is reversed.
Air Transport
Air Pacific is expected to commence flights to Hong Kong in December 2009 with the new
air services agreement (ASA) signed with China in early 2009. A similar ASA has been
signed with Continental Micronesia to service routes between Guam/Nadi/Honolulu soon. In
mid-2009, AFL started works on upgrading Rotuma airport to bring it up to international
standards. Estimated cost of this upgrading work is $17million.
Development Constraints and Challengers
The development constraints and challenges include:
encouraging training for more engineers, transport economists, surveyors, etc.‘;
strengthening and establishment of relevant legislation to support regulatory roles in
industries like roads, shipping, aviation, etc;
provision of more resources to address safety standards;
taking advantage of the free air space provisions under ICAO;
providing conducive environment to encourage private sector participation;
government commitment to ensure establishment of relevant institutional reforms;
and
government holistic economic policy of co-existing activities integrated with transport
development.
3.2.16 Energy
The provision of a regular energy
supply is critical to the functioning of
any economy. Availability, reliability
and cost of appropriate forms of
energy are necessary as a basis for
viable investments needed to attract
private productive investments to
create employment, alleviate poverty
and increase exports.
Fiji, like any other country in the
region, is heavily dependent on
imported fuel to meet a major
component of its energy demand. As
such, Fiji is vulnerable to the continuous fluctuation of world crude oil prices. For the past
few years, demand in Fiji has increased from around $400 million in 2004 to $1.25 billion in
2008.

70
The development and approval in 2006 of the National Energy Policy(NEP) by Cabinet has
provided a common framework for both the public and private sector to work towards the
optimum utilisation of energy resources for the overall growth and development of the
economy. The policy focuses on four key strategic areas that include; i)National Energy
Planning, ii)Energy Security, iii)Power Sector and iv)Renewable Energy Development. With
challenges confronting the sector, summarily the approach intends to strengthen our supply
sources and simultaneously manage our demand for energy. With the above, Government
further plans to develop an energy legislation based on the NEP.
Around 66.8% of the country‘s electricity requirements are met from renewable energy
sources which include; 62.1% hydro, 0.6% wind and other renewable resource 4.1% biomass.
This is provided largely through the FEA‘s grid network on the two main islands and Ovalau.
Imported petroleum for diesel back-up generators, meets the remaining balance of 33.2 %.
The Department of Energy (DoE) has also installed about 600 diesel based systems in various
rural communities.
The amount of electricity generated and sold by FEA reflects the level of economic activity
in the country. Currently, the contribution of the electricity sector to GDP is about 3.6%. This
is projected to increase as a result of greater access to electricity in rural areas under the
Government‘s Rural Electrification Programme which, apart from the extension of the grid
networks and diesel schemes, also encourages the utilization of solar home systems in rural
communities.
Major changes have taken place within the FEA, following its internal restructuring to
improve the efficiency and effectiveness of its operations. Government is reviewing the
regulatory role of FEA with the intention of removing this role from FEA, which will enable
the company to concentrate on its core business and largely promote a competitive
environment for the sector. FEA plans to invest $350m up to 2012 in parallel with some $150
million of private investment in IPP and PPP arrangements. FEA hopes that all these
additional national investments in renewable energy sources (hydro, geothermal, wind,
biomass and municipal waste) will assist in the accomplishment of its goal of 90% renewable
energy by 2011. In addition to the above, Government continues to support FEA‘s proposed
new energy developments, such as the Nadarivatu Hydro project.
In terms of final energy consumption, the Transport sector has continually consumed a little
over 40% of the total energy supplied. This is followed by the Commercial sector, Industrial
and Domestic sector. Some of the important measures that have been identified to address the
situation are outlined;
i) addressing consumption of our transport sector through the development and use of
bio-fuels locally and other legislative measures;
ii) diversifying the current energy mix through the use of LPG in the industrial, transport
and domestic sectors; and
iii) improving the efficiency of energy use in all sectors of our economy.
Development Constraints and Challenges
The development constraints and challenges include:
Continuous fluctuation and the high price of oil that increases domestic costs and the
fuel import bill;

71
Regulatory arrangements in the electricity industry;
Lack of a regular energy sector information database;
Weaknesses in the delivery mechanisms under the current Rural Electrification
Policy; and
Development of Renewable Energy Projects.
3.2.17 Water and Sewerage
The consistent supply of clean, safe piped water and efficient sewerage services are crucial
for both rural and urban sectors in inducing greater economic activity and commercial
developments. Fiji has an abundance of water resources, however, there are persistent
problems of supply of piped water. Approximately 75 percent of Fiji‘s population has access
to piped water while the proportion of population having access to sewerage facilities is about
25 percent.
Government recognizes the importance of water and sewerage services in the socio-economic
development of the country. As such, in the next five years, Government will ensure that
inhabitants of some of Fiji‘s most densely populated areas have access to regular and safe
piped water and an environment friendly sewerage system.
The Suva/Nausori Regional Water Supply and Sewerage Scheme are currently undergoing
upgrading and augmentation works to improve the level of service to consumers in terms of
reliability, quality and quantity. There are altogether 25 packages under this project of which
8 have been completed. Sewerage rehabilitation and augmentation works have also begun on
the Kinoya Sewerage Treatment Plant, Tacirua Sewer extension, Samabula North Sewer and
the Suva Point Sewerage.
In the Western division, the Nadi/Lautoka regional water supply scheme involves the
upgrading of the raw water supply capacity pipeline from the Vaturu Dam to Nagado Water
Treatment Plant to allow for better transfer of water to Lautoka. The progress on the Natadola
Water project has seen the completion of the pipeline between Sigatoka and the Voua
Reservoir near the Fijian Resort. Further developments are envisaged on the pipeline from
Voua Reservoir to Natadola and construction of the Natadola reservoir and pump stations.
Government will continue to pursue reform programmes in the Water and Sewerage
Department. The development of a water management policy will safeguard the proper
management of Fiji's fresh waters and the marine environment as well. New legislation and
regulation will ensure an appropriate framework for sustainable exploitation and
environmental protection of fresh water rivers and ground water aquifers.
Development Constraints and Challenges
The development constraints and challenges include:
financing infrastructure upgrading, low level of cost recovery and lack of professional
and technical staff;
aging of existing infrastructure;
low levels of cost recovery;
increased demand for infrastructure from the growing tourism industry, business
centres and industrial estates;

72
creation of new water and sewerage company; and
acceptance by consumers of the need to adopt a user pay concept.
3.3 Policy Objectives, Strategies and Key Performance Indicators
3.3.1 Macroeconomic Management
Goal: Maintaining macro-economic stability to facilitate social and economic development
Policy
Objectives
Strategies Key Performance Indicators
The nation
enjoys macro-
economic
stability and
growth on
which to build
improved
standards of
living and
quality of life.
Low and stable levels of inflation
are assured through use of fiscal
policy to manage budget deficits
and monetary and interest rate
policy to pro-actively manage
inflation.
Promote growth consistent with
criteria of the UNDP Human Life
Quality Index.
Inflation is to be kept around
3% percent over a 5-year
period.
Annual growth rate to
continually improve from the
forecast of -0.3% for 2009
Reserves level to continually
improve from the 1.8 months
of import cover in April
2009.
To maintain confidence in Fiji‘s
currency and capacity to meet
international financial obligations
through: maintenance of a stable
foreign exchange rate regime; a
reasonable level of reserves; pro-
active use of monetary policy and a
progressive review of exchange
controls with further relaxation in
annual budgets.
Interest rates on deposits are
at least positive in real terms.
Inflation and foreign reserve
targets (above) are met and
interest rate spreads reduced.
Debts to be reduced from 49
% of GDP to less than 40%
of GDP by 2012.
Transparent, market based interest
rates maintained at levels consistent
with low inflation and a
comfortable level of foreign
reserves.
To maintain a sustainable ratio of
debt to GDP by restricting spending
to levels consistent with debt
targets.
Revenue to be not less than
27% of GDP in each year of
the plan period.
Annual investment increased
to 25% of GDP with 15%
private sector investment in
2010.
Top corporate and income
tax rates no more than 30%.

73
Goal: Maintaining macro-economic stability to facilitate social and economic development
Policy
Objectives
Strategies Key Performance Indicators
Government revenue regime is used
to promote economic growth
through appropriate levels of
taxation, a broader tax base,
reduced distortions, increased
compliance and development of the
user pay principle.
To reduce government spending as
a proportion of GDP through tight
control of Ministerial expenditure
within budget provisions and
through improved cost recovery
measures.
Priority allocation of resources to
focus on core activities of
government in infrastructure, health
and education and increasing the
proportion of capital expenditure in
the budget.
Tax collected within 3
months of the due date to be
not less than 95% of the tax
due.
Government deficit to be 3.0
% of GDP for 2009 and
lower thereafter.
Capital to operating
expenditure mix of 20:80 for
2009 and to be 25:75 by
2010.
Maintenance expenditure to
be not less than 7.5% of total
expenditure.
3.3.2 Tourism
Goal: A sustainable, growing and globally competitive industry
Policy
Objectives Strategies Key Performance Indicators
Fiji benefits
from a
sustainable
increase in
economic
contribution and
retention of the
tourist dollar
from an
environmentally
and socially
sustainable and
equitable
tourism sector.
Additional rooms are constructed
to maintain a balance between
supply and demand.
New markets are developed and
the required physical and
institutional infrastructure
established.
Promote high growth niche
markets for specialized tourism.
Cruise ship and yachting tourism
promoted, using improved outer
island jetties and navigational aids.
Promote human resources
development and introduce
accreditation schemes for quality
of services, training and
productivity.
Increase institutional capacity and
Target 14,361 rooms by
2014
10% annual growth rate in
Tourism GDP
10% annual growth rate in
tourism investment
Target 4,600 additional jobs
created by 2014.
Target 925,000 visitors by
2014
Average tourist spend
increase by 10% per year
Average length of stay
increases to 8 nights by
2016.
Average occupancy rate
maintained at 65%

74
Goal: A sustainable, growing and globally competitive industry
Policy
Objectives Strategies Key Performance Indicators
resources of tourism facilitating
agencies, including a sustainable
funding formula for FVB.
Increase local supply of quality
agriculture, seafood and organic
produce for hotels and restaurants.
On-going review of the tourism
investment regime.
Broaden the benefits of tourism to
other regions.
E-Fiji online dynamic packaging
sales system established for all
tourism businesses.
Develop new direct links by air
with countries such as to Europe
and China via Korea, Hong Kong,
Singapore, India and North and
South America.
Review performance of domestic
air services with view to
benchmarking against international
performance standards for safety
and reliability, booking systems,
handling of schedule changes, fit
out of planes, luggage and freight
handling.
Establish an effective gateway to
the North, looking at expanding
the capacity of Savusavu to cater
for DASH 8 aircrafts and Labasa
to allow for night operations for
DASH 8 aircrafts.
At least 15% of FVB‘s
marketing budget dedicated
to promotion of the
Northern Division
Resource
owners benefit
from greater
participation in
the tourism
industry.
Promote licensed and accredited
tourism development on native
lands with equity participation by
resource owners.
Develop resource owner capacity
to develop and participate in
sustainable tourism industry and
tourism related activities.
Support training of resource
owners to participate in tourism
development
Development of natural and
cultural attractions including
5% growth in businesses
(51% or more ownership)
owned by resource owners
established and licensed per
year.
At least 50 per cent of
nature-based and
community-based tourism
operations meet or exceed
recommended best practice
guidelines and standards by
2012.
At least 4 new natural and

75
Goal: A sustainable, growing and globally competitive industry
Policy
Objectives Strategies Key Performance Indicators
scenic views, foot treks etc cultural attractions
developed by 2014.
Sustainable
Eco-Tourism
Development
Promotion and development of
Eco-Tourism facilities
Access to land sites for Eco-
Tourism Development
Development of eco-
tourism standards by 2010
5 percent annual growth in
Eco-tourism
3.3.3 Manufacturing and Commerce
Goal: Sustainable and globally competitive manufacturing and commerce industries
Policy
Objectives
Strategies Key Performance
Indicators
Fiji
supported by
a diversified
and
expanded
manufacturin
g and
commercial
sector.
Development of competitive, high value-
added manufacturing industries, including
agro-based and niche products.
Annual review of tariff barriers.
Enforcement of international standards,
weights and measures, and quality control on
domestic producers and importers.
Enforcement of anti-dumping legislation and
ensure imported goods meet Fiji standards,
including labels and packaging.
Implement electronic commerce policy and
legislation.
National programme improving
competitiveness through the National
Productivity Charter.
Annual foreign direct
investment to be 6% of
GDP in 2011.
Annual value of
domestic private
investment to be 9% of
GDP.
Annual exports of
goods and services
increase as % of
GDP.(to be consistent
with 105 quoted below
in Improved Business
Regulatory
Environment).
Fiji to improve on the
World Bank Doing
Business rankings.
Communities
should
benefit from
enhanced
consumer
protection
and
awareness.
Increase effectiveness of monitoring,
enforcement and service delivery by PIB,
Fair Trading Department, and Commerce
Commission.
Consumer Council to promote consumer
awareness and education.
Improve Government and Donor support to
the Consumer Council by 10% per year from
the present funding of $569,170 and to
enforce weights and measures standards.
Consumer complaints
solved through
mediation increased
from 15% (201/1305)
in 2005 to 30%.
Diversifying Effective implementation of the National Annual exports of

76
Goal: Sustainable and globally competitive manufacturing and commerce industries
Policy
Objectives
Strategies Key Performance
Indicators
Exports Base
Export Strategy (NES) to broaden the
country‘s export base.
Mainstream the National Export Strategy in
Government‘s developmental agenda.
goods and services to
be not less than 65%
of GDP.
Improved
Business
Regulatory
Environment
Fast tracking the implementation of the
recommendations of the ADB study on ― An
Analysis of the Legal Framework for Private
Sector Development‖.
Harmonize current Investment Approvals
Process (IAP) reforms with the above study.
Review/amend legislations relating to
business establishment and Investment.
Development of a national strategy for
Micro, Small and Medium Enterprises.
Annual value of
domestic private
investment to be 10%
of GDP (consistent
with 9% quoted
above).
3.3.4 Information and Telecommunications
Goal: Universal access to information and competitive telecommunication services
Policy Objectives Strategies Key Performance
Indicators
Responsible media.
Greater coverage given
by media to
Government
programmes
People and businesses
enjoy improved ICT
services in terms of
coverage, quality and
price.
Media Promulgation
Strategic partnerships with
media to ensure unfettered
dissemination of Government
information
Reduce telecom rates in the
short term by promoting more
discussions between potential
investors in ICT services and
providers of
telecommunication services.
Increased coverage of
telecommunication services
especially to rural areas by
continuing to provide
telecommunication access to
unconnected villages.
Develop Fiji as an attractive
info-communications hub in
the region.
A well informed citizenship.
Ensure the regulatory and legal
framework functions.
Increased coverage of
Government activities
Greater public
awareness of
Government
programmes and broad-
based appreciation of
Government
Reduction in telephone
charges by at least 25%
by 2011.
Telephone lines and
cellular subscribers to be
not less than 25% in
rural areas and 75% in
urban areas (MDG).
Increase number of rural
tele-centres from 5 to 25
by 2011.
Increase bandwidth to
all service providers to
be not less than 1000
Mbytes by 2011.

77
Goal: Universal access to information and competitive telecommunication services
Policy Objectives Strategies Key Performance
Indicators
Align broadcast and media
training to industry standards.
Establish an appropriate
framework and promote e-
commerce development.
Introduce e-government in
order to raise efficiency of
service delivery.
Provide appropriate support for
provision of ICT infrastructure.
Operation of new regulator .
Grant of at least another two
free to air television broadcast
licence
Allocation of communication
bandwidths to allow more
transmissions
Increase number of free-
to-air TV broadcast
providers by additional
2 by 2011.
License additional 1
cellular mobile
operators.

78
3.3.5 Micro, Small and Medium Enterprises
Goal: Creating sustainable livelihoods through enterprise development
Policy
Objectives Strategies Key Performance Indicators
Communities
improve their
livelihoods
through micro,
small, and
medium
enterprise
development.
Encourage excellence through annual
awards for individual and group MSME
excellence.
Improve business support services and
infrastructure by:
reviewing MSME laws and
regulations;
extending micro finance facilities to
all provinces;
providing incentives for large firms to
develop MSME suppliers; and
developing marketing for MSMEs
through research conducted regularly
on new markets and opportunities.
Establish a system to register MSMEs and
set up database, with view to move it on-
line (e-Gov) as an advertising site for
MSMEs in Fiji, exhibiting their range of
services.
Promote MSME capacity building in
partnership with NGOs at Provincial and
District level.
Develop a National MSME Strategy
Develop a nationwide program to improve
financial literacy and awareness,
particularly with schools and in the rural
areas.
Establish a venture capital scheme to assist
MSMEs.
At least 100 new MSMEs
registered in MSME
database each year.
Loans and savings clients
of MFIs increased from the
current 22,000 to 30,000 by
2014.
Business Incubation
Centres support
development of 200 new
enterprises during the plan
period.
Commercial bank lending
to small businesses
increases annually.
Creation of effective working partnerships
and networks to promote integrated
employment solutions at national and local
levels.
Development of new Local Economic
Development (LED) strategies and
community based employment models for
Fiji.
New inter-government
employment initiatives and
private sector partnerships
established
300 New Livelihoods
Created
Empowering local
communities and
institutions to address
unemployment.

79
3.3.6 International Relations and External Trade
Goal: Global integration for promoting political and socio-economic advancement
Policy
Objectives
Strategies Key Performance Indicators
Communities
should
benefit from
Fiji‘s
diplomatic
and
economic
relations.
Implementation of the National Export
Strategy, coordinated under the Ministry of
Commerce and Industry, to be implemented
as a Strategic Priority.
Diversify export markets, particularly in the
Asia-Pacific region, in partnership with
private sector.
Improve investment and trade facilitation and
negotiation capacity.
Enhance existing bilateral, regional and
multilateral relations.
With the private sector and concerned
agencies, develop a temporary employment
strategy and establish agreements with
regional countries, Gulf States, US and EU to
facilitate training and employment of skilled
and seasonal workers to be employed in
those countries.
Develop and implement Medium Term
plan/targets for free trade agreements.
Strengthen trade facilitation in areas of
quarantine protocols, customs, ports and
immigration.
Advocate Fiji‘s interest and profile in
regional and international institutions.
Adhere to international declarations,
agreements, conventions and treaties and
align domestic policies to them.
Recruit personnel with expertise in trade
negotiations and investment.
Develop a South Pacific Policy Statement on
regional resource pooling, governance and
security.
Secure visa free entry for Fiji citizens to
foreign countries and establish and update
registry for all countries granting visa free
entry by 2010.
Establish and maintain a website to provide
accurate and timely information on Fiji.
Exports of goods and
services to be increased
from 58% of GDP in 2005
to at least 65% of GDP.
Agreements in place with
key developed partners on
temporary employment of
Fiji nationals as skilled
and/or seasonal workers.
Cordial
bilateral and
multi-lateral
Bi-lateral discussions.
Convening of National Elections.
Alignment of Development Plans to MDGs,
Agreement in place with
Australia and NZ on
temporary employment
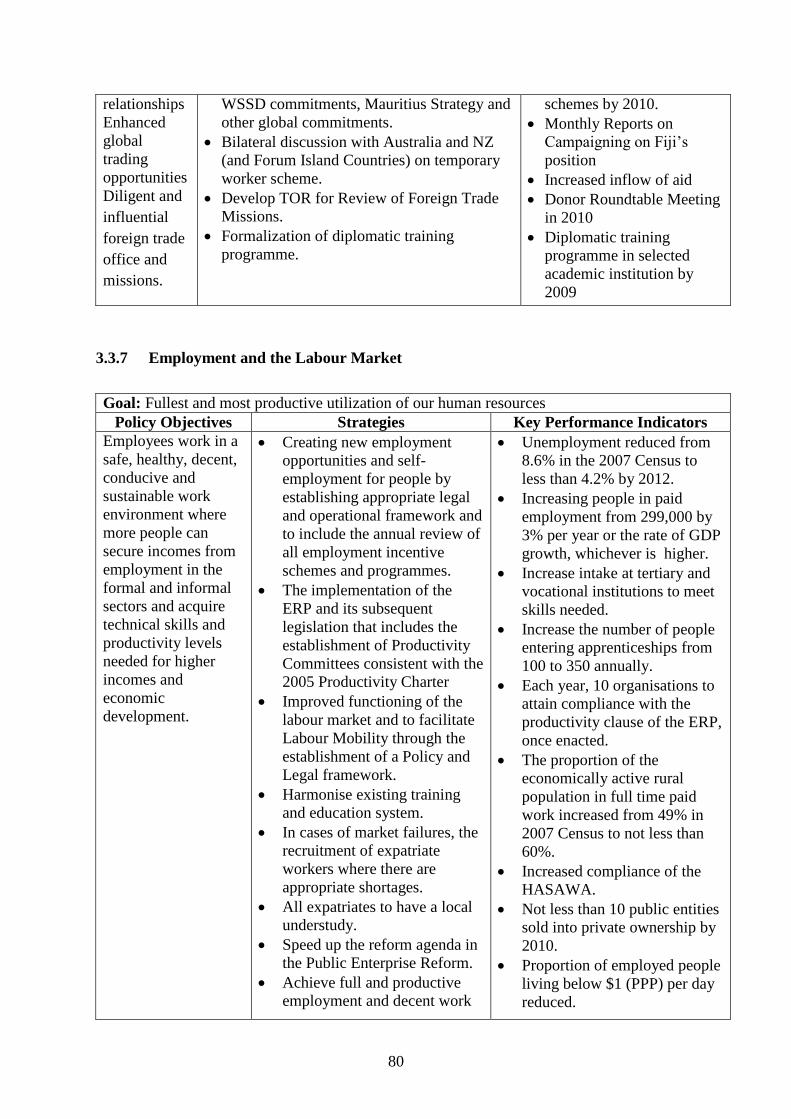
80
relationships
Enhanced
global
trading
opportunities
Diligent and
influential
foreign trade
office and
missions.
WSSD commitments, Mauritius Strategy and
other global commitments.
Bilateral discussion with Australia and NZ
(and Forum Island Countries) on temporary
worker scheme.
Develop TOR for Review of Foreign Trade
Missions.
Formalization of diplomatic training
programme.
schemes by 2010.
Monthly Reports on
Campaigning on Fiji‘s
position
Increased inflow of aid
Donor Roundtable Meeting
in 2010
Diplomatic training
programme in selected
academic institution by
2009
3.3.7 Employment and the Labour Market
Goal: Fullest and most productive utilization of our human resources
Policy Objectives Strategies Key Performance Indicators
Employees work in a
safe, healthy, decent,
conducive and
sustainable work
environment where
more people can
secure incomes from
employment in the
formal and informal
sectors and acquire
technical skills and
productivity levels
needed for higher
incomes and
economic
development.
Creating new employment
opportunities and self-
employment for people by
establishing appropriate legal
and operational framework and
to include the annual review of
all employment incentive
schemes and programmes.
The implementation of the
ERP and its subsequent
legislation that includes the
establishment of Productivity
Committees consistent with the
2005 Productivity Charter
Improved functioning of the
labour market and to facilitate
Labour Mobility through the
establishment of a Policy and
Legal framework.
Harmonise existing training
and education system.
In cases of market failures, the
recruitment of expatriate
workers where there are
appropriate shortages.
All expatriates to have a local
understudy.
Speed up the reform agenda in
the Public Enterprise Reform.
Achieve full and productive
employment and decent work
Unemployment reduced from
8.6% in the 2007 Census to
less than 4.2% by 2012.
Increasing people in paid
employment from 299,000 by
3% per year or the rate of GDP
growth, whichever is higher.
Increase intake at tertiary and
vocational institutions to meet
skills needed.
Increase the number of people
entering apprenticeships from
100 to 350 annually.
Each year, 10 organisations to
attain compliance with the
productivity clause of the ERP,
once enacted.
The proportion of the
economically active rural
population in full time paid
work increased from 49% in
2007 Census to not less than
60%.
Increased compliance of the
HASAWA.
Not less than 10 public entities
sold into private ownership by
2010.
Proportion of employed people
living below $1 (PPP) per day
reduced.

81
Goal: Fullest and most productive utilization of our human resources
Policy Objectives Strategies Key Performance Indicators
for all, including women and
young people.
Effective and efficient
resolution of employment
grievances, disputes and other
labour related matters through
the Mediation Unit,
Employment Relations
Tribunal and the Employment
Relations Court.
Establishment of Labour
Management Consultation and
Cooperation Committees
(LMCCC) for employers
employing more than 20
workers.
Development of systems and
processes in compliance with
ISO 9000 within the Civil
Service and the private sector
organizations.
Proportion of own account and
contributing family workers in
total employment increased.
3% productivity growth by
2012
Conduct at least 20 LMCCC
and Productivity structured
training per annum
commencing in 2010 for both
private and public sector
organizations.

82
3.3.8 Land Resources Development and Management
Goal: Effective management of land resources whilst ensuring sustainable development
Policy Objectives Strategies
Key Performance
Indicators
Resource owners and land
users securing long term
incomes from
environmentally sustainable
land development and
management.
Establishment of a Committee
to provide advice on land
availability options.
Set up Committee to initiate
work on Land Reforms.
Strengthen institutional
capacity and adequately
resource the Land Resource
Planning and Development
Unit and the Land
Conservation Board to enforce
land use policies.
Complete review of the Land
Conservation Act.
Strengthen resource
management and awareness on
appropriate land use and
watershed management
practices from the community
level.
Strengthen FLIS setup with
view to establishing a national
land register.
Encourage partnerships
between NLTB, Landowners
and Government to encourage
better utilization of land under
reserve.
Develop National Landuse
Plans for various divisions, and
provinces.
Promulgate a new
land tenure system
which allows
equitable returns to
owners and users
through an effective
market for land use
rights by 2011.
Establishment of a
National Land
Register by 2012.
Four divisional land
use plans in place
by 2014.
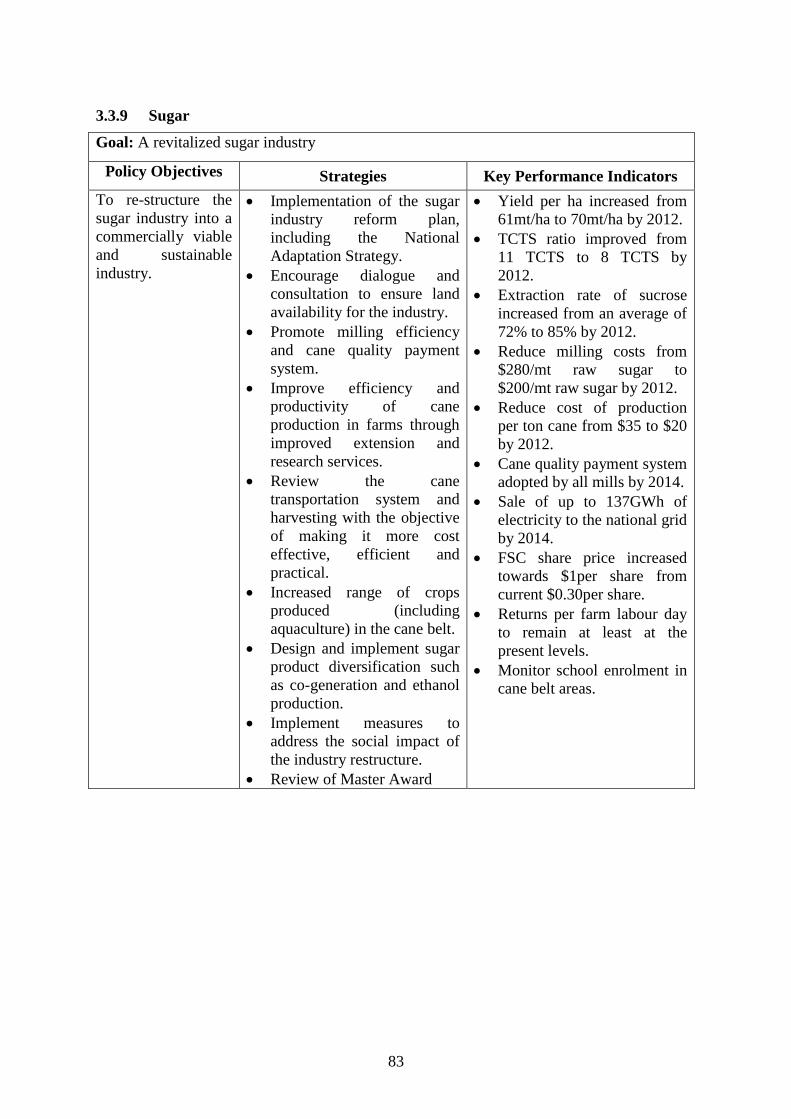
83
3.3.9 Sugar
Goal: A revitalized sugar industry
Policy Objectives Strategies Key Performance Indicators
To re-structure the
sugar industry into a
commercially viable
and sustainable
industry.
Implementation of the sugar
industry reform plan,
including the National
Adaptation Strategy.
Encourage dialogue and
consultation to ensure land
availability for the industry.
Promote milling efficiency
and cane quality payment
system.
Improve efficiency and
productivity of cane
production in farms through
improved extension and
research services.
Review the cane
transportation system and
harvesting with the objective
of making it more cost
effective, efficient and
practical.
Increased range of crops
produced (including
aquaculture) in the cane belt.
Design and implement sugar
product diversification such
as co-generation and ethanol
production.
Implement measures to
address the social impact of
the industry restructure.
Review of Master Award
Yield per ha increased from
61mt/ha to 70mt/ha by 2012.
TCTS ratio improved from
11 TCTS to 8 TCTS by
2012.
Extraction rate of sucrose
increased from an average of
72% to 85% by 2012.
Reduce milling costs from
$280/mt raw sugar to
$200/mt raw sugar by 2012.
Reduce cost of production
per ton cane from $35 to $20
by 2012.
Cane quality payment system
adopted by all mills by 2014.
Sale of up to 137GWh of
electricity to the national grid
by 2014.
FSC share price increased
towards $1per share from
current $0.30per share.
Returns per farm labour day
to remain at least at the
present levels.
Monitor school enrolment in
cane belt areas.

84
3.3.10 Non-Sugar Agriculture and Livestock
Goal: Sustainable community livelihoods through food security and competitive exports
Policy Objectives Strategies Key Performance
Indicators
Fiji is served by a
thriving agriculture
sector that sustains
Fiji‘s food security
and sets a strong
platform for
commercial
agricultural
development.
Establish commodity protocols with
existing and new markets (China,
Australia, NZ, EU, US, Japan) and
promote formation of industry
councils to spearhead/ coordinate
commodity development.
Strengthen demand driven research
and expansion in partnership with the
private sector.
Identify mechanisms to improve
accessibility of farmers to credit
facilities.
Build capacity at community level for
commercial agriculture. More
coordination required among various
programs implemented by different
ministries.
Improve linkage with local tourism
industry. Assessments to be
undertaken on industry needs and
awareness, training and support
provided to farmers to meet these
standards.
Review all existing BQAs and
commodity protocols. Assessment to
be undertaken on market needs and
current level of supply. This
information is to be widely
disseminated to farmers.
Improve training services. Review and
better coordinate training programs in
various ministries. Make training more
farmer friendly, more accessible, and
affordable.
Conduct household, village, settlement
food security awareness and support.
Promote standards for all commodities
and food stuff sold locally.
Increase
agriculture sector‘s
contribution to
GDP from 12% to
15%.
Value of annual
non-sugar
agriculture exports
increased to
$100m by 2014.
Value of fruits and
vegetables imports
reduced from
around $150m
annually to $80m
by 2014.
Increase lending to
agriculture sector
by commercial
banks to 1% of
total loan portfolio
by 2014 from
current level of
around 0.6%.
Agricultural
Census completed
by 2010
Maintain Food
Import Capability
Index at 0.17 or
better.

85
3.3.11 Forestry
Goal: Sustainable development and management of forest resources
Policy Objective Strategies Key Performance Indicators
Conservation and
management of forest and
biological resources
Institute forest sector
reform through
enhancement of national
capacity to manage and
develop the sector
Promote ecosystem
stability through
conservation of forest
biodiversity, water
catchments and soil
fertility.
Promote sustainable
supply of forest products
and services by
maintaining large
permanent forest area.
Building partnership in
forest plantation
development.
Enhance engagement of
landowners and
communities in
sustainable forest
management plans.
Determination of annual
allowable cut.
Adoption of revised
legislation to support the
Fiji Forest Policy
Statement 2007 and
National Forest Program.
by 2010.
Restructure of the
Department of Forest, FPL
and FHCL by 2010.
2 forest native reserves
identified and gazetted by
2014.
Increase forest area by 2%
annually.
Establishment of 5
conservation area and
protected forest areas by
2012.
Forest resource utilization
for optimum economic
benefits
Evaluation of yield and
quality of forest
products.
Development of
standards and guidelines.
Undertake research
focused on timber
utilization and product
development to
diversify the export base.
Promote resource
utilization efficiency in
primary and secondary
processing.
Diversification into
wood energy production
and pine resin tapping
by Fiji Pine Limited.
Increase export volume
and value by 5% by 2011.
Increase efficiency in
timber production by 5%
from 2010.
Adoption of Fiji Forest
Certification in 2010.
Establishment of
Competent Authority to
Support Forest
certification. Certification
of Pine and Mahogany
Plantations by 2010.
Determine value of carbon
credits from forest.
Increase employment in
the sector by 1% annually
from 2011.

86
Goal: Sustainable development and management of forest resources
Increase resource owners
participation and business
ownership by 5% by 2012.
Develop a non-wood
product industry to
generate at least $5 million
by 2012.
3.3.12 Fisheries Resources
Goal: Pursuing growth and ensuring food security through sustainable fisheries resource
management
Policy Objective Strategies Key Performance
Indicators
Ensure food security
through sustainable
fisheries resource
management
Review of policy,
legislation and institutional
arrangement.
Promote ecosystem
approach to coastal
fisheries and aquaculture
development.
Review of the Total
Allowable Catch (TAC).
Build capacity at
community level to manage
its resources.
Enhance resource
assessment and
management of inshore and
inland fisheries.
Strengthen food security
through freshwater
aquaculture.
Maintain and control
healthy oceanic fisheries.
Adoption of revised
legislation, policy and
management plans by
2010.
Restructure of the
Department of
Fisheries by 2010.
110 MPA identified
and gazetted by 2014.
Complete Marine
Inventory Survey of
410 Customary
Fishing Areas by
2012.
Increased freshwater
fish and prawn
production by 5%
respectively by 2012.
Fisheries resource
utilization for optimum
economic benefits
Evaluation of fisheries
resources.
Development of trade
standards and guidelines.
Undertake research focused
on product development to
Increase export
volume and value by
5% by 2011.
Full compliance to the
EU fish export
standard in 2010.

87
Goal: Pursuing growth and ensuring food security through sustainable fisheries resource
management
Policy Objective Strategies Key Performance
Indicators
diversify the export base.
Build local industry
capacity on HACCP and
CITES requirements.
Support local industry to
meet compliance standards
for re-entry into EU
market.
Encourage public and
private sector partnership
in industry development.
Improve linkages with
tourism industry and local
market.
Support existing income
generating commodities:
(seaweed, aquarium ,
tilapia, prawn, pearl).
Increase catch and
income of small scale
fishermen by 2%
annually by 2010.
Increase employment
in the sector by 1%
annually by 2011.
Increase resource
owners participation
and business
ownership by 5% by
2012.
Increase income by
5% from existing
commodities.

88
3.3.13 Mineral and Groundwater
Goal: Pursuing growth through sustainable mineral and groundwater resource management
Policy Objectives Strategies Key Performance
Indicators
Sustainable
development and
management of
mineral and
groundwater
resources to ensure
long term economic
benefits for all.
Strengthen resource management
by proactive enforcement of
provisions of the Environment
Management Act and other
legislations.
Implement Vatukoula
Rehabilitation Program
Complete the process of reviewing
the Mining Act to promulgation.
Capacity building within the
Department of Mineral Resources.
Review fiscal regime for mining
sector to be regionally
competitive.
Build local capacity and
institutional support for the
exploration and development of
other segments such as offshore
mineral, gas, geothermal energy,
marble quarrying etc.
Publish EIA Reports of all mining
operations be made on quarterly
basis, including costs of
exploration by Tenants.
The establishment of a Mineral
Resources Authority to be
mandated by legislation.
The adoption of a National Policy
Framework in the use of Best
Practices to act as guidelines for
planning, research and decision
making for all engaged in the
Mining Sector. This will create
better working relationship and
increased understanding between
landowners, developers and
government.
Put in place appropriate policy and
legislative support for the
management and utilization of
water resources, including
groundwater.
Sector contribution to
GDP restored to 1.1%
by 2012.
Promulgate revised
Mining Act in 2010
Annual exploration
expenditure doubled to
$12 million by 2010.
Increaes gold exports
to at least $77m
annually by 2012.
1 new mining
operation developed
by 2014.
Formulate a Long
Term Strategy or
‗Road Map‘ for the
Mining sector by 2010
Target $100m in
bottled water exports
by 2012.
Groundwater
contribution to GDP
be increased to 2% per
3 years.

89
3.3.14 Financial Services
Goal: An effective, competitive and stable financial system
Policy
Objectives
Strategies Key Performance Indicators
People and
organizations
in Fiji have
access to
appropriate
modes of
transparent,
sound and
secure
financial and
banking
facilities.
To review, evaluate, implement
and monitor appropriate
recommendations of the COIFS
report, the 2007 FSAP, EFF
review, Action plan for
Insurance and Guarantee
Schemes, FNPF studies and
restructure of Fiji‘s
superannuation sector, FDB
review recommendations and the
Rural banking survey
recommendations.
Promote development of formal
financial institutions in all rural
and outer island areas.
Develop, promote and monitor
financial instruments which
provide cost effective export
finance to remove financial
constraints on exports.
Increase the usage of
FIJICLEAR.
Enhance safety and protection of
financial institutions and
financial services from their use
and abuse by criminals for
money laundering, corruption,
fraud and other serious crimes.
Promote and protect customer
interests in financial services
Review legislations and
regulatory procedures, including
micro-finance regulations and
legislation on RBF, Banking,
Insurance, and Superannuation.
Enhanced monitoring of bank
fees and charges.
Collect and analyse data from
credit unions, micro finance
operators and similar sources.
Provide legal backing to Fiji
Accounting Standards and Fiji
Standards on Auditing.
Improvement in the accessibility
by micro, small and medium
enterprises to loanable funds for
economic purposes.
Encourage promotion of access to
basic banking services for rural
areas and the reduction in
unbanked areas by 2011.
Establish an indicator, which
allows the Government to both
measure and monitor this
accessibility on an on-going basis.
More use of export finance
through awareness and promotion
by commercial banks
Increased awareness of
Suspicious Transactions
Reporting (STR) and issues
relating to money laundering and
financing of terrorism throughout
all sectors of the economy.
Ensure that all major players
(FNPF, Government, FIRCA, etc)
use FIJICLEAR
Formalise and finalise all
reporting lines of STRs by 2009.
Achieve full compliance of the
requirements of the Financial
Transactions Reporting (FTR)
Act.
Ensure that financial institutions
under the FTR Act put in place
appropriate know-your-customer
rules and procedures and develop
and employ due diligence
policies.
Banks to fully justify fees and
charges and inform RBF and to
have complaint process in place
and monitored by RBF.
Total equity market capitalization
of listed entities increased to
100% of GDP by 2010.

90
Goal: An effective, competitive and stable financial system
Policy
Objectives
Strategies Key Performance Indicators
Establish an active capital
market of international standard
and encourage debt and equity
products to list on the stock
exchange.
Adopt international best
insurance and funds management
practices.
Enhance the public debt
management system.
Broaden the range of instruments
in consultation between
Government and RBF.
A survey to be undertaken in
identifying/establishing an
appropriate financial services
regulator.
Value of shares traded on the
stock exchange annually
increased to 2% of market
capitalisation by 2010.
The completion of the sector
regulator survey by 2009 and the
identification /initial plans
towards implementation by 2010.
Review the relevant legislations
by 2009 and to be in place by
2010.
RBF to continuously develop
policies and guidelines for the
financial sector that are in line
with international and best
practices.
Have a superranuation legistation
in place by 2010.
Widening
coverage of
financial
services
Increase rural and outer island
households with savings in
institutions and banks from 30%
to 50% and with borrowings
from 6% to 25% by 2012.
To explore avenues to capture
remittances within the capital
markets.
Develop a National Strategy for
the development of micro, small
and medium enterprises.
Setting up of incubator
programme for MSMEs‘.
Strengthen the central bank‘s
monitoring and supervisory role.
Develop/establish an information
sharing network system amongst
entities in the financial services
sector.
Adequate
prudential
supervision
The detection of suspicious
transactions increased from 300
to 500 by 2011.
Increase rural and outer island
households with savings in
institutions and banks from 30%
to 50% and with borrowings
from 6% to 25% by 2012.
RBF‘s Finacial System
Development and Compliance
Group to collect and disseminate
data on fees and charges,
complaints, etc. Establish a
Financial Services Ombudsman.
Examine whether there are
adequate mechanisms for
protecting consumers and
addressing consumer complaints.
Establish a Financial Services
Commission to look at customers‘
grievances, manage a

91
Goal: An effective, competitive and stable financial system
Policy
Objectives
Strategies Key Performance Indicators
comprehensive program of
consumers‘ awareness and
education and provide.
information and guidance on
financial institutions.
Review financial services
transaction framework to
encourage lending to sole traders
and small proprietorships
Ensure that the financial system is
operating under a sound and
stable environment with
appropriate levels of funds
management and improved
disclosures of financial
statements.
RBF‘s role in monitoring and
supervising the financial services
system must be increased to
contain or mitigate exposure to
economic or financial shocks.
Deepening
financial
markets
Development of the Capital
Markets which includes market
infrastructure and
microstructure; policy
frameworks and enabling
legislation; training and
development for intermediaries;
awareness and education
programs for investors and
businesses by 2009.
Development of capital market
regulatory aspects which include
licensing market players;
protecting investors through
prudential supervision; ensuring
compliance with relevant laws
and rules by market players;
regulating & supervising the
Stock Exchange; and promoting
Good Governance by 2015.
Do a roadshow and invite players
in Singapore, Malaysia to open
financial institutions in Fiji.
Establish a Capital Markets
Master Plan;
Review of legislations impacting
the financial markets;
Enhance the value proposition for
Fijian issuers;
Improve the role of the capital
market in meeting investors
preferences;
Develop internationally
competitive market institutions
and intermediaries;
Ensure the effectiveness of
regulation within the changing
market environment;
Formulate a comprehensive
vision and programme for the
development of Fiji‘s capital
market;
Formulate a framework for the
orderly and effective sequencing
of deregulation and liberalization;
and
Identify and map the direction for

92
Goal: An effective, competitive and stable financial system
Policy
Objectives
Strategies Key Performance Indicators
the strategic positioning of Fiji‘s
capital market both domestically
and externally.
Management
of
superannuation
funds
Using private fund managers to
invest FNPF funds,
demonopolize the industry with
superannuation remaining
mandatory, and demonopolizing
the industry with superannuation
optional for each citizen by
2015.
Individual participation in the
market is negligible To promote
wider participation, share
investment scheme of the FNPF
be extended to Government and
Government guaranteed bonds
by 2015.
Government to consider issuing
bonds only earmarked for small
investors by 2011.
All offshore investments
strengthened.
Split up the management of the
FNPF‘s investment portfolio.
Deregulation of the
superannuation industry
(demonopolisation of FNPF).
Improve the financial literacy of
its members.
Government to issue a yearly
program indicating when it will
issue bonds and Treasury Bills in
the market, in order for the market
and investors to be ready and
prepared for the issuance of these
papers.

93
3.3.15 Transport
Goal: An integrated transport system that is efficient, safe and environmentally sustainable
Policy
Objectives
Strategies Key Performance
Indicators
Multi-modal:
To ensure
access to safe,
efficient,
affordable and
environ-
mentally
sustainable
transportation
services.
Review Government Subsidies on Transport.
Attract potential investors to provide alternative
modes of transportation through PPP
framework.
To promote the use of public transport.
Introduction of effective measures to reduce the
number of road deaths, mishaps at sea and air
crashes through enabling legal frameworks.
LTA, FIMSA and CAAFI incorporate stringent
safety and security measures.
To continue investment in the construction,
maintenance and upgrading of the national
transport network supported by enabling
legislation and regulation enforced.
Ensure access to all forms of transport.
Promote the use of fuel efficient vehicles.
Undertake a wider study on the transportation
system in the Suva-Nausori corridor, including
study of intermodal and peak hour variability,
and make and implement appropriate decisions
on the recommendations.
At least one
transport PPP
project valued at
over $100 million
by 2014.
Reduction in
annual fatalities
on all forms of
transport by at
least 20% from
the present 90.
Land
Transport:
To enhance
livelihood by
reducing cost
of transport of
people and
goods.
Protect investment in the national land transport
network through effective controls on vehicle
overloading and adequate maintenance.
Reform and consolidate the land transport
sector.
Reform the Government Quarry.
Acquisition of plants and heavy machinery.
Continue the revision of traffic management
schemes.
Control the importation ages of second hand
vehicles.
Introduce alternative fuel powered vehicles.
Review the Land Transport structure and
funding mechanisms for implementation.
Improve vehicle operating costs by investing in
more maintenance.
Consolidation of the Traffic Act (Cap 176)
Review of the Land Transport Act, 1998 and
subsidiary regulations.
Merger of LTA & Dept of National Roads
(PWD)
Protect investment in the national land transport
Not less than
125km of national
roads resealed and
40km
rehabilitated each
year.
Annual CO2
emissions per
capita reduced
from 1.6mt to
1.0mt.
Average vehicle
emission levels
reduced from
40,000 ppm to
20,000 ppm.
Reduce vehicle
emission opacity
from 70% to 35%.
Reduce road
death toll from
120 to 50 pa.

94
Goal: An integrated transport system that is efficient, safe and environmentally sustainable
Policy
Objectives
Strategies Key Performance
Indicators
network through effective controls on vehicle
overloading and adequate maintenance
Reform & consolidate the Land Transport
Sector
Self-funding mechanism develop for LTA,
DNR, NRSC, Police Traffic & Municipalities.
Implementation and monitoring of user-pay
principles
Improve the traffic management schemes and
reduce traffic congestion at main trunk routes
Review current LTA traffic infringement fines
and penalties.
Control the importation of second-hand vehicles
Introduction of alternative powered vehicles
Review the Land Transport structure & funding
mechanisms for implementation
Improve vehicle operating costs by investing in
more road maintenance
Marine
Transport:
Communities
and the country
enjoy better
access to
passenger and
cargo shipping
services.
Improve efficiency at ports and provide
competitive international port charges,
including for cruise ships.
More frequent services to Maritime Provinces.
Develop and upgrade seaways and main rivers.
Ensure a high level of safety and security in sea
transport and prevent marine pollution.
Provide economical, safe, adequate and efficient
facilities for the transport of goods and people
to facilitate trade, transshipment and other
related functions.
Ensure optimal location, updated design and
construction of existing and new jetties.
Commence implementation of Rokobili Port.
Review of the Shipping Franchise – ROI.
Review of Fiji Shipping Corporation Ltd – ROI.
Re-organisation of FIMSA & review of the
Marine Act, 1986 and subsidiary regulations.
Develop a user pay concept for all possible
income generating capacity for the service
provided and to review the current charges on
services rendered.
Facilitate the training program for the
apprenticeship scheme for the 20 intakes for
2009 and ongoing apprentices.
Draft and promulgate a Marine (Aids to
Navigation) Regulation
Annual tonnage
of international
cargo handled in
Fiji ports
increased from
3.3 million
revenue tons in
2005 to 5 million
by 2011.
Minimum of 2
trips per month on
each outer island
route.
Fiji maintains its
White List Status.
Main Ports
maintain ISPS
Code status.
Integrated
provincial
development
Traveling public
satisfied with
government
shipping services.
Smooth
operations of the
shipping fleet.

95
Goal: An integrated transport system that is efficient, safe and environmentally sustainable
Policy
Objectives
Strategies Key Performance
Indicators
Provision of adequate maritime infrastructure
such as Aids to Navigation (AtoNs), Mooring
Buoys, Beacons, etc.
Identification and development of new &
shorter sea routes.
Replacement and maintenance of lighthouses
and beacons.
Update registry and improved database &
archival records
Update registry and improved database &
archival records
Provision of Safety standards, risk analysis,
monitoring, enforcement, communication and
operational capabilities necessary to ensure the
safe, secure and effective operation of the
maritime safety system and the protection of the
marine environment.
Cruise Ship and Yachting Tourism promoted,
using improved outer island infrastructure and
Aids to Navigation – ROI.
Introduction of effective methods to reduce
number of accidents and incidents at sea through
education including enabling legal framework
FIMSA to enforce stringent safety and security
measures in accordance with the ISPS Code
Improve efficiency at ports and provide
competitive international port charges including
cruise ships
Provision of up-to-date, timely and accurate
Hydrographic publications necessary for safe and
efficient navigation for navigable waters of Fiji
in the most cost-effective and efficient manner.
Qualified people
in the ship
building industry.
Improved and
safer shipping.
Global integration
& international
relations
The Maritime &
Port Sector and
the Marine
environment are
safe, secure and
clean for all its
users.
Procedure
familiarity
A comprehensive
information
management
system supporting
the enhanced
scope of FIMSA.
Maintenance of
international
standards.
Maintenance of
international
maritime
standards.
Improved
hydrographic
services
Air Transport:
To promote
development of
tourism and
exports to
expand
industries
relying on air
freight.
Continued improvements in airport infrastructure
and facilities, including capacity extension at
Nausori to accommodate 737-800, widening at
Savusavu, and upgrading at Rotuma to facilitate
as port of entry.
Design a model that will take care or manage
non-core activities of CAAFI
Increased number of passenger seats per annum.
Improved runway capacity to meet additional
cargo requirements.
Utilization of additional air traffic rights under
existing ASAs by 2009.
Restructure and reform the aviation industry in
3 or more airlines
with unsubsidised,
scheduled domestic
flights.
Passenger seat km
on domestic flights
restored to 1999
levels of 110
million by 2010
and increased to
not less than 150
million by 2011
from 73.1 million

96
Goal: An integrated transport system that is efficient, safe and environmentally sustainable
Policy
Objectives
Strategies Key Performance
Indicators
line with international standards by 2009.
Airstrips to be compliant with ICAO
international standards.
A new international airport in Vanua Levu to be
evaluated and considered by 2010.
Review the role of Air Pacific in the
development of the tourism and export sector
Encourage domestic and regional aviation
competition to benefit Fiji‘s travelling public,
tourism and export sector.
in 2005.
International
airfreight capacity
increased from 700
million tonne/km
in 2005 to not less
than 1,000 million
tonne/km by 2010.
3.3.16 Energy
Goal: A resource efficient, cost effective and environmentally sustainable energy sector
Policy
Objectives
Strategies Key Performance
Indicators
The
community has
increased
secure access
to affordable
and reliable
energy
supplies.
Enact/enforce appropriate legislation
to improve sustainable energy use,
including the National Energy Policy
(NEP) and Renewable Energy Based
Rural Electrification Act (to be
remove).
Develop and implement a national
electrification master plan covering
both grid and stand–alone systems
with appropriate resources.
A specific Power Development Plan
is put in place for Vanua Levu.
Monitor customer satisfaction on
national grid power availability and
other appropriate aspects of service
delivery.
Formation of an appropriate
independent regulatory agency and
review the Electricity Act.
Greater collaboration within the
industry and with other sectors and
strengthen private sector
involvement in all forms of energy,
including review of tariffs, cost
recovery and competition in energy
GDP per kg oil
equivalent, at constant
1995 prices, increased
from $5 in 2004 to $8 by
2010.
90% national
electrification coverage
by 2012 with urban
increased from 95% to
98%and rural areas from
70% to 85%.
Household power outages
on Grid Lines are each
not more than 5 minutes
by 2012.
IPP to produce between
200 - 250 GWh of energy
per year by 2012

97
Goal: A resource efficient, cost effective and environmentally sustainable energy sector
Policy
Objectives
Strategies Key Performance
Indicators
production.
Encourage competition in the
generation of energy.
Strengthen the
capacity for
energy
planning and
information
management
for energy
sector
Establish a reliable energy
information system for end use
decision making at all levels.
To put in place appropriate
institutional structure.
Strengthen coordination and
consultation with key stakeholders
and the external environment on
energy development (issues with
regards to Climate Change, CDM,
Renewable Energy Technology
Transfer etc.)
An up-to-date and reliable
energy statistics and a
user friendly information
system by 2010.
Appropriate staffing
structure adopted by 2010
A vibrant network with
energy institutions locally
and internationally.
Secure additional and new
funding sources with
donor agencies.
Enhance
energy security
through greater
participation
and
collaboration
within the
industry.
Assess Fiji‘s energy security
situation to guide future policy
decisions.
Reduce inefficient use of energy
through research, demonstration,
energy audits, regulation, building
codes, and create a robust market for
energy efficient appliances.
Mandate the adoption of Minimum
Energy Performance Standards and
Labelling for refrigerators and
freezers in Fiji.
Promote measures to reduce fossil
fuel consumption, including in the
transport sector, and encourage
alternative fuels for the power and
transport sectors.
Report on Fiji‘s Energy
Security Situation to be
completed in 2010; and
recommendations
adopted.
Improvement in the
national electricity mix
from 40/60 renewables to
fossil fuel to 90/10 for the
grid and from 5/95 to
55/45 for off grid energy
by 2012
10% reduction (after
growth adjustment) in the
national electricity grid
consumption by 2014
All freezers and

98
Goal: A resource efficient, cost effective and environmentally sustainable energy sector
Policy
Objectives
Strategies Key Performance
Indicators
Assess and promote development of
local renewable energy resource
potential in Fiji.
refrigerators sold in Fiji
comply to the relevant
adopted standards by
2010.
Energy Efficiency and
Conservation Measures
incorporated in the local
building codes by 2011.
20% of fuel for transport
is met through bio-fuel
(E5 & B10), LPG and
other renewable sources
by 2012
30 biogas plants installed
in rural areas every year.
3.3.17 Water and Sewerage
Goal: Access to safe drinking water and a sanitary waste disposal system
Policy Objectives Strategies Key Performance
Indicators
The community is
served by access to
reliable and adequate
supplies of safe water in
both urban and rural
centres and to sanitary
and environmentally
safe sewerage waste
systems and treatment
facilities
Expand rural water supply
schemes and extend and upgrade
major urban and regional water
schemes to include rural areas as
outlined in their respective master
plans.
Expansion of the sewer
reticulation network and
sewerage treatment facilities and
promote the need for care of the
environment
Private sector participation in the
provision of capital works of
water and sewerage services
increased through outsourcing or
management contracts and
reorganisation of Water and
Sewerage Department as a Fiji
Water Authority, supported by
review of tariffs and to improve
efficiency and effectiveness.
90% of the urban
population and 75% of
the rural population
have access to safe
water supply by 2012
Increase in the annual
number of water
connections to new
customers from
approximately 3,000 to
3,500.
Increase in the urban
population with
sewerage connection to
not less than 35% by
2012
Level of unaccounted
for water reduced from
approximately 30% to
25% by 2012.

99
Goal: Access to safe drinking water and a sanitary waste disposal system
Policy Objectives Strategies Key Performance
Indicators
Identify 30 possible water and
sewerage projects and prepare
cost estimates and tender
documents for implementation
under contract; and promote
aggressive leakage reduction
programmes by setting targets for
volumetric savings per month.

CHAPTER 4

100
Chapter 4 Socio-Cultural Development
4.1 Review of Social Development
4.1.1 Human Development Index and Millennium Development Goals
One of the key purposes of good governance is the creation of a society free from poverty
where all have equal access to their basic needs and social justice is assured. The
challenge is not only to reform the economy in order to boost economic growth but also
to empower the people as a means of revitalizing their livelihoods. This calls for a human
rights approach to development planning that places people at the centre of development
efforts. The added value provided by this approach is that the norms and values enshrined
in it have the potential to empower the poor. This is important, because it is now widely
recognized that effective poverty reduction is not possible without empowering its
people.
Most of the social indicators have worsened in Fiji over the past decades. These
indicators include the Human Development Index (HDI) and the Millennium
Development Goals (MDGs) - the proportion of the people living in poverty, maternal
and child mortality rates, and primary school enrolments.
The HDI is a widely accepted measure of a country‘s progress in attaining satisfactory
levels of education, health and income. Fiji‘s ranking was 42nd
in 1975 but dropped to
61st in 1997. Its position further eroded in the late 1990s. Based on the 2007/08 UNDP
Human Development Index, Fiji currently is placed 92nd
out of 177. Samoa and Tonga
— which had rankings similar to those of Fiji in the 1970s — have performed much
better than Fiji in recent years, with rankings of 77th
and 55th
in 2007/08 respectively.
The MDGs and their associated targets and indicators, which were endorsed by 189
countries including Fiji at the 2000 Millennium Summit, provide a recognised set of
indicators that can be used to judge the key elements of social progress. 23 of the 58
MDG indicators are included as Key Performance Indicators in the relevant chapters and
links to MDG indicators are stated. The revised monitoring framework for MDGs is
attached as Appendix 2.
4.1.2 Global Partnership for Development
The purpose of any aid programme is to contribute to the improvements in the lives of the
poor in the community. The aid effectiveness agenda, enshrined in the Paris Declaration of
Aid Effectiveness (2005) and more recently through the Accra Agenda for Action (AAA)
(2008), aims to improve the quality of delivery, management and use of official
development assistance (ODA) in order to maximize its development impacts.

101
The Paris Declaration on Aid Effectiveness represents a significant step towards
formalizing and focusing international efforts to improve the effectiveness of aid and its
contribution to development.
Given the strong support of the above by Pacific Island Member Countries and
Development Partners, the Pacific Islands Forum Secretariat (PIFS) was directed to
develop a set of Pacific Principles for Aid Effectiveness. In April, 2008 Pacific Island
Countries participated in a Regional Workshop in Nadi to consider progress in the
implementation of the Pacific Aid Effectiveness Principles and in preparation for the Accra
High Level Forum on Aid Effectiveness.
Relating to the above, the Fiji Government recognizes the need for Global Partnership for
Development, specifically relating to Goal 8 of the Millennium Development Goal. The
Roadmap aligns donor programmes to its development initiatives. The Roadmap
acknowledges the need for strengthening donor coordination and ensures its commitment
to increase the effectiveness of aid through adhering to the principles of the Paris
Declaration.
Development assistance to Fiji is important and development partners continue to work
with Government to improve the livelihoods of people in Fiji. However, aid donor grants
are not large and represented around 1.3 % of Fiji‘s GDP in 2003. Donor grants fell in
2000, as most development assistance was withdrawn following the May 2000 crisis.
Donor funds increased in 2001 and were restored to more normal levels in 2002.
Estimates for 2004 and 2005 show that donor grants were more than doubled compared
to 2002 as the Australian programme expanded and the EU programme was re-
established. Loan finance is also available through the Asian Development Bank.
Donor programmes are well-aligned to the areas covered by the MDG‘s. In the Education
Sector, the Fiji Education Sector Programme (FESP) continues to assist the Ministry of
Education with the provision of improved infrastructure and upgraded facilities. The total
5-6 year programme with a Non-State Actor component has been funded via a $45million
grant from the European Union. Likewise, assistance to the Ministry of Education in
terms of capacity support, relevant training and upgrade of tertiary qualifications will
likely be the focus in the next 5 years for the second phase of the AusAID funded Fiji
Education Sector Programme. Scholarships from NZAID and AusAID will continue to
provide the thrust for higher learning for those seeking further education. The
construction of the Japanese Government funded ICT Centre at the University of the
South Pacific will see a state of the art learning environment conducive to delivering
better ICT outcomes for not only Fiji citizens but the Pacific populace that study there as
well.
In the Health Sector, a second phase of the AusAID funded Fiji Health Sector
Improvement Programme is envisaged to commence in 2010, possibly for the duration of
another 5 or so years. This initiative will likely focus on strengthening the capacity of the
Ministry of Health to provide an even more efficient and effective standard of service
delivery to the citizens of Fiji. The NZAID Medical Treatment Scheme will continue to
102
complement Government‘s own efforts to provide medical treatment abroad. The
interventions of WHO and UNFPA in areas dealing with support for training, population-
related initiatives, preventative programs and general health assistance should continue in
the near future.
Development Constraints and Challenges
Whilst the level of Government-Donor engagement is relatively significant during the
review period, the lack of proper framework to guide this engagement was an issue of
concern. Donor coordination and enhanced partnership needs to be strengthened. To this
end Government aims to improve its coordinating mechanisms, using proper guidelines
and procedures whereby government and donors will work together to ensure that
Government‘s priorities are addressed for sustainable development. Government is
committed to increase the effectiveness of aid through adhering to the principles of the
Paris Declaration and the Pacific Principles.
4.1.3 National Identity and Social Cohesion
Fiji is a multi-racial, multi-cultural and pluralistic country with a multiplicity of
languages, religions and ways of living. However, the country is a fragmented society
because there is no unity amongst the two major ethnic group. Previous attempts were
made to address racial differences and disunity by successive governments, NGOs and
Civil Societies, but did not come to fruition. There is an absence of a National Identity.
At present the citizens of Fiji identify themselves more strongly with their religions,
ethnicity and by their various community or province than by nationality.
Most of the i-Taukei lived in villages, grouped into districts and provinces and they had
aligned themselves with Christianity because it brought civilisation into the country and
was the first western religion to arrive in Fiji through the missionaries whereas Fijian
Indians are mostly associated with Hinduism and Islam; and Fijian Chinese with
Buddhism. Within each of the ethnic or religious groups, there exist various other sub-
divisions, such as tikinas or districts, which embrace many villages. Districts have
similarities and differences in terms of dialects, religious beliefs and culture. Different
religions have different denominations, sects and sub religious groups. We as people of
this country lack understanding and appreciation of each others socio-cultural
uniqueness. This contributed to religious intolerance and religious sacrilege because
people do not appreciate and respect others faiths and beliefs.
These differences were usually taken by many of our political leaders to gain political
mileage. During the past thirty eight years, political leadership played a key role in
dividing rather than uniting our people. The division was derived from the colonial
system of leadership of divide and rule. Our leaders have failed to unite our various
communities in a form that truly reflects our diversity.
Weak and poor leadership contributed to the building of a fractured and fragmented
society. Leadership in the past had intentionally kept the people of Fiji apart, and had

103
used the race card for their survival. If Fiji‘s leaders and its people do not work together
or join hands to define what we have in common and what we want to achieve together in
the future we will never achieve the peaceful and prosperous society which we all aspire
to.
Development Constraints and Challenges
The lack of social cohesion has contributed to exclusiveness and lower economic growth.
One of the main challenges we face is how to unite people who comprise several ethnic
communities with diverse social, economic and cultural backgrounds. It is this diversity
which requires a symbol that is acceptable for the whole population, as a basis for the
development of national identity and creates firm allegiance. This allegiance can be
constructed, made concrete, communicated and maintained over time. The process to
negotiate a national identity is a continuous process which demands inclusiveness and the
fair representation of people and cultures. The end results ought to be a shared
conviction that people are socialized into believing its essence, resulting in its
internalization.
A process needs to be designed and facilitated that can include the participation of all
communities and leaders need to be focused on our nation rather than their sectional
interests. We need to build Fiji into a non-racial, culturally-vibrant and united, well-
governed, truly democratic nation that seeks progress, and prosperity through merit-based
equality of opportunity, justice and peace. Establishing a national identity through a
common name is of utmost importance with education, religion, and culture having
important roles to play in our peaceful co-existence, social cohesion and nation building.
4.1.4 Poverty Reduction
The growing incidence and the dynamics of poverty in Fiji have stratified and polarized
Fijian society between the haves and the have-nots and between the educated and the
uneducated. Poor parents beget poor children, creating a kind of dynasty of the poor. The
resulting tensions and social conflicts have eroded the fabric that held the Fijian society
together.
Poverty reduction is the most difficult challenge facing Fiji and its people and the greatest
obstacle to the pursuit of sustainable socio-economic growth. Reducing poverty has been
a core policy objective of successive Governments for many years and has been regularly
articulated in development plans and strategies and annual budgets. Poverty reduction is
a core objective of all development partners and the first MDG concerns the eradication
of extreme poverty and hunger.
On the basis of the 2002/03 Household Income Expenditure Survey (HIES) results,
34.4% of the population lived below the Basic Needs Poverty Line (BNPL), indicating a
5% increase from the 1990-91 HIES. Most of those in poverty are people living in rural
areas, particularly those from the Fiji Indian community. The poverty gap is estimated to
have been $2,616.64 per year for an average household. The gap is the difference

104
between the national poverty line (estimated at $8062.6 in 2002), and the average income
of a poor household ($5,445.96 per year). This indicates the depth of poverty. Fiji
remains a society with deep income inequalities. The 2002-03 HIES shows that the
poorest 20% of households received 5.9% of the national income while the top 20% of
households received 47.9% of the national income. Results of the 2008-09 HIES will be
available by the end of 2009.
Further, the estimated basic needs poverty line (BNPL) per household per week increased
from $28.45 in 1977 to $83 in 1990 and to $132 in 2002. Statistics collected from
various HIES indicate the existence of high levels of poverty in Fiji although the non-
availability of consistent data on poverty has resulted in various viewpoints on the actual
levels of poverty in Fiji. There is clear evidence of a worsening of the poverty situation
(35% by 2002) and there has been no evidence of any significant improvement in more
recent years.
Poverty has many dimensions, one of which is the extent to which people have sufficient
food. In the MDGs, this issue is measured by the prevalence of under-weight children,
and the proportion of the population who are receiving less than the minimum level of
dietary intake. The most recent national figures were collected by the 2004 Fiji National
Food and Nutrition Survey. The survey found a low incidence of child malnutrition. At a
national level, the incidence of under-weight children less than 5 years of age in Fiji was
15% in 1980, 10.5% in 1993, and 7% in 2004.
Coordination and monitoring of all poverty targeted programmes is essential. The
Poverty Monitoring Unit needs to be strengthened to implement the National Integrated
Poverty Eradication Programme Framework. Government remains committed to funding
ongoing poverty targeted programmes such as assistance for housing and squatter
upgrading, microfinance, education assistance and family assistance. This is evident in
the increase of the minimum monthly Family Assistance allowance of $30 to $60. Rural
livelihood development projects, including the Rural and Outer Island Development
Project and the Northern Development Programme will supplement existing government
initiatives towards poverty alleviation.
Mainstreaming issues facing people living with disabilities is a great challenge but also a
crucial component of poverty reduction. Through the Department of Social Welfare and
the Fiji National Council for Disabled Persons, the Government adopted the Fiji National
Disability Policy in November 2008. Identified outputs of the policy will enable the
advancement of programmes, development of strategies and identification of activities to
improve and progress the status and well being of people living with disabilities. The first
ever national count of people living with disabilities has been completed and more than
10,000 have been recorded to live with some form of disability, mental, physical or both.
The results of the count will enable the development of focused programmes and
targeted interventionto be designed to reduce the vulnerability of people with disabilities.

105
Development Constraints and Challenges
National income redistribution is the main cause of poverty in Fiji. Low economic growth
is compounded by the instability of land tenure, which affects a range of activities in the
economy.
The key issues inhibiting poverty reduction include; a lack of political commitment;
political instability (weak governance); lack of access to economic assets, markets and
social services; ineffective coordination, implementation, and monitoring; lack of
participation by all stakeholders vis-à-vis Government, the private sector and civil
society; absence of sustainability mechanisms in programmes and projects; and lack of
involvement of beneficiaries in project design, implementation, monitoring, and
evaluation.
The creation of more sustainable, secure employment opportunities with better wages is
the long-term mechanism for moving people out of poverty. However, at current levels of
economic growth, there are restricted job opportunities and inadequate support for the
poor to enable them to take greater advantage of existing opportunities. There is a need to
provide an enabling environment and stimulate the active participation of the private
sector, civil society organizations, communities, and development partners generating
income earning opportunities.
Widening income inequality is increasing poverty in Fiji. Economic growth has tended to
benefit those already better off, further worsening the rural- urban disparity. Fiscal
policies over the past decades have not addressed income redistribution. An emerging
challenge is the weakening of the traditional family support system, resulting in more
people seeking welfare assistance, particularly the elderly.
There is a need to empower all citizens through education. There are a large number of
students dropping out early from school. With limited skills and knowledge to improve
their livelihoods, early school leavers make up a large number of the unemployed and
subsequently contribute to the rising tide of crime and violence. There are acute shortages
of infrastructure and facilities at all levels. The education system emphasizes theoretical
knowledge at the expense of technical, vocational, and entrepreneurial education. School
curriculum need urgent review to make them relevant and practice oriented. There is a
need to provide unhindered access to compulsory universal basic education to all citizens
as a bridge to the future socioeconomic transformation and establish and maintain
enhanced quality and standards through relevant, competency-based curriculum and
effective quality control at all levels.
One of the major drawbacks in monitoring poverty in Fiji has been the lack of
appropriate, comprehensive and timely data and analysis on which to assess the actual
level of poverty. Welfare services for the very poor or destitute are provided by several
government agencies as well as by NGOs, but there are very few well-coordinated
reporting systems.

106
The area of disability has, over the years, endured considerable development constraints
like financial assistance, human resources, technology and infrastructure and the lack of
data and statistical information on all areas and forms of disability.
Continuous challenges faced by people with disabilities and organisations include the
mainstreaming of disability issues in all programs of Government and civil society
organisations; strong collaboration between all partners on service delivery and program
implementation; advocacy and awareness of concerns for the rights of people with
disability; and the limited ambit of laws and regulations governing the area of disability.
4.1.5 Housing and Urban Development
Fiji‘s housing crisis is real and pervasive. An indicator of this is that there are currently
about 200 squatter/informal settlements comprising of about 100,000 people in the
country. The majority of these people constitute the bulk of the 387,000 people earning
less than $7,000 per year. Approximately 50,000 low to moderate income households
currently need decent, safe, affordable housing. In seeking to meet these need, the
production of mixed-income housing development that provides for broad income
diversity in neighborhoods is deemed a desirable social and economic goal, however the
form the actual design and implementation of this option takes is crucial.
The continuous growth of urbanization in the Fiji economy and population indicate that
strong demand for housing will continue. The provisional 2007 population census results
show an increase in urban household by 18.4% with approximately 61,300 total increase
in population. 51% of the population is urban and that the urban growth rate is 1.7%
compared with the national growth rate of 0.7%. Approximately 90% of the increased
population (55,266) is in the Western and Central Division. The Suva and Nausori Urban
and Peri Urban area alone has an increase in population of approximately 32,300. This
poses significant challenges in terms of planning, delivery and community development.
The housing needs of the majority of people in Fiji are met by the private sector, however
with the expiry of land leases there is increasing number of people seeking housing. This
is evident with the growing number of informal settlements and the growth of private
rented housing sector. The level of private provision depends of course on significant
Government support through:
Capital investment in infrastructure;
Planning and regulatory regimes which facilitate the efficient operation of the
market; and
Support to households under the fiscal and income support regimes.
Enhancing the local government framework remains a key strategy for addressing
housing, squatter settlement and other urban development needs. There is a need to create
a more amiable relationship between national and local government authorities to allow
for more effective national development programmes to be carried out in towns and
cities. The completion of an independent review of the local government framework will

107
provide the Government with options on how to improve the delivery of municipal
services and accountability of local government authorities, which are currently under the
control of Administrators appointed by Government.
Development Constraints and Challenges
There are two important issues that need to be addressed for Fiji‘s housing sector. Firstly,
that the key instruments to address the challenges for the future are in the areas of
―planning, urban design, infrastructural investment, land management and public service
delivery‖. Secondly, that a greater quantity of housing must not be at the expense of
quality development.
The plan to encourage the use of land to improve rural situations eg through providing
incentives for rural living to reduce urban migration is a necessary complementary
initiative. Resource constraints has contributed to Governments being unable to provide
enough land for people to prosper, build and own houses and ultimately form sustainable
communities. Sustainable housing programs should go hand in hand with income
generating opportunities and accessibility to amenities.
Currently, Fiji does not have an employment strategy. Having an employment creation
strategy, together with the availability of more land, could help in resolving both the
unemployment situation in rural areas and urban migration. Key agencies involved with
the management, acquisition and utilization of land in Fiji eg Lands Department and the
NLTB need to rationalize and formulate a transparent, consistent process for acquiring
land for housing development. Most of the informal settlers live on ‗vakavanua’8 land,
given to them some 30 to 50 years ago to settle. There is a need for Native Land to be
allowed the opportunity to be developed in a manner that would be beneficial for all
stakeholders especially landowners. The lack of development capital has been identified
as a major constraint. To acquire quick returns, some landowners have resorted to
issuing ‗vakavanua’ leases all around Fiji.
There is a need for a more integrated, coordinated and holistic approach in the
development of policy and the implementation of stakeholder programmes for housing in
Fiji. This should include periodical review and ongoing dialogue among stakeholders on
their perspectives on housing issues in Fiji and would necessarily include information
sharing and partnerships in the delivery of low cost housing programmes. Because the
actions and authorities of multiple government and semi-government departments and
agencies explicitly and implicitly affect housing, inter-agency communication and the
sharing of resources would facilitate for delivering more affordable, accessible housing.
It is important to encourage a multicultural and pluralistic society: multiculturalism is a
part of sustainable communities. Any housing development initiatives should look at
allocating spaces for places of worship as well as recreation..
8 ‗Vakavanua settlements‘ are informal settlements acquired through customary arrangement with the land
owners and there is no legal basis for ownership or lease.

108
4.1.6 Social Justice
Social justice is a fundamental aspect of the common good. It broadly consists of two
elements: justice and charity. The goal of social justice is to ensure equality of dignity,
especially those who, through no fault of their own, are disadvantaged and destitute. It is
also to ensure that everyone has the basic right to a dignified life, enjoys equality of
citizenship, and that no one lacks the basic necessities of life.
The 1997 Constitution provided the legal justification and framework for the enactment
of the Social Justice Act 2001 and implementation of Affirmative Action Programmes in
the areas of: (a) education and training; (b) land and housing; and (c) participation in
commerce and in all levels and branches of service of the State. The social justice clauses
under the 1997 Constitution will be retained under Fiji‘s new Constitution with further
restrictions placed on when AAP can be utilized by future Governments that is consistent
with the principle of equal opportunity before affirmative action and affirmative action
only when there is a genuine need for it.
Since the implementation of AAP under the Social Justice Act in 2001, Government has
allocated almost $300 million for the various groups targeted in the 29 programmes. Each
programme has specific goals and target beneficiaries, means of assistance, performance
indicators and criteria for selecting members of the target group. The criteria for selection
include race, gender, economic status, disability and physical location. Of these
programmes, 17 benefit all communities, 10 benefit Fijians and Rotumans as a target
group and 2 are specifically for Indians and minority communities.
The broad issue for Fiji is the articulation of an acceptable legal, social and moral
framework that is based on the pursuit of ―equal dignity‖ and which will guide the
development and governance of Fiji in the future.
Development Constraints and Challenges
To be just in designing and implementing the Social Justice Act and the AAPs, it is
important that reliable, highly accurate and updated information on poverty and
disadvantaged communities is readily available. There is a need to design AAPs that are
effective, transparent and meet the needs of the genuinely disadvantaged communities.
To measure the successes or failures of the AAPs, indicators are needed for the four
broad programme categories. Qualitative indicators would be much more helpful to
gauge the progress achieved in these categories. It is difficult to conduct monitoring
assessments if the specific indicators and objectives of the programmes are not tied to the
broad categories under which each of them fall. Each programme has its own specific
objectives and indicators for measuring its successes or failures, although most of them
have no historical content to indicate where a certain programme started, its
achievements so far, and suggestions for a review of the indicators.

109
There is a need for an improved financial monitoring and tracking system that would
allow for proper accounting of funds and be subject to audit by the Office of the Auditor
General. It is not clear from the 2002-03, 2004 and 2005 annual reports how the funds
had been spent, who were the recipients, and whether or not the funds were utilized for
the purposes for which they were disbursed. Without a good financial monitoring and
tracking system, which should be an integral part of the overall monitoring structure,
programme funds would be open to abuse and misappropriation.
4.1.7 Education and Training
Elementary, Primary and Secondary Education
Access to basic education is a right of all Fijians. Education, up till secondary level, is
well established in Fiji with ownership and management of schools being in partnership
between State and community. 98 percent of schools are managed by civil society and
non-government organizations while government provides teachers and sets curriculum.
The role of education in building unity has been comprehensively discussed in the Fiji
Education Commission (FIEC) report of 2000. Some of the recommendations have been
implementedin the education system and some incorporated in Fiji‘s National Curriculum
Framework.
Fiji is on target with MDG 2 ―to achieve universal primary education‖. Fiji has attained
near universal primary education, but primary school enrolment and net enrolment rates
have decreased since 2000. There is concern about the growing number of drop-outs from
primary school. The percentage of pupils starting Class 1 who reach Class 5 has
increased from 88% in 2002 and 93% in 2006. Class 5 survival ratios stood at 95.2%,
indicating that more effort needs to be made to keep students at primary school. The
2004/2005 Employment and Unemployment Survey revealed that 90% of the persons
aged 5 to 14 were attending school, with the proportion a slightly higher 92% for Indo-
Fijians compared to 89% for Fijians. Some 10% of this age group were not attending
school with 8% for the Indo-Fijians and 11% i-Taukei. The gap widened at higher
educational level, where 31% i-Taukei, 24% of Indo-Fijians and 15% for Rotumans of
the 15-19 age group were found to be not at school, however an average of some 73%
were at school. Though some parents cannot afford school costs, particularly in rural
areas, these dropouts are of concern given the need to maximize the education potential
of the workforce.
The large number of students dropping out early from school is a critical problem since it
is one of the major contributing factors to the growing incidence of poverty. In turn,
poverty impacts so adversely on the socio-economic development of this country. With
limited skills and knowledge to improve their livelihoods, early school leavers make up a
large number of the unemployed and subsequently they contribute disproportionately to
the rising tide of crime and violence occurring in most urban centres.

110
There is a need to conduct community workshops on parental education to change the
community‘s perceptions about education, improve parents‘ participation and support,
reduce the ‗dropout‘ rate and improve students‘ academic achievements. The
establishment of a collaborative model of education in villages and communities is an
essential element of this initiative and make available community scholarship funds
through better utilization of resources.
Tertiary Education
Under the Roadmap the government recognizes the critical importance of tertiary
institutions for developing high-quality human resources, especially in an increasingly
technology-driven world economy. The government also recognizes the challenges facing
these institutions, challenges that include inadequate funding and facilities, curriculum
that are inadequate to meet the challenges of nation building, inadequate and
inappropriate staffing (especially among the lecturers).
Development Constraints and Challenges
Although the country has achieved near universal primary education, the dropout rate at
primary level will continue to be an area of concern, particularly for Fijian students. A
high dropout rate, as already stated is also apparent from Form 6 to Form 7. Many
students face difficulty in affording education.
Ethnic differences are still a concern in terms of examination performance. Indigenous
Fijian students lag behind other ethnic groups in major external examinations. Similar
gaps are also evident between rural and urban schools. Priority spending in education is a
major factor that could contribute to the differential in performance. The 2002/03 HIES
showed that Indo-Fijian families spent some 116% more on average per child than Fijian
families.
Access to secondary education is increasing with net enrolments standing at 71% in 2000.
Enrolments have been higher for girls (74%). There is concern however, that secondary
students have difficulty in getting jobs. The 2002/03 HIES showed that most of the
unemployed population (77.2%) had secondary education.
The education system will need to consolidate efforts to build and support social
cohesion in schools. More emphasis has been placed on examinable subjects, sports and
other extra-curricular activities. A deeper understanding and acceptance of cultures and
inbuilt values is critical to having and practicing an internalized sense of national identity,
therefore more support is required to strengthen and embed values teaching in all schools
in Fiji
4.1.8 Health
Health continues to be a growing and increasingly complex field of competing priorities
from all perspectives - from the individuals to governments, businesses, health

111
professionals and the health services system. A healthy and productive population is a
key for sustainable economic development. Despite consuming a major portion of
governments budget (>3% of GDP and 9% of total budget), health care funding continues
to be lower as compared to other countries in the region while Fiji‘s population tends to
be increasing every year.
Fiji‘s progress towards Millennium Development Goals (MDGs) such as reduction in
child mortality, maternal mortality and HIV/AIDS, have not been achieving the impacts
on the health of citizens which Government intends. Fiji‘s life expectancy for males and
females is on a declining path (2007 population census). The performance against the
three health MDGs is disappointing as compared to baseline data of 1990 and 2015
target. The current statistics show a slow progress in improving the infant and maternal
mortality rates, immunization coverage and the prevalence of HIV/AIDS.
The progress towards MDGs suggests that the substantial and increased input of
resources by Government is not achieving the impacts on the health of citizens which
Government intends. Increasing annual budget allocations in itself is healthy and positive
but if it is still below a critical level of less than 5% of GDP (Fiji averages less than 3%),
then may be it is not sufficient to adequately fund important interventions that would
specifically address the MDG targets.
In addition to the continuing incidence of communicable diseases, there is an increasing
prevalence of Non Communicable Diseases (NCDs) such as diabetes and hypertension,
due to lifestyle changes, poor diet, smoking, changing patterns of physical activity ,
continuing mulnutrition problems, particularly in school children and women. On disease
conditions and status, NCD continues to be the major cause of morbidity and mortality.
Controlling diabetes and cardiovascular disease remains a priority focus of the Ministry
of Health (MOH). With the re-emergence of infectious diseases such as typhoid, which
were thought to have been controlled, an extra burden will now be placed on the already
incapacitated health system. This is termed the double burden of disease, where high
rates of infectious disease and NCD co-exist.
The ability of government to increase its health sector allocations is limited by slowed
national economic growth, by a history of significant under-funding and by periodic
austerity measures related to political events. To increase revenues from the population
of service users would represent a policy change to public sector provision and could, if
not done well, have significant population health status ramifications. The introduction
of realistic user-charges could result in much of the population‘s inability to pay, a
consequent reduced access to services and worsening health status indicators. The
potential for the general population to pay health insurance premiums is similarly limited,
although some employers provide health insurance schemes on a co-payment basis with
their staff.
Improving public provision of information on the performance of the health system (such
as waiting times for elective surgery, drug stock-outs, and selected morbidity and
mortality indicators) will enhance advocacy, accountability and decision making in the

112
health sector. This has been lacking in Fiji‘s health sector with resource allocation being
based on conventional budgeting system. Currently, systems for collecting and publicly
reporting such information are lacking. It is important to establish a means of data
collection methods that allows timely reporting of service activity for use to provide
information to source/fund national projects and to optimize individual patient care.
Poor allocation of resources is now leading Fiji‘s health sector into a debilitated state
with increasing cost pressure leading to long term sustainability of its financing system.
There is a need to reallocate resources in response to areas with greatest burden to the
economy and the only possible way is for the need to have evidence to support effective
decision making. As such, the importance of National Health Accounts (NHAs) is
increasingly becoming important in management of resources and review of health
policies.
Development Constraints and Challenges
Development constraints and challenges include:
to improve efficiency and effectiveness of the use of resources in health service
delivery;
to respond to the increasing numbers of HIV/AIDS and STI cases;
to reverse the deteriorating rates of child mortality, infant mortality and maternal
mortality;
to reduce the incidence of Non-Communicable and life-style diseases;
the emigration of skilled health care professionals;
limited capacity for policy analysis and research;
improving physical and financial access to good-quality health services in depressed
domestic and global economy;
the increasing demand and cost for health care;
the need to improve stewardship over policy formulation, health legislation,
regulation, resource mobilization, coordination, monitoring, and evaluation;
the need to strengthen the national health system and improve its management;
the need to improve the availability and management of health resources (financial,
human, infrastructure, and so forth);
reducing the disease burden attributable to priority diseases and health problems,
including hiv/aids, and reproductive health–related illnesses;
increasing consumers‘ awareness of their health status and poor lifestyle; and
to foster effective collaboration and partnership with all health actors, NGOs and
CSOs.
4.1.9 Gender Equality and Women in Development
The target for MDG 3 is to eliminate gender disparity in primary and secondary
education preferably by 2005 and to all levels of education no later by 2015. School
enrolment data published annually by the Ministry of Education and enrolment data
provided by tertiary education institutes provide figures for the ratio of girls to boys. In

113
Fiji, the sex ratio for primary in 2007 (0.92) is closely balanced and the enrolment figures
reflect the overall population ratio (0.96) released by FIBOS in the 2007 Census. At
secondary and tertiary education the ratio of girls to boys has reversed; 1.06 and 1.08
respectively. The gaps between girls and boys begin to widen with girls outnumbering
boys as education level increases. These differences in ratio do not continue in the
employment world.
Women‘s composition in the labour force has dropped from 40% in the 1996 Census to
31% in the 2004/05 EUS. Although women are 31% of those the FIBOS describes as
―economically active‖, 54% of all working females are unpaid household workers. The
2004/05 EUS revealed that the number of females who were self employed increased
from 13% in 1996 to 25% in 2005. Governments over the years have failed to commit to
creating an enabling environment, to enable women to participate fully in the socio-
economic development of the country.
Table 4.1: Comparison of men and women employed in the Economy
Activity Female Male All % Female % of Fem % of Male
A Wages
B Salary
C Employer
D Self Employed
E Family Worker
F Community Worker
G Household Worker
39263 106835 146098
18303 30581 48884
617 2647 3263
23105 68713 91818
19486 18470 37957
1730 505 2235
120855 1642 122497
27
37
19
25
51
77
99
18 47
8 13
0 1
10 30
9 8
1 0
54 1
Gender Neutral
Economically Active 223359 229393 452752 49 100 100
Females are a half (49%) of all the ―workers‖ in society but under-represented in the
workforce (table 4.1). Except for the lowly paid Family and Community Workers,
females in income-earning categories are now all much lower than that for Males: Wage
Earners (18% v 47%), Salary Earners (8% v 13%) and Self-Employed (10% v 30%).
However, looking at females by age group 53% between 20 to 29 years of age are Salary
Earners and 29% are Wage Earners (much better than the older groups). They have
moved out of Self-Employed and Family Workers (table 4.2). However, there is a need to
focus attention for participation of women in older age groups
Table 4.2: Females as Percentage of Age Group
Activity 20-29 30-39 40-54 Over54 % Female
A Wages
B Salary
C Employer
D Self Employed
E Family Worker
F Community Worker
29 27 27 19
53 36 26 36
55 16 22 10
17 24 29 27
39 69 73 43
91 76 84 66
27
37
19
25
51
77
All 32 31 32 30 31

114
Wages and Salary 34 30 27 24 30
Although recent indicators show little difference in the educational levels and
achievements of men and women, and despite Government's commitments to gender
equality, occupational discrimination and gender segregation are strong and persistent. As
compared to 1982 Economically Active Females increased by 55% between 1982 (20%)
and 2004 (31%), compared to 35% increase for Males, although this proportion is still
considered low. While the number of households increased by more than a third, total
number doing full-time household work and female household workers declined by 5%.
There is a little change in males becoming household workers. Females should be
encouraged to become part of the ―Economically Active‖ persons in Fiji, moving out of
full-time household work into income earning work for the household.
Studies from the 2004/05 EUS indicate that female representation in senior management
and professional occupations has increased. For instance, female technicians and
associate professionals increased from 28% in 1996 to 33% in 2005. However, few
women own businesses, because the inheritance laws practised by both major ethnic
groups in Fiji usually exclude women from inheriting land or other fixed assets.
Women predominate among workers in the shrinking manufacturing sector. Labour costs
in Fiji are interestingly competitive, but imported raw materials added to the cost of
production, makes the country's products less competitive without subsidies or special
terms for market entry. Women process workers cannot sustain their livelihood with low
wages.
Women's higher risk of poverty and destitution is associated with labor force
discrimination, increasing divorce and separation rates and problems in collecting
maintenance payments from a departed spouse. Women constitute the majority of
beneficiaries under the Social Welfare Department's Family Assistance Scheme. Female
unemployment increased slightly from 7.8% in 1996 to 8.7% in 2005, perhaps as a result
of loss of jobs in the garment and other industries.
Economically Active Females work some 14 hours more per week, or 31% more on
average than Economically Active Males in all categories. This is a gender gap that must
be addressed if females are to have the opportunity to develop themselves professionally,
and enjoy leisure as men do. This requires Men- all categories- to do their fair share of
household work.
These facts indicate the need for effective social safety nets for the unemployed
particularly, training and investment to promote alternative livelihoods for women
displaced from the manufacturing sector. New models are necessary to provide women
with micro finance for self employment.

115
In accordance with MDG 5 for improved maternal health it is important that Government
reviews its efforts to promote rural family programme. The fertility rate of 4:4 among
rural Fijian women suggests the need for renewed efforts.
In 2004 for the first time, more women among new cases were confirmed HIV positive
than men. Experts consider that Fiji may be moving towards an AIDS epidemic. A
strong emphasis on gender issues is needed to reduce HIV transmission, in keeping with
MDG 6.
Development Constraints and Challenges
Development constraints and challenges include:
implementation and monitoring of sectoral programmes, government policies and
administrative practices and procedures have incorporated gender perspectives;
implementation and monitoring of the EEO policy in all workplaces, presence of
occupational discrimination and gender segregation in labor markets;
monitoring the compliance of laws and administrative practices and procedures to
CEDAW Articles;
maintaining effective social safety nets for the employed in particular training and
investment to promote alternative livelihoods for women displaced from the
manufacturing sector;
promoting rural women's advancement in economic activities without destroying
sustainability of women's fisheries and, therefore, household food security;
continuing social impact analysis of trade agreements on impact on women's health of
imported, low quality foods;
increasing incidence of domestic violence;
decreasing fertility of women especially rural Fijian women;
spreading of HIV/AIDS as an epidemic; and
collection and analysis of gender-sensitive data.
4.1.10 Children and Youth
Fiji‘s future prosperity depends on nurturing and developing children who are well
prepared to take their place in tomorrow‘s society. The Plan‘s strategy, therefore, seeks to
implement basic education requirements to increase school enrolment and provide better
schools and better-trained teachers. However, there are many factors, apart from
education, that affect the development of a child and include issues such as
unemployment, financial constraints, family problems, teenage pregnancy and sexual and
reproductive health, child labour and prostitution.
Programmes to support children and youth directly support the Strategic Priorities of
implementing affirmative action, reducing crime and alleviating poverty. In the long
term, the development of children and youths as good citizens for Fiji‘s future is the
cornerstone of national development and supports all the priorities.

116
Joblessness has resulted in the rising incidence of social ills amongst young people.
Policies will target youth empowerment and development in order to reverse the negative
consequences associated with the past pattern of development.
There has been some improvements in the management of child abuse, but there is still
urgent need for legal reform to impose severer penalties on offenders, to make the
collection of evidence easier, offer additional protection to the survivor of abuse through
the legislative process, provide specialized counseling services to children and their
families, and to organize community awareness programmes to help change attitudes and
stigma associated with child abuse.
The Ministry of Social Welfare, Women & Poverty Alleviation has developed, along
with six other ministries/departments the Resources and Results-based Framework (RRF)
2008-2012 which has identified three major outcomes in child protection. Out of the
RRF, the Fiji 2009 Annual Work Plan (AWP) for Child Protection based on the 2008
AWP was signed by the National Coordinating Committee on Children (NCCC) in April
2009. The 2009 AWP outlines activities that will be undertaken by the Government of
Fiji, with support from UNICEF, in progressing towards the achievements of the
expected outputs/outcomes (results) as stated in the Resource and Results-based
Framework (RRF).
The NCCC was established following Fiji‘s ratification of the United Nations Convention
of the Rights of the Child (CRC) in August 1993. The NCCC , a Cabinet sub- Committee
has members which includes the Permanent Secretaries for: Ministry of Social Welfare,
Women & Poverty Alleviation; Ministry of Justice, Electoral Reform & Anti Corruption;
Ministry for Education, National Heritage, Culture & Arts, Youth & Sports; Ministry of
Indigenous Affairs; Ministry for Defense, National Security, Disaster Management &
Immigration; and Ministry for Provincial Development & Multi Ethnic Affairs, and
NGOs that provide services that target children..
The National Youth Service Scheme (NYSS) was implemented in 2008 with a budget
allocation of $1 million. The NYSS targets clients of around 2000 individuals per annum
and in 2008, a total of 5955 clients were registered, an indication of the high demand for
youth employment opportunities. A total of 563 employments were created from 120
employer‘s nation wide as work attachment, volunteers and full time paid employees. For
2009, a total of 1000 clients have been enrolled.
Development Constraints and Challenges
Development constraints and challenges include:
discrimination of children with disabilities;
insufficient funding for all the implementing agencies and development projects;
coordination of implementation of programmes across sectors;
achieving the identified outputs of the Annual Work Programme for Child
Protection;

117
establishing a monitoring and evaluation process of the Resource and Results-
based Framework to progressively examine the status of Children‘s Welfare; and
prioritizing legislative review and reform for the care and protection of children.
4.1.11 Sports Development
Sport contributes to the overall development of a country and it is a worthwhile
investment strategy in improving the socio-economic benefit to any nation. It promotes
nation building and community development by bonding people to work together. It
moulds better citizens through the inculcation of values such as tolerance, goodwill,
understanding, teamwork and promotes active and healthy lifestyles.
A nation‘s investments in sports will give rise to benefits in:
promotion of national identity and national pride;
community development and integration;
crime prevention;
good health and healthy lifestyles;
higher domestic productivity and greater national productivity;
higher education; and
economic benefits.
Sport, therefore, plays a very powerful role in our society and individual lives. As such, it
is important that the people of Fiji, supported by Government, strive to identify and
develop strategies and policies which will encourage and sustain for its long term growth.
Sports can create viable employment opportunities and generate internal revenue through
many aspects of the sports industry if it is systematically allowed to develop properly. It
provides attractive platforms to major local and international companies to sponsor their
products and services. Incentives need to be provided to the private sector to encourage
them to sponsor sporting organisations‘ programmes and activities. Advertising, radio
and television rights, product endorsements and promotions, sports tourism and
remittances are some areas that can be the initial targets of sports development before
progressing into clothing, footwear and other accessories manufacturing.
Very few sports in Fiji have achieved such progress in past few years while the majority
of them are actually struggling to survive and progress. The only major setback for most
of the 40 sports organizations is the lack of financial resources that they need to facilitate
their development programmes. Most sports need Development Officers to administer the
sports and initiate development programmes as these are still been looked after by
volunteers who have fulltime work and only attend to their sports tasks in their spare
time. Getting the sporting organizations to be operating professionally and effectively
will boost their chances of securing sponsorships which should enable them to move into
the next level of development. There is also the need to put in place proper talent
identification networks at the grass root levels for all sports and a well structured
institution to nurture and systematically develop the athletes/players to reach maximum
potentials.

118
The current development programmes looked after by the Government through the
Department of Youth and Sports are:
disbursement of four sports grants to National Sports Organisations;
disbursement of special funding for regional and international competitions;
rural sports field development;
sports outreach programme; and
basic sports gear assistance programme.
Development Constraints and Challenges
Some constraints that hinder the development of sports are:
lack of standard sports grounds and other basic facilities in rural areas;
low sports funding and the need to entice more business sponsorships for sports;
involvement of volunteers in sports administrations and the need to have paid
development officers;
establishment of a high level sports institution to further develop new talents
systematically;
development of international standard sports grounds to accommodate
international competitions like Super 14 Rugby or FIFA soccer matches;
proper structured sports syllables in tertiary institutions to include sports specific
subjects like sports marketing, sports administration, sports management, sports
psychology, sports science, sports medicine, etc; and
the need for a sports regulatory body to regulate and control all matters relating to
sports.
4.1.12 Environmental Sustainability
―Ensuring environmental sustainability‖ is the seventh MDG, which provides a
framework for integrating the principles of Sustainable Development into national
policies, with the focus on ensuring availability of safe drinking water, improving
sanitation, and reducing other social ills such as poverty and unemployment.
The Environmental Management Act (EMA) 2005 provides the legislative framework for
the sustainable development of land and water resource management. However, there
have been a number of constraints in implementing the EMA such as inadequate
resourcing of the Department of Environment, outdated subsequent legislations and
regulations, the absence of accredited laboratories, and poor coordination among
agencies.
Achieving sustainable development, while overcoming environmental challenges such as
deforestation, land degradation, logging of watersheds, over-exploitation of terrestrial and
aquatic biological resources, improper waste management and pollution control, impact

119
of climate change, and the attitude of people in terms of the unsustainable use of their
resources, is a central challenge of this plan.
The improper disposal and treatment of solid waste is one of the gravest environmental
problems faced in Fiji. The problem is most acute in fast growing urban centres and other
highly populated areas and is beginning to be a major concern for the tourism industry.
This concern led to the organization of annual Clean Up Fiji Campaigns, which has run
for 13years and is well supported by the business community.
The generation of waste for disposal has been steadily increasing and is likely to continue
to increase with the growth of urban centers and an increasing middle class population
which is driving the rise in demand for imported goods. The composition of waste has
also changed and now non-biodegradables account for a greater proportion of waste.
Waste on land are catered for by rubbish dumps, with the first landfill established in
Naboro in 2003/2004 to cater for waste from Navua, Lami and the greater Suva areas.
The Naboro Landfill was designed to offer 40-50years of clean, safe and sanitary waste
disposal and all waste coming into this site was to be assessed for its suitability for
disposal, and special treatment administered to it wherever necessary. The operation of
the facility was also designed to allow for revenue generation to assist in the running of
the landfill. Approximately 60,000 tons of waste is dumped at the landfill annually.
Implementation of the National Solid Waste Management Strategy 2008– 2010, launched
in June 2008, needs to be prioritized. A key component of the Strategy is a public
awareness campaign and creating partnerships amongst all stakeholders including
municipal councils, the business sector and the community at large.
Fiji‘s economy and its people, like other small island states, are also susceptible to the
impacts of climate change. Since ratifying the UN Framework Convention on Climate
Change (UNFCCC), policies adopted by Government in successive Development Plans
have recognized the critical importance of managing the environment and natural
resources, to ensure social and economic prosperity in the present and for the future. The
implementation of these policies, however, has not been adequately supported with the
required budget. As a developing nation with scarce resources and competing priorities
and obligations, the Government has preferred to rely predominantly on foreign aid and
assistance to finance ‗environment‘ projects.
Climate change is beginning to have substantial and widespread impacts on Fiji, affecting
sectors as varied as health, coastal infrastructure, water resources, agriculture, forestry
and fisheries. As a predominantly agricultural based economy, the impact is being felt
more by the rural populace who depend on the agriculture sector for their livelihood. The
increasing incidence and intensity of droughts, cyclones and flooding is taking its toll on
the economy and the lives of ordinary citizens.
The sea-level rise is leading to coastal erosion. With the majority of villages and
settlements in Viti Levu located along the coast, there is a noticeable infiltration of the
sea into the village compound during high tide. The increase in the frequency and

120
intensity of tropical cyclones over the past decade is fueling coastal inundation and
erosion. Intensive urban development along the coast, as well as deforestation of
catchments has also contributed to exposing large coastal areas to flooding and erosion.
Continuous coastal erosion is also taking its toll on inshore fisheries on which the villages
rely for food. The drop in the size of the catch is attributed to the build up in
sedimentation. Coastal populations and their assets are exposed to higher vulnerability to
extreme events such as storm surges, tsunamis, and high tides. The erosion of coastal
areas is also now slowly leading to the movement of villages away from low lying areas.
The most recent flooding occurred in late December 2008 and early January 2009.
Experts conceded that these floods were the worst in Fiji‘s recorded history with 11 lives
lost, and a conservative estimate of F$76million9 worth of damages to public assets and
agriculture. Damage to crops and loss of livestock from the recent flooding in late
December 2008/early January 2009 was estimated at F$40million. Around half of these
losses are attributed to the sugar industry, the backbone of the agriculture sector and the
economy. The aftermath of floods increases the risks of exposure to water borne diseases,
leptospirosis, and contamination of water sources. The floods directly affected about
150,000 people, almost a fifth of Fiji‘s population. While tropical cyclones are expected
at this period, what has been noted is the increasing intensity of these natural hazards,
particularly over the past decade.
To manage the impacts on the community, more concerted effort is being put into
improving land use practices through a National Rural Land Use Policy, improving
management of watersheds, and mainstreaming the CHARM10
concept into development
planning.
A critical tool in the fight against Climate Change is the Kyoto Protocol. The Kyoto
Protocol is an international agreement linked to the UNFCCC. The major feature of the
Kyoto Protocol is that it sets binding targets for 37 industrialized countries and the
European Community for reducing greenhouse gas emissions. These amounts to an
average of 5% against 1990 levels over the five-year period 2008-2012. The major
distinction between the Protocol and the UNFCCC is that while the Convention
encouraged industrialized countries to stabilize GHG emissions, the Protocol commits
them to do so.
One of the 3 mechanisms open to industrialized countries to meet their commitments
under the Protocol is called Clean Development Mechanism (CDM). The CDM, defined
in Article 12 of the Protocol, allows a country with an emission-reduction or emission-
limitation commitment under the Kyoto Protocol to implement an emission-reduction
project in developing countries. Such projects can earn saleable certified emission
reduction (CER) credits, each equivalent to one tonne of CO2, which can be counted
towards meeting Kyoto targets.
9 Losses to private businesses and emergency relief and ration costs are not included in the $76m.
10 Comprehensive Hazard And Risk Management

121
A CDM project activity might involve, for example, a rural electrification project using
solar panels or the installation of more energy-efficient boilers. The mechanism
stimulates sustainable development and emission reductions, while giving industrialized
countries some flexibility in how they meet their emission reduction or limitation targets.
Fiji has so far registered two CDM projects through the FEA – the Wainikasou and
Vaturu Hydropower Plants. More technical work is required to identify other
opportunities, particularly in the area of renewable energy.
Development Constraints and Challenges
Development constraints and challenges include:
adequate resourcing of Department of Environment to carry out mandated
functions under the EMA;
lack of capacity among Government agencies to enforce relevant legislations such
as the Land Conservation and Improvement Act, National Code of Logging
Practice, etc;
addressing ‗environment‘ issues along sectoral lines is difficult and conflicts
sometimes arise as ministries get protective when they perceive other agencies
encroaching on areas they consider their sole jurisdiction;
lack of coordination between agencies and the current situation where the
Department of Environment is reliant on other agencies to implement mitigation
and adaptation measures. The Department can provide advice on mitigation and
adaptation measures but has no authority to dictate what is to be implemented;
lack of capacity within Government (including the Department of Environment)
to fully appreciate the fundamental issues of climate change and their widespread
impacts across the whole economy;
lack of capacity also constrains the ability of Government to draw out relevant
statistics and data to fully understand the evolution of Fiji‘s climate and
biodiversity. This lack of capacity translates into a lack of confidence by
Government to commit resources for such research work given the uncertainty on
the applicability and usage of the research data and outcome. Hence, the reliance
on foreign aid to fund such projects;
lack of information, education and awareness on impacts of climate change in
rural and outer islands – for instance the ordinary villager is not aware that
changes affecting his everyday living (such as fishing, tending his crops etc) are a
result of the impact of activities of industrialized countries on the global climate;
and
poor and sluggish economic performance over the past decade, coupled with
political turmoil and uncertainty means a lot more emphasis is placed on
economic recovery and very little attention is paid to environmental concerns.
4.1.13 Culture and Heritage
Fiji is a multi-racial, multi-cultural country with a multiplicity of languages, religions and
ways of living and the recognition and acceptance of these cultures create harmony and
unity amongst all races. Culture refers to the diverse manifestation of human intellectual

122
and artistic creativity that is both culture and heritage and is the living form of cultural
expression. Integral to the development of the nation is the conservation, development
and promotion of the indigenous identity.
There has been growing concern from Government regarding cultural revitalization. This
is reflected through continued government support towards cultural heritage activities
such as heritage site management, artistic promotion activities, developing creative
industries, preservation and protection of artifacts and archaeological documentation,
safeguarding and promotion of language. Historic conservation and cultural activities
maintain the distinct character of communities. Cultural and natural heritage sites and
traditional arts should be conserved and protected. Tourism, as the fastest growing
industry in the world, relies to a large extent on cultural heritage for its sustainability.
Due emphasis should be placed towards the listing of Fiji‘s cultural and natural heritage
sites in the world heritage listing and the establishment of proper heritage management
system and the necessary infrastructure to ensure benefits flow to the local economy and
the sustainability of tourism based activities.
Culture has the potential to address the problems of unemployment, poverty and crime,
faced by our youth today. The challenge is to develop and engage in both formal
education curricula and non-formal activities for young people to provide a catalyst and
an opportunity for this in instilling a sense of values and cultural identity. The association
between gender, culture and environment needs consideration. The challenge is to
develop an agenda that recognizes women as significant actors in development and as
bearers and signifiers of their living cultural heritage who conserve and manage the
biological diversity of the landscape.
Development Constraints and Challenges
Development constraints and challenges include:
strengthened partnership with resource owners;
financial support; and HRD support for the sector; and
unsustainable tourism, mining, and forestry developments.
4.1.14 Disaster Risk Reduction and Disaster Management
Fiji is located in one of the most vulnerable and highly at risk location to disasters in the
world. About one or two cyclones hits the country every year and floods and flash floods
because of climate change has become a common occurrence. Over the last decade,
damage caused by tropical cyclones alone has been estimated at more than $500 million
and more than 100 lives have been lost. Tropical Cyclone Ami, which struck the
Northern and Eastern Divisions in 2003, caused social and economic losses of more than
$100 million, whilst the floods in April 2004 caused damages estimated at more than $30
million.
A risk management approach underpins Government efforts in disaster risk reduction,
with a strong emphasis on greater community resilience and self-reliance. The integration

123
of risk management into the development planning decision-making and budgetary
processes using the Comprehensive Hazard and Risk Management (CHARM) approach
will make a significant contribution towards disaster and risk reduction. Essentially this
will place strong emphasis in the analysis and evaluation of hazards, vulnerabilities and
elements at risk and ensuring that adequate measures are taken to lessen the risks and the
vulnerabilities in all these development processes. However, the heavy dependence on
Government handouts after recent disasters, coupled with high rehabilitation costs, has
disrupted planned capital expenditure programmes. To address this problem, Government
established a National Disaster Relief and Rehabilitation Fund, with a $2.6 million
budget in 2004. The 2007 revised budget increased this provision to $8 million. A
National Disaster Committee was established in the Prime Minister‘s Office, to oversee
the new National Disaster Relief and Rehabilitation Fund and to assist the NDMO to deal
with disasters.
The reviews of the Natural Disaster Management Act 1998 and the 1995 National
Disaster Management Plan have been completed and the recommended changes are in
draft awaiting the Attorney General Office‘s sanction and Cabinet approval. The
principal recommendations are to include human caused hazards including technological
hazards in the Act and Plan and to institute qualitative improvements in legislation,
regulations, organization, operating procedures, training and readiness. The reviews
stressed that an effective crisis and emergency management system under national
leadership is essential. The system would adequately facilitate all aspects of Disaster
Management which has both Disaster Risk Reduction and Disaster Management. The
focus on community capacity building is promoting self reliance, reducing dependency
and to achieving community resilience and sustainable development.
Work has commenced on the development of a National Action Plan to adopt the
Regional Framework.
Partnership with SOPAC under EU funding resulted in the development of the Navua
Flood Early Warning System which has been operational since October 2007. Similar
work is scheduled for Nadi and Ba rivers under French funding and the upgrading of the
Rewa river system. An additional 9 HF Radios were purchased through AusAID funding
and were installed between 2007 and early 2008. The radios would enhance
communication and operational capacity of Emergency Operational Centres and
management of overall disaster management operations.
Development Constraints and Challenges
There is a need to fast track development of Response Plans and Early Warning Systems
for floods, earthquakes and tsunamis, at all levels in order to provide the people with
reasonable safety measures to be able to deal with these events confidently and to
facilitate a more responsive and timely Government intervention.
The development of an all hazard, integrated, people focused early warning system.

124
Mainstreaming disaster risk reduction into other sectoral development plans, policies and
programmes is crucial for sustainable development and community resilience.
The Fiji Red Cross works closely with the divisional commissioners and provincial
administrators/district officers and provides invaluable support during emergency relief
operations. There is a need to continue to strengthen relationships with Disaster
Management partners, including the Red Cross, civil society, as well as the FRANZ
group, the EU, ADB, World Bank, UNDP, NZAID, AusAID and SOPAC. We need to
actively engage the community in all aspects of disaster risk management.
4.1.15 Rural and Outer Island Development
The rural areas of Viti Levu, and outer islands, including Vanua Levu, have remained
relatively undeveloped with poor livelihood opportunities due to isolation and lack of
access to services and markets. Their relative isolation excludes them from the
mainstream of Fiji‘s economic and social development, resulting in large movements of
people, especially those entering the economically active years, seeking opportunities in
urban areas.
The proportion of the population living in rural areas has been decreasing from 62% in
1986, to 53% in 1996, to 49%, according to the 2007 Census Report. Urban development
measures are necessary to relieve the problems created by the mass relocation of people
to the urban centers such as squatter settlements, but the underlying problem is the
uneven distribution of opportunities between the rural and urban areas.
This requires a holistic approach through the provision of basic infrastructure, improve
mobility and market access through regular and reliable shipping services, and
complementary livelihood activities. Government infrastructure spending on the transport
sector has traditionally been focused on land transport, with only about 1.4% spent
annually on sea and shipping related activities. Expenditure on shipping is limited to
maintenance with most of this small budget shared between Suva, Lautoka, Savusavu and
Levuka – the international ports of entry – rather than to develop inter-island shipping.
The outer islands do not have substantial markets on their own, the main market for most
products being Suva or Viti Levu. However the only means to access this market is by
sea, leading to un-satisfied demands and needs for better shipping services and maritime
infrastructure. A review of the Shipping Franchise Scheme is planned with Government
keen to improve services to the outer islands, in particular, finding a workable solution to
service ‗uneconomical‘ routes.
Massive infrastructure work is planned for Vanua Levu, such as the upgrading of
Savusavu port and upgrading of major connecting highways. To complement these
commitments, Government has declared Vanua Levu, Rotuma, Kadavu, Taveuni,
Lomaiviti, Kioa, Rabi and Lau as tax free regions effective from 1st January 2009. The
incentives for companies that set up in these regions have been offered to encourage
125
investment, support development, create employment and improve livelihood
opportunities in the Northern Division and Maritime areas.
With the aim of improving the delivery of services to rural areas, a new streamlined
divisional development structure, involving the establishment of Divisional Development
Boards (DDB), will also being put in place. The new structure should enable better
coordination of Government‘s development programmes and improve implementation of
projects in the various divisions. The DDBs will be at the forefront of revitalizing
economic activity in the rural and outer islands and facilitate the coordination of
development efforts of Government at the divisional level.
The livelihood activities currently funded by Government through the annual budget,
such as the Northern Division Programme (NDP), would reap greater rewards through
such a holistic approach.
Since its launch in November 2007 to the end of 2008, the NDP project office received a
total of 1322 applications, valued at over $5.1million. At the end of 2008, 996
applications had been processed with the remaining 326 being processed in the first
quarter of 2009. From the 996 applications processed, 916 have been assessed and
approved for grants to the value of $2.34million. However, only 361 (or 39.4%) received
funding in 2008 valued at $1.08million. The majority of these recipients, 226 (or 63%),
sought counterpart funding (or debt equity) from FDB, 51 (or 14%) from Micro Finance
Co-op Labasa, 35 (or 10%) from Micro Finance Labasa, 15 (or 4%) from Commercial
Banks, and 34 (or 9%) from Sugar Cane Growers Fund. These other lenders disbursed
approximately $1.125million.
In 2008 the majority of these projects (82%) were classified as micro projects, with
annual turnover less that $30,000. Agriculture projects, particularly dalo and yaqona
farming, were the main recipients of the equity grants. Other projects include the
purchase of bullocks (working animals) for cane farmers, outboard engines and fiberglass
boats for fishermen, and breeding animals for livestock farmers (piggery, poultry, goats,
beef).
Development Constraints and Challenges
The major development challenges for rural development are:
lack of basic infrastructure such as roads, ports and jetties, access to electricity
and telecommunication, reliable water supply;
lack of mobility and access to markets due to irregular shipping services;
lack of coordination of development initiatives of Government and donors;
lack of participation of community in identifying and prioritizing development
needs; and
reduction in the economically active population present in rural areas and outer
islands.

126
4.2 Policy Objectives, Strategies and Key Performance Indicators
4.2.1 Building National Identity and Social Cohesion
Goal: A peaceful, non-racial, inclusive and united society
Policy Objectives Strategies Key Performance Indicators
A common National
Identity for all Fiji citizens A new Constitution with
Fiji as the name of the
nation
Public awareness and
consultations to promote
national identity.
National anthem and flag
raising ceremony to be
observed in schools and
important national/state
functions.
Adoption of a common name Fijian
by 2014.
National anthem and flag raising
ceremony on a weekly basis in
schools by 2009
Communities to live
together to promote social
cohesion and unity
Fiji Day celebrations to
promote national
identity/unity.
Establish a Commission
of Healing and
Reconciliation, Truth
and Justice (CHRTJ)
Encourage mixed
schools.
Promulgate an Anti-
Discrimination Act.
Eliminate racial and
inappropriate
categorization and
profiling in government
records and registers.
Fiji Day celebrations annually.
CHRTJ established by 2010.
Anti-Discrimination Act by 2013.
Racial and inappropriate
categorization records removed from
government records by 2010.
Strengthen the role of
education, religion, culture
and sports in promoting
national unity
Include the teaching of
the two main vernacular
languages in education
curriculum
Encourage and promote
religious freedom and
understanding in schools
and society
Two vernacular languages taught by
2013.
Multi-cultural education in Fiji
National Curriculum Framework.

127
Equipping the media,
and sports organizations
to promote national
identity/unity
Education curriculum to
include moral, values
education, multi-culture,
and comparative
religious studies
4.2.2 Poverty Alleviation
Goal: Poverty reduced to a negligible level
Policy Objectives Strategies Key Performance Indicators
All categories of
the poor are able to
meet their basic
needs.
Reach consensus on the definition of
the poor and their needs and ensure
the compilation and timely analysis
of statistics on poverty, including
HIES and to be conducted on a five-
yearly basis.
Focused surveys and research should
be conducted at micro level
(households) to show the impact on
the poor of any structural
adjustments, so that remedial actions
can be identified and implemented.
Review and develop poverty targeted
policies and implement appropriate
programmes in housing, national
insurance and social security and
National Integrated Poverty
Eradication Framework.
Empower communities through
liberation education programmes for
self-sufficiency, self-reliance and self
esteem.
Introduce a national minimum wage
and at the same time enhance
national productivity.
Establish community mechanisms for
feedback on public services.
Disseminate information to the
nation about anti-poverty
Proportion of population
below the HIES defined
basic needs poverty line
reduced from 35% to less
than 15% by 2020
Poverty gap ratio reduced
from $2,600 to $2,000
(MDG)
Percentage share of
consumption held by poorest
20% increased from 7% to
10% (MDG).
Not less than 1,500
recipients of family
assistance graduate from
assistance programmes
through income generating
projects.
A phased implementation of
a national minimum wage
rate from 2009 -2011 with
full implementation in 2012.
Reduction in number of
elderly in State care from 98
to 60.
Number of projects
supporting young people
increased from 180 – 250
annually

128
Goal: Poverty reduced to a negligible level
Policy Objectives Strategies Key Performance Indicators
programmes.
Formalize and strengthen
Government and civil society
partnership in alleviating poverty,
including traditional support
mechanisms for the disadvantaged
and support to the elderly through
CSO.
Enable policies, strategies and
programmes for people living with
disabilities through partnerships with
Government and civil society.
Strengthen government‘s pro poor
legislation, policies and programmes
to target citizens through
municipalities, provincial councils,
and advisory councils in both rural
and urban areas.
Establish financial inclusion
programmes for the poor
Strengthen institutions and
programmes that support children of
the poorest of the poor
Ensure affirmative action
programmes are needs-based and to
align them to a shared social justice
preamble.
Increase the number of
people in paid employment
from close to 0.3 million by
3% per year or the rate of
GDP growth, whichever the
highest.
Increase immunization
coverage to 100 percent by
2010.
Increase the percentage of
the population with access
to safe drinking water to at
least 75 percent by 2011.
Access to education for all
children by 2011
Establish partnership
agreement with NGOs and
CSOs by 2010
4.2.3 Housing and Urban Development
Goal: Access to adequate, quality and affordable accommodation for all citizens
Policy Objectives Strategies Key Performance Indicators
To facilitate for
accessible, decent
and affordable
housing for all
citizens with a
particular focus on
low income groups
and the poor.
Facilitate the strengthening of
the social housing programmes
of various implementing
agencies eg Rotahomes and
Habitat for Humanity.
Assist Government‘s
implementing agencies i.e. PRB,
HART and HA towards the
effective execution of their
social obligations and
Approximately 100
families/annum to benefit from
the current social housing
programmes of various
stakeholders from 2010
onwards.
Production of approximately
500-750 land lots or housing
units /annum from 2010
onwards for middle to low
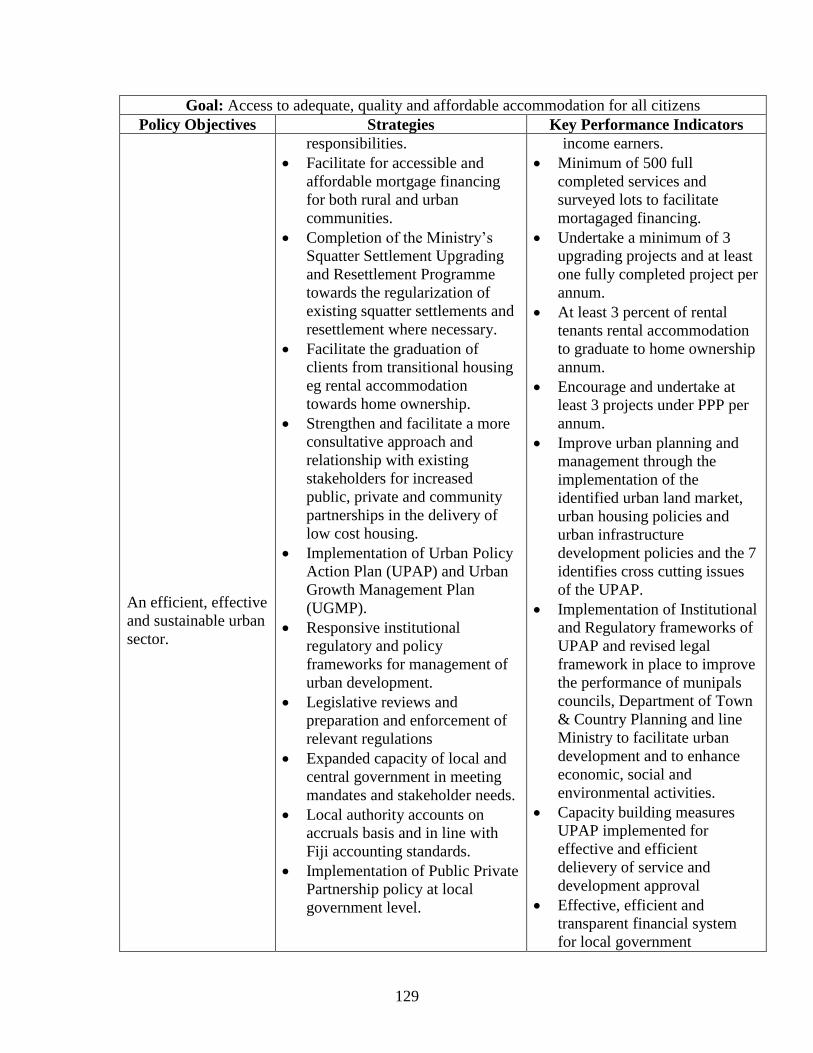
129
Goal: Access to adequate, quality and affordable accommodation for all citizens
Policy Objectives Strategies Key Performance Indicators
An efficient, effective
and sustainable urban
sector.
responsibilities.
Facilitate for accessible and
affordable mortgage financing
for both rural and urban
communities.
Completion of the Ministry‘s
Squatter Settlement Upgrading
and Resettlement Programme
towards the regularization of
existing squatter settlements and
resettlement where necessary.
Facilitate the graduation of
clients from transitional housing
eg rental accommodation
towards home ownership.
Strengthen and facilitate a more
consultative approach and
relationship with existing
stakeholders for increased
public, private and community
partnerships in the delivery of
low cost housing.
Implementation of Urban Policy
Action Plan (UPAP) and Urban
Growth Management Plan
(UGMP).
Responsive institutional
regulatory and policy
frameworks for management of
urban development.
Legislative reviews and
preparation and enforcement of
relevant regulations
Expanded capacity of local and
central government in meeting
mandates and stakeholder needs.
Local authority accounts on
accruals basis and in line with
Fiji accounting standards.
Implementation of Public Private
Partnership policy at local
government level.
income earners.
Minimum of 500 full
completed services and
surveyed lots to facilitate
mortagaged financing.
Undertake a minimum of 3
upgrading projects and at least
one fully completed project per
annum.
At least 3 percent of rental
tenants rental accommodation
to graduate to home ownership
annum.
Encourage and undertake at
least 3 projects under PPP per
annum.
Improve urban planning and
management through the
implementation of the
identified urban land market,
urban housing policies and
urban infrastructure
development policies and the 7
identifies cross cutting issues
of the UPAP.
Implementation of Institutional
and Regulatory frameworks of
UPAP and revised legal
framework in place to improve
the performance of munipals
councils, Department of Town
& Country Planning and line
Ministry to facilitate urban
development and to enhance
economic, social and
environmental activities.
Capacity building measures
UPAP implemented for
effective and efficient
delievery of service and
development approval
Effective, efficient and
transparent financial system
for local government

130
Goal: Access to adequate, quality and affordable accommodation for all citizens
Policy Objectives Strategies Key Performance Indicators
performance.
Establish Urban Governance
Index by 2009 and monitor
improved local government
performance thereafter.
Facititate for local and
government statutory
organizations to assume
responsibility for providing
low-cost housing.
4.2.4 Social Justice
Goal: Equal opportunities for all
Policy
Objectives
Strategies Key Performance Indicators
All ethnic
groups enjoy an
improved
quality of life
and standard of
living.
Improve education and training for
all ethnic groups and build capacity
for all leaders.
Mid-term review to improve the
effectiveness of the Social Justice and
Affirmative Action programme.
Harmonization of existing
legislations, including the Finance
Act, with the Social Justice Act.
Pass rates in FSLC improved
from 68% to 80% and in FSFE
from 77% to 85% by 2012.
Recovery in student loan
scheme increased from 1.5% to
50%.
A draft social justice preamble
statement for a revised Act by
2010
People with
disabilities
enjoy greater
access to an
inclusive,
barrier free and
rights based
society.
Empowerment
and
development of
Improve the provision of and policies
for education and vocational training
services which meet the needs of
people with disabilities.
Implement the National 5 Year Plan
of Action on Disabilities.
Provision of incentives to employers
to employ people with disabilities.
A policy for persons with disabilities
developed and implemented,
including regulations to require
appropriate access to all public
buildings and places.
Enabling policies, strategies and
programmes for people living with
disabilities through partnerships with
Government and civil society.
Enrolment in regular and
special schools increased from
1,068 in 2004 to 2,000 in 2011.
Trained special education
teachers with diploma
increased from 9 to 20 by
2011.
Increased number of persons
with disabilities in paid
employment from 50 to 100.
National disability census and
report to be completed by
2010.

131
Goal: Equal opportunities for all
Policy
Objectives
Strategies Key Performance Indicators
Vulnerable
Groups Inclusive education services and
programmes for all special needs
children in schools, homes,
communities and hospitals.
More people with disabilities are able
to access decent work.
Promoting the rights of women and
children with disabilities.
Strengthen social security
programmes for people with
disabilities.
4.2.5 Education and Training
Goal: Educating the nation for peace and prosperity
Policy Objectives Strategies Key Performance Indicators
Making Fiji a
Knowledge- based
society
Establish a modular
system of education
Abolishment of
external examinations
Establish a coherent
national tertiary
education system
Curriculum framework
developed to enhance
spiritual, intellectual,
social and physical
development and
strengthen instruction
in Fijian and Hindi as
well as English.
Improvement in the
numbers and quality of
competent and
motivated teachers and
reduction of the pupil:
teacher ratios.
Increased use of
standards improvement
measurement in
schools.
Net enrolment rate for secondary
schools rise from 79% to 90% by
2012
Progression rate in secondary
schools increase from 67% to 80%
of the cohort in class 1 by 2012.
FILNA implemented in all primary
schools by 2010
Proportion of students who complete
6 years of education increase from
76% to 95% by 2012
Proportion of pupils who start class
1 who reach class 5 to be not less
than 95% (MDG)
All schools to emphasise study of
various languages by 2012
Disparities in the FSLC pass rate are
at least reduced from 24% to 15%
between rural and urban students
and from 2% to 1% between male
and female students by 2012
Disparities in the FSFE pass rate are
at least reduced from 24% to 15%
between rural and urban students
and 2% to 1% between male and

132
Goal: Educating the nation for peace and prosperity
Policy Objectives Strategies Key Performance Indicators
Enhanced rural
education programme
by establishing
appropriate
infrastructure, building
standards, review of
school performance and
piloting distance
education programme.
Strengthened
partnership between
government,
communities, donors,
municipal councils,
school management
committees, developers
and parents.
Strengthen and
expanded Technical
and Vocational
Educational and
Training (TVET).
Effective and efficient
allocation of subsidies
to tertiary institutions.
Conduct tracer study to
know the fate of school
leavers as school-
dropouts and qualified
graduates in the labour
market or in the tertiary
institution.
Review the Affirmative
Action policies.
Community awareness
campaigns on the
importance of
education in economic
development.
Better training in
financial management,
record keeping and
monitoring.
female students by 2012
Proportion of students successfully
completing TVET courses not less
than 90% to meet current and future
demand
All schools to hold a flag ceremony
at least once a week
Differential Resourcing Policy on
grants and staff distribution
implemented by 2009
Preschool enrolment in rural schools
increases by 10% each year from
16% in 2006
Compulsory teaching and learning
of Fijian language and culture in all
schools by 2012
All school names denoting racial
affiliation removed by 2012
Proportion of teachers undergo in-
service teacher training increased by
10% annually
All teachers serving in schools in
Fiji registered by December 2009
Commencement of the Higher
Education promulgation
implementation finalized by
December 2009

133
4.2.6 Health
Goal: Quality, affordable and efficient health services for all
Policy Objectives Strategies Key Performance Indicators
Communities are
provided with
adequate primary
and preventive
health services,
thereby protecting,
promoting and
supporting their
well being.
Strengthen and
implement integrated
programme on
maternal and child
health, Expanded
Programme on
Immunization,
Integrated
Management of
Childhood Illnesses
and Reproductive
Health
Child mortality rate reduced from 26 to 20
per 1000 live births by 2015(MDG).
Percentage of one year old immunized
against measles increased from 68% to
95%.
Reduce prevalence of underweight children
under five years of age by 50% (MDG)
.Implement the safe
motherhood
programme.
Maternal mortality ratio reduced from 50 to
20 per 100,000 live births by 2015 (MDG)
Antenatal care coverage (at least one visit
and at least four visits) (MDG)
Achieve universal
access to
reproductive health
and strengthen
reproductive
programme.
Reduce Adolescent birth rate (MDG)
Contraceptive prevalence rate amongst
population of child bearing age increased
from 46% to 56% by 2015 (MDG).
Unmet need for family planning reduced
from 50% to 40% (MDG)
Achieve universal
access to treatment
for HIV/AIDS for all
those who need it
HIV/AIDS prevalence among 15-24 year
old pregnant women reduced from 0.04 to
0.03 (MDG)
Proportion of population with advanced
HIV infection with access to antiretroviral
drugs (MDG)
Implement the
STI/HIV/AIDS
Strategic Plan 2010-
2012.
Implement the Non
Communicable
Prevalence of diabetes reduced from 16% to
14%.
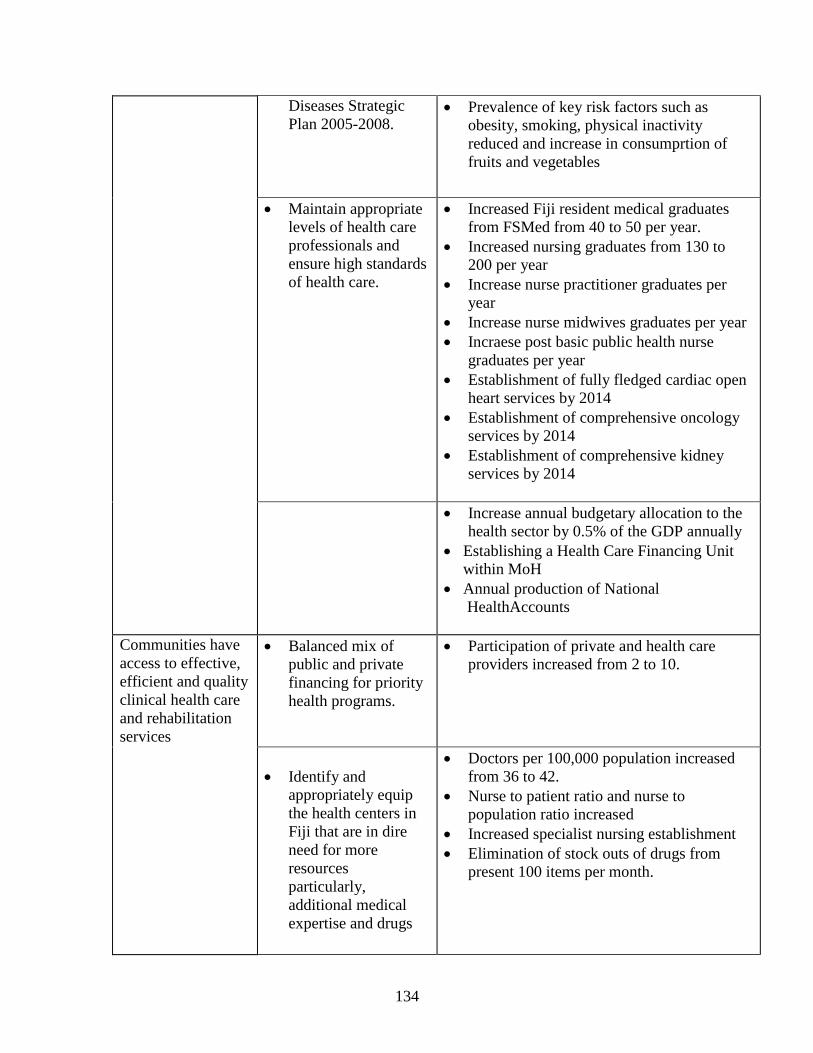
134
Diseases Strategic
Plan 2005-2008.
Prevalence of key risk factors such as
obesity, smoking, physical inactivity
reduced and increase in consumprtion of
fruits and vegetables
Maintain appropriate
levels of health care
professionals and
ensure high standards
of health care.
Increased Fiji resident medical graduates
from FSMed from 40 to 50 per year.
Increased nursing graduates from 130 to
200 per year
Increase nurse practitioner graduates per
year
Increase nurse midwives graduates per year
Incraese post basic public health nurse
graduates per year
Establishment of fully fledged cardiac open
heart services by 2014
Establishment of comprehensive oncology
services by 2014
Establishment of comprehensive kidney
services by 2014
Increase annual budgetary allocation to the
health sector by 0.5% of the GDP annually
Establishing a Health Care Financing Unit
within MoH
Annual production of National
HealthAccounts
Communities have
access to effective,
efficient and quality
clinical health care
and rehabilitation
services
Balanced mix of
public and private
financing for priority
health programs.
Participation of private and health care
providers increased from 2 to 10.
Identify and
appropriately equip
the health centers in
Fiji that are in dire
need for more
resources
particularly,
additional medical
expertise and drugs
Doctors per 100,000 population increased
from 36 to 42.
Nurse to patient ratio and nurse to
population ratio increased
Increased specialist nursing establishment
Elimination of stock outs of drugs from
present 100 items per month.

135
Improved level of
equity, efficiency and
effectiveness of
health services.
Doctors per 100,000 population increased
from 36 to 42
Elimination of stock outs of drugs from
present 100 items per month
Average length of stay for in-patient
treatment reduced from 5 to 3 days.
Outsourcing non technical activities such as
laundry, kitchen, housekeeping and security
by end of 2010.
Financial resources
shifted towards cost-
effective health
programmes.
Outsourcing non technical activities such as
laundry, kitchen, housekeeping and security
by end of 2010.
Implementation of a
Social Health
Insurance Scheme
Health expenditure increased from the
current 2.92% to at least 5% of GDP by
2013
New fees and charges
incorporated in the
revised Hospital and
Dispensary Act
Health expenditure increased from the
current 2.92% to at least 5% of GDP by
2013
Establish a Health
Policy Commission
Hospital Boards established by 2010
4.2.7 Gender Equality and Women Development
Goal: Achievement of gender equality and empowerment of women
Policy Objective Strategies Key Performance Indicator
Achievement of
Gender Equality and
Empowerment of
Women through full
participation in
business and decision-
making process
through entrepreneurial
support in non-formal
and formal sector and
decision making
processes.
Laws in relation to UN
CEDAW (articles 1-13)
reviewed, implemented and
monitored; gender
mainstreaming institutions
strengthened; a National
Women‘s Plan of Action
implemented, Domestic
Violence Bill enacted,
awareness training on the
Family Law Act, and ensure
appropriate sentencing
Share of women in wage
employment in the non-
agricultural sector increased
from 35.9% to 37.9% by 2011
(MDG).
Combined primary and
secondary girls: boys ratio of 1:1
(MDG).
The proportion of female school
principals, vice and assistant
principals to be not less than
25% by 2011.

136
Goal: Achievement of gender equality and empowerment of women
Policy Objective Strategies Key Performance Indicator
penalties, including
counseling, for violent
crimes, against women and
children.
Increase ability of women
and their access to income
generating activities
including SME.
Development (WOSED to be
reviewed), targeted
programmes for women in
agriculture reform and equal
training opportunities at all
levels in Government.
Empower women,
particularly rural women,
through training on
leadership, awareness of
human and indigenous rights
issues, health and quality of
life through Partnership,
Networking and
Coordination with women
groups and increased
collaboration and partnership
with NGOs.
Mainstream gender
perspectives in all ministries
Strategic plans, Corporate
plans and Business plans.
Strengthen women‘s groups
to increase awareness in the
role that women play in
societies.
conduct gender sensitization
workshops at national and
district (including village)
level
mobilizing and networking
with more men and young
boys organizations to work
as gender advocates
increased partnerships with
women‘s groups at
The proportion of female CEOs
in Government to be at least
20% by 2011.
At least one woman in each
Government board, committee,
tribunal, council, and
commission.
Proportion of seats held by
women in national parliament
and municipal elections to be not
less than 20% (MDG).
Number of women supported by
micro-finance increased from
5,100 in 2006 to not less than
19,500 by 2010.
Cases of domestic violence
recorded by police to be
monitored and analyzed.
Availability of Sex-
Disaggregated data.
Maintain the 50% parity of
young females
Full female parity (50%) in the
top three occupation group in
older age group
Percentage of Females who are
considered ―Economically
Active‖ to rise from the 31% in
2004-05 to 37.9% by 2011
Household work for
economically active females
reduced from 14 hours per week
to less than 5 hours by 2011.
Improve average paid work for
Economically Active women as
compared to men from17% to
less than 10% by 2011

137
Goal: Achievement of gender equality and empowerment of women
Policy Objective Strategies Key Performance Indicator
community level, non
government organisations
and civil society
organisations to conduct
empowerment programmes
for women
increased partnerships with
research institutions such as
the academia to provide
evidence based research and
results to make informed
policy decisions
support local and regional
organizations in engaging
with women‘s rights CSO‘s
and indigenous women‘s
groups to advocate and
advance gender equality
initiatives
adoption of a central data &
information management
information system to reflect
gender statistics and
indicators disaggregated by
ethnicity, age, disability, and
employment status and other
relevant status.
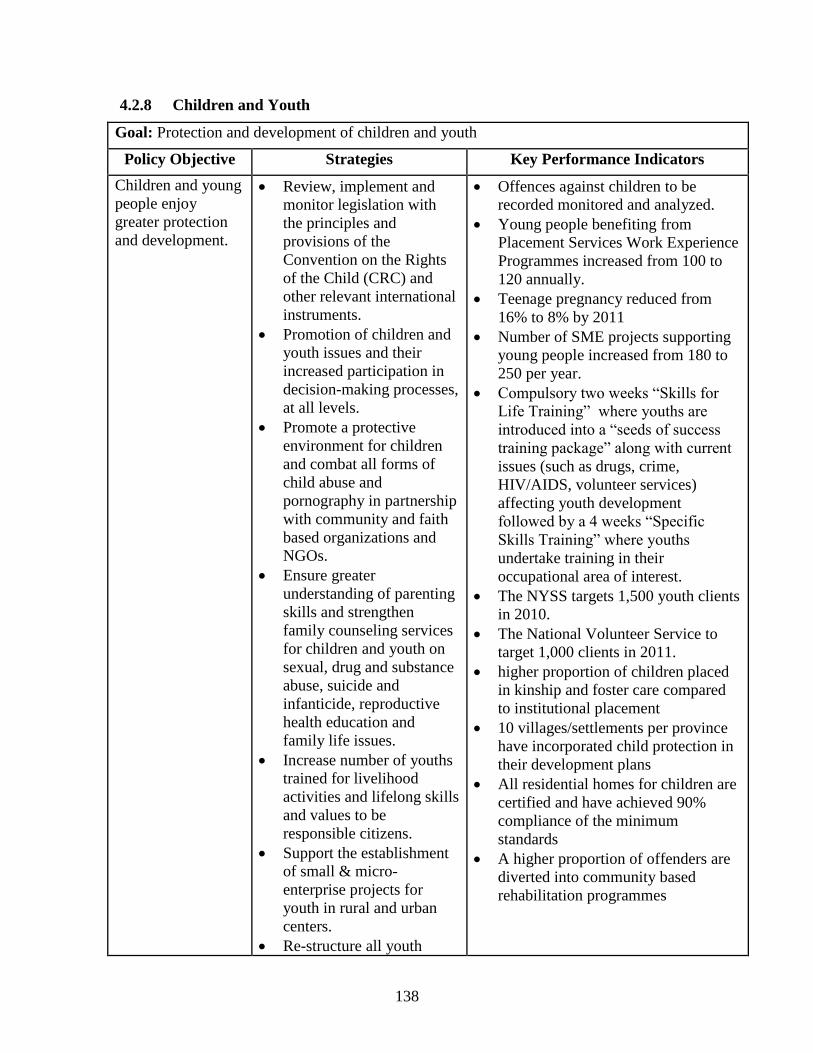
138
4.2.8 Children and Youth
Goal: Protection and development of children and youth
Policy Objective Strategies Key Performance Indicators
Children and young
people enjoy
greater protection
and development.
Review, implement and
monitor legislation with
the principles and
provisions of the
Convention on the Rights
of the Child (CRC) and
other relevant international
instruments.
Promotion of children and
youth issues and their
increased participation in
decision-making processes,
at all levels.
Promote a protective
environment for children
and combat all forms of
child abuse and
pornography in partnership
with community and faith
based organizations and
NGOs.
Ensure greater
understanding of parenting
skills and strengthen
family counseling services
for children and youth on
sexual, drug and substance
abuse, suicide and
infanticide, reproductive
health education and
family life issues.
Increase number of youths
trained for livelihood
activities and lifelong skills
and values to be
responsible citizens.
Support the establishment
of small & micro-
enterprise projects for
youth in rural and urban
centers.
Re-structure all youth
Offences against children to be
recorded monitored and analyzed.
Young people benefiting from
Placement Services Work Experience
Programmes increased from 100 to
120 annually.
Teenage pregnancy reduced from
16% to 8% by 2011
Number of SME projects supporting
young people increased from 180 to
250 per year.
Compulsory two weeks ―Skills for
Life Training‖ where youths are
introduced into a ―seeds of success
training package‖ along with current
issues (such as drugs, crime,
HIV/AIDS, volunteer services)
affecting youth development
followed by a 4 weeks ―Specific
Skills Training‖ where youths
undertake training in their
occupational area of interest.
The NYSS targets 1,500 youth clients
in 2010.
The National Volunteer Service to
target 1,000 clients in 2011.
higher proportion of children placed
in kinship and foster care compared
to institutional placement
10 villages/settlements per province
have incorporated child protection in
their development plans
All residential homes for children are
certified and have achieved 90%
compliance of the minimum
standards
A higher proportion of offenders are
diverted into community based
rehabilitation programmes

139
Goal: Protection and development of children and youth
Policy Objective Strategies Key Performance Indicators
development programmes
towards a more client
oriented and market driven
approach.
Encourage National
Volunteer Services in all
Govt. Ministries, &
Statutory Bodies.
Strengthen policy
formulation, programme
implementation and
monitoring.
4.2.9 Sports Development
Goal: Promoting sports for healthy lifestyles, employment opportunities, peace, unity and
harmony
Policy
Objectives
Strategies Key Performance Indicators
People enjoy
healthier
lifestyles and
improved
sporting skills and
knowledge.
Increase in participation of
citizens in ―Sports for All‖
activities and integrate them
in the workplace.
Support the development of
sports facilities, programmes
and involvement of the
private sector in sports.
Measures to be designed and
implemented to promote
minor sports and develop
professional players.
To facilitate employment
opportunities through sports.
Increased number of
qualified sports scientists and
administrators and improved
coordination between sports
agencies, continuing
implementation of the
National Sports policy.
Increase in the number of
Increase in corporate sponsorship
from $2.6 million to $3.5 million per
year.
Increase in gold medals from 25 to 35
in the Pacific and Mini South Pacific
Games.
At least 3 medals won at each
Commonwealth Games .
Each year, at least one age group in a
team sport to qualify for World
Championships.
Increase in number of athletes and
players contracted to overseas clubs
from 70 to 200.
Establishment of a Sports
Commission focusing on regulatory
aspects for national sporting bodies.

140
Goal: Promoting sports for healthy lifestyles, employment opportunities, peace, unity and
harmony
Policy
Objectives
Strategies Key Performance Indicators
national age group teams
(U13, U17, U19 and U23)
and competition for various
sports.
Review Government tax
incentives on sports
sponsorship for national
sporting federations.
Administration of sports
grants to National Sporting
Organizations.
Rural playing fields
development.
Implementation of sports
outreach program.
Establish regulatory body for
amateur sports
4.2.10 Environmental Sustainability
Goal: Sustainable management and utilization of Fiji‘s natural resources
Policy Objectives Strategies Key Performance Indicators
Fiji‘s environment
is protected from
unsustainable
degradation and
continues to
provide for our
current and future
needs
Promote awareness of
environmental management
at all levels and mobilize
communities to manage
their own environment as a
priority over outside
intervention by State and
Non-State actors.
Review and strengthen
legislation which includes
environmental management
provisions (e.g. Forest Act,
Public Health Act, and
Litter Decree) and
coordinate implementation
in the framework of the
EMA.
Enforce the EMA giving
Waste disposal increased to 100,000
tonnes per year from 2010 and
maintained.
100% of facilities comply with EMA
requirements by 2010.
All new developments to conduct EIA
and establish monitoring benchmarks
consistent with the EMA from 2010.
Total cessation of non-quarantine pre-
shipment application for methyl
bromide and chlorofluoro-carbons
(CFCs) by 2010.
5 new CDM projects registered by
2012.
Dept. of Environment operating as a
Statutory Authority by 2012.

141
Goal: Sustainable management and utilization of Fiji‘s natural resources
Policy Objectives Strategies Key Performance Indicators
priority to early full
enforcement of provisions
for EIA and Waste
Management and Pollution
Control.
Continue the
implementation of the
Biodiversity Strategy and
Action Plan and Endangered
and Protected Species Act
and the ODS Act 1998.
Increase awareness of
Climate Change and its
impact
Explore potential areas
where Fiji can take
advantage of Carbon
Trading Facility provided
under the Kyoto Protocol.
Re-organization of Dept. of
Environment into a
Statutory Authority
4.2.11 Culture and Heritage
Goal: Protection and promotopn of our culture and heritage for current and future generations
Policy
Objectives
Strategies Key Performance Indicators
Each
community
enjoys
increased
experience and
benefits of its
own culture and
heritage and
appreciation of
those of fellow
communities in
Fiji.
Protect, preserve and manage
Fiji‘s cultural and natural heritage
Assist the agencies in the
implementation of their
development policies and
strengthen co-ordination of their
work.
Develop and strengthen Fiji Arts
Council, Fiji Museum, Fiji Art
Gallery, and National Trust of Fiji
to increase their effectiveness.
Develop strategies to preserve,
promote and increase awareness of
culture for posterity.
At least 2 heritage sites
included in the World Heritage
listing.
At least 80% of resource
owners meet standard for best
practices in the marketing of
cultural resources.
At least 20 new heritage sites
included as visitor attractions.
At least 20 new archaeological
sites surveyed annually.

142
Goal: Protection and promotopn of our culture and heritage for current and future generations
Policy
Objectives
Strategies Key Performance Indicators
Establish partnerships and links of
professional cultural heritage
institutions locally and overseas to
support technical training on
heritage management and
preservation.
Promote conservation and cultural
resource development that
emphasizes partnership with local
resource owners & local
institutions.
Fully capitalize the Fiji Heritage
Foundation as a sustainable and
innovative funding mechanism for
cultural heritage projects.
Develop a cultural heritage and
arts curricula for primary and
secondary schools for inclusion
into the formal education
curricula.
4.2.12 Disaster Risk Reduction and Disaster Management
Goal: Building national resilience to disasters and adapting to climate change
Policy
Objectives
Strategies Key Performance Indicators
Communitie
s are better
protected
from the
risks of
disasters
and are
better able
to cope with
their
consequenc
es.
Identify and implement effective
risk reduction projects.
Improve community response
capacity in dealing with disasters
and risks with effective, integrated
and people-focused early warning
systems on all hazards.
Enhance analysis and evaluation of
hazards, vulnerabilities and risks.
Promote and strengthen food
security programme to enhance
community based disaster
reduction initiatives.
Government responds to disaster
situation within the first 24 hours.
Casualties reduced from 30 per year
to none.
Everybody to receive timely
warning
One third of all villages and
settlements in Fiji have disaster
plans and committees in 2010
Models of best practice developed
and adopted to support disaster risk
reduction
Cost for disaster emergency relief

143
Strengthen organizational,
institutional, policy and decision
making frameworks.
Enhance knowledge, information,
public awareness and education.
Strengthen effective planning,
response and recovery.
Ensure availability of adequate
necessary germplasm to support
recovery.
food ration reduced by 20% by
2012
4.2.13 Rural and Outer Islands Development
Goal: Promoting equal opportunities and access to basic services, livelihoods and
markets
Policy Objectives Strategies Key Performance Indicators
Rural and outer island
communities to meet
their basic needs,
improve living standards
and quality of life
towards self-sufficiency.
Extend FEA power
connectivity across
Vanua Levu.
Strengthen interagency
coordination to facilitate
implementation of major
road infrastructure
programs earmarked for
Vanua Levu such as
those under Chinese loan,
and Savusavu port.
Awareness programmes
to educate rural
population on
Government assistance
and their civic
responsibilities.
Undertake capacity
building in divisional
offices to better serve
population.
Develop divisional
development plans in
consultation with
divisional stakeholders,
including community.
Improve provision of
basic services to the rural
areas (health, education,
Family Assistance Scheme
beneficiaries in Eastern and
Northern Divisions reduced
by 1500 from current level
of over 7600 by 2014.
Endorsement of all four
Divisional Development
Plans by Cabinet by 2011.

144
Goal: Promoting equal opportunities and access to basic services, livelihoods and
markets
Policy Objectives Strategies Key Performance Indicators
agriculture extension)
Rural and outer island
dwellers enjoy
increased access to
markets and
government services to
ensure income and food
security.
Community capacity
building programmes at
grassroots levels in
collaboration with NGOs.
Support development of
MSME.
Inter island shipping
routes reviewed as well
as improvement in inter
island maritime
infrastructure.
Increased access to
formal financial services
for savings and credit,
including rural banking,
microfinance and savings
and credit unions.
Increased market access
and connectivity by
upgrading infrastructure
and the provision of
basic services and
amenities.
Minimum of 2 trips per
month on each of nine
franchised outer island
shipping routes.
1500 newly registered tax
payers on Vanua Levu
annually.
2000 newly registered
FNPF members on Vanua
Levu annually.
At least 5 companies
established under tax free
zone initiative in Vanua
Levu by 2014.

CHAPTER 5

145
Chapter 5 Implementation and Monitoring Mechanism
It is recognized that the successful implementation of the Roadmap to Democratic
and Sustainable Socio Economic Development (RDSSED) will require effective
leadership, coordination, commitment, the necessary resources and continuous
capacity building. Therefore, it is imperative that the necessary institutional
arrangement is in place to ensure effective implementation of the Roadmap.
5.1 The Implementation Framework
All stakeholders and implementing agencies including Ministries and Departments
will ensure that all key initiatives and major outputs are achieved within the
timeframe. The framework to ensure a systematic and coherent approach to
implementation is illustrated in Figure 5.1 and will consist of the following phases:
(i) Roadmap - based on the Strategic Framework for Change which will outline
the outputs and respective strategies and programmes to achieve the outcomes
in the Strategic Framework.
(ii) Action Plans - based on the Roadmap, ministries and departments will
develop Action Plans which will be basis for the formulation of their Annual
Corporate Plans.
(iii) Nationwide Effort - all stakeholders including ministries and departments
must contribute positively to the implementation programme.
(v) Implementation and Monitoring - a monitoring and reporting framework
will be developed to ensure systemic and effective implementation.
Figure 5.1: The Implementation Framework
Strategic Framework
Roadmap
Action Plans
Implementation &
Monitoring Framework
Annual
Corporate Plans
July 09
Aug 09
Sept 09
Oct 09

146
5.2 The Monitoring Mechanism
The monitoring mechanism will involve the National Peoples Charter Council
(NPCC), eleven sub-committees, a secretariat, Ministries and Departments, private
sector and civil society. The entities involved in the mechanism and their reporting
relationship is illustrated in Figure 5.2.
5.2.1 Composition and Functions of the NPCC
The members of the NPCC will be inclusive and representative of the people of Fiji.
Therefore, members shall be drawn from the Government of the day, members of
Parliament, recognised private sector organisations, the Great Council of Chiefs, Non
Government Organisations, religious organisations, provincial councils, advisory
councils and other community-based organisations.
Whereas the implementation and monitoring mechanisms of successive previous
Governments have focused largely on passively reviewing implementation
performance, this will need adjustment and updating as circumstances change over
time. In light of this necessity and the need for greater public inclusiveness, dialogue
and participation, the NPCC, shall be actively engaged in performing the role of
facilitator, setting and shaping the ongoing agenda for change.
The NPCC will monitor the Roadmap outputs and their respective Key Performance
Indicators (KPIs), as contained in the attached Implementation and Monitoring
Matrix. The NPCC, and sub-committees will not limit themselves to assessing
progress against the KPIs: an important function of the sub-committees will be to
assess the continuing relevance of outcomes and KPIs and the quality of information
they are providing so that the adequacy of all KPIs is kept under review.
The functions of the NPCC, shall include:
monitor Roadmap implementation focusing on the outputs and key
performance indicators;
provide forums for consultation and dialogue for consensus building on
national development issues;
carry out civic education on governance issues, national identity and other
issues considered relevant and important;
evaluate and review performance of implementing agencies;
review of the Roadmap when necessary for the purpose of updating and
adjustment; and
provide policy advice and support to the Prime Minister and Cabinet on issues
pertaining to the Roadmap.

147
PARLIAMENT
NATIONAL PEOPLES CHARTER
COUNCIL
Sub-Com
Pillar 1
Figure 5.2 Monitoring Framework for the Roadmap
Sub-Com
Pillar 2
Sub-Com
Pillar 3
Sub-Com
Pillar 5
Sub-Com
Pillar 4
Sub-Com
Pillar 6
Sub-Com
Pillar 7
Sub-
Com
Pillar 8
Sub-Com
Pillar 9
Sub-Com
Pillar 10
Sub-Com
Pillar 11
Government Ministries and Departments Civil Society Organisations Private Sector Organisations

148
Sub-Committees
To support the work of the NPCC, eleven sub committees will be established to coordinate the work
relevant to their respective sectors based on their Terms-of-Reference. The sub-committees will
comprise representatives from Government, the private sector and civil society. To facilitate
implementation, the sub-committees will meet on a quarterly basis during the year.
The sub-committees will:
set a broad agenda for the four meetings in the year in consultation with the Secretariat;
with the assistance of the Secretariat, hold meetings in accordance with the forward
programme. The objective of the meetings will be to monitor progress made in the
achievement of KPIs, identify constraints and corrective actions; and
provide an oral report and recommendations to meetings of the NPCC.
Secretariat
A Secretariat will be established under the Ministry of National Planning to support the NPCC in its
functions. The secretariat needs to be professional and have a strong technical background to better
support the NPCC. In light of the broad range and complexity of issues involved, the Secretariat must
be adequately equipped with resources and expertise.
The Secretariat will:
determine, with the sub-committees‘ Chair, which Ministries and Departments, private sector
and civil society sections have responsibilities relevant to the work of the sub-committees;
determine from the Implementation and Monitoring Framework and annual corporate plans of
relevant Ministries and Departments what progress should be expected, and what information
available, in the forthcoming financial year; also assist the Chair to set a forward agenda;
communicate the forward agenda to all members and Permanent Secretaries of relevant
Ministries and Departments, private sector and civil society;
maintain contact with relevant Ministries and Departments to determine the range of
performance information available;
set up an information and cooperation network with relevant Ministries and Departments, the
private sector and civil society so that they can actively support the Secretariat role;
set dates for meetings and inform members of sub-committees; ensure as far as possible that
information relevant to the discussion is circulated beforehand; and where final published
information is not available, obtain estimates or provisional data; and
record the discussions to form a basis for the Chair‘s oral report to the NPCC.
Permanent Secretaries of Ministries and Departments
Permanent Secretaries will contribute to the implementation and monitoring of the Roadmap to
Democratic and Sustainable Socio Economic Development (RDSSED) by:
ensuring that there are direct links between their annual corporate plans, RDSSED and budget
bids. Performance indicators and milestones in annual corporate plans should be realistic and

149
achievable within the resources of the Ministry or Department with appropriate collaboration
from other parts of Government, and capable of being achieved within the year covered by the
Plan;
aligning their personal performance agreements to the outputs and coordination requirements
identified in the RDSSED and the annual corporate plans; and
personally attending meetings of the sub-committees to which their Ministry or Department is
relevant, and taking a personal interest in the quality and timeliness of the information being
provided by their Ministry or Department to the sub-committees.
Cabinet
Cabinet will play an active leadership role in the implementation and monitoring and will:
discuss on a regular basis progress reports on Roadmap implementation;
on the advice of NPCC, and in consultation with the President‘s Office, effect reviews when
necessary to the Roadmap; and
through the Ministers ensure full and effective implementation of the Roadmap.
5.2.2 Management Information System
The effectiveness of monitoring and evaluation systems is dependent on the establishment of a well-
developed management information system. The availability of timely and quality data is essential to
ensure informed decisions are undertaken.
The Fiji Islands Bureau of Statistics, as the national statistical agency, is mandated to ‗collect, compile,
abstract, analyse and publish statistical information relating to the commercial, industrial, agricultural,
social, economic and general activities and conditions of the people of Fiji in a timely and coherent
manner.‘
An Information System will be established and maintained so that the implementation of reforms can
be tracked and timely corrective actions taken. The Information System will include agreed baselines,
time-bound indicators, and specific benchmarks to measure and monitor progress. It will permit timely
analysis and prompt publication of the results from and effects of the RDSSED initiatives.

APPENDICES

151
Appendix 1 Macroeconomic Data and Projections
Table 1: Gross Domestic Product by Sector ($000), 2001 - 2011
ACTIVITY
2001
2002
2003
2004
2005
2006
2007
2008
2009 2010
2011
Agriculture, Forestry,
Fishing & Subsistence 434,063 454,481 434,940 457,419 461,276 458,803 432,787 432,042 428,560 446,353 457,895
Agriculture 329,213 343,848 335,113 342,374 342,350 345,127 332,269 329,714 331,623 373,345 361,331
Crops 186,309 197,761 188,352 193,091 192,644 190,561 178,131 174225 176066 188977 202945
Sugarcane 121853 124721 121070 122331 114813 121,157 94431 82155 82155 90370 99408
Other Crops 64456 73040 67282 70760 77831 69,404 83700 92070 93911 98607 103537
Livestock Products 15822 17872 18770 20510 20511 23,917 24175 25142 24891 25388 26658
Subsistence 119329 119624 120176 121059 121499 122,181 122770 123384 123877 124497 125119
Public Sector 7753 8591 7815 7714 7696 8,468 7193 6963 6789 6538 6609
Fishing 70,162 77,546 61,878 76,984 82,570 78,988 66,396 69,368 66,982 69,723 65,040
Fishing 42356 49804 33465 48356 53844 50,155 37270
40065 37661 40298 35462
Subsistence 27278 27345 27471 27673 27774 27,930 28065 28205 28318 28460 28602
Public Sector 528 397 942 955 952 903 1061 1097 1003 966 976
Forestry 34,688 33,087 37,949 38,061 36,356 34,688 34,122 32,961 29,955 31,230 31,524
Forestry 17532 15912 20736 20700 18936 17,175 16520 15198 12159 13375 13575
Subsistence 16461 16501 16578 16699 16760 16,854 16936 17021 17089 17174 17260
Public Sector 695 674 635 662 660 659 666 742 707 681 688
Mining and
Quarrying 41,566 40,081 37,833 43,384 30,045 15,092 312.0 7,530.8 12,051.6 16,738.5 20,086.2
Manufacturing 449,852 453,488 448,857 506,482 428,293 440,027 440,993 423,509 414,955 428,877 439,014
Sugar 60483 61849 60093 60679 56972 60,094 46826 40739 40739 44812 49294
Beverage and
Tobacco 46804 52579 61734 71082 91340 102,655 121971 121483 119053 121435 123863
Other Food
Industries 30844 34184 35690 38080 36869 38,080 36247 36972 37711 395597 41577
Non Food Industries 299809 292661 278821 323785 229918 225,633 222,114 210204 203058 208351 209305
Clothing and
Footwear 178054 156349 139280 173582 78256 56,661 59551 47641 40495 37660 36907
Other Non Food
Industries 121755 136312 139541 150203 151662 168,973 162563 162563 162563 170691 172398
Informal Sector 11912 12215 12519 12856 13194 13,565 13835 14112 14394 14682 14975
Electricity & Water 100,150 104,429 108,696 112,905 114,385 122,073 122,564 118,661 120,314 123,087 125,934
Electricity 94027 98158 102149 104739 106000 111,111 111,461 107003 108073 110234 112439
Water 6123 6271 6547 8166 8385 10,962 11,103 11658 12241 12853 13496
Building &
Construction 116,491 126,221 134,873 140,693 177,533 191,740 152,334 152566 153148 153382 153617
Private Sector 26539 27175 36683 47645 89941 105,294 77517 77517 73641 73641 73641
Public Sector 41024 50005 50502 45022 39453 40,336 28,482 28482 32754 32754 32754
Own Account & Self
Employment 48928 49041 47688 48026 48139 46,110 46335 46567 46753 46987 47222
Wholesale & Reatil
Trade, Hotels &
Restaurants 465,157 465,964 476,946 537,605 532,244 556,559 528,799 544,775 531,260 542,437 554,006
Wholesale & Retail
Trade 342,188 332,016 338,314 376,278 354,750 379,199 364,909 372207 365258 369036 372855
Wholesale & Retail
Trade 330717 320643 326648 364320 342889 367,273 352788 359844 352647 356173 359735
Informal Sector 11471 11373 11666 11958 11861 11,926 12,121 12363 12611 12863 13120
Hotels & Restaurants 122,969 133,948 138,632 161,327 177,494 177,360 163,890 172568 166002 173401 181151
Hotels &
Restaurants 98092 108437 112486 134477 149939 149,030 134996 143096 135941 142738 149875
Informal Sector 24877 25511 26146 26850 27555 28,330 28894 29472 30061 30663 31276
Transport &
Communication 357,551 387,990 401,055 394,313 422,277 408,328 391,838 406,546 410,756 418,555 431,355
Transport 249,567 274,984 283,983 289,987 315,164 305,853 296,571 309,374 309,697 315,475 326,213

152
Land Transport 36862 37736 38785 39943 41273 42,684 43566 4437 45326 46233 47157
Water Transport 30608 33335 35149 35948 42748 39,739 40104 40906 41724 42559 43410
Air Transport 52862 65871 74064 78525 78187 79,125 77574 83780 79591 79591 81979
Services allied to
Transport 108158 116427 113833 112822 129610 120,302 110846 115280 117585 121113 127169
Informal Sector 21077 21615 22152 22749 23346 24,003 24481 24971 25470 25979 26499
Communication 107984 113006 117072 104326 107113 102,475 95,267 97,172 101,059 103,080 105,142
Finance,Insurance,Real
Estate & Business
Services 373,913 367,174 323,429 336,374 369,984 428,122 420,595 425,629 417,874 423,763 431,316
Finance 110,139 101,688 79,567 85,059 104,387 130,390 120,041 117751 105516 103593 103022
Monatary Institution 84,542 78,869 67,942 66,281 80,496 93,993 89,501 99876 87641 85372 84443
Private Sector 53179 57185 49890 48041 60748 78,984 67790 74908 72661 73387 74855
Public Sector 31363 21684 18052 18240 19748 15,009 21711 24968 14981 11984 9588
Other Financial
Institution 25,597 22,819 11,625 18,778 23,891 36,397 30,540 17875 17875 18221 18580
Private Sector 3666 3666 2095 1571 4189 17,281 16758 4190 4190 4399 4619
Public Sector 21931 19153 9530 17207 19702 19,116 13782 13686 13686 13822 13961
Insurance 91,526 99,511 74,818 77,317 81,334 81,328 79,641 81219 83162 85153 87194
Private Sector 42941 44081 48453 49467 52514 51,211 48395 49363 50350 51357 52384
Public Sector 48585 55430 26365 27850 28820 30,117 31246 31856 32812 33796 34810
Real Estate &
Business Services 172,248 165,975 169,044 173,998 184,263 216,404 220,913 226660 229196 235017 241100
Formal Sector 51533 44962 47472 51533 61352 92,803 96716 101842 103879 109073 114526
Owner Occupied
Dwellings 120715 121013 121572 122465 122911 123,601 124197 124818 125317 125944 126574 Community, Social and
Personal Services 467,737 483,555 518,645 515,089 547,318 591,776 509,311 492,679 493,710 479,942 464,671
Personal &
Household Services 59,268 60,904 62,359 63,868 65,387 67,001 68,251 69262 70293 71344 72417
Formal Sector 15760 16287 16632 16909 17195 17,453 17717 17717 17717 17717 17717
Informal Sector 43508 44617 45727 46959 48192 49,548 50534 51545 52576 53627 54700
Social & Related
Community Services 408469 422651 456286 451221 481931 524,775 441,060 423,418 423,418 408,598 392,254
less imputed bank
service charges 117887 108841 85164 91043 111730 139,563 128,486 126,034 112,939 110,881 110,269
Grand Total 2,688,595 2,774,544 2,800,111 2,953,223 2,971,624 3,072,957 2,871,047 2,877,904 2,869,689 2,922,254 2967626
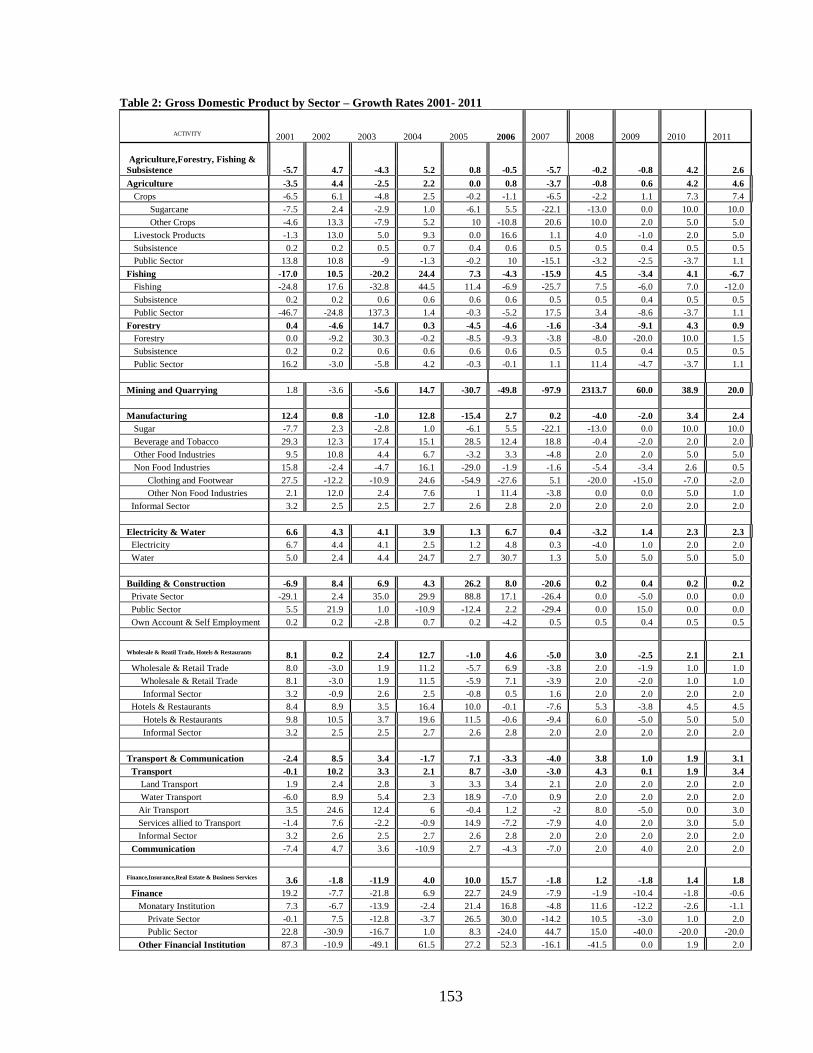
153
Table 2: Gross Domestic Product by Sector – Growth Rates 2001- 2011
ACTIVITY
2001
2002
2003
2004
2005 2006 2007 2008 2009 2010 2011
Agriculture,Forestry, Fishing &
Subsistence -5.7 4.7 -4.3 5.2 0.8 -0.5 -5.7 -0.2 -0.8 4.2 2.6
Agriculture -3.5 4.4 -2.5 2.2 0.0 0.8 -3.7 -0.8 0.6 4.2 4.6
Crops -6.5 6.1 -4.8 2.5 -0.2 -1.1 -6.5 -2.2 1.1 7.3 7.4
Sugarcane -7.5 2.4 -2.9 1.0 -6.1 5.5 -22.1 -13.0 0.0 10.0 10.0
Other Crops -4.6 13.3 -7.9 5.2 10 -10.8 20.6 10.0 2.0 5.0 5.0
Livestock Products -1.3 13.0 5.0 9.3 0.0 16.6 1.1 4.0 -1.0 2.0 5.0
Subsistence 0.2 0.2 0.5 0.7 0.4 0.6 0.5 0.5 0.4 0.5 0.5
Public Sector 13.8 10.8 -9 -1.3 -0.2 10 -15.1 -3.2 -2.5 -3.7 1.1
Fishing -17.0 10.5 -20.2 24.4 7.3 -4.3 -15.9 4.5 -3.4 4.1 -6.7
Fishing -24.8 17.6 -32.8 44.5 11.4 -6.9 -25.7 7.5 -6.0 7.0 -12.0
Subsistence 0.2 0.2 0.6 0.6 0.6 0.6 0.5 0.5 0.4 0.5 0.5
Public Sector -46.7 -24.8 137.3 1.4 -0.3 -5.2 17.5 3.4 -8.6 -3.7 1.1
Forestry 0.4 -4.6 14.7 0.3 -4.5 -4.6 -1.6 -3.4 -9.1 4.3 0.9
Forestry 0.0 -9.2 30.3 -0.2 -8.5 -9.3 -3.8 -8.0 -20.0 10.0 1.5
Subsistence 0.2 0.2 0.6 0.6 0.6 0.6 0.5 0.5 0.4 0.5 0.5
Public Sector 16.2 -3.0 -5.8 4.2 -0.3 -0.1 1.1 11.4 -4.7 -3.7 1.1
Mining and Quarrying 1.8 -3.6 -5.6 14.7 -30.7 -49.8 -97.9 2313.7 60.0 38.9 20.0
Manufacturing 12.4 0.8 -1.0 12.8 -15.4 2.7 0.2 -4.0 -2.0 3.4 2.4
Sugar -7.7 2.3 -2.8 1.0 -6.1 5.5 -22.1 -13.0 0.0 10.0 10.0
Beverage and Tobacco 29.3 12.3 17.4 15.1 28.5 12.4 18.8 -0.4 -2.0 2.0 2.0
Other Food Industries 9.5 10.8 4.4 6.7 -3.2 3.3 -4.8 2.0 2.0 5.0 5.0
Non Food Industries 15.8 -2.4 -4.7 16.1 -29.0 -1.9 -1.6 -5.4 -3.4 2.6 0.5
Clothing and Footwear 27.5 -12.2 -10.9 24.6 -54.9 -27.6 5.1 -20.0 -15.0 -7.0 -2.0
Other Non Food Industries 2.1 12.0 2.4 7.6 1 11.4 -3.8 0.0 0.0 5.0 1.0
Informal Sector 3.2 2.5 2.5 2.7 2.6 2.8 2.0 2.0 2.0 2.0 2.0
Electricity & Water 6.6 4.3 4.1 3.9 1.3 6.7 0.4 -3.2 1.4 2.3 2.3
Electricity 6.7 4.4 4.1 2.5 1.2 4.8 0.3 -4.0 1.0 2.0 2.0
Water 5.0 2.4 4.4 24.7 2.7 30.7 1.3 5.0 5.0 5.0 5.0
Building & Construction -6.9 8.4 6.9 4.3 26.2 8.0 -20.6 0.2 0.4 0.2 0.2
Private Sector -29.1 2.4 35.0 29.9 88.8 17.1 -26.4 0.0 -5.0 0.0 0.0
Public Sector 5.5 21.9 1.0 -10.9 -12.4 2.2 -29.4 0.0 15.0 0.0 0.0
Own Account & Self Employment 0.2 0.2 -2.8 0.7 0.2 -4.2 0.5 0.5 0.4 0.5 0.5
Wholesale & Reatil Trade, Hotels & Restaurants 8.1 0.2 2.4 12.7 -1.0 4.6 -5.0 3.0 -2.5 2.1 2.1
Wholesale & Retail Trade 8.0 -3.0 1.9 11.2 -5.7 6.9 -3.8 2.0 -1.9 1.0 1.0
Wholesale & Retail Trade 8.1 -3.0 1.9 11.5 -5.9 7.1 -3.9 2.0 -2.0 1.0 1.0
Informal Sector 3.2 -0.9 2.6 2.5 -0.8 0.5 1.6 2.0 2.0 2.0 2.0
Hotels & Restaurants 8.4 8.9 3.5 16.4 10.0 -0.1 -7.6 5.3 -3.8 4.5 4.5
Hotels & Restaurants 9.8 10.5 3.7 19.6 11.5 -0.6 -9.4 6.0 -5.0 5.0 5.0
Informal Sector 3.2 2.5 2.5 2.7 2.6 2.8 2.0 2.0 2.0 2.0 2.0
Transport & Communication -2.4 8.5 3.4 -1.7 7.1 -3.3 -4.0 3.8 1.0 1.9 3.1
Transport -0.1 10.2 3.3 2.1 8.7 -3.0 -3.0 4.3 0.1 1.9 3.4
Land Transport 1.9 2.4 2.8 3 3.3 3.4 2.1 2.0 2.0 2.0 2.0
Water Transport -6.0 8.9 5.4 2.3 18.9 -7.0 0.9 2.0 2.0 2.0 2.0
Air Transport 3.5 24.6 12.4 6 -0.4 1.2 -2 8.0 -5.0 0.0 3.0
Services allied to Transport -1.4 7.6 -2.2 -0.9 14.9 -7.2 -7.9 4.0 2.0 3.0 5.0
Informal Sector 3.2 2.6 2.5 2.7 2.6 2.8 2.0 2.0 2.0 2.0 2.0
Communication -7.4 4.7 3.6 -10.9 2.7 -4.3 -7.0 2.0 4.0 2.0 2.0
Finance,Insurance,Real Estate & Business Services 3.6 -1.8 -11.9 4.0 10.0 15.7 -1.8 1.2 -1.8 1.4 1.8
Finance 19.2 -7.7 -21.8 6.9 22.7 24.9 -7.9 -1.9 -10.4 -1.8 -0.6
Monatary Institution 7.3 -6.7 -13.9 -2.4 21.4 16.8 -4.8 11.6 -12.2 -2.6 -1.1
Private Sector -0.1 7.5 -12.8 -3.7 26.5 30.0 -14.2 10.5 -3.0 1.0 2.0
Public Sector 22.8 -30.9 -16.7 1.0 8.3 -24.0 44.7 15.0 -40.0 -20.0 -20.0
Other Financial Institution 87.3 -10.9 -49.1 61.5 27.2 52.3 -16.1 -41.5 0.0 1.9 2.0

154
Private Sector 0.0 0.0 -42.9 -25.0 166.6 312.5 -3.0 -75.0 0.0 5.0 5.0
Public Sector 119.3 -12.7 -50.2 80.6 14.5 -3.0 -27.9 -0.7 0.0 1.0 1.0
Insurance 36.4 8.7 -24.8 3.3 5.2 0.0 -2.1 2.0 2.4 2.4 2.4
Private Sector 2.8 2.7 9.9 2.1 6.2 -2.5 -5.5 2.0 2.0 2.0 2.0
Public Sector 91.9 14.1 -52.4 5.6 3.5 4.5 3.7 2.0 3.0 3.0 3.0
Real Estate & Business Services -14.5 -3.6 1.8 2.9 5.9 17.4 2.1 2.6 1.1 2.5 2.6
Formal Sector -36.4 -12.8 5.6 8.6 19.1 51.3 4.2 5.3 2.0 5.0 5.0
Owner Occupied Dwellings 0.2 0.2 0.5 0.7 0.4 0.6 0.5 0.5 0.4 0.5 0.5
Community, Social and Personal Services 2.2 3.4 7.3 -0.7 6.3 8.1 -13.9 -3.3 0.2 -2.8 -3.2
Personal & Household Services 2.5 2.8 2.4 2.4 2.4 2.5 1.9 1.5 1.5 1.5 1.5
Formal Sector 0.6 3.3 2.1 1.7 1.7 1.5 1.5 0.0 0.0 0.0 0.0
Informal Sector 3.2 2.5 2.5 2.7 2.6 2.8 2.0 2.0 2.0 2.0 2.0
Social & Related Community
Services 2.1 3.5 8.0 -1.1 6.8 8.9 -16 -4.0 0.0 -3.5 -4.0
less imputed bank service charges 19.2 -7.7 -21.8 6.9 22.7 24.9 -7.9 -1.9 -10.4 -1.8 -0.6
Grand Total 1.9 3.2 0.9 5.5 0.6 3.4 -6.6 0.2 -0.3 1.8 1.6

155
Table 3: Gross Domestic Product Shares by Sector (%) 2001- 2011
Activity 2001 2002 2003 2004 2005 2006 2007 2008 2009 2010 2011
Agriculture,Forestry, Fishing &
Subsistence 16.1 16.4 15.5 15.5 15.5 14.9 15.1 15.0 14.9 15.3 15.4
Agriculture 12.2 12.4 12.0 11.6 11.5 11.2 11.5 11.5 11.6 11.8 12.2
Crops 6.9 7.1 6.7 6.5 6.5 6.2 6.2 6.1 6.1 6.5 6.8
Sugarcane 4.5 4.5 4.3 4.1 3.9 3.9 3.3 2.9 2.9 3.1 3.3
Other Crops 2.4 2.6 2.4 2.4 2.6 2.3 2.9 3.2 3.3 3.4 3.5
Livestock Products 0.6 0.6 0.7 0.7 0.7 0.8 0.8 0.9 0.9 0.9 0.9
Subsistence 4.4 4.3 4.3 4.1 4.1 4.0 4.3 4.3 4.3 4.3 4.2
Public Sector 0.3 0.3 0.3 0.3 0.3 0.3 0.3 0.2 0.2 0.2 0.2
Fishing 2.6 2.8 2.2 2.6 2.8 2.6 2.3 2.4 2.3 2.4 2.2
Fishing 1.6 1.8 1.2 1.6 1.8 1.6 1.3 1.4 1.3 1.4 1.2
Subsistence 1.0 1.0 1.0 0.9 0.9 0.9 1.0 1.0 0.6 1.0 1.0
Public Sector 0.0 0.0 0.0 0.0 0.0 0.0 0.0 0.0 0.0 0.0 0.0
Forestry 1.3 1.2 1.4 1.3 1.2 1.1 1.2 1.1 1.0 1.0 1.0
Forestry 0.7 0.6 0.7 0.7 0.6 0.6 0.6 0.5 0.4 0.4 0.4
Subsistence 0.6 0.6 0.6 0.6 0.6 0.5 0.6 0.6 0.6 0.6 0.6
Public Sector 0.0 0.0 0.0 0.0 0.0 0.0 0.0 0.0 0.0 0.0 0.0
Mining and Quarrying 1.5 1.4 1.4 1.5 1.0 0.5 0.0 0.3 0.4 0.6 0.7
Manufacturing 16.7 16.3 16.0 17.2 14.4 14.3 15.4 14.7 14.3 14.6 14.8
Sugar 2.2 2.2 2.1 2.1 1.9 2.0 1.6 1.4 1.4 1.5 1.7
Beverage and Tobacco 1.7 1.9 2.2 2.4 3.1 3.3 4.2 4.2 4.3 4.3 4.3
Other Food Industries 1.1 1.2 1.3 1.3 1.2 1.2 1.3 1.3 1.3 1.3 1.4
Non Food Industries 11.2 10.5 10.0 11.0 7.7 7.3 7.7 7.3 6.8 6.9 6.9
Clothing and Footwear 6.6 5.6 5.0 5.9 2.6 1.8 2.1 1.7 1.4 1.4 1.2
Other Non Food Industries 4.5 4.9 5.0 5.1 5.1 5.5 5.7 5.6 5.4 5.6 5.6
Informal Sector 0.4 0.4 0.4 0.4 0.4 0.4 0.5 0.5 0.5 0.5 0.5
Electricity & Water 3.7 3.8 3.9 3.8 3.8 4.0 4.3 4.1 4.3 4.3 4.3
Electricity 3.5 3.5 3.6 3.5 3.6 3.6 3.9 3.7 3.8 3.8 3.8
Water 0.2 0.2 0.2 0.3 0.3 0.4 0.4 0.4 0.4 0.4 0.5
Building & Construction 4.3 4.5 4.8 4.8 6.0 6.2 5.3 5.3 5.4 5.3 5.2
Private Sector 1.0 1.0 1.3 1.6 3.0 3.4 2.7 2.7 2.6 2.5 2.5
Public Sector 1.5 1.8 1.8 1.5 1.3 1.3 1.0 1.0 1.1 1.1 1.1
Own Account & Self Employment 1.8 1.8 1.7 1.6 1.6 1.5 1.6 1.6 1.6 1.6 1.6
Wholesale & Reatil Trade, Hotels &
Restaurants 17.3 16.8 17.0 18.2 17.9 18.1 18.4 18.9 18.5 18.5 18.7
Wholesale & Retail Trade 12.7 12.0 12.1 12.7 11.9 12.3 12.7 12.9 12.8 12.7 12.8
Wholesale & Retail Trade 12.3 11.6 11.7 12.3 11.5 12.0 12.3 12.5 12.4 12.3 12.3
Informal Sector 0.4 0.4 0.4 0.4 0.4 0.4 0.4 0.4 0.4 0.4 0.4
Hotels & Restaurants 4.6 4.8 5.0 5.5 6.0 5.8 5.7 6.0 5.7 5.8 6.0
Hotels & Restaurants 3.6 3.9 4.0 4.6 5.0 4.8 4.7 5.0 4.6 4.8 4.9
Informal Sector 0.9 0.9 0.9 0.9 0.9 0.9 1.0 1.0 1.1 1.1 1.1
Transport & Communication 13.3 14.0 14.3 13.4 14.2 13.3 13.6 14.1 13.9 14.0 14.0
Transport 9.3 9.9 10.1 9.8 10.6 10.0 10.3 10.8 10.7 10.6 10.6
Land Transport 1.4 1.4 1.4 1.4 1.4 1.4 1.5 1.5 1.6 1.6 1.6
Water Transport 1.1 1.2 1.3 1.2 1.4 1.3 1.4 1.4 1.5 1.5 1.5
Air Transport 2.0 2.4 2.6 2.7 2.6 2.6 2.7 2.9 2.6 2.6 2.6
Services allied to Transport 4.0 4.2 4.1 3.8 4.4 3.9 3.9 4.0 4.1 4.1 4.0
Informal Sector 0.8 0.8 0.8 0.8 0.8 0.8 0.9 0.9 0.9 0.9 0.9
Communication 4.0 4.1 4.2 3.5 3.6 3.3 3.3 3.4 3.2 3.3 3.4
Finance,Insurance,Real Estate &
Business Services 13.9 13.2 11.6 11.4 12.5 13.9 14.6 14.8 14.9 14.8 14.8
Finance 4.1 3.7 2.8 2.9 3.5 4.2 4.2 4.1 3.9 3.8 3.7
Monatary Institution 3.1 2.8 2.4 2.2 2.7 3.1 3.1 3.5 3.3 3.1 3.1
Private Sector 2.0 2.1 1.8 1.6 2.0 2.6 2.4 2.6 2.8 2.7 2.7
Public Sector 1.2 0.8 0.6 0.6 0.7 0.5 0.8 0.9 0.5 0.4 0.3
Other Financial Institution 1.0 0.8 0.4 0.6 0.8 1.2 1.1 0.6 0.6 0.6 0.6
Private Sector 0.1 0.1 0.1 0.1 0.1 0.6 0.6 0.1 0.1 0.2 0.2
Public Sector 0.8 0.7 0.3 0.6 0.7 0.6 0.5 0.5 0.5 0.5 0.5
Insurance 3.4 3.6 2.7 2.6 2.7 2.6 2.8 2.8 2.9 2.9 3.0
Private Sector 1.6 1.6 1.7 1.7 1.8 1.7 1.7 1.7 1.8 1.8 1.8
Public Sector 1.8 2.0 0.9 0.9 1.0 1.0 1.1 1.1 1.2 1.2 1.2
Real Estate & Business Services 6.4 6.0 6.0 5.9 6.2 7.0 7.7 7.9 8.0 8.1 8.2
Formal Sector 1.9 1.6 1.7 1.7 2.1 3.0 3.4 3.5 3.6 3.8 3.9
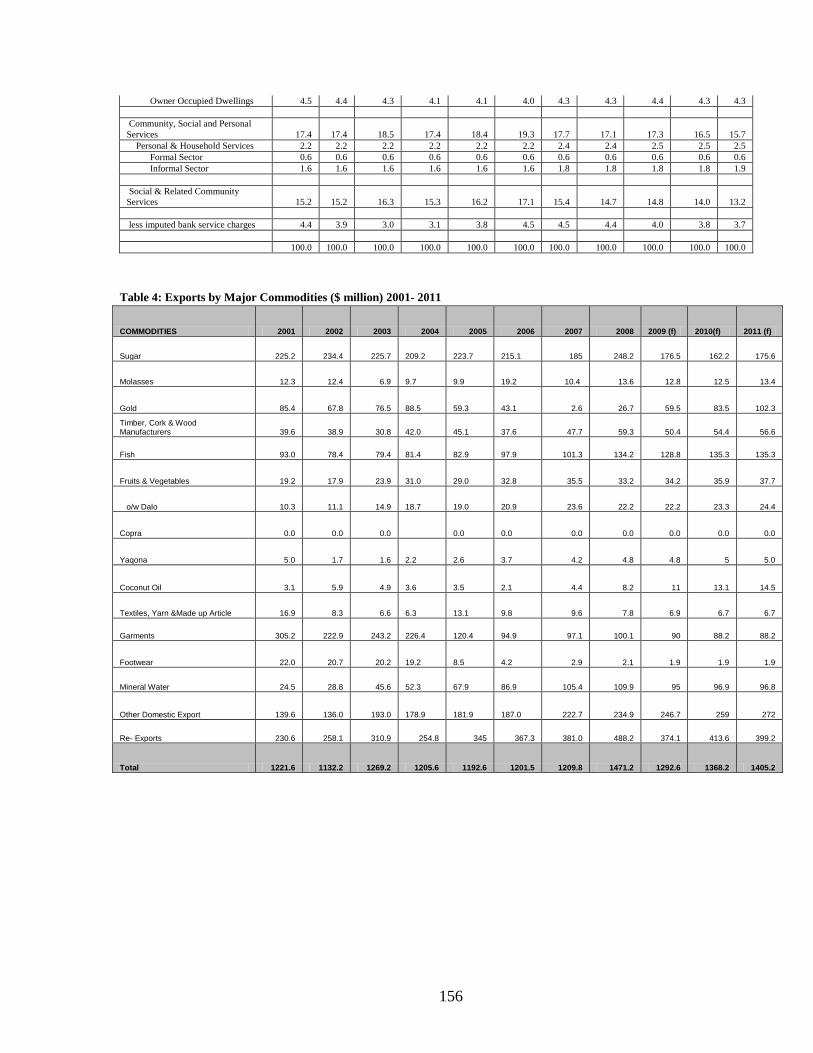
156
Owner Occupied Dwellings 4.5 4.4 4.3 4.1 4.1 4.0 4.3 4.3 4.4 4.3 4.3
Community, Social and Personal
Services 17.4 17.4 18.5 17.4 18.4 19.3 17.7 17.1 17.3 16.5 15.7
Personal & Household Services 2.2 2.2 2.2 2.2 2.2 2.2 2.4 2.4 2.5 2.5 2.5
Formal Sector 0.6 0.6 0.6 0.6 0.6 0.6 0.6 0.6 0.6 0.6 0.6
Informal Sector 1.6 1.6 1.6 1.6 1.6 1.6 1.8 1.8 1.8 1.8 1.9
Social & Related Community
Services 15.2 15.2 16.3 15.3 16.2 17.1 15.4 14.7 14.8 14.0 13.2
less imputed bank service charges 4.4 3.9 3.0 3.1 3.8 4.5 4.5 4.4 4.0 3.8 3.7
100.0 100.0 100.0 100.0 100.0 100.0 100.0 100.0 100.0 100.0 100.0
Table 4: Exports by Major Commodities ($ million) 2001- 2011
COMMODITIES 2001 2002 2003 2004 2005 2006 2007 2008 2009 (f) 2010(f) 2011 (f)
Sugar 225.2 234.4 225.7 209.2
223.7
215.1 185 248.2 176.5 162.2 175.6
Molasses 12.3 12.4 6.9 9.7
9.9
19.2 10.4 13.6 12.8 12.5 13.4
Gold 85.4 67.8 76.5 88.5
59.3
43.1 2.6 26.7 59.5 83.5 102.3
Timber, Cork & Wood Manufacturers 39.6 38.9 30.8
42.0
45.1
37.6 47.7 59.3 50.4 54.4 56.6
Fish 93.0 78.4 79.4 81.4
82.9
97.9 101.3 134.2 128.8 135.3 135.3
Fruits & Vegetables 19.2 17.9 23.9 31.0
29.0
32.8 35.5 33.2 34.2 35.9 37.7
o/w Dalo 10.3 11.1 14.9 18.7
19.0
20.9 23.6 22.2 22.2 23.3 24.4
Copra 0.0 0.0 0.0 0.0
0.0 0.0 0.0 0.0 0.0 0.0
Yaqona 5.0 1.7 1.6 2.2
2.6
3.7 4.2 4.8 4.8 5 5.0
Coconut Oil 3.1 5.9 4.9 3.6
3.5
2.1 4.4 8.2 11 13.1 14.5
Textiles, Yarn &Made up Article 16.9 8.3 6.6 6.3
13.1
9.8 9.6 7.8 6.9 6.7 6.7
Garments 305.2 222.9 243.2 226.4
120.4
94.9 97.1 100.1 90 88.2 88.2
Footwear 22.0 20.7 20.2 19.2
8.5
4.2 2.9 2.1 1.9 1.9 1.9
Mineral Water 24.5 28.8 45.6 52.3
67.9
86.9 105.4 109.9 95 96.9 96.8
Other Domestic Export 139.6 136.0 193.0 178.9
181.9
187.0 222.7 234.9 246.7 259 272
Re- Exports 230.6 258.1 310.9 254.8 345 367.3 381.0 488.2 374.1 413.6 399.2
Total 1221.6 1132.2 1269.2 1205.6 1192.6 1201.5 1209.8 1471.2 1292.6 1368.2 1405.2

157
Table 5: Exports by Major Commodities - Growth Rates (%) 2001-2011
COMMODITIES 2001 2002 2003 2004 2005 2006 2007 2008 2009 (f) 2010(f) 2011 (f)
Sugar -5.0 4.1 -3.7 -7.3 6.9 -3.8 -14 34.2 -28.9 -8.1 8.2
Molasses 29.1 0.4 -44.2 39.5 2.8 93.5 -45.7 30.5 -5.7 -2.3 7.1
Gold 22.4 -20.5 12.7 15.7 -32.9 -27.3 -94 927.8 122.7 40.4 22.5
Timber, Cork & Wood Manufacturers -8.9 -1.7 -20.7 36.3 7.2 -16.6 26.9 24.3 15.0 8.0 4.0
Fish 7.8 -15.7 1.3 2.6 1.8 3.4 15.1 32.4 -4.0 5.0 0.0
Fruits & Vegetables 0.4 -7.7 33.6 30.1 -6.7 13.2 8.3 -6.6 3.0 5.0 5.0
o/w Dalo -16.6 7.6 35.2 25.1 1.7 10.1 12.7 -6 0.0 5.0 5.0
Copra 0 0
Yaqona -13.1 -65.3 -9.4 40.8 15.8 43.9 14.3 13.1 0.0 5.0 1.0
Coconut Oil -32.1 140.6 -16 -27.6 -2.2 -38.6 105.8 85.7 34.0 19.8 10.7
Textiles, Yarn &Made up Article -45 -50.6 -21 -4.8 107.9 -22.9 -4.7 -19.3 -11.4 -2.0 0.0
Garments -5.3 -27 9.1 -6.9 -46.8 -21.1 2.3 3.1 -10.2 -2.0 0.0
Footwear -6.3 -5.9 -2.6 -4.6 -55.7 -51.3 -30.2 -28 -7.4 -2.0 0.0
Mineral Water 146.9 17.4 58.4 14.7 29.7 28 21.3 4.3 -13.8 2.0 2.0
Other Domestic Export 3.5 -2.6 42 -7.3 1.7 2.6 19.3 5.5 5.0 5.0 5.0
Re- Exports 45.2 11.9 20.5 -18 35.4 6.5 3.7 28.1 -23.4 10.5 -3.5
Total 5.8 -7.3 12.1 -5 -1.1 0.8 0.7 21.6 -12.1 5.9 2.8
Table 6: Imports By Major Commodities ($million), 2001 - 2011
ECONOMIC CATEGORY 2001 2002 2003 2004 2005 2006 2007 2008 2009 (F) 2010 (F) 2011(f)
Food 313.1 314.8 335.2 351.6 355.5 386.0 394.3 520 502.1 536.2 527.1
Beverage & Tobacco 14.8 16.3 17.5 20.4 21.7 22.7 21.6 21.7 21.8 21.8 21.8
Crude Materials 13.7 13.8 16.3 20.2 21.7 32.1 24.5 31 29.4 30.3 31.2
Mineral Fuels 443.5 435.4 463.0 587.0 784.0 1021.5 958.2 1222.1 930.5 1023.6 1074.6
Oil & Fats 16.1 15.4 20.9 15.8 18.1 17.5 24.8 37.0 26.0 27.3 28.7
Chemicals 144.8 147.5 162.8 196.5 206.2 224.1 218.5 274.5 262.1 269.9 278
Manufactured Goods 423.1 384.9 445.5 486.2 452.2 464.1 422.5 460.8 439.5 440.6 447.3
Machinery & Transport Equipment 420.5 429.1 579.4 559.1 591.1 688 568.8 726.5 679 726.6 725.7
Miscellaneous Manufactured Goods 217.9 206.2 236.7 253.5 264 258.3 246 278.6 269.9 274.8 281.7
Other Commodities 9.5 6.6 7.4 11.3 8.3 10 10.9 29.2 11.7 11.8 11.9
Total 2017.0 1790.0 2284.7 2501.6 2722.8 3124.3 2890.1 3601.4 3172.1 3362.8 3428.3

158
Table 7: Imports by Major Comodities- Growth Rates(%) 2001-2011
Table 9: Real GDP Growth Rates, Foreign Reserves, Interest Rates, and Government Revenue, Expenditures and Debt
2001 2002 2003 2004 2005 2006 2007 2008 2009 2010 2011
Real GDP Growth % 1.9 3.2 0.9 5.5 0.6 3.4 -6.6 0.2 -0.7 2.0 1.6
Inflation % 4.3 0.8 4.2 3.3 2.7 3.1 4.3 6.6 9.5 2 2.5
Reserves: months of cover 846.0 902 .1 943.6 786.2 549.1 515.4 804.6 558.7 720.0(July)
- goods & services
- goods
Interest Rates %
- Lending Rate 8.19 7.89 7.39 7.03 6.63 7.9 8.46 7.72 7.96 (June)
- Savings Deposit Rate 0.78 0.57 0.45 0.36 0.40 0.84 0.64 0.64 0.76 (June)
- Time Deposit Rate 2.43 2.17 1.70 1.77 2.03 9.05 4.45 3.00 4.94(June)
- RBF Note Rate 1.25 1.25 1.19 1.75 2.25 4.25 4.25 - -
- Minimum Lending Rate 1.75 1.75 1.75 2.25 2.75 5.25 9.25 6.00 3.00(June)
Revenue % of GDP 25.0 25.0 25.0 24.0 25.0 25.0 27.0 24.4 25.5 25.4 25.8
Expenditure % of GDP 30.0 31.0 30.0 28.0 29.0 38.0 29.027.7 25.9 28.7 24.7 23.2
Operating/Capital Ratio 81/19 79/21 80/20 83/17 83/17 85/15 86/14 82/18 80/20 86/14 87/13
Net budget deficit %(actual) -6.0 -6.0 -6.0 -3.0 -3.0 -3.0 -2.0 -2.0
Net deficit % (planned) 5.0 -6.0 -4.0 -3.0 -3.0 -4.0 -2.0 -2.0 - 3.0 - 2.0 -1.0
Debt as a % of GDP 45.0 47.0 49.0 48.0 49.0 52.2 50.3 47.9 48 47 46
ECONOMIC CATEGORY 2001 2002 2003 2004 2005 2006 2007 2008 2009 (F) 2010 (F) 2011(f)
Food 39.1 0.5 6.5 4.9 1.1 8.6 2.2 31.9 -3.4 6.8 -1.7
Beverage & Tobacco 42.3 10.1 7.4 16.6 6.5 4.4 -4.8 0.5 0.5 0.0 0.0
Crude Materials -13.8 0.7 18.1 23.9 7.3 48.1 -23.7 26.5 -5.3 3.0 3.0
Mineral Fuels 33.4 -1.8 6.3 26.8 33.6 30.3 -6.2 27.5 -23.9 10.0 5.0
Oil & Fats 15.8 -4.3 35.7 -24.4 14.7 -3.5 41.7 49.2 -29.7 5.0 5.0
Chemicals 23 1.9 10.4 20.7 4.9 8.7 -2.5 25.6 -4.5 3.0 3.0
Manufactured Goods -14 -9 15.7 9.1 -7 2.6 -9 9.1 -4.6 0.3 1.5
Machinery & Transport Equipment 15.7 2 35 -3.5 5.7 16.4 -17.3 27.7 -6.5 7.0 -0.1
Miscellaneous Manufactured Goods -10.8 -5.4 14.8 7.1 4.1 -2.1 -4.8 13.3 -3.1 1.7 2.6
Other Commodities 35.7 -30.5 12.1 52.7 -26.5 20.5 9.0 167.9 -60 1.0 1.0
Total 10.7 -2.3 16 9.5 8.8 14.7 -7.5 24.6 -11.9 6.0 1.9

159
Table 10: Actual and Budgeted Expenditure (VAT inclusive), 2001-2011
Year Budget ($000) Revised ($000) Actual ($000)
2001 1,096,847.50 1,134,051.00 1,132,872.2
2002 1,255,497.20 1,273,251.00 1,260,961.7
2003 1,294,995.50 1,325,166.10 1,322,211.1
2004 1,313,300.40 1,364,178.00 1,322,568.2
2005 1,424,484.20 1,434,526.20 1,390,436.2
2006 1,548,662.90 1,548,662.90 1,558,510.0
2007 1,710,842.60 1,572,369.90 1,504,071.7
2008 1,527,907.00 1,527,907.00
2009 1,715,225.40
2010 1,548,612.60
2011 1,523,731.60
Table 11: Government Expenditure on Key Priorities, 2001-2011
Infrastructure Health Education
Year $M % of Total $M % of Total $M % of Total
2001 147.01 13% 107.9 10% 203.25 18%
2002 196.09 16% 124.2 10% 224.13 18%
2003 198.41 15% 129.86 10% 243.33 18%
2004 185.24 14% 125.84 10% 267.85 20%
2005 183.66 13% 126.59 9% 279.49 19%
2006 209.28 14% 131.31 9% 277.36 18%
2007 185.35 12% 174.71 12% 311.82 21%
2008 244.08 166.55 304.94
2009 301.73 179.51 278.41
2010 205.09 179.70 279.17
2011 201.43 179.01 279.17
Table 12: Direct and Indirect Tax Concessions, 2001-
2011 2002 2003 2004 2005 2006 2007 2008
Total Direct Tax Concession 93.1 33.6 36.1 54.4 61.7 27.3 28.4
Total Indirect Tax Concession 92 133.4 110.7 112.8 110 96.2 153.4
Total Concessions 185.1 167 146.8 167.2 171.7 123.5 181.8
Total Concessions as % of GDP 4.6 3.8 3.1 3.4 3.1 2.3 3.1
GDP at Market Price ($M) 4026.4 4382.7 4719.5 4969.7 5455.7 5263.6 5895.9

160
Table 13: Gross Domestic Product at Constant 1995 Prices, 2001-2011
GDP at Constant prices, 2001-2011
Year GDP @ constant 1995 prices ($000) Growth Rates%
2001 2,688,595 1.9
2002 2,774,544 3.2
2003 2,800,111 0.9
2004 2,953,223 5.5
2005 2,971,624 0.6
2006 3,072,959 3.4
2007 2,871,047 -6.6
2008 2,877,904 0.2
2009 2,869,689 -0.3
2010 2,922,254 1.8
2011 2,967,626 1.6
Table 14 Gross Domestic Product at Current Factor Cost, 2001-2011
GDP at Current Factor Cost, 2001-2011
Year GDP -@current factor cost($000) Growth Rates%
2001 3293817 5.0
2002 3480687 5.7
2003 3688992 6.0
2004 3982232 7.9
2005 4212025 5.8
2006 4629140 9.9
2007 4555356 -1.6
2008 4940874 8.5
2009 5011089 1.4
2010 5258062 4.9
2011 5501138 4.6
Table 15 Gross Domestic Product at Current Prices, 2001-2011
GDP at Current market prices , 2001-2011
Year GDP- market price ($000) Growth rates %
2001 3777204 5.4
2002 4026442 6.6
2003 4382661 8.8
2004 4719513 7.7
2005 4969692 5.3
2006 5455711 9.8
2007 5263607 -3.5
2008 5895945 8.5
2009 5979733 1.4
2010 6274445 4.9
2011 6564508 4.6

161
Appendix 2 Millennium Development Goals (MDGs) Goals and Targets*
(from the Millennium Declaration) Indicators for monitoring progress**
Goal 1: Eradicate extreme poverty and hunger
Target 1: Halve, between 1990 and 2015, the proportion of people whose income is less than one dollar a day
1. Proportion of population below $1 (PPP) per day11
2. Poverty gap ratio 3. Share of poorest quintile in national consumption
Achieve full and productive employment and decent work for all, including women and young people
Growth rate of GDP per person employed Employment-to-population ratio Proportion of employed people living below $1 (PPP) per day Proportion of own account and contributing family workers in total employment
Target 2: Halve, between 1990 and 2015, the proportion of people who suffer from hunger
4. Prevalence of underweight children under-five years of age 5. Proportion of population below minimum level of dietary energy
consumption Goal 2: Achieve universal primary education
Target 3: Ensure that, by 2015, children everywhere, boys and girls alike, will be able to complete a full course of primary schooling
6. Net enrolment ratio in primary education 7. Proportion of pupils starting grade 1 who reach last grade of
primary** 8. Literacy rate of 15-24 year-olds, women and men**
Goal 3: Promote gender equality and empower women
Target 4: Eliminate gender disparity in primary and secondary education, preferably by 2005, and in all levels of education no later than 2015
9. Ratios of girls to boys in primary, secondary and tertiary
education
10. (dropped)12
11. Share of women in wage employment in the non-agricultural
sector 12. Proportion of seats held by women in national parliament
Goal 4: Reduce child mortality
Target 5: Reduce by two-thirds, between 1990 and 2015, the under-five mortality rate
13. Under-five mortality rate 14. Infant mortality rate 15. Proportion of 1 year-old children immunised against measles
Goal 5: Improve maternal health
Target 6: Reduce by three-quarters, between 1990 and 2015, the maternal mortality ratio
16. Maternal mortality ratio 17. Proportion of births attended by skilled health personnel 19c. Contraceptive prevalence rate13
Achieve, by 2015, universal access to reproductive health
Adolescent birth rate Antenatal care coverage (at least one visit and at least four visits) Unmet need for family planning
Goal 6: Combat HIV/AIDS, malaria and other diseases
Target 7: Have halted by 2015 and begun to reverse the spread of HIV/AIDS
18. HIV prevalence among population aged 15-24 years
19a. Condom use at last high-risk sex
19b. Proportion of population aged 15-24 years with comprehensive
correct knowledge of HIV/AIDS
20. Ratio of school attendance of orphans to school attendance of
non-orphans aged 10-14 years
11 For monitoring country poverty trends, indicators based on national poverty lines should be used, where available.
12 Previously: “Ratio of literate women to men, 15-24 years old”.
13 Moved from Goal 6.

162
Goals and Targets*
(from the Millennium Declaration) Indicators for monitoring progress**
Achieve, by 2010, universal access to treatment for HIV/AIDS for all those who need it
Proportion of population with advanced HIV infection with access to antiretroviral drugs
Target 8: Have halted by 2015 and begun to reverse the incidence of malaria and other major diseases
21. Incidence** and death rates associated with malaria
22. Proportion of children under 5 sleeping under insecticide-treated
bednets and Proportion of children under 5 with fever who are
treated with appropriate anti-malarial drugs**
23. Incidence**, prevalence and death rates associated with
tuberculosis
24. Proportion of tuberculosis cases detected and cured under
directly observed treatment short course
Goal 7: Ensure environmental sustainability
Target 9: Integrate the principles of sustainable development into country policies and programmes and reverse the loss of environmental resources
25. Proportion of land area covered by forest
27. (dropped)14
28. CO2 emissions, total, per capita and per $1 GDP (PPP), and
consumption of ozone-depleting substances** 29. (dropped)15
Proportion of fish stocks within safe biological limits
Proportion of total water resources used
Reduce biodiversity loss, achieving, by 2010, a significant reduction in the rate of loss
26. Proportion of terrestrial and marine areas protected**
Proportion of species threatened with extinction
Target 10: Halve, by 2015, the proportion of people without sustainable access to safe drinking water and basic sanitation
30. Proportion of population using an improved drinking water source**
31. Proportion of population using an improved sanitation facility** Target 11: By 2020, to have achieved a significant improvement in the lives of at least 100 million slum dwellers
32. Proportion of urban population living in slums16**
Goal 8: Develop a global partnership for development
Target 12: Develop further an open, rule-based, predictable, non-discriminatory trading and financial system Includes a commitment to good governance, development and poverty reduction – both nationally and internationally Target 13: Address the special needs of the least developed countries Includes: tariff and quota free access for the least developed countries' exports; enhanced programme of debt relief for heavily indebted poor countries (HIPC) and cancellation of official bilateral debt; and more generous ODA for countries committed to poverty reduction Target 14: Address the special needs of landlocked developing
Some of the indicators listed below are monitored separately for the least developed countries (LDCs), Africa, landlocked developing countries and small island developing States.
Official development assistance (ODA) 33. Net ODA, total and to the least developed countries, as
percentage of OECD/DAC donors’ gross national income 34. Proportion of total bilateral, sector-allocable ODA of OECD/DAC
donors to basic social services (basic education, primary health care, nutrition, safe water and sanitation)
35. Proportion of bilateral official development assistance of OECD/DAC donors that is untied
36. ODA received in landlocked developing countries as a proportion of their gross national incomes
37. ODA received in small island developing States as a proportion of their gross national incomes
Market access
14 Previously: “Energy use (kg oil equivalent) per $1 GDP (PPP)”.
15 Previously: “Proportion of population using solid fuels”.
16 The actual proportion of people living in slums is measured by a proxy, represented by the urban population living in households with at least one of the four characteristics: (a) lack of access to improved water supply; (b) lack of access to improved sanitation; (c) overcrowding (3 or more persons per room); and (d) dwellings made of non-durable material.

163
Goals and Targets*
(from the Millennium Declaration) Indicators for monitoring progress**
countries and small island developing States (through the Programme of Action for the Sustainable Development of Small Island Developing States and the outcome of the twenty-second special session of the General Assembly) Target 15: Deal comprehensively with the debt problems of developing countries through national and international measures in order to make debt sustainable in the long term
38. Proportion of total developed country imports (by value and excluding arms) from developing countries and least developed countries, admitted free of duty
39. Average tariffs imposed by developed countries on agricultural products and textiles and clothing from developing countries
40. Agricultural support estimate for OECD countries as a percentage of their gross domestic product
41. Proportion of ODA provided to help build trade capacity Debt sustainability 42. Total number of countries that have reached their HIPC
decision points and number that have reached their HIPC completion points (cumulative)
43. Debt relief committed under HIPC and MDRI** Initiatives 44. Debt service as a percentage of exports of goods and services
Target 16: replaced by new target in Goal 1 45. (Replaced by new indicators in Goal 1)17
Target 17: In cooperation with pharmaceutical companies, provide access to affordable essential drugs in developing countries
46. Proportion of population with access to affordable essential drugs on a sustainable basis
arget 18: In cooperation with the private sector, make available the benefits of new technologies, especially information and communications
47a. Telephone lines per 100 population ** 47b. Cellular subscribers per 100 population** 48. Internet users per 100 population**
* The numbering of the targets and indicators will be undertaken through the inter-agency process of the Inter-agency and Expert Group on MDG Indicators. ** The language has been modified for technical reasons, so that the data can be more clearly reflected.
17 Previously: “Unemployment rate of young people aged 15-24 years, each sex and total”.
Top Related