


Languages
Pages
Legal

REPUBLIC OF TURKEY
PRE-ACCESSION
ECONOMIC PROGRAMME
2012 - 2014
ANKARA
December 2011

The Pre-Accession Economic Programme (2012-2014) has been adopted by High Planning Council
Decision No. 2011/40

i
CONTENTS
1. POLICY FRAMEWORK AND OBJECTIVES ........................................................................................ 1
2. MACROECONOMIC OUTLOOK ............................................................................................................ 3 2.1. Recent Economic Developments ........................................................................................................... 5
2.1.1. Real Sector ...................................................................................................................................... 5
2.1.2. Inflation, Monetary and Exchange Rate Policies .......................................................................... 10
2.1.3. Financial Sector ............................................................................................................................ 14
2.1.4. Balance of Payments ..................................................................................................................... 15
2.2. Medium Term Macroeconomic Scenario ............................................................................................ 19
2.2.1. Real Sector .................................................................................................................................... 19
2.2.2. Inflation, Monetary and Exchange Rate Policies .......................................................................... 27
2.2.3. Balance of Payments ..................................................................................................................... 28
2.2.4. Main Risks in Projections ............................................................................................................. 31
3. PUBLIC FINANCE.................................................................................................................................... 33 3.1. General Government Balance and Public Debt ................................................................................... 33
3.1.1. Fiscal Policy Strategy and Medium Term Objectives ................................................................... 34
3.1.2. Current Situation and Medium Term Perspective ......................................................................... 36
3.1.3. Structural and Cyclical General Government Balance ................................................................. 42
3.1.4. Public Debt Management .............................................................................................................. 48
3.1.5. Budgetary Implications of Major Structural Reforms .................................................................. 54
3.2. Sensitivity Analysis ............................................................................................................................. 55
3.3. Public Finance Risks ........................................................................................................................... 56
3.4. Quality of Public Finance .................................................................................................................... 56
3.5. Institutional Features of Public Finance .............................................................................................. 58
3.5.1. Law on Court of Accounts ............................................................................................................ 58
3.5.2. Public Financial Management and Control Law ........................................................................... 58
4. STRUCTURAL REFORMS ..................................................................................................................... 61 4.1. Enterprise Sector .................................................................................................................................. 61
4.1.1. Privatization .................................................................................................................................. 61
4.1.2. Competition Law and Policies ...................................................................................................... 62
4.1.3. Improvement of the Investment Environment .............................................................................. 62
4.1.4. Utilities and Network Industries ................................................................................................... 63
4.2. Financial Sector ................................................................................................................................... 65
4.2.1. Banking Sector.............................................................................................................................. 65
4.2.2. Capital Market .............................................................................................................................. 67
4.2.3. Insurance Sector ............................................................................................................................ 70
4.3. Labor Market ....................................................................................................................................... 70
4.4. Agriculture Sector ................................................................................................................................ 76
4.4.1. Agriculture .................................................................................................................................... 76
4.4.2. Rural Development ....................................................................................................................... 79
4.5. Administrative Reform ........................................................................................................................ 80
4.5.1. Strategic Planning and Performance Based Budgeting ................................................................. 80
4.5.2. Economic and Social Council ....................................................................................................... 81
4.6. Other Reform Areas ............................................................................................................................. 81
4.6.1. Regional Development ................................................................................................................. 81
4.6.2. Health and Social Security Reform ............................................................................................... 84
4.6.3. R&D and Innovation ..................................................................................................................... 86
4.6.4. Information and Communication Technologies............................................................................ 87
4.6.5. Transportation ............................................................................................................................... 88
4.6.6. Energy ........................................................................................................................................... 90
ANNEX TABLES ........................................................................................................................................... 95

ii
TABLES
Table 2.1: Growth Rates and Demand Components .......................................................................................... 6 Table 2.2: Labor Market Developments ............................................................................................................. 9 Table 2.3: Banking Sector Overview ............................................................................................................... 15 Table 2.4: Balance of Payments ....................................................................................................................... 16 Table 2.5: Foreign Trade by Broad Economic Categories Classification ........................................................ 17 Table 2.6: Foreign Trade by Country Groups .................................................................................................. 18 Table 2.7: Demand Components of Growth ..................................................................................................... 20 Table 2.8: Investment-Savings Balance ........................................................................................................... 23 Table 2.9: Value-Added by Sectors ................................................................................................................. 24 Table 2.10: Increases in Production Factors ..................................................................................................... 25 Table 2.11: Contribution to Growth by Factors of Production ......................................................................... 25 Table 2.12: Developments in the Labor Market ............................................................................................... 27 Table 2.13: Balance of Payments Forecasts ..................................................................................................... 31
Table 3.1: Central Government Budget Balance .............................................................................................. 37 Table 3.2: General Government Revenues and Expenditures - 1 ..................................................................... 40 Table 3.3: General Government Revenues and Expenditures - 2 ..................................................................... 41 Tablo 3.4: General Government Balance Analysis .......................................................................................... 43 Table 3.5: EU Defined General Government Nominal Debt Stock ................................................................. 49 Table 3.6: Central Government Gross Debt Stock ........................................................................................... 49 Table 3.7: Central Government Debt Stock Composition by Instruments ....................................................... 50 Table 3.8: Central Government Domestic Debt Stock by Lenders .................................................................. 51 Table 3.9: Maturity Composition of Central Government Domestic Debt Stock ............................................ 51 Table 3.10: Time Remaining to Maturity of the Central Government External Debt Stock ............................ 51 Table 3.11: Projection of Treasury-Guaranteed Foreign Debt Service ............................................................ 53 Table 3.12: Projections of General Government Debt Stock ........................................................................... 54
Table 4.1: Privatization Transactions Completed in 2011................................................................................ 61 Table 4.2: Standard Reference Interconnection Charge Tariffs (Taxes Excluded) .......................................... 64 Table 4.3: Wholesale Line Rental Charge Tariffs (Taxes Excluded) ............................................................... 64 Table 4.4: Local Loop Access Charge Tariffs .................................................................................................. 65 Table 4.5: Basic Employment and Labor Indicators ........................................................................................ 71 Table 4.6: Employment Share by Sector .......................................................................................................... 72 Table 4.7: Trends in Gross Schooling Rates .................................................................................................... 72 Table 4.8: Education Level of the Labor Force in 2010 ................................................................................... 73 Table 4.9: Active Labor Force Programs Provided by İŞKUR ........................................................................ 73 Table 4.10: Matrix of Policy Commitments: Labor Market ............................................................................. 76 Table 4.11: Matrix of Policy Commitments: Agriculture-I (Main Developments in Agriculture Support) ......... 78 Table 4.12: Matrix of Policy Commitments: Agriculture - II (Important Projects in Agriculture) .................. 79 Tablo 4.13: Information on Regional Development Agencies ......................................................................... 83 Table 4.14: Matrix of Policy Commitments: Regional Development .............................................................. 84 Table 4.15: Matrix of Policy Commitments: Health Care-Social Security ...................................................... 86 Table 4.16: Matrix of Policy Commitments: Transportation ........................................................................... 90 Table 4.17: Legal Regulations Realized in Energy Market in 2011 ................................................................. 92 Table 4.18: Matrix of Policy Commitments: Energy ....................................................................................... 93
iii
FIGURES Figure 2.1: GDP Developments ......................................................................................................................... 6 Figure 2.2: Industrial Production Index and Capacity Utilization Rate ............................................................. 7 Figure 2.3: Seasonally Adjusted Unemployment Rate and Labor Force Participation Rate .............................. 8 Figure 2.4: Agricultural and Non-Agricultural Employment ............................................................................. 9 Figure 2.5: Industry and Services Employment ................................................................................................. 9 Figure 2.6: CPI Targets and Realizations ......................................................................................................... 10 Figure 2.7: CPI and Core CPI .......................................................................................................................... 10 Figure 2.8: Developments in Exports and Export Prices .................................................................................. 17 Figure 2.9: GDP Growth .................................................................................................................................. 21 Figure 2.10: Contributions to GDP Growth ..................................................................................................... 21 Figure 2.11: Production by Sectors .................................................................................................................. 23 Figure 2.12: Output Gap ................................................................................................................................... 26
Figure 3.1: General Government Balance ........................................................................................................ 44 Figure 3.2: Primary General Government Balance .......................................................................................... 45 Figure 3.3: Cyclical General Government Balance .......................................................................................... 45 Figure 3.4: Average Maturity and Cost of Treasury’s Borrowing ................................................................... 52 Figure 3.5: Sustainability Scenarios ................................................................................................................. 55

iv
BOXES
Box 2.1: Export Oriented Production and Input Supply Strategy .................................................................... 29
Box 3.1: Adjustments in General Government Balance in the Context of Fiscal Notification ........................ 33 Box 3.2: Structural and Cyclical General Government Balance Calculation Methodology............................. 46

v
ABBREVIATIONS
BASEL-II International Recommendations on Banking Laws and Regulations Issued by Basel
Committee on Banking Supervision
BOT Build-Operate-Transfer
BOTAŞ Petroleum Pipeline Corporation
BRSA Banking Regulation and Supervision Agency
CBRT Central Bank of the Republic of Turkey
CMB Capital Markets Board
COMCEC Standing Committee for Economic and Commercial Cooperation of the Organization of
Islamic Cooperation
CPI Consumer Price Index
ÇATAK Environmentally Based Agricultural Land Protection
DIS Direct Income Support
ECOFIN Economic and Financial Affairs Council
EDAŞ Electricity Distribution Company
EFSF European Financial Stability Fund
EMRA Energy Market Regulatory Agency
ENTSO-E European Network of Transmission System Operators for Electricity
ESA European System of Accounts
EU European Union
EU-27 The EU Member Countries After Enlargement on 1 January 2007
EÜAŞ Turkish Electricity Production Company Inc.
GAP Southeastern Anatolian Project
GDBI Government Domestic Borrowing Instrument
GDP Gross Domestic Product
GSM Global System for Mobile Communications
HPC High Planning Council
ILO International Labor Organization
IMF International Monetary Fund
IPA Instrument for Pre-Accession Assistance
IPARD IPA Rural Development Funds
ISE İstanbul Stock Exchange
IT Information Technology
ITCA Information Technologies and Communications Authority
İŞKUR Turkish Employment Organization
KASDEP Social Support Project in Rural Areas
KKYDP Rural Development Investments Support Programme
KOSGEB Small and Medium Industry Development Organization
KÖY-DES Project for Supporting Infrastructure of Villages
LNG Liquefied Natural Gas
MENA Middle East and North Africa
MERSİS Central Registry System For Legal Persons Project
MoU Memorandum of Understanding
MTP Medium Term Programme
NPP Nuclear Power Plant
OECD Organization for Economic Co-operation and Development
PCMS Province Coordination and Monitoring System
PEP Pre-Accession Economic Programme
PMC Portfolio Management Companies
PPI Producer Price Index
R&D Research and Development
SCT Special Consumption Tax
SDIF Savings Deposit Insurance Fund
vi
SDR Special Drawing Right
SEEs State Economic Enterprises
SMEs Small and Medium Sized Enterprises
SODES Social Support Program
SPO State Planning Organization
SSI Social Security Institution
TAEA Turkish Atomic Energy Authority
TAKBİS Land Registry and Cadastre Information System
TGNA Turkish Grand National Assembly
TCDD Turkish State Railways
TDZ Technology Development Zones
TEDAŞ Turkish Electricity Distribution Company
TEİAŞ Turkish Electricity Transmission Company
TFP Total Factor Productivity
TL Turkish Lira
TOBB Union of Chambers and Commodity Exchanges of Turkey
TURKSTAT Turkish Statistical Institute
TÜBİTAK Scientific and Technological Research Council of Turkey
UCTE Union for the Coordination of Transmission of Electricity
UKKS National Rural Development Strategy
VEDOP Tax Office Full Automation Project
YOİKK Coordination Council for the Improvement for the Investment Environment

Policy Framework and Objectives
1
1. POLICY FRAMEWORK AND OBJECTIVES
Turkey, as an acceding country for European Union (EU) membership, has prepared the Pre-
Accession Economic Programme (PEP) and has submitted to the European Commission since 2001,
responding to the request of the Economic and Financial Affairs Council (ECOFIN Council) dated
26/27 November 2000. The PEP (2012-2014) has been prepared under the coordination of Ministry
of Development (State Planning Organization) with the contributions of relevant ministries and
institutions, and adopted by the decision of the High Planning Council (HPC)1 No. 2011/40.
Pre-Accession Economic Programme is prepared within the scope of the Ninth Development
Plan (2007-2013), based on Medium Term Programme (2012-2014) and 2012 Annual Programme.
Developments occurred in the short period between Medium Term Programme (MTP) publication
and PEP preparation are not evaluated as developments that will change the medium term trends.
Thereby, the framework of MTP for medium-term outlook and projections has been kept in PEP.
Economic performance of Turkey, one of the few countries which announced and
implemented an exit strategy out of the crisis, was noteworthy in the last one and a half year. Thanks
to the measures taken and policies implemented, Turkish economy was among the fastest growing
economies in 2010 and in the first half of 2011.
Turkish economy has decoupled significantly from the EU economies in terms of public
deficit and debt sustainability, in addition to the high growth performance and employment growth
in 2010 and 2011. While Turkish economy grew by 9 percent in 2010, it recorded 10.2 percent
growth rate in the first half of 2011. On the other hand, it is projected that Euro Area, which grew by
1.8 percent in 2010, will grow by low rates of 1.6 percent and 1.1 percent respectively in 2011 and
2012. After the crisis, while the employment losses that occurred in EU countries have not been
recovered yet and significant rises in unemployment rates have been experienced in some EU
countries like Spain, Ireland, Portugal and Greece, a rapid recovery was observed in employment in
Turkish economy. High rates of increase in employment were recorded by 6.2 percent in 2010 and
6.8 percent in first three quarters of 2011. With the measures implemented to mitigate effects of the
crisis, general government budget deficit to GDP ratio, which increased in 2009, began to decline as
of 2010 and was realized as 2.9 percent in 2010. Correspondingly, the ratio of general government
gross debt stock to GDP which displayed a decreasing trend since 2010, declined to 42.2 percent by
3.9 percentage points decrease in 2010 and it is projected to recede to 32 percent in 2014 with a
steady decrease in the following period. On the other hand, the general government budget deficit to
GDP ratio in Euro Area which reached 6 percent in 2010 due to deteriorated fiscal structure and
high level of debt stocks in EU countries especially Greece, Ireland and Italy, is estimated to decline
in the forthcoming period with the measures taken. However, the general government gross debt
stock to GDP ratio is projected to continue its increasing trend and reach 90 percent in 2012. These
facts imply that uncertainties regarding EU economies are continuing.
The 2011 Progress Report announced by the European Commission in October 2011
mentioned that Turkey has successfully carried out monetary and fiscal policy mix during crisis
period by referring to the exit strategy of the Turkish economy from the crisis. In the Report, it was
underlined that Turkey, though negatively affected by global financial crisis, caught up a strong
growth performance rapidly again as a consequence of supervisory and regulatory reforms which
were put into practice in previous periods. In parallel, it was expressed that strong economic
recovery was followed by significant increases in employment and substantial decreases in
unemployment rate. On the other hand, it was stated that strong domestic demand through raising
imports and current account deficit causes increasing vulnerabilities to external shocks.
The Pre-Accession Economic Programme (2012-2014) has been prepared in an environment
of rising uncertainties and risks in global economy, deteriorating confidence environment and in
which downside risks on growth has become more pronounced, especially concerns about
sustainability of rising public debt stocks in Euro area has been intensified and vulnerability and
uncertainties for the forthcoming period are still prevalent.
1 High Planning Council is composed of one Deputy Prime Minister and seven Ministers under the presidency of Prime Minister.

Policy Framework and Objectives
2
Turkish economy, with its increased resilience thanks to strong fiscal position and banking
sector, diverged rapidly from negative effects of global crisis and entered into a strong growth path
in consequence of timely and decisively implemented policies. In parallel with established
confidence in economy, growth was above expectations and was driven by private sector in 2010
and in the first half of 2011. A relative slowdown is expected in the second half of 2011 and in 2012
depending on global developments. GDP growth, which is anticipated to be 7.5 percent in 2011, is
expected to be 4 percent in 2012 and reach 5 percent during 2013-2014 period.
In the forthcoming period, maintaining growth in a sustainable structure is of utmost
importance. Within this framework, Pre-Accession Economic Programme (2012-2014) has been
prepared in line with Medium Term Programme (2012-2014), which has the main objectives of
increasing welfare, increasing employment, sustaining fiscal discipline, increasing domestic savings,
reducing current account deficit, and thereby strengthening macroeconomic stability in a stable
growth path.
The policies will focus on increasing the quality of labor force, labor market flexibility and
labor force participation rate besides the policies which will ensure stable growth environment
supporting job creation.
The fiscal policy in the PEP (2012-2014) period will be implemented with an approach that
will help to maintain macroeconomic stability, support a private sector-led growth and facilitate to
combat current account deficit by taking the income, expenditure and debt stock projections in the
Programme into account. In this period, fiscal discipline will be essential in fiscal policy
implementation. In this framework, general government gross debt stock to GDP ratio, which has
started to decline in 2010, is targeted to continue this declining trend throughout the program period.
Inflation targeting regime will be continued in the PEP (2012-2014) period in compliance
with the main objective of achieving price stability. The ultimate target is to decrease inflation rate
to levels complying with the Maastricht criteria. Effective liquidity management through interest
rate corridor and reserve requirements will be the policy instruments to contribute to financial
stability in the coming period.
The floating exchange rate regime will continue in the forthcoming period within its ongoing
framework. As in recent years, the Central Bank will have no target for exchange rate. When
unhealthy price formations are observed due to the possible loss of market depth, the Central Bank
may hold foreign exchange selling auctions, compatible with the spirit of the floating exchange rate
regime, and/or intervene directly. The Central Bank may also start to hold foreign exchange buying
auctions depending on global conditions and the developments in the foreign exchange market.
The recent crisis showed that Turkish economy enhanced its resilience owing to structural
reforms. However current global developments and uncertainties underlined the importance of
reforms in many countries including Turkey. Therefore decisively continuation of structural reforms
in Turkey is of utmost important in the forthcoming period. In this context, structural reforms will
be continued effectively in 2012-2014 period.
In the second chapter of the Pre-Accession Economic Programme (2012-2014), which
consists of four main chapters, recent economic developments in the Turkish economy are evaluated
by considering the developments in the world economy, and then the macroeconomic forecasts for
the 2012-2014 period are presented. In the third chapter, fiscal policies for the PEP (2012-2014)
period are put forward together with forecasts and analyses regarding budget and debt management.
In the fourth chapter, assessments on developments in structural reforms, budgetary impacts and
reform agenda are included.

Macroeconomic Outlook
3
2. MACROECONOMIC OUTLOOK
In the global economy last year has been a period in which economic and financial stability
could not be achieved, the concerns about the sustainability of increasing public debts and risks on
banking sector in developed countries have increased, uncertainties have continued, confidence
environment have deteriorated and downside risks on growth have increased. The world economy
grew by 5.1 percent in 2010 due to measures taken by countries to mitigate the effects of global
crisis and restore the lost confidence in markets. In 2010, while emerging and developing countries
grew by 7.3 percent with considerable contribution of China and India, developed countries
recorded 3.1 percent growth.
Decoupling between developed and developing countries became much more evident despite
the achieved economic recovery in global level in 2010. In the recent period, while developed
countries experienced difficulties due to high public debt ratios, weak banking-financial structure
and low growth performance, the fragilities due to inflation pressure and raising capital inflows
have increased in developing countries which recorded high growth rates.
Especially in Euro Area, serious deterioration in banking and financial risk indicators arose
and confidence was lost in markets. The ratings of some countries and some banks in Europe were
downgraded due to risks of sovereign debt crisis. Considerable decline has been observed in the
global risk appetite with the spreading of debt crisis. Although the measures such as purchase of
government bonds of troubled countries by ECB and expansion of EFSF were taken, they were
evaluated as an effort to postpone the problems. Even though these measures stopped the
deterioration of risk appetite, they could not restore the confidence in markets permanently.
Difficulties and delays in decision making mechanism of the European Union complicated the
control of this process. Factors such as realization of lower than expected growth in the US
economy, insufficient improvements in employment, reaching to the borrowing limit and delays in
decision making process, downgrading of credit ratings for the first time in the US history and the
absence of strong medium term fiscal plan have damaged the confidence in markets.
Since the second quarter of the 2011, economic growth has slowed in developed countries as
a result of measures taken to overcome fiscal and financial problems being inadequate and
tightened domestic demand by future uncertainties. Leading indicators indicate a slowdown in
economic activity for all countries except Japan.2
As a result of these developments, the forecasts regarding the year 2011 for world economic
outlook are revised downward. The world growth which was predicted as 4.4 percent in April was
reduced to 4.3 percent in June and to 4 percent in September. Thus, growth estimate for 2012 is
reduced from 4.5 percent to 4 percent.3
The growth rate for advanced economies is estimated to be 1.6 percent and 1.9 percent in
2011 and 2012, respectively. The growth performance of emerging and developing economies is
expected to be negatively affected through trade and finance channels because of the financial
problems in advanced economies. The growth rate is forecasted as 6.4 percent and 6.1 percent in
2011 and 2012, respectively.
US economy is predicted to grow as 1.5 percent in 2011 and 1.8 percent in 2012. The growth
forecast of Euro Area is revised from 2 percent to 1.6 percent for 2011 and from 1.7 percent to 1.1
percent for 2012. Especially, the sharp decrease in European Commission Economic Sensitivity
Index (ESI) in September, which has been declining since March 2011, has signaled that slowdown
in growth has been continuing noticeably in Euro Area.
The world trade volume that grew 12.8 percent in 2010 is expected to increase 7.5 percent in
2011 in parallel with expected slowdown in overall growth. World trade volume is predicted to
increase by 5.8 percent in 2012.
2 OECD Bulletin of Composite Leading Indicators, October 2011. 3 IMF World Economic Outlook, September 2011.
Macroeconomic Outlook
4
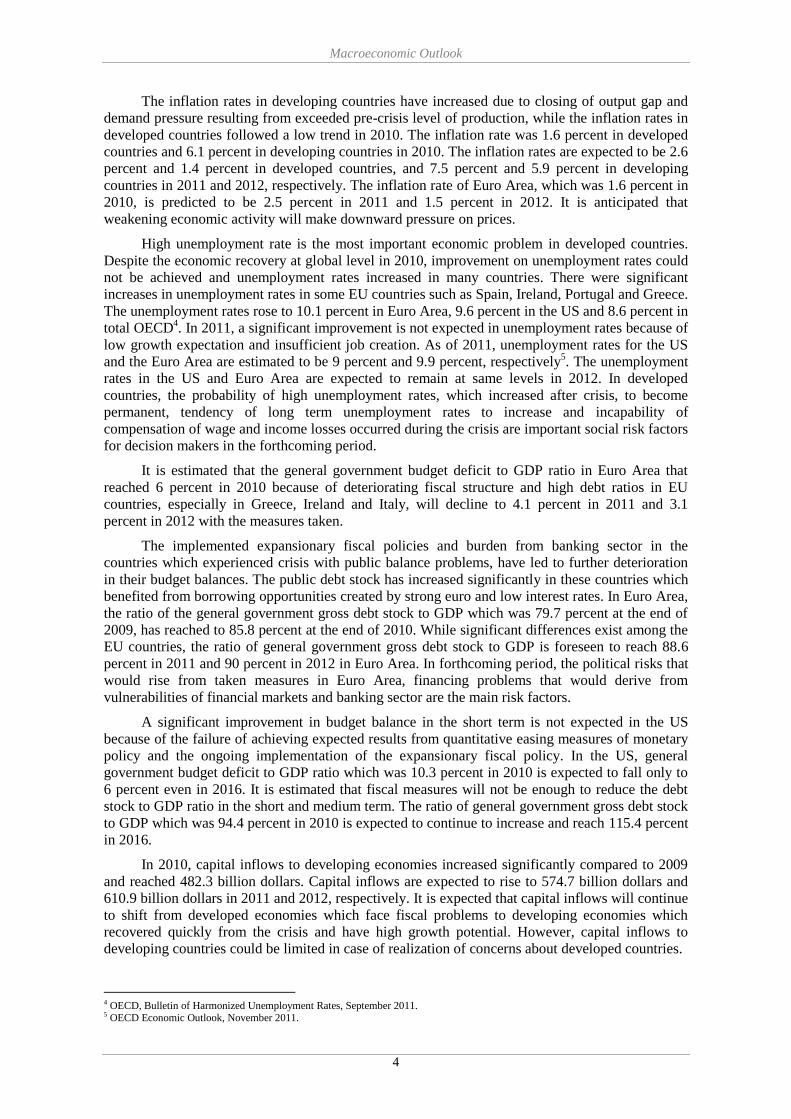
The inflation rates in developing countries have increased due to closing of output gap and
demand pressure resulting from exceeded pre-crisis level of production, while the inflation rates in
developed countries followed a low trend in 2010. The inflation rate was 1.6 percent in developed
countries and 6.1 percent in developing countries in 2010. The inflation rates are expected to be 2.6
percent and 1.4 percent in developed countries, and 7.5 percent and 5.9 percent in developing
countries in 2011 and 2012, respectively. The inflation rate of Euro Area, which was 1.6 percent in
2010, is predicted to be 2.5 percent in 2011 and 1.5 percent in 2012. It is anticipated that
weakening economic activity will make downward pressure on prices.
High unemployment rate is the most important economic problem in developed countries.
Despite the economic recovery at global level in 2010, improvement on unemployment rates could
not be achieved and unemployment rates increased in many countries. There were significant
increases in unemployment rates in some EU countries such as Spain, Ireland, Portugal and Greece.
The unemployment rates rose to 10.1 percent in Euro Area, 9.6 percent in the US and 8.6 percent in
total OECD4. In 2011, a significant improvement is not expected in unemployment rates because of
low growth expectation and insufficient job creation. As of 2011, unemployment rates for the US
and the Euro Area are estimated to be 9 percent and 9.9 percent, respectively5. The unemployment
rates in the US and Euro Area are expected to remain at same levels in 2012. In developed
countries, the probability of high unemployment rates, which increased after crisis, to become
permanent, tendency of long term unemployment rates to increase and incapability of
compensation of wage and income losses occurred during the crisis are important social risk factors
for decision makers in the forthcoming period.
It is estimated that the general government budget deficit to GDP ratio in Euro Area that
reached 6 percent in 2010 because of deteriorating fiscal structure and high debt ratios in EU
countries, especially in Greece, Ireland and Italy, will decline to 4.1 percent in 2011 and 3.1
percent in 2012 with the measures taken.
The implemented expansionary fiscal policies and burden from banking sector in the
countries which experienced crisis with public balance problems, have led to further deterioration
in their budget balances. The public debt stock has increased significantly in these countries which
benefited from borrowing opportunities created by strong euro and low interest rates. In Euro Area,
the ratio of the general government gross debt stock to GDP which was 79.7 percent at the end of
2009, has reached to 85.8 percent at the end of 2010. While significant differences exist among the
EU countries, the ratio of general government gross debt stock to GDP is foreseen to reach 88.6
percent in 2011 and 90 percent in 2012 in Euro Area. In forthcoming period, the political risks that
would rise from taken measures in Euro Area, financing problems that would derive from
vulnerabilities of financial markets and banking sector are the main risk factors.
A significant improvement in budget balance in the short term is not expected in the US
because of the failure of achieving expected results from quantitative easing measures of monetary
policy and the ongoing implementation of the expansionary fiscal policy. In the US, general
government budget deficit to GDP ratio which was 10.3 percent in 2010 is expected to fall only to
6 percent even in 2016. It is estimated that fiscal measures will not be enough to reduce the debt
stock to GDP ratio in the short and medium term. The ratio of general government gross debt stock
to GDP which was 94.4 percent in 2010 is expected to continue to increase and reach 115.4 percent
in 2016.
In 2010, capital inflows to developing economies increased significantly compared to 2009
and reached 482.3 billion dollars. Capital inflows are expected to rise to 574.7 billion dollars and
610.9 billion dollars in 2011 and 2012, respectively. It is expected that capital inflows will continue
to shift from developed economies which face fiscal problems to developing economies which
recovered quickly from the crisis and have high growth potential. However, capital inflows to
developing countries could be limited in case of realization of concerns about developed countries.
4 OECD, Bulletin of Harmonized Unemployment Rates, September 2011. 5 OECD Economic Outlook, November 2011.

Macroeconomic Outlook
5
In the following period, in order to restore confidence, global growth and stability
environment the priority policy areas are; reducing financial problems and high debt ratio in the
US, Japan and the Euro Area within the framework of the announced fiscal plan, continuing easy
monetary policy when needed, strengthening the financial structure of banks and continuing the
structural reforms in the financial sector, commodity and labor markets. In the Euro Area, low
growth rates and high unemployment rates are key structural problems, in addition to high public
debt ratios, transnational interaction of the banking and financial system, debatable structure of the
monetary and fiscal union and differences in competitiveness between the countries of the north
and south. In order to overcome the current vicious circle, the governments should demonstrate
strong and determined political will and make tough decisions. In order to restore investor
confidence, ensuring fiscal balance and strengthening fiscal structure through the fiscal
consolidation especially in Euro Area and increasing opportunities and flexibility of the EFSF are
primarily recommended. The importance of decisive and coordinated action at the global level,
efficient operations of supranational mechanisms including developing countries such as G20
platform and the importance of implementation of the decisions have once more increased.
In this period, Turkey has decoupled significantly from both EU and transition economies
with its high growth performance and low public debt structure. However, in case the public debt
crisis in the EU which is the biggest trade partner of Turkey deepens further, the crisis turns into
banking sector crisis and the slowdown in economic activity continues, it is possible that Turkey is
likely to be adversely affected from these developments.
By taking into consideration the recent developments regarding world economy, the Pre-
Accession Economic Programme (2012-2014) has been prepared in an environment in which the
uncertainties and risks at global level have risen. The assumptions about all exogenous variables
used in PEP forecasts are presented in Annex Table 6.
2.1. Recent Economic Developments
2.1.1. Real Sector
2.1.1.1. Growth
Turkish economy rapidly eliminated negative effects of global crisis with the timely and
decisively implemented policies and attained a strong growth path. Turkish economy, with sound
macroeconomic fundamentals and a strong Medium Term Programme, showed high performance
and grew by 9 percent in 2010 due to declining uncertainities, maintained capital inflows, lower
interest rates and credit expansion.
Private consumption expenditures increased by 6.7 percent and private fixed investment
expenditures increased by 33.5 percent in 2010. Private sector machinery-equipment investment
expenditures, which increased by 43 percent, have been the main driver of the high increase in
private sector investment. Public sector consumption and fixed investment expenditures increased
by 2 percent and 15.1 percent respectively. Contribution of change in stocks to growth was realized
as 2.4 percent as a consequence of increase in production following strong demand and declinig
uncertainities. Thereby, total domestic demand increased by 13.4 percent and had an important role
on strong growth in 2010.
While recovery in global economy increased exports of goods and services, strong domestic
demand stimulated imports of goods and services. While exports of goods and services increased
by 3.4 percent, imports of goods and services increased by 20.7 percent in 2010. As a result of
divergence between increase in domestic and foreign demand, contribution of net exports of goods
and services to growth was -4.4 percentage points.
Strong growth in economy has continued in the first half of 2011. In consequence, GDP
growth rate was 10.2 percent in the first half of 2011 and Turkey has been among the fastest
growing countries.

Macroeconomic Outlook
6
Table 2.1: Growth Rates and Demand Components (Annual Percentage Change, at 1998 Prices)
Quarterly
Annual 2010 2011
2009 2010 I II III IV I II First 6
Months
GDP -4.8 9.0 12.2 10.2 5.3 9.2 11.6 8.8 10.2
Agriculture 3.6 2.4 3.7 2.8 0.9 4.3 7.5 6.4 6.8
Industry -6.9 12.6 19.4 14.6 7.2 10.5 13.5 7.6 10.4
Manufacturing -7.2 13.3 21.2 15.1 7.2 11.2 13.7 8.0 10.7
Services -3.2 8.5 9.1 9.1 6.2 9.6 10.7 10.5 10.6
Construction -16.1 17.1 8.3 20.4 22.1 17.5 14.7 13.2 13.9
Total Consumption -1.0 6.1 7.0 3.4 5.8 8.0 11.7 9.0 10.3
Public 7.8 2.0 0.6 4.7 -0.9 3.2 6.7 7.9 7.3
Private -2.3 6.7 8.0 3.2 6.7 9.0 12.4 9.2 10.8
Gross Fixed Capital Form. -19.0 29.9 16.8 28.4 30.0 42.1 33.6 28.9 31.1
Public -0.6 15.1 13.6 15.5 13.5 17.1 7.4 6.6 6.9
Private -22.5 33.5 17.3 31.4 34.2 49.5 38.0 33.5 35.6
Total Final Dom. Demand -5.1 10.7 8.9 8.3 10.4 14.8 16.3 13.6 14.9
Total Domestic Demand -7.4 13.4 18.2 12.0 9.7 14.7 16.5 13.6 15.0
Exports of Goods and Serv. -5.0 3.4 -0.9 12.5 -1.6 4.3 8.3 0.2 3.9
Imports of Goods and Serv. -14.3 20.7 22.0 19.2 16.2 25.4 27.2 18.8 22.7
Source: TURKSTAT
Note: Services sector is derived by subtracting agriculture and industry sectors from total sectors.
Scrutinizing the gross domestic product by expenditure items, consumption and investment
decisions were affected favorably by the declining uncertainities, increasing consumer confidence
and improving credit conditions. As a matter of fact, private consumption expenditures increased
by 10.8 percent in the first half of 2011. While private fixed investment expenditures increased by
35.6 percent, private machinery-equipment investment expenditures increased by 45.1 percent in
the same period. On the other hand, public consumption and fixed investment expenditures
increased by 7.3 percent and 6.9 percent respectively in the first half of 2011. As a result, total final
domestic demand increased by 14.9 percent in the same period.
Figure 2.1: GDP Developments
Source: TURKSTAT
16
18
20
22
24
26
28
30
-20
-15
-10
-5
0
5
10
15
19
98
Q3
19
99
Q3
20
00
Q3
20
01
Q3
20
02
Q3
20
03
Q3
20
04
Q3
20
05
Q3
20
06
Q3
20
07
Q3
20
08
Q3
20
09
Q3
20
10
Q3
20
11
GDP Annual Growth Rate, % (Left Axis)
Seasonally and Calendar Adjusted GDP, Quarterly Growth Rate, % (Left Axis)
Seasonally and Calendar Adjusted GDP, Million TL of 1998 Prices (Right Axis)

Macroeconomic Outlook
7
Real exports of goods and services recorded 3.9 percent increase in the first half of 2011. In
spite of low performance in exports, strong growth in domestic demand and production led real
imports of goods and services to increase by 22.7 percent in the same period. In parallel, in 2010
foreign trade deficit recorded a significant increase. The faster recovery in Turkish economy
relative to our export markets and the increase in energy prices are the most important underlying
factors behind these developments.
As a result of these developments, in the first half of 2011, contributions to GDP growth of
private consumption was 7.6 percentage points, private fixed investment was 6.9 percentage points,
public consumption was 0.7 percentage points and public fixed investment was 0.2 percentage
points. In this period, changes in stocks did not contribute to GDP growth. With the increase in
exports remaining considerably below the increase in imports, the contribution of net exports to
growth realized as -5.3 percentage points. The contribution of net exports to growth being
substantially negative is apparent as an unfavorable issue in the growth performance.
Considering the sectoral developments, value added growth in industry sector and services
sector which were 12.6 percent and 8.5 percent respectively were effective on growth performance
in 2010. Value added in agriculture sector also increased by 2.4 percent.
In the first half of 2011, value added in agriculture sector increased by 6.8 percent. On the
other hand, value added in industry sector increased by 10.4 percent. Considering the sub-sectors,
the increase in value added was realized as 5.4 percent in the mining and quarrying sector, 10.7
percent in the manufacturing industry and 8.8 percent in the electricity, gas and water supply
sector.
Figure 2.2: Industrial Production Index and Capacity Utilization Rate
Source: TURKSTAT and CBRT
Industrial production index increased by 9.7 percent in the January-September period of
2011 (Figure 2.2). Considering the sub-sectors, there are significant production increases in main
sectors such as manufacturing of motor vehicles (21.3 percent), manufacturing of electrical
equipment (19.3 percent) and manufacturing of computer, electrical and optical devices (15
percent) and manufacturing of machinery-equipment (26 percent).
Capacity utilization rate in the manufacturing industry, another leading indicator for
economic activity, increased by 3.1 percentage points on average in January-November 2011,
compared to the same period of the previous year. However, capacity utilization rate has not
reached pre-crisis level yet.
55
60
65
70
75
80
85
80
90
100
110
120
130
140
20
07-1 3 5 7 9
11
20
08-1 3 5 7 9
11
20
09 1 3 5 7 9
11
20
10 1 3 5 7 9
11
20
11 1 3 5 7 9
Industrial Production Index, 2005=100 (Left Axis) Capacity Utilization Rate, % (Right Axis)
Macroeconomic Outlook
8
The value added in the services sector increased by 10.6 percent in the first half of 2011.
Scrutinizing the sub-sectors, it is observed that the production in all sub-sectors increased in the
first half of the year. Considering important sub-sectors, the increase in the wholesale and retail
trade sector was 15.2 percent, in the construction sector was 13.9 percent, in the transport, storage
and communication sector was 12.3 percent, in the activities of financial intermediation sector was
11.7 percent, in the ownership and dwelling sector was 2 percent and in the real estate renting and
business activities sector was 9.2 percent.
2.1.1.2. Labor Market
Turkish labor market, which deteriorated seriously during the global financial crisis,
displayed a fast recovery throughout 2010. The unemployment rate, which reached historically
high levels during the crisis, recorded a significant decline thanks to the strong employment growth
in 2010.
In the industrial sector, which suffered the largest amount of job losses during the crisis,
employment increased remarkably during the recovery. The highest employment growth rate was
also recorded in that sector. Throughout 2010, the value added of the industrial sector increased by
12.6 percent and the employment increased by 10.2 percent, as a result 417,000 new jobs were
created in the industrial sector. A large part of this increase, namely 346,000, occurred in the
manufacturing industry.
In 2010, the value added in the services sector increased by 8.6 percent and the employment
increased by 3.9 percent, therefore 461,000 new jobs were created in the sector. Analyzing this
development in the services sector at a disaggregated sectoral level, employment in construction
sector and professional, scientific and technical activities sector have increased by 125,000 and
167,000 respectively. As a result, employment in the non-agricultural sector increased by 5.4
percent and 874,000 new jobs were created throughout 2010.
The high rate of increase in agricultural employment in 2010 is a noteworthy issue for the
labor market developments in Turkey. The employment increased by 8.5 percent in agricultural
sector and the employment level increased by additional 443,000 people in 2010.
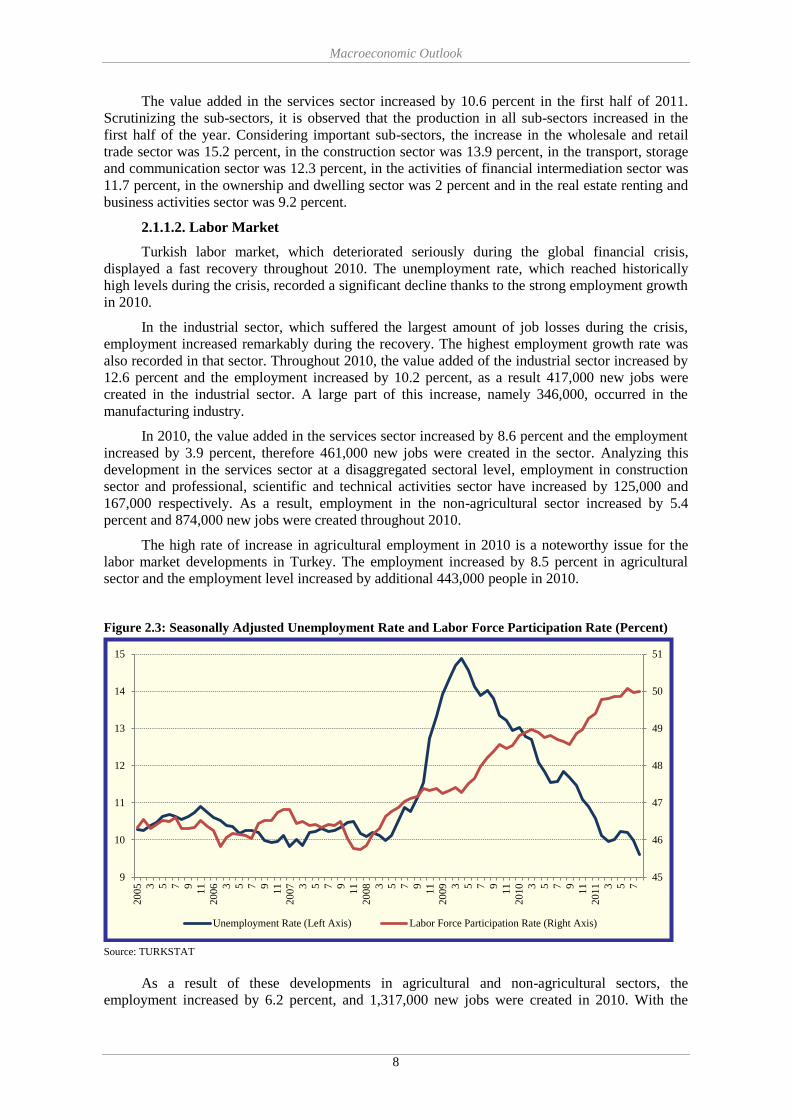
Figure 2.3: Seasonally Adjusted Unemployment Rate and Labor Force Participation Rate (Percent)
Source: TURKSTAT
As a result of these developments in agricultural and non-agricultural sectors, the
employment increased by 6.2 percent, and 1,317,000 new jobs were created in 2010. With the
45
46
47
48
49
50
51
9
10
11
12
13
14
15
20
05 3 5 7 9
11
20
06 3 5 7 9
11
20
07 3 5 7 9
11
20
08 3 5 7 9
11
20
09 3 5 7 9
11
20
10 3 5 7 9
11
20
11 3 5 7
Unemployment Rate (Left Axis) Labor Force Participation Rate (Right Axis)
Macroeconomic Outlook
9
contribution of these favorable developments in employment, the unemployment rate, which was
14 percent in 2009, declined to the level of 11.9 percent in 2010 in spite of the increases in the
labor force participation rate. In this respect, Turkey is one of the few countries which have
accomplished a fast recovery in the labor market in the aftermath of the global financial crisis.
The decline in unemployment rate had also reflections on female, non-agricultural and young
unemployment rates. The female unemployment rate, which was 14.3 percent in 2009, declined to
13 percent in 2010; the non-agricultural unemployment rate, which was 17.4 percent in 2009,
declined to 14.8 percent in 2010 and lastly the unemployment rate among young people, which was
25.3 percent in 2009, declined to 21.7 percent in 2010.
Table 2.2: Labor Market Developments
(15+Age, Thousands)
Annual 2010 2011
2009 2010 I II III IV I II III
Working Age Population 51,686 52,541 52,223 52,431 52,645 52,860 53,152 53,439 53,734
Labor Force Part. Rate, % 47.9 48.8 47.5 49.4 49.7 48.6 48.5 50.5 51.0
Labor Force 24,748 25,641 24,831 25,901 26,166 25,665 25,766 26,995 27,406
Employment 21,277 22,594 21,267 23,055 23,195 22,854 22,802 24,445 24,884
Unemployed 3,471 3,046 3,564 2,846 2,971 2,811 2,964 2,550 2,521
Employment Rate, % 41.2 43.0 40.7 44.0 44.1 43.2 42.9 45.7 46.3
Unemployment Rate, % 14.0 11.9 14.4 11.0 11.4 11.0 11.5 9.4 9.2
Non-Agriculture, % 17.4 14.8 17.5 13.8 14.5 13.7 14.2 12.0 11.9
Among Young People, % 25.3 21.7 25.5 19.8 21.1 20.8 20.6 17.5 18.6
Employment by Sectors
Agriculture 5,240 5,683 5,040 5,831 6,178 5,682 5,573 6,273 6,704
Non-Agriculture 16,037 16,911 16,227 17,224 17,017 17,172 17,229 18,172 18,180
Industry 4,079 4,496 4,308 4,470 4,525 4,667 4,652 4,777 4,682
Services 11,958 12,415 11,919 12,754 12,492 12,505 12,577 13,395 13,498
Source: TURKSTAT
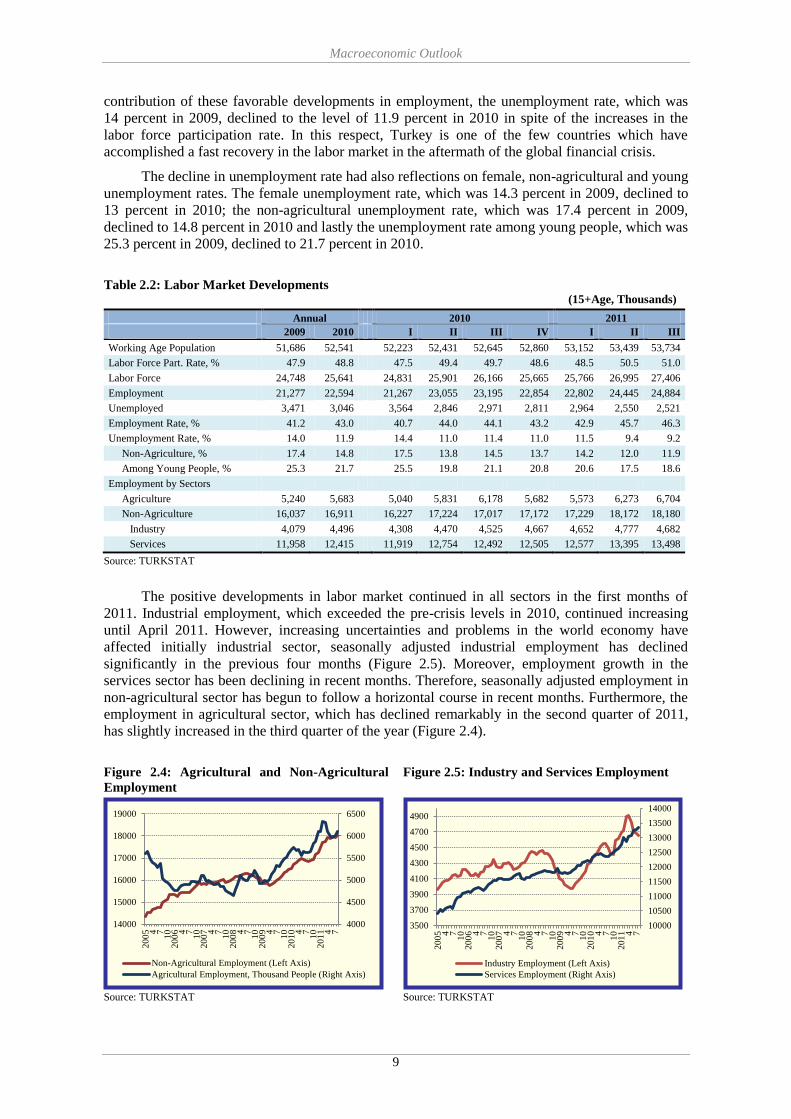
The positive developments in labor market continued in all sectors in the first months of
2011. Industrial employment, which exceeded the pre-crisis levels in 2010, continued increasing
until April 2011. However, increasing uncertainties and problems in the world economy have
affected initially industrial sector, seasonally adjusted industrial employment has declined
significantly in the previous four months (Figure 2.5). Moreover, employment growth in the
services sector has been declining in recent months. Therefore, seasonally adjusted employment in
non-agricultural sector has begun to follow a horizontal course in recent months. Furthermore, the
employment in agricultural sector, which has declined remarkably in the second quarter of 2011,
has slightly increased in the third quarter of the year (Figure 2.4).
Figure 2.4: Agricultural and Non-Agricultural
Employment
Figure 2.5: Industry and Services Employment
Source: TURKSTAT Source: TURKSTAT
4000
4500
5000
5500
6000
6500
14000
15000
16000
17000
18000
19000
200
5 4 710
200
6 4 710
200
7 4 710
200
8 4 710
200
9 4 710
201
0 4 710
201
1 4 7
Non-Agricultural Employment (Left Axis)
Agricultural Employment, Thousand People (Right Axis)
10000
10500
11000
11500
12000
12500
13000
13500
14000
3500
3700
3900
4100
4300
4500
4700
4900
200
5 4 710
200
6 4 710
200
7 4 710
200
8 4 710
200
9 4 710
201
0 4 710
201
1 4 7
Industry Employment (Left Axis)
Services Employment (Right Axis)

Macroeconomic Outlook
10
However, in the first three quarters of 2011, both the employment in non-agricultural and
agricultural sectors showed strong increases in comparison with the same period of previous year.
Accordingly, the decline in unemployment rate has continued in 2011 and seasonally adjusted
unemployment rate has fallen below the pre-crisis levels.
2.1.2. Inflation, Monetary and Exchange Rate Policies
2.1.2.1. Inflation
At the end of 2010, annual rates of increase in the Consumer Price Index (CPI) and Producer
Price Index (PPI) were 6.4 percent and 8.87 percent respectively (Figure 2.6). The upward trend in
inflation in the last quarter of 2009 has continued until the last quarter of 2010 due to the tax
arrangements concerning fuel oil, alcoholic beverages and tobacco products and high rates of
increase in unprocessed food prices. The course of food prices was determinant in inflation
developments throughout 2010. The annual energy inflation rose in the first half of the year, then
declined gradually in the second half and ended the year at 9.96 percent. The prices of alcoholic
beverages and tobacco products increased significantly as a result of the rise in taxes introduced
during the year and the annual inflation of the group reached to 24.66 percent by the end of 2010.
Although the impact of rises in food and energy prices on service prices became evident via
catering and transportation services channels, the annual services inflation dropped down to the
lowest level in its history in 2010 and realized 4.24 percent by end of the year. Within this
framework, the core inflation indicators maintained their low levels during the year and annual
inflation rates of SCA-H and SCA-I6 were 3.49 and 2.99 by the end of the year, respectively
(Figure 2.7). Consequently, annual consumer inflation became 6.4 percent as of December 2010 by
decreasing 0.13 percentage points compared to the end of 2009 and realized close to the year-end
target.
Figure 2.6: CPI Targets and Realizations (%) Figure 2.7: CPI and Core CPI
(Annual Percentage Change)
Source: CBRT, TURKSTAT
Source: TURKSTAT
The downward trend in inflation in the last quarter of 2010, continued during the first quarter
of 2011 due to base effect and positive developments in unprocessed food prices and the annual
rate of increase in CPI fell to a rather low level of 3.99 percent as of the end of March 2011.
However starting from the second quarter of 2011, depreciation of the Turkish Lira and the
increase in international commodity prices began to affect consumer prices. Core goods annual
inflation in which aforementioned price increases was notably experienced increased significantly
and reached to 7.64 percent as of September 2011. Parallel to this, the contribution of core goods to
annual inflation increased steadily from the beginning of the year and reached to 1.91 percentage
points as of September 2011. While, annual processed food inflation rose gradually due to the
6 Core CPI-H: Indicators for the CPI Having Specified Coverages-H (Unprocessed food products, energy and alcoholic beverages,
tobacco products and gold excluded CPI).
Core CPI-I: Indicators for the CPI Having Specified Coverages-I (Energy, food and non-alcoholic beverages, alcoholic beverages, tobacco products and gold excluded CPI).
0
2
4
6
8
10
12
14
20
07 4 7
10
20
08 4 7
10
20
09 4 7
10
20
10 4 7
10
20
11 4 7
10
Core-I CPI
35.0
20.0
12.0
8.0
5.0 4.0 4.0
7.5 6.5
29.7
18.4
9.3
7.7
9.7 8.4
10.1
6.5 6.4
0
5
10
15
20
25
30
35
40
2002 2003 2004 2005 2006 2007 2008 2009 2010
Target Realization

Macroeconomic Outlook
11
increase in global food prices, annual energy inflation increased notably due to the rise in oil prices.
These developments indicate that cost pressures rather than the recovery in the domestic demand
have been the main factor for the recent rise in inflation. As a result, annual consumer inflation
realized as 6.15 percent in September 2011. Annual core inflation indicators have steadily
increased since October 2010. The contribution of core goods to the annual rate of changes of the
indicators has played an important role in the aforementioned increase. As of September, the
annual inflation in SCA-H and SCA-I were 7.42 percent and 6.96 percent, respectively (Figure
2.7).
Following the announcement of MTP (2012-2014), CPI went up by 3.27 percent and 1.73
percent in October and November, respectively. This surge was mainly driven by increases in main
inflation indicators due to the arrangement in administered prices and lag effects of exchange rate
developments. Thus, 12 months CPI inflation reached 9.48 percent in November. Inflation is
expected to increase in December due to the base effect in unprocessed food prices. In this
framework, 2011 end-year inflation is expected to realize around 10 percent.
2.1.2.2. Monetary and Exchange Rate Policy
As normalization in global markets becomes more pronounced, on 14 April 2010 the Central
Bank publicized its exit strategy that involves a gradual withdrawal of the liquidity measures taken
during the crisis and normalization of the monetary policy framework. In this context, the excess
liquidity via repo auctions has been gradually reduced parallel to the normalization of the money
markets. As the market liquidity conditions have evolved as envisaged, in May 2010 the Central
Bank has initiated the first step of the technical arrangement to facilitate a change in the operational
structure of liquidity management by which the one week repo rate became the new policy rate.
Accelerating short-term capital inflows, the divergence between domestic and external
demand growth and rapid credit expansion contributed to the widening of the current account
deficit in the second half of 2010, necessitating a close monitoring of macroprudential risks to
Turkey. Therefore, the Central Bank started to follow a monetary policy framework where price
stability and financial stability complement each other. Thus, with the main objective of
maintaining price stability and the duty of observing financial stability, the Central Bank adopted a
new policy mix with lower policy rates, wider interest rate corridor and higher required reserve
ratios in order to contain macroprudential risks in the fourth quarter of 2010.
In this context, in order to encourage long-term capital inflows and to maintain the stability
of the Turkish Lira, the Central Bank reduced the one-week repo auction rate, which is the policy
rate, from 7 percent to 6.25 percent with decisions of December 2010 and January 2011. Moreover,
the Central Bank significantly widened the spread between overnight borrowing and lending rates.
In this regard, the Central Bank cut its overnight borrowing rate to 1.50 percent and hiked its
lending rate to 9 percent. A similar adjustment was made for late liquidity window rates.
Since September 2010, the Central Bank has taken important steps regarding reserve
requirements, a key element of the Central Bank’s policy mix serving to control macroprudential
risks. Firstly, as part of the exit strategy, the TL reserve requirement ratio was raised by 0.50 points
each in September and in November. Moreover, in September 2010, the Central Bank ended
interest payments on TL reserve requirements in order to use required reserve ratios as an active
policy instrument. In December, the Central Bank adopted a more comprehensive approach and
decided to differentiate TL reserve requirement ratios by maturity in order to extend the maturity of
the banking system’s liabilities, thereby reducing maturity mismatches, and to encourage long-term
capital inflows. Accordingly, the required reserve ratio on short-term liabilities was raised and the
required reserve base was expanded by including repo transactions, except interbank and Central
Bank transactions. Finally, the TL required reserve ratio on liabilities excluding short-term
deposits/participation funds was again raised on 24 January 2011. The weighted average of the
reserve requirement ratios, where weights are assigned by the share of liabilities, was increased
about 4 percentage points from 23 September 2010 to 24 January 2011.
In order to benefit more effectively from capital flows by boosting foreign exchange reserves
while also enhancing the resilience against volatile capital flows, the Central Bank decided to

Macroeconomic Outlook
12
change the method of foreign exchange buying auctions in October 2010. The Central Bank
decided that banks would no more hold any option at regular auctions as of 3 January 2011. In the
meantime with the same decision, the daily amount of purchase was raised to 50 million dollars in
order to avoid a significant slowdown in Central Bank’s foreign exchange purchases due to the
ending of options.
The Central Bank, with the main objective of maintaining price stability and the duty of
observing financial stability, adopted a policy mix in November 2010 and continued to implement
the policy mix of low policy rate, wide interest rate corridor and high reserve requirement ratios in
the first quarter of 2011. Accordingly, one-week repo rate, the policy rate, was reduced to 6.25
percent in January with a 25 basis point decline and the weighted average of the required reserve
ratios was raised in order to control rapid credit growth. The rapid surge in oil and commodity
prices in the subsequent period increased the upside risks to inflation, necessitating an additional
tightening in order to limit the second round effects. Assessing that required reserve ratios rather
than policy rates would be more effective for containing macro financial risks driven by the
divergence between domestic and external demand, the additional tightening was implemented
through a substantial increase in the weighted average of the required reserve ratios. Accordingly,
in March, the TL required reserve ratios were raised 4 percentage points for demand deposits,
short-term time deposits/participation funds and other liabilities. In order to balance domestic and
external demand, and thus limit macro financial risks, short-term TL and FX required reserve ratios
were raised slightly on 21 April 2011 by consequently driving the weighted average of the TL
required reserve ratios up to 13.5 percent. Meanwhile, on 21 April 2011, as part of the measures to
contain macro financial risks, FX required reserve ratios were differentiated by maturity and raised
slightly for short-term deposits.
Lagged effects of cumulative increases in import prices led to a gradual and envisioned
increase in core inflation indicators in the second quarter of 2011. The Central Bank stated that this
increase was due to a relative price change in tradable goods rather than deterioration in the general
pricing behavior, and hence secondary effects were yet to be observed. In this context, considering
the slowdown in economic activity and the uncertainties in the global economy, policy rate and TL
required reserve ratios were kept constant between April and July 2011.
The mounting concerns in the second quarter of 2011 regarding sovereign debt problems
across some European countries as well as global economic growth adversely affected the risk
appetite and capital flows to emerging economies. In view of these developments, the daily amount
to be purchased via FX auctions was reduced to 30 million dollars from 50 million dollars in May
and June. Towards the end of July, FX buying auctions were suspended in order to monitor the
effects of the decisions taken by the EU pertaining to solve the sovereign debt problems.
Additionally, in July, in order to extend the maturity structure of the banking sector
liabilities, foreign exchange required reserve ratios were decreased for long-term liabilities, while
they were kept unchanged for liabilities with maturities less than one-year.
The policies implemented by the Central Bank since end-2010 aimed at gradually
rebalancing the economy towards a healthier growth composition without hampering the medium-
term inflation outlook. Accordingly, policies were pursued to prevent excessive deviation of
exchange rates in either direction from economic fundamentals, while necessary measures were
taken with the support of other institutions, to ensure reasonable levels in credit growth rates.
As the risk perceptions deteriorated rapidly and debt problems in the Euro Area further
intensified in early August 2011, the Central Bank held an interim meeting on 4 August 2011 to
contain the potential adverse effects of these developments on financial stability and economic
activity, and announced a comprehensive package of measures. These measures laid the
background for a timely, controlled and effective provision of liquidity to markets in the event of a
financial turmoil that may be driven by the developments in the global economy. The Central Bank
cut the policy rate by 0.50 percentage points in order to contain the risk of a recession in domestic
economic activity that may be posed by the escalating global economic problems.

Macroeconomic Outlook
13
Having noted the uncertainties regarding the global economy in its August and September
meetings, the Central Bank stated that closely monitoring the developments and taking necessary
policy measures without delay were of great importance. During this period, upon the acceleration
of capital outflows from emerging economies, a series of liquidity measures were taken to limit the
fluctuations in the foreign exchange market.
Measures regarding Turkish Lira market in August-October period were built on two pillars.
First is preventing extreme volatility in overnight interest rates by narrowing the interest rate
corridor, which was previously used as an instrument to discourage short term capital flows as
well. Similarly, with the aim of mitigating fluctuations in repo interest rates, an amendment has
been made so that the funding from repo transactions will be included in the liabilities that are
currently subject to required reserves by taking the average of daily balances between two
calculation periods.
The second element of the measures taken after August 2011 regarding TL liquidity is to
meet the TL liquidity requirement of the Turkish banking system in a more permanent way.
Accordingly, with the decisions taken in August-October period, the upper limit for FX reserves
that may be held to meet Turkish Lira reserve requirements was raised to 40 percent of TL
liabilities. This decision was taken with a view to meeting the TL liquidity requirement of the
Turkish banking system permanently and at a lower cost, while at the same time bolstering the
build-up of the Central Bank’s FX reserves. Moreover, the required reserve ratios of Turkish lira
liabilities of certain maturities were reduced such that the weighted average TL required reserve
ratio, has come down to 10.5 percent.
Furthermore, in August-October period, some measures regarding liqudity in foreign
exchange markets were also taken to lay the background for a timely, controlled and effective
provision of liquidity to markets in the event of a financial turmoil that may be driven by the
developments in the global economy. With decisions taken on different dates, the FX required
reserve ratios were reduced, one week FX depo lending rate for transactions, which the Central
Bank is a party to, was reduced slightly and it was decided to supply FX liquidity to the market via
foreign exchange selling auctions when deemed appropriate. With the decision taken in September
2011, the facility of maintaining reserves requirement as standard gold at the accounts of Central
Bank against the total amount of reserve requirement maintained for the precious metal deposit
accounts and up to 10 percent of reserve requirements for foreign currency liabilities excluding
precious metal deposit accounts has been provided. Moreover, as valid from the liability scale
dated 28 October 2011, the facility of maintaining reserves requirement as standard gold at the
accounts of Central Bank against the total amount of reserve requirement maintained for the
precious metal deposit accounts and up to 10 percent of reserve requirements for foreign currency
liabilities, in order to strengthen the gold reserves of the Central Bank and to provide more
flexibility for liquidity methods of banks.
The ongoing deterioration in global risk appetite, which started in August, has led to an
excessive depreciation of the Turkish Lira. Accumulated depreciation of 30 percent since
November 2010 started to pose risks on inflation outlook. Moreover, the adjustments in
administered prices in October were far beyond the projections of the Central Bank and this
brought about a sizeable upward revision for the short-term inflation forecasts. Accordingly, in its
October meeting, the Central Bank underlined that it would not tolerate the outlook and
expectations for medium-term inflation to be affected by these developments, and decided to widen
the overnight interest rate corridor by raising the lending rate from 9 percent to 12.5 percent.
At the Monetary Policy Committee meeting of 4 August 2011, the Central Bank agreed to
closely monitor developments, and if necessary, take measures to provide foreign exchange
liquidity via appropriate methods and instruments. Accordingly, taking global developments into
consideration, the Central Bank has continued to supply FX liquidity to the market via high-volume
foreign exchange selling auctions as of 5 October 2011. Furthermore, as unhealthy price formations
in exchange rates are being observed due to speculative behavior stemming from a decrease in

Macroeconomic Outlook
14
market depth, on 18 October 2011, the Central Bank directly intervened to the market through FX
sales.
2.1.3. Financial Sector
Thanks to the restructuring starting from 2002 and the latest strong regulation and
supervision frame, Turkish banking sector had a successful performance in 2011 despite the crisis
in global markets. Alternative distribution channels, number of customers and fundamental sizes of
banking sector continued to increase in this period and concerning the number of institutions
operating in the sector, number of banks decreased by 1 and realized as 48 as of August 2011 when
compared to end-2010. Turkish banking sector maintained its strong and stable structure and its
asset size which amounted to 657 billion dollars as of end-2010 increased by 4.9 percent and
realized as 689 billion dollars in August 2011. Credit volume of banking sector increased by 8.6
percent to 373 billion dollars as of August 2011 compared to end-2010.
Within this strong structure, the share of securities in total assets is decreasing relatively
while the share of loans is continuing to increase. Accordingly, the share of loans in total assets
which was 52.3 percent in 2010 increased to 54.1 percent in August 2011. Besides real sector
loans, consumer loans have a significant growth trend in recent years. The share of housing loans,
credit cards and other retail loans in total loans are in an increasing trend.
When strength indicators of banking system are analyzed, it is seen that capital adequacy
ratio of the sector is quite above the legal limit by 16.6 percent in August 2011. The scope of
current own funds of Turkish banking sector is mostly comprised of Tier-I capital which represents
cash capital elements and has a buffer role against the problems. Current sound capital structure
increases resilience of the sector against sudden shocks and this sound structure supports
maintaining stability in economy.
The ratio of non-performing loans to gross loans, which is the credit risk indicator of the
sector, increased following the emergence of global crisis but followed a declining trend in 2011
and decreased to 2.8 percent as of August. The ratio of the sector’s foreign exchange net general
position to own funds realized as 0.49 percent as of August 2011. Moreover the advantageous
situation concerning liquidity indicator continues. The ratio of off-balance sheet transactions to
assets, which grew in recent years, has the purpose of protection from financial risks.
The fact that banks had to set aside more provisions as a result of the CBRT’s resolution on
required reserves in 2011 led them to meet their liquidity requirements through repo. On the other
hand, as a result of the aforementioned policy of the CBRT, the maturity of deposits, that is the
most important funding resource of banks, lengthened partially.
Turkish banking sector continued to make profits during the crisis period, though not as high
as previous periods. Banking sector net profit which was 14.4 billion dollars in 2010 realized as 7.3
billion dollars in the first eight months of 2011. Return on assets and return on own funds ratios
which were 3 percent and 20.1 percent respectively in 2010 are realized as 1.5 percent and 9.8
percent respectively within the first eight months of 2011.
Stock exchange market was generally volatile during 2010, but had an increasing trend. In
the first ten months of 2011, the Index had a downward movement. ISE 100 Index increased by
24.9 percent as of 31 December 2010 compared to end-2009 and realized as 66,004. The ISE 100
Index realized as 56,061 points at the end of October 2011, decreasing 15.1 percent compared to
end-2010. While the ISE 100 Dollar Index increased by 20.9 percent and realized as 2,500 points
as of 31 December 2010, by the end of October 2011 it decreased by 25.2 percent compared to end
of 2010 and realized as 1,565 points. The share of foreign investors in the stock exchange market
preserve its stable pattern during 2010, however compared to its end-2009 level, which was 67.3
percent, it decreased slightly to 66.2 percent as of 31 December 2010. This share decreased to 62
percent as of end-October 2011.
There were 59 companies operating in insurance and private pension sector, as of 30
September 2011. 35 of these companies were operating in the area of non-life insurance, 13 in life
insurance and pension area, 10 in life insurance area and 1 in reinsurance area. As of the same date,
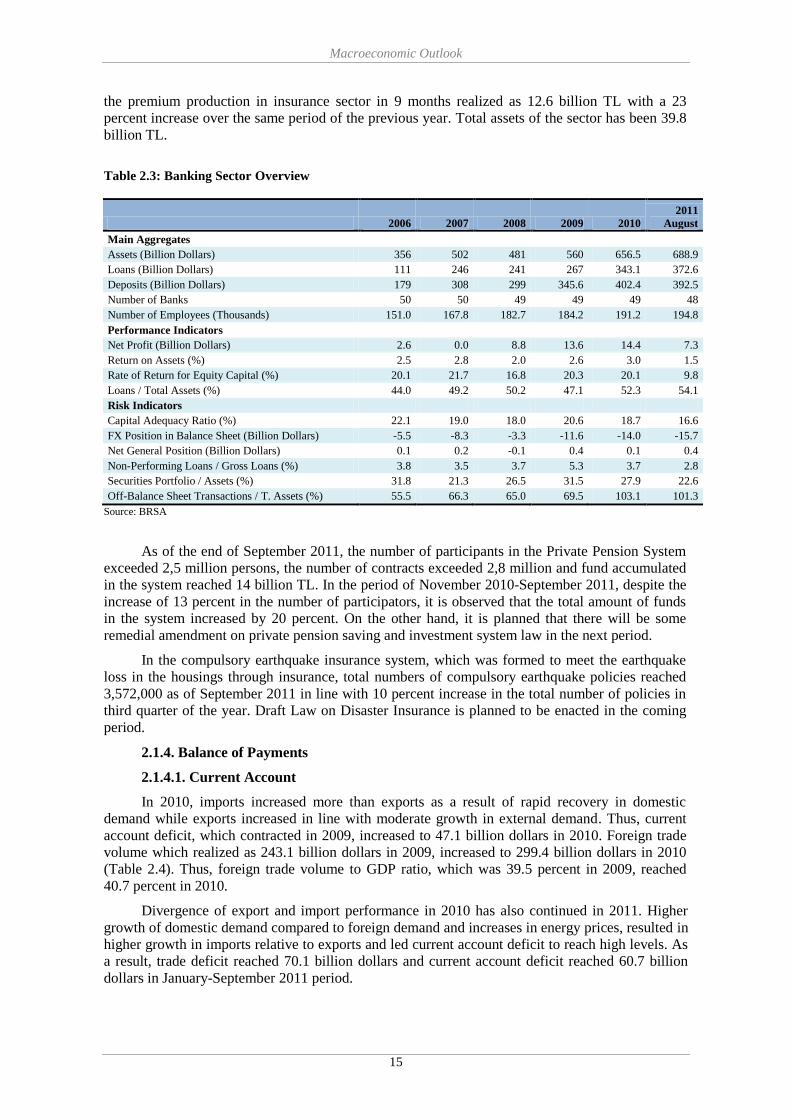
Macroeconomic Outlook
15
the premium production in insurance sector in 9 months realized as 12.6 billion TL with a 23
percent increase over the same period of the previous year. Total assets of the sector has been 39.8
billion TL.
Table 2.3: Banking Sector Overview
2006 2007 2008 2009 2010
2011
August
Main Aggregates
Assets (Billion Dollars) 356 502 481 560 656.5 688.9
Loans (Billion Dollars) 111 246 241 267 343.1 372.6
Deposits (Billion Dollars) 179 308 299 345.6 402.4 392.5
Number of Banks 50 50 49 49 49 48
Number of Employees (Thousands) 151.0 167.8 182.7 184.2 191.2 194.8
Performance Indicators
Net Profit (Billion Dollars) 2.6 0.0 8.8 13.6 14.4 7.3
Return on Assets (%) 2.5 2.8 2.0 2.6 3.0 1.5
Rate of Return for Equity Capital (%) 20.1 21.7 16.8 20.3 20.1 9.8
Loans / Total Assets (%) 44.0 49.2 50.2 47.1 52.3 54.1
Risk Indicators
Capital Adequacy Ratio (%) 22.1 19.0 18.0 20.6 18.7 16.6
FX Position in Balance Sheet (Billion Dollars) -5.5 -8.3 -3.3 -11.6 -14.0 -15.7
Net General Position (Billion Dollars) 0.1 0.2 -0.1 0.4 0.1 0.4
Non-Performing Loans / Gross Loans (%) 3.8 3.5 3.7 5.3 3.7 2.8
Securities Portfolio / Assets (%) 31.8 21.3 26.5 31.5 27.9 22.6
Off-Balance Sheet Transactions / T. Assets (%) 55.5 66.3 65.0 69.5 103.1 101.3
Source: BRSA
As of the end of September 2011, the number of participants in the Private Pension System
exceeded 2,5 million persons, the number of contracts exceeded 2,8 million and fund accumulated
in the system reached 14 billion TL. In the period of November 2010-September 2011, despite the
increase of 13 percent in the number of participators, it is observed that the total amount of funds
in the system increased by 20 percent. On the other hand, it is planned that there will be some
remedial amendment on private pension saving and investment system law in the next period.
In the compulsory earthquake insurance system, which was formed to meet the earthquake
loss in the housings through insurance, total numbers of compulsory earthquake policies reached
3,572,000 as of September 2011 in line with 10 percent increase in the total number of policies in
third quarter of the year. Draft Law on Disaster Insurance is planned to be enacted in the coming
period.
2.1.4. Balance of Payments
2.1.4.1. Current Account
In 2010, imports increased more than exports as a result of rapid recovery in domestic
demand while exports increased in line with moderate growth in external demand. Thus, current
account deficit, which contracted in 2009, increased to 47.1 billion dollars in 2010. Foreign trade
volume which realized as 243.1 billion dollars in 2009, increased to 299.4 billion dollars in 2010
(Table 2.4). Thus, foreign trade volume to GDP ratio, which was 39.5 percent in 2009, reached
40.7 percent in 2010.
Divergence of export and import performance in 2010 has also continued in 2011. Higher
growth of domestic demand compared to foreign demand and increases in energy prices, resulted in
higher growth in imports relative to exports and led current account deficit to reach high levels. As
a result, trade deficit reached 70.1 billion dollars and current account deficit reached 60.7 billion
dollars in January-September 2011 period.

Macroeconomic Outlook
16
Table 2.4: Balance of Payments
(Billion Dollars)
Annual
January-September
2009 2010 2010 2011
Current Account -14.0 -47.1 -30.2 -60.7
Trade Balance -24.9 -56.4 -37.6 -70.1
Total Exports 109.6 120.9 87.0 105.7
Exports (fob) 102.1 113.9 81.7 99.5
Total Imports -134.5 -177.3 -124.7 -175.7
Imports (cif) -140.9 -185.5 -130.6 -181.7
Balance on Services 16.7 15.0 11.5 14.5
Credit 33.5 34.5 25.6 30.0
Tourism Revenues 21.3 20.8 15.5 17.8
Debit -16.7 -19.4 -14.1 -15.4
Balance on Income -8.2 -7.1 -5.0 -6.3
Credit 5.2 4.5 3.7 3.3
Debit -13.4 -11.6 -8.7 -9.5
Current transfers 2.3 1.4 1.0 1.2
Capital and Financial Account 8.9 42.9 28.1 48.4
Capital Account 0.0 -0.1 -0.1 0.0
Financial Account (Excluding Reserves) 9.1 55.8 36.6 53.8
Direct Investment 6.9 7.6 4.2 9.3
Direct Investment in Turkey 8.4 9.1 5.4 10.9
Direct Investment Abroad -1.6 -1.5 -1.2 -1.7
Portfolio Investment 0.2 16.1 13.1 14.4
Other Investment 2.0 32.1 19.3 30.2
Assets 11.0 7.1 6.0 11.7
Liabilities -9.0 25.0 13.3 18.5
Trade Credits -1.1 2.1 0.0 3.7
Loans -13.9 8.6 0.9 15.8
Monetary Authority 0.0 0.0 0.0 0.0
General Government 0.9 1.4 1.4 -0.4
Banks -4.5 12.9 4.9 10.4
Other Sectors -10.4 -5.7 -5.3 5.7
Currency and Deposits 4.1 13.8 12.0 -1.5
Monetary Authority -0.9 -0.6 -0.3 -1.5
Banks 5.0 14.3 12.3 0.0
Other Liabilities 1.9 0.5 0.5 0.5
Reserve Assets -0.1 -12.8 -8.5 -5.4
Net Errors and Omissions 5.1 4.2 2.2 12.3
Source: CBRT
In 2010, world exports increased by 12.8 percent while Turkish exports recorded an increase
of 11.5 percent of which 6.3 percent has been real increase (Figure 2.8). In 2011, continuation of
risks and problems in world economy has caused the continuation of weak foreign demand as in
2010. Indeed, real exports increased at the low rate of 6.6 percent in January-September period of
2011. In the same period, with the contribution of 14.2 percent increase in export prices, exports
increased by 21.7 percent compared to the same period of previous year and reached 99.5 billion
dollars. According to most recent data, in January-October 2011 exports have increased by 20.2
compared to the same period of the previous year and reached 111.4 billion dollars. In this period,
chemicals and chemical products exports increased by 22.2 percent, electrical machinery and
apparatus exports increased by 24 percent, motor vehicles and trailers exports increased by 15.5
percent and textiles exports increased by 22.8 percent.

Macroeconomic Outlook
17
Figure 2.8: Developments in Exports and Export Prices
Source: IMF-IFS, TURKSTAT
In line with the high growth performance, imports increased by 31.7 percent and reached
185.5 billion dollars in 2010. In January-October 2011 period, high increase in imports has
continued and import growth realized as 36.3 percent. In the same period, imports of capital goods
realized as 30.8 billion dollars with a 41.1 percent increase, import of intermediate goods realized
as 145.2 billion dollars with a 36.8 percent increase and consumption goods imports realized as
24.9 billion dollars with a 27.8 percent increase (Table 2.5). In January-September 2011 period,
import prices increased significantly by 17.5 percent and increase in real imports realized as 18.4
percent.
Table 2.5: Foreign Trade by Broad Economic Categories Classification (Billion Dollars)
Annual
January-October
2009 Share
% 2010
Share
%
Change
% 2010
Share
% 2011
Share
%
Change
%
Total Exports 102.1 100.0 113.9 100.0 11.5 92.7 100.0 111.4 100.0 20.2
Capital Goods 11.1 10.9 11.8 10.3 5.9 9.6 10.4 11.6 10.5 21.2
Intermediate Goods 49.7 48.7 56.4 49.5 13.4 46.1 49.7 56.3 50.5 22.3
Consumption Goods 40.7 39.9 45.3 39.8 11.3 36.7 39.6 43.0 38.6 17.3
Other 0.6 0.5 0.4 0.4 -26.4 0.3 0.4 0.4 0.4 28.3
Total Imports 140.9 100.0 185.5 100.0 31.7 147.9 100.0 201.6 100.0 36.3
Capital Goods 21.5 15.2 28.8 15.5 34.3 21.8 14.8 30.8 15.3 41.1
Intermediate Goods 99.5 70.6 131.4 70.8 32.1 106.1 71.8 145.2 72.0 36.8
Consumption Goods 19.3 13.7 24.7 13.3 28.2 19.5 13.2 24.9 12.4 27.8
Other 0.7 0.5 0.5 0.3 -18.1 0.4 0.3 0.7 0.3 60.4
Source: TURKSTAT
Foreign trade by country groups shows that, share of EU countries in exports increased by
0.3 percentage points and realized as 46.3 percent in 2010 and the share of other countries in
exports realized as 51.9 percent, reflecting 0.2 percentage points decline. Share of imports from EU
countries in total imports declined to 38.9 percent in the same period, indicating 1.2 percentage
points decline. In January-October 2011 period, share of exports to EU in total exports was 46.9
percent and the share of imports from EU in total imports was 37.9 percent (Table 2.6).
Services surplus decreased to 15 billion dollars in 2010. The decline in tourism revenues,
main item of balance on services, was effective on this development. Continuation of weak
economic performance of developed countries, which determines the tourism demand of Turkey,
led to the decline in tourism revenues in 2010. In January-September 2011 period, tourism
revenues began to rise again and reached 17.8 billion dollars with an increase of 14.6 percent
compared to the same period of previous year.
-60
-40
-20
0
20
40
60
80200
0-1 7
200
1-1 7
200
2-1 7
200
3-1 7
200
4-1 7
200
5-1 7
200
6-1 7
200
7-1 7
200
8-1 7
200
9-1 7
201
0-1 7
201
1-1 7
Turkey World
Exports Growth Rate, %
-30
-20
-10
0
10
20
30
200
0-1 7
200
1-1 7
200
2-1 7
200
3-1 7
200
4-1 7
200
5-1 7
200
6-1 7
200
7-1 7
200
8-1 7
200
9-1 7
201
0-1 7
201
1-1 7
Turkey World
Changes in Export Prices, %

Macroeconomic Outlook
18
Although a recovery about 1.1 billion dollars was realized in balance on income, current
transfers decreased by 0.9 billion dollars in 2010. In January-September 2011, while a deteoriation
of 1.3 billion dollars in balance on income was recorded, an improvement of 0.2 billion dollars was
realized in current transfers.
Table 2.6: Foreign Trade by Country Groups
(Billion Dollars)
Annual
January-October
2009 Share
% 2010
Share
%
Change
% 2010
Share
% 2011
Share
%
Change
%
Merchandise Exports 102.1 100.0 113.9 100.0 11.5 92.7 100.0 111.4 100.0 20.2
European Countries (EU-27) 47.0 46.0 52.7 46.3 12.1 42.9 46.3 52.2 46.9 21.7
Other Countries 53.2 52.1 59.1 51.9 11.2 48.1 51.9 57.1 51.3 18.9
Turkish Free Zones 2.0 1.9 2.1 1.8 6.5 1.7 1.8 2.0 1.8 20.4
Merchandise Imports 140.9 100.0 185.5 100.0 31.7 147.9 100.0 201.6 100.0 36.3
European Countries (EU-27) 56.5 40.1 72.2 38.9 27.7 57.3 38.7 76.4 37.9 33.4
Other Countries 83.5 59.2 112.5 60.6 34.8 89.9 60.8 124.3 61.7 38.3
Turkish Free Zones 1.0 0.7 0.9 0.5 -9.0 0.7 0.5 0.9 0.4 21.1
Source: TURKSTAT
2.1.4.2. Capital and Financial Account
In the global recovery period, capital inflows especially to emerging and developing
countries increased significantly in 2010 and realized as 482.3 billion dollars7. With the effects of
this favorable development observed in capital movements, financial account excluding reserves
which declined to 9.1 billion dollars in 2009 increased above its pre-crisis level of 55.8 billion
dollars in 2010.
Net direct investment to developing and emerging countries increased from 310.6 billion
dollars in 2009 to 324.8 billion dollars in 2010. This figure is expected to reach 429.3 billion
dollars in 2011. Increase in global foreign direct investment flows in 2010 also affected Turkey and
net foreign direct investment, which was 6.9 billion dollars in 2009, increased to 7.6 billion dollars
in 2010. In first three quarters of 2011, this item exceeded its 2010 level with 9.3 billion dollars.
Portfolio investment inflows to Turkey reached 16.1 billion dollars in parallel with
diminishing uncertainties in financial markets in 2010. In 2010, while net inflows of 3.5 billion
dollars in equity securities and net inflows of 10.7 billion dollars in government domestic
borrowing instruments (GDBI) were recorded, net borrowing of 4.1 billion dollars was recorded
through debt securities issued abroad by Treasury. Besides, starting from 2010, banks provided
long-term capital inflows of 1 billion dollars through issuing debt securities abroad. In first three
quarters of 2011, net portfolio investment inflows to Turkey reached 14.4 billion dollars and in its
sub-items net inflows of 8.6 billion dollars in GDBI, net inflows of 2.3 billion dollars in banks’
debt security issues abroad and net inflows of 1.5 billion dollar in debt security issues abroad by
Treasury were realized, while in equities net outflows of 0.4 billion dollars was recorded.
Other investments recovered rapidly in 2010 and net inflows reached 32.1 billion dollars
with the recovery in foreign trade volume and improvement of borrowing facilities in international
markets. Besides significant increases in deposits of foreign banks, the rise in short term credit
usage of domestic banks was influential in this development. Furthermore, banks transferring assets
amounting to 13.6 billion dollars from abroad to Turkey was the other notable development in
2010. In the first three quarters of 2011, net inflow in other investment item was recorded as 30.2
billion dollars. Credit usage of banks and other sectors by 10.4 billion dollars and 5.7 billion dollars
respectively and 11.6 billion dollars deposits that other sectors transferred from abroad to Turkey
were determinant in the developments in other investment item.
7 IMF World Economic Outlook Report, September 2011.
Macroeconomic Outlook
19
Consequently, current account deficit was recorded as 60.7 billion dollars in first three
quarters of 2011. Current account deficit was financed by 53.8 billion dollars inflow recorded in
finance account excluding reserves and 12.3 billion dollars inflow in net errors and omissions
items. Since financing items were higher than the current account deficit, reserves increased by 5.4
billion dollars in this period.
2.2. Medium Term Macroeconomic Scenario
Recently, uncertainty has gradually increased in global economy as well as decoupling
between developed and developing countries has become apparent. Thanks to its strong fiscal
structure and banking sector, confidence has been achieved inTurkish economy in a short period of
time by timely and sound policies. Thereby, economy has attained a strong growth path. Turkey
recorded 9 percent growth in 2010, 10.2 percent in the first half of 2011 and has been among the
fastest growing countries.
In the forthcoming period, maintaining growth in a sustainable structure is of utmost
importance. Within this framework, Pre-Accession Economic Programme (2012-2014) has been
prepared in line with Medium Term Programme (2012-2014), which has the main objectives of
increasing welfare, increasing employment, sustaining fiscal discipline, increasing domestic
savings, reducing current account deficit, and thereby strengthening macroeconomic stability in a
stable growth path.
The policies will focus on increasing the quality of labor force, labor market flexibility and
labor force participation rate besides the policies which will ensure stable growth environment
supporting job creation.
Maintaining the structural transformation in the areas of competitiveness, efficiency in
public expenditures, good governance, state aids, education system, judicial system, tax system,
informal economy, local governments and regional development are the main priorities of the
Programme.
2.2.1. Real Sector
2.2.1.1. Demand Components of Growth
In 2010 a significant recovery was experienced with the effect of expansionary economic
policies implemented in 2009 to reduce the negative effects of the global financial crisis and
reestablish confidence in the markets. Thereby, world economy which contracted by 0.7 percent in
2009, grew by 5.1 percent in 2010. However, this outlook deteriorated again in 2011. Budget
deficits and high public debts resulting from expansionary policies implemented against the crisis
have increased the uncertainty in global markets. These developments have led to downward
revisions of the global growth expectations for 2012.
Like many countries, Turkey was affected by the global crisis but has recovered strongly
with the appropriate and timely measures. Accordingly, GDP growth was estimated as 6.8 percent
for 2010, but upward risks were mentioned in PEP (2011-2013). Indeed, as a result of strong
macroeconomic fundamentals, elimination of uncertainties with a credible Medium Term
Programme and low interest rates, Turkish economy performed above the expectations with 9
percent growth in 2010 and 10.2 percent in the first half of 2011.
Scrutinizing the expenditure composition of high GDP growth, it is observed that growth has
been mostly driven by private sector consumption and fixed capital investment expenditures.
Private consumption expenditures increased by 10.8 percent in the first half of 2011 compared to
the same period of previous year. With the effect of global developments, increase in credit costs
and exchange rate depreciation, growth of consumption expenditures is expected to slow down in
the second half of the year and to be 6.1 percent in 2011. Private sector fixed capital investment
expenditures increased by 35.6 percent in the first half of 2011. In line with the expected slowdown
in economic growth in the second half of the year, growth rate of private investment is forecasted
to be 22.3 percent at the end of 2011. However, concerning the recent indicators, annual estimates
carry upward risks (Table 2.7).
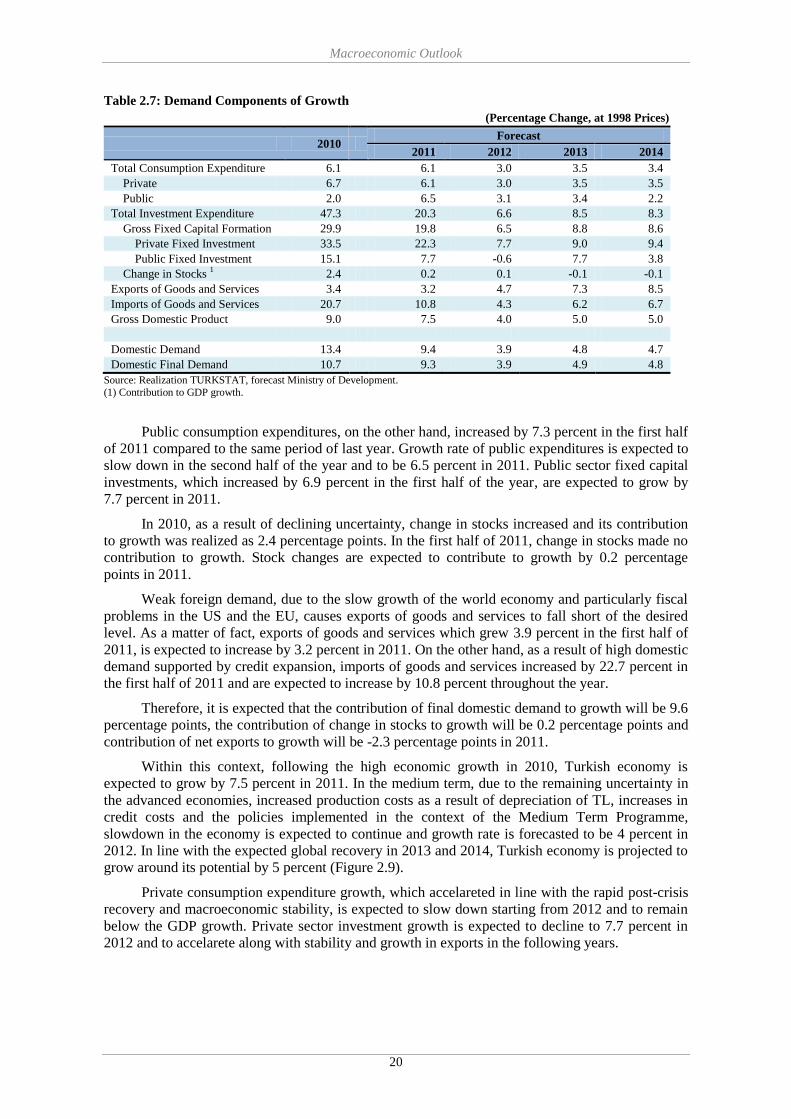
Macroeconomic Outlook
20
Table 2.7: Demand Components of Growth
(Percentage Change, at 1998 Prices)
2010 Forecast
2011 2012 2013 2014
Total Consumption Expenditure 6.1 6.1 3.0 3.5 3.4
Private 6.7 6.1 3.0 3.5 3.5
Public 2.0 6.5 3.1 3.4 2.2
Total Investment Expenditure 47.3 20.3 6.6 8.5 8.3
Gross Fixed Capital Formation 29.9 19.8 6.5 8.8 8.6
Private Fixed Investment 33.5 22.3 7.7 9.0 9.4
Public Fixed Investment 15.1 7.7 -0.6 7.7 3.8
Change in Stocks 1 2.4 0.2 0.1 -0.1 -0.1
Exports of Goods and Services 3.4 3.2 4.7 7.3 8.5
Imports of Goods and Services 20.7 10.8 4.3 6.2 6.7
Gross Domestic Product 9.0 7.5 4.0 5.0 5.0
Domestic Demand 13.4 9.4 3.9 4.8 4.7
Domestic Final Demand 10.7 9.3 3.9 4.9 4.8
Source: Realization TURKSTAT, forecast Ministry of Development.
(1) Contribution to GDP growth.
Public consumption expenditures, on the other hand, increased by 7.3 percent in the first half
of 2011 compared to the same period of last year. Growth rate of public expenditures is expected to
slow down in the second half of the year and to be 6.5 percent in 2011. Public sector fixed capital
investments, which increased by 6.9 percent in the first half of the year, are expected to grow by
7.7 percent in 2011.
In 2010, as a result of declining uncertainty, change in stocks increased and its contribution
to growth was realized as 2.4 percentage points. In the first half of 2011, change in stocks made no
contribution to growth. Stock changes are expected to contribute to growth by 0.2 percentage
points in 2011.
Weak foreign demand, due to the slow growth of the world economy and particularly fiscal
problems in the US and the EU, causes exports of goods and services to fall short of the desired
level. As a matter of fact, exports of goods and services which grew 3.9 percent in the first half of
2011, is expected to increase by 3.2 percent in 2011. On the other hand, as a result of high domestic
demand supported by credit expansion, imports of goods and services increased by 22.7 percent in
the first half of 2011 and are expected to increase by 10.8 percent throughout the year.
Therefore, it is expected that the contribution of final domestic demand to growth will be 9.6
percentage points, the contribution of change in stocks to growth will be 0.2 percentage points and
contribution of net exports to growth will be -2.3 percentage points in 2011.
Within this context, following the high economic growth in 2010, Turkish economy is
expected to grow by 7.5 percent in 2011. In the medium term, due to the remaining uncertainty in
the advanced economies, increased production costs as a result of depreciation of TL, increases in
credit costs and the policies implemented in the context of the Medium Term Programme,
slowdown in the economy is expected to continue and growth rate is forecasted to be 4 percent in
2012. In line with the expected global recovery in 2013 and 2014, Turkish economy is projected to
grow around its potential by 5 percent (Figure 2.9).
Private consumption expenditure growth, which accelareted in line with the rapid post-crisis
recovery and macroeconomic stability, is expected to slow down starting from 2012 and to remain
below the GDP growth. Private sector investment growth is expected to decline to 7.7 percent in
2012 and to accelarete along with stability and growth in exports in the following years.
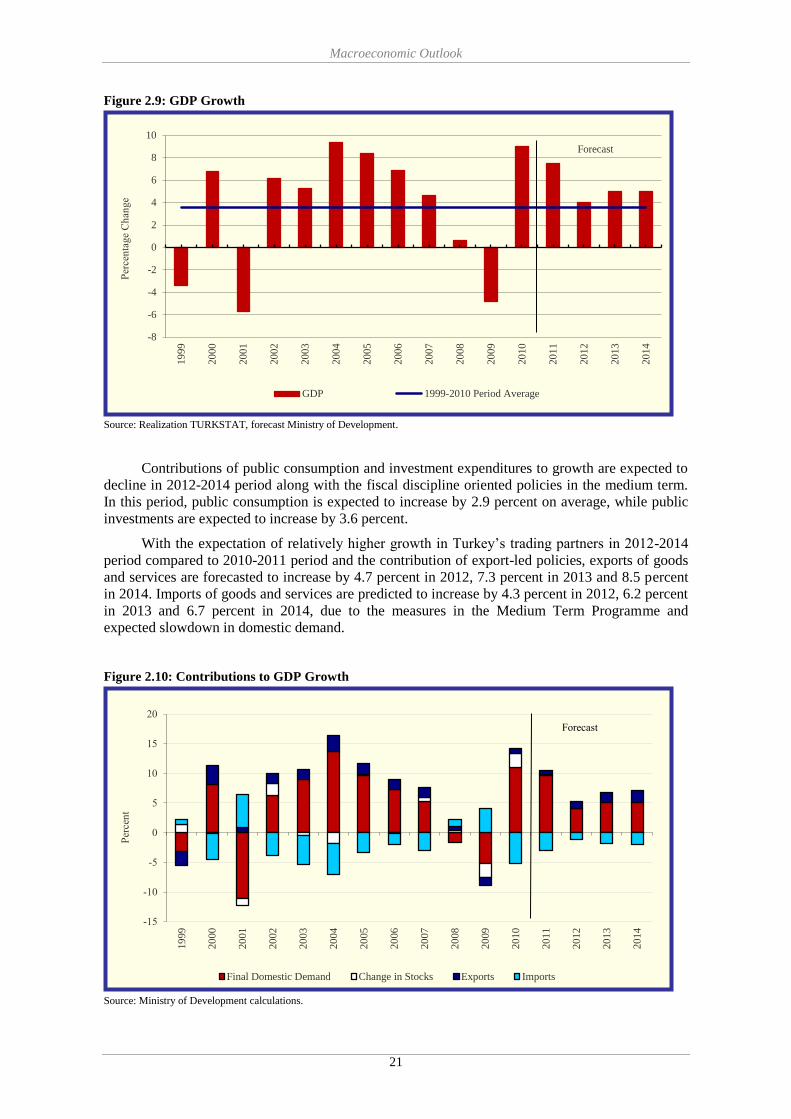
Macroeconomic Outlook
21
Figure 2.9: GDP Growth
Source: Realization TURKSTAT, forecast Ministry of Development.
Contributions of public consumption and investment expenditures to growth are expected to
decline in 2012-2014 period along with the fiscal discipline oriented policies in the medium term.
In this period, public consumption is expected to increase by 2.9 percent on average, while public
investments are expected to increase by 3.6 percent.
With the expectation of relatively higher growth in Turkey’s trading partners in 2012-2014
period compared to 2010-2011 period and the contribution of export-led policies, exports of goods
and services are forecasted to increase by 4.7 percent in 2012, 7.3 percent in 2013 and 8.5 percent
in 2014. Imports of goods and services are predicted to increase by 4.3 percent in 2012, 6.2 percent
in 2013 and 6.7 percent in 2014, due to the measures in the Medium Term Programme and
expected slowdown in domestic demand.
Figure 2.10: Contributions to GDP Growth
Source: Ministry of Development calculations.
-8
-6
-4
-2
0
2
4
6
8
10
19
99
20
00
20
01
20
02
20
03
20
04
20
05
20
06
20
07
20
08
20
09
20
10
20
11
20
12
20
13
20
14
Per
cen
tage
Ch
ange
GDP 1999-2010 Period Average
Forecast
-15
-10
-5
0
5
10
15
20
19
99
20
00
20
01
20
02
20
03
20
04
20
05
20
06
20
07
20
08
20
09
20
10
20
11
20
12
20
13
20
14
Per
cen
t
Final Domestic Demand Change in Stocks Exports Imports
Forecast

Macroeconomic Outlook
22
In PEP (2012-2014) period, growth is expected to be private sector driven in line with Turkey's growth strategy. In 2012-2014 period, it is expected that contribution of net exports to
growth, which was negative in previous years, will decrease and realize around zero on average,
with the exchange rate adjustment and the recovering demand in trading partners (Figure 2.10).
2.2.1.2. Investment-Saving Balance
Policy measures taken in a timely and decisive manner with a medium-term perspective
during global crisis period and strong structural fundamentals provided Turkish economy to exceed
its pre-crisis production level by experiencing a high growth performance in 2010. The ratio of
private sector fixed investments to GDP increased to 14.9 percent by rising 1.7 percentage points
over the previous year as a result of rapidly recovering domestic demand where main contribution
came from private fixed investments. In this period, share of public fixed capital investments in
GDP realized as 3.9 percent with an increase of 0.2 percentage points. The share of change in
stocks in GDP realized as 1.2 percent in 2010 upon compensation of stocks which decreased
previously with the uncertainty brought by the crisis. Thus, total investment expenditures to GDP
ratio rose to 19.9 percent in 2010 by an increase of 5 percentage points over the previous year
(Table 2.8).
As strong domestic demand and growth have continued in the first half of 2011, private
sector fixed investments surged by 35.6 percent compared to the same period of the previous year.
Maintainance of low levels of interest rates and strong capital structure of banking sector has
supported this process. Although growth rate is anticipated to slow down in the second half of 2011
due to rising uncertainties on global scale, the share of private sector fixed investments in GDP is
expected to increase by 2.8 percentage points and reach 17.7 percent throughout the year. In 2011,
the ratio of public sector fixed investments to GDP is estimated to realize at 4 percent with a slight
rise compared to previous year. Thus, total investments as a share of GDP are predicted to reach
22.1 percent for the whole year.
While growth is expected to slow down slightly in 2012, attaining a stable growth path is
targeted in the Programme period. As specified in MTP (2012-2014), with policies supporting
private sector investments for steady growth, private sector fixed investment expenditures are
expected to increase by 8.7 percent annually on average during the period of 2012-2014. In this
context, the share of private investments in GDP is expected to reach 19.8 percent at the end of the
period. On the other hand, public sector fixed investments as a share of GDP is expected to be 3.9
percent on average during the Programme period and thereby total investments as a share of GDP
is predicted to reach 24 percent at the end of the period.
Rapid economic recovery in 2010 was followed by a rapid increase in imports. With rapidly
increasing trade deficit and insufficient domestic savings, the need for external resources has
increased. In this period, international capital flows to Turkish economy increased significantly and
foreign savings as a share of GDP realized as 6.5 percent. This trend has also continued in 2011. In
this period, in spite of rising global uncertainties, sufficient foreign resource inflow realized thanks
to sound financial and fiscal structure of the Turkish economy. In this context, foreign savings to
GDP ratio is predicted to reach 9.4 percent in this year.
The share of domestic savings in GDP, which declined significantly in 2009, increased to
13.4 percent despite a strong growth in 2010. Due to low levels of interest rates and rising
confidence in the economy, the ratio of domestic savings to GDP is predicted to fall to the level of
2009. As a result of the projection of growth rates to be close to its potential level and policies
aimed at increasing public and private savings during the Programme period, domestic savings as a
share of GDP are expected to increase steadily during the period and reach the level of 17 percent
in 2014. Thus, foreign savings to GDP ratio is predicted to decline steadily and decrease to 7
percent at the end of the period.
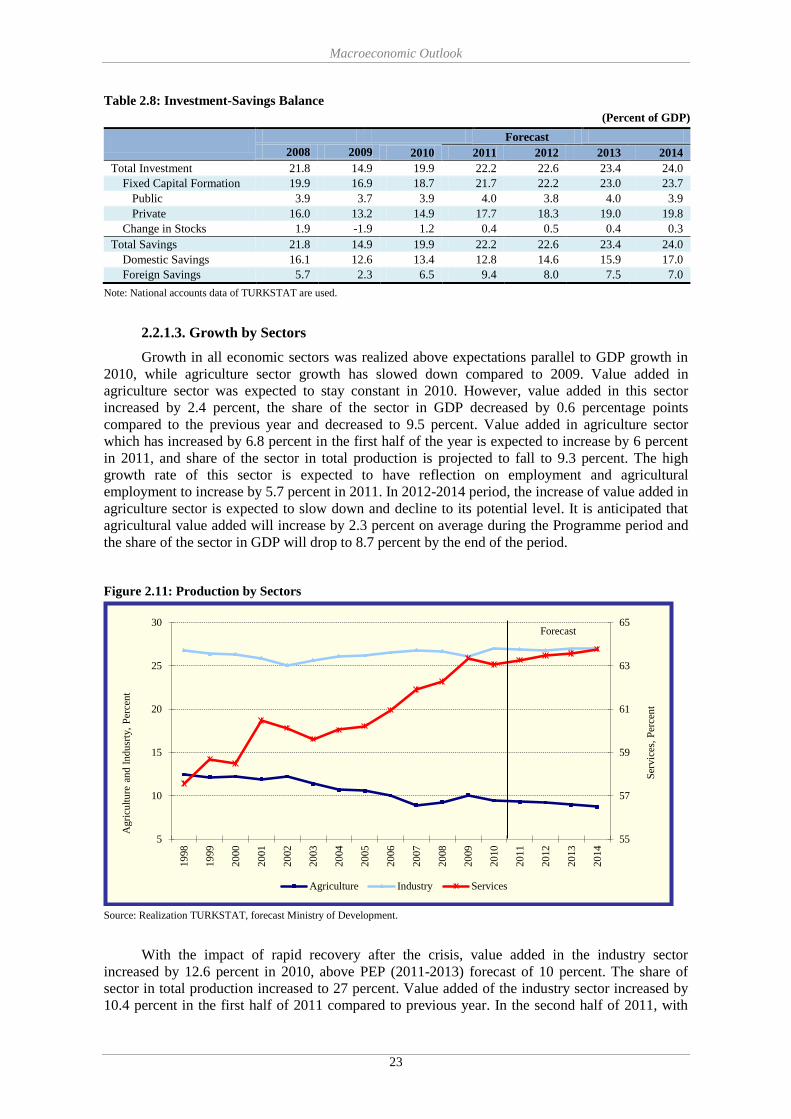
Macroeconomic Outlook
23
Table 2.8: Investment-Savings Balance
(Percent of GDP)
Note: National accounts data of TURKSTAT are used.
2.2.1.3. Growth by Sectors
Growth in all economic sectors was realized above expectations parallel to GDP growth in
2010, while agriculture sector growth has slowed down compared to 2009. Value added in
agriculture sector was expected to stay constant in 2010. However, value added in this sector
increased by 2.4 percent, the share of the sector in GDP decreased by 0.6 percentage points
compared to the previous year and decreased to 9.5 percent. Value added in agriculture sector
which has increased by 6.8 percent in the first half of the year is expected to increase by 6 percent
in 2011, and share of the sector in total production is projected to fall to 9.3 percent. The high
growth rate of this sector is expected to have reflection on employment and agricultural
employment to increase by 5.7 percent in 2011. In 2012-2014 period, the increase of value added in
agriculture sector is expected to slow down and decline to its potential level. It is anticipated that
agricultural value added will increase by 2.3 percent on average during the Programme period and
the share of the sector in GDP will drop to 8.7 percent by the end of the period.
Figure 2.11: Production by Sectors
Source: Realization TURKSTAT, forecast Ministry of Development.
With the impact of rapid recovery after the crisis, value added in the industry sector
increased by 12.6 percent in 2010, above PEP (2011-2013) forecast of 10 percent. The share of
sector in total production increased to 27 percent. Value added of the industry sector increased by
10.4 percent in the first half of 2011 compared to previous year. In the second half of 2011, with
55
57
59
61
63
65
5
10
15
20
25
30
19
98
19
99
20
00
20
01
20
02
20
03
20
04
20
05
20
06
20
07
20
08
20
09
20
10
20
11
20
12
20
13
20
14
Ser
vic
es,
Per
cen
t
Agri
cult
ure
and I
ndusr
ty,
Per
cent
Agriculture Industry Services
Forecast
Forecast
2008 2009 2010 2011 2012 2013 2014
Total Investment 21.8 14.9 19.9 22.2 22.6 23.4 24.0
Fixed Capital Formation 19.9 16.9 18.7 21.7 22.2 23.0 23.7
Public 3.9 3.7 3.9 4.0 3.8 4.0 3.9
Private 16.0 13.2 14.9 17.7 18.3 19.0 19.8
Change in Stocks 1.9 -1.9 1.2 0.4 0.5 0.4 0.3
Total Savings 21.8 14.9 19.9 22.2 22.6 23.4 24.0
Domestic Savings 16.1 12.6 13.4 12.8 14.6 15.9 17.0
Foreign Savings 5.7 2.3 6.5 9.4 8.0 7.5 7.0

Macroeconomic Outlook
24
the effect of global uncertainty, it is expected that the increase in value added of the industry sector
will slow down and it will be 7.2 percent in 2011. While growth of manufacturing sector was
recorded as 17.9 percent in the first six month of 2010, it was 10.7 percent in the same period of
2011. While growth of energy sector increased from 5.6 percent to 8.8 percent in the same period,
mining sector growth decreased from 10.6 percent to 5.4 percent. In 2012-2014 period, industry
sector value added is expected to increase by 4.8 percent annually on average which implies that its
share will remain constant.
Table 2.9: Value-Added by Sectors
(At 1998 Prices, Percent)
Realization Forecast
2008 2009 2010 2011 2012 2013 2014
Growth Rates
Agriculture 4.3 3.6 2.4 6.0 3.0 2.0 2.0
Industry 0.3 -6.9 12.6 7.2 3.5 5.6 5.2
Services 1.2 -3.2 8.5 7.8 4.4 5.2 5.4
GDP 0.7 -4.8 9.0 7.5 4.0 5.0 5.0
Percent of GDP
Agriculture 9.3 10.1 9.5 9.3 9.2 9.0 8.7
Industry 26.7 26.1 27.0 26.9 26.8 26.9 27.0
Services 62.3 63.4 63.1 63.3 63.5 63.6 63.8
GDP 100.0 100.0 100.0 100.0 100.0 100.0 100.0
Note: Services sector is derived by subtracting agriculture and industry sectors from total sectors.
Services sector, which is driven by wholesale and retail trade sector, transport, storage and
communication sector, financial intermediation sector and construction sector, has recorded 10.6
percent growth in the first half of 2011compared to the same period of previous year. It is expected
that value added in this sector will increase by 7.8 percent in 2011, above the previous forecast of 5
percent. Growth of the sector is expected to slow down in line with the developments in the
industry sector in the 2012-2014 period and to be 5 percent annually on average. Consequently, the
share of the services sector in GDP is expected to increase gradually during this period and reach
63.8 percent by an increase of 0.7 percentage points compared to 2010.
2.2.1.4. Sources of Growth
Analyzing the sources of growth in Turkish economy from a long-term perspective8, it is
observed that investments thereby capital stock has been the main driving factor of growth and TFP
did not contribute to the growth remarkably overall, although its contribution displayed different
patterns between periods. With the impact of macroeconomic instabilities experienced in 1990s,
TFP contributed to growth marginally in 1985-2000 period. However, it is observed that TFP has
started to play a significant role in terms of contribution to the growth due to the positive
developments after the 2001 crisis. Scrutinizing the period of 2002-2010 wherein 5 percent annual
average growth rate was recorded, it is seen that TFP increased by 1.8 percent annually on average
and its contribution to the growth was recorded as 36.7 percent (Table 2.10 and Table 2.11). On the
other hand, employment had a similar pattern of the previous periods and contribution of
employment to the growth was realized as 20 percent. Significant increases in labor productivity
were recorded in this period as well. Evaluating the sources of growth with a long-term
perspective, it is observed that employment has showed a stable pattern in terms of contribution to
growth whereas all changes have stemmed from the shifts between the capital stock and TFP
among the periods.
Turkish economy contracted by 4.8 percent in 2009 due to the developments in the global
economy. However, with a rapid recovery after the crisis, it grew by 9 percent in 2010 which is a
8 Unlike the previous PEPs, in the Pre-Accession Economic Programme (2012-2014), in order to reflect a long-term perspective, the
results of the analyses based on annual data set instead of quarterly data set are provided for the structural issues such as production function, sources of growth, productivity and potential GDP.
Macroeconomic Outlook
25
considerably high growth rate. Analyzing the sources of growth, it is observed that high increases
in capital stock and employment were the main contributors to this high GDP growth, while TFP
contributed to the growth negatively due to the high contributions of the other factors. In 2010,
employment increased by 6.2 percent and capital stock corrected by capacity utilization rate rose
by 17.2 percent. The capacity utilization rate, which declined significantly in 2009, made an
upward adjustment by 7 percentage points in 2010. This is reflected to the growth rate of capacity
utilization corrected capital stock.
Table 2.10: Increases in Production Factors
(Percent)
Period GDP Growth Capital Stock
Growth
Capital Stock
Growth *
Employment
Growth TFP Growth
1985-2000 4.3 7.7 7.8 1.7 0.3
2001-2010 3.9 5.2 4.7 1.4 1.2
1985-2010 4.1 6.7 6.6 1.6 0.7
2012-2014 4.7 6.8 7.4 1.8 0.8
* Capital stock increase corrected by capacity utilization rate.
Table 2.11: Contribution to Growth by Factors of Production
(Percent)
Period Capital Stock Employment TFP
1985-2000 67.5 25.0 7.5
2001-2010 45.9 23.3 30.8
1985-2010 59.7 24.4 15.8
2012-2014 59.2 24.6 16.2
In the first half of 2011, Turkish economy displayed a performance above the expectations in
terms of economic growth and this led to an upward revision in growth forecasts for 2011. Similar
to 2010, the main factors of growth will be capital stock and employment and contribution of TFP
will not be significant in this year. It is foreseen that capital stock will increase by 6.6 percent and
employment will increase by 5.9 percent.
In PEP (2012-2014) period, considering global economic outlook and uncertainties, Turkish
economy is expected to grow by 4.7 percent annually on average, which is slightly below the
average growth rate of 2002-2010 period. The capital stock, which is expected to increase by 6.8
percent annually on average, will continue to be the main determinant of growth in this period.
With the relative slowdown in the economy in 2012, employment is foreseen to increase by 1.4
percent. In the following years, it is expected that employment will increase by around 2 percent
and will contribute to growth approximately by 25 percent. A remarkable increase in labor
productivity compared to previous years is expected in this period as well. In 2012-2014 period,
TFP is foreseen to increase by 0.8 percent annually on average, which is the historical average
growth rate, and to contribute to the growth by 16.2 percent. Considering these forecasts, sources
of growth in PEP (2012-2014) period is expected to display a pattern similar to historical averages.
2.2.1.5. Potential Output
Annual output gap series based on the estimations of four different methods; Hodrick
Prescott method, production function method, linear method and split-time linear method are
presented on Figure 2.12. According to the output gap estimates by alternative methods, output
level displayed a fluctuating and unstable structure around its potential level in 1990s due to
existing economic problems and macroeconomic instability in Turkish economy. In 2001, output
retreated below its potential considerably due to the financial crisis, however it reached its potential
in 2004, with the impact of important reforms starting from 2001. Thereinafter, especially in 2006-
2007 period, output gap reached its peak.
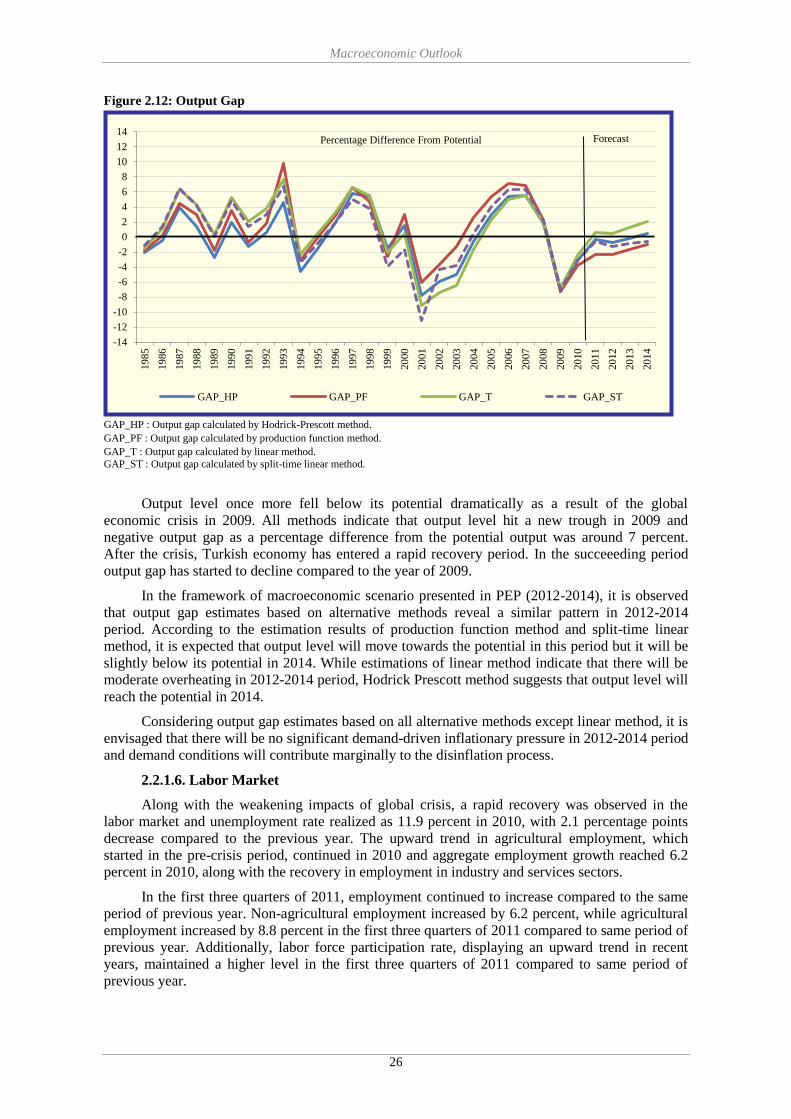
Macroeconomic Outlook
26
Figure 2.12: Output Gap
GAP_HP : Output gap calculated by Hodrick-Prescott method.
GAP_PF : Output gap calculated by production function method. GAP_T : Output gap calculated by linear method.
GAP_ST : Output gap calculated by split-time linear method.
Output level once more fell below its potential dramatically as a result of the global
economic crisis in 2009. All methods indicate that output level hit a new trough in 2009 and
negative output gap as a percentage difference from the potential output was around 7 percent.
After the crisis, Turkish economy has entered a rapid recovery period. In the succeeeding period
output gap has started to decline compared to the year of 2009.
In the framework of macroeconomic scenario presented in PEP (2012-2014), it is observed
that output gap estimates based on alternative methods reveal a similar pattern in 2012-2014
period. According to the estimation results of production function method and split-time linear
method, it is expected that output level will move towards the potential in this period but it will be
slightly below its potential in 2014. While estimations of linear method indicate that there will be
moderate overheating in 2012-2014 period, Hodrick Prescott method suggests that output level will
reach the potential in 2014.
Considering output gap estimates based on all alternative methods except linear method, it is
envisaged that there will be no significant demand-driven inflationary pressure in 2012-2014 period
and demand conditions will contribute marginally to the disinflation process.
2.2.1.6. Labor Market
Along with the weakening impacts of global crisis, a rapid recovery was observed in the
labor market and unemployment rate realized as 11.9 percent in 2010, with 2.1 percentage points
decrease compared to the previous year. The upward trend in agricultural employment, which
started in the pre-crisis period, continued in 2010 and aggregate employment growth reached 6.2
percent in 2010, along with the recovery in employment in industry and services sectors.
In the first three quarters of 2011, employment continued to increase compared to the same
period of previous year. Non-agricultural employment increased by 6.2 percent, while agricultural
employment increased by 8.8 percent in the first three quarters of 2011 compared to same period of
previous year. Additionally, labor force participation rate, displaying an upward trend in recent
years, maintained a higher level in the first three quarters of 2011 compared to same period of
previous year.
-14
-12
-10
-8
-6
-4
-2
0
2
4
6
8
10
12
1419
85
19
86
19
87
19
88
19
89
19
90
19
91
19
92
19
93
19
94
19
95
19
96
19
97
19
98
19
99
20
00
20
01
20
02
20
03
20
04
20
05
20
06
20
07
20
08
20
09
20
10
20
11
20
12
20
13
20
14
GAP_HP GAP_PF GAP_T GAP_ST
Percentage Difference From Potential Forecast

Macroeconomic Outlook
27
Due to increasing uncertainties in the global economy in 2011, a slowdown is expected in
Turkish economy starting from the second half of the year and this expectation is taken into
account in labor market projections. In this context, seasonally adjusted non-agricultural
employment, which has been following a horizontal path in recent periods, is expected to maintain
its horizontal path in the last quarter of the year.
Given these assumptions and projections, non-agricultural employment is expected to
increase by 6 percent in 2011. As for the agricultural sector, employment is expected to increase by
5.7 percent. Thus, total employment is expected to increase by 5.9 percent and unemployment rate
is forecasted to retreat to 10.5 percent in 2011 (Table 2.12). However, in the context of recent
realizations, possibility of having a lower than projected unemployment rate is deemed high.
Agricultural employment is expected to show a moderate decline in the period of 2012-2014,
while non-agricultural employment is expected to increase in line with the projections of economic
growth and productivity increases. In this context, non-agricultural employment is predicted to
increase by 2.2 percent, 2.8 percent and 2.9 percent in 2012, 2013 and 2014, respectively.
Considering these forecasts regarding agricultural and non-agricultural employment, aggregate
employment is estimated to increase by approximately 2.7 million people in 2014 compared to
2010.
Seasonally adjusted labor force participation rate, which has an upward trend since 2008, has
followed a horizontal path starting from the first months of 2011. In this context, labor force
participation rate is expected to realize as 49.9 percent in 2011. In 2012-2014 period, it is expected
to display a moderate decline and realize as 49.7 percent.
Table 2.12: Developments in the Labor Market
(15+ Age)
Realization
Forecast
2009 2010 2011 2012 2013 2014
Working Age Population (Thousand Person) 51,686 52,541 53,534 54,527 55,478 56,390
Labor Force Participation Rate (Percent) 47.9 48.8 49.9 49.7 49.7 49.7
Labor Force (Thousand Person) 24,748 25,641 26,724 27,081 27,565 28,043
Employment 21,277 22,594 23,925 24,257 24,752 25,264
Agriculture 5,240 5,683 6,005 5,935 5,910 5,878
Non-Agriculture 16,037 16,911 17,919 18,322 18,843 19,386
Unemployed 3,471 3,046 2,799 2,823 2,813 2,779
Employment Increase (Percent) 0.4 6.2 5.9 1.4 2.0 2.1
Agriculture 4.9 8.5 5.7 -1.2 -0.4 -0.5
Non-Agriculture -1.0 5.4 6.0 2.2 2.8 2.9
Employment Rate (Percent) 41.2 43.0 44.7 44.5 44.6 44.8
Unemployment Rate (Percent) 14.0 11.9 10.5 10.4 10.2 9.9
Within the context of these expectations, the unemployment rate is forecasted as 10.4 percent
for 2012, 10.2 percent for 2013 and 9.9 percent for 2014.
2.2.2. Inflation, Monetary and Exchange Rate Policies
The Central Bank will continue to implement inflation targeting regime in 2012, in
compliance with its main objective of achieving price stability. The ultimate target is to decrease
the inflation to Maastricht criteria levels. The Central Bank envisions a target path for inflation that
entails a gradual progress to price stability, considering the structural transformation in the Turkish
economy, the convergence process to the developed economies, and the rigidities in price setting
behavior remaining from high inflation environment. In this context, the end-year inflation targets
for 2012 and 2013 are set as 5 percent. The end-year inflation target for 2014 will be announced in
the policy document of Monetary and Exchange Rate Policy for 2012 to be published in December
2011.
Macroeconomic Outlook
28
Within the inflation targeting practice, reserve requirements and overnight interest rate
corridor in addition to the key policy instrument, i.e. one week repo interest rate, have been used as
effective monetary policy tools since the last quarter of 2010. The Central Bank, when deemed
necessary, would allow the market interest rate to divert from the policy rate and to be determined
within the interest rate corridor at a level that the Central Bank accepts to be in line with the
economic conditions.
The floating exchange rate regime will be sustained in 2012. The Central Bank has bought
26 billion dollars between August 2009 and July 2011 through pre-announced foreign exchange
buying auctions in order to provide the market with foreign exchange liquidity when needed and in
a prudent way with a view to support both price stability and financial stability. In this framework,
when unhealthy price formations are observed due to the possible loss of market depth, the Central
Bank may hold foreign exchange selling auctions, compatible with the spirit of the floating
exchange rate regime, and/or intervene directly. On the other hand, conditional on the
developments in the global economy, the Central Bank may start to act as an intermediary in the
Foreign Exchange Deposit Market in order to increase the flow of foreign exchange liquidity in
interbank FX market. The Central Bank may also start to hold foreign exchange buying auctions
depending on global conditions and the developments in the foreign exchange market.
The financial stability oriented decisions of the Central Bank since November 2010 were
mainly driven by a view to slow down the excessively rapid growth of the private sector’s foreign
liabilities and to improve the quality of these liabilities. The Central Bank places utmost
importance on the surveillance of the expected decline in the current account deficit and the
observed improvement in the quality of its financing. The Central Bank is of the opinion that the
current pace of the consumer credit growth should be further slowed down in order to sustain the
balancing of domestic and external demand. Therefore, by increasing private savings, the
correction of the current account deficit would be faster and healthier. Effective liquidity
management through interest rate corridor and reserve requirements will be the policy instruments
to contribute to financial stability in the coming period.
2.2.3. Balance of Payments
2.2.3.1. Current Account
In the recovery process after the global financial crisis, in 2010 and 2011 global growth and
especially growth in advanced economies has been quite slow, but Turkish economy has recovered
rapidly and has been among the fastest growing economies. In line with this, Turkish economy
experienced surging domestic demand and imports, while the sluggish performance of foreign
demand resulted in relatively poor export performance. Due to the discrepancy between domestic
and foreign demand performance, trade deficit and current account deficit are expected to hit 85.3
billion dollars and 71.7 billion dollars respectively at the end of 2011, after 56.4 billion dollars and
47.1 billion dollars recorded respectively in 2010.
With the slight improvement in trade partners’ growth performance in 2012-2014, export
performance is expected to significantly improve compared to 2010 and 2011. Real exports of
goods are expected to increase by 7.4 percent, 9.4 percent and 9.5 percent in 2012, 2013 and 2014
respectively. Export prices are forecasted to increase by 2.5 percent, 2 percent and 2 percent in the
same years respectively and thereby nominal exports will reach 185.1 billion dollars by the end of
2014. Despite the decline in 2009, real export growth has reached 9.1 percent annually on average
in 2002-2011 period, and this performance supports the viability of the export projections for 2012-
2014. Real exchange rate, which displayed an appreciation trend in 2002-2010 period on average,
has depreciated significantly in 2011. In 2012-2014 period, assumption of constant real exchange
rate at its levels in 2011, is expected to support export growth.
In the high growth period after 2002, due to both strong domestic demand and increasing
machinery-equipment and intermediary goods required by increasing export volume, imports
surged. This trend continued in 2010 and 2011 with the rapid increase in domestic demand. Within
this context, real import growth which was 20.8 percent in 2010 is forecasted to be 13.1 percent in
2011.

Macroeconomic Outlook
29
Economic realizations and expectations have brought future consumption and investment
demands to be pulled ahead. Thereby, imports which attained high levels is expected to record
lower growth rates in the forthcoming period. Accordingly, import growth, which recorded quite
high rates in the first half of 2011, is expected to slow down relatively in the second half of the
year. Growth elasticity of imports has been displaying a decreasing trend in Turkish economy. This
trend is expected to continue in forthcoming period and with the slowdown in GDP growth, real
import growth is expected to recede to 6 percent on average in 2012-2014 period. Real exchange
rate, which depreciated in 2011, staying at its current levels and sluggish course of oil and energy
prices with sluggish global growth performance are other factors that will support import growth
following a lower course compared to previous period. With these assumptions, goods imports are
expected to display a slight rise and reach 295.9 billion dollars in 2014.
In 2012-2014 balance on services, particularly tourism revenues, are forecasted to continue
its historical trend. Accordingly, balance on services, which is expected to realize as 19.3 billion
dollars in 2011, is forecasted to reach 26.7 billion dollars in 2014.
Trade deficit, which is forecasted as 85.3 billion dollars in 2011, is expected to decline in
2012 and by slightly increasing in 2013-2014, to attain 88.4 billion dollars level in 2014. With the
limited increase in trade deficit and improving balance on services, current account deficit to GDP
ratio is targeted to decrease to 7 percent in 2014 from 9.4 percent level in 2011.
Box 2.1: Export Oriented Production and Input Supply Strategy
Strategic goal in foreign trade towards 2023, 100th anniversary of The Republic of Turkey, is to increase
Turkey’s share in world merchandise trade and attain 500 billion dollars of exports. In this respect, through improving
new policies in the sectors subject to foreign trade, we aim to ensure sustainable growth in export, improve the
exporter’s competitiveness and increase domestic value added in tradable sectors.
To achieve these goals, all relevant political instruments must be interactive with each other, with a holistic
approach, so in this context Export Oriented Production Strategy was considered. With Export Oriented Production
Strategy, sustainable increase in exports, technological development in export oriented production, higher domestic
value added and diversification of export markets and products are aimed. Export Oriented Production Strategy
Assessment Board has undertaken an important task in this direction. In Export Oriented Production Strategy
Assessment Board that convenes under the chairmanship of the Minister of Economy, relevant ministries and public
institutions are represented by senior officials. One of the main agenda items of this committee meeting is Input Supply
Strategy (ISS), which is conducted by the Ministry of Economy.
ISS, as seen in many countries, aims at ensuring sustainability in accessing inputs that manufacturing industry
needs for production, improving competitiveness and increasing efficiency and productivity in exports. With ISS, it is
planned to minimize the risks resulted in uncertainty of global input supply, unbalances in input resources such as
country/region dependencies, uncertainties regarding the future of natural resources which are inputs and price
volatilities caused by commodity market developments. In addition to this, another important goal of the ISS is to
develop action plans that will determine and maintain the safety of input supply which will play a key role in
sustainable production of new products and new technologies in the following years and ensure that they are being
implemented using appropriate political instruments.
In this context, following the field studies about leading sectors in Turkey's exports from the perspective of input
supply, all outcomes emanated from theoretical and analytical researches have been brought to the agenda of the
Export Oriented Production Strategy Assessment Board. Also, draft action plans and reports for the specific sectors
have been prepared so far. Draft sectoral action plans are expected to be put into implementation after approval.
2.2.3.2. Capital and Financial Account
Private capital inflows to emerging market economies displayed a strong recovery in 2010.
The flow of abundant liquidity in developed countries, where effects of the crisis have been more
intensely experienced, to emerging market economies played a significant role in this development.
In addition, relative improvement in risk perception regarding emerging market economies in
parallel to their robust growth performance supported massive capital inflows to these countries. In
this period, capital flows to Turkish economy notably increased and finance account balance
excluding reserves reached its historical maximum level of 55.8 billion dollars in 2010.

Macroeconomic Outlook
30
In the first half of 2011, capital inflows to emerging market economies continued as the
course of global economy relied on strong economic performance of emerging market economies
and the pace of recovery in developed countries realized generally in line with predictions. Thus, it
was not encountered any problem regarding external financing, in spite of rising current account
deficit and rapid economic growth driven by increasing domestic consumption and investment
demand in this period. Capital inflows (financial account balance excluding reserves) which
increased drastically starting from last quarter of 2010 compared to the same period of previous
year continued this trend in the first nine months of 2011 and reached 53.8 billion dollars. Reserve
assets increased by 5.4 billion dollars during the same period.
In the third quarter of 2011, growing downside risks stemming from ongoing structural
fragilities particularly in the US and the Euro Area and major financial turbulence in the latter
paved the way to increase uncertainties in global economy. This situation has caused capital
inflows to Turkish economy to slow down through portfolio investment and other investment.
However, it is evaluated that adequate level of capital inflows would be provided with timely
macroprudential measures and expectations of upward revision in Turkey’s credit note in the
following period. Moreover, expectation that interest rates will remain at low levels in developed
countries for a long time, supports this situation. Thus, finance account balance excluding reserves
is expected to reach 62.4 billion dollars in 2011. Despite reserve accumulation in the first half of
the year, due to the foreign exchange selling auctions against TL by the Central Bank within the
surveillance of financial stability in the second half of the year, limited amount of reserve
accumulation is projected throughout the year. Considering realizations in first three quarters of
2011, net errors and omissions are expected to be an important item in financing current account
deficit in 2011 and to reach 9.6 billion dollars.
Capital flows which have been adversely affected by recent turbulence in financial markets
are expected to accelerate to developing countries in the coming period9. With its sound financial
and fiscal structure as well as the continuance of efforts to improve business environment as
specified in Medium Term Programme (2012-2014), Turkish economy is expected to demonstrate
positive divergence from other emerging market economies. In the context of Medium Term
Programme targets, capital inflows to Turkish economy are expected to realize at 65.2 billion
dollars in 2012, 67.1 billion dollars in 2013 and 66.8 billion dollars in 2014.
In Turkish economy, with its resilient and strong macroeconomic structure, direct
investments which are forecasted to realize at 13.4 billion dollars in 2011, are expected to
accelerate during the Programme period and reach 15.2 billion dollars at the end of 2014.
With its sound financial and fiscal structure, as in 2010, Turkish economy has experienced
massive portfolio inflows in first three quarters of 2011. Portfolio investments which have been
slowing down due to recent financial turmoil in global markets are expected to recover in the rest
of the year and to realize as 19.7 billion dollars in 2011. Portfolio investments are expected to
realize around 13 billion dollars in the Programme period.
Other investments, which recovered rapidly after the crisis and reached 32.1 billion dollars in
2010, are expected to realize at 31.2 billion dollars in 2011 and become the biggest financing item.
While the increase in TL deposits of foreign banks increased the liabilities of other investments in
2010, this trend reversed in 2011. However, real sector, which was net credit payer in last two
years as a result of fluctuations in international credit markets, became net user in the first three
quarters of 2011. Moreover, the upsurge in foreign credit use of banks has supported capital
inflows in this period. Other investments are expected to be the most important financing item in
the Programme period with its positive effects on domestic private investment demand and
economic growth. In this context, other investments are expected to realize as 41.3 billion dollars
in 2012, 40.8 billion dollars in 2013 and 40.3 billion dollars in 2014.
9 IMF World Economic Outlook, September 2011; IIF Capital Flows to Emerging Market Economies, September 2011.
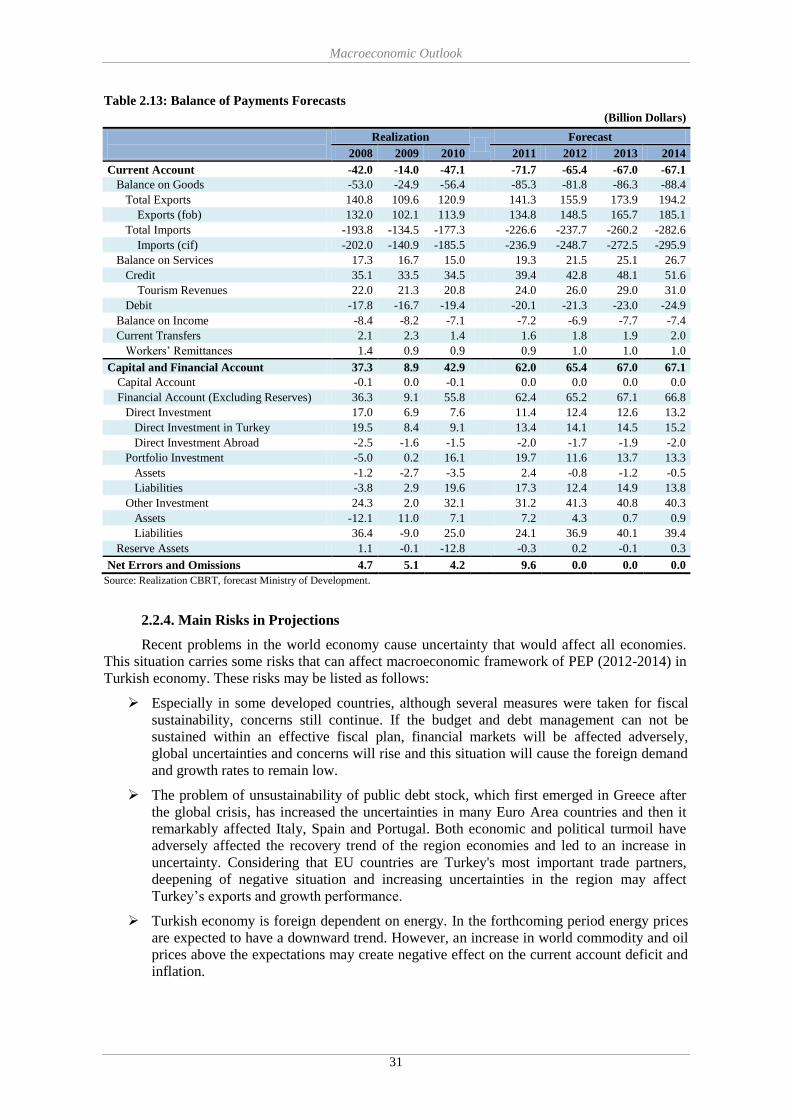
Macroeconomic Outlook
31
Table 2.13: Balance of Payments Forecasts
(Billion Dollars)
Realization
Forecast
2008 2009 2010 2011 2012 2013 2014
Current Account -42.0 -14.0 -47.1
-71.7 -65.4 -67.0 -67.1
Balance on Goods -53.0 -24.9 -56.4 -85.3 -81.8 -86.3 -88.4
Total Exports 140.8 109.6 120.9
141.3 155.9 173.9 194.2
Exports (fob) 132.0 102.1 113.9 134.8 148.5 165.7 185.1
Total Imports -193.8 -134.5 -177.3
-226.6 -237.7 -260.2 -282.6
Imports (cif) -202.0 -140.9 -185.5 -236.9 -248.7 -272.5 -295.9
Balance on Services 17.3 16.7 15.0
19.3 21.5 25.1 26.7
Credit 35.1 33.5 34.5 39.4 42.8 48.1 51.6
Tourism Revenues 22.0 21.3 20.8
24.0 26.0 29.0 31.0
Debit -17.8 -16.7 -19.4 -20.1 -21.3 -23.0 -24.9
Balance on Income -8.4 -8.2 -7.1
-7.2 -6.9 -7.7 -7.4
Current Transfers 2.1 2.3 1.4 1.6 1.8 1.9 2.0
Workers’ Remittances 1.4 0.9 0.9 0.9 1.0 1.0 1.0
Capital and Financial Account 37.3 8.9 42.9 62.0 65.4 67.0 67.1
Capital Account -0.1 0.0 -0.1 0.0 0.0 0.0 0.0
Financial Account (Excluding Reserves) 36.3 9.1 55.8 62.4 65.2 67.1 66.8
Direct Investment 17.0 6.9 7.6 11.4 12.4 12.6 13.2
Direct Investment in Turkey 19.5 8.4 9.1
13.4 14.1 14.5 15.2
Direct Investment Abroad -2.5 -1.6 -1.5 -2.0 -1.7 -1.9 -2.0
Portfolio Investment -5.0 0.2 16.1
19.7 11.6 13.7 13.3
Assets -1.2 -2.7 -3.5 2.4 -0.8 -1.2 -0.5
Liabilities -3.8 2.9 19.6
17.3 12.4 14.9 13.8
Other Investment 24.3 2.0 32.1 31.2 41.3 40.8 40.3
Assets -12.1 11.0 7.1
7.2 4.3 0.7 0.9
Liabilities 36.4 -9.0 25.0 24.1 36.9 40.1 39.4
Reserve Assets 1.1 -0.1 -12.8
-0.3 0.2 -0.1 0.3
Net Errors and Omissions 4.7 5.1 4.2 9.6 0.0 0.0 0.0
Source: Realization CBRT, forecast Ministry of Development.
2.2.4. Main Risks in Projections
Recent problems in the world economy cause uncertainty that would affect all economies.
This situation carries some risks that can affect macroeconomic framework of PEP (2012-2014) in
Turkish economy. These risks may be listed as follows:
Especially in some developed countries, although several measures were taken for fiscal
sustainability, concerns still continue. If the budget and debt management can not be
sustained within an effective fiscal plan, financial markets will be affected adversely,
global uncertainties and concerns will rise and this situation will cause the foreign demand
and growth rates to remain low.
The problem of unsustainability of public debt stock, which first emerged in Greece after
the global crisis, has increased the uncertainties in many Euro Area countries and then it
remarkably affected Italy, Spain and Portugal. Both economic and political turmoil have
adversely affected the recovery trend of the region economies and led to an increase in
uncertainty. Considering that EU countries are Turkey's most important trade partners,
deepening of negative situation and increasing uncertainties in the region may affect
Turkey’s exports and growth performance.
Turkish economy is foreign dependent on energy. In the forthcoming period energy prices
are expected to have a downward trend. However, an increase in world commodity and oil
prices above the expectations may create negative effect on the current account deficit and
inflation.
Macroeconomic Outlook
32
Recently, the political turmoil called Arab Spring in Turkey's neighbour countries and
MENA region, has emerged as a factor that increases uncertainty which negatively affects
confidence both in the region and Turkey.
Expectation that inflation will remain above the target, negatively affected expectations
and confidence in 2011. In PEP (2012-2014) period, insufficiency of the measures taken
by the Central Bank due to other factors and adverse effects of this situation on
expectations may require additional measures to achieve the inflation targets.
Strengthening credit rating of Turkish economy; which has overcome the inflation
problem, improved its fiscal structure, established a strong banking sector and thus
decreased its vulnerabilities; to investment grade in the next period, may further increase
capital inflows and its economic performance.

Public Finances
33
3. PUBLIC FINANCE
Fiscal policy will be implemented in a way that it contributes to growth process driven by
the private sector, maintaining macroeconomic stability and combat with current account deficit by
increasing the resources available for the private sector and improving public sector balances in the
medium term.
The figures presented in PEP (2012-2014) related to general government and central
government budget are prepared based on MTP (2012-2014) and 2012 Annual Program.
3.1. General Government Balance and Public Debt
General government figures which started to be generated in 1999 by SPO consists of the
institutions and organizations within the scope of central government, local administrations, social
security institutions and general health insurance, extra budgetary funds, revolving funds and
Unemployment Insurance Fund. By consolidating the expenditures and revenues of these units,
general government total expenditures, revenues and balance are obtained.
A different methodology is used while calculating the general government statistics in terms
of obtaining total expenditures and revenues, and netting of the fiscal relations among the units
included in the scope. In this context, in parallel with international standards total expenditures and
revenues are based on gross values and no netting has been made between the revenue-expenditure
items.
General principle in calculating the expenditures and the revenues of general government
units is obtained from recording transfers made from a budget classification to another budget
classification as an expenditure item in the accounts of the institutions making the transfer and as a
revenue item in the accounts of the institution receiving the transfer. Such an accounting practice
helps showing public revenue as an income item in the budget of the public institution which first
receives the flow as income while as an expenditure item in the account of the institution which
makes the final expenditure.
As a result, deficit (or surplus) figures vary as to budget classifications (or public
institutions) while total balance figures remain the same.
Box 3.1: Adjustments in General Government Balance in the Context of Fiscal Notification
Through various adjustments made in the scope of the debt stock and accounting records, general government
deficit is being harmonized with the budget deficit and debt definitions of the European Union, and every year these
are sent to the relevant units of the European Union in the form of fiscal notification tables.
While preparing fiscal notification tables;
Revenues and expenditures (duty losses of the state banks, etc.) which are defined as such in the ESA 95 rules
but not included in the budget deficit are added to the budget; and accounts which do not comply with the
definition of revenue (privatization, revenue of issuing coins, etc.) or expenditure (risk account, etc.) but
which are included in the budget are eliminated from the budget.
Revenues and expenditures, which are reported in the budget on a cash basis, are changed to the required
values on an accrual basis. The differences between the accrued and the collected amounts are corrected.
Interest expenditures on the public debt stock are calculated on an accrual basis and allocated to the year to
which they belong.
As a result of these adjustments, general government prepared for fiscal notification and general government
published by Ministry of Development differs from each other.
While preparing general government figures, within the framework of the consolidation
approach adopted;
The shares transferred to local governments and funds from the general budget tax
revenues and other transfers are cleared from the central government budget base and
displayed in the balances of local governments or funds to which they are related,
Public Finances
34
The current transfers to the social security and general health insurance system from the
central government budget are cleared from the budget expenditure base and social
security and general health insurance system are cleared from revenue base,
The amounts transferred to the central government budget from revolving funds, extra
budgetary funds and Unemployment Insurance Fund are cleared from the central
government budget revenue base and expenditure base of relevant units,
Fiscal relations among the institutional units included in the scope of general government
except for the central government budget are structured in a way to prevent double
counting.
3.1.1. Fiscal Policy Strategy and Medium Term Objectives
In medium term, without compromising fiscal discipline, the fiscal policy will be
implemented in parallel with the aims of maintaining macroeconomic stability and decreasing
current account deficit. Besides, studies on strengthening the structural side of the public financial
management system will be continued by means of continuing the regulations which will increase
transparency, accountability and effectiveness.
Within this scope, main policies to be implemented in the period of 2012-2014 are as
follows:
3.1.1.1. Revenue Policy
Stability and predictability in implementation of tax policies will be essential.
Tax policies, aimed at accelerating foreign direct investments, reducing the regional
development disparities, supporting R&D activities and creating a production structure
which increases competitiveness of the economy, will be implemented.
Works regarding the simplification of the tax legislation and rewriting in accordance
with necessities will be continued. In this context, the works about reviewing Income
Tax Law and Tax Procedure Law will be completed.
Tax policy will be used effectively in case of need in fighting with problems, specifically
with insufficient domestic savings and current account deficit, which threaten the
sustainability of growth.
The amount of tax expenditure emerged due to the exceptions, exemptions and
deductions will be reported regularly.
Works on increasing tax compliance and broadening the tax-base will be continued.
Lump-sum taxes and fees will be updated by taking the general economic environment
into account.
In the determination and implementation of tax policies, priorities concerning climate
change and energy use economizing will also be taken into account.
Measures aiming at encouraging individual and corporate savings and stimulating capital
accumulation will be taken.
Arrangements intended to raise the own revenues of local administrations will be
implemented considering the increases in the values of assets after the settlement
development and infrastructure services.
Necessary measures will be taken in order to utilize public sector owned immovable and
to use them effectively, efficiently and economically.
3.1.1.2. Expenditure Policy
More emphasis will be given on growth and employment supporting expenditures and
expenditures reducing regional development disparities. By giving priority to health,

Public Finances
35
education and social expenditures, policies aimed at improving the life quality of the
society and improving quality of human capital will continue to be pursued.
Strategic planning and performance-based budgeting, introduced in order to increase
financial transparency and accountability and strengthen decision-making processes of
public administrations, will become widespread.
Emphasis on infrastructure investments supporting the efficiency and productivity of
economy in medium and long-term will be given. Priority will be given to investments
on education, health, technological research, transportation, drinking water, and
information and communication technologies.
Spending programs will be reviewed in order to increase productivity. For this purpose,
an administrative mechanism will be established.
Program-based classification works will be started for the effective monitoring of
expenditure programs.
Public financial statistics having crucial importance in decision-making, monitoring and
evaluation process will be published in compliance with international standards.
In order to ensure efficiency in social aids, efforts to reach the real needy people will
continue and works launched in 2010 to establish connection between social aids and
employment will be accelerated.
In order to ensure efficiency in health services and expenditures, without compromising
the quality of health services, to avoid unnecessary use of drugs and health service,
medication and treatment expenditures will be rationalized.
In order to execute more effective audits on health spending, control models that consider
the past behaviors of health care providers will be developed; software, hardware and
training infrastructure will be strengthened in risk analysis and data mining.
Global budget implementation in health system will be enhanced and continued.
A fair adjustment system for retirees will be implemented gradually.
Incentive schemes for employment will be made uncomplicated and more effective.
By diversification in terms of land and product, agricultural supports will be rearranged
with the aim of increasing efficiency, productivity and quality in production.
Regulations towards increasing efficiency and transparency of public procurement
system will be implemented.
3.1.1.3. Public Borrowing Policy
Information about borrowing such as financing programs, domestic borrowing strategies
and tender announcements will continue to be announced on a regular basis.
In order to ensure balanced distribution of debt service between terms and to increase the
price efficiency in the secondary market, buy-back and switching auctions will continue
to be applied depending on market conditions.
To improve public borrowing opportunities and lower the costs, new financing
instruments and sales methods that meet the investors’ demands will be developed.
In order to reduce the liquidity risks in cash and debt management, keeping sufficient
level of reserve assets will continue.
Primary dealership system will continue to be implemented.
Borrowing will be made mainly in TL denominated and fixed rate instruments to the
extent that market conditions allow.

Public Finances
36
3.1.1.4. Public Financial Management and Audit
In order to ensure an effective external audit in the public, the implementation
infrastructure of Court of Accounts will be enhanced and auditing activities will be
expanded.
It will be ensured that internal control systems in public administrations are established
in a healthy way and internal and external audit are conducted in coordination and
effectively.
It will be ensured that the compliance level of activities of public administrations with
public internal control and audit standards will be increased.
Quantity and competency of human resources of public financial management will be
enhanced to strengthen management responsibility in public administrations.
The organizational capacity of internal audit units will be enhanced and their position in
the organizational structure of public administrations will be strengthened.
The Internal Audit Coordination Board, which functions as central harmonization unit in
the area of internal audit, will be restructured.
3.1.2. Current Situation and Medium Term Perspective
3.1.2.1. Current Situation
3.1.2.1.1. Developments in the Central Government Budget Revenues and Expenditures
Economic recovery started in the last quarter of 2009 continued strongly in 2010 and central
government budget deficit and public sector borrowing requirement to GDP ratio decreased by 1.9
percentage points and 2.8 percentage points respectively compared to the previous year and
reduced to 3.6 percent and 2.3 percent.
In 2010, the contractionary impact of global crisis on economic activity diminished and this
affected budgetary revenues positively. In 2010, central government total budget revenues raised
by 17.5 billion TL over the budget predictions and reached to 23 percent of GDP. In addition, tax
revenues and non-tax other revenues to GDP ratios were realized as 19.1 percent and 3.9 percent
respectively.
In 2010, income tax was realized 1.1 billion TL lower than the budget projections whereas
the corporate tax was above the budget projections by 3 billion TL, thus taxes on income, profits
and capital gains was realized as 5.6 percent of GDP.
Due to recovery in domestic economic activity and high increase in imports, indirect taxes
collection has been higher than the budget projections by 14.6 billion TL. Accordingly, Special
Consumption Tax, domestic VAT and VAT on imports collections have been above the projections
by 2.7 billion TL, 3.7 billion TL and 6.1 billion TL, respectively. On the other hand due to sharp
decrease in consumption, observed as a result of tax increases on tobacco products and limiting
areas of use, tax on tobacco products was realized below the budget targets by an amount of 1.6
billion TL.
As of the end of 2010, the total expenditure of central government budget was realized as
26.7 percent of GDP, while primary expenditures and interest payments were 22.3 percent and 4.4
percent of GDP, respectively.
Due to compensation given for the difference between inflation and salary rise, and
additional staff employment, total personnel expenses, composed of personnel expenses, state
premiums to social security institutions and reserve appropriations for personnel expenditure, was
realized above the budget appropriation by 1.5 billion TL.
In 2010, expenditure on purchase of goods and services was realized above the initial
appropriation by 4 billion TL. Increase in health and defense-security expenditures and some other
needs of line ministries were determinant on the aforementioned development.
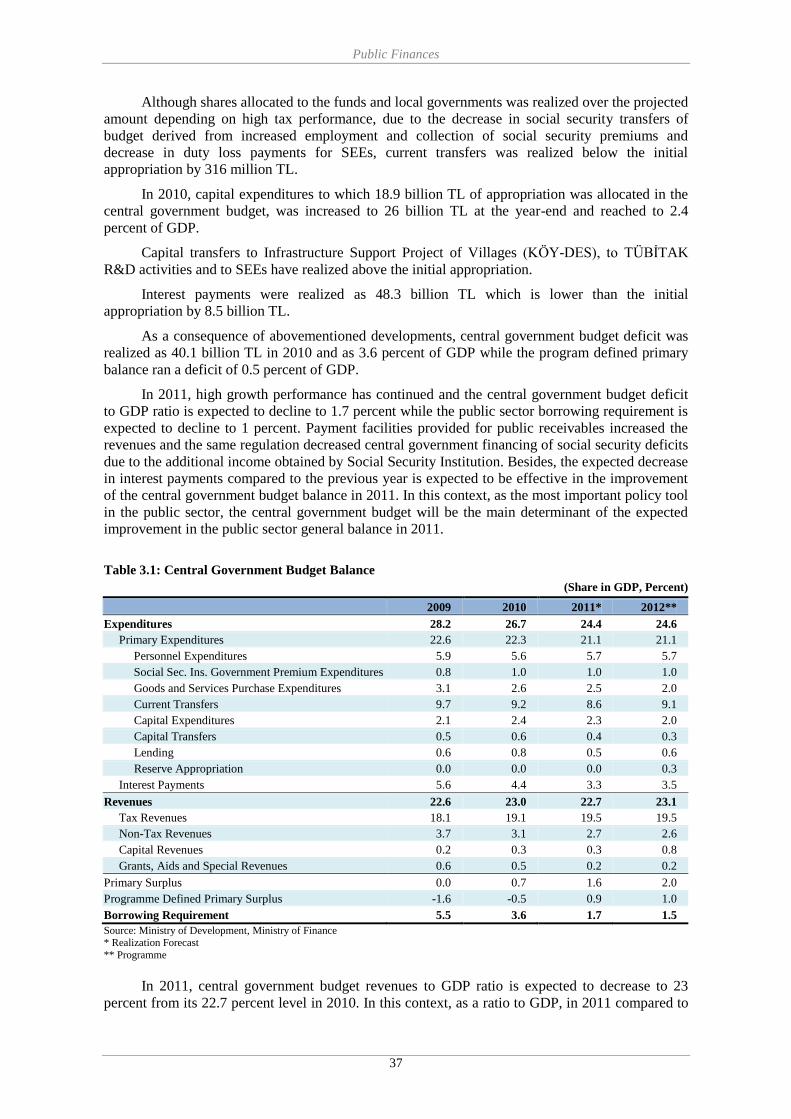
Public Finances
37
Although shares allocated to the funds and local governments was realized over the projected
amount depending on high tax performance, due to the decrease in social security transfers of
budget derived from increased employment and collection of social security premiums and
decrease in duty loss payments for SEEs, current transfers was realized below the initial
appropriation by 316 million TL.
In 2010, capital expenditures to which 18.9 billion TL of appropriation was allocated in the
central government budget, was increased to 26 billion TL at the year-end and reached to 2.4
percent of GDP.
Capital transfers to Infrastructure Support Project of Villages (KÖY-DES), to TÜBİTAK
R&D activities and to SEEs have realized above the initial appropriation.
Interest payments were realized as 48.3 billion TL which is lower than the initial
appropriation by 8.5 billion TL.
As a consequence of abovementioned developments, central government budget deficit was
realized as 40.1 billion TL in 2010 and as 3.6 percent of GDP while the program defined primary
balance ran a deficit of 0.5 percent of GDP.
In 2011, high growth performance has continued and the central government budget deficit
to GDP ratio is expected to decline to 1.7 percent while the public sector borrowing requirement is
expected to decline to 1 percent. Payment facilities provided for public receivables increased the
revenues and the same regulation decreased central government financing of social security deficits
due to the additional income obtained by Social Security Institution. Besides, the expected decrease
in interest payments compared to the previous year is expected to be effective in the improvement
of the central government budget balance in 2011. In this context, as the most important policy tool
in the public sector, the central government budget will be the main determinant of the expected
improvement in the public sector general balance in 2011.
Table 3.1: Central Government Budget Balance
(Share in GDP, Percent)
2009 2010 2011* 2012**
Expenditures 28.2 26.7 24.4 24.6
Primary Expenditures 22.6 22.3 21.1 21.1
Personnel Expenditures 5.9 5.6 5.7 5.7
Social Sec. Ins. Government Premium Expenditures 0.8 1.0 1.0 1.0
Goods and Services Purchase Expenditures 3.1 2.6 2.5 2.0
Current Transfers 9.7 9.2 8.6 9.1
Capital Expenditures 2.1 2.4 2.3 2.0
Capital Transfers 0.5 0.6 0.4 0.3
Lending 0.6 0.8 0.5 0.6
Reserve Appropriation 0.0 0.0 0.0 0.3
Interest Payments 5.6 4.4 3.3 3.5
Revenues 22.6 23.0 22.7 23.1
Tax Revenues 18.1 19.1 19.5 19.5
Non-Tax Revenues 3.7 3.1 2.7 2.6
Capital Revenues 0.2 0.3 0.3 0.8
Grants, Aids and Special Revenues 0.6 0.5 0.2 0.2
Primary Surplus 0.0 0.7 1.6 2.0
Programme Defined Primary Surplus -1.6 -0.5 0.9 1.0
Borrowing Requirement 5.5 3.6 1.7 1.5
Source: Ministry of Development, Ministry of Finance * Realization Forecast
** Programme
In 2011, central government budget revenues to GDP ratio is expected to decrease to 23
percent from its 22.7 percent level in 2010. In this context, as a ratio to GDP, in 2011 compared to

Public Finances
38
the previous year, tax revenues are expected to increase by 0.4 percentage point and reach 19.5
percent, while non-tax other revenues are expected to decrease by 0.7 percentage point and reach
3.2 percent.
With the Law No.6111 dated 13 February 2011 regarding restructuring of some overdue
receivables of the state and revising of Laws about social security and general health insurance,
important facilities were granted for the collection of accumulated receivables of the state. Within
the context of this practice, the amount of collection has been 11.7 billion TL as of end of the
October. At the end of October 2011, the amount of the collection is expected to reach 12.5 billion
TL. On the other side, estimation of 7.5 billion TL which could have been collected from the
sources covered by the Law No.6111 in 2011 even in case of not putting such a regulation in force,
is considered, net effect of the restructuring on the central government budget revenues is estimated
to be around 5 billion TL.
In addition to the revenues from the facilities granted to the some overdue state receivables
with the Law No.6111, import VAT and SCT on motor vehicles are basic factors of the foreseen
increase in tax revenues. Decline in the non-tax other revenues results from the decline in interest
revenues and special revenues.
In 2011, income tax and corporate tax collections are expected to be higher than the budget
targets by 0.3 billion TL and 3 billion TL, respectively. It is seen that revenues attained due to
restructuring are effective in rise of corporate tax collection.
It is estimated that special consumption tax collection, which constitutes approximately 25
percent of the central government tax revenues, will be higher than the 2011 budget target by 1.6
billion TL. High increase in motor vehicle sales and favorable developments in collection of
special consumption tax from tobacco products will be influential on this situation.
With the Decision of the Council of Ministers No.2011/2304 and dated 12 October 2011,
lump-sum amounts of excise tax on alcoholic beverages were increased at rates ranging from 20
percent to 23 percent. SCT rates were increased by 5 percentage points for light commercial
vehicles, 20 percentage points for passenger cars that have an engine size between 1600 cm3 and
2000 cm3, 46 points for passenger cars that have an engine size bigger than 2000 cm
3. In addition
to this, deduction rate for Resource Utilization Support Fund on imports with acceptance credit,
deferred letter of credit and cash on delivery payment methods was increased from 3 percent to 6
percent. Proportional SCT rate on mobile phones was increased to 25 percent by 5 percentage
points rise and lump-sum SCT was redetermined as 100 TL. Also, proportional SCT rate on
cigarette and minimum lump-sum SCT amount for one packet of cigarettes are specified as 65
percent and 2.9 TL, respectively.
In 2011, due to the increase in the volume of domestic economic activities, domestic value
added tax collection and revenues from stamp tax and duties are expected to be higher than the
budget targets by 3.5 billion TL and 1 billion TL, respectively. Besides this, with the impact of
high increase in imports, collection of VAT on imports is envisaged to be higher than the budget
target by 7.2 billion TL.
It is foreseen that privatization revenues will be 3 billion TL, less than the budget target of
9.5 billion TL. Non-tax other revenues excluding privatization revenues is expected to be higher
than the budget target by 1.3 billion TL.
In 2011, central government primary expenditures is expected to realize above the initial
budget appropriation by 5.5 billion TL and to be 21.1 percent of GDP by a decrease of 1.2
percentage points compared to the previous year. Interest payments to GDP ratio, which was 4.4
percent in 2010, is estimated to decrease by 0.6 percentage point with respect to the initial
appropriation and to be 3.3 percent. Thus, the total expenditure of central government budget is
estimated to be above the initial appropriation by 599 million TL and realize as 24.4 percent of
GDP.
In 2011 budget, 85.6 billion TL of appropriation was allocated to total personnel expenses,
of which 72.3 billion TL belongs to personnel expenses, 12.7 billion TL belongs to state premiums
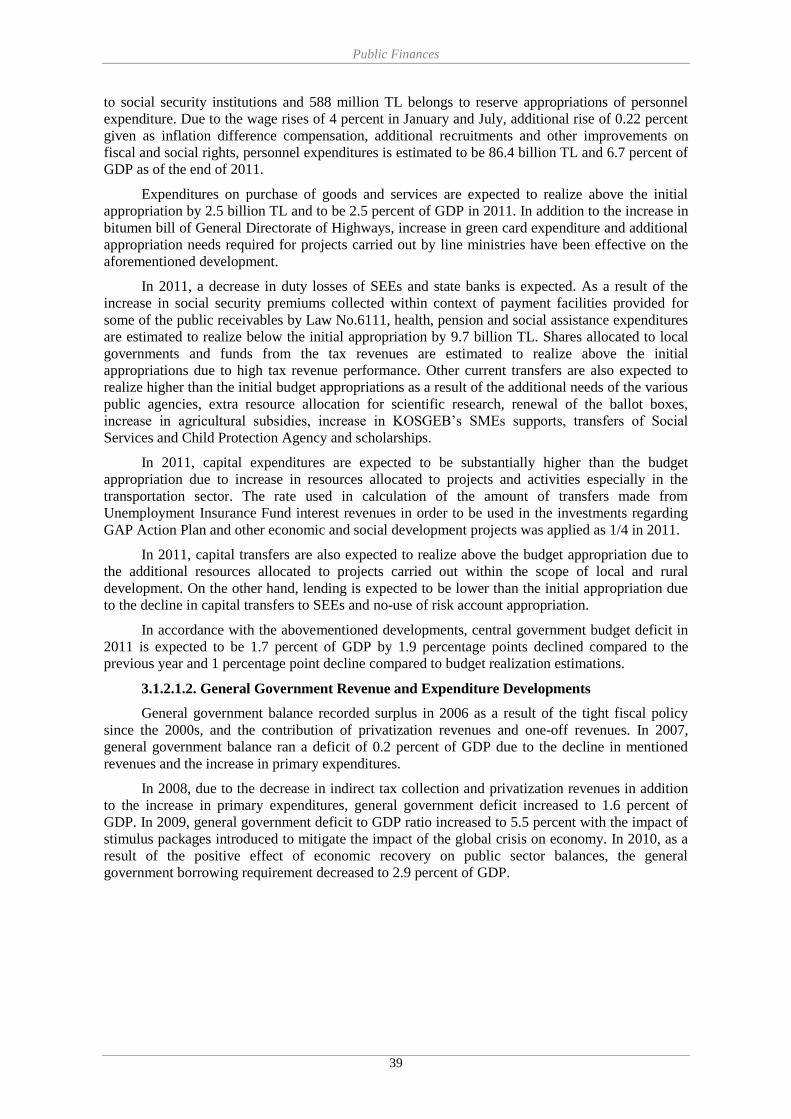
Public Finances
39
to social security institutions and 588 million TL belongs to reserve appropriations of personnel
expenditure. Due to the wage rises of 4 percent in January and July, additional rise of 0.22 percent
given as inflation difference compensation, additional recruitments and other improvements on
fiscal and social rights, personnel expenditures is estimated to be 86.4 billion TL and 6.7 percent of
GDP as of the end of 2011.
Expenditures on purchase of goods and services are expected to realize above the initial
appropriation by 2.5 billion TL and to be 2.5 percent of GDP in 2011. In addition to the increase in
bitumen bill of General Directorate of Highways, increase in green card expenditure and additional
appropriation needs required for projects carried out by line ministries have been effective on the
aforementioned development.
In 2011, a decrease in duty losses of SEEs and state banks is expected. As a result of the
increase in social security premiums collected within context of payment facilities provided for
some of the public receivables by Law No.6111, health, pension and social assistance expenditures
are estimated to realize below the initial appropriation by 9.7 billion TL. Shares allocated to local
governments and funds from the tax revenues are estimated to realize above the initial
appropriations due to high tax revenue performance. Other current transfers are also expected to
realize higher than the initial budget appropriations as a result of the additional needs of the various
public agencies, extra resource allocation for scientific research, renewal of the ballot boxes,
increase in agricultural subsidies, increase in KOSGEB’s SMEs supports, transfers of Social
Services and Child Protection Agency and scholarships.
In 2011, capital expenditures are expected to be substantially higher than the budget
appropriation due to increase in resources allocated to projects and activities especially in the
transportation sector. The rate used in calculation of the amount of transfers made from
Unemployment Insurance Fund interest revenues in order to be used in the investments regarding
GAP Action Plan and other economic and social development projects was applied as 1/4 in 2011.
In 2011, capital transfers are also expected to realize above the budget appropriation due to
the additional resources allocated to projects carried out within the scope of local and rural
development. On the other hand, lending is expected to be lower than the initial appropriation due
to the decline in capital transfers to SEEs and no-use of risk account appropriation.
In accordance with the abovementioned developments, central government budget deficit in
2011 is expected to be 1.7 percent of GDP by 1.9 percentage points declined compared to the
previous year and 1 percentage point decline compared to budget realization estimations.
3.1.2.1.2. General Government Revenue and Expenditure Developments
General government balance recorded surplus in 2006 as a result of the tight fiscal policy
since the 2000s, and the contribution of privatization revenues and one-off revenues. In 2007,
general government balance ran a deficit of 0.2 percent of GDP due to the decline in mentioned
revenues and the increase in primary expenditures.
In 2008, due to the decrease in indirect tax collection and privatization revenues in addition
to the increase in primary expenditures, general government deficit increased to 1.6 percent of
GDP. In 2009, general government deficit to GDP ratio increased to 5.5 percent with the impact of
stimulus packages introduced to mitigate the impact of the global crisis on economy. In 2010, as a
result of the positive effect of economic recovery on public sector balances, the general
government borrowing requirement decreased to 2.9 percent of GDP.
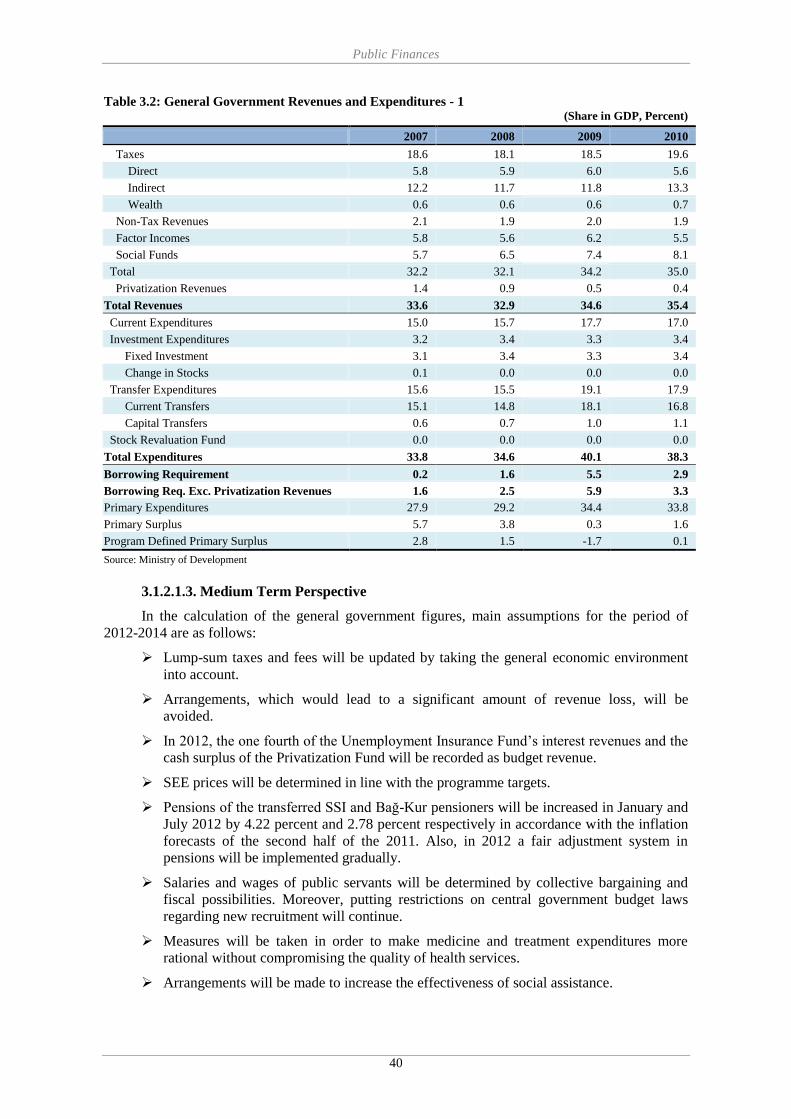
Public Finances
40
Table 3.2: General Government Revenues and Expenditures - 1 (Share in GDP, Percent)
2007 2008 2009 2010
Taxes 18.6 18.1 18.5 19.6
Direct 5.8 5.9 6.0 5.6
Indirect 12.2 11.7 11.8 13.3
Wealth 0.6 0.6 0.6 0.7
Non-Tax Revenues 2.1 1.9 2.0 1.9
Factor Incomes 5.8 5.6 6.2 5.5
Social Funds 5.7 6.5 7.4 8.1
Total 32.2 32.1 34.2 35.0
Privatization Revenues 1.4 0.9 0.5 0.4
Total Revenues 33.6 32.9 34.6 35.4
Current Expenditures 15.0 15.7 17.7 17.0
Investment Expenditures 3.2 3.4 3.3 3.4
Fixed Investment 3.1 3.4 3.3 3.4
Change in Stocks 0.1 0.0 0.0 0.0
Transfer Expenditures 15.6 15.5 19.1 17.9
Current Transfers 15.1 14.8 18.1 16.8
Capital Transfers 0.6 0.7 1.0 1.1
Stock Revaluation Fund 0.0 0.0 0.0 0.0
Total Expenditures 33.8 34.6 40.1 38.3
Borrowing Requirement 0.2 1.6 5.5 2.9
Borrowing Req. Exc. Privatization Revenues 1.6 2.5 5.9 3.3
Primary Expenditures 27.9 29.2 34.4 33.8
Primary Surplus 5.7 3.8 0.3 1.6
Program Defined Primary Surplus 2.8 1.5 -1.7 0.1
Source: Ministry of Development
3.1.2.1.3. Medium Term Perspective
In the calculation of the general government figures, main assumptions for the period of
2012-2014 are as follows:
Lump-sum taxes and fees will be updated by taking the general economic environment
into account.
Arrangements, which would lead to a significant amount of revenue loss, will be
avoided.
In 2012, the one fourth of the Unemployment Insurance Fund’s interest revenues and the
cash surplus of the Privatization Fund will be recorded as budget revenue.
SEE prices will be determined in line with the programme targets.
Pensions of the transferred SSI and Bağ-Kur pensioners will be increased in January and
July 2012 by 4.22 percent and 2.78 percent respectively in accordance with the inflation
forecasts of the second half of the 2011. Also, in 2012 a fair adjustment system in
pensions will be implemented gradually.
Salaries and wages of public servants will be determined by collective bargaining and
fiscal possibilities. Moreover, putting restrictions on central government budget laws
regarding new recruitment will continue.
Measures will be taken in order to make medicine and treatment expenditures more
rational without compromising the quality of health services.
Arrangements will be made to increase the effectiveness of social assistance.
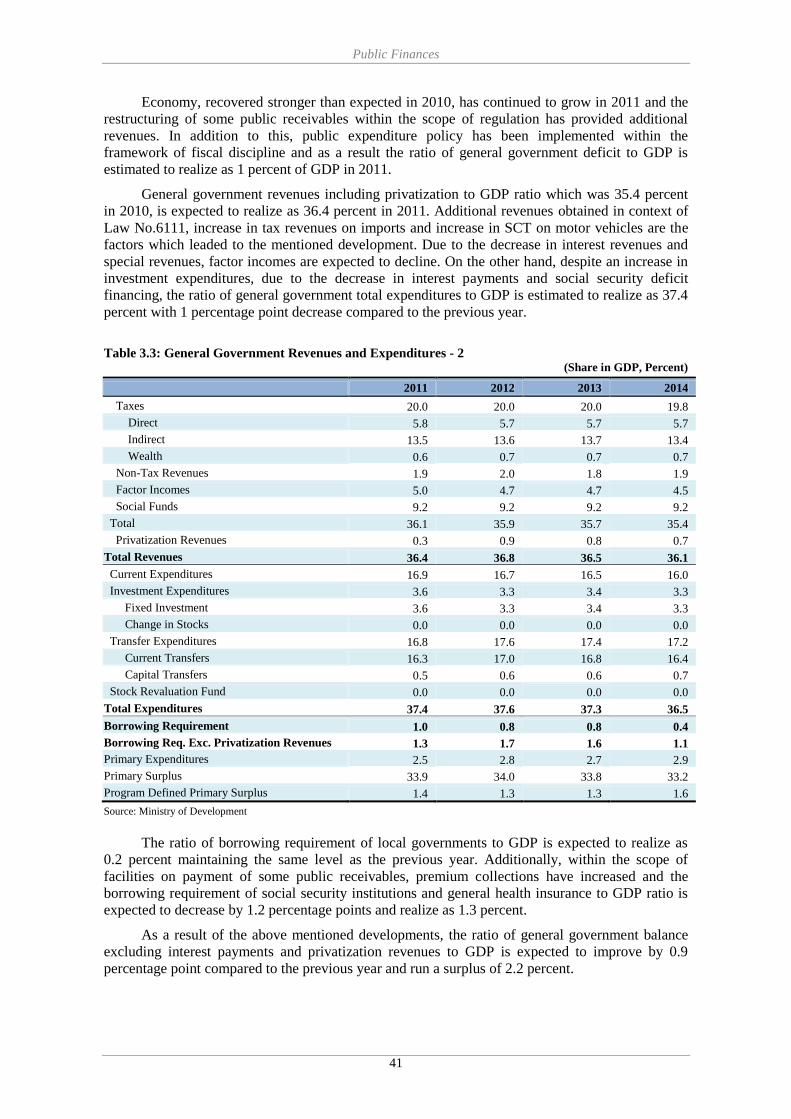
Public Finances
41
Economy, recovered stronger than expected in 2010, has continued to grow in 2011 and the
restructuring of some public receivables within the scope of regulation has provided additional
revenues. In addition to this, public expenditure policy has been implemented within the
framework of fiscal discipline and as a result the ratio of general government deficit to GDP is
estimated to realize as 1 percent of GDP in 2011.
General government revenues including privatization to GDP ratio which was 35.4 percent
in 2010, is expected to realize as 36.4 percent in 2011. Additional revenues obtained in context of
Law No.6111, increase in tax revenues on imports and increase in SCT on motor vehicles are the
factors which leaded to the mentioned development. Due to the decrease in interest revenues and
special revenues, factor incomes are expected to decline. On the other hand, despite an increase in
investment expenditures, due to the decrease in interest payments and social security deficit
financing, the ratio of general government total expenditures to GDP is estimated to realize as 37.4
percent with 1 percentage point decrease compared to the previous year.
Table 3.3: General Government Revenues and Expenditures - 2
(Share in GDP, Percent)
2011 2012 2013 2014
Taxes 20.0 20.0 20.0 19.8
Direct 5.8 5.7 5.7 5.7
Indirect 13.5 13.6 13.7 13.4
Wealth 0.6 0.7 0.7 0.7
Non-Tax Revenues 1.9 2.0 1.8 1.9
Factor Incomes 5.0 4.7 4.7 4.5
Social Funds 9.2 9.2 9.2 9.2
Total 36.1 35.9 35.7 35.4
Privatization Revenues 0.3 0.9 0.8 0.7
Total Revenues 36.4 36.8 36.5 36.1
Current Expenditures 16.9 16.7 16.5 16.0
Investment Expenditures 3.6 3.3 3.4 3.3
Fixed Investment 3.6 3.3 3.4 3.3
Change in Stocks 0.0 0.0 0.0 0.0
Transfer Expenditures 16.8 17.6 17.4 17.2
Current Transfers 16.3 17.0 16.8 16.4
Capital Transfers 0.5 0.6 0.6 0.7
Stock Revaluation Fund 0.0 0.0 0.0 0.0
Total Expenditures 37.4 37.6 37.3 36.5
Borrowing Requirement 1.0 0.8 0.8 0.4
Borrowing Req. Exc. Privatization Revenues 1.3 1.7 1.6 1.1
Primary Expenditures 2.5 2.8 2.7 2.9
Primary Surplus 33.9 34.0 33.8 33.2
Program Defined Primary Surplus 1.4 1.3 1.3 1.6
Source: Ministry of Development
The ratio of borrowing requirement of local governments to GDP is expected to realize as
0.2 percent maintaining the same level as the previous year. Additionally, within the scope of
facilities on payment of some public receivables, premium collections have increased and the
borrowing requirement of social security institutions and general health insurance to GDP ratio is
expected to decrease by 1.2 percentage points and realize as 1.3 percent.
As a result of the above mentioned developments, the ratio of general government balance
excluding interest payments and privatization revenues to GDP is expected to improve by 0.9
percentage point compared to the previous year and run a surplus of 2.2 percent.
Public Finances
42
General government tax revenues to GDP ratio is estimated to be 20 percent in 2012,
maintaining the same level as the previous year. As a ratio to GDP, direct taxes, indirect taxes and
wealth taxes will realize as 5.7 percent, 13.6 percent and 0.7 percent, respectively.
Social funds, which is the sum of premium collections obtained from private sector and
public sector for the purpose of financing social security system, is estimated to maintain its
previous year’s level and realize as 9.2 percent as a ratio to GDP in 2012. The ratio of general
government non-tax revenues to GDP is expected to improve by 0.1 percentage point and the ratio
of general government factor incomes to GDP is expected to decrease by 0.2 percentage point in
2012 compared to the previous year. The forecast that Treasury portfolio and participation
revenues, and enterprise and property revenues will fall compared to 2011 was mainly effective on
this situation.
In 2012, general government revenues excluding privatization revenues is estimated to
decrease by 0.1 percentage points and decline to 35.9 percent of GDP while privatization revenues
is estimated to increase by 0.5 percentage point and realize as 0.9 percent of the GDP with the
effect of privatization program which includes particularly energy sector privatizations. In this
context, general government total revenues are expected to reach 36.8 percent of GDP in 2012.
The ratio of general government primary expenditures to GDP is expected to increase by 0.1
percentage point compared to the previous year and realize as 34 percent in 2012. The increase in
financing of social security deficits which has decreased in 2011 as a result of additional revenues
obtained in context of restructuring plays an important role in the abovementioned development.
Moreover, the ratio of interest payments to GDP is expected to increase by 0.2 percentage point
compared to the previous year and realize as 3.6 percent. Thus, the ratio of general government
total expenditures to GDP is estimated to realize as 37.6 percent with 0.3 percentage point increase
compared to the previous year.
As a result of the developments, the ratio of general government deficit to GDP is projected
to decrease to 0.8 percent in 2012. Additionally, the ratio of general government surplus excluding
interest payments and privatization revenues which is expected to realize as 2.2 percent in 2011, is
estimated to be 1.9 percent in 2012.
As a result of the implementation of revenue and expenditure policies within the framework
of fiscal discipline, the ratio of general government deficit to GDP, which is expected to realize as
0.8 percent in 2012, is expected to decrease to 0.4 percent at the end of 2014. Moreover, general
government balance excluding interest payments and privatization revenues is expected to give a
surplus of 2.2 percent as a ratio to GDP at the end of 2014.
3.1.3. Structural and Cyclical General Government Balance
Structural general government balance was obtained with consolidation of the balances of
central government budget, local administrations, social security institutions, general health-care
insurance, extra-budgetary funds, revolving funds and unemployment insurance fund. Unlike PEP
2010, while determining structural revenues, the sensitivity of indirect taxes to cyclical
developments is calculated by taking the relationship between consumption and potential private
consumption (CP/C) instead of the relationship between GDP and potential GDP (Y
P/Y) into
consideration (Box 3.2).
In PEP 2011, unlike general government balance analyzed in public finance chapter, actual
general government balance does not cover the privatization revenues and one-off revenues.
Revenues and expenditures of the actual general government balance also cover temporary effects
resulted from economic fluctuations. Structural general government balance reflects the revenue
and expenditure levels that would be under the assumption that economy was operating at potential
level.
In 2009, recovery packages were put into implementation in order to mitigate the adverse
effects of the global crisis and several measures were taken to increase the domestic demand and
production. With this regard, additional increases in some expenditure items, tax cuts for
recovering demand and similar implementations significantly increased the actual general

Public Finances
43
government borrowing requirement. Effects of the implemented expansionary fiscal policy were
also observed on the structural borrowing requirement. On the other hand, significant contraction in
economic activities in 2009 caused larger deterioration in the actual borrowing requirement. As a
matter of fact, 2.6 percentage points of 3.5 percentage points deterioration in the actual general
government deficit is resulted from cyclical movements.
Tablo 3.4: General Government Balance Analysis 1
Output
Gap
(Y/Yp) 2
General Government Balance /
GDP
Primary General Government
Balance / GDP Cyclical
Balance /
GDP Actual Balance
Structural
Balance 3 Actual Balance
Structural
Balance 3
1999 -1.57 -9.99 -9.57 1.25 1.49 -0.26
2000 1.46 -9.87 -10.32 3.17 2.91 0.29
2001 -7.80 -12.63 -9.48 4.91 6.69 -2.34
2002 -5.91 -11.78 -9.17 3.49 5.19 -2.03
2003 -5.04 -8.37 -6.70 4.93 5.92 -1.31
2004 -0.61 -4.44 -4.50 5.89 5.78 0.08
2005 3.03 -0.77 -1.81 6.40 5.58 0.99
2006 5.35 -0.39 -1.95 5.75 4.52 1.46
2007 5.55 -1.71 -3.48 4.16 2.71 1.59
2008 1.77 -2.50 -3.04 2.92 2.47 0.49
2009 -7.21 -5.99 -3.59 -0.26 1.72 -2.11
2010 -3.14 -3.28 -2.30 1.23 2.06 -0.90
2011 -0.33 -2.07 -2.04 1.38 1.41 -0.03
2012 -0.78 -1.99 -1.77 1.66 1.85 -0.21
2013 -0.23 -1.72 -1.61 1.78 1.88 -0.10
2014 0.41 -1.13 -1.17 2.15 2.13 0.03
(1) It refers to balance excluded public claims reconstruction, privatization and one-off revenues.
(2) Percentage difference from potential. (3) Structural balance is ratio of potential GDP.
As from last quarter of 2009, strong implementation of the measures taken to enhance fiscal
discipline and the impacts of the recovery trend in the economy affected balances positively as of
2010. Analyzing Table 3.4, it is observed that the ratio of structural general government deficit to
potential GDP, which has displayed a downward trend in 2010, decreased by 1.3 percentage points
compared to 2009. Increase on structural revenues of the central government budget, local
administrations and social security institutions were the main determinant on this decrease.
As a result of strong economic recovery, the improvement on actual general government
deficit became more significant and its ratio to GDP decreased by 2.7 percentage points in 2010
compared to 2009. The increases in the revenues of the central government budget and social
security institutions and the decreases in the expenditures of the revolving funds, local
administrations and central government budget, especially good and services purchases and interest
payments, were effective on this improvement of actual general government deficit.
In 2011, in addition to fiscal adjustments made by considering the economic environment,
the decline in budget interest expenditures and increase in economic activity led to a decrease in the
actual budget deficit and thus actual general government deficit. As a result of these developments,
in 2011, the ratio of actual general government deficit to GDP decreased by 1.2 percentage points
compared to 2010. On the other hand, decrease in the ratio of structural general government deficit
to potential GDP was limited by 0.3 percentage point. The decrease in actual general government
deficit was resulted from increases in social security revenues and decreases in budget
expenditures, mainly decreases in domestic capital transfers, domestic lending and interest
payments. Similar to the situation of actual deficit, increases in social security revenues and
decreases in central government budget expenditures were also effective on the decline of the
structural general government deficit.
The actual and structural general government deficits, which have started to display
downward trend as of 2010, are expected to decrease further, with the additional measures taken, in
the period of 2012-2014. This expected improvement in structural balance is resulted from the
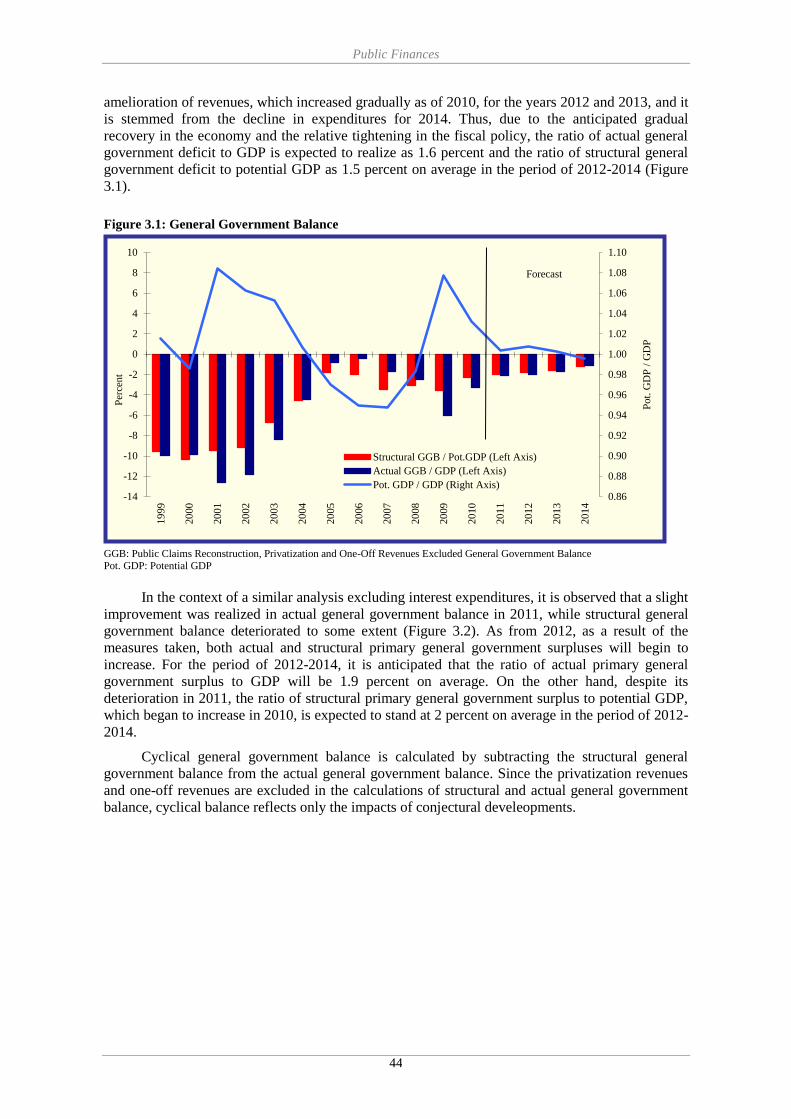
Public Finances
44
amelioration of revenues, which increased gradually as of 2010, for the years 2012 and 2013, and it
is stemmed from the decline in expenditures for 2014. Thus, due to the anticipated gradual
recovery in the economy and the relative tightening in the fiscal policy, the ratio of actual general
government deficit to GDP is expected to realize as 1.6 percent and the ratio of structural general
government deficit to potential GDP as 1.5 percent on average in the period of 2012-2014 (Figure
3.1).
Figure 3.1: General Government Balance
GGB: Public Claims Reconstruction, Privatization and One-Off Revenues Excluded General Government Balance Pot. GDP: Potential GDP
In the context of a similar analysis excluding interest expenditures, it is observed that a slight
improvement was realized in actual general government balance in 2011, while structural general
government balance deteriorated to some extent (Figure 3.2). As from 2012, as a result of the
measures taken, both actual and structural primary general government surpluses will begin to
increase. For the period of 2012-2014, it is anticipated that the ratio of actual primary general
government surplus to GDP will be 1.9 percent on average. On the other hand, despite its
deterioration in 2011, the ratio of structural primary general government surplus to potential GDP,
which began to increase in 2010, is expected to stand at 2 percent on average in the period of 2012-
2014.
Cyclical general government balance is calculated by subtracting the structural general
government balance from the actual general government balance. Since the privatization revenues
and one-off revenues are excluded in the calculations of structural and actual general government
balance, cyclical balance reflects only the impacts of conjectural develeopments.
0.86
0.88
0.90
0.92
0.94
0.96
0.98
1.00
1.02
1.04
1.06
1.08
1.10
-14
-12
-10
-8
-6
-4
-2
0
2
4
6
8
10
19
99
20
00
20
01
20
02
20
03
20
04
20
05
20
06
20
07
20
08
20
09
20
10
20
11
20
12
20
13
20
14
Pot.
GD
P /
GD
P
Per
cen
t
Structural GGB / Pot.GDP (Left Axis)
Actual GGB / GDP (Left Axis)
Pot. GDP / GDP (Right Axis)
Forecast

Public Finances
45
Figure 3.2: Primary General Government Balance
PGGB: Primary General Government Balance Pot. GDP: Potential GDP
The cyclical effect is estimated to decline as from 2009 where it was substantially high as a
consequence of the divergence of GDP from its potential. Especially during the PEP period, the
cyclical general government effect is forecasted to decline remarkably together with the expected
economic recovery (Figure 3.3).
Figure 3.3: Cyclical General Government Balance
GGB: General Government Balance
Pot. GDP: Potential GDP
0.91
0.94
0.97
1.00
1.03
1.06
1.09
1.12
-6
-4
-2
0
2
4
6
8
19
99
20
00
20
01
20
02
20
03
20
04
20
05
20
06
20
07
20
08
20
09
20
10
20
11
20
12
20
13
20
14
Pot.
GD
P /
GD
P
Per
cen
t
Structural PGGB / Pot.GDP (Left Axis)
Actual PGGB / GDP (Left Axis)
Pot. GDP / GDP (Right Axis)
Forecast
0.91
0.94
0.97
1.00
1.03
1.06
1.09
1.12
-3
-2
-1
0
1
2
3
4
19
99
20
00
20
01
20
02
20
03
20
04
20
05
20
06
20
07
20
08
20
09
20
10
20
11
20
12
20
13
20
14
Pot.
GD
P /
GD
P
Per
cen
t
Cyclical GGB / GDP (Left Axis)
Pot. GDP / GDP (Right Axis) Forecast
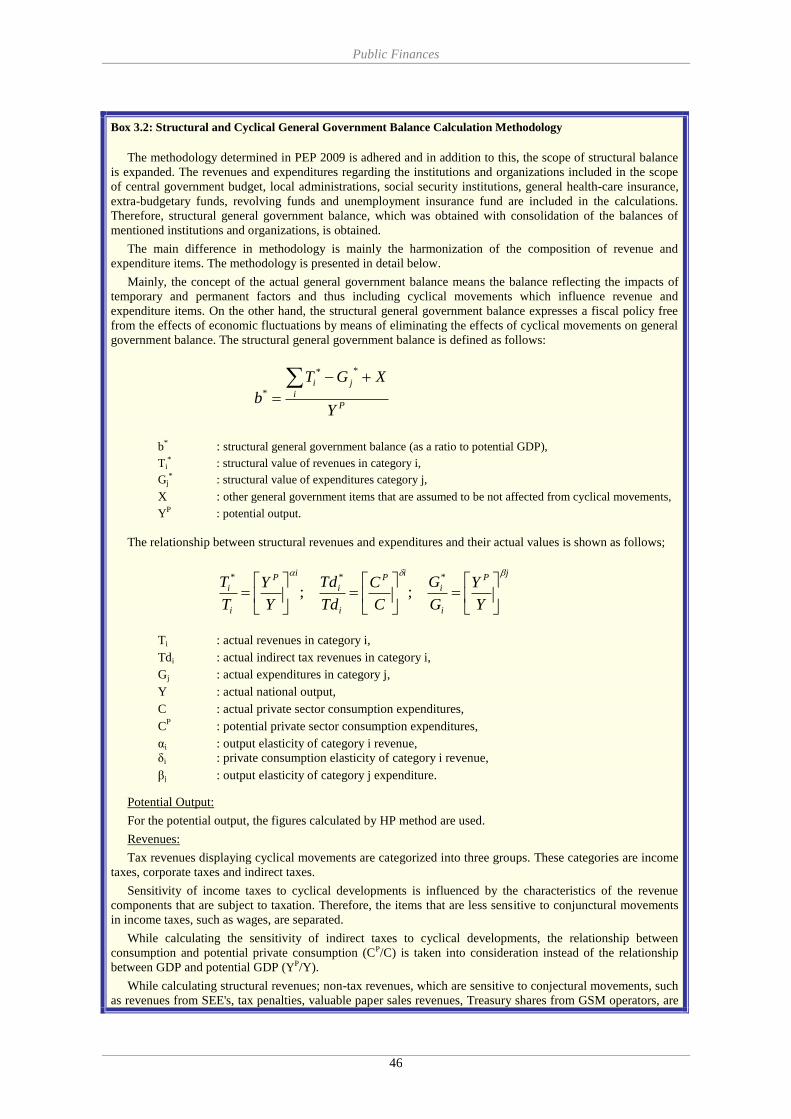
Public Finances
46
Box 3.2: Structural and Cyclical General Government Balance Calculation Methodology
The methodology determined in PEP 2009 is adhered and in addition to this, the scope of structural balance
is expanded. The revenues and expenditures regarding the institutions and organizations included in the scope
of central government budget, local administrations, social security institutions, general health-care insurance,
extra-budgetary funds, revolving funds and unemployment insurance fund are included in the calculations.
Therefore, structural general government balance, which was obtained with consolidation of the balances of
mentioned institutions and organizations, is obtained.
The main difference in methodology is mainly the harmonization of the composition of revenue and
expenditure items. The methodology is presented in detail below.
Mainly, the concept of the actual general government balance means the balance reflecting the impacts of
temporary and permanent factors and thus including cyclical movements which influence revenue and
expenditure items. On the other hand, the structural general government balance expresses a fiscal policy free
from the effects of economic fluctuations by means of eliminating the effects of cyclical movements on general
government balance. The structural general government balance is defined as follows:
P
i
ji
Y
XGT
b
**
*
b* : structural general government balance (as a ratio to potential GDP),
Ti* : structural value of revenues in category i,
Gj* : structural value of expenditures category j,
X : other general government items that are assumed to be not affected from cyclical movements,
YP : potential output.
The relationship between structural revenues and expenditures and their actual values is shown as follows;
jP
i
i
iP
i
i
iP
i
i
Y
Y
G
G
C
C
Td
Td
Y
Y
T
T
***
;;
Ti : actual revenues in category i,
Tdi : actual indirect tax revenues in category i,
Gj : actual expenditures in category j,
Y : actual national output,
C : actual private sector consumption expenditures,
CP : potential private sector consumption expenditures,
αi : output elasticity of category i revenue,
δi : private consumption elasticity of category i revenue,
βj : output elasticity of category j expenditure.
Potential Output:
For the potential output, the figures calculated by HP method are used.
Revenues:
Tax revenues displaying cyclical movements are categorized into three groups. These categories are income
taxes, corporate taxes and indirect taxes.
Sensitivity of income taxes to cyclical developments is influenced by the characteristics of the revenue
components that are subject to taxation. Therefore, the items that are less sensitive to conjunctural movements
in income taxes, such as wages, are separated.
While calculating the sensitivity of indirect taxes to cyclical developments, the relationship between
consumption and potential private consumption (CP/C) is taken into consideration instead of the relationship
between GDP and potential GDP (YP/Y).
While calculating structural revenues; non-tax revenues, which are sensitive to conjectural movements, such
as revenues from SEE's, tax penalties, valuable paper sales revenues, Treasury shares from GSM operators, are
Public Finances
47
accepted sensitive to economic developments.
The wealth taxes, which are less sensitive to economic developments, are considered insensitive to
conjuncture.
Whole of the tax revenues of funds are considered sensitive to conjuncture. While making income tax,
corporate tax and indirect tax allocation, the transfers made from the general budget are considered.
While determining sensitivity of tax revenues of local administrations to economic developments, the items
which are less affected by conjunctural developments, especially the property tax item, are sorted. A major part
of tax revenues are considered as sensitive to conjuncture although they vary according to years. A large part of
indirect taxes are considered as insensitive to economic developments and the taxes included in the structural
balance account and affected by conjuncture are shown as indirect taxes.
Whole of the revolving funds tax revenues are considered as sensitive to conjuncture.
A small part of non-tax revenues of local administrations which mostly include performance of duties given
by the law are considered as sensitive to conjunctural developments.
Only 10 percent of revolving funds factor revenues; and as changing by years, 10 to 20 percent of local
administrations are considered as sensitive to conjunctural developments. Since a major part of property
incomes in local administrations covers natural monopoly service, it is considered as less sensitive to
conjunctural developments.
In social security balance, the whole of social funds other than pension fund premium revenues and the
whole of premium revenues of unemployment insurance are considered as sensitive to conjuncture.
In unemployment insurance balance, the interest revenues are considered as sensitive, and other factor
revenues are considered as insensitive to conjuncture.
One-off revenues, such as privatization, are not included in actual and structural balance calculations.
In revenue elasticity calculations, the elasticity of indirect taxes is assumed to be unity. On the other hand,
elasticities of other revenue items are estimated by ordinary least squares method.
Expenditures:
Budget expenditures are classified into two categories in terms of their sensitivity to cyclical movements as
sensitive and insensitive. The expenditures sensitive to cyclical movements include the items such as green card
payments, duty losses, aome parts of agricultural subsidies and risk account. On the other hand, the insensitive
expenditures include items such as investment, personnel, capital transfers and interest expenditures items.
The items such as transfers to household which are included in the transfer expenditures of local
administrations and capital increases of companies are considered as sensitive to conjunctural developments.
The fact that the urban infrastructure need is continuous and extensive shows that the increases in
investment expenditures of local administrations depend on financing opportunities rather than being sensitive
to economic developments. Therefore, only one fourth of investment expenditures are considered as sensitive to
conjunctural developments in parallel with the increase in income.
Although it changes by years, a small part of the current expenditures of local administrations other than
personnel expenditures are considered as sensitive to conjunctural developments.
In unemployment insurance balance, the education expenditures are considered sensitive and the current
expenditures other than education expenditures are considered as insensitive to conjuncture.
Whole of the transfer expenditures of unemployment insurance, especially the insurance payments, is
considered as sensitive to conjuncture.
In fund balance, a large part of the transfers made by the Social Aid and Solidarity Promotion Fund is
considered as sensitive and remaining current transfers are considered as insensitive.
Calculations are made by considering the expenditures of social security institutions and revolving funds
insensitive to conjunctural developments.
Income elasticity of expenditures, which are sensitive to cyclical movements are calculated using ordinary
least squares method.
Cyclical General Government Balance:
The difference between actual general government balance and structural general government balance is
defined as cyclical general government balance:
*** bbb
b**
: cyclical general government balance (as a ratio to GDP),
b : actual general government balance (as a ratio to GDP),
b*
: structural general government balance (as a ratio to potential GDP).

Public Finances
48
3.1.4. Public Debt Management
3.1.4.1. Institutional Responsibilities for Debt Management and Borrowing Limits
The Undersecretariat of Treasury executes debt management in line with the borrowing limit
determined pursuant to the Article 5 of the Law No.4749 on Regulating Public Finance and Debt
Management, enacted in April 2002.
This Law establishes the principles of public debt and risk management as follows:
To follow a sustainable, transparent and accountable debt management policy in line
with monetary and fiscal policies by considering macroeconomic balances,
To meet financing need at the lowest possible cost in medium and long term, in
accordance with the reasonable risk level determined considering cost factors, domestic
and foreign market conditions.
Net borrowing limit is described as the amount of difference between the initial budget
appropriations and estimated revenues specified in the budget law of the relevant fiscal year. In line
with the same article of the Law, this limit could be increased up to 5 percent within the year by
considering the needs and developments in debt management. In the cases where such amount is
not sufficient, an additional increase of five percent may be made only by Cabinet Decree upon the
view of the Undersecretariat of Treasury and offer of the Ministry to which the Undersecretariat of
Treasury is affiliated.
Since 2002, works have been made in the areas of market, credit and operational risk
management in order to manage the assets and liabilities of Treasury effectively and to take
necessary measures by determining the risks that may occur in time accurately10
.
In the context of operational risk management, by analyzing the likelihood and the impact
levels of the possible risks to be encountered within the scope of debt management, the critical
business processes for the establishment of internal control have been determined and the various
emergency scenarios and new studies to ensure business continuity have been carried out.
With the aim of improving the efficiency and functionality of these studies, Internet based
Operational Risk Management Information System (ORMIS) is used in order to monitor the
incident reports where the records concerning the risks encountered in daily implementations were
included and to assist dynamic assessment of risks.
Additionally, a workshop on Business Process Management for Internal Control in Debt
Management Office, supported by TAIEX (Technical Assistance Information Exchange
Instrument), an EU foundation, was organized in Ankara on 26-29 September 2011. In this
workshop, contribution to studies in Treasury was obtained from sharing the experiences of UK
and France on internal control and business processes management.
3.1.4.2. Debt Management Strategy
Within the scope of accountable, transparent and sustainable borrowing policies which are
compatible with the monetary and fiscal policies, ensuring the optimal cost target in the medium
and long term at a reasonable risk level, strategic benchmarking policy has been continued since
2003. Depending on the cost and risk calculations, to manage the public debt efficiently against the
main risks of liquidity, exchange rates and interest, the following measures have been taken as the
main pillars of the borrowing policy in 2011:
To make domestic cash borrowing mainly in TL,
To use fixed interest rate instruments for TL borrowings in order to reduce the share of
debt of which interest rate will be renewed in the next 12 months,
10 Detailed information on the analyses within the framework of market and credit risk management is available in the Annual Public Debt Management Reports of Turkish Treasury for years 2008 and 2009.
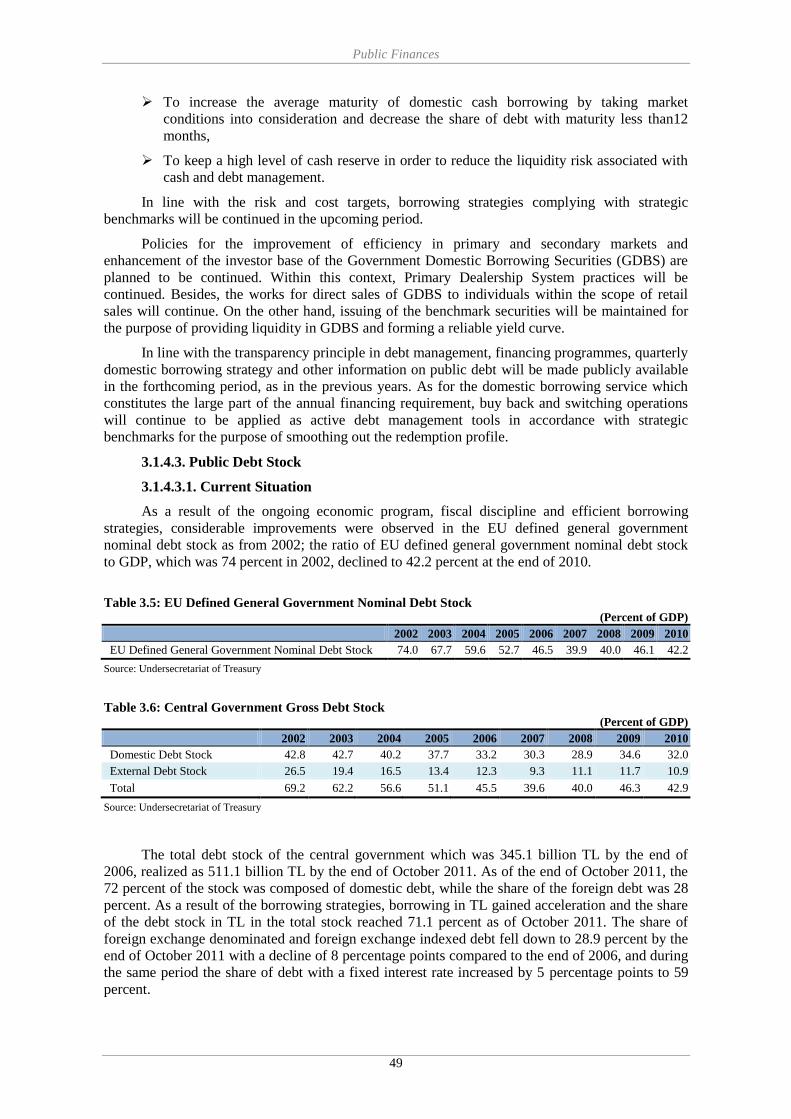
Public Finances
49
To increase the average maturity of domestic cash borrowing by taking market
conditions into consideration and decrease the share of debt with maturity less than12
months,
To keep a high level of cash reserve in order to reduce the liquidity risk associated with
cash and debt management.
In line with the risk and cost targets, borrowing strategies complying with strategic
benchmarks will be continued in the upcoming period.
Policies for the improvement of efficiency in primary and secondary markets and
enhancement of the investor base of the Government Domestic Borrowing Securities (GDBS) are
planned to be continued. Within this context, Primary Dealership System practices will be
continued. Besides, the works for direct sales of GDBS to individuals within the scope of retail
sales will continue. On the other hand, issuing of the benchmark securities will be maintained for
the purpose of providing liquidity in GDBS and forming a reliable yield curve.
In line with the transparency principle in debt management, financing programmes, quarterly
domestic borrowing strategy and other information on public debt will be made publicly available
in the forthcoming period, as in the previous years. As for the domestic borrowing service which
constitutes the large part of the annual financing requirement, buy back and switching operations
will continue to be applied as active debt management tools in accordance with strategic
benchmarks for the purpose of smoothing out the redemption profile.
3.1.4.3. Public Debt Stock
3.1.4.3.1. Current Situation
As a result of the ongoing economic program, fiscal discipline and efficient borrowing
strategies, considerable improvements were observed in the EU defined general government
nominal debt stock as from 2002; the ratio of EU defined general government nominal debt stock
to GDP, which was 74 percent in 2002, declined to 42.2 percent at the end of 2010.
Table 3.5: EU Defined General Government Nominal Debt Stock
(Percent of GDP)
2002 2003 2004 2005 2006 2007 2008 2009 2010
EU Defined General Government Nominal Debt Stock 74.0 67.7 59.6 52.7 46.5 39.9 40.0 46.1 42.2
Source: Undersecretariat of Treasury
Table 3.6: Central Government Gross Debt Stock
(Percent of GDP)
2002 2003 2004 2005 2006 2007 2008 2009 2010
Domestic Debt Stock 42.8 42.7 40.2 37.7 33.2 30.3 28.9 34.6 32.0
External Debt Stock 26.5 19.4 16.5 13.4 12.3 9.3 11.1 11.7 10.9
Total 69.2 62.2 56.6 51.1 45.5 39.6 40.0 46.3 42.9
Source: Undersecretariat of Treasury
The total debt stock of the central government which was 345.1 billion TL by the end of
2006, realized as 511.1 billion TL by the end of October 2011. As of the end of October 2011, the
72 percent of the stock was composed of domestic debt, while the share of the foreign debt was 28
percent. As a result of the borrowing strategies, borrowing in TL gained acceleration and the share
of the debt stock in TL in the total stock reached 71.1 percent as of October 2011. The share of
foreign exchange denominated and foreign exchange indexed debt fell down to 28.9 percent by the
end of October 2011 with a decline of 8 percentage points compared to the end of 2006, and during
the same period the share of debt with a fixed interest rate increased by 5 percentage points to 59
percent.
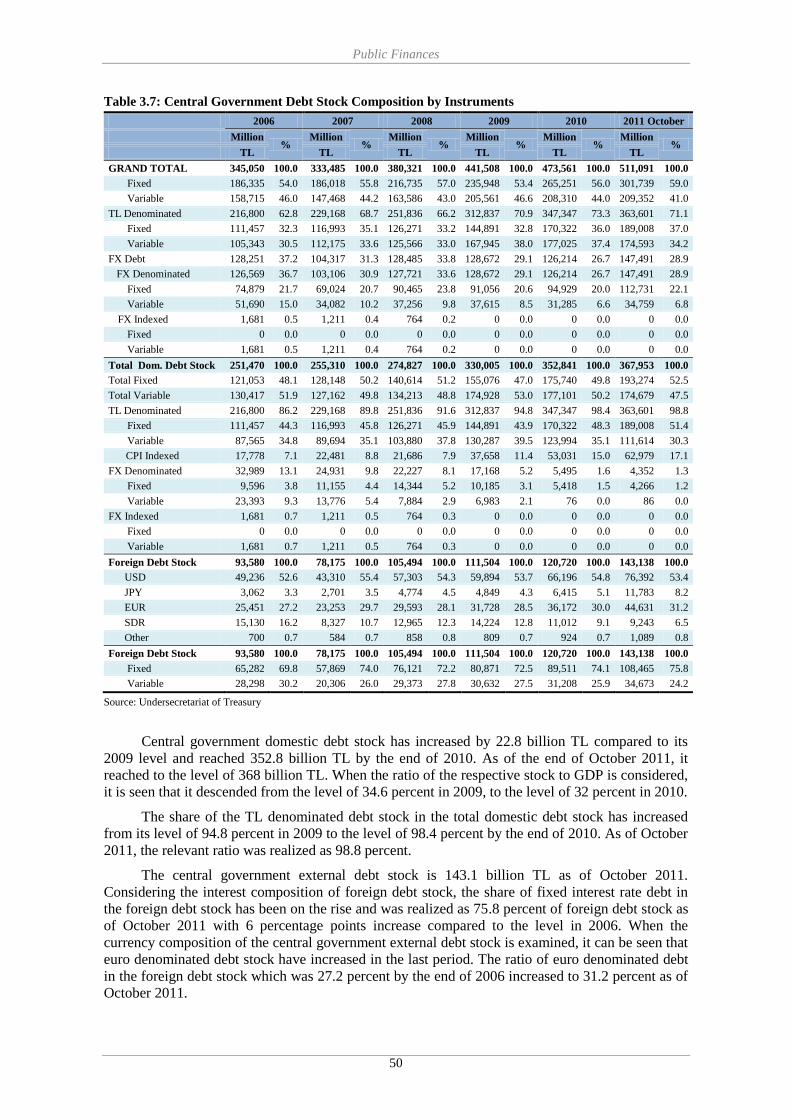
Public Finances
50
Table 3.7: Central Government Debt Stock Composition by Instruments
2006 2007 2008 2009 2010 2011 October
Million %
Million %
Million %
Million %
Million %
Million %
TL TL TL TL TL TL
GRAND TOTAL 345,050 100.0 333,485 100.0 380,321 100.0 441,508 100.0 473,561 100.0 511,091 100.0
Fixed 186,335 54.0 186,018 55.8 216,735 57.0 235,948 53.4 265,251 56.0 301,739 59.0
Variable 158,715 46.0 147,468 44.2 163,586 43.0 205,561 46.6 208,310 44.0 209,352 41.0
TL Denominated 216,800 62.8 229,168 68.7 251,836 66.2 312,837 70.9 347,347 73.3 363,601 71.1
Fixed 111,457 32.3 116,993 35.1 126,271 33.2 144,891 32.8 170,322 36.0 189,008 37.0
Variable 105,343 30.5 112,175 33.6 125,566 33.0 167,945 38.0 177,025 37.4 174,593 34.2
FX Debt 128,251 37.2 104,317 31.3 128,485 33.8 128,672 29.1 126,214 26.7 147,491 28.9
FX Denominated 126,569 36.7 103,106 30.9 127,721 33.6 128,672 29.1 126,214 26.7 147,491 28.9
Fixed 74,879 21.7 69,024 20.7 90,465 23.8 91,056 20.6 94,929 20.0 112,731 22.1
Variable 51,690 15.0 34,082 10.2 37,256 9.8 37,615 8.5 31,285 6.6 34,759 6.8
FX Indexed 1,681 0.5 1,211 0.4 764 0.2 0 0.0 0 0.0 0 0.0
Fixed 0 0.0 0 0.0 0 0.0 0 0.0 0 0.0 0 0.0
Variable 1,681 0.5 1,211 0.4 764 0.2 0 0.0 0 0.0 0 0.0
Total Dom. Debt Stock 251,470 100.0 255,310 100.0 274,827 100.0 330,005 100.0 352,841 100.0 367,953 100.0
Total Fixed 121,053 48.1 128,148 50.2 140,614 51.2 155,076 47.0 175,740 49.8 193,274 52.5
Total Variable 130,417 51.9 127,162 49.8 134,213 48.8 174,928 53.0 177,101 50.2 174,679 47.5
TL Denominated 216,800 86.2 229,168 89.8 251,836 91.6 312,837 94.8 347,347 98.4 363,601 98.8
Fixed 111,457 44.3 116,993 45.8 126,271 45.9 144,891 43.9 170,322 48.3 189,008 51.4
Variable 87,565 34.8 89,694 35.1 103,880 37.8 130,287 39.5 123,994 35.1 111,614 30.3
CPI Indexed 17,778 7.1 22,481 8.8 21,686 7.9 37,658 11.4 53,031 15.0 62,979 17.1
FX Denominated 32,989 13.1 24,931 9.8 22,227 8.1 17,168 5.2 5,495 1.6 4,352 1.3
Fixed 9,596 3.8 11,155 4.4 14,344 5.2 10,185 3.1 5,418 1.5 4,266 1.2
Variable 23,393 9.3 13,776 5.4 7,884 2.9 6,983 2.1 76 0.0 86 0.0
FX Indexed 1,681 0.7 1,211 0.5 764 0.3 0 0.0 0 0.0 0 0.0
Fixed 0 0.0 0 0.0 0 0.0 0 0.0 0 0.0 0 0.0
Variable 1,681 0.7 1,211 0.5 764 0.3 0 0.0 0 0.0 0 0.0
Foreign Debt Stock 93,580 100.0 78,175 100.0 105,494 100.0 111,504 100.0 120,720 100.0 143,138 100.0
USD 49,236 52.6 43,310 55.4 57,303 54.3 59,894 53.7 66,196 54.8 76,392 53.4
JPY 3,062 3.3 2,701 3.5 4,774 4.5 4,849 4.3 6,415 5.1 11,783 8.2
EUR 25,451 27.2 23,253 29.7 29,593 28.1 31,728 28.5 36,172 30.0 44,631 31.2
SDR 15,130 16.2 8,327 10.7 12,965 12.3 14,224 12.8 11,012 9.1 9,243 6.5
Other 700 0.7 584 0.7 858 0.8 809 0.7 924 0.7 1,089 0.8
Foreign Debt Stock 93,580 100.0 78,175 100.0 105,494 100.0 111,504 100.0 120,720 100.0 143,138 100.0
Fixed 65,282 69.8 57,869 74.0 76,121 72.2 80,871 72.5 89,511 74.1 108,465 75.8
Variable 28,298 30.2 20,306 26.0 29,373 27.8 30,632 27.5 31,208 25.9 34,673 24.2
Source: Undersecretariat of Treasury
Central government domestic debt stock has increased by 22.8 billion TL compared to its
2009 level and reached 352.8 billion TL by the end of 2010. As of the end of October 2011, it
reached to the level of 368 billion TL. When the ratio of the respective stock to GDP is considered,
it is seen that it descended from the level of 34.6 percent in 2009, to the level of 32 percent in 2010.
The share of the TL denominated debt stock in the total domestic debt stock has increased
from its level of 94.8 percent in 2009 to the level of 98.4 percent by the end of 2010. As of October
2011, the relevant ratio was realized as 98.8 percent.
The central government external debt stock is 143.1 billion TL as of October 2011.
Considering the interest composition of foreign debt stock, the share of fixed interest rate debt in
the foreign debt stock has been on the rise and was realized as 75.8 percent of foreign debt stock as
of October 2011 with 6 percentage points increase compared to the level in 2006. When the
currency composition of the central government external debt stock is examined, it can be seen that
euro denominated debt stock have increased in the last period. The ratio of euro denominated debt
in the foreign debt stock which was 27.2 percent by the end of 2006 increased to 31.2 percent as of
October 2011.

Public Finances
51
Table 3.8: Central Government Domestic Debt Stock by Lenders
2006 2007 2008 2009 2010
2011
October
2006 2007 2008 2009 2010
2011
October
Billion TL Share in the Domestic Debt Stock, Percent
Total 251.5 255.3 274.8 330.0 352.8 368.0
100.0 100.0 100.0 100.0 100.0 100.0
Public 71.4 66.9 65.8 60.9 51.4 60.1 28.4 26.2 23.9 18.5 14.6 16.3
CBRT 17.8 16.0 13.0 8.0 - -
7.1 6.3 4.7 2.4 - -
Public Banks 19.9 15.8 10.1 5.6 - - 7.9 6.2 3.7 1.7 - -
SDIF 4.5 3.8 3.1 2.3 2.3 2.3
1.8 1.5 1.1 0.7 0.7 0.6
CBRT (IMF Credits) - - - - - - - - - - - -
Other 29.3 31.3 39.6 45.0 49.1 57.8
11.6 12.3 14.4 13.6 13.9 15.7
Market(*)
180.1 188.4 209.1 269.1 301.4 307.9 71.6 73.8 76.1 81.5 85.4 83.7
Source: Undersecretariat of Treasury
(*) Bonds issued to SDIF for deposits of Reconstruction Bank are included in Market.
Treasury bonds issued to the Saving Deposits Insurance Fund in line with the restructuring
of the banking sector and the bonds issued for duty losses and capital injections to public banks in
2001 were fully redeemed and consequently those securities were deducted from the debt stock. As
of end of October 2011, the share of debts which lend by public sector in total central government
domestic debt stock is 16.3 percent and share of debts lend by private sector is 83.7 percent.
Table 3.9: Maturity Composition of Central Government Domestic Debt Stock
2006 2007 2008 2009 2010 2011
October
Average Time Remaining to Maturity of Stock (Month)
Cash 22.3 25.7 24.4 25.0 30.9 32.3
Non-Cash 32.0 25.7 19.8 14.4 40.4 30.3
Total 24.0 25.7 23.9 24.4 31.0 32.3
Source: Undersecretariat of Treasury
Table 3.10: Time Remaining to Maturity of the Central Government External Debt Stock*
2010 2011 October
Stock
Time
Remaining
to
Maturity
Average
Time
Remaining
to
Maturity
Stock
Time
Remaining
to
Maturity
Average
Time
Remaining
to
Maturity
Million
Euros % Year Year
Million
Euros % Year Year
Maturity 57,791 100 10.5 8.8 57,201 100 10.8 9.0
Medium Term (1-5 years) 0 0 0.0 0.0 309 1 4.4 4.0
Long Term (More than 5 years) 57,791 100 10.5 8.8 56,892 99 10.9 9.1
By Lender 57,791 100 10.5 8.8 57,201 100 10.8 9.0
Credit 24,454 42 10.8 6.7 23,399 41 11.4 7.2
International Organizations 14,628 25 10.2 6.9 13,283 24 11.2 7.8
IMF 4,247 7 2.4 1.1 2,663 5 1.8 0.8
Government Agencies 4,758 8 18.2 9.7 4,698 8 18.2 9.9
Other 5,068 9 5.6 3.4 5,418 10 5.9 3.5
Bond 33,337 58 10.3 10.3 33,802 59 10.5 10.3
By Currency 57,791 100 10.5 8.8 57,201 100 10.8 9.0
USD 32,306 56 10.9 10.2 31,110 54 11.1 10.3
JPY 3,131 5 19.1 10.1 4,799 8 15.9 10.1
EUR 17,653 31 10.2 7.9 18,175 32 10.7 7.9
SDR 4,259 7 2.4 1.1 2,674 5 1.8 0.8
Other 442 1 11.4 5.8 444 1 11.7 5.9
Source: Undersecretariat of Treasury
(*) IMF’s SDR appropriations are not included.
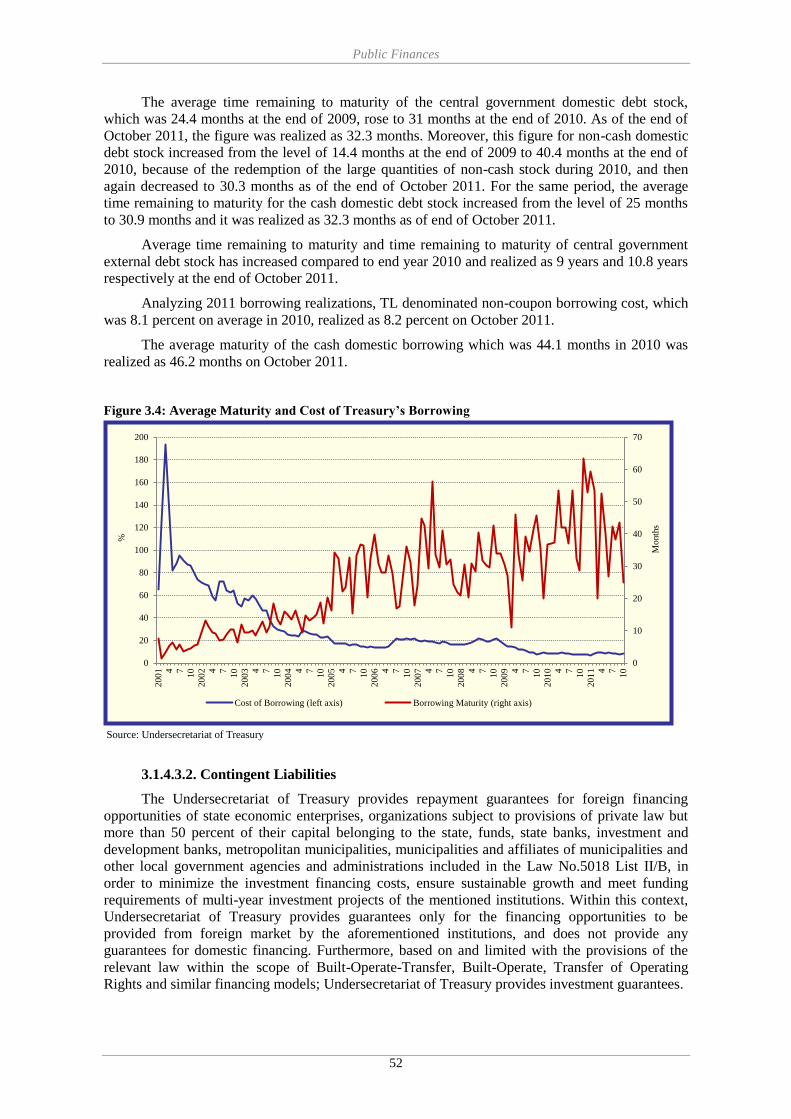
Public Finances
52
The average time remaining to maturity of the central government domestic debt stock,
which was 24.4 months at the end of 2009, rose to 31 months at the end of 2010. As of the end of
October 2011, the figure was realized as 32.3 months. Moreover, this figure for non-cash domestic
debt stock increased from the level of 14.4 months at the end of 2009 to 40.4 months at the end of
2010, because of the redemption of the large quantities of non-cash stock during 2010, and then
again decreased to 30.3 months as of the end of October 2011. For the same period, the average
time remaining to maturity for the cash domestic debt stock increased from the level of 25 months
to 30.9 months and it was realized as 32.3 months as of end of October 2011.
Average time remaining to maturity and time remaining to maturity of central government
external debt stock has increased compared to end year 2010 and realized as 9 years and 10.8 years
respectively at the end of October 2011.
Analyzing 2011 borrowing realizations, TL denominated non-coupon borrowing cost, which
was 8.1 percent on average in 2010, realized as 8.2 percent on October 2011.
The average maturity of the cash domestic borrowing which was 44.1 months in 2010 was
realized as 46.2 months on October 2011.
Figure 3.4: Average Maturity and Cost of Treasury’s Borrowing
Source: Undersecretariat of Treasury
3.1.4.3.2. Contingent Liabilities
The Undersecretariat of Treasury provides repayment guarantees for foreign financing
opportunities of state economic enterprises, organizations subject to provisions of private law but
more than 50 percent of their capital belonging to the state, funds, state banks, investment and
development banks, metropolitan municipalities, municipalities and affiliates of municipalities and
other local government agencies and administrations included in the Law No.5018 List II/B, in
order to minimize the investment financing costs, ensure sustainable growth and meet funding
requirements of multi-year investment projects of the mentioned institutions. Within this context,
Undersecretariat of Treasury provides guarantees only for the financing opportunities to be
provided from foreign market by the aforementioned institutions, and does not provide any
guarantees for domestic financing. Furthermore, based on and limited with the provisions of the
relevant law within the scope of Built-Operate-Transfer, Built-Operate, Transfer of Operating
Rights and similar financing models; Undersecretariat of Treasury provides investment guarantees.
0
10
20
30
40
50
60
70
0
20
40
60
80
100
120
140
160
180
200
20
01 4 7
10
20
02 4 7
10
20
03 4 7
10
20
04 4 7
10
20
05 4 7
10
20
06 4 7
10
20
07 4 7
10
20
08 4 7
10
20
09 4 7
10
20
10 4 7
10
20
11 4 7
10
Mo
nth
s
%
Cost of Borrowing (left axis) Borrowing Maturity (right axis)

Public Finances
53
The probable undertaking of the payments of the guaranteed debts of the financially stressed
organizations and covering of obligations under the investment guarantees by the Treasury
constitutes a significant part of the explicit contingent liabilities.
Endogenous Credit Rating Model which considers the debt-receivable relationship between
the institutions and the Treasury and financial statements of these institutions, was put into practice
in 1 January 2007, in order to improve the management of contingent liabilities confronting the
Undersecretariat of Treasury. In this context, the limit for Treasury guarantees and on-lent foreign
loans, guarantee and on-lent fees and partial guarantee ratios are calculated using this model based
on the expected losses from organizations in order to alleviate risks arising from contingent
liabilities. With this regard, the expected loss identifies the expectation regarding the cost which
will occur in the case where the organizations demand undertaking due to their financial
inadequacies or where they fail to fulfill other liabilities to Treasury.
In this context, the limit covering repayment guarantees, investment guarantees and on-lent
foreign loans to be provided under the Law No.4749 is set by budget law every year. The limit to
be applied for the Treasury guarantees to be provided under the Law No.4749 was 2 billion dollars
in 2005, 3 billion dollars in 2006 and 2007 and 2 billion dollars in 2008. In addition to this
guarantee opportunity, as from 2009, the foreign financing to be used on-lent was taken into the
scope of this limit and it was determined as 4 billion dollars in 2009, as 3 billion dollars in 2010
and 2011.
If a Treasury guarantee is provided under the Law No.4749, a fee up to 1 percent of the
guaranteed amount is charged to the regarded institution. On the other hand, upon amendment
made in the Law No.4749 in 2008, if on-lent foreign loan is provided, a fee up to 1 percent of the
on-lent amount is charged to the related institution as well. In the partial guarantee practice, credits
except export credits obtained from the international and regional organizations and foreign
Official Export Insurance Agencies, are guaranteed up to 95 percent of the total liabilities.
3.1.4.3.3. Repayment Guarantee
The repayment guaranteed debt stock, which is used to keep investment financing costs of
public agencies and institutions that are not in the context of general government and to provide
fund liquidity, has increased from its level of 7.5 billion dollars in 2010 to 8.4 billion dollars by end
of second quarter of 2011. The increase in the level of stock is due to the guarantees provided to
public banks and private investment and development banks.
Table 3.11: Treasury-Guaranteed Foreign Debt Service Projections* (Million Euro)
Principal Interest Total
2012 438 117 555
2013 454 105 559
2014 511 93 603
2015+ 3,830 469 4,299
(*) Based on usage, provisional, by September 2010.
Source: Undersecretariat of Treasury
Although there is an increase in the Treasury-guaranteed debt stock, the undertaking ratio,
which was 9.2 percent by of the end of 2010, dropped to the level of 8.3 percent by the end of
October 2011.
As for the payment projection of the Treasury guaranteed foreign debt stock in the medium
term, there is an increase parallel to the increase in disbursements.
3.1.4.3.4. Investment Guarantees
Undersecretariat of Treasury has provided investment guarantees to energy and
infrastructure sectors as well as repayment guarantees. Within the context of an investment
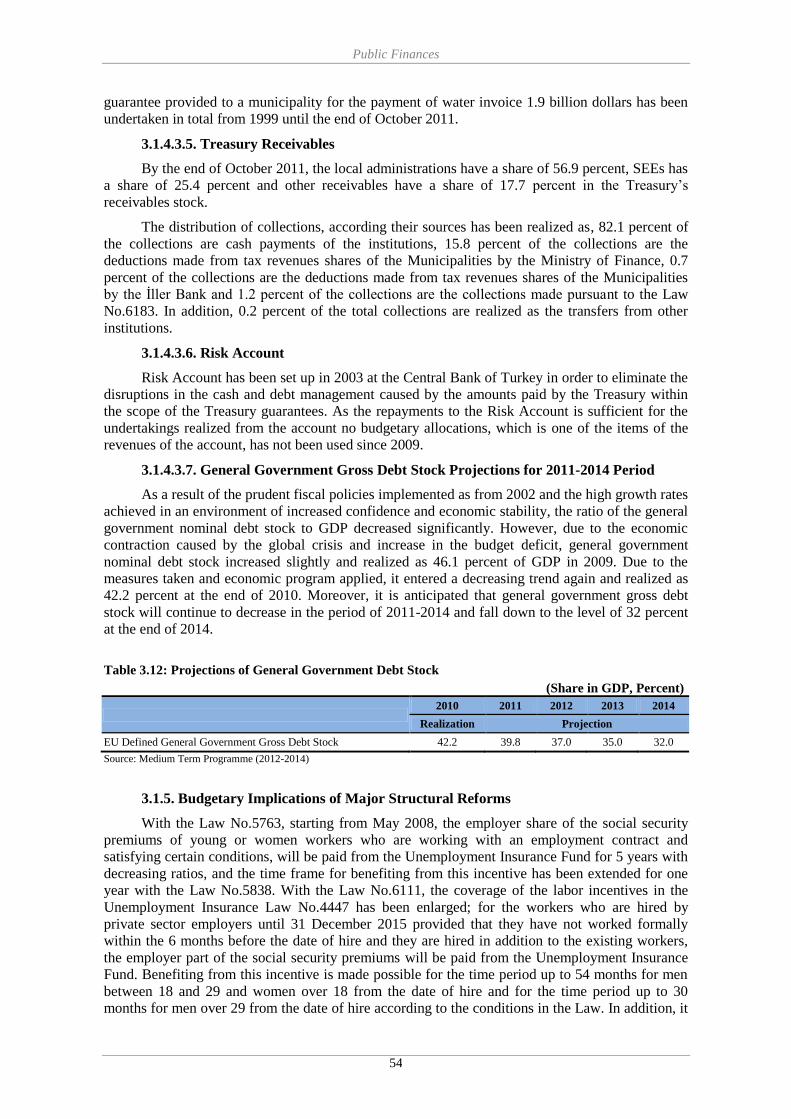
Public Finances
54
guarantee provided to a municipality for the payment of water invoice 1.9 billion dollars has been
undertaken in total from 1999 until the end of October 2011.
3.1.4.3.5. Treasury Receivables
By the end of October 2011, the local administrations have a share of 56.9 percent, SEEs has
a share of 25.4 percent and other receivables have a share of 17.7 percent in the Treasury’s
receivables stock.
The distribution of collections, according their sources has been realized as, 82.1 percent of
the collections are cash payments of the institutions, 15.8 percent of the collections are the
deductions made from tax revenues shares of the Municipalities by the Ministry of Finance, 0.7
percent of the collections are the deductions made from tax revenues shares of the Municipalities
by the İller Bank and 1.2 percent of the collections are the collections made pursuant to the Law
No.6183. In addition, 0.2 percent of the total collections are realized as the transfers from other
institutions.
3.1.4.3.6. Risk Account
Risk Account has been set up in 2003 at the Central Bank of Turkey in order to eliminate the
disruptions in the cash and debt management caused by the amounts paid by the Treasury within
the scope of the Treasury guarantees. As the repayments to the Risk Account is sufficient for the
undertakings realized from the account no budgetary allocations, which is one of the items of the
revenues of the account, has not been used since 2009.
3.1.4.3.7. General Government Gross Debt Stock Projections for 2011-2014 Period
As a result of the prudent fiscal policies implemented as from 2002 and the high growth rates
achieved in an environment of increased confidence and economic stability, the ratio of the general
government nominal debt stock to GDP decreased significantly. However, due to the economic
contraction caused by the global crisis and increase in the budget deficit, general government
nominal debt stock increased slightly and realized as 46.1 percent of GDP in 2009. Due to the
measures taken and economic program applied, it entered a decreasing trend again and realized as
42.2 percent at the end of 2010. Moreover, it is anticipated that general government gross debt
stock will continue to decrease in the period of 2011-2014 and fall down to the level of 32 percent
at the end of 2014.
Table 3.12: Projections of General Government Debt Stock
(Share in GDP, Percent)
2010 2011 2012 2013 2014
Realization Projection
EU Defined General Government Gross Debt Stock 42.2 39.8 37.0 35.0 32.0
Source: Medium Term Programme (2012-2014)
3.1.5. Budgetary Implications of Major Structural Reforms
With the Law No.5763, starting from May 2008, the employer share of the social security
premiums of young or women workers who are working with an employment contract and
satisfying certain conditions, will be paid from the Unemployment Insurance Fund for 5 years with
decreasing ratios, and the time frame for benefiting from this incentive has been extended for one
year with the Law No.5838. With the Law No.6111, the coverage of the labor incentives in the
Unemployment Insurance Law No.4447 has been enlarged; for the workers who are hired by
private sector employers until 31 December 2015 provided that they have not worked formally
within the 6 months before the date of hire and they are hired in addition to the existing workers,
the employer part of the social security premiums will be paid from the Unemployment Insurance
Fund. Benefiting from this incentive is made possible for the time period up to 54 months for men
between 18 and 29 and women over 18 from the date of hire and for the time period up to 30
months for men over 29 from the date of hire according to the conditions in the Law. In addition, it

Public Finances
55
is regulated that workers who receive professional competence certificate while working or
workers who graduate from middle or high schools which give professional and technical
education can benefit from this incentive for the time period up to 18 months. Moreover, it is made
possible to benefit from the labor incentives covered in the Law No.4447 and to benefit from the
labor incentives in other laws at the same time. The five-point discount in premium due to the Law
No.5763 is expected to create an additional burden of 0.37 percent, 0.38 percent and 0.40 percent
(as ratio to GDP) on the social security balances in 2011, 2012 and 2013 respectively.
3.2. Sensitivity Analysis
Within the framework of public debt and risk management implementations, taking
macroeconomic balances into consideration, a sustainable, transparent and accountable debt
management policy that conforms with monetary and fiscal policies has been in effect since 2002.
Tight fiscal policies implemented in the period of 2002-2008 and strategic benchmarking practices
applied since 2003 helped mitigate the impacts of the exchange rate, interest rate and growth
related negative shocks on the public debt stock in the medium and long term and improved the
resilience of the debt stock against shocks. The sustainability analyses regarding the course of debt
stock against various macroeconomic shocks in the period of 2012-2014 are presented below. In
figure 3.5, under various scenarios, the course of EU Defined General Government Gross Debt
Stock to GDP ratios in response to the exogenous shocks has been analyzed.
Figure 3.5: Sustainability Scenarios
In various scenarios, response of debt to GDP ratio to the exogenous shocks; such as
exchange rate, real growth rate and real interest rate shocks, are analyzed. Within the context of the
analysis, the level of exchange rate shock is increased in comparison to past years’ analyses and
determined as 10 percent. Therefore, in the analyses, impacts of 10 percent increase in the
exchange rates, 2 percentage points decrease in the real growth rate and 500 base points increase in
the real interest rates compared to the base scenario in each year have been assessed separately and
jointly. Examining the scenarios stated above, compared to the base scenario, it is evaluated that
the debt stock will record an increase of 1.1 percentage points under the exchange rate shock; 1.7
percentage points under the real interest rate shock and 2 percentage points under the growth rate
shock in 2014. In the combined shock scenario in which all shocks are taken into consideration
together, it is proposed that the debt stock may increase by 5.1 percentage points compared to the
base scenario. On the other hand, even though the exchange rate shock is assumed higher than the
previous year’s sustainability scenarios, the combined shock scenario leads the debt to GDP ratio to
32.0
33.1
34.0 33.7
37.1
30
33
36
39
42
45
48
20
07
20
08
20
09
20
10
20
11
20
12
20
13
20
14
%
Baseline Scenario Exchange Rate Shock (%10) Growth Shock (2 percentage points)
Interest Shock (500 bp) Combined Shock

Public Finances
56
deviate from the base scenario in 2014 at the same level with that of last year’s analysis. Even in
the combined shock scenario, debt stock to GDP ratio is expected to decline in the medium term.
3.3. Public Finance Risks
In the 2012-2014 period risks that might constitute obstacle to reach the determined
objectives in the public finance are summarized below:
In the case that growth rate is realized lower than expected, the central government
revenue performance and the employment increase parameter will be adversely affected;
therefore, there is a possibility of increase in the financing needs. This situation, under
the circumstance of social security insurance premium collections being lower than
projections and health-care expenditures are not taken under control, will increase the
transfers to the social security institutions from the central government budget.
Failing to update the fixed taxes and fees will adversely affect the revenue performance.
Underperformance of privatization will result in lower realization of public revenues than
the expectations.
If the employment does not increase at the expected level, the number of people
benefiting from the Unemployment Insurance Fund will increase, which will result in a
slight deterioration of the balances of the Unemployment Insurance Fund.
If the inflation rate resulted higher than the projected level, compensation for exceeding
inflation rate will be paid to public servants.
Salary increase rates of civil servants will be determined by collective bargaining with
public servant unions. Therefore, the personnel expenditures may realize above the
budget appropriations.
The sensitivity of the current public debt stock to the market risk has significantly
declined compared to previous years but the excessive volatilities that may occur in the
markets may adversely affect the mentioned stock.
3.4. Quality of Public Finance
The remarkable growth performance recorded in 2010, maintained in 2011 and public fiscal
balances have improved due to additional revenues acquired and expenditure policies conducted
pursuant to fiscal discipline. In order to make this performance permanent, it is important to use
public sources in a way to support potential growth, and to design public finance in line with a
private sector based growth perspective.
Similar to 2011, in 2012 cash surplus of the Privatization Fund and a certain ratio of the
interest revenues of the Unemployment Insurance Fund will continue to be used within the scope of
GAP and other regional development projects. Pursuant to the temporary 6th article of the Law
No.4447, amended with the Law No.5921, the rate of 1/4 will be implemented in 2012 as in 2011,
for the calculation of the transfers from the Unemployment Insurance Fund to GAP Action Plan
and other economic development and social development investments. In this context, in 2010-
2012 period, a total of 14.5 billion TL will be used for the GAP Action Plan and other economic
and social development investments.
In 2011, a certain part of the fiscal space resulting from increasing revenues due to high
growth and facilities of payment granted to the some overdue state receivables and decreasing
social security deficit financing because of restructuring, has been used for central government
budget capital expenditures. For 2012-2014 period, capital expenditures have been decreased to a
sustainable level taking financing possibilities into consideration and the ratio of capital
expenditures to GDP is expected to be 2 percent.
The Social Support Programme (SODES) which was put into implementation in GAP
provinces in 2008 in order to effectively meet the need of improving human capital and providing
social integration under the component titled Providing Social Development of GAP Action Plan

Public Finances
57
was extended in a way to cover DAP provinces in 2010. Within the scope of the mentioned
programme, it is estimated that a total resource of 881 million TL will be used in the period of
2011-2014. Additionally, for 2012, it is programmed to allocate a resource of 450 million TL from
the central government budget to 26 development agencies which were designed for the purpose of
activating local development potential and of which establishment process was completed by the
end of 2010. Within the scope of the activities to be carried out by development agencies, a total
resource of 1.9 billion TL is proposed for use in the period of 2011-2014.
As a result of the amendments in the Laws No.5350 and 5615, the scope of the incentive for
development priority regions was extended and the eligibility conditions were improved.
Furthermore, a new incentive model was developed on a regional, sectoral and project basis and
accordingly, a legal arrangement was made allowing the application of reduced corporate tax for
new investments, and the provision of the right of access for the real properties of Treasury, when
they are used as the locations of the investments. Also, the legal arrangement supporting the
transfer of the production facilities of textile companies to the cities determined by the Council of
Ministers through the use of tax advantage, has been completed. Implementation period of Law
No.5084 on promotion on insurance premium employer share has been extended until the end of
2012. In this context, within the scope of the Treasury incentive payments which are made in the
form of current transfer expenditures in the general government budget, 2.7 billion TL for 2011-
2014 is expected to be spent.
For the R&D incentives managed by TÜBİTAK, an expenditure of 800 million TL for 2011
and a total of 2.5 billion TL for the period 2012-2014 were projected. In order to create a
productive and competitive economic environment through the support of R&D activities, the Law
No.5746 was enacted to be effective until 2023. Under this Law, it is now possible to deduct 100
percent of the R&D expenditures from the tax liabilities while this has been applied as 40 percent
under the Corporate Tax Law and Income Tax Law since 2004. In the law, withholding tax support
for the income tax as well as the insurance premium support for the R&D staff and offers techno-
enterprise capital support for innovative ideas are also regulated.
The Decree numbered 2009/15197 on the Principles and Procedures regarding the Treasury
Support to be Provided to Credit Guarantee Institutions, which was prepared in order to provide
easier access of SMEs to financing opportunities, was published on the Official Gazette on 15 July
2009. Pursuant to the aforementioned decree, it is determined to provide support up to 1 billion TL.
After that regulation, the first credit guarantee institution which will be provided with support by
the Undersecretariat of Treasury was determined as KGF. On the other hand, so as to facilitate
application conditions for SMEs, resolve financing problems of the companies engaging in
activities in the area of ship construction and ship management and reduce costs of beneficiaries,
regulations were made regarding more active operation of the system by means of some
amendments made in the aforementioned Decree in 2010 and finally 2011. Additionally, the
utilization period of the system has been extended until 2013 with the amendment made in July
2011. Credit amounting to a total of 593.7 million TL was issued for 1031 SMEs during the period
between July 2009, in which the said support became operative, and November 2011.
For the incentives offered by the Directorate for the Promotion and Development of the
Small and Medium Scaled Enterprises (KOSGEB), an expenditure of 747 million TL for the period
of 2012-2014 was estimated.
The Project for the Support of the Infrastructure of the Villages (KÖY-DES), which has been
implemented since 2005 and developed to meet the common needs of the local administrations
such as drinking water, sewage and roads, will continue in the period of 2011-2014. Accordingly, it
is programmed that 1.7 billion TL of a resource will be allocated to the aforementioned project in
the period of 2012-2014. A programme, namely Water and Sewage Infrastructure Project (SUKAP)
was initiated for funding for drinking water and sewage projects of municipalities which are
considered urgent but have difficulty in financing. As for the period of 2012-2014, it is
programmed to make an expenditure of 1.6 billion TL for this project.

Public Finances
58
3.5. Institutional Features of Public Finance
Significant structural changes are being made to improve the institutional capacity in the
public financial management. Some of the recent regulations designed for this purpose are
presented below.
3.5.1. Law on Court of Accounts
Court of Accounts Law No.6085, which aim at regulating the establishment of Court of
Accounts, its functioning, audit and judicial procedures, qualifications and appointments of its
staff, responsibilities and competences, rights and obligations and other matters pertaining to
personnel, the election and security of tenure of the President and members of Court of Accounts in
order to perform audit activities on behalf of the Turkish Grand National Assembly, to take final
decision on the accounts and transactions of those responsible, to carry out the duties of examining,
auditing and taking final decision stemming from laws, in the framework of accountability and
fiscal transparency in the public sector, to ensure that public administrations function effectively,
economically, efficiently and in compliance with laws and that public resources are acquired,
preserved and utilized in accordance with foreseen purposes, targets, laws and other legal
arrangements, was published in the Official Gazette dated 19 December 2010 and entered into
force. In the context of Court of Accounts Law No.6085, the work for the secondary legislation
required for the Court of Accounts to perform its audits in line with the EU practices and
international audit standards are still in progress.
3.5.2. Public Financial Management and Control Law
According to the results of the second Competition Examination for Assistant Financial
Services Specialists, which aim to improve the implementation capacities of the public
administrations in the field of financial management and control, 319 assistant financial services
specialists were recruited in public administrations.
The process regarding exchange of views among public administrations for the Draft
Financial Management and Control Manual, which has been prepared for providing guidance to the
public administrations in the implementation of the new financial management and control system
introduced with the Public Financial Management and Control Law No.5018, is still in progress.
Besides, the work on the improvement of Financial Management and Control Central
Harmonization Unit Handbook is continuing.
All the activities envisaged in the Contract of the Twinning Project Strengthening Financial
Management and Control System in Turkey were successfully realized. Within the scope of the
aforementioned project, seminars were organized for top managers of the pilot public institutions
on Institutional Governance and Internal Control and Risk Management.
Within the framework of the Guide on Action Plan for the Compliance with the Public
Internal Control Standards, public administrations submitted their action plans to the Ministry of
Finance. Those action plans were examined and assessment results were published on the web site
of the Directorate General of Budget and Fiscal Control.
Works for the amendments planned on the Public Financial Management and Control Law
No.5018 are still in progress.
As of November 2011, excluding regulatory and supervisory agencies there are 763 internal
auditors working in the public administrations within the scope of general government that are
subject to the internal audit provisions of the Law No.5018. In 2010-2011, as a result of the exam
following 3 months training programme conducted by the Internal Audit Coordination Board, 189
internal auditors, are deemed to be successful and entitled to receive public internal auditor
certificate. As a consequence of the Internal Audit Candidate Selection Exam which was held on 18
September 2011, 100 internal auditor candidates were deemed to be successful. Those candidates
will be subjected to a 3 months internal audit training as of December 2011.
The internal auditor candidate selection exam and the content of the internal audit training
programme have been revised in 2011 by the By-law Amending the By-law on the Selection,

Public Finances
59
Training and Certification of Internal Auditor Candidates published in the Official Gazette dated 16
June 2011 and No.27966. Moreover, Public Internal Audit Standards were published in the Official
Gazette dated 16 August 2011 and No.28027. Additionally Internal Audit Quality Assurance and
Improvement Programme was published in the Official Gazette dated 15 October 2011 and
No.28085.

Public Finances
60

Structural Reforms
61
4. STRUCTURAL REFORMS
4.1. Enterprise Sector
4.1.1. Privatization
The total amount of privatization of which sales/transfer operations were completed was 3.1
billion dollars in 2010. This amount reached to 341 million dollars as of the end of November
2011. The main privatizations in this term are some river plants belonging to EÜAŞ, Mazıdağı
Phosphate Plant belonging to Sümer Holding, and immovable properties belonging to various
institutions.
The total amount of privatization which are at the stage of approval/contract is 9.7 billion
dollars and such implementations include 8 electricity distribution companies (Aras, Vangölü,
Boğaziçi, Trakya, Dicle, İstanbul Anadolu Yakası, Toroslar, Akdeniz), some river power plants,
TCDD İskenderun Port, public shares in Turkish Sugar Factories (portfolio groups B and C) and
public shares in Doğusan A.Ş. and Acıpayam Selüloz A.Ş.
The privatization implementations for which transfer operations were completed in 2011 (as
of November) are shown in Table 4.1.
Table 4.1: Privatization Transactions Completed in 2011
Company Privatization Transaction Sales Price
(Dollars)
Bayburt, Çemişgezek, Girlevik River Plants Transfer of Operating Rights 29,050,000
Bünyan, Çamardı, Pınarbaşı, Sızır River Plants Transfer of Operating Rights 69,700,000
Dereköy, Cerrah, Suuçtu River Plants Transfer of Operating Rights 6,600,000
Çağ , Otluca, Uludere River Plants Transfer of Operating Rights 40,800,000
Adilcevaz, Ahlat, Malazgirt, Sönmez River Plants Transfer of Operating Rights 6,350,000
Değirmendere, Karaçay, Kuzuculu River Plants Transfer of Operating Rights 7,020,000
Turunçova-Finike River Plants Transfer of Operating Rights 2,760,000
Besni, Derme, Erkenek, Kernek River Plants Transfer of Operating Rights 13,800,000
Kayadibi River Plant Transfer of Operating Rights 7,644,000
Sümer Holding - Mazıdağı Phosphate Plant Sale of Plant/Asset 28,000,000
Others Sales and transfers of various real
estates and facilities
129,120,751
Total 340,844,751
Sales/transfer operations of Aras Electricity Distribution Company and public shares in
Doğusan A.Ş. and Acıpayam Selüloz A.Ş., for which tender processes were completed, are
expected to be completed. In addition to them; sales/transfer approval and contract stages of some
river plants belonging to EÜAŞ, TCDD İskenderun Port, and Electricity Distribution Companies
(Vangölü, Boğaziçi, Trakya, Dicle, İstanbul Anadolu Yakası, Toroslar, Akdeniz) are expected to be
completed. Works for the zoning plan in order to call the privatization tender of Izmir and Derince
ports of TCDD are still in progress. The privatization work for some of the thermal power plants
belonging to EÜAŞ is planned to be started in 2012.
The privatization tender of B portfolio group (Malatya, Erzincan, Elazığ, and Elbistan Sugar
Factories) and C portfolio group (Kastamonu, Kırşehir, Turhal, Yozgat, Çorum, and Çarşamba
Sugar Factories) belonging to Turkish Sugar Factories Co. has been completed and it is at the
approval stage.
In order to privatize some motorways and bridges, by the method of transfer of operation
rights, the tender announcement has been made. In addition, in order to privatize the 80 percent
share of Başkent Doğalgaz Dağıtım A.Ş. (natural gas distribution company), tender announcement
was made.
Structural Reforms
62
4.1.2. Competition Law and Policies
A draft law, regarding the antitrust legislation in Turkey, was sent to TGNA, and is in the
agenda of general assembly. Preparations are underway to draw up a guide on competitive impact
assessment which is part of regulatory impact analysis and allows regulations to be designed in a
way to be as less anticompetitive as possible.
A communiqué, No.2010/4, Concerning the Mergers and Acquisitions Calling for the
Authorization of the Competition Board, was issued. The purpose of this Communiqué is to
determine and announce the mergers and acquisitions which require notification to and
authorization by the Competition Board in order to gain legal validity pursuant to Article 7 of the
Act on the Protection of Competition, No.4054, as well as the procedures and principles concerning
the notification of such transactions. By the communiqué, so as to increase legal certainty for
undertakings, market share threshold was abandoned and a turnover threshold based notification
system was launched.
A cooperation protocol has been signed between the Competition Authority and the
Information and Communication Technologies Authority. The protocol aims to determine the
principles and procedures for addressing, in mutual cooperation, the issues which fall under their
authority and duties and which are related to establishing, developing and protecting a competitive
environment in electronic communications sector; to demonstrate a joint attitude for interpretation
of related concepts and legislation; and to ensure that decisions for mutual cooperation and
information transfer are taken.
With the Law No.6015 which aims; regulation of state aids according to agreements between
Turkey and EU, determination of methods and principals of monitoring and auditing by setting
essentials and principals of reporting of them to concerned authorities; State Aid Monitoring and
Supervision Board, and General Directorate of State Aids to run secretariat of the aforementioned
Board, have been established, and thereby authority on state aids has became operational. Draft
regulations about the law are being prepared and are planned to be issued and become effective
until 30 June 2013. After this date, duties set in the Law will be fulfilled by this authority.
4.1.3. Improvement of the Investment Environment
In the context of studies made for the improvement of the Investment Environment since
2001, a significant progress has been recorded in improving the business climate and increasing
investments. Works regarding Coordination Council for the Improvement of the Investment
Environment (YOİKK) are continuing.
The Civil Procedure Law covering arrangements enabling the acceleration of judicial
process, the widespread utilization of arbitration in Turkey for investors and establishment of
arbitration culture was entered into force after after being published in the Official Gazette
No.27836 dated 4 February 2011.
The change in the Regulation on the Control of Packaging Wastes eliminating the obligation
for the submission of packaging wastes of industrial establishments to municipilaties and/or to the
contracted collection and seperation facilities holding licences was published in the Official
Gazette No.28035 dated 24 August 2011.
The works for developing an entrepreneur information system which will contribute to the
investors and other users in the market in making more accurate decisions by enabling collecting,
updating and providing the industry and trade sectors data in an integral, systematic way and as
compatible with each other are still in progress under the coordination of the Ministry of Industry
and Trade.
The new Turkish Commercial Code; which was prepared by considering the new
developments in international substantive law and law regimes, multilateral trade and electronic
commerce and liability laws as well as the need to harmonize the Commercial Code with newly
enacted other laws and EU legislation, was published in the Official Gazette on 14 February 2011.
The Law which sets out the enforcement and application of Turkish Commercial Code was also
Structural Reforms
63
published at the same time. New regulations in the areas of the definition of commercial
undertakings and tradesmen, trading companies, companies according to their scale, intellectual
property rights, electronic transactions, transportation of goods, securities and stocks and shares,
maritime law, insurance law and building consumer awareness was brought by this Law. The
renewed Turkish Commercial Code will enter into force largely on 1 July 2012 and fully on 1
January 2013 after the completion of secondary legislations and other preparations.
The Law on Code of Obligations, which was prepared considering both developments in the
area of law of obligations and especially law of contracts and current economic and social
conditions, was approved by TGNA and published in the Official Gazette on 4 February 2011. The
Law which sets out the enforcement and application of the Law on Code of Obligations was also
published at the same time. With this law, which will enter into force on 1 July 2012, it is aimed to
improve legal infrastructure in terms of adopting current business practices and thus to make the
Code of Obligations respondent to current social, industrial, economic and technical developments.
As a matter of fact, asset-liability relations of everyday and business life is arranged in a
apprehensible way in the framework of modern legal principles and up-to-date technological
developments like electronic signature and internet usage are generalized. With this regulation,
improvement of the investment environment is aimed by increasing the consistency between Code
of Obligations and new Turkish Commercial Law.
4.1.4. Utilities and Network Industries
4.1.4.1. Energy
The works for the liberalization of the energy market have also been continued in 2011. The
expected benefits of the electricity privatization are the reduction of costs by productive enterprises
and reflecting them to consumers, decreasing high energy losses, empowerment of the financial
structure of the sector by increasing accrual and collection rates, increasing the contribution of the
private sector for supply security, and finally realization of the renovation and expansion
investments by the private sector.
An important stage has been reached in the liberalization attempts started in the energy
sector of Turkey as from the beginnings of 2000s. In 2010, privatization tenders of 52 small
hydroelectricity plants, which were operated by Electricity Generation Company (EÜAŞ) and had
an installed power of 142 MW, were launched. These power plants have been separated into 19
groups as to be privatized by transfer of operational rights method. After the tendering process the
sale of 18 groups has been approved by the Decision of Privatization Supreme Council dated 26
August 2010. In 2011, the transfer contracts for 8 of the aforementioned 18 groups have been
signed. Related works for signing the transfer contracts of the remaining groups are still ongoing.
The expected improvement could not be achieved in the privatization of electricity
distribution companies (EDAŞ) in 2011. Two (Çamlıbel and Uludağ EDAŞ) of the three electricity
distribution companies whose tenders were completed in 2010 have been transferred to private
sector in 2010 whereas Fırat EDAŞ has been transferred in 2011. On the other hand, the transfer of
8 EDAŞ (Vangölü, Boğaziçi, Trakya, Gediz, Dicle, İstanbul Anatolian Side, Akdeniz and Toroslar)
whose privatization tenders were completed in 2010 and Aras EDAŞ whose tender previously was
suspended by the decision of 13th Department of State Council dated 20 March 2009 could not be
completed yet. Göksu EDAŞ, which was privatized in 1998 and faced with a lawsuit against the
tendering procedures in 2000, has been transferred to private sector at the beginning of 2011. In
this way, together with the former transfers, the privatization process of 11 of the 20 regional
distribution companies owned by TEDAŞ (Turkish Electricity Distribution Company) has been
completed. Works for transferring remaining 9 distribution companies are still ongoing.
For the purpose of transfer of natural gas import to private sector pursuant to law, offers of 4
companies regarding the natural gas agreement of 4 billion sm3 were deemed appropriate as a result
of the tender made by BOTAŞ, the public natural gas company. After the transfer conditions were
met and EMRA gave the license for import, import of 250 million contract m3/year gas was started
on 19 December 2007, import of 750 million contract m3/year gas was started on 3 January 2009
and import of 3,000 million contract m3/year gas was started on 1 April 2009. The tender which

Structural Reforms
64
was conducted by BOTAŞ in 2011 to transfer of 6,000 million contract m3/year was cancelled as
the exporter company did not give its approval, which made the proposals void. On the other hand,
spot LNG imports were started by private sector in May 2009 for the first time. In 2010 and 2011
spot LNG imports were carried on.
4.1.4.2. Telecommunication
Law No.4502, which was put into force in 2000, paved the way to liberalization process in
the telecommunications sector in Turkey and Information Technologies and Communications
Authority (ITCA)11
was established as the independent regulatory body. On the other hand, in
accordance with the same Law, monopoly rights of the incumbent operator Turk Telekom in the
field of fixed telecommunication services expired at the beginning of 2004 and competition was
introduced in the sector.
ITCA has completed sectoral secondary legislation and authorized numerous operators since
2000. In order to be able to deliver services, it is compulsory for these operators to interconnect
with the incumbent operator under reasonable terms and access to infrastructures they control. To
this end, relevant markets and operators with significant market power in these markets have been
identified. Significant market power operators send their reference access and interconnection
offers to ITCA and these are published after the approval by the Authority. Standard reference
interconnection charges of the incumbent and GSM operators are provided in the following table
with their effective dates.
Table 4.2: Standard Reference Interconnection Charge Tariffs (Taxes Excluded)
Enforcement Date
Call Initiation and Call Termination
Charges on Turk Telekom Network
(Kr/min.)
Call Termination Charges on GSM Networks
(Kr/min.)
Local In-zone Out-zone Turkcell Vodafone Avea
1 January 2007 - 2.00 3.7 14.0 15.2 17.5
1 March 2007 - 1.89 3.0 13.6 14.5 16.7
1 April 2008 - 1.71 2.7 9.1 9.5 11.2
1 May 2009 1.39 1.71 2.7 6.55 6.75 7.75
1 April 2010 1.39 1.71 2.24 3.13 3.23 3.7
Source: Information Technologies and Communications Authority
As indicated in the table, interconnection charges of significant market power operators,
particularly those of mobile operators have been reduced considerably in the previous period
(Table 4.2). Furthermore, pursuant to an ITCA board decision taken in July 2011, Turk Telekom
added wholesale line rental services into its reference interconnection offer, which was updated in
August 2011. Wholesale line rental charges are shown in the Table 4.3. Upon completion of
preparations in Turk Telekom’s systems, these services are expected to be launched as of 2012.
Table 4.3: Wholesale Line Rental Charge Tariffs (Taxes Excluded)
Enforcement
Date
Turk Telekom Wholesale Line Rental Charge Tariffs
Activation Charge (TL) Line Rental Charge (TL/Month)
PSTN ISDN BA ISDN PA PSTN ISDN BA ISDN PA
2011 5.64 11.28 1,629.32 9.48 18.96 284.40
Source: Information Technologies and Communications Authority
11 The Electronic Communications Law No.5809 which entered into force on 10 November 2008, changed the name of Telecommunications Authority as Information Technologies and Communications Authority.
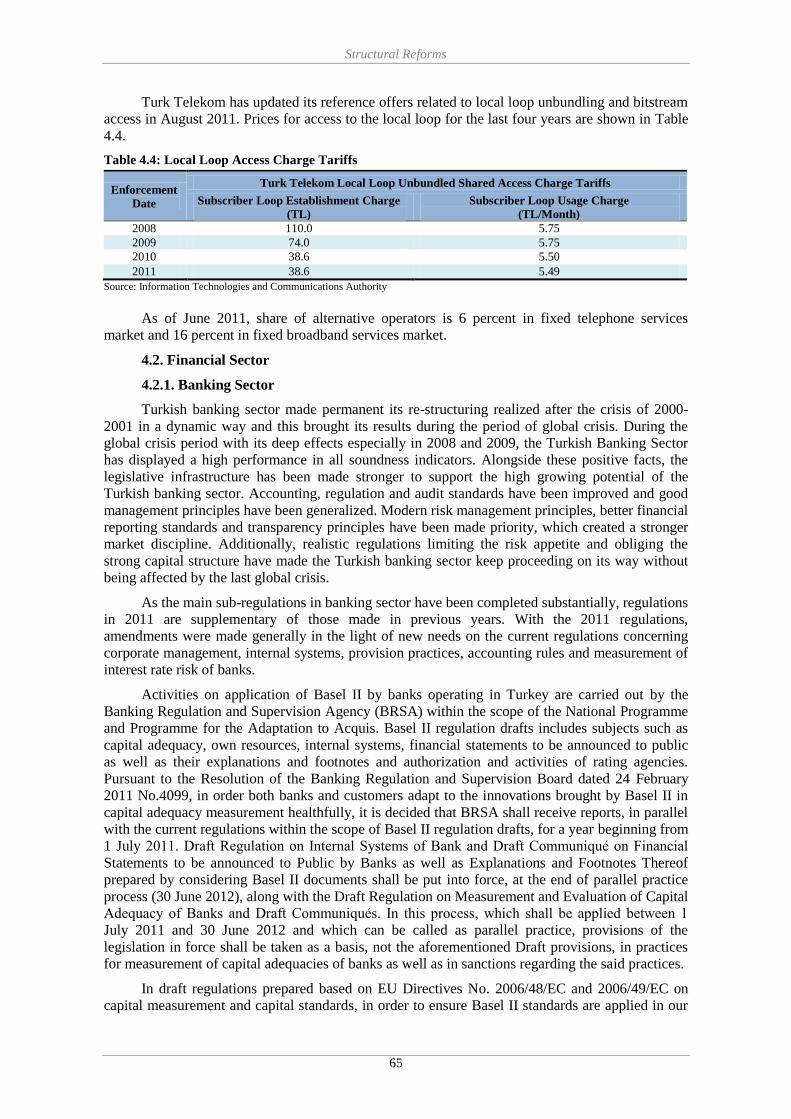
Structural Reforms
65
Turk Telekom has updated its reference offers related to local loop unbundling and bitstream
access in August 2011. Prices for access to the local loop for the last four years are shown in Table
4.4.
Table 4.4: Local Loop Access Charge Tariffs
Enforcement
Date
Turk Telekom Local Loop Unbundled Shared Access Charge Tariffs
Subscriber Loop Establishment Charge
(TL)
Subscriber Loop Usage Charge
(TL/Month)
2008 110.0 5.75
2009 74.0 5.75
2010 38.6 5.50
2011 38.6 5.49
Source: Information Technologies and Communications Authority
As of June 2011, share of alternative operators is 6 percent in fixed telephone services
market and 16 percent in fixed broadband services market.
4.2. Financial Sector
4.2.1. Banking Sector
Turkish banking sector made permanent its re-structuring realized after the crisis of 2000-
2001 in a dynamic way and this brought its results during the period of global crisis. During the
global crisis period with its deep effects especially in 2008 and 2009, the Turkish Banking Sector
has displayed a high performance in all soundness indicators. Alongside these positive facts, the
legislative infrastructure has been made stronger to support the high growing potential of the
Turkish banking sector. Accounting, regulation and audit standards have been improved and good
management principles have been generalized. Modern risk management principles, better financial
reporting standards and transparency principles have been made priority, which created a stronger
market discipline. Additionally, realistic regulations limiting the risk appetite and obliging the
strong capital structure have made the Turkish banking sector keep proceeding on its way without
being affected by the last global crisis.
As the main sub-regulations in banking sector have been completed substantially, regulations
in 2011 are supplementary of those made in previous years. With the 2011 regulations,
amendments were made generally in the light of new needs on the current regulations concerning
corporate management, internal systems, provision practices, accounting rules and measurement of
interest rate risk of banks.
Activities on application of Basel II by banks operating in Turkey are carried out by the
Banking Regulation and Supervision Agency (BRSA) within the scope of the National Programme
and Programme for the Adaptation to Acquis. Basel II regulation drafts includes subjects such as
capital adequacy, own resources, internal systems, financial statements to be announced to public
as well as their explanations and footnotes and authorization and activities of rating agencies.
Pursuant to the Resolution of the Banking Regulation and Supervision Board dated 24 February
2011 No.4099, in order both banks and customers adapt to the innovations brought by Basel II in
capital adequacy measurement healthfully, it is decided that BRSA shall receive reports, in parallel
with the current regulations within the scope of Basel II regulation drafts, for a year beginning from
1 July 2011. Draft Regulation on Internal Systems of Bank and Draft Communiqué on Financial
Statements to be announced to Public by Banks as well as Explanations and Footnotes Thereof
prepared by considering Basel II documents shall be put into force, at the end of parallel practice
process (30 June 2012), along with the Draft Regulation on Measurement and Evaluation of Capital
Adequacy of Banks and Draft Communiqués. In this process, which shall be applied between 1
July 2011 and 30 June 2012 and which can be called as parallel practice, provisions of the
legislation in force shall be taken as a basis, not the aforementioned Draft provisions, in practices
for measurement of capital adequacies of banks as well as in sanctions regarding the said practices.
In draft regulations prepared based on EU Directives No. 2006/48/EC and 2006/49/EC on
capital measurement and capital standards, in order to ensure Basel II standards are applied in our

Structural Reforms
66
country, only the measurement methodology based on standard approach concerning measurement
of credit risk is mentioned and it is planned that measurement methodology based on internal rating
shall be put into practice in following periods.
Pursuant to the Principle 5 on major acquisitions of the Core Principles for Effective
Banking Supervision published by the Basel Committee on Banking Supervision, an amendment
was made to the Regulation on Operations of Banks subject to Permission and Indirect
Shareholding, in order to constitute a permission system concerning establishment of cross-border
partnerships by banks or their participation to the established partnerships.
Subsequent to the amendment made to the Regulation on Internal Systems of Banks, it is
provisioned that at least one of the audit committee members should be residing in Turkey, records
to be kept by data systems according to the Uniform Chart of Accounts on transaction basis should
be consistent with the Turkish Accounting Standards as well and should be kept directly on
primary systems, cumulative accounting should be enabled in transaction based accounting, the
intra-bank rules such as strategy, policy, implementation procedures to be formed pursuant to any
kind of reporting and provisions of Regulation as well as internal correspondence to be made in
line with provisions of legislation should be made in Turkish.
Pursuant to the amendment made to the Regulation on Equities of Banks, inclusion rates of
primary subordinated debts to tier-I have been restructured according to their attributions, prepaid
expenses are removed out of discount from tier-I item and put subject to credit risk, part of primary
subordinated debts which is included in tier-II is limited with 50 percent of tier-I in tier-II account
along with secondary subordinated debts and it is enabled upon the permission of the BRSA that
the limit for tier-II may not exceed tier-I amount shall not be applied temporarily in extraordinary
circumstances.
With the amendments made in the rules of restructuring of reserve ratios and loans, it was
aimed to decrease the economic effects of global crisis, and the amendments were made in
exceptions relating to banks’ consolidated financial statement preparations with a view to provide
adaptation to Turkish Accounting Standards. Besides, amendments in banks’ financial statement
format were made with a view to make financial reporting compatible with international
accounting standard which was issued recently.
A principle relating to charging was added to Institutional Management Principles of Banks,
in June 2011. With the Resolution of the Banking Regulation and Supervision Board it was decided
to take into account of adaptation level of banks to institutional management principles in defining
rating notes to be given to banks in on-site audit. The rating notes given in on-site audit are taken
into account in calculation of insurance premium which the banks pay for deposit insurance.
Besides, these rating notes constitute an important element of situation assessment of banks, in
implementation activities.
On the other hand, regulation works were completed relating to measurement and evaluation
of interest rate risk emanating from transactions of banks except purchase and sale and evaluation
of that, in a manner to be pursuant to the Directive No.2006/48/EC of EU. The Regulation on
Measurement of Interest Rate Risk Emanating from Banking Accounts with Standard Shock
Method and Evaluation Thereof was published in Official Gazette dated 23 August 2011. Although
the regulation was come into force, the adaption to rational limits shall be obligatory as of 1 July
2012.
Relating to preparation of emergency action plan and management of risk relating to a
probable systematic risk that may arise in the sector, Financial Stability Committee is composed by
the participation of the Undersecretariat of Treasury, BRSA, SDIF and CBRT. While Systemic
Risk Coordination Committee, which was found within the scope of Protocol on Systemic Risk
Cooperation relating to Financial System, and was signed between these institutions, initiated to
operate in 2010 and has been maintaining its activities regularly.

Structural Reforms
67
In order to increase the stress test implementation capacity of BRSA, model based scenario
analyses were developed. Works on improvement of the model is continuing towards including
economic growth, real sector and current account data.
While routine relations with equivalent authorities in other countries and international
institutions maintained in foreign relations field, memorandum of understandings were signed with
Qatar Financial Center Regulatory Authority, German Federal Financial Supervisory Authority,
Croatian National Bank, Central Bank of Jordan, relating to information exchange and cooperation
in banking supervision field and thus, the number of countries signed MoU reached to 28.
4.2.2. Capital Market
At the end of 2010 and in 2011, the following steps were taken in order to protect investors
in the capital markets and create a stable and efficient market considering the EU directives:
With the amendmends adopted in the Capital Markets Law in Febuary 2011 and October
2011; all the administrative and judicial proceedings with regard to dematerialized
securities shall be fulfilled by the Central Registry Board members, new provisions have
been introduced for designing the dematerialization process of the capital market
instruments, changes have been made in the organisation structure of the CMB and stock
exchanges and all organized exchanges, the leveraged transactions on the foreign exchange
commodity, precious metals and other instruments determined by the CMB are regulated
and new powers have been given to the Capital Markets Board in terms of regulation and
enforcement of Corporate Governance Principles.
Necessary arrangements has been made in 2011 regarding trade of the shares of publicly-
held companies in ISE which are not traded in ISE but satisfy the condition of necessary
size and ISE is expected to complete relevant rules by the end of 2011.
The draft Communiqué regarding the principles split-off publicly-held companies have
been approved by the CMB and has sent to related Ministry for to be published in Official
Gazette.
Works has been performed for bringing private sector borrowing instruments into force and
developing the infrastructure regarding local administration borrowing instruments,
commercial papers, derivative products and interest-free financing instruments and in order
to develop new financial products and enhancing transaction volume of existing financial
products. In this regard, the total amount of outstanding private sector debt securities has
increased and warrants started to be traded at the market. For the first time Ijara Certificate
has been issued.
Works for securitization and activating housing finance market has been performed. In this
regard the first Asset Backed Security was issued in 2011.
In order to keep securities investment trusts in line with the financial developments, a new
communiqué of principles regarding securities investment trusts has been published. This
communiqué aims to improve corporate governance and portfolio management practices of
securities investment trusts by introducing new principles related to founding, public
offering, management and public disclosures.
With the amendments on the communiqué of principles regarding real estate investment
trusts, the requirement on the preparation of portfolio tables was abolished. Instead, real
estate investment trusts have begun to disclose all the information pertaining to their
portfolios via their financial statements. Thus, investors may have their own investment
decisions by analyzing every item of the portfolio in detail.
With the amendments on the communiqué of principles regarding portfolio management
companies, portfolio management companies are authorized to facilitate an intermediation
activity on buying and selling of fund units. So, an important step has been taken on the
way of the harmonization process between Turkish mutual fund regulation and the EU’s
regulations. Moreover, this amendment gives portfolio management companies the

Structural Reforms
68
opportunity to specialize on buying and selling of mutual fund units. The emergence of
portfolio management companies as a new player in the mutual fund market is expected to
increase the size of fund market, the number of investors in this market, and the
competition within this market. In addition, with the amendments on the communiqué
regarding portfolio management companies, the variety of financial assets for these
companies has been increased.
With the amendments on the Communiqué of principles regarding the Principles on
Investment Funds, a new fund called Short Term Bonds and Bills Fund has been created.
Moreover, in order to improve the public disclosure standards within the mutual fund
industry, the requirement for mutual funds to make disclosures through the Public
Disclosure Platform, which is available on the internet and open to all investors, has been
introduced. This amendment is expected to improve public disclosure facilities and
decrease the disclosure costs of mutual funds.
A new Communiqué on Corporate Governance Principles have been introduced.
Meanwhile, the corporate governance principles of CMB have been revised by taking into
consideration international developments and attached in the annex of the Communiqué.
EU founded Technical Assistance for Strengthening the Audit Capacity of CMB Project
was begun in November 2010 and ended in 2011. Based on the output report of this
project, preparation of regulation on IT Audit has begun.
In terms of surveillance between the markets, works for preventing market deteriorating
activities that may arise in the markets are continued by following up the spot market and
future markets transactions simultaneously.
Proxy information of investors, the list of insiders regarding ISE traded companies and the
amendments to said list of insiders have started to be attainable through Central Registry
System (CRS) in order to diminish the processes of surveillance and enforcement activities
pursuant to Capital Market Law.
Number of quality control inspections for audit firms that issue audit reports for financial
statements of publicly held companies and capital market institutions has been increased.
Regarding bilateral relations with the regulatory and supervisory bodies of other countries
in 2011, a Regulatory Dialog aiming the cooperation on supervision, regulation and
training between CMB of Turkey and US SEC has been signed, bilateral MoUs have been
signed with the securities regulators of Krygz Republic and Pakistan and also a joint
training program has been organized together with the US SEC with participants from the
region has also attended.
Regarding the tasks undertaken within the international organizations, COMCEC Capital
Market Regulators Forum has been established among the COMCEC member countries’
regulators and Chairman of the CMB is designated as the Chairman of the Forum.
Furthermore, as the Emerging Markets Committee Chair of International Organization of
Securities Commissions (IOSCO) the CMB has involved in the work on financial stability
issues in emerging markets and developing economies which is conducted by Financial
Stability Board. ın addition, regarding the OECD works conducted by the CMB, new joint
projects with ISE on corporate governance principles in MENA and Eurasia regions have
been introduced.
In January 2011, a web page for investors (www.yatirimyapiyorum.gov.tr) has been
launched to ensure that investors can access information about capital markets and
instruments easily and efficiently and a Facebook page called “Yatırım Yapıyorum” has
been launched in order to make public written and visual announcements about the
activities of CMB on financial education on social media.
The list of actions to be carried out in the period of 2012-2014 in order to increase supply
and demand in capital markets, ensure confidence and stability in the markets, create legislation in

Structural Reforms
69
compliance with the EU and international standards, and establish necessary infrastructure for
implementation of this legislation are as follows:
Within the framework of the Strategy and Action Plan on Istanbul International Financial
Centre, the works to prepare a new Capital Market Law which is in harmony with EU
regulations are continued. Following the enactment of law, secondary regulation works,
which ensure the compliance with EU regulations and market requirements, shall be made.
On the other hand before the enactment of the law, for the purpose of alignment with EU
acquis, the works have been continued on the secondary legislation which can be amended
without a change in the Capital Market Law.
Regulations will be made on the classification of financial services within the framework
of EU acquis and on the structuring of these services in a way to provide flexibility to
financial intermediaries in order to satisfy the needs of customers.
The promulgation of the sub-regulations and the authorization process of the intermediary
institutions related with the leveraged transactions will be progressed.
The upper limit of management fee regarding mutual funds will be changed in order to
increase fund returns and enhance the attractiveness of mutual funds for investors.
Regulations for activating housing finance and introducing new products such as real estate
investment fund and venture capital investment fund shall be made.
The process for improving surveillance of warrants is in progress.
Works are carried out in order to improve technical infrastructure of CMB-ISE Cooperative
Surveillance Programme.
Regulatory works regarding public disclosure of the information concerning future will
continue.
Works will continue for the development of private sector debt securities, securitization
products, derivative products and interest-free financing instruments markets.
Studies will be performed on reviewing corporate governance principles in accordance
with the EU legislation, international developments and the demands of the market
participants.
The project titled Strengthening the Capital Markets Board which has been approved
within the scope of 2008 Programming of EU Pre-Accession Financial Assistance, could
not be started due to the delays in the process and the absence of a potential twinning
partner. For this reason, work will be continued to divide the project accepted under the
IPA 2008 Programme into two separate new projects which would be financed from other
EU funds. In the first project, it is aimed at preparing of compliance drafts of capital market
legislation to EU legislation and improving the capacity of CMB. In the second project, it
is aimed at improving the IT capacity of CMB.
Participation to the international works on developing capital markets will be continued in
2012 and within this framework a joint seminar on emerging markets will be organized
with OECD. Moreover, MoUs will be signed with foreign securities regulators and
cooperation activities will be carried on increasingly. Also, activities related to the projects
on development of foreign countries’ capital markets and supported by the funds of World
Bank will be conducted.
In order to ensure development of capital markets, a series of activities to broaden investor
base in the market will be conducted by the CMB. To this end, it is planned to complete
National Strategy and Action Plan on Financial Education, to establish a Call Center to
Serve Capital Markets Investors, to organize seminars for university students and women
and to conduct some activities to increase financial awareness among school aged children
through essay contests, educative CD’s, games etc.
Structural Reforms
70
4.2.3. Insurance Sector
Important developments were experienced in insurance and private pension markets in 2011
and remarkable improvements were provided in terms of the quality of services supplied to
citizens.
In order to enable citizens to receive better service with respect to insurance products, a great
importance is attached to education activities in insurance sector. Within the framework of the
training programme, which was started in 2009 and completed between 2009-2010 and given to the
technical personnel of insurance agencies throughout the country, 46 thousand people have
recieved training. In the same period, two insurance expertise services have been procured and a
total of 802 insurance experts have started serving in the sector after the necessary training and
examinations by the Insurance Sector Education Centre. The work on starting a profession and
renovation education which are stipulated in secondary legislation about the actors (agent/expert/
broker/actuary/staffs in the insurance firm) operating in the insurance sector is continuing rapidly.
On the other hand, Insurance and Actuarial Education Workshop was organized on 19-20 April
2011. There were made some analysis of current status on vocational schools and colleges that
provide education in the field of insurance and actuary in this aforementioned workshop by the
participation of all relevant stakeholders. Moreover, solution proposals for the main problems were
also discussed. Moreover, an international insurance summit named Turkey, Central Asia, Middle
East, North Africa and the Balkans Insurance Summit: Turkish Insurance Sector Model was held
on 23-24 May 2011 as an Insurance Training Center organization. By this organization, experience
of Turkey’s insurance sector, which has internationally well-known and good example institutions,
was shared with participating countries.
In order to disseminate insurance concept in the society, to make society conscious of
insurance and to increase insurance awareness, Insurance Awareness and Promotion Strategy is
published by the Undersecretariat of Treasury. Within the context of this strategy, the week starting
from Monday of the last week of every May is declared as Insurance Week, and in first of these, in
30 May-5 June 2011 activities were organized towards increasing social insurance consciousness.
The Arbitration Commission, for which legal and operational infrastructure works were
completed in 2009, began to accept applications in October 2009. As of 31 September 2011,
number of the member organizations to the system is 48. On the other hand, there are currently 141
insurance arbitrator registered in the list of arbitrators. As of November 2011, within the context of
applications, 1643 applications were made to Insurance Arbitrators Commission and 831 conflicts
were concluded by insurance arbitrators in this process. It is observed that, with activities from its
start, this system has contributed to establishing confidence in the sector and also decreasing the
number of cases in the courts.
4.3. Labor Market
Within the framework of a sustainable growth focused on employment, developing
employment opportunities in line with the requirements of a competitive economy and information
society, reducing unemployment, attaining a more flexible labor market structure while
maintaining security, establishing an effective relationship between education and employment and
extending active labor programmes are the main priorities.
As of 31 December 2010, 53.7 million people out of a total population of 73.7 million are at
working age in Turkey. While the share of 0-14 age group in the total population is decreasing, the
share of working age population and elderly population is increasing.
With the help of the recent efforts aiming to increase employment and decrease
unemployment in the Turkish labor market there have been remarkable improvements regarding
the labor market in 2010. According to Household Labor Force Survey in 2010, labor force
participation rate increased from 47.9 to 48.8 compared to previous year and reached the highest
level since 2002. Labor force increased by 3.6 percent and employment rate went up by 6.2 percent
in 2010. Considering the 9 percent of growth rate and significant rises labor force participation rate
in 2010, the importance of the increase in employment becomes clear. Furthermore, the number of

Structural Reforms
71
unemployed, which decreased by 12.2 percent in 2010, have declined for the first time since 2005.
Due to the impact of the global crisis, unemployment rate which increased to 14 percent in 2009,
decreased to 11.9 percent in 2010 and to 9.2 percent as of August 2011. These positive
improvements reflected to the non-agricultural and young unemployment rates as well. Non-
agricultural unemployment rate declined from 17.4 percent in 2009 to 14.8 percent in 2010 and in
the same period young unemployment rate decreased from 25.3 percent to 21.7 percent. As of
August 2011, these rates were realized as 11.9 percent and 18.6 percent, respectively.
Table 4.5: Main Employment and Labor Indicators
(15 + Age, Percent)
Turkey EU-27
2008 2009 2010 2008 2009 2010
Labor Force Participation Rate (LFPR) 46.9 47.9 48.8 57.6 57.6 57.5
Female 24.5 26.0 27.6 50.2 50.5 50.5
Male 70.1 70.5 70.8 65.5 65.2 64.9
Employment Rate 41.7 41.2 43.0 53.6 52.5 52.0
Female 21.6 22.3 24.0 46.5 46.0 45.6
Male 62.6 60.7 62.7 61.2 59.4 58.7
Unemployment Rate 11.0 14.0 11.9 7.1 9.0 9.7
Female 11.6 14.3 13.0 6.7 9.1 9.7
Male 10.7 13.9 11.4 7.6 9.0 9.6
Rural 7.2 8.9 7.3 - - -
Urban 12.8 16.6 14.2 - - -
Youth Unemployment Rate (15-24) 20.5 25.3 21.7 15.5 19.8 20.9
Non-Agricultural Unemployment Rate 13.6 17.4 14.8 - - -
Source: TURKSTAT, EUROSTAT
The population out of labor force decreased in 2010. On the other hand, unlike the previous
years the number of people who are ready to work but not looking for job have been decreased for
the first time since 2007.
Analyzing the total labor force participation and employment rates by gender, which are
lower than the EU averages but displaying increasing trends, it is observed that these are high for
male but low for female compared to the EU averages. In 2010, while female participation rate
remained around at 50.5 percent in EU, this rate increased by 1.6 percentage points and reached
27.6 percent in Turkey. At the same period, female employment rate decreased by 0.4 percentage
point and declined to 45.6 percent in EU, whereas this rate increased by 1.7 percentage points and
reached 24 percent in Turkey. While unemployment rate decreased significantly in Turkey, it
increased by 0.7 percentage point and reached 9.7 percent in EU. Despite the recent remarkable
improvements in the labor market, female participation and employment rates are still lower than
the EU level. With migration to the urban areas from rural areas, women, who were previously
employed in agricultural activities in rural areas, can not participate in the labor force due to the
insufficiency of their qualifications for urban jobs. Besides, even when they are employed, they
generally work with low wages and in the unregistered sectors. This situation crates an impediment
in front of the entry of women into the labor market.
Scrutinizing the employment by sectors, it is observed that the highest amounts of jobs were
created in industry sector among the non-agricultural sectors. In 2010, while growth rate was 12.6
percent in industry, 17.1 percent in construction, 8.5 percent in services sector and 2.4 percent in
agriculture, employment increased by 10.2 percent in industry, 9.6 percent in construction, 3.1
percent in services and 8.5 percent in agriculture sector. The increasing trend in the share of
agricultural employment since 2007 continued in 2010 as well.
In line with the improvements in the labor market, informal employment rate decreased by
0.5 percentage point and dropped to 43.2 percent, while this rate in non-agricultural sectors
decreased by 1.1 percentage points and declined to 29 percent in 2010.
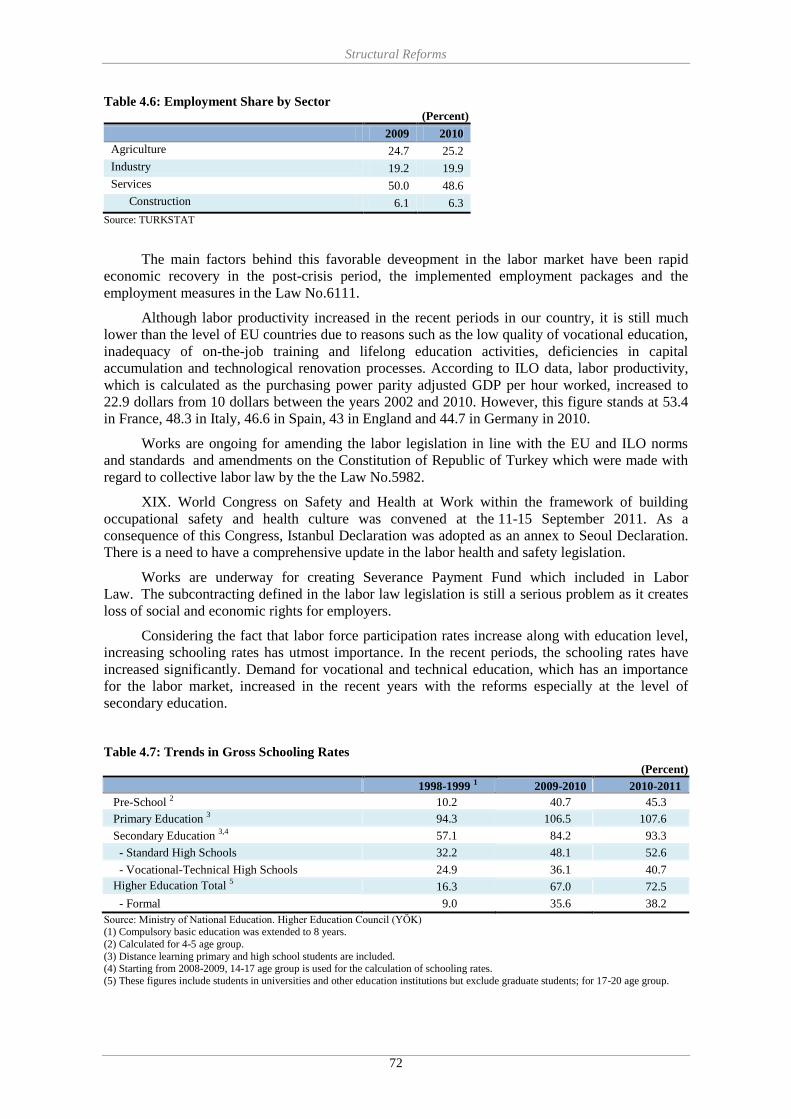
Structural Reforms
72
Table 4.6: Employment Share by Sector (Percent)
2009 2010
Agriculture 24.7 25.2
Industry 19.2 19.9
Services 50.0 48.6
Construction 6.1 6.3
Source: TURKSTAT
The main factors behind this favorable deveopment in the labor market have been rapid
economic recovery in the post-crisis period, the implemented employment packages and the
employment measures in the Law No.6111.
Although labor productivity increased in the recent periods in our country, it is still much
lower than the level of EU countries due to reasons such as the low quality of vocational education,
inadequacy of on-the-job training and lifelong education activities, deficiencies in capital
accumulation and technological renovation processes. According to ILO data, labor productivity,
which is calculated as the purchasing power parity adjusted GDP per hour worked, increased to
22.9 dollars from 10 dollars between the years 2002 and 2010. However, this figure stands at 53.4
in France, 48.3 in Italy, 46.6 in Spain, 43 in England and 44.7 in Germany in 2010.
Works are ongoing for amending the labor legislation in line with the EU and ILO norms
and standards and amendments on the Constitution of Republic of Turkey which were made with
regard to collective labor law by the the Law No.5982.
XIX. World Congress on Safety and Health at Work within the framework of building
occupational safety and health culture was convened at the 11-15 September 2011. As a
consequence of this Congress, Istanbul Declaration was adopted as an annex to Seoul Declaration.
There is a need to have a comprehensive update in the labor health and safety legislation.
Works are underway for creating Severance Payment Fund which included in Labor
Law. The subcontracting defined in the labor law legislation is still a serious problem as it creates
loss of social and economic rights for employers.
Considering the fact that labor force participation rates increase along with education level,
increasing schooling rates has utmost importance. In the recent periods, the schooling rates have
increased significantly. Demand for vocational and technical education, which has an importance
for the labor market, increased in the recent years with the reforms especially at the level of
secondary education.
Table 4.7: Trends in Gross Schooling Rates
(Percent)
1998-1999 1 2009-2010 2010-2011
Pre-School 2 10.2 40.7 45.3
Primary Education 3 94.3 106.5 107.6
Secondary Education 3,4
57.1 84.2 93.3
- Standard High Schools 32.2 48.1 52.6
- Vocational-Technical High Schools 24.9 36.1 40.7
Higher Education Total 5
16.3 67.0 72.5
- Formal 9.0 35.6 38.2
Source: Ministry of National Education. Higher Education Council (YÖK)
(1) Compulsory basic education was extended to 8 years.
(2) Calculated for 4-5 age group.
(3) Distance learning primary and high school students are included. (4) Starting from 2008-2009, 14-17 age group is used for the calculation of schooling rates.
(5) These figures include students in universities and other education institutions but exclude graduate students; for 17-20 age group.

Structural Reforms
73
In Turkey in 2010, 63.8 percent of the labor force, 64.2 percent of the employed people, and
60.3 percent of the unemployed people have less than high school education including the illiterate.
The mismatch between labor supply and demand due to the low qualification and productivity of
the existing labor force is an important factor reducing the efficiency of labor market.
Table 4.8: Education Level of the Labor Force in 2010
(Percent)
Labor
Force Employed Unemployed
Labor Force
Participation
Rate
Employment
Rate
Unemployment
Rate
Illiterate 4.5 4.8 2.3 19.8 18.6 6.0
Pre-High School 59.3 59.4 58.0 46.8 41.4 11.6
High Schools 10.6 10.2 14.2 51.4 43.2 15.9
Vocational and Technical High Schools 9.8 9.6 10.9 65.8 57.1 13.2
Higher Education 15.8 16.0 14.6 78.8 70.2 11.0
Total 100.0 100.0 100.0 48.1 43.0 11.9
Source: TURKSTAT
Active labor policies aimed at improving skills of the individuals who have low
qualifications and difficulties in entry to the labor market, creating jobs and training the labor force
maintain their importance. Hence, the resources allocated for active labor programmes are
increased in Turkey. The expenditures made by İŞKUR within the scope of active labor
programmes increased by 13.9 percent and reached almost 349 million TL in 2010.
Table 4.9: Active Labor Force Programs Provided by İŞKUR
Expenditure (TL) Number of Beneficiaries
2006 15,174,182 17,106
2007 29,671,865 33,597
2008 35,601,907 32,206
2009 306,366,045 213,852
2010 348,918,000 208,390
2011 1 165,750,000 175,808
Source: İŞKUR
(1) As of 30 September 2011.
In addition, 161.9 million TL was reserved for İŞKUR in the period of 2008-2012 within the
scope of GAP Action Plan. 76.6 million TL of the mentioned resource was spent as of November
2011. It is expected that this major resource allocated to GAP provinces will lead to an important
increase in employment in the region.
It is planned to employ 2,000 job and occupation consultants by İŞKUR’s local offices as of
the end of 2011. In 2012 additional 2,000 job and occupation consultants will be employed.
Impact Evaluation of İŞKUR’s Training Programmes Project, aiming to understand how
training programmes performing by İŞKUR affect trainees and how these programmes’ effects
differ across different groups, is implemented. Under this project, employment status of 5,700
trainee that participated İŞKUR’s trainings is being followed in 23 provinces.
Increasing Labor Market Intermediary Activities in favour of Employability of Long Term
Unemployed People which was supported by the Dutch Government was completed. At the end of
the project, in two pilot areas (Adana and Malatya) 100 people were employed. Besides 216
business consultants received trainings.
In 2010, 89,708 unemployed people received training in 4,332 general vocational courses
organized by İŞKUR. 42,447 unemployed people received training in 1,916 courses with
employment guarantee. Within the scope of the Public Works Programmes, 38,761 people
received training in 1,838 courses. Entrepreneurship training was provided to 8,306 people for

Structural Reforms
74
starting up their own business in 419 courses. Besides, 3,638 disabled and 5,243 convict and ex-
convict unemployed persons were provided vocational training by İŞKUR. A total of 15,054
unemployed persons were provided vocational training in 2010, in the context of placement of
unemployed persons receiving unemployment insurance.
Some progress was achieved in employment of women having problems regarding entrance
into labor market in 2010. As a matter of fact, while 29,453 unemployed women registered in
İŞKUR was placed in jobs in 2009, this figure increased to 49,697 in 2010. There was a significant
increase in employment of disabled persons, who constitute another group having problems in
entering to the labor market, in 2010 compared to 2009. While 26,405 disabled people were placed
in jobs in 2009, 31,962 disabled people were placed in jobs in 2010.
Labor market research conducted by İŞKUR since 2007 need to be reviewed to contribute to
the design and implementation of active labor programmes in accordance with the needs of market
at national and local level.
Within the framework of Operational Programme on Developing Human Resources of the
Instrument of Pre-Accession Assistance (IPA), İŞKUR manages the Operations of Encouraging
Employment of Young People, Improving Quality of Public Employment Services and Supporting
Employment of Women, of which the total budget amounts to 68 million euros.
The Operation of Improving Quality of Public Employment Services aims to improve the
quality and effectiveness of public employment services by means of increasing institutional and
administrative capacities of İŞKUR and Provincial Employment and Vocational Education Boards.
Within the scope of the Operation of Supporting Employment of Women, it is aimed to
support İŞKUR in order to eliminate the barriers for women to enter into labor market and to
facilitate their access to jobs and to provide them better work conditions, for the purpose of
improving employability of women. Within the scope of the project, it is planned to provide
entrepreneurship training for 4,000 women, child and elderly care training for 1,200 women,
career consultancy and guidance training for 180,000 women and employment guarantee trainings
for 12,000 women.
With the Law No.6111 that including important labor market regulation employees working
with the short-time contract entitled to benefit from unemployment insurance optionally, the
amount and coverage of short-time work benefit that currently equal to daily unemployment
benefit expended, when participated in training courses that financed by government ownership of
green card will continue; and for new workers that will be hired by the employers, under certain
conditions unemployment insurance premiums will be financed by Unemployment Insurance Fund
for 6-48 months until 2015.
Preparation works of National Employment Strategy aiming improvement of labor market,
decreasing unemployment and increasing skilled employment is planned to be completed by the
end of 2011 with the coordination of Ministry of Labor and Social Security and with the
contribution of social partners. This strategy is especially targeting to improve flexicurity
perspective in working life.
National and international markets increasingly demand labor who is creative, has high
analytical thinking abilities, can quickly adapt to new skills and can access information. In this
context, prepared new curricula are being implemented to improve the quality of education. On the
other hand, on-the-job training for teachers needs to be more effective.
In Turkey, there is a need to support formal and mass education with technologies, increase
informatics literacy qualities of teachers and students and develop information and communication
technology infrastructure in schools in order to equip students with technological competences.
Efforts are continuing to provide effective use of Information Technology (IT) classes in education
and disseminate broadband internet access services to all schools and educational institutions.
It is of utmost important to effectively direct vocational and technical education to provide
the qualified intermediate labor force required by the labor market. The share of students in

Structural Reforms
75
vocational and technical education increased to 43.6 percent by the 2010-2011 academic year. In
addition, combination of secondary-level vocational and technical educational institutions under
the Ministry of National Education with the new organizational law of the General Directorate of
Vocational and Technical Education has been an important development in terms of increasing the
efficiency of these institutions. Following this development, expectations has increased about a
formation of structure in the real sense, in terms of programs rather than different types of school.
Facilitating transitions between the different educational levels in order to reduce drop outs of
students from system Students and compensating failures, understandable and encouraging system
approach should be adopted. To address this approach in an integrated manner and carry out
practices within the vocational and technical education Vocational Education and Training
Strategy are being prepared. Moreover, in the context of Vocational High Schools to be more
efficient efforts are needed.
Efforts continue to develop the capacities of Professional Qualifications Agency, established
in 2006, to manage the national professional qualifications system. The Professional Qualifications
Agency, which is an important part of the national competences system, began its works for
improving the professional standards by considering the needs of labor market and for making
certification after evaluating the students. Also preparation of National Qualification Framework
will be finalized in 2012.
In order to handle vocational and technical education in integrity and to carry out the
implementations, the works for preparing Vocational Education and Teaching Strategy Document
continue. It is aimed to increase the quality of formal education and arrange vocational courses by
enhancing machinery and equipment infrastructure of 111 industrial and vocational high schools in
82 provinces and by providing in-service training for the teachers within the scope of the project
on Specialized Vocational Centres to be implemented with cooperation of the Ministry of National
Education, Ministry of Labor and Social Security, İŞKUR and TOBB.
Flexible working conditions prevalent in EU countries can not be practiced effectively in
our country. Dissemination of flexible working conditions is of particular importance to increase
employment, reduce unemployment and informal employment, and increase employment of
women and disadvantaged groups within the context of social inclusion. Within this framework,
the need to encourage flexible working forms and to strengthen their relation with social security
maintains its importance. In this context, some of the priorities that is planned to be implemented
in the next years are following:
Regulations that will enable to flexible working forms such as tele-working,
telecommuting, job-sharing and flexible working hours model will be enacted as well as
other forms in the Labor Law and these working types will be more spread and
implemented.
Severance Payment Fund will be established thereby preserving the acquired rights of
workers and competiveness of enterprises within the sustainable actuarial balance.
The Economic and Social Council will be restructured in order to increase the efficiency of
existing social dialogue mechanisms in our country.
The works on the Occupational Health and Safety Law will be completed and the audits in
this field will be improved.
In line with the increase of resources allocated to İŞKUR under the active labor market
programs, the physical environment and qualified staff needs of İŞKUR Provincial
Directorates will be met in order to ensure that these programs are implemented more
efficiently and the quality of services provided by İŞKUR is improved. Furthermore, the
career counseling services offered by İŞKUR will be scaled up and streamlined.
The activities of private employment agencies will be diversified. In this context, ongoing
works about required regulations that enable these agencies to contract temporary work
will be finalized.

Structural Reforms
76
Table 4.10: Matrix of Policy Commitments: Labor Market
(1000 Euros)
2010 2011 2012 2013 2014
1. Encouraging Employment of Young People Operation
A. Implementation Profile --- --- --- --- ---
B. Net Budgetary Effect -3,827 -140 -863 -100 ---
B.1. Direct Effect on Budgetary Revenues --- --- --- --- ---
B.2. Direct Effect on Budgetary Expenditures 3,827 140 863 100 ---
2. Improving Quality of Public Employment Services Operation
A. Implementation Profile --- --- --- --- ---
B. Net Budgetary Effect -331 -894 -631 -375 ---
B.1. Direct Effect on Budgetary Revenues --- --- --- --- ---
B.2. Direct Effect on Budgetary Expenditures 331 894 631 375 ---
3. The Women Employment Support Operation
A. Implementation Profile --- --- --- --- ---
B. Net Budgetary Effect -3,411 -915 -50 --- ---
B.1. Direct Effect on Budgetary Revenues --- --- --- --- ---
B.2. Direct Effect on Budgetary Expenditures 3,411 915 50 --- ---
Total Net Budgetary Effect
A. Implementation Profile --- ---- ---- --- ---
B. Net Budgetary Effect -7,549 -1,949 -1,544 -475 ---
B.1. Direct Effect on Budgetary Revenues ---- --- --- --- ---
B.2. Direct Effect on Budgetary Expenditures 7,549 1,949 1,544 475 ---
4.4. Agriculture Sector
4.4.1. Agriculture
The basic objectives of agricultural policies are; to ensure food security and safety and to
form a sustainable agricultural structure that is harmonized with the EU.
In this context, while the policy instruments are implemented to direct production according
to demand, priority will be given to the necessary transformation of the agricultural structure in
order to cope with the competition in the Union after Turkey's accession. Within this scope,
significant supports contributing to the structural transformation in the agriculture sector are given
in Table 4.9. In addition, projects for increasing the contribution of these supports to achieve
sustainable agricultural structure and technical support provided under the EU Financial
Cooperation are given in Table 4.10.
The works on the Law related to the establishment and duties of the Ministry of Agriculture
and Rural Affairs, which aim increasing the institutional capacity of public sector in the process of
structural transformation, have been completed. In this framework, Ministry of Food, Agriculture
and Livestock was established instead of Ministry of Agriculture and Rural Affairs by the Decree
Law No.639, dated 8 June 2011.
Veterinary Services, Phytosanitary Food and Feed Law No.5996 was enacted in June 2010 in
order to ensure harmonization with EU in the fields of food, feed, food hygiene, and veterinary
services. With enactment of this law, opening criteria of Chapter 12 which is about food safety,
veterinary services and phytosanitary is completed and the chapter is opened.
In order to prevent fragmentation of agricultural lands by inheritance, necessary amendments
will be made in related laws. Besides, land consolidation activities for decreasing investment
expenditures and expropriation costs in public irrigation projects as well as reducing the amount of
fragmented and scattered agricultural lands will be accelerated.
With the Direct Income Support (DIS) Programme introduced across the country in 2001,
15.8 million hectares of land was registered in 2008 and payments were made to approximately 2.4
million farmers. The share of area based payments including DIS payments in agricultural support
budget realized as 35 percent in 2008 while it was 80 percent in 2004. This share was realized as 27
percent in 2009 when DIS payments were abolished. In 2010 the share of area based payments in
the agricultural support budget was recorded as 36 percent. Within the scope of registration and

Structural Reforms
77
monitoring/control system which has been developed along with DIS implementation, conditional
area-based payments launched in 2004, such as organic farming, soil analyses, Environmentally
Based Agricultural Land Protection (ÇATAK), use of certificated seed and seedling and
unconditional area-based payments such as gas oil and fertilizer payments have been realized in
order to guide production.
Nonetheless, in order to provide structural transformation that is necessary for
competitiveness of livestock sector within the Union after full membership, the share of animal
husbandry supports, which was 7 percent in total support budget in 2004, increased to 24 percent in
2011 and this ratio is programmed to be 26 percent in 2012. In this context, fodder crops support
payments per decare (thousand square meters), milk incentive premium, pure bred cows payments
per head and additional payment implementations in case of being registered and free from diseases
cases were foreseen. In addition to implementation of the cattle identification system, Tagging and
Vaccination of Sheep and Goats Project having EU grant was started in 2009 for identification of
sheep and goats, second phases of Rabies Control Project and Foot and Mouth Disease Control
Project were launched in 2011. Works related to these projects are still in progress. Besides,
Restructuring of Border Inspection Posts Project, which commenced in 2007 within the scope of
EU Financial Cooperation in order to improve related administrative capacity, has been completed,
however the efforts for the elimination of the deficiencies related to the organizational capacity still
continue.
Moreover in line with EU harmonization efforts, works on the establishment of land parcel
identification system, which is main instrument of Integrated Management and Control System
used for forwarding and management of agricultural support, were started within the framework of
2011 Investment Programme.
On the other hand, meat prices began to increase as from August 2009 and reached its top
level in April and May 2010. In order to overcome such increase, import of breeding and butchery
living animal and carcass from the countries including the EU member states has been accelerated.
While the share of Supports Programme for Rural Development Investments, which is
implemented in order to establish institutional capacity for implementation of EU Rural
Development Policies, was 1.4 percent in total support budget in 2007, it is foreseen to be 5.7
percent in 2012 including national co-finance contribution for rural development program in EU
Pre-Accession Financial Instrument. While there is a need for regional differentiation in this
practice taking into account regional characteristics, it is also essential to consider the
complementarity of this program with similar practices expected to be realized in the coming
period within the scope of EU Financial Cooperation.
Pursuant to the Agriculture Insurance Law No.5363, within the scope of supporting
producer's insurance premium, 575,000 insurances related to the risks under assurance especially
on the subjects such as hail, frost, and animal life were issued as of October 2011 and it is expected
that this number will reach 630,000 at the end of the year. Hence, total amount of state aid is
expected to be 240 million TL at the end of the year.
In the framework of aforementioned issues, taking considering the requirements of EU
accession process as well, a support strategy will be prepared together with a timing schedule that
would enhance predictability with respect to the development of an infrastructure whereby the
ultimate goal will be agricultural holdings-based subsidies with the capability of area-based
administration and control, and ensuring efficiency and quality improvement through registration
that will enable structural transformation in animal husbandry and transforming animal stock to
pure culture race.
The activities in order to eliminate problems related to the quality and quantity of
agricultural statistical data and to improve information infrastructure and administrative structure
are programmed in a way of obtaining technical support in the scope of EU Financial Cooperation.
In this context, the studies of improvement of Farmer Registration System are continued in order to
establish an Integrated Administration and Control System having a ultimate goal of forming Farm
Registration System. In accordance with that, in the framework of Pre-Accession Financial

Structural Reforms
78
Cooperation, for the aim of monitoring the development of enterprises and contributing to policy
making process, projects related to establishing Farm Accounting Data Network and Land Parcel
Identification System and improvement of Ministry of Food, Agriculture and Livestock's statistical
capacity have been implemented.
In the fisheries sector, priority will be given to improve the institutional structure, increasing
the effectiveness of resource management in capture fisheries and ensuring environmentally
friendly production in aquaculture. In this context, in order to ensure sustainable fisheries, Fisheries
Law will be amended based on compliance with EU Common Fisheries Policy. In addition to that,
the works on construction of offices at the landing points, improvement of fisheries information
system and spreading the usage of remote sensing method for ensuring the effectiveness of control
services have been continued. Furthermore, the project named Introduction of Stock Assessment to
Fisheries Management System of Turkey aiming at determining legislative and institutional needs
and improving the human capacity in order to form a basis for the establishment of stock
assessment system was finalized in 2011.
The harmonization works related to the food safety, veterinary services and phytosanitary
legislation with the EU acquis and international standards are proceeding within the framework of
the strategy determined within the scope of the opening criteria of Chapter 12. Public investments
through modernization of laboratories and application of new food analysis methods as well as
accreditation works are continuing in order to reinforce the food control system.The compliance of
animal originated food processing enterprises with EU food legislation is mainly considered in the
framework of Law No.5996. According to the procedures and support mechanisms to be
determined, deficiencies of food enterprises are aimed to make up with modernization programs.
The privatization process of public sugar factories is still in progress and finalization of
amendments on sugar sector legislation are expected in order to activate quote management and
supervision. Privatization process of those factories is expected to be finished in 2014, at the latest.
Table 4.11: Matrix of Policy Commitments: Agriculture-I (Main Developments in Agriculture Support)
(1000 Euros)
2008 2009 2010 2011 2012 2013 2014
1. Area Based Supports
A. Implementation Profile --- --- --- --- --- --- ---
B. Net Effect on Budget -1,120,373 -580,053 -1,109,409 -967,407 -1,022,816 --- ---
B.1. Direct Effect on Budgetary Revenues --- --- --- --- --- --- ---
B.2. Direct Effect on Budgetary Expenditures 1,120,373 580,053 1,109,409 967,407 1,022,816 --- ---
2. Supports for Livestock Sector Pursuant to the Decree 2005/8503
A. Implementation Profile --- --- --- --- --- --- ---
B. Net Effect on Budget -577,826 -421,995 -629,514 -721,881 -810,272 --- ---
B.1. Direct Effect on Budgetary Revenues --- --- --- --- --- --- ---
B.2. Direct Effect on Budgetary Expenditures 577,826 421,995 629,514 721,881 810,272 --- ---
3. Support for Rural Development Investments
A. Implementation Profile --- --- --- --- --- --- ---
B. Net Effect on Budget -57,694 -114,684 -78,120 -130,544 -177,410 --- ---
B.1. Direct Effect on Budgetary Revenues --- --- --- --- --- --- ---
B.2. Direct Effect on Budgetary Expenditures 57,694 114,684 78,120 130,544 177,410 --- ---
4. Agricultural Insurance
A. Implementation Profile --- --- --- --- --- --- ---
B. Net Effect on Budget -24,568 -28,365 -35,236 -103,743 -114,514 --- ---
B.1. Direct Effect on Budgetary Revenues --- --- --- --- --- --- ---
B.2. Direct Effect on Budgetary Expenditures 24,568 28,365 35,236 103,743 114,514 --- ---
Total Net Effect on Budget
A. Implementation Profile --- --- --- --- --- --- ---
B. Net Effect on Budget -1,780,461 -1,145,098 -1,852,279 -1,923,575 -2,125,012 --- ---
B.1. Direct Effect on Budgetary Revenues --- --- --- --- --- --- ---
B.2. Direct Effect on Budgetary Expenditures 1,780,461 1,145,098 1,852,279 1,923,575 2,125,012 --- ---
Source: 2012 Annual Programme.
Note: The values of agricultural support budget in 2012 Annual Programme are converted to euro by using average exchance rates with respect to related years.

Structural Reforms
79
Table 4.12: Matrix of Policy Commitments: Agriculture - II (Important Projects in Agriculture 1)
(1000 Euros)
2008 2009 2010 2011 2012 2013 2014
1. Restructuring the Border Inspection Points Project
A. Implementation Profile --- --- --- --- --- --- ---
B. Net Effect on Budget 3,326 506 89 --- --- --- ---
B.1. Direct Effect on Budgetary Revenues 4,950 576 133 --- --- --- ---
B.2. Direct Effect on Budgetary Expenditures 1,624 70 44 --- --- --- ---
2. Controlling of Rabies Project (2)
A. Implementation Profile --- --- --- --- --- --- ---
B. Net Effect on Budget 1,598 209 --- 1,276 361 --- ---
B.1. Direct Effect on Budgetary Revenues 2,357 327 --- 1,549 443 --- ---
B.2. Direct Effect on Budgetary Expenditures 759 118 --- 273 82 --- ---
3. Tagging and Vaccination of sheep and goats
A. Implementation Profile --- --- --- --- --- --- ---
B. Net Effect on Budget --- 11,220 377 4,821 6,969 --- ---
B.1. Direct Effect on Budgetary Revenues --- 18,182 2,812 4,871 7,351 --- ---
B.2. Direct Effect on Budgetary Expenditures --- 6,962 2,435 50 382 --- ---
4. Avian Influenza and Human Pandemic Preparedness and Response
A. Implementation Profile --- --- --- --- --- --- ---
B. Net Effect on Budget -4,846 -4,108 -7,265 -5,872 --- --- ---
B.1. Direct Effect on Budgetary Revenues 2,293 1,095 --- --- --- --- ---
B.2. Direct Effect on Budgetary Expenditures 7,139 5,203 7,265 5,872 --- --- ---
5. Land Parcel Identification System Project
A. Implementation Profile --- --- --- --- --- --- ---
B. Net Effect on Budget --- --- --- 11,292 9,643 --- ---
B.1. Direct Effect on Budgetary Revenues --- --- --- 13,299 11,487 --- ---
B.2. Direct Effect on Budgetary Expenditures --- --- --- 2,007 1,844 --- ---
6. Combatting Against FMD Project (2)
A. Implementation Profile --- --- --- --- --- --- ---
B. Net Effect on Budget 10,477 10,298 311 8,558 8,910 --- ---
B.1. Direct Effect on Budgetary Revenues 15,715 15,407 444 10,392 10,862 --- ---
B.2. Direct Effect on Budgetary Expenditures 5,238 5,109 133 1,834 1,952 --- ---
Total Net Effect on Budget
A. Implementation Profile --- --- --- --- --- --- ---
B. Net Effect on Budget 10,555 18,125 -6,488 20,075 25,883 --- ---
B.1. Direct Effect on Budgetary Revenues 25,315 35,587 3,389 30,111 30,143 --- ---
B.2. Direct Effect on Budgetary Expenditures 14,760 17,462 9,877 10,036 4,260 --- ---
(1) In EU-funded projects, impact on budgetary revenues results from EU contributions with grant and investment component in the
related projects.
(2) Second phase implementation of projects were commenced in 2011.
4.4.2. Rural Development
In the Ninth Development Plan period (2007-2013) the main objective of the rural
development policy is to enable the rural community to achieve sustainable working and living
conditions in its region. In accordance with this purpose the Rural Development Plan (2010-2013),
prepared in line with the strategic objectives and priorities which were determined in the National
Rural Development Strategy (NRDS), was approved by the High Planning Council in August 2010.
In accordance with the basic framework mentioned in Rural Development Plan, the efforts to
finalize the draft document which aims to regulate basis and procedures of the Rural Development
Plan’s monitoring and evaluation structure are ongoing.
The works carried out by the National Fund regarding accreditation of the central
organization and local coordinators of the Agriculture and Rural Development Support Institution
(ARDSI) which will conduct the implementation and payment activities of the IPA Rural
Development Programme (or IPARD Programme) covering the period of 2007-2013 were
completed and application was made to the European Commission for conferring of management
Structural Reforms
80
on 22 July 2010. As a result of the auditing done by Commission’s officials, it is concluded that 17
of 20 provinces have necessary requirements for full accreditation. For the aforementioned
provincial authorities official accreditation decision was made also on 29 August 2011. For the
other 3 provinces namely Erzurum, Ordu and Van, accreditation process has completed and
approval of the Commission is on the way. Preparations for the extending IPARD Programme to 22
provinces concerning the second phase were started. Apart from the accreditation process, the
Multi-Annual Financing Agreement was signed among the parties concerning the EU assistance
amount of 290.5 million euro for 2007-2010 period under IPARD component. ARDSI announced
conditional call for proposal in 2010 for the projects which will be financed under IPARD
Programme. However, the unconditional call for proposals was also announced in July-October
2011 by ARDSI.
The implementations of the projects contributing to acceleration of rural development in
Turkey are continuing. Those are; Sivas-Erzincan Development, Anatolian Water Basins
Rehabilitation, Diyarbakır-Batman-Siirt Development, Ardahan-Kars-Artvin Development,
Improving Life Conditions of Small Scaled Farmers in East Black Sea Region, Çoruh River Basin
Rehabilitation, GAP Integrated Rural Development and Identification and Expanding of Local
Structure and Architecture in Rural Areas projects.
In order to manage the economic and social transformation process more effectively in the
rural areas; the attempts to enhance national capacity on different issues (mountain settlements,
village architecture, etc.) have been supported by pilot projects implemented with the cooperation
of central and local administration institutions which are bringing services to rural areas.
In the period of 2006-2010; Rural Development Investments Support Programme (KKYDP)
in which the projects on the subject of processing, packaging and storage of agricultural products,
irrigation systems and purchase of machinery and equipment were supported, was implemented.
Within the scope of the Programme implemented in a form of five-stages, in total, 916 million TL
was provided as grant support by the end of 2010. By the decision of Agricultural Support and
Guidance Council, KKYDP was extended five years more so as to cover the period of 2011-2015.
The codes of practice for the new period were drawn up by Council of Ministers’ Decision, no.
2011/1409 and the first phase of implementation was launched in 2011.
The Social Support Project in Rural Area (KASDEP) was completed in 2010 which had
being implemented in 81 provinces since 2003 through the cooperation of the former General
Directorate of Social Assistance and Solidarity and the former Ministry of Agriculture and Rural
Affairs for the poor people within the scope of the Law No.3294 in order to make them producers
through the agricultural and other non-agricultural income generating activities. A source of 669.6
million TL was allocated for KASDEP in the period of 2003-2010.
A resource of 550 million TL was allocated in 2011 for the Village Infrastructure Support
Project (KÖY-DES) which have been implemented in 79 provinces in order to eradicate the
infrastructure problems of villages and sub-villages other than Istanbul and Kocaeli provinces
regarding road and drinking water since 2005. Projects regarding small-scaled irrigation and
sewerage systems were included in KÖY-DES in 2010 and 2011, respectively.
4.5. Administrative Reform
4.5.1. Strategic Planning and Performance Based Budgeting
Within the framework of Public Financial Management and Control Law No.5018, strategic
planning and performance-based budgeting works which aim allocation of public resources to
priority public services and use of these resources in an efficient, effective and economical manner
at public administrations, continue. The transition program which is laid down in the Regulation on
Principles and Procedures regarding Strategic Planning in Public Administrations has been
completed as of 2010. Whole of the public institutions in the transition program, except five, has
prepared their first strategic plans. Preparations of strategic plans in new public institutions have
been continuing.
Structural Reforms
81
Preparation of strategic plans by the State Owned Economic Enterprises (SEEs) is decreed
by the General Investment and Financial Programmes of 2008 and 2009 upon the Decision of the
Council of Ministers. Within this scope, 16 out of 19 SEEs completed their strategic plans as of
December 2010 and works are in progress in the remaining three.
Ministry of Development carries out a project called Stakeholder Engagement in Strategic
Planning and Policy Making. The project made by the Ministry of Development aims to assess the
current status of engagement, create a framework in order to determine how engagement can be
more beneficial in strategic plan assessments and to increase awareness about engagement.
By-law on the Procedures and Principles of Strategic Planning in Public Administrations
which was enacted in 2006 and the Strategic Planning Guide for Public Administrations will be
reviewed in the light of the previous studies and experiences, and necessary amendments will be
made in 2012 in order to overcome the problems encountered and to enable the system function
more effectively.
Preparation works for the IPA project titled as Improved Strategic Management Capacity for
Central Administrations were completed and the project is currently at the bidding phase.
Implementation of the project is expected to start in year 2012. By this project, capacity
improvement activities, for the Ministry of Development, other administrations having central
guidance role and administrations under the obligation of preparing strategic plans, will be carried
out in the area of strategic planning. Besides, a monitoring and evaluation system will be set up for
strategic plans.
The performance programmes prepared by the administrations which completed their
strategic plan works based on the By-law on the Performance Programmes to be Prepared by
Public Administrations and the Performance Programme Preparation Guide regulated by the
Ministry of Finance pursuant to the Law No.5018, shall be submitted to the Plan and Budget
Commission in order to be evaluated together with the budgets of the related administrations during
the meeting on the Draft Law regarding Central Management Budget.
In this context, the General Directorate of Budget and Financial Control of the Ministry of
Finance developed a Performance Budget Module within the e-budget system in order to create
cost tables with parameters of the performance programme, provide infrastructure in establishment
of budget connection and to collect and report the data centrally. Besides, the Performance
Monitoring and Evaluation section has been added to the mentioned module and put into service
for the use of public administrations in order to monitor, evaluate and report the performance
programmes.
In addition to technical assessments, Ministry of Finance monitors implementation and
realization level of performance programmes.
4.5.2. Economic and Social Council
Efforts are continuing to make changes in Economic and Social Council Law to make the
ESC more functional, with more participation in the context of European Union standarts.
4.6. Other Reform Areas
4.6.1. Regional Development
One of the five development axes defined in the Ninth Development Plan of Turkey
covering the period of 2007-2013 is Ensuring Regional Development. In the framework of
development approach based on local dynamics and internal potential, the main objectives of
regional development policies are as follows:
making central-level policies more compatible and effective,
increasing institutional capacity at local level,
disseminating economic development and social welfare across the country in a balanced
way,
Structural Reforms
82
directing inter-regional migration propensity towards intra-region,
ensuring balanced distribution of the population in space,
establishing a healthy urbanization structure,
reducing socio-economic development disparities between urban and rural areas by
enhancing welfare in rural areas.
In line with these goals and objectives, Regional Development High Council chaired by
Prime Minister has been established to strengthen governance by ensuring compliance and
coordination of regional development policies with other central level policies in decision making,
programming, implementation and monitoring. Council is the superior decision making body with
regard to regional development issues. In addition to that, Regional Development Committee has
been established to analyse regional development policies at technical level and to create
suggestions for the Council. Committee is composed of high level representatives of the member
ministries of the Council.
Preparation studies for National Regional Development Strategy aiming to ensure national
level coordination of regional development and competitiveness, to strengthen the compliance
between spatial and socio-economic development policies and to create a general framework and
guidance for the regional and local scale plans and strategies, is ongoing.
Eastern Anatolia Project Regional Development Administration, Konya Plain Project
Regional Development Administration and Eastern Black Sea Project Regional Development
Administration have been established as affiliated institutions to the Ministry of Development, in
order to contribute development of their regions by coordinating daily activities of the projects on
Eastern Anatolia, Konya Plain and Eastern Black Sea and the planning, programming, monitoring
and evaluation of the investment projects in those regions.
Particularly in the less developed regions, Growth Centres that have high growth potential
and that can serve to their periphery are determined. Works for the better accessibility of these
centres and fortification of their physical and social infrastructures have continued. Studies for the
special support programme that started in 2008 have been continued also in 2011. Within the
context of the Growth Centres Programme, 14.9 million TL in 2008, 18.2 million TL in 2009 and
17.6 million TL in 2010 were allocated to the beneficiary institutions responsible from the projects
in Diyarbakır. Furthermore, as part of the programme implementation whcih is extended to
Erzurum, Şanlıurfa and Van provinces, 16.7 million TL were allocated to Erzurum, 28.2 million
TL to Şanlıurfa and 14.9 million TL to Van in 2010. Budget of the programme for 2011 is 79
million TL.
In the GAP region, the amount of investment allocated at the beginning of 2008 increased to
2 billion TL from 1 billion TL in the mid-year as a result of the entry of GAP Action Plan into
force. In 2009, 2010 and 2011, 3 billion TL, nearly 4 billion TL and 4.3 billion TL were allocated
for total investments in the region respectively. As a result, share of investments in the region in the
total public investments rose to approximately 14 percent from the level of 7 percent along with the
start of implementation of GAP Action Plan.
For GAP AP, there is a need for financial resource amounting to 27.2 billion TL in terms of
2011 prices in the period of 2008-2012 for the projects and activities more than 300. It is envisaged
that 23.6 billion TL of this resource will be allocated from the central budget. Allowance for the
investments within the scope of GAP AP in 2008 was 1.9 billion TL. The total allowance allocated
to the activities within the scope of GAP AP was 2.66 billion TL, 3.24 billion TL and 3.28 billion
TL for the years 2009, 2010 and 2011 respectively.
Establishment of development agencies which are considered an important tool in regional
development policies was completed in all NUTS II regions. On the first stage, the agencies have
focused on institutional capacity building, publicity and rising awareness activities. The agencies
began rapidly to work for determining priority areas of the region and providing financial and
technical support for the projects in these areas.

Structural Reforms
83
As of July 2011, regional plans were prepared in all of 26 NUTS II regions under the
coordination of development agencies.
Project supports which have been provided since 2008 by development agencies are
increasing in terms of the number of supporting agencies, number of supported priority
areas and projects and amount of support.
As of November 2011, all agencies made calls for proposals at least for once,
14,303 project applications were made in total, 2,434 projects were supported and
an amount of 833 million TL was allocated to projects.
20 agencies have carried out calls for proposal amounting to 322 million TL in 43
priority areas as of November 2011.
Additionally, the agencies began to, direct activity support and technical support in
the regions. Consolidated table for the financial support is provided below.
Tablo 4.13: Information on Regional Development Agencies
Grant Programme/Direct Financial Support Provided by Development Agencies (Million TL)
Year Priority Area Grant Amount* Project Application Supported Projects
2008 6 46 1,129 258
2009 9 93 2,576 406
2010 55 373 9,442 1,798
2011** 43 322 1,156 -
Total 113 833 14,303 2,434
Direct Activity Support Pogramme (Million TL)
Year Number of Programs Grant Amount* Project Application Supported Projects
2009 1 0.3 11 6
2010 8 4.4 559 111
2011** 26 19.8 --- ---
Total 35 24.5 570 117
Technical Assistance Programme (Million TL)
Year Number of Programs Grant Amount* Project Application Supported Projects
2010 6 2.3 367 271
2011** 21 11.8 - -
Total 27 14.1 367 271
Number of Staff in Development Agencies
Year General Secretary Internal Audit Specialist Officer
2011*** 26 16 746 148
Total 936
* For 2008-2010 years contractual, for 2011 declared.
** Process is continuing.
*** As of November 2011.
The Work Programme, Budget and Accounting module in Development Agencies
Management System was opened to the use of development agencies. Process modeling was
completed for all other modules. Software development works are continued for these modules.
The activities regarding monitoring and evaluation of regional development programmes
implemented within the scope of financial cooperation between Turkey and the EU for 2004-2006
period were transferred to relevant development agencies.
With the implementation of regional development programs co-financed in the scope of
Turkey-EU financial cooperation, project preparation, implementation and monitoring capacity in
development unions and governorships responsible for coordinating programs in the region were
built and further developed. It is aimed to transfer the existing capacity at local level to agencies
and to develop it by means of agency resources.

Structural Reforms
84
In order to ensure effective, efficient, transparent and accountable functioning of the IPA
system in Turkey and to contribute to the preparations of Turkey for the EU Cohesion Policy,
technical assistance project entitled as Capacity Improvement in Economic and Social Cohesion
Policy II (ESC-II) and financed under IPA component I was started as of 6 September 2011.
Within the context of the project, capacity building activities for the institutional actors taken part
in implementation of components III and IV of IPA and preparations for Structural Funds will be
undertaken.
Studies on the design and infrastructure of Province Coordination and Monitoring System
(PCMS), developed for handling investments and socio-economic developments in a local and
regional development perspective, has been finalized within the framework of TUBİTAK
Programme for Supporting Research and Development Projects of Public Institutions. The project
was commenced on 1 March 2009. The first prototype was put into operation as of 4 February 2010
and the second one in 21 October 2010. Currently, there are nearly 7,000 users of the system in 81
provinces. Studies for putting PCMS into service for central institutions and establishing
infrastructure for integration of PCMS are continuing. Meetings were held with relevant
institutions and organizations in education, health and energy sectors and necessary data were
gathered. A contract was signed with TURKSTAT for data integration.
Table 4.14: Matrix of Policy Commitments: Regional Development
(1000 Euros)
2010 2011 2012 2013 2014
1. GAP Action Plan
A. Implementation Profile --- --- --- --- ---
B. Net Effect on Budget -1,735,270 -1,837,606 --- --- ---
B.1. Direct Effect on Budgetary Revenues --- --- --- --- ---
B.2. Direct Effect on Budgetary Expenditures 1,735,270 1,837,606 --- --- ---
2. Development Agencies
A. Implementation Profile --- --- --- --- ---
B. Net Effect on Budget -226,347 -192,307 -192,307 -190,677 ---
B.1. Direct Effect on Budgetary Revenues --- --- --- ---
B.2. Direct Effect on Budgetary Expenditures 226,347 192,307 192,307 190,677 ---
3. KÖY-DES
A. Implementation Profile --- --- --- --- ---
B. Net Effect on Budget -833,333 -235,042 --- --- ----
B.1. Direct Effect on Budgetary Revenues --- --- --- --- ---
B.2. Direct Effect on Budgetary Expenditures 833,333 235,042 --- --- ---
Total Net Effect on Budget
A. Implementation Profile --- --- --- --- ---
B. Net Effect on Budget -2,794,950 -2,264,955 --- --- ---
B.1. Direct Effect on Budgetary Revenues --- --- --- --- ---
B.2. Direct Effect on Budgetary Expenditures 2,794,950 2,264,955 --- --- ---
4.6.2. Health and Social Security Reform
4.6.2.1. Health Transformation Program
The Health Transformation and Social Security Reform Project, that is continuation of the
Health Transition Project of which first stage was completed in 2009, is amount of 81.1 million
dollars and will be carried out between the second half of 2009 and 2013.
Within the framework of the Health Transformation Program, institutions responsible for
health services provision will be restructured. In this context, firstly, the organization law of the
Ministry of Health will be renewed in order to strengthen its planning and supervisory role, and
Refik Saydam Hygiene Centre will be transformed into the National Public Health Institution with
Structural Reforms
85
international accreditation. In order to enhance service quality and efficiency, public hospitals will
be gradually given administrative and financial autonomy. Turkey Medicine and Medical Devices
Agency will be established to regulate production, import, export, provision and use of drugs, of
substances used in drug production and of medical devices. It will also ensure that they will be
delivered to the society safely, effectively, in good quality and in compliance with standards.
Considering the fact that old age population of our country will increase gradually, it is
important to diversify the preventive health services regarding the non-communicable diseases.
Program for Struggling and Controlling Obesity (2010-2014) in Turkey was prepared under the
coordination of the Ministry of Health and put into implementation with the Prime Ministry Notice
numbered 2010/22 in order to increase the level of information on preventing obesity which
increases in prevalence in our country and to encourage people to gain the habit of sufficient and
balanced nutrition and regular physical activity. Besides, Program for Preventing and Controlling
Cardiovascular Diseases was prepared by the Ministry of Health and it has been put into
implementation in 2011.
In order to reduce the deficit of health personnel, in particular physicians, an increase of 80
percent in the quotas of faculties of medicine, and an increase of 60.5 percent in the quotas of nurse
schools were recorded in the period of 2008-2011.
Aiming to make medical care and rehabilitation of old or bedridden patients in their own
houses instead of health institutions and to shorten hospitalization durations, the implementation of
the directive of home care services supply by the Ministry of Health is ongoing in 69 provinces as
of October 2011.
The Central Hospital Appointment System Project, which aims to activate health information
system, has been implemented in public hospitals in 69 provinces as of October 2011 and it is
targetted to be spread to all country by 2012.
While the ratio of public health expenditures to GDP was 3.7 percent in 2002, this rate stood
at 4.5 percent in 2010 and is expected to be 4.4 percent in 2011. The increase in health
expenditures with the effect of the capacity increase in health service supply, improvement of
accessibility of services and increase in exchange rate caused an increase in public health
expenditures as of years.
4.6.2.2. Social Security Reform
Legislation works about social security reform has been completed to a great extent. The
works for establishing a financially sustainable, quality service supplying social security system
with effective audit mechanisms are in progress within the Social Security Institution (SSI). Within
this scope, projects for bringing all insurance operations to automation are being carried on.
Health expenditures of people under the Green Card system, which enables citizens without
financial power to recieve health services, will be transferred to SSI as of 1 January 2012. With
Law No.6111 which entered into force in 2011, unpaid premium to SSI have been restructured,
scope of Social Securities and General Health Insurance Law No.5510 has been expanded in terms
of number of people covered. Besides, in the mentioned Law, some arrangements about improving
SSI’s auditing capacity have been made.
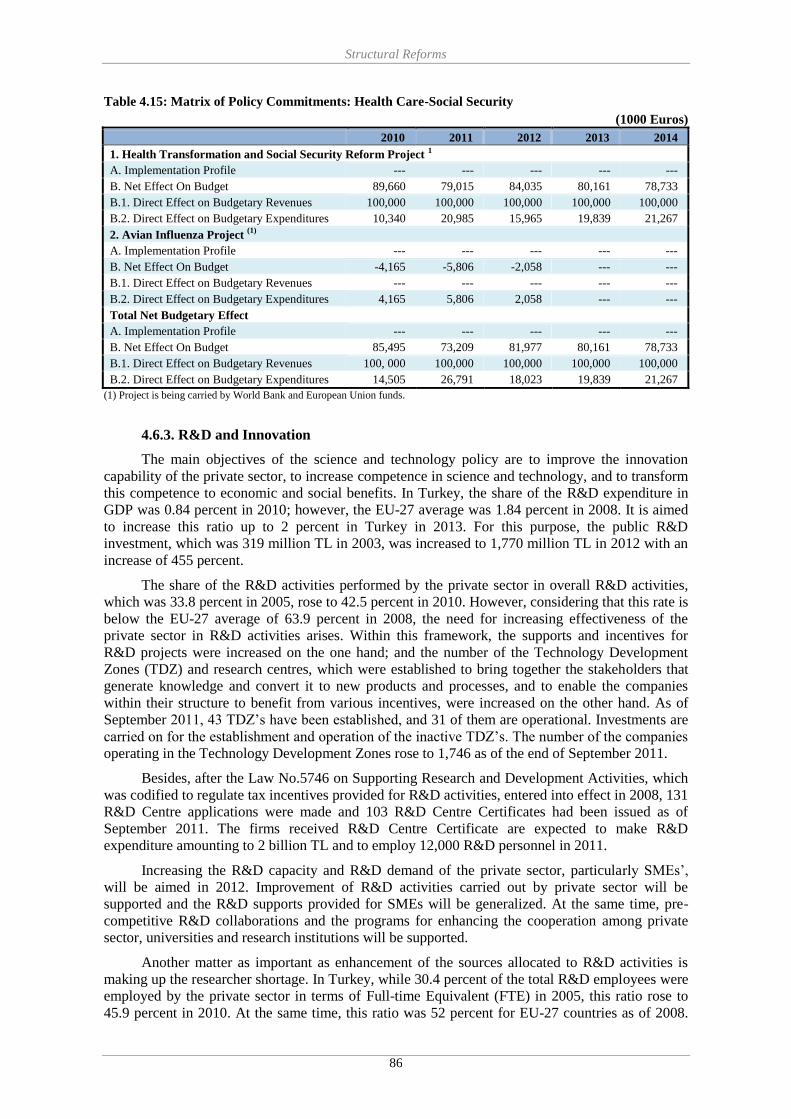
Structural Reforms
86
Table 4.15: Matrix of Policy Commitments: Health Care-Social Security
(1000 Euros)
2010 2011 2012 2013 2014
1. Health Transformation and Social Security Reform Project 1
A. Implementation Profile --- --- --- --- ---
B. Net Effect On Budget 89,660 79,015 84,035 80,161 78,733
B.1. Direct Effect on Budgetary Revenues 100,000 100,000 100,000 100,000 100,000
B.2. Direct Effect on Budgetary Expenditures 10,340 20,985 15,965 19,839 21,267
2. Avian Influenza Project (1)
A. Implementation Profile --- --- --- --- ---
B. Net Effect On Budget -4,165 -5,806 -2,058 --- ---
B.1. Direct Effect on Budgetary Revenues --- --- --- --- ---
B.2. Direct Effect on Budgetary Expenditures 4,165 5,806 2,058 --- ---
Total Net Budgetary Effect
A. Implementation Profile --- --- --- --- ---
B. Net Effect On Budget 85,495 73,209 81,977 80,161 78,733
B.1. Direct Effect on Budgetary Revenues 100, 000 100,000 100,000 100,000 100,000
B.2. Direct Effect on Budgetary Expenditures 14,505 26,791 18,023 19,839 21,267
(1) Project is being carried by World Bank and European Union funds.
4.6.3. R&D and Innovation
The main objectives of the science and technology policy are to improve the innovation
capability of the private sector, to increase competence in science and technology, and to transform
this competence to economic and social benefits. In Turkey, the share of the R&D expenditure in
GDP was 0.84 percent in 2010; however, the EU-27 average was 1.84 percent in 2008. It is aimed
to increase this ratio up to 2 percent in Turkey in 2013. For this purpose, the public R&D
investment, which was 319 million TL in 2003, was increased to 1,770 million TL in 2012 with an
increase of 455 percent.
The share of the R&D activities performed by the private sector in overall R&D activities,
which was 33.8 percent in 2005, rose to 42.5 percent in 2010. However, considering that this rate is
below the EU-27 average of 63.9 percent in 2008, the need for increasing effectiveness of the
private sector in R&D activities arises. Within this framework, the supports and incentives for
R&D projects were increased on the one hand; and the number of the Technology Development
Zones (TDZ) and research centres, which were established to bring together the stakeholders that
generate knowledge and convert it to new products and processes, and to enable the companies
within their structure to benefit from various incentives, were increased on the other hand. As of
September 2011, 43 TDZ’s have been established, and 31 of them are operational. Investments are
carried on for the establishment and operation of the inactive TDZ’s. The number of the companies
operating in the Technology Development Zones rose to 1,746 as of the end of September 2011.
Besides, after the Law No.5746 on Supporting Research and Development Activities, which
was codified to regulate tax incentives provided for R&D activities, entered into effect in 2008, 131
R&D Centre applications were made and 103 R&D Centre Certificates had been issued as of
September 2011. The firms received R&D Centre Certificate are expected to make R&D
expenditure amounting to 2 billion TL and to employ 12,000 R&D personnel in 2011.
Increasing the R&D capacity and R&D demand of the private sector, particularly SMEs’,
will be aimed in 2012. Improvement of R&D activities carried out by private sector will be
supported and the R&D supports provided for SMEs will be generalized. At the same time, pre-
competitive R&D collaborations and the programs for enhancing the cooperation among private
sector, universities and research institutions will be supported.
Another matter as important as enhancement of the sources allocated to R&D activities is
making up the researcher shortage. In Turkey, while 30.4 percent of the total R&D employees were
employed by the private sector in terms of Full-time Equivalent (FTE) in 2005, this ratio rose to
45.9 percent in 2010. At the same time, this ratio was 52 percent for EU-27 countries as of 2008.
Structural Reforms
87
The share of women researchers in the total researchers in terms of FTE, which is an important
criterion for gender equality in working life, was calculated as 34 percent for Turkey in 2007 while
this ratio was above the EU-27 average of 31 percent.
The number of academicians will be increased and balanced distribution of them will be
ensured across the country within the scope of enhancing researcher human resources. Besides, in
order to cover the academician shortage of developing universities, especially the newly
established universities, academician development programs will be expanded.
In line with enhancing scientific and technologic cooperation with the EU countries and
being a part of European Research Area, Turkey has participated to EU’s Seventh Framework
Programme on Science and Technology.
4.6.4. Information and Communication Technologies
Information Society Strategy covering the years 2006-2010 and its annex Action Plan has
been implemented, aiming at transforming Turkey into an information society, one of the main
objectives of Ninth Development Plan. Works are on progress for some certain actions on Action
Plan wich are not totally completed. Preparatory works have been launched to determine policies
and strategies on information society for the next period.
Within the objective of educating human resources required by information society, the
Ministry of National Education has provided broadband internet access to 96 percent of elementary
school students and to all of the secondary school students as of November 2010. The FATİH
Project includes distribution of tablet PCs to primary and secondary school students, provision of
interactive boards, laptops, other IT equipment and internet access infrastructure to approximately
620,000 classrooms. In addition to effective use of ICT in education, the project provides
opportunities for improvement of ICT literacy, deployment of broadband access infrastructure and
development of software and ICT services sector.
According to the Use of Information and Communication Technology (ICT) in Households
Survey announced by TURKSTAT in August 2011, the ratio of individuals using the internet in the
last three months is 45 percent, and 38.9 percent of those use the internet to interact with public
agencies. According to the ICT Usage in Enterprises Survey published by TURKSTAT in
November 2010, ratio of the enterprises that have internet access was 90.9 percent while ratio using
the internet to interact with the public agencies was 72.8 percent among these enterprises.
Within the objective of creating more qualified labor force which produces higher value
added, the Qualified Informatics Employees Project carried out by İŞKUR aims to train more
qualified informatics employees in the areas needed by the information and communication
technologies sector by means of the education programmes developed by international ICT firms.
As of July 2011, education programmes have been implemented in Ankara, Adana, Kayseri,
Denizli and Konya. Works for initiating the program in other cities are still in progress.
Besides commonly used e-government applications, the works on health and social security
applications, the third phase of Automation of Tax Administrations Project (VEDOP), Land
Registry and Cadastre Information System (TAKBİS), Central Registry System for Legal Persons
Project (MERSİS), and the Pilot Project on Citizenship Card are continuing.
Pilot implementation works on the project regarding the electronic citizenship card, which
will allow secure identity authentication in access of citizens to the services both in traditional and
electronic environments and replace the current paper based identity cards, were completed in
November 2010. It is targeted to begin the works for spreading it across the country in 2012.
The number of the electronic signature users has been increasing steadily. The number of
qualified electronic certificates has been around 251,000 by June 2010. 105,000 of these are being
used for mobile signature, which was put into practice in 2007. Many public and private
organizations are using e-signature in their institutional procedures.
e-Correspondence Project has been initiated to provide exchange of official correspondences
between the public institutions on digital environment. Within this scope, e-Correspondence
Structural Reforms
88
Technical Specification Document and related open sorce software has been released in November
2011. For implementing e-Correspondence Project, necessary legal arrangements will be developed
in the next period.
Thanks to constitutional amendment in 2010, the right of demand the protection of personal
data has been granted to persons. This right also covers right to obtain, delete and receive
information about proper usage and to request for correction regarding their personal data.
According to the Constitutional Amendment, personal data can only be processed, in the cases
provided by law or the person's express consent. This amendment also provisioned that principles
and procedures regarding personal data, shall be set fort by Law. The Draft Law on Protection of
Personal Data became null and void due to expiring of the legislative term. It is expected that the
draft law will be updated and presented again to TGNA.
Within the scope of the works carried out in the area of cyber crimes, Turkey signed the
Cyber Crime Convention of European Council No.185 on 10 November 2010. Besides the Cyber
Crime Convention, the works regarding approval of the Conventions No.108 and No.181 of the
Council will be started.
Following the enactment of the Electronic Communications Law in November 2008, works
on harmonization of secondary legislation with this Law has been initiated. ITCA continued its
efforts in this respect in 2011.
As of June 2011, fixed telephone, mobile telephone and broadband subscriber penetration
rates are 21.4 percent, 86.5 percent and 15 percent in Turkey, respectively. At the same date, the
number of subscribers using broadband service over fibre optic connections was 190,000. As of the
end of June 2011, the number of 3G subscribers reached 24.8 million and the number of
subscribers using mobile broadband access services reached 3.6 million. As of November 2011,
552 authorizations were granted for 342 operators.
The effectiveness of alternative infrastructure operators in the market and coverage of their
fibre optic networks have been increasing lately. The length of fibre optic cables these operators
own reached 32,523 km in June 2011, while this figure was 9,216 km at the end of 2008. Within
the scope of mobile number portability, 35.4 million subscribers ported their numbers as of
November 2011. This number is 113,000 for fixed telephone numbers.
In 2011, Turkey has continued its works within the framework of EU Information and
Communication Technologies Policy Support Programme, which is one of the components of the
Competitiveness and Innovation Framework Programme of EU and to which Turkey has been a
party since 1 January 2009.
In line with the policy of transition to terrestrial digital broadcasting, the Law No.3984 on
Broadcasts of Radio and Television Organizations was repealed. In order to comply with the
developments in the broadcasting sector and the EU Acquis, the Law No.6112 Broadcast Services
and Organizations of Radio and Televisions was entered into force after being published on the
Official Gazette on 3 March 2011.
Draft Decree Law aiming gradual liberalization of the postal services market; establishment
of an effective competition environment; separation of policy setting, regulation and operation
functions in the postal sector; and restructuring the sector in line with relevant EU directives, was
submitted to the Prime Ministry.
4.6.5. Transportation
The enacment process of the draft bills of General Railway Framework Law and TCDD Law
and the complementary draft regulations on Railway Safety, Railway Operating License, Railway
Interoperability and Railway Infrastructure Access, all of which would bring a EU harmonized
structure and legal framework to the railway sector, have not been completed. However,
organizational structure of Ministry of Transport has been changed by Decree Law No.655 and
General Directorate of Railway Regulation was established, which is responsible for the

Structural Reforms
89
liberalisation of rail transport, certification of rail operators and rolling stock, regulation of public
service obligations, safety certification and, determination of rail infrastructure access price.
The tendering procedure of the Turkish Railways Reform Project, which aims at
determination of a strategy and preparation of an action plan regarding the railway reform, and
increasing the safety and interoperability capacity of infrastructure management and railway
enterprises which will be formed after restructuring of TCDD, and to increase the capacity of
infrastructure management on the allocation of railway infrastructure and on infrastructure
utilization pricing, has been completed and project works are going on.
Within the context of maritime transportation, in consequence of the studies made related to
sea safety, and realization of the country obligations about flag, port and coastal state controls,
Turkish Flag Register that moved to the white list following the Committee Meeting of Paris
Memorandum of Understanding maintained its position.
Within the scope of the membership to EU process, Approved Design Organizations
Regulation (SHT 21.T), Regulation on the Oversight of Safety in Air Traffic Management (SHY-
GÖZETİM), Regulation on Use of Risk Assessment and Reduction Methods by the Air Navigation
Service Providers (SHT 65-04), Regulation on Use of Safety Management Systems by the Air
Navigation Service Providers (SHT 65-03), and Language Proficiency Regulation (SHT-1L) are
published in 2011.
Within the context of EU harmonization process, Computerized Reservation Systems
Regulation (SHT-CRS) is published in 11 October 2011. All necessary works on Passenger Rights
Regulation have been completed and the regulation has been sent to the Office of Minister to be
sent to Prime Ministry.
It is demanded that, Legislation Concerning the Rights of Disabled Persons and Persons with
Reduced Mobility Travelling by Air, which is classified under the secondary legislation in the EU
Strategy 2011 Progress Report, be assessed together with those works which are envisaged to be
assessed with our full membership to EU.
Technical Support to the General Directorate of Civil Aviation on Sector Strategy Document
Preparation Project, which has a budget of 200,000 euros, was started on 5 May 2010 with the
opening meeting and has been completed on 15 June 2011.
Another project accepted in 2010 was the Preparation of a Feasibility Report regarding the
Education Centre Planned to be established from the EU IPA Fund within the scope of Enhancing
Administrative Capacity in the Field of Education on Security and Safety Requirement of Turkish
Civil Aviation Project, with a budget of 200,000 euros and 6 months duration, and it has been
completed on 24 May 2011.
In addition, the fourth project whose application was approved in 2010 was the Project of
Increasing Administrative Capacity of General Directorate of Civil Aviation regarding Emission
Trade System, with 3 months duration and 160,000 euros budget, and it has been completed on
September 2011 succesfully.
Application within the Accessible Airport Project of ISG International Airport Investment
Development and Operation Inc. who is operating in Sabiha Gökçen Airport was completed and
the company has been entitled as an Accessible Airport Institution. Efforts by İstanbul Airport
Operations in Atatürk Airport and Fraport IC İçtaş Antalya Airport Terminal Investment and
Operations in Antalya Airport are underway under the scope of the Accessible Airport Project.
In compliance with 185/2010 EU Acquis, SHT No.17.2 Civil Aviation Safety Trainings and
Certification Direction was published. By means of this direction, authorizations of aviation safety
instructor, training institution and training subjects have been provided. Besides, a project was
prepared with a project cost of 700,000 TL under same directions to bring training and test
requirement for civil aviation security personnel to be authorized.
In the field of road transportation, by means of the Road Transportation Law which was put
into effect in 2003 and a series of legislations made with regard to this Law, it is aimed to develop

Structural Reforms
90
a strong and competitive sector. On 15 August 2007, with a contract signed between the
Privatization Administration and a Trilateral Consortium, the establishment and management of
vehicle control stations has been transferred to this Consortium for 20 years. The objective is to
increase the road traffic safety with more effective and healthier technical controls within EU
standards. Within this context, 193 immobile and 73 new mobile stations have been set up in all 81
provinces by the private sector as of November 2011.
To make weight and size controls of the commercial vehicles possible in line with the EU
standards, a comprehensive investment plan has been prepared for increasing the number of control
stations up to 300 until the year 2020.
After completing domestic legal procedures as of 30 October 2009, Turkey has become a
party to the European Agreement (ADR) on the International Carriage of Dangerous Goods by
Road, and the said agreement entered into effect on 22 March 2010. The Regulation on
Transportation of Dangerous Goods by Road, which contains provisions with regards to the
implementation of this Agreement, was put into effect as of 1 January 2011. The studies on the
measures concerning the implementation of this regulation are carried on.
Communiqués published with the purposes of increasing road safety and environmental
protection, target withdrawal of vehicles older than 1979 model at first and then withdrawal of
vehicles older than 1985 model. With these Communiqués, 160,000 old commercial vehicles are
planned to be withdrawn from the domestic market until the end of 2013. Within this scope, the
number of scrapped old vehicles has been 61,415 as of 31 October 2011.
On the other hand, Strenghtening Weight and Dimension Controls of Commercial Vehicles
and Strengthening Intermodal Transport in Turkey Projects were approved by the EU Commission.
Intermodal Transport Project has already begun in November 2011 with partnership of the Ministry
of Transport and Public Works of Spain. The project regarding weight and dimension controls has
reached the tender stage, and this project is expected to begin in January 2012.
Table 4.16: Matrix of Policy Commitments: Transportation
(1000 Euros)
2010 2011 2012 2013 2014
1. Transport Operational Program1
A. Implementation Profile --- --- --- --- ---
B. Net Effect on Budget --- -8,345 -8,088 -25,565 ---
B.1. Direct Effect on Budgetary Revenues --- --- --- --- ---
B.2. Direct Effect on Budgetary Expenditures --- 8,345 8,088 25,565 ---
Total Net Budget Effect
A. Implementation Profile --- --- --- --- ---
B. Net Effect on Budget --- -8,345 -8,088 -25,565 ---
B.1. Direct Effect on Budgetary Revenues --- --- --- --- ---
B.2. Direct Effect on Budgetary Expenditures --- 8,345 8,088 25,565 ---
(1) Indicative amounts for Köseköy-Gebze and Irmak-Karabük-Zonguldak Railway Rehabilitation, Signalization and Technical
Assistance Projects.
4.6.6. Energy
The primary objective of the energy sector is to provide energy, which is required for
economic development and social progress, in a continuous, high quality and reliable manner with
minimum cost in a competitive free market. For this purpose, Turkey attaches utmost importance
and gives priority to realiz ing energy market reforms and adapting the national energy legislation
fully with the EU energy legislation. In this context, fundamental sectoral laws were completed to a
great extent and efforts for establishing a fully competitive energy market are continuing.
Turkey has determined as a national target to work synchronized with-parallel to European
Network of Transmission System Operators for Electricity (ENTSO-E) and to operate the
electricity system in a more economic, qualified and reliable manner by sharing backup. Technical
and administrative arrangements in this regard were completed and synchronized parallel trial

Structural Reforms
91
operation was started on 18 September 2010. In 2011, the second and third phases of trial operation
period were completed. Beginning from 2 June 2011, for electricity trade between Turkey, Greece
and Bulgaria a limited capacity allocation has been authorized in accordance with the European
Union rules and ENTSO-E practices. Along with this permission, electricity trade of 400 MW from
Europe to Turkey and 300 MW from Turkey to Europe has become possible.
For ensuring continuity in the petroleum market, keeping adequate amount of petroleum
stock to prevent risks in case of crises or extraordinary circumstances and to perform our country
obligations as required by international agreements, and aligning the stock system with the EU
legislation and establishing a more robust stock management, a draft bill has been prepared by the
Ministry of Energy and Natural Resources and is expected to be enacted in the next period.
With the aim of expanding the use of natural gas across the country, Energy Market
Regulatory Agency (EMRA) has held natural gas city distribution tenders for 58 distribution
regions so far and 53 winning companies have been awarded gas distribution licenses. Including
the 7 distribution licenses given before 2003 to the companies active in the natural gas using
provinces, the number of licenced distribution companies reached 60 and the number of gas
supplied distribution regions has reached 58. As a result of natural gas distribution tenders
performed by the EMRA since 2003, access to natural gas both in industry and residential sector
has been supplied in 63 of 81 provinces.
Increasing energy efficiency is another important issue included in the agenda of Turkish
energy sector. In this regard, by means of the By-law on Increasing Efficiency in Energy Resources
and Energy Usage, which entered into force after being published on the Official Gazette dated 25
October 2008, No.27035, the Efficiency Increasing Project (VAP) and voluntary agreement models
were put into force in order to support the works for energy efficiency in the industry. A total
support exceeding 2 million TL was provided to 17 projects in 2009 and 15 projects in 2010
throughout Turkey under the VAP scheme. Under the voluntary agreement support similar efforts
are continuing. So far, a total of 22 (11 in 2009 and 11 in 2010) voluntary agreements have been
signed between the government and industrial companies. In order to increase the upper limits of
the support given by the government, a study for amending the aforementioned regulation has been
initiated in 2011. Hence all applications related with VAP and voluntary agreement supports have
been temporarily suspended in 2011.
Facilitating the utilization of vast renewable energy sources potential and increasing market
share of renewable based electricity generation are other crucial elements of Turkish energy policy.
To this end, supporting mechanisms and incentive schemes such as feed-in tariffs, purchase
obligation, connection priorities, license fees discounts and exemptions and various practical
conveniences in project preparation and land acquisition have been defined in relevant laws and
regulations.
With the Amendment to Law on Utilization of Renewable Energy Resources for the Purpose
of Generating Electrical Energy, which was published in the Official Gazette dated 8 January 2011,
new feed-in tariff levels differentiated in a cost-reflective manner for different renewable energy
sources and technologies have been introduced. Namely, for hydro and wind 7.3 cents/kWh; for
geothermal 10.5 cents/kWh and for solar and biomass 13.3 cents/kWh will be provided if the
investors prefer to sell their electricity to public. In addition, a certain support of 0.4 to 3.5
cents/kWh will also be provided to the plants those utilize domestically manufactured technical
equipments. The amendment also covers the rules for certification of renewable-based electricity
generation.
By-law on Electricity Generating Facilities Based on Solar Power which defines the
principals and procedures regarding the standards of equipment used in solar power plants, test
methods and audit has been issued by Ministry of Energy and Natural Resources and published in
the Official Gazette dated 19 June 2011. On the other hand, in order to determine the appropriate
wind projects among competing applications for the same location and/or wind substation, By-law
about Competition for the Applications of the Wind Power Plant Projects was enacted in 2010.
With this regulation, the selection criterion was determined as contribution margin of wind power

Structural Reforms
92
plant for each kWh of electricity to be generated. Within this context, Turkish Electricity
Transmission Company (TEİAŞ) has executed significant studies in 2011 and has made 13
different tenders. In consequence of the tenders, totally 5,500 MW capacity has been allocated to
147 private companies aiming to establish wind power plants.
The works for enabling usage of nuclear energy for electricity generation purposes were
continued in 2011. The project company established for constructing a nuclear power plant (NPP)
in Mersin-Akkuyu with a total installed power of 4,800 MW has initiated its works and in this
context has completed legal and administrative applications for various permissions and licenses.
According to the related agreement, the project company will have to put into operation the first
unit of the NPP mostly 7 years after all kinds of permissions, licenses, approvals, etc. are obtained.
In this respect, it is forecasted that the NPP will likely be put into use as from 2020.
Apart from Mersin-Akkuyu, another NPP is planned to be built in Sinop. This second NPP is
also envisaged to be built by Intergovernmental Bilateral Cooperation Treaty method. The
negotiations conducted with South Korea until now has ended without any agreement. The
negotiations conducted with Japan have been interrupted due to the nuclear accident in Fukushima.
Necessary studies for the field in Sinop, where the NGS is envisaged to be built, are performed by
state-owned Electricity Generation Company (EÜAŞ). For this purpose, adequate allocation is
given to EÜAŞ under the Nuclear Field Studies project.
Table 4.17: Legal Regulations Realized in Energy Market in 2011
Date Number Name Description
8 January 2011
Official
Gazette No.27809
Amendment to Law on
Utilization of Renewable Energy
Resources for the Purpose of Generating Electrical Energy
The objective of the Amendment is to
promote renewable based electricity
generation by defining new feed-in tariff levels.
19 June 2011
Official
Gazette
No.27969
By-law on Electricity Generating
Facilities Based on Solar Power
The objective of the Regulation is to define
the principals and procedures about the
standards of equipment used in solar power plants, test methods and audit.
There are 3 projects to be carried out with the EU in the next period within the framework of
the reforms in energy sector:
1. The Project of Improving the Structure and Capacity of TEİAŞ was offered within the
scope of Pre-Accession Financial Cooperation Programming 2009 and it was accepted by
the European Commission. The Financing Agreement 2009 required for implementation of
the project and the Operational Agreement, were signed in December 2010 and March
2011 respectively. Studies for the technical requirements which are essential for the project
initiation are ongoing. The project is expected to commence actually in 2012. Total budget
of the project is approximately 2,005,500 euros and its part to be covered by national co-
financing amounts 200,550 euros, corresponding to 10 percent of this budget.
2. Service contract of Project for Rehabilitation of the Frequency Control Performance of
Turkish Electricity System for Synchronous Parallel Operation with UCTE, which was
proposed by TEİAŞ within the scope of the Pre-Accession Financial Assistance
Programming-2007 in order to ensure integration of Turkish electricity system with
European electricity system and which was approved by the European Commission was
signed in December 2010. The project is expected to be completed in January 2012. There
is no national co-financial contribution margin for the project.
3. The Project of Adaptation of Grid Regulation with ENTSO-E Legislation proposed by
TEİAŞ within the scope of Pre-Accession Financial Assistance Programming-2010 was
approved by the European Commission. The Financing Agreement 2010 between
European Union and Turkey was signed in April 2011. The Operational Agreement of the

Structural Reforms
93
project is expected to be signed until the end of 2011. Total budget of the project is 1.5
million euros and its part to be covered by national co-financing amounts 150,000 euros,
which corresponds to 10 percent of this budget. The project is expected to commence
actually in 2012.
Table 4.18: Matrix of Policy Commitments: Energy
(1000 Euros)
2011 2012 2013 2014
1. Project of Improving the Structure and Capacity of TEİAŞ
A. Implementation Profile --- --- --- ---
B. Net Budget Effect --- -200.6 --- ---
B.1. Direct Effect on Budget Revenues --- --- --- ---
B.2. Direct Effect on Budget Expenditures --- 200.6 --- ---
2. Project of Adaptation of Grid Regulation with ENTSO-E Legislation
A. Implementation Profile --- --- --- ---
B. Net Budget Effect --- -150.0 --- ---
B.1. Direct Effect on Budget Revenues --- --- --- ---
B.2. Direct Effect on Budget Expenditures --- 150.0 --- ---
Total Net Budget Effect
A. Implementation Profile --- --- --- ---
B. Net Budget Effect --- -350.6 --- ---
B.1. Direct Effect on Budget Revenues --- --- --- ---
B.2. Direct Effect on Budget Expenditures --- 350.6 --- ---

Structural Reforms
94

Annex Tables
95
ANNEX TABLES
ANNEX TABLES

Annex Tables
96
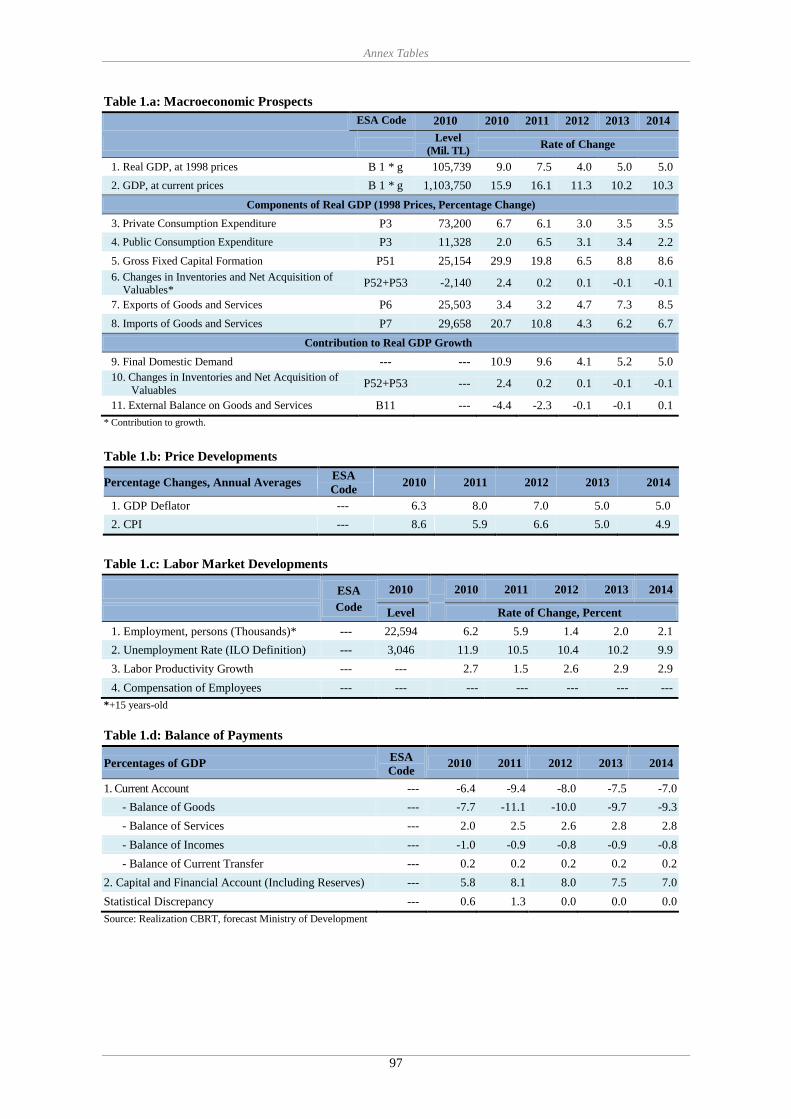
Annex Tables
97
Table 1.a: Macroeconomic Prospects
ESA Code 2010 2010 2011 2012 2013 2014
Level
(Mil. TL) Rate of Change
1. Real GDP, at 1998 prices B 1 * g 105,739 9.0 7.5 4.0 5.0 5.0
2. GDP, at current prices B 1 * g 1,103,750 15.9 16.1 11.3 10.2 10.3
Components of Real GDP (1998 Prices, Percentage Change)
3. Private Consumption Expenditure P3 73,200 6.7 6.1 3.0 3.5 3.5
4. Public Consumption Expenditure P3 11,328 2.0 6.5 3.1 3.4 2.2
5. Gross Fixed Capital Formation P51 25,154 29.9 19.8 6.5 8.8 8.6
6. Changes in Inventories and Net Acquisition of
Valuables* P52+P53 -2,140 2.4 0.2 0.1 -0.1 -0.1
7. Exports of Goods and Services P6 25,503 3.4 3.2 4.7 7.3 8.5
8. Imports of Goods and Services P7 29,658 20.7 10.8 4.3 6.2 6.7
Contribution to Real GDP Growth
9. Final Domestic Demand --- --- 10.9 9.6 4.1 5.2 5.0
10. Changes in Inventories and Net Acquisition of
Valuables P52+P53 --- 2.4 0.2 0.1 -0.1 -0.1
11. External Balance on Goods and Services B11 --- -4.4 -2.3 -0.1 -0.1 0.1
* Contribution to growth.
Table 1.b: Price Developments
Percentage Changes, Annual Averages ESA
Code 2010 2011 2012 2013 2014
1. GDP Deflator --- 6.3 8.0 7.0 5.0 5.0
2. CPI --- 8.6 5.9 6.6 5.0 4.9
Table 1.c: Labor Market Developments
ESA
Code
2010 2010 2011 2012 2013 2014
Level Rate of Change, Percent
1. Employment, persons (Thousands)* --- 22,594 6.2 5.9 1.4 2.0 2.1
2. Unemployment Rate (ILO Definition) --- 3,046 11.9 10.5 10.4 10.2 9.9
3. Labor Productivity Growth --- --- 2.7 1.5 2.6 2.9 2.9
4. Compensation of Employees --- --- --- --- --- --- ---
*+15 years-old
Table 1.d: Balance of Payments
Percentages of GDP ESA
Code 2010 2011 2012 2013 2014
1. Current Account --- -6.4 -9.4 -8.0 -7.5 -7.0
- Balance of Goods --- -7.7 -11.1 -10.0 -9.7 -9.3
- Balance of Services --- 2.0 2.5 2.6 2.8 2.8
- Balance of Incomes --- -1.0 -0.9 -0.8 -0.9 -0.8
- Balance of Current Transfer --- 0.2 0.2 0.2 0.2 0.2
2. Capital and Financial Account (Including Reserves) --- 5.8 8.1 8.0 7.5 7.0
Statistical Discrepancy --- 0.6 1.3 0.0 0.0 0.0
Source: Realization CBRT, forecast Ministry of Development

Annex Tables
98
Table 2: General Government Budgetary Prospects
Percentages of GDP ESA Code 2010 2011 2012 2013 2014
Net Lending by sub-sectors*
1. General Government S13 2.9 1.0 0.8 0.8 0.4
2. Central Government S1311 1.4 0.5 0.3 0.0 -0.1
3. Funds S1311 -0.2 -0.2 -0.7 -0.6 -0.5
4. Local Administration S1313 0.2 0.2 0.2 0.3 0.1
5. Social Security Fund S1314 2.4 1.3 1.8 1.8 1.7
6. Revolving Funds S1311 -0.2 -0.2 -0.1 -0.2 -0.1
7. Unemployment Fund --- -0.7 -0.7 -0.7 -0.7 -0.7
General Government (S13)
8. Total Receipts TR 35.4 36.4 36.8 36.5 36.1
9. Total Expenditures TE 38.3 37.4 37.6 37.3 36.5
10. Net Lending EDP.B9 2.9 1.0 0.8 0.8 0.4
11. Interest Payments EDP.
D41+FISIM 4.5 3.5 3.6 3.5 3.3
12. Primary Balance --- -1.6 -2.5 -2.8 -2.7 -2.9
Components of Revenues
13. Taxes --- 19.6 20.0 20.0 20.0 19.8
14. Social Funds D61 8.1 9.2 9.2 9.2 9.2
15. Factor Incomes D4 5.5 5.0 4.7 4.7 4.5
16. Other --- 1.9 1.9 2.0 1.8 1.9
17. Total Receipts TR 35.4 36.4 36.8 36.5 36.1
Components of Expenditures
18. Total Consumption P32 17.0 16.9 16.7 16.5 16.0
19. Total Social Transfers D62+D63 5.8 5.0 5.4 5.4 5.3
20. Interest Payments EDP.
D41+FISIM 4.5 3.5 3.6 3.5 3.3
21. Subsidies(1) D3 0.7 0.8 0.7 0.7 0.6
22. Gross Fixed Capital Formation P51 3.4 3.6 3.3 3.4 3.3
23. Other --- 6.8 7.5 7.8 7.8 8.0
24. Total Expenditures TE 38.3 37.4 37.6 37.3 36.5
*(+) refers to deficit. (-) refers to surplus.
(1) Includes agricultural support. Duty losses of SEEs and Support and Price Stability Fund.
Table 3: General Government Debt Developments
ESA
Code 2010 2011 2012 2013 2014
Percentage of GDP
1. Gross Debt --- 42.2 39.8 37.0 35.0 32.0
2. Change in Gross Debt --- --- -2.4 -2.8 -2.0 -3.0
Contributions to Change in Gross Debt
3. Primary Balance --- --- -2.5 -2.8 -2.7 -2.9
4. Interest Expenditure EDP D.41 --- 3.5 3.6 3.5 3.3
5. Current GDP Growth --- --- -6.4 -4.2 -3.6 -3.3
6. Other --- --- 3.0 0.6 0.8 -0.1

Annex Tables
99
Table 4: Cyclical Developments*
2010 2011 2012 2013 2014
1. Real GDP Growth (1998 Prices,%) 9.0 7.5 4.0 5.0 5.0
2. Net Lending of General Government / GDP (%) 2.9 1.0 0.8 0.8 0.4
3. Net Interest Expenditure / GDP (%) 3.6 2.8 3.1 2.9 2.7
4. Potential GDP Growth (%) 4.4 4.5 4.5 4.4 4.3
5. Output Gap (Percentage Difference from the Potential) -3.1 -0.3 -0.8 -0.2 0.4
6. Cyclical Component / GDP (%) ** 0.9 0.0 0.2 0.1 -0.0
7. Cyclically Adjusted Balance / Potantial GDP (%) ** 2.3 2.0 1.8 1.6 1.2
8. Cyclically Adjusted Primary Balance / Potential GDP (%)** -2.1 -1.4 -1.9 -1.9 -2.1
*General Government
** (+) refers to deficit. (-) refers to surplus.
Table 5: Divergence from Previous Update
2010 2011 2012 2013 2014
GDP Growth (Percent)
Previous Update 6.8 4.5 5.0 5.5 ---
Latest Update 9.0 7.5 4.0 5.0 5.0
Difference 2.2 3.0 -1.0 -0.5 ---
General Government Net Lending (Percentage of GDP)
Previous Update 3.7 2.1 1.8 1.1 ---
Latest Update 2.9 1.0 0.8 0.8 0.4
Difference -0.8 -1.1 -1.0 -0.3 ---
General Government Gross Debt (Percentage of GDP)
Previous Update 42.3 40.6 38.8 36.8 ---
Latest Update 42.2 39.8 37.0 35.0 32.0
Difference -0.1 -0.8 -1.8 -1.8 ---
Table 6: Basic Assumptions on the External Economic Environment Underlying the Pre-Accession
Economic Programme (2012-2014) Framework*
2010 2011 2012 2013 2014
Exchange Rates
Parity (USD/ €) 1.33 1.40 1.35 1.33 1.33
Real Exchange Rate (Percentage Change)** 7.0 -11.5 0.0 0.0 0.0
GDP Growth
Euro Area (Real. Percentage Change) 1.8 1.6 1.1 1.5 1.7
World Trade (In Real Terms)
World Import Volume Increase (Percent) 12.8 7.5 5.8 6.4 6.7
International Prices
EU CPI (Percentage Change) 2.0 3.0 1.8 1.8 1.9
US CPI (Percentage Change) 1.6 3.0 1.2 0.9 1.1
Oil Prices ($ / barrel) 77.2 104.7 97.0 101.5 102.2
*IMF, World Economic Outlook, September 2011. ** (+) shows appreciation, (-) shows depreciation.

Annex Tables
100
Table 7: Structural Reform Agenda and Developments
Measures in Previous PEP
Realization
Status
(Y/N)
Date12 Comments
Privatization
The privatization of electricity
distribution companies N 2011
Privatization tenders of Electricity Distribution
Companies (Aras, Vangölü, Boğaziçi, Trakya,
Dicle, İstanbul Anadolu Yakası, Toroslar,
Akdeniz) were completed, and their procedures
are at the contract stage.
Privatization of lottery games N ---
Efforts are carried on to call again the cancelled
tender related to privatization of the national
lottery games by means of licencing.
Initiation of the privatization process
for TCDD İzmir and Derince Ports N 2011
Works for the zoning plan in order to call the
privatization tender of İzmir and Derince ports are
still in progress.
The privatization of river power plants Y 2011 Sales/transfer operations of some river plants
belonging to EÜAŞ were completed.
The privatization of TŞFAŞ (Sugar
Factories Co.) N 2011
Privatization tenders of sugar factories consisting
of B portfolio group (Malatya, Erzincan, Elazığ,
and Elbistan Sugar Factories) and C portfolio
group (Kastamonu, Kırşehir, Turhal, Yozgat,
Çorum, and Çarşamba Sugar Factories) belonging
to TŞFAŞ were completed, and the procedure is at
the stage of approval. The works are carried on to
privatize all sugar factories until the end of 2014.
Competition Law and Policies
Amendment to the Act on the
Protection of Competition No.4054
both to increase enforcement
efficiency and to bring it in line with
the current EU legislation in the form
of Regulation and Notices.
N 2012 The bill is on the agenda of the TGNA.
Improvement of the Investment Environment
The Coastal Act N 2012
Concerning the Draft Bill Amending the
Coastal Act prepared by Ministry of Public
Works and Settlement, the process of gathering
the opinions of the related entities is going on.
Financial Sector
Enhancing the structure on custody and
clearing transactions N 2012
Following the enactment of amendments
planned to be done in the Capital Markets Law
about the institutions of custody and clearing, it
is planned to make the main legislation on these
institutions about their organizations and
activities, regulate the issues such as protecting
custody guarantees and protecting the assets
subjected to custody obligation as a result of
listed operations, even if their custody operations
have not been realized yet, and to make sure that
the main principles of the current custody system
is included in the legislation and to make
necessary changes in these principles.
12 The date or foreseen date of realization.

Annex Tables
101
Capital markets compliance with the
EU acquis about the capital adequacy
of the intermediary institutions
N 2009-
2012
The drafts on Compliance with the EU acquis on
capital adequacy are prepared during the
Twinning Project. However, due to ongoing
global crisis, new approach on capital adequacy
has emerged. Therefore, the works by CMB will
be finalized in parallel to the new international
practices.
Dematerialization of Government
Domestic Borrowing Instruments
(GDBI) at the Central Registry Agency
(CRA) and custody on customer basis
N 2012
Within the scope of the project, necessary
amendments in legislation were made regarding
monitoring GDBIs in the registry system and
principles of transactions were determined.
Besides, works were commenced in terms of
integration of repo-reverse repo transactions in
which GDBIs are subject, into registered system
and the mentioned works are in progress.
Amendments on Capital Markets Law regarding
discretion, seizure and similar judicial and
administrative claims in the registry system have
come into force. System is expected to be in use
by 30 June 2012 after the completion of works
and technical studies conducted by CRA with
related institutions.
Agriculture
Enactment of the Law on the
establishment and duties of the
Ministry of Agriculture and Rural
Affairs
Y 2011
By taking into account functional organization
required from especially providing plant health,
veterinary and food safety services together as
envisaged in EU acquis, agricultural research-
development and extension in an integrated way
and establishing of policy development capacity
in soil conservation and land usage, Ministry of
Food, Agriculture and Livestock was established
by the Decree Law No.639, dated 8 June 2011.
Amendment of Fisheries Law N 2012
In order to ensure the sustainable fisheries and
the compliance with EU acquis, Fisheries Law
will be amended, including arrangements on
resource management and securing high quality
product.
Regional Development
Decree Law No.649 on the
Organization and Duties of the
Ministry of European Union and
Amendment of Some Laws and Decree
Laws
E 2011
Establishment, membership and duties of High
Council of Regional Development and Regional
Development Committee were introduced under the
Decree Law No.641.
Decree Law (No.641) on the
Organisation and Duties of the
Ministry of Development
E 2011
Undersecretariat of State Planning Organisation
(SPO) has been restructured under the name of
Ministry of Development. Decree Law No.540
dated 19 June 1994 was abolished except the
provisions under Annex-2.
Council of Minister Decision Y 2011
With the Council of Minister Decision, the share of
the budget income of the municipalities allocated to
the development agencies is determined as five per
thousand according to the Article 19 of the Law
No.5449 on Establishment, Coordination and Duties
of Development Agencies.
By-law Amending the By-law on
Project and Activity Support of
Development Agencies
Y 2011
Some articles in the parts of definitions, prohibition
of assistance, projects and activities to be supported,
ground rules of financial assistance, direct financial
assistance and technical assistance and common
clauses in By-law on Project and Activity Support
of Development Agencies were changed.

Annex Tables
102
Health and Social Security Reform
Strengthening of National Health
Information System N 2012
Pilot implementation of Hospital Appointment
and Referral Integration System will be extended.
Works for medicine tracking system will be
completed. Implementation of tele-medicine will be extended.
Information and Communication Technologies
The Draft Law on Protection of
Personal Data N 2011
The Draft Law will be presented again to the
TGNA in new legislative period.
Cyber Crime Convention of European
Council No.185 N 2011
Turkey signed the Cyber Crime Convention of the
European Council, No.185 on 10 November 2010.
Ratification procedure by the TGNA is still in
progress.
By-law on Processing of Personal Data
and Protection of Privacy in the Telecommunications Sector
N 2011
Works will be carried on to make amendmends on
Directive about Processing of Personal Data and
Protection of Privacy in the Telecommunications
Sector, which was enacted and published in
Offical Gazette No.25365 on 6 February 2011 in
order to ensure harmonization with the Directive
2002/58/EC concerning processing of personal
data and protection of privacy in the electronic
communications sector and the Directive
2006/24/EC on retention of data generated or
processed in connection with the provision of
publicly available electronic communications
services or of public communications networks.
Turkish Code of Commerce Y 2011
Turkish Code of Commerce Law No.6102 was
published in Official Gazette No.27846 on 14
February 2011. According to this Law, every
stock corporation has to set up a web-site of their
corporation. Some documents relating to this
corporation have to be published via that website.
Moreover, some documents have to be saved
electronically. Executive Board meetings might be held electronically.
Notification Law Y 2011
The Law on Amending Certain Articles of
Notification Law and Other Laws No.6099
provides an Article regarding Electronic
Notification. Moreover, electronic notification has
became compulsory for joint-stake companies,
limited companies and limited partnership divided
into share companies.
Energy
Continuation of the privatization works
for the electricity distribution companies
Y 2012
The privatization works of electricity distribution
assets have been continued in 2011. It is expected
that the privatization of electricity distribution regions will be completed in 2012.
Continuation of the privatization works
in electricity generation assets Y
2004-
2014
The works for transfer of power plants whose
privatization tenders realized in 2010 have been
continued in 2011. It is expected that the
privatization of electricity generation companies will be accelerated in 2012.
Project of Improving the Structure and
Capacity of TEİAŞ N 2009-...
Within the scope of fortification of the
institutional structure and expansion of the
technical capacity of the Turkish Electricity
Transmission Company (TEİAŞ), live
maintenance for the electricity transmission
system, development of occupational safety and
training activities, revision of human resources
policies, improvement of the IT structure and
Annex Tables
103
restructuring of the organization are planned. The
Project was submitted in scope of 2009 Pre-
Accession Financial Cooperation Programming
and was accepted by the European Commission.
The Financing Agreement 2009 required for
implementation of the project and the Operational
Agreement were signed in December 2010 and
March 2011 respectively. Works for the technical
requirements which are essential for the project
initiation are ongoing. The project is expected to commence actually in 2012.
Project of Adaptation of Grid
Regulation with ENTSO-E Legislation N 2010-…
The project was proposed within the necessity of
legislation change emerged as a result of works
for the operating of Turkish electricity system
synchronized parallel with to continental Europe’s
electricity system within the scope of Pre-
Accession Financial Cooperation Programming
2010 and was approved by the European
Commission. The Financing Agreement 2010 was
signed in April 2011. The Operational Agreement
of the project is expected to be signed up to the
end of 2011. The project is envisaged to
commence in 2012.
Activities to provide supply security in
electricity N
2007-
2012
Necessary measures will be taken to activate the
licenses for investment and to complete the
investments within the envisaged periods.
Investments for efficiency improving and
rehabilitation in public power plants will be
continued. For keeping adequate amount of
petroleum stock, aligning the stock system with
the EU legislation and establishing a more robust stock management, a law will be enacted.
Institutional division of coordination
and supervision activities in nuclear energy field
N 2007-
2012
The regulation and surveillance activities in the
field of nuclear energy will be carried out by a
newly established institution, the research,
technology development and implementation
activities will remain under the responsibility of TAEA.
Top Related