


Languages
Pages
Legal

DRAFT
Public Private Partnership
Commercial Viability Analysis
Honolulu Rail Transit Project
May 2018
P3 Commercial Viability Analysis | Page 2
Reliance restricted; prepared solely for HART. Does not constitute assurance or legal advice. Refer to limitations and restrictions on page 2.
Banner name Terms of Reference
This report (the “Report”), dated May 2018, represents a deliverable required under the terms of the subcontract agreement between HDR Engineering, Inc. (“HDR”) and
Ernst and Young Infrastructure Advisors, LLC (“EYIA” or “we”) dated December 8, 2017, pursuant to the prime contract between HDR and the Honolulu Authority for Rapid
Transportation (“HART”) in connection with the Honolulu Rail Transit Project (“HRTP”). In preparing the Report, EYIA relied upon data and cost estimates provided by HDR and
HART, and other publicly available information (e.g., Recovery Plan, FFGA Plan of Finance). No procedures were performed by EYIA to evaluate the accuracy or completeness
of data and information provided by these entities, and no such procedures were included in the agreed upon scope of work in the subcontract agreement (which was
determined in conjunction with the HART and HDR). Accordingly, EYIA expresses no opinion and issues no other form of assurance regarding the data and information
provided by HDR or HART. The procedures EYIA performed do not constitute an audit of historical financial statements or an examination of prospective financial statements
in accordance with standards established by the American Institute of Certified Public Accountants (“AICPA”).
The services performed by EYIA were advisory in nature. Certain analyses in the Report are based on estimates and/or assumptions about future events which were provided
by HDR and HART. Differences between estimated and actual results are not unusual because future events and circumstances frequently do not occur as expected, and
those differences may be material. We make no representation of, nor do we take any responsibility over, the achievement of estimated or projected results. The analyses
contained in the Report are based on data and information made available to EYIA through the date hereof. Should additional relevant data or information become available
subsequent to the date of the Report, such data or information may have a material impact on the analyses contained in the Report. EYIA has no future obligation to update
the Report.
Neither the Report nor any of our work constitutes legal opinion or advice. No representation is made relating to matters of a legal nature, including, without limitation,
matters of title or ownership, legal description, encumbrances, liens, priority, easements and/or land use restrictions, the validity or enforceability of legal documents,
present or future national or local legislation, regulation, ordinance or the like, or legal or equitable defenses.
The Report is intended solely for use by HART. While we believe the work performed is responsive to HART’s request pursuant to the scope of work in our subcontract
agreement with HDR, we make no representation as to the sufficiency of the Report and our work for any other purposes. Any third parties reading the Report should be aware
that the Report is subject to limitations, and the scope of the Report was not designed for use or reliance by third parties for investment purposes, or any other purpose. We
assume no duty, obligation or responsibility whatsoever to any third parties that may obtain access to the Report.
P3 Commercial Viability Analysis | Page 3
Reliance restricted; prepared solely for HART. Does not constitute assurance or legal advice. Refer to limitations and restrictions on page 2.
Banner name HART Goals
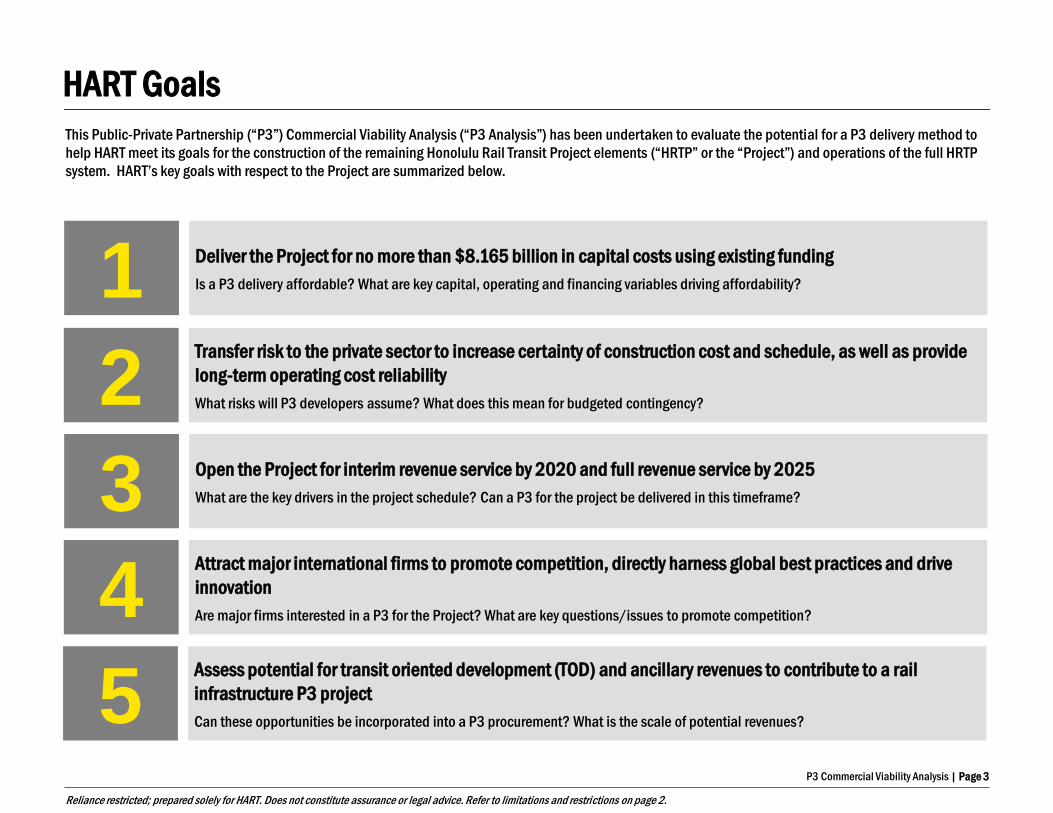
1 Deliver the Project for no more than $8.165 billion in capital costs using existing funding
Is a P3 delivery affordable? What are key capital, operating and financing variables driving affordability?
3 Open the Project for interim revenue service by 2020 and full revenue service by 2025
What are the key drivers in the project schedule? Can a P3 for the project be delivered in this timeframe?
2 Transfer risk to the private sector to increase certainty of construction cost and schedule, as well as provide
long-term operating cost reliability
What risks will P3 developers assume? What does this mean for budgeted contingency?
4 Attract major international firms to promote competition, directly harness global best practices and drive
innovation
Are major firms interested in a P3 for the Project? What are key questions/issues to promote competition?
This Public-Private Partnership (“P3”) Commercial Viability Analysis (“P3 Analysis”) has been undertaken to evaluate the potential for a P3 delivery method to
help HART meet its goals for the construction of the remaining Honolulu Rail Transit Project elements (“HRTP” or the “Project”) and operations of the full HRTP
system. HART’s key goals with respect to the Project are summarized below.
5 Assess potential for transit oriented development (TOD) and ancillary revenues to contribute to a rail
infrastructure P3 project
Can these opportunities be incorporated into a P3 procurement? What is the scale of potential revenues?

P3 Commercial Viability Analysis | Page 4
Reliance restricted; prepared solely for HART. Does not constitute assurance or legal advice. Refer to limitations and restrictions on page 2.
Project Overview
The P3 Analysis focuses on the design and construction of the City Center Section, including related stations (“City Center Guideway and Stations” or “CCGS”),
as well as the parking garage and transit center at Pearl Highlands. A P3 delivery would also include operations and maintenance (“O&M”) of the full HRTP
system, including the existing (and under construction) guideway, rail and station infrastructure.
Operations
Kapolei
Waikiki
UH-Manoa
Construction Construction 0 4 miles
West Oahu-Farrington
Highway Section
6.9 miles / 11.1 km
Kamehameha Highway
Section
3.9 miles / 6.3 km
Airport Section
5.2 miles / 8.2 km
City Center Section
4.1 miles / 6.6 km
Pearl Highlands Parking
Garage and Transit Center
P3 Commercial Viability Analysis | Page 5
Reliance restricted; prepared solely for HART. Does not constitute assurance or legal advice. Refer to limitations and restrictions on page 2.
Guideway
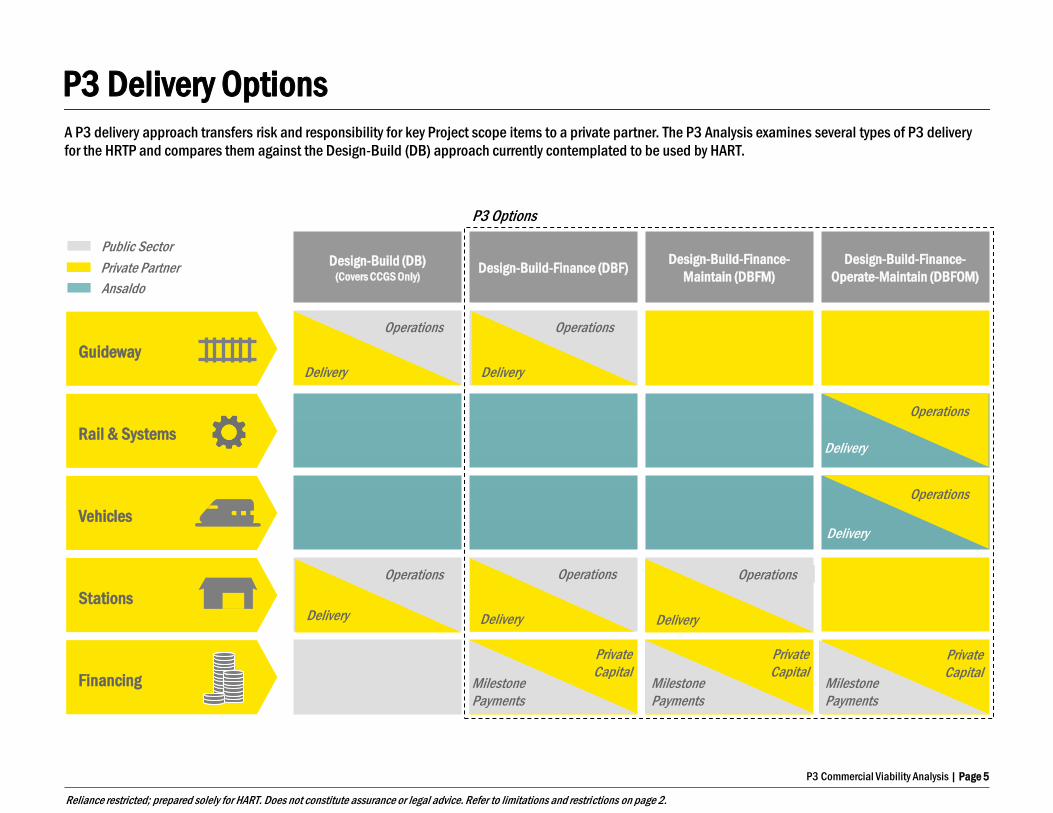
A P3 delivery approach transfers risk and responsibility for key Project scope items to a private partner. The P3 Analysis examines several types of P3 delivery
for the HRTP and compares them against the Design-Build (DB) approach currently contemplated to be used by HART.
Design-Build (DB) (Covers CCGS Only)
Design-Build-Finance (DBF) Design-Build-Finance-
Maintain (DBFM)
Design-Build-Finance-
Operate-Maintain (DBFOM)
Delivery
Operations
Public Sector
Private Partner
Rail & Systems
Vehicles
Stations
Financing
Delivery
Operations
Milestone
Payments
Private
Capital Milestone
Payments
Milestone
Payments
Delivery
Operations
Ansaldo
Operations
Delivery
Operations
Delivery
Operations
Delivery
P3 Options
Private
Capital Private
Capital
Operations
Delivery
P3 Delivery Options
P3 Commercial Viability Analysis | Page 6
Reliance restricted; prepared solely for HART. Does not constitute assurance or legal advice. Refer to limitations and restrictions on page 2.
Banner name Design Build (DB)
HART/City DB Contractor O&M Provider (Ansaldo
Core Systems) Construction Progress Payments
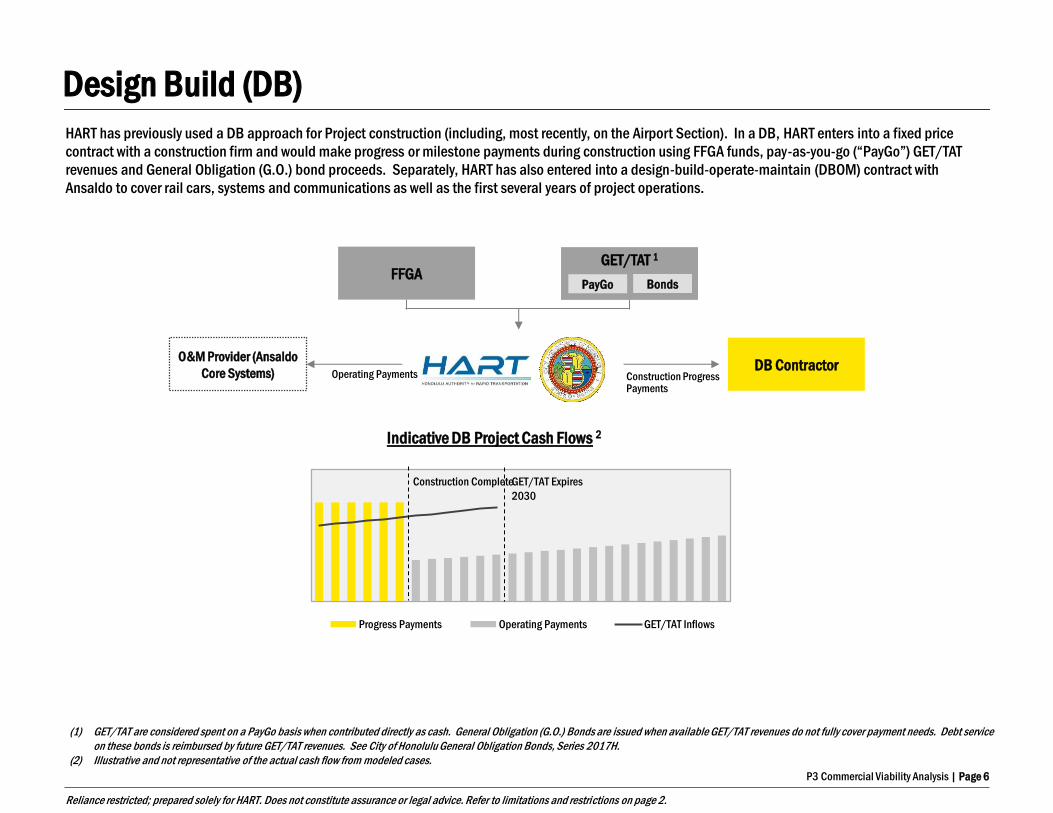
HART has previously used a DB approach for Project construction (including, most recently, on the Airport Section). In a DB, HART enters into a fixed price
contract with a construction firm and would make progress or milestone payments during construction using FFGA funds, pay-as-you-go (“PayGo”) GET/TAT
revenues and General Obligation (G.O.) bond proceeds. Separately, HART has also entered into a design-build-operate-maintain (DBOM) contract with
Ansaldo to cover rail cars, systems and communications as well as the first several years of project operations.
Operating Payments
Progress Payments Operating Payments GET/TAT Inflows
(1) GET/TAT are considered spent on a PayGo basis when contributed directly as cash. General Obligation (G.O.) Bonds are issued when available GET/TAT revenues do not fully cover payment needs. Debt service
on these bonds is reimbursed by future GET/TAT revenues. See City of Honolulu General Obligation Bonds, Series 2017H.
(2) Illustrative and not representative of the actual cash flow from modeled cases.
GET/TAT Expires
2030
Indicative DB Project Cash Flows 2
GET/TAT 1
Bonds PayGo FFGA
Construction Complete
P3 Commercial Viability Analysis | Page 7
Reliance restricted; prepared solely for HART. Does not constitute assurance or legal advice. Refer to limitations and restrictions on page 2.
Banner name Design Build Finance (DBF)
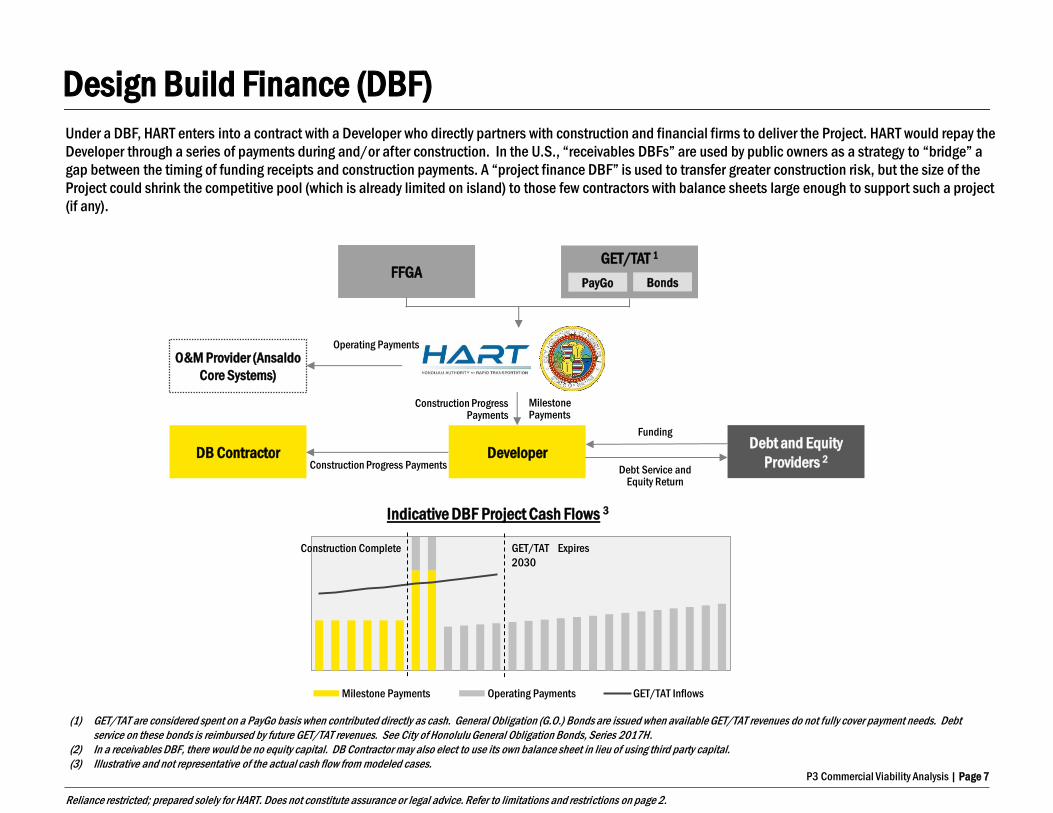
Under a DBF, HART enters into a contract with a Developer who directly partners with construction and financial firms to deliver the Project. HART would repay the
Developer through a series of payments during and/or after construction. In the U.S., “receivables DBFs” are used by public owners as a strategy to “bridge” a
gap between the timing of funding receipts and construction payments. A “project finance DBF” is used to transfer greater construction risk, but the size of the
Project could shrink the competitive pool (which is already limited on island) to those few contractors with balance sheets large enough to support such a project
(if any).
Milestone Payments Operating Payments GET/TAT Inflows
HART/City
Developer
O&M Provider (Ansaldo
Core Systems)
Milestone Payments
Operating Payments
Debt and Equity
Providers 2 Debt Service and
Equity Return
Funding
DB Contractor Construction Progress Payments
Indicative DBF Project Cash Flows 3
Construction Progress Payments
GET/TAT 1
Bonds PayGo FFGA
(1) GET/TAT are considered spent on a PayGo basis when contributed directly as cash. General Obligation (G.O.) Bonds are issued when available GET/TAT revenues do not fully cover payment needs. Debt
service on these bonds is reimbursed by future GET/TAT revenues. See City of Honolulu General Obligation Bonds, Series 2017H.
(2) In a receivables DBF, there would be no equity capital. DB Contractor may also elect to use its own balance sheet in lieu of using third party capital.
(3) Illustrative and not representative of the actual cash flow from modeled cases.
GET/TAT Expires
2030
Construction Complete

P3 Commercial Viability Analysis | Page 8
Reliance restricted; prepared solely for HART. Does not constitute assurance or legal advice. Refer to limitations and restrictions on page 2.
Design Build Finance (Operate) Maintain (DBF(O)M)
Under a DBFOM, HART enters into a contract with a Developer. The Developer then partners with construction, operating and financial partners to deliver the
Project. This approach introduces private capital into the Project which is repaid over time subject to successful construction through “availability payments”
contingent upon project successful operating performance.
Milestone Payments AP - Capital AP - Operating GET/TAT Inflows
HART/City
Developer
O&M Provider Operating Payments
Debt and Equity
Providers Debt Service and
Equity Return
Funding
DB Contractor Construction Progress Payments
Indicative DBFOM Project Cash Flows 2, 3
Milestone Payments
Availability Payments
(1) GET/TAT are considered spent on a PayGo basis when contributed directly as cash. General Obligation (G.O.) Bonds are issued when available GET/TAT revenues do not fully cover payment needs. Debt
service on these bonds is reimbursed by future GET/TAT revenues. See City of Honolulu General Obligation Bonds, Series 2017H.
(2) Illustrative and not representative of the actual cash flow from modeled cases.
(3) A “final acceptance payment” may be also added to this structure, made after construction is over.
O&M Provider (Ansaldo
Core Systems) Operating Payments
Under the DBFM variant, O&M Provider would supplement
Ansaldo’s scope of work
GET/TAT 1
Bonds PayGo FFGA
GET/TAT Expires
2030
Construction Complete
P3 Commercial Viability Analysis | Page 9
Reliance restricted; prepared solely for HART. Does not constitute assurance or legal advice. Refer to limitations and restrictions on page 2.
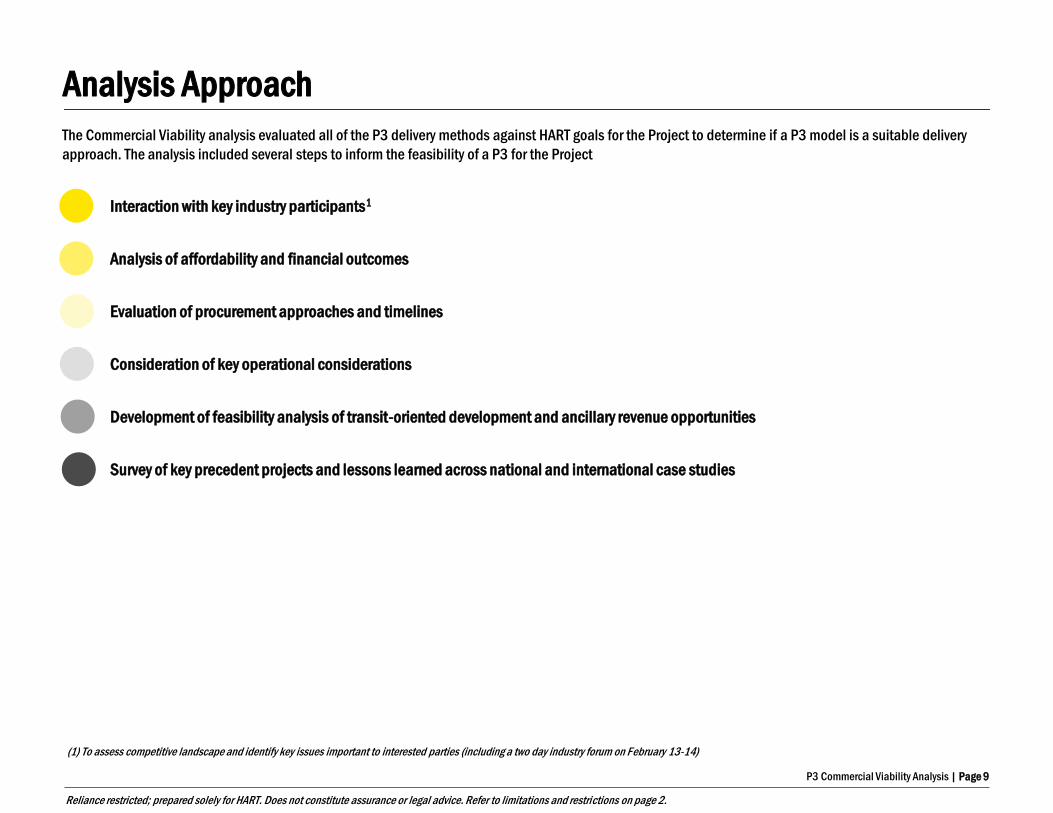
The Commercial Viability analysis evaluated all of the P3 delivery methods against HART goals for the Project to determine if a P3 model is a suitable delivery
approach. The analysis included several steps to inform the feasibility of a P3 for the Project
► Interaction with key industry participants1
► Analysis of affordability and financial outcomes
► Evaluation of procurement approaches and timelines
► Consideration of key operational considerations
► Development of feasibility analysis of transit-oriented development and ancillary revenue opportunities
► Survey of key precedent projects and lessons learned across national and international case studies
Analysis Approach
(1) To assess competitive landscape and identify key issues important to interested parties (including a two day industry forum on February 13-14)

P3 Commercial Viability Analysis | Page 10
Reliance restricted; prepared solely for HART. Does not constitute assurance or legal advice. Refer to limitations and restrictions on page 2.
The P3 Analysis evaluated the DB and P3 delivery options against HART goals. The analysis determined that, while all methods achieve HART goals, DBFM and
DBFOM provide the best overall value to HART and the City.
1
3
2
4
5
Deliver the Project for no more than $8.165 billion
in capital costs using existing funding 1
Assess potential for transit oriented development
(TOD) and ancillary revenues to contribute to a rail
infrastructure P3 project
Transfer risk to the private sector to increase
certainty of construction cost and schedule, as well
as provide long-term operating cost reliability 2
Open the Project for interim revenue service by
2020 and full revenue service by 2025
Attract major international firms to promote
competition, directly harness global best practices
and drive innovation
(1) The DB and DBF options have the lowest cost of capital and require the lowest amount of funds to cover base capital costs. While the DBFM and DBFOM options have higher cost of capital, they are also more
likely to promote innovation and enhance competition to drive improved construction pricing to offset higher financing cost.
(2) The DBFM and DBFOM options offer higher risk transfer than DB and DBF, driving improved price and schedule certainty, including more reliable base capital cost pricing due to contractual risk transfer
provisions.
Note: DB (Design-Build) is shown as a “vertical” baseline – DBF, DBFM and DBFOM’s ability to meet HART’s goals are shown relative to DB.
DBFOM DBFM DBF Less Likely More Likely
DB
P3 Delivery Options: Goals

P3 Commercial Viability Analysis | Page 11
Reliance restricted; prepared solely for HART. Does not constitute assurance or legal advice. Refer to limitations and restrictions on page 2.
1 Deliver the Project for no more than $8.165 billion in capital costs using existing funding
Is a P3 delivery method affordable? What are key variables driving affordability considerations?
A 26-year DBF(O)M is affordable within the existing $8.165 billion HART budget. An “affordability limit” can be incorporated in to a P3
procurement to communicate budget limits to teams, and the evaluation criteria can be designed to incentivize offerors to meet financial goals.
The affordability of a P3 for the Project has been evaluated based on
assumptions about HART revenues:
► GET and TAT revenue projections
► FFGA funding availability
► City subsidy
The affordability of the P3 is also driven by cost items related to the P3
and non-P3 components of the project:
► Construction costs (P3 project vs. non-P3 project) and
contingency
► P3 agreement term (currently 6 years of construction plus 20
years of operations)
► Sizing of construction milestone payments
► Cost of capital for at-risk private financing
Given color of money considerations, operating costs (and potential
operating savings related to a P3) have not been incorporated into the
affordability curve; it is assumed that the City covers all operations and
maintenance-related costs.
HRTP Sources Past Non-P3 P3 Total
FFGA Funds 785 365 399 1,550
GET/TAT Funds 1,546 2,070 366 3,9821
G.O. Bond Proceeds - 1,240 409 1,649
Other 360 172 452 984
Total 2,691 3,847 1,627 8,165
Uses and Sources of Funds during Construction (YOE $Ms)
HRTP Uses Past Non-P3 P3 Total
Total 2,691 3,847 1,627 8,165
Note: Chart shows total HRTP costs for full scope. Past costs shown through end 2017. Non-P3 costs
are for remaining segments under construction outside P3 scope. Other uses of funds include
government agency costs and required savings; they do not include financing costs. Other sources of
funds include City subsidy, private capital and others.
(1) Total GET/TAT funds amount to approximately $7 billion throughout the P3 agreement term, with
the remainder of funds received after construction paying for G.O. debt service, availability payments
related to capital, and additional railcars
Goal 1: Project Affordability

P3 Commercial Viability Analysis | Page 12
Reliance restricted; prepared solely for HART. Does not constitute assurance or legal advice. Refer to limitations and restrictions on page 2.
0%
5%
10%
15%
20%
25%
Denver Eagle Maryland
Purple Line
Texas I-635 Goethals
Bridge
Presidio
Parkway
1 Deliver the Project for no more than $8.165 billion in capital costs using existing funding
Is a P3 delivery method affordable? What are key variables driving affordability considerations?
The DBF(O)M base case incorporates 5-10% construction cost savings on the $1.627 billion P3 Project (1-2% of the $8.165 billion HRTP) related
to innovation and competition relative to a more traditional procurement and delivery.
► A more conservative 5% cost savings would still result in an affordable
DBFOM assuming a faster Availability Payment capital repayment profile
and/or shorter P3 agreement term reducing financing costs.
► Reduction in baseline capital cost: The 5-10% base capital costs reduction
is more than reasonable compared to savings observed on DBF(O)M
actually implemented. On the innovation front, a savings of 10-20% or
more versus public sponsor projections has been observed on P3s across
the country. Given the fact that the project is partially built and
environmental approvals constrain certain design decisions, the lower end
has been assumed. On the competition side, HART has not historically
attracted major international contractors to compete for construction
contracts. These firms may be able to price certain risks more competitively
in the context of the larger DBF(O)M business opportunity.
► No reduction in construction contingency: The HART budget is currently
carrying an contingency allocated to the P3 project scope with additional
unallocated contingency included in its financial projections. The P3
conservatively assumes this full contingency remains unchanged despite
the incremental risk allocation benefits of a P3 structure which should
reduce the need for funds beyond the base budget.
Historical P3 Innovation/Competition Savings (% of Public
Sponsor Projected Cost)
HART Assumption
Goal 1: Project Affordability
P3 Commercial Viability Analysis | Page 13
Reliance restricted; prepared solely for HART. Does not constitute assurance or legal advice. Refer to limitations and restrictions on page 2.
Risk Item DB DBFM/DBFOM
Construction Costs/Errors & Omissions
Construction Schedule
Utilities Relocation
Geotechnical and Archeological
Environmental and Permits
Right of Way Acquisition
Supervening/Relief Events
Interface Risk /
Operations & Maintenance Costs /
Defects in Existing Assets/Vehicles
System Performance/Service Quality /
Long-Term Asset Condition/Useful Life
Ridership and Revenue
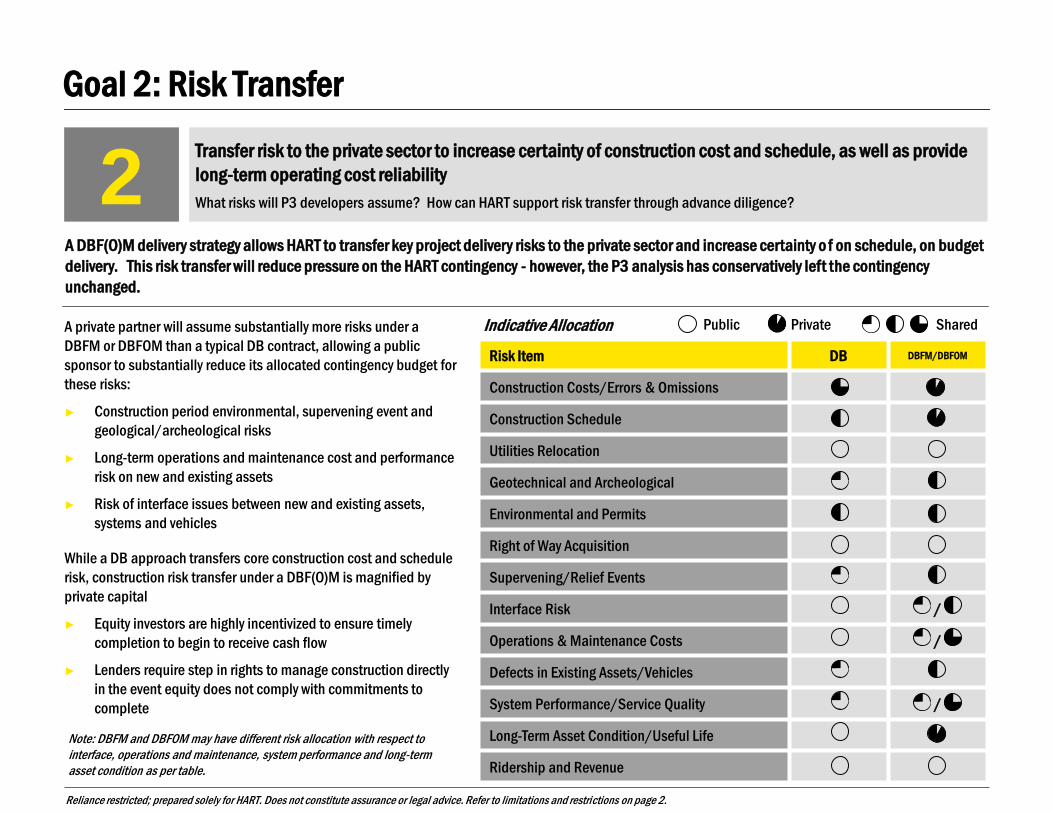
A DBF(O)M delivery strategy allows HART to transfer key project delivery risks to the private sector and increase certainty o f on schedule, on budget
delivery. This risk transfer will reduce pressure on the HART contingency - however, the P3 analysis has conservatively left the contingency
unchanged.
A private partner will assume substantially more risks under a
DBFM or DBFOM than a typical DB contract, allowing a public
sponsor to substantially reduce its allocated contingency budget for
these risks:
► Construction period environmental, supervening event and
geological/archeological risks
► Long-term operations and maintenance cost and performance
risk on new and existing assets
► Risk of interface issues between new and existing assets,
systems and vehicles
While a DB approach transfers core construction cost and schedule
risk, construction risk transfer under a DBF(O)M is magnified by
private capital
► Equity investors are highly incentivized to ensure timely
completion to begin to receive cash flow
► Lenders require step in rights to manage construction directly
in the event equity does not comply with commitments to
complete
Note: DBFM and DBFOM may have different risk allocation with respect to
interface, operations and maintenance, system performance and long-term
asset condition as per table.
Indicative Allocation Shared Private Public
2 Transfer risk to the private sector to increase certainty of construction cost and schedule, as well as provide
long-term operating cost reliability
What risks will P3 developers assume? How can HART support risk transfer through advance diligence?
Goal 2: Risk Transfer

P3 Commercial Viability Analysis | Page 14
Reliance restricted; prepared solely for HART. Does not constitute assurance or legal advice. Refer to limitations and restrictions on page 2.
A DBF(O)M may allow for improvement on HART’s committed project delivery
schedule; already ongoing advance utility relocation works are a prudent
strategy for further enhancing schedule.
A competitive P3 procurement will give offerors a Project completion deadline, and
teams can be incentivized through the RFP the P3 compensation structure to further
accelerate completion to (i) lower construction price by reducing construction inflation
and (ii) score points related to construction schedule acceleration.
While a P3 procurement typically takes longer than a traditional DB (18 months vs. 9-
12 months), significant design work will be accelerated and included in proposals,
which allows for full service opening earlier or no later than 2025. The schedule shown
assumes a two-step P3 procurement:
► Request for Proposals Part 1 (Qualifications): All teams submit information on
relevant experience on similar projects and details on financial strength
► Request for Proposals Part 2 to Priority Listed Offerors: Selected teams from Part
1 phase engage with HART team over an extended period to refine DBF(O)M
commercial terms culminating in the submittal of detailed technical and financial
proposals which include fixed price offers
► Full design and construction: Approximately 6 years from Q4 2019 to Q4 2025
(no P3 schedule savings assumed)
2025
Q4 2018
Q3 2018
Q1 2019
RFP Part 1 Release/Responses
Shortlist/Issue RFP Part 2
Proposer + HART Technical/Commercial Meetings
Proposer + HART Technical/Commercial Meetings
Proposer + HART Technical/Commercial Meetings
Proposer + HART
Technical/Commercial Meetings
Technical & Price Proposals Due
Award/NTP
Q2 2019
Q3 2019
Q4 2019
2020 Interim Revenue Service Date
Full Revenue Service Date
Potential for P3 to shorten
construction duration
3 Open the Project for full revenue service by 2025
What are the key drivers in the project schedule? Can a P3 for the project be delivered in this timeframe?
Goal 3: Project Schedule
P3 Commercial Viability Analysis | Page 15
Reliance restricted; prepared solely for HART. Does not constitute assurance or legal advice. Refer to limitations and restrictions on page 2.
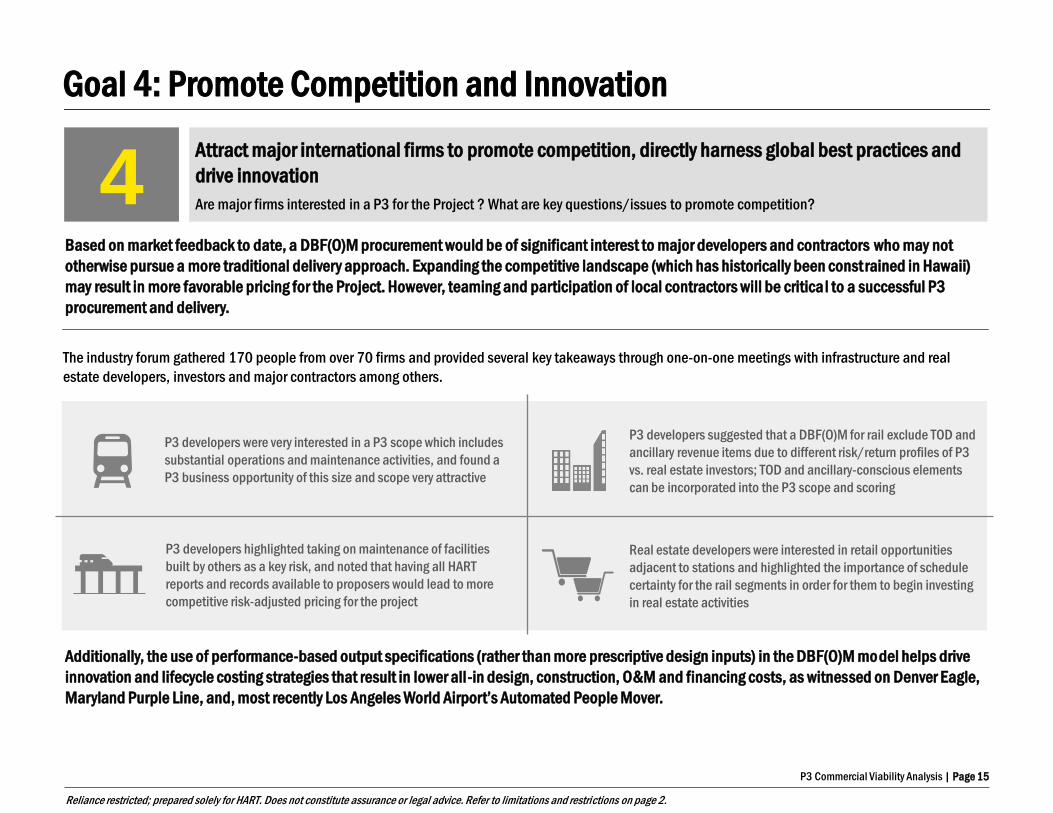
Based on market feedback to date, a DBF(O)M procurement would be of significant interest to major developers and contractors who may not
otherwise pursue a more traditional delivery approach. Expanding the competitive landscape (which has historically been constrained in Hawaii)
may result in more favorable pricing for the Project. However, teaming and participation of local contractors will be critical to a successful P3
procurement and delivery.
Additionally, the use of performance-based output specifications (rather than more prescriptive design inputs) in the DBF(O)M model helps drive
innovation and lifecycle costing strategies that result in lower all-in design, construction, O&M and financing costs, as witnessed on Denver Eagle,
Maryland Purple Line, and, most recently Los Angeles World Airport’s Automated People Mover.
The industry forum gathered 170 people from over 70 firms and provided several key takeaways through one-on-one meetings with infrastructure and real
estate developers, investors and major contractors among others.
P3 developers suggested that a DBF(O)M for rail exclude TOD and
ancillary revenue items due to different risk/return profiles of P3
vs. real estate investors; TOD and ancillary-conscious elements
can be incorporated into the P3 scope and scoring
Real estate developers were interested in retail opportunities
adjacent to stations and highlighted the importance of schedule
certainty for the rail segments in order for them to begin investing
in real estate activities
P3 developers highlighted taking on maintenance of facilities
built by others as a key risk, and noted that having all HART
reports and records available to proposers would lead to more
competitive risk-adjusted pricing for the project
P3 developers were very interested in a P3 scope which includes
substantial operations and maintenance activities, and found a
P3 business opportunity of this size and scope very attractive
4 Attract major international firms to promote competition, directly harness global best practices and
drive innovation
Are major firms interested in a P3 for the Project ? What are key questions/issues to promote competition?
Goal 4: Promote Competition and Innovation
P3 Commercial Viability Analysis | Page 16
Reliance restricted; prepared solely for HART. Does not constitute assurance or legal advice. Refer to limitations and restrictions on page 2.
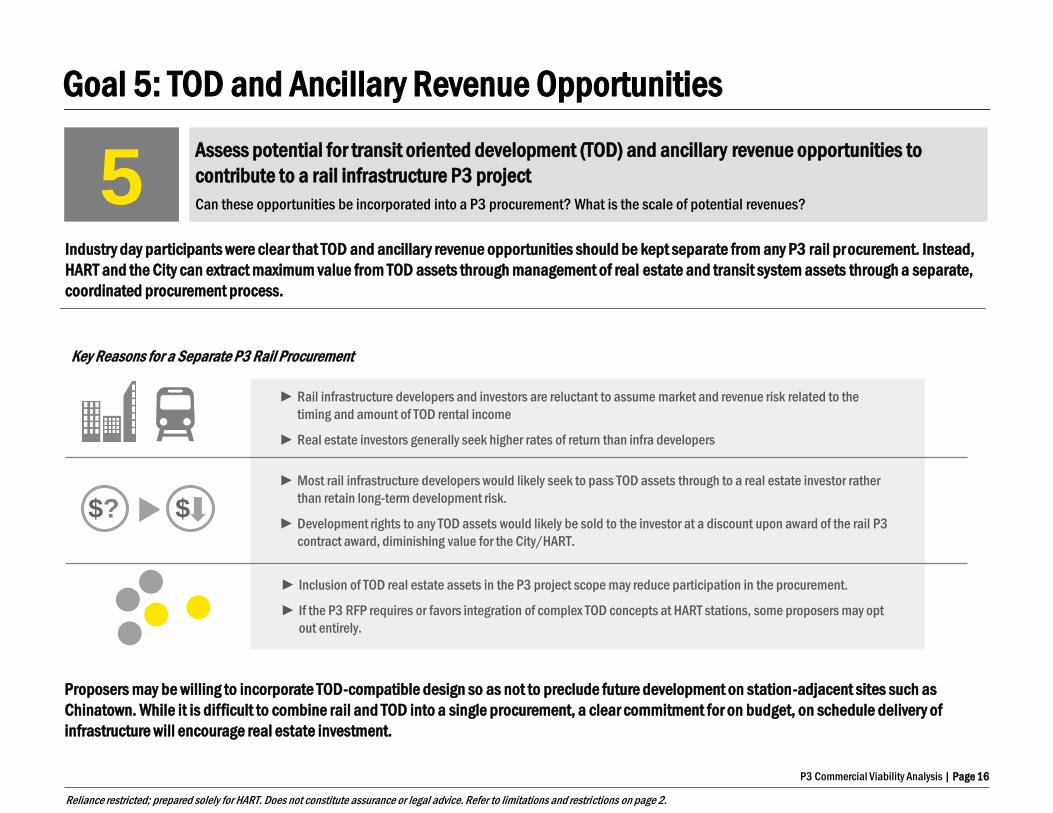
Industry day participants were clear that TOD and ancillary revenue opportunities should be kept separate from any P3 rail pr ocurement. Instead,
HART and the City can extract maximum value from TOD assets through management of real estate and transit system assets through a separate,
coordinated procurement process.
5 Assess potential for transit oriented development (TOD) and ancillary revenue opportunities to
contribute to a rail infrastructure P3 project
Can these opportunities be incorporated into a P3 procurement? What is the scale of potential revenues?
Goal 5: TOD and Ancillary Revenue Opportunities
► Inclusion of TOD real estate assets in the P3 project scope may reduce participation in the procurement.
► If the P3 RFP requires or favors integration of complex TOD concepts at HART stations, some proposers may opt
out entirely.
► Most rail infrastructure developers would likely seek to pass TOD assets through to a real estate investor rather
than retain long-term development risk.
► Development rights to any TOD assets would likely be sold to the investor at a discount upon award of the rail P3
contract award, diminishing value for the City/HART.
► Rail infrastructure developers and investors are reluctant to assume market and revenue risk related to the
timing and amount of TOD rental income
► Real estate investors generally seek higher rates of return than infra developers
Proposers may be willing to incorporate TOD-compatible design so as not to preclude future development on station-adjacent sites such as
Chinatown. While it is difficult to combine rail and TOD into a single procurement, a clear commitment for on budget, on schedule delivery of
infrastructure will encourage real estate investment.
$? $
Key Reasons for a Separate P3 Rail Procurement

P3 Commercial Viability Analysis | Page 17
Reliance restricted; prepared solely for HART. Does not constitute assurance or legal advice. Refer to limitations and restrictions on page 2.
-
10%
20%
30%
40%
50%
60%
70%
80%
Perc
enta
ge o
f O&M
Ancillary HART TOD Farebox Midpoint Low High
0
5
10
15
20
25
30
35
40
45
50
YOE
$M
s
Ground lease income from HART-acquired TOD sites1 and ancillary revenue opportunities such as parking and concessions offer a long-term
funding source for the Project. By 2045, these sources are estimated to yield a cumulative $238 million and cover up to 11% of annual O&M
availability payments. (2) Coupled with projected 2030 ridership revenue, it could cover roughly 40% of annual O&M payments upon stabilized
operations. Revenue risk related to the amount or timing of these receipts would remain with the City.
(1) Refers to sites originally acquired by HART for a transit purpose. Revenue from these sites is assumed to be available for HART system O&M costs. (2) Reflects midpoint estimate; low is $116M (6%) and high is $361M (16%) ; ground lease estimates assume affordable housing requirements are met. Note: Figures assume inflation of 2.5% per annum.
5 Assess potential for transit oriented development (TOD) and ancillary revenue opportunities to
contribute to a rail infrastructure P3 project
Can these opportunities be incorporated into a P3 procurement? What is the scale of potential revenues?
Goal 5: TOD and Ancillary Revenue Opportunities
Likely Impact on O&M Funding
2030 Stabilized
Operations (full
ridership ramp-up)
5%
6% $141M
$97M
HART TOD and Ancillary Revenues
$97 million in TOD revenue from HART-
acquired sites and $141 million in
ancillary revenue generate $238 million in
total
P3 Commercial Viability Analysis | Page 18
Reliance restricted; prepared solely for HART. Does not constitute assurance or legal advice. Refer to limitations and restrictions on page 2.
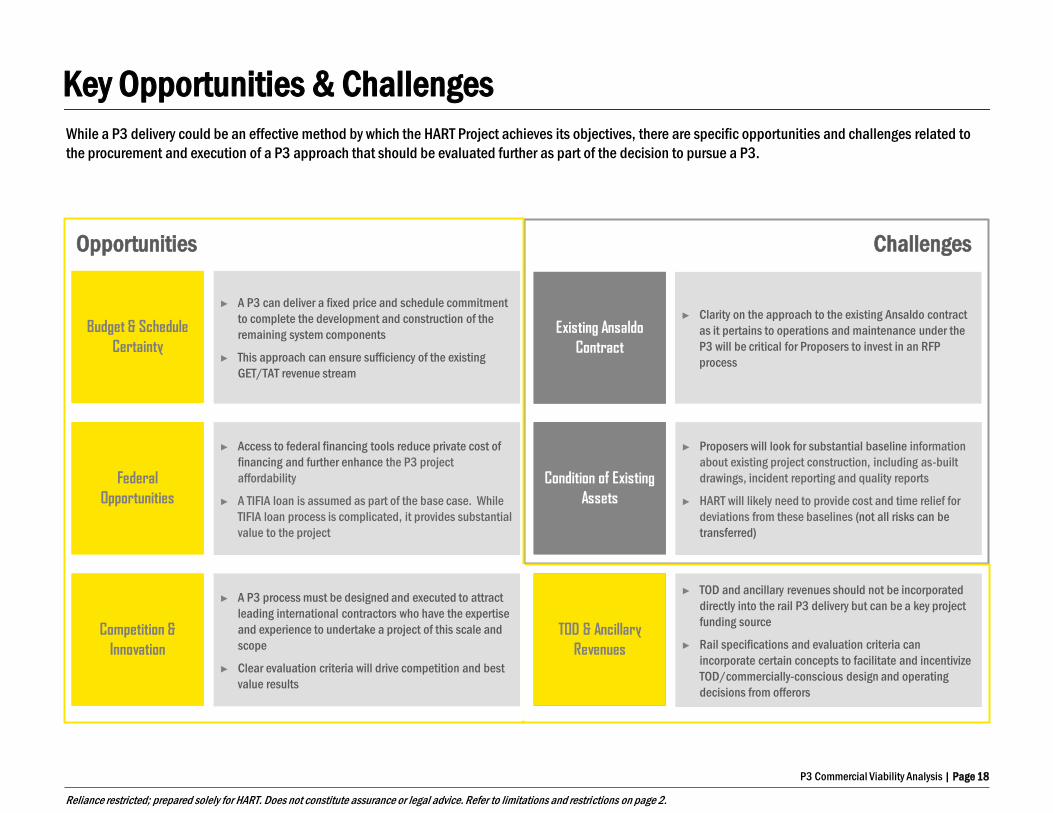
Key Opportunities & Challenges
While a P3 delivery could be an effective method by which the HART Project achieves its objectives, there are specific opportunities and challenges related to
the procurement and execution of a P3 approach that should be evaluated further as part of the decision to pursue a P3.
Budget & Schedule
Certainty
► A P3 can deliver a fixed price and schedule commitment
to complete the development and construction of the
remaining system components
► This approach can ensure sufficiency of the existing
GET/TAT revenue stream
Existing Ansaldo
Contract
► Clarity on the approach to the existing Ansaldo contract
as it pertains to operations and maintenance under the
P3 will be critical for Proposers to invest in an RFP
process
Federal
Opportunities
► Access to federal financing tools reduce private cost of
financing and further enhance the P3 project
affordability
► A TIFIA loan is assumed as part of the base case. While
TIFIA loan process is complicated, it provides substantial
value to the project
Condition of Existing
Assets
► Proposers will look for substantial baseline information
about existing project construction, including as-built
drawings, incident reporting and quality reports
► HART will likely need to provide cost and time relief for
deviations from these baselines (not all risks can be
transferred)
Competition &
Innovation
► A P3 process must be designed and executed to attract
leading international contractors who have the expertise
and experience to undertake a project of this scale and
scope
► Clear evaluation criteria will drive competition and best
value results
TOD & Ancillary
Revenues
► TOD and ancillary revenues should not be incorporated
directly into the rail P3 delivery but can be a key project
funding source
► Rail specifications and evaluation criteria can
incorporate certain concepts to facilitate and incentivize
TOD/commercially-conscious design and operating
decisions from offerors
Challenges Opportunities
P3 Commercial Viability Analysis | Page 19
Reliance restricted; prepared solely for HART. Does not constitute assurance or legal advice. Refer to limitations and restrictions on page 2.
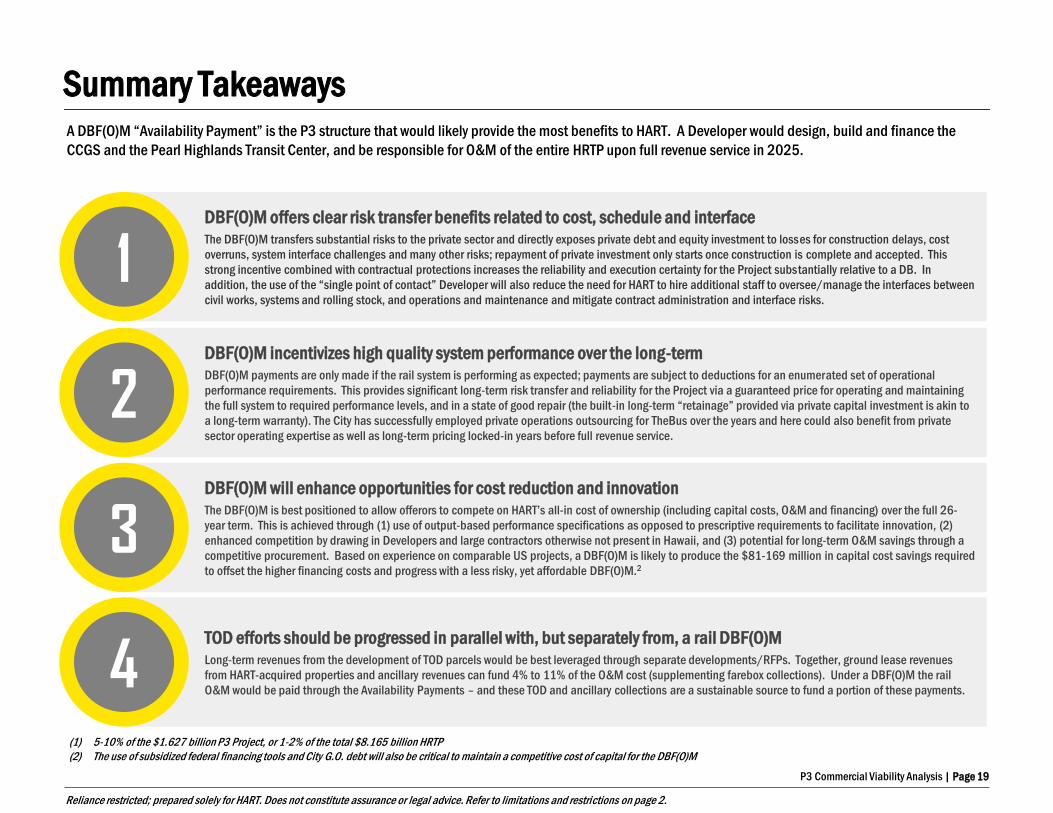
Summary Takeaways
DBF(O)M offers clear risk transfer benefits related to cost, schedule and interface The DBF(O)M transfers substantial risks to the private sector and directly exposes private debt and equity investment to losses for construction delays, cost
overruns, system interface challenges and many other risks; repayment of private investment only starts once construction is complete and accepted. This
strong incentive combined with contractual protections increases the reliability and execution certainty for the Project substantially relative to a DB. In
addition, the use of the “single point of contact” Developer will also reduce the need for HART to hire additional staff to oversee/manage the interfaces between
civil works, systems and rolling stock, and operations and maintenance and mitigate contract administration and interface risks.
1
DBF(O)M incentivizes high quality system performance over the long-term DBF(O)M payments are only made if the rail system is performing as expected; payments are subject to deductions for an enumerated set of operational
performance requirements. This provides significant long-term risk transfer and reliability for the Project via a guaranteed price for operating and maintaining
the full system to required performance levels, and in a state of good repair (the built-in long-term “retainage” provided via private capital investment is akin to
a long-term warranty). The City has successfully employed private operations outsourcing for TheBus over the years and here could also benefit from private
sector operating expertise as well as long-term pricing locked-in years before full revenue service.
2
DBF(O)M will enhance opportunities for cost reduction and innovation The DBF(O)M is best positioned to allow offerors to compete on HART’s all-in cost of ownership (including capital costs, O&M and financing) over the full 26-
year term. This is achieved through (1) use of output-based performance specifications as opposed to prescriptive requirements to facilitate innovation, (2)
enhanced competition by drawing in Developers and large contractors otherwise not present in Hawaii, and (3) potential for long-term O&M savings through a
competitive procurement. Based on experience on comparable US projects, a DBF(O)M is likely to produce the $81-169 million in capital cost savings required
to offset the higher financing costs and progress with a less risky, yet affordable DBF(O)M.2
3
TOD efforts should be progressed in parallel with, but separately from, a rail DBF(O)M Long-term revenues from the development of TOD parcels would be best leveraged through separate developments/RFPs. Together, ground lease revenues
from HART-acquired properties and ancillary revenues can fund 4% to 11% of the O&M cost (supplementing farebox collections). Under a DBF(O)M the rail
O&M would be paid through the Availability Payments – and these TOD and ancillary collections are a sustainable source to fund a portion of these payments. 4
(1) 5-10% of the $1.627 billion P3 Project, or 1-2% of the total $8.165 billion HRTP
(2) The use of subsidized federal financing tools and City G.O. debt will also be critical to maintain a competitive cost of capital for the DBF(O)M
A DBF(O)M “Availability Payment” is the P3 structure that would likely provide the most benefits to HART. A Developer would design, build and finance the
CCGS and the Pearl Highlands Transit Center, and be responsible for O&M of the entire HRTP upon full revenue service in 2025.
P3 Commercial Viability Analysis | Page 20
Reliance restricted; prepared solely for HART. Does not constitute assurance or legal advice. Refer to limitations and restrictions on page 2.
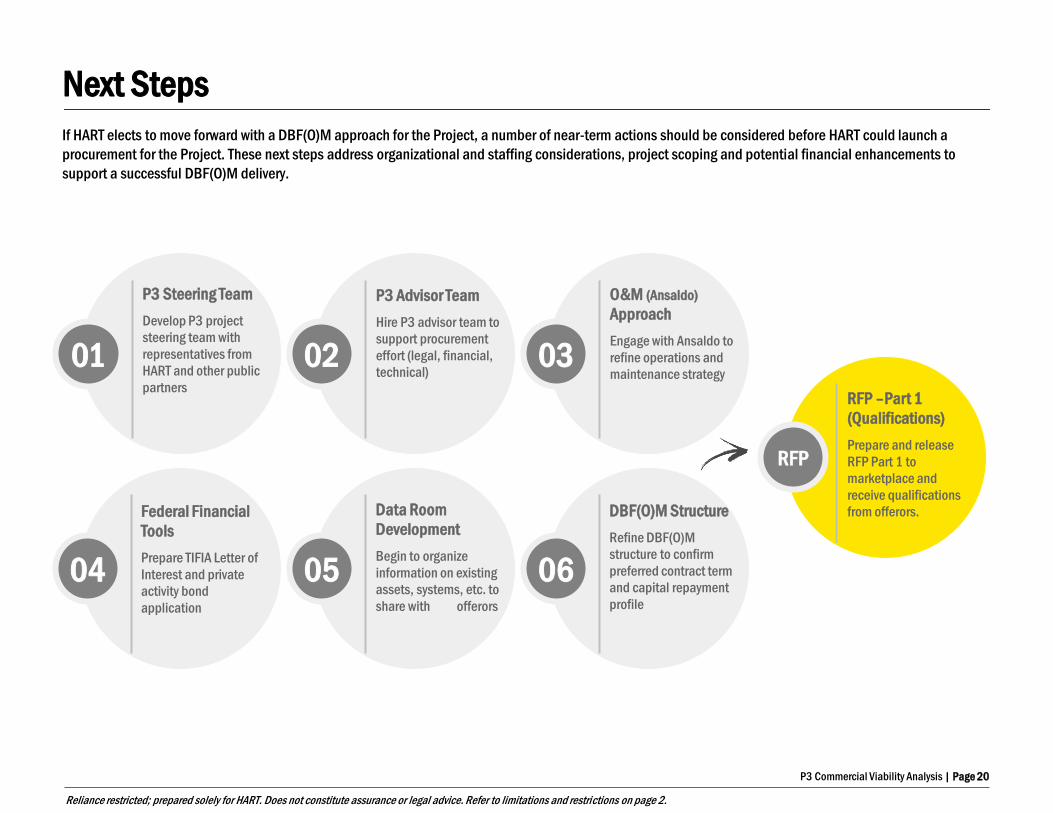
If HART elects to move forward with a DBF(O)M approach for the Project, a number of near-term actions should be considered before HART could launch a
procurement for the Project. These next steps address organizational and staffing considerations, project scoping and potential financial enhancements to
support a successful DBF(O)M delivery.
Next Steps
P3 Steering Team
Develop P3 project
steering team with
representatives from
HART and other public
partners
01
P3 Advisor Team
Hire P3 advisor team to
support procurement
effort (legal, financial,
technical) 02
O&M (Ansaldo)
Approach
Engage with Ansaldo to
refine operations and
maintenance strategy 03
Federal Financial
Tools
Prepare TIFIA Letter of
Interest and private
activity bond
application
04
Data Room
Development
Begin to organize
information on existing
assets, systems, etc. to
share with offerors
05
RFP –Part 1
(Qualifications)
Prepare and release
RFP Part 1 to
marketplace and
receive qualifications
from offerors.
RFP
DBF(O)M Structure
Refine DBF(O)M
structure to confirm
preferred contract term
and capital repayment
profile
06
P3 Commercial Viability Analysis | Page 21
Reliance restricted; prepared solely for HART. Does not constitute assurance or legal advice. Refer to limitations and restrictions on page 2.
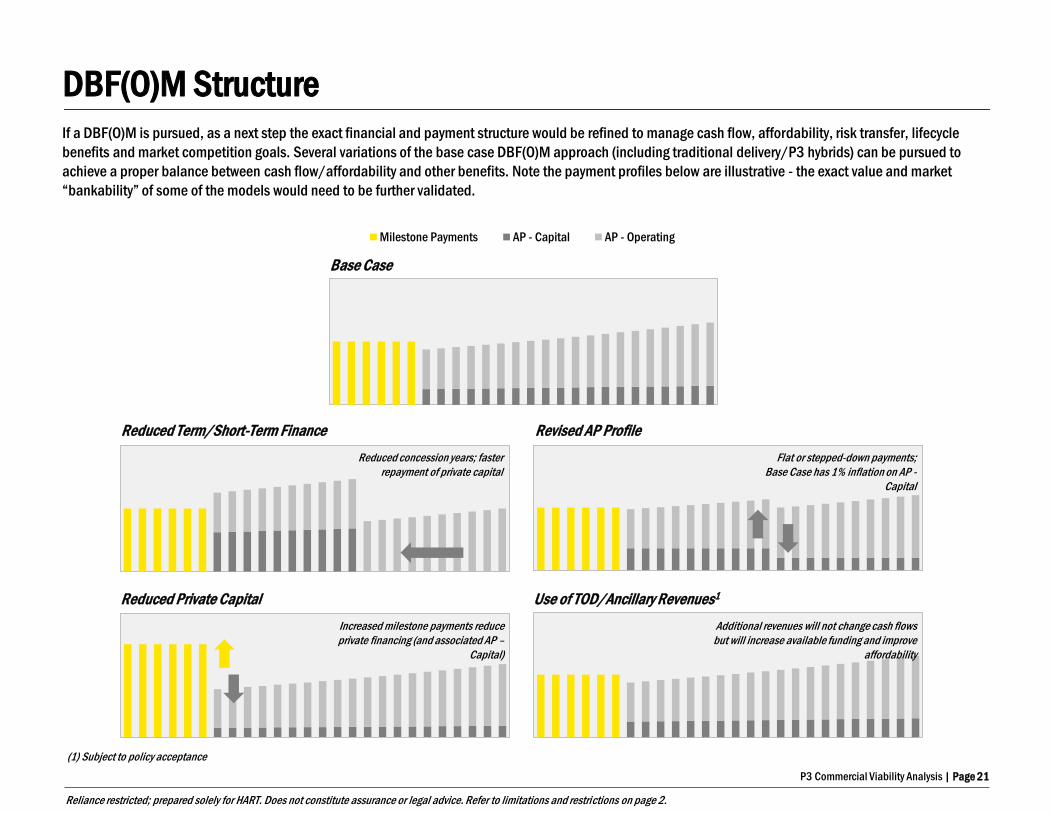
Milestone Payments AP - Capital AP - Operating
If a DBF(O)M is pursued, as a next step the exact financial and payment structure would be refined to manage cash flow, affordability, risk transfer, lifecycle
benefits and market competition goals. Several variations of the base case DBF(O)M approach (including traditional delivery/P3 hybrids) can be pursued to
achieve a proper balance between cash flow/affordability and other benefits. Note the payment profiles below are illustrative - the exact value and market
“bankability” of some of the models would need to be further validated.
DBF(O)M Structure
Base Case
Reduced Term/Short-Term Finance Revised AP Profile
Reduced Private Capital Use of TOD/Ancillary Revenues1
Flat or stepped-down payments;
Base Case has 1% inflation on AP -
Capital
Reduced concession years; faster
repayment of private capital
Increased milestone payments reduce
private financing (and associated AP –
Capital)
Additional revenues will not change cash flows
but will increase available funding and improve
affordability
(1) Subject to policy acceptance

Top Related