


Languages
Pages
Legal


l“”LA-5012-PR ~A PROGRESS REPORT
Performance of Multiple HEPA Fik-s
Against Plutonium A-ercxds
for Period Murch 1 through June 30, 1972 ‘
For Reference
Not to be taken from this room
‘)of the University of California
LOS ALAMOS, NEW MEXICO 87544
4\
UNITED STATES
ATOMIC ENERGY COMMISSION
CONTRACT’ W-7405 -ENG. 36

This report was prepared as an account of work sponsored by the United
States Government. Neither the United States nor the United States Atomic
Energy Commission, nor any of their employees, nor any of their contrac-
tors, subcontractors, or their employees, makes any warranty, express or im-
plied, or assumes any legal liability or responsibility for the accuracy, com-
pleteness or usefulness of any information, apparatus, product or process dis-
closed, or represents that its use would not infringe privately owned rights.
In the interest of prompt distribution, this progress reportI
was not edited by the Technical Information staff; I .... ..-
.. -’, . . . . .
.. . ... .
Printed in the United St. I- 2. Availeble from
National Technical II, t I Service
U. S. Department of Lci.. wce
5285 Port Royal Road “
Springfield, Virginia 22151
Price: Printed Copy $3.00; Microfiche $0.95
... —-

4)+-8hn C3kmcw
sciera?itic IaboraSaryof the University of California
LOS ALAMOS, NEW MEXICO 87S44
Performance
Against
ILA-5012-PRA Progress Report
SPECIAL DISTRIBUTION
ISSUED: .hlly 1972
of Multiple HEPA Filters
Plutonium AerosokI
for Period March 1 through June 30, 1972 ~
12y
HarryJ.Ettinger,ProjectManagerJohnC.Eider
ManuelGonzales
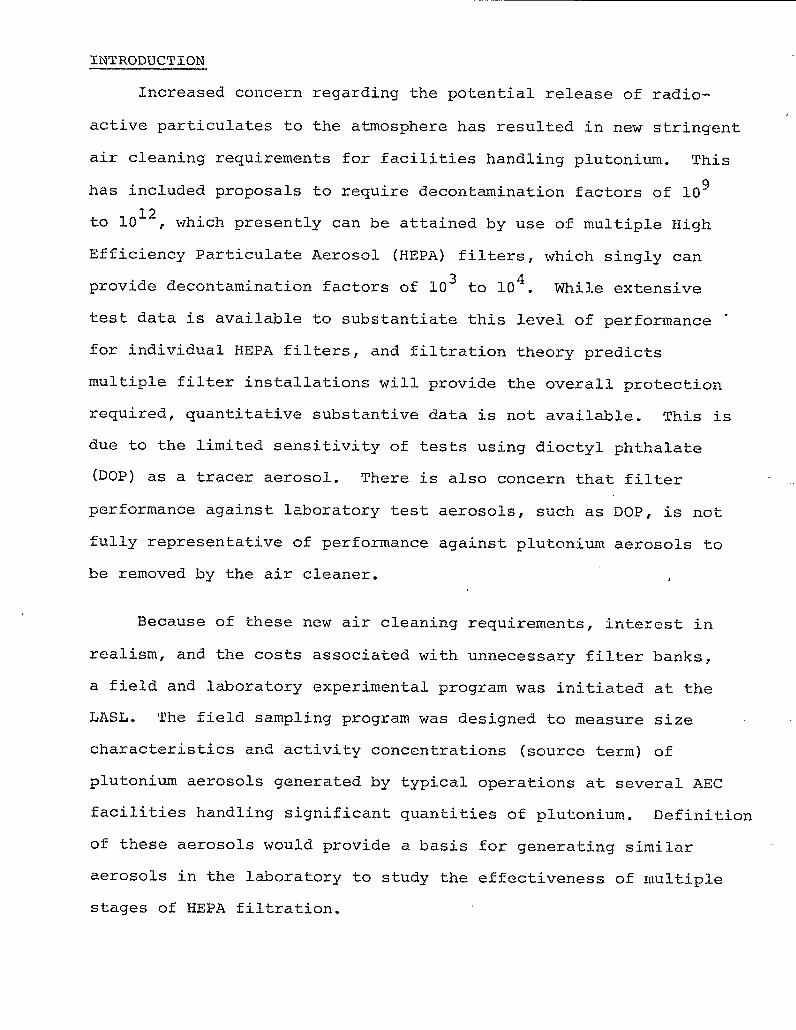
INTRODUCTION
Increased concern regarding the potential release of radio-
active particulate to the atmosphere has resulted in new stringent
air cleaning requirements for facilities handling plutonium. This
has included proposals to require decontamination factors of 109
to 1012, which presently can be attained by use of multiple High
Efficiency Particulate Aerosol (HEPA) filters, which singly can
4provide decontamination factors of 103 to 10 . While extensive
test data is available to substantiate this level of performance -
for individual HEPA filters, and filtration theory predicts
multiple filter installations will provide the overall protection
required, quantitative substantive data is not available. This is
due to the limited sensitivity of tests using dioctyl phthalate
(DOP) as a tracer aerosol. There is also concern that filter
performance against laboratory test aerosols, such as DOP, is not
fully representative of performance against plutonium aerosols to
be removed by the air cleaner.4
Because of these new air cleaning requirements, interest in
realism, and the costs associated with unnecessary filter banks,
a field and laboratory experimental program was initiated at the
LASL . The field sampling program was designed to measure size
characteristics and activity concentrations (source term) of
plutonium aerosols generated by typical operations at several AEC
facilities handling significant quantities of plutonium. Definition
of these aerosols would provide a basis
aerosols in the laboratory to study the
stages of HEPA filtration.
foz generating similar
effectiveness of multiple

This first progress report only covers four months since
initiation of the program, therefore data reported is of a
preliminary and limited nature, and complete statistical analysis
is not yet available. However, general trends are indicated. To
date, analytical procedures generally consist of gross alpha
counting, with the assumption. that Pu is the only particulate
present. Alpha spectroscopy will be employed to verify this
assumption.
2

I. SUMMARY
The field sampling program
membrane filters) , and particle
for activity concentrations (using
size analysis (using Andersen
impactors) , has been in
sampling locations have
facilities: Los AlalTtos
and Rocky Flats Plant.
progress since mid-March, 1972. Five
been selected at the following three AEC
Scientific Laboratory, Mound Laboratory,
These five sampling locations will provide
data to characterize the source aerosol resulting from 1) chemical
production; 2) research and development activities; and 3)
machining and fabrication. These sampling sites will include
238PU 239PUoperations involving ; ; and a mixture of the two
isotopes.
Initial data shows Pu concentrations ranging from 286 dpm/m3
to 16.5 x 10⁶ dpm/m3. Aerodynamic size characteristics based on
Andersen irnpactor sampling and analysis by a computer program
which provides a log normal minimum chi-squares fit of these data
indicate the following for two of the sampling locations:
aerodynamic activity median diameter (aamd) = .52 ~m to 3.5 pm
geometric standard deviation (ag) = 1.5 to 6.6
Mean values of aamd and u for each location are 1.70 pm9
and 2.33; 2.83 pm and 3.o3, respectively. A third sampling
location has an aamd too small to be adequately analyzed by
Andersen impactors. Approximately 60% of the particulate activity
at this sampling location is smaller than the smallest cutoff
diameter of the Andersen impactor.
,
3

Potential errors due to particle rebound from impactor plates
is being evaluated using twin impactor streams with one sampler
having the impactor surfaces coated with a membrane filter.
Preliminary results indicate that particle rebound is not a
serious problem. Initial samples for electron microscopy have
not been adequate for particle sizing due to low particle concen-
tration and the background from nonradioactive particles. Electron
microscopy has indicated minimal agglomeration of particles
collected from one exhaust air stream.
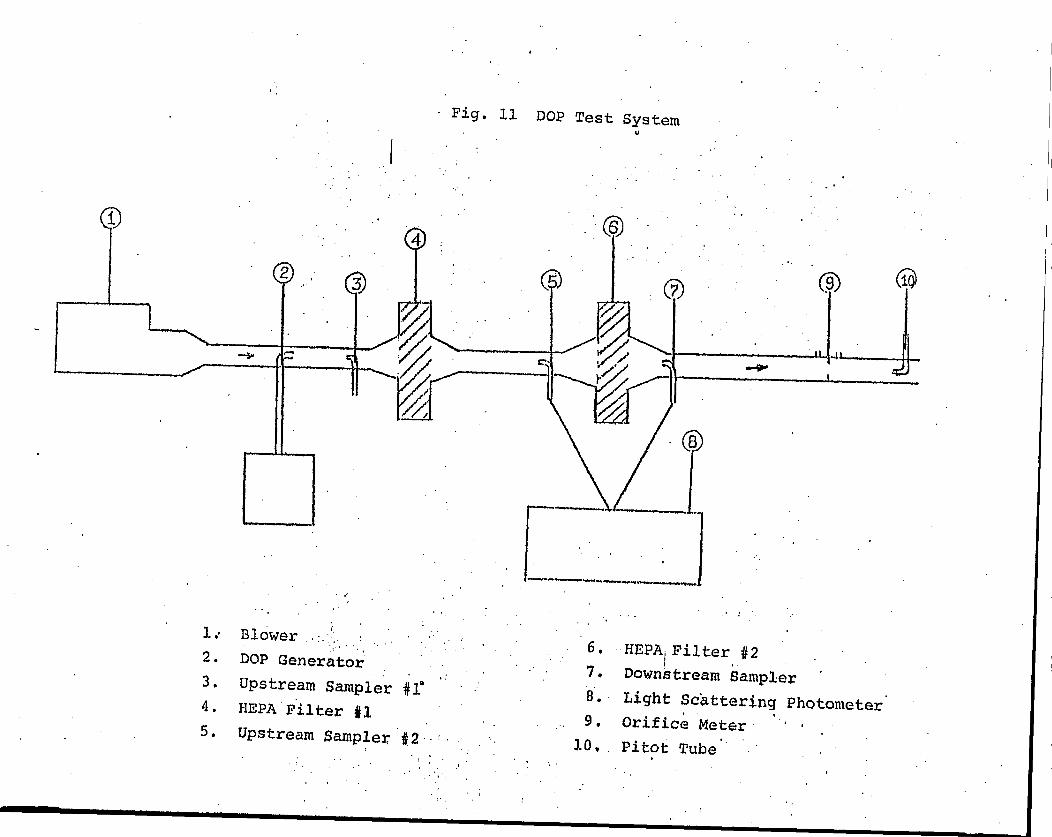
A polydisperse DOP test system has been constructed to a)
quality control test all HEPA filters to be evaluated using
plutonium aerosols, and b) estimate HEPA filter efficiency for
the second of two filters in series. The latter involves using a
25 cfm test system employing two HEPA filters in series, and
generating a highly concentrated DOP aerosol upstream of the first
filter to provide an aerosol concentration downstream of the first
of about 0.4 to 1.0%. This then constitutes the upstream challange
aerosol for the second HEPA filter. Using the minimum detectable
limit for the LASL
this second filter
light scattering photometer, efficiency for
j-s>99.9$3.
Several methods of generating the plutonium aerosol are being
investigated. Alpha counting capabilities are being expanded to
accommodate samples from the laboratory experimental study.

11. FIELD SAMPLING
A. BACKGROUND
AEC plants participating in this first phase of the
field sampling program fall within the jurisdiction of the AEC
Albuquerque Operations Office. These include: Los Alamos
Scientific Laboratory, Mound Laboratory, and Rocky Flats Plant.
These three plants, represent many different production and
research operations, utilizing both 238Pu and 239PU, and are
expected to provide suitable air sampling data for evaluating
source terms under a variety of “worst normal” conditions. We
have defined. “worst normal” the highest range of activities
generated as a result of routine operations. “Worst normal”
would not include an accident situation, or rarely-performed
maintenance operation, which causes an unusual aerosol, release.
Generally only the source term, or particles incident on
the exhaust HEPA filters at each location, is being measured,
however, some air samples have been obt~ined (but not yet analyzed)
downstream of those HEPA filters which are routinely tested using
DOP . These data will define HEPA filter efficiency for air cleaning
systems which have previously been in-place DOP tested.
Wide variations of activity concentration were expected,
primarily due to differences in the amount of material handled at
each location. Differences in size characteristics were also
expected for two reasons: 1) plutonium handling procedures
(mechanical and chemical) differ markedly at each site; and 2)
aerosols incident on the main exhaust filters may undergo previous
5

stages of filtration at the glovebox. Therefore, results of this
study will necessarily be reported as ranges of values to describe
the source term and aerosol size characteristics.
Due to the nature of some
plants involved, sampling locations
be identified only in these general
operations performed in the
and operational processes will
terms :
1) general research and development (r & d)
2) recovery (chemical operations)
3) production (mechanical operations)
It should suffice to report source term data without tying them
to a specific location. If more detailed reports relating aerosol
sources to types of operations are needed, these may be prepared
,with a limited distribution.
The field sampling program is expected to terminate at
these three plants by mid-September. Sufficient data defining
tlhesesource terms should be available early in the next quarter
to permit initiation of the laboratory study.
B. EXPERIMENTAL APPARATUS AND TECHNIQUE
1. SIZE SEPARATION BY AiiDERSEN IMPACTOR
The 8-stage Andersen impactor (1)was selected to be
the primary sampler for particle size analysis. This device is
simple, easy to operate in the field, and provides size separation
over a fairly wide range of particle diameters. Size separation
is based
entering
directed
on inertial properties of the aerosol particles. Particles
the impactor are accelerated through multiple jets and
toward an impaction surface. Larger particles having
6

sufficient inertia leave the flow path and impact on the col-
lecting surface. Smaller particles (particles with less inertia)
continue on to succeeding stages in which smaller jets and
higher velocities cause them to eventually deposit according to
their aerodynamic size. Particles sufficiently small to clear all
stages of the impactar are collected by a backup membrane filter
(Ml?)which in effect becomes a ninth collection stage.
The backup MF and the eight impaction plates
undergo radiometric analysis by alpha counting. The net count rate
can be considered proportional to the mass of particles deposited
on a plate if two assumptions are made: 1) absorption of alpha
particles in the particle (self-absorption) is negligible, and
2) specific activity (dpm/gm) is constant. According to
Anderson ‘2), a 5 MeV alpha particle has a range of at least 10 pm
‘n ‘u02’ compared to a physical diameter of 3-4 pm collected. at
the first stage of the impactor. An alpha particle emitted any-
where in a 4 pm PU02 particle should emerge from the particle with
sufficient energy to be counted. Spectroscopy samples, discussed
in more detail later, support this hypothesis for the particle
size range of interest in this study. Constant specific activity
of plutonium deposited on the impactor samples is a valid assumption
if one Pu isotope is handled and if the form of Pu (density) does
not change. One of the three facilities discharges a mixture of
238Pu and 239Pu in highly variable ratios. The complexity of this
situation and some alternatives to the present methods of analysis
will be discussed in Results and Discussion Section.
7
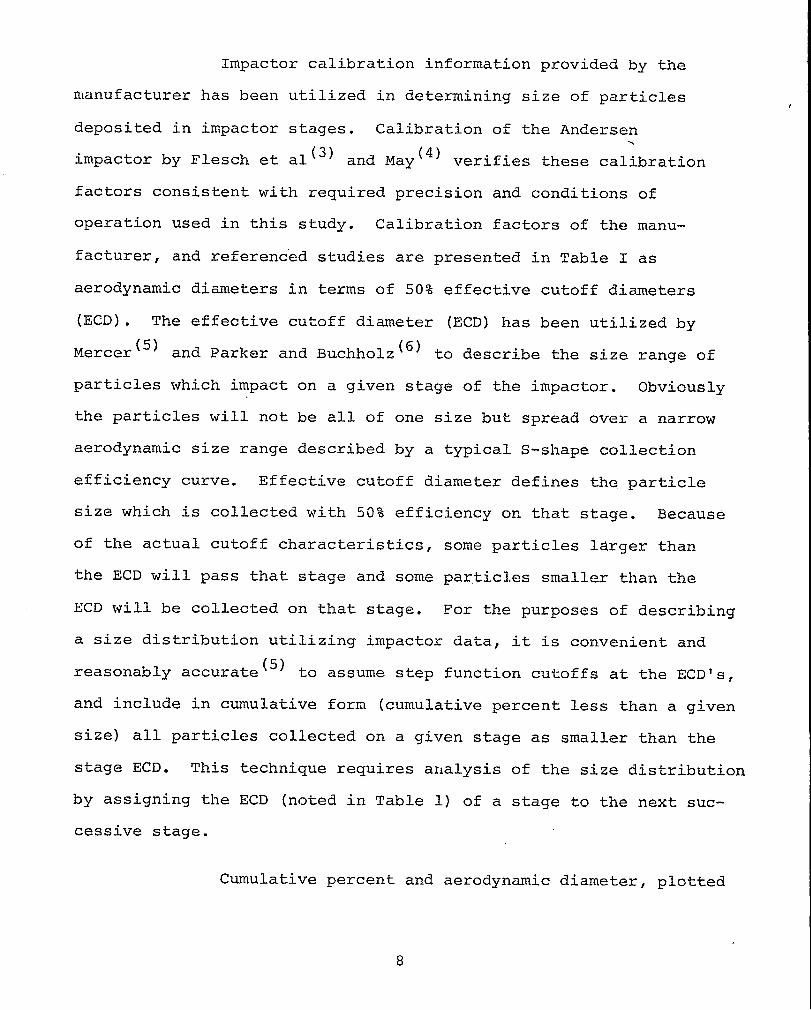
Impactor calibration information provided by the
manufacturer has been utilized in determining size of particles
deposited in impactor stages. Calibration of the Andersen\
impactor by Flesch et al (3) and May ‘4) verifies these calibration
factors consistent with required precision and conditions of
operation used in this study. Calibration factors of the manu-
facturer, and referenced studies are presented in Table I as
aerodynamic diameters in terms of 50% effective cutoff diameters
(ECD). The effective cutoff diameter (ECD) has been utilized by
Mercer ‘5) and Parker and Buchholz (6) to describe the size range of
particles which impact on a given stage of the impactor. Obviously
the particles will not be all of one size but spread over a narrow
aerodynamic size range described by a typical S-shape collection
efficiency curve. Effective cutoff diameter defines the,particle
size which is collected with 50% efficiency on that stage. Because
of the actual cutoff characteristics, some particles larger than
the ECD will pass that stage and some par,ticl.essmaller than the
ECD will be collected on that stage. For the purposes of describing
a size distribution utilizing impactor data, it is convenient and
reasonably accurate (5) to assume step function cutoffs at the ECD’S,
and include in cumulative form (cumulative percent less than a given
size) all particles collected on a given stage as smaller than the
stage ECD. This technique requires analysis of the size distribution
by assigning the ECD (noted in Table 1) of a stage to the next suc-
cessive stage.
Cumulative percent and aerodynamic diameter, plotted
8

on log probability graph paper and analyzed by graphical
inethods(7), directly
(aamd) and geometric
bution. The aamd is
define aerodynamic
standard deviation
closely related to
activity median diameter
(09) of the size disixi-
aerodynamic mass median
diameter (ammd). Results of size measurements will be reported in
terms of these size parameters rather than converting to frequently
used alternates such as microscopic count median diameter or mass
median diameter. Aerodynamic diameter is the parameter of concern
since it defines the aerodynamic properties of a particle (or
cluster) which in turn defines the probability of filter pene’tiation.
Evaluation of the Andersen impactor has indicated a
potential error due to particle rebound; i.e. the particle does
not adhere to the first plate it contacts (8,9). The particle may
then deposit on the next stage, or rebound from all succeeding
stages and be collected by the backup filter. In either case the
aamd would be reduced, and the a would increase.9
Use of a “sticky”
impaction surface would interfere with alpha counting procedures and
was not acceptable. ‘Toevaluate the problem of Pu particle rebound,
several types of membrane filter media have been applied to the
surface of the impactor plates. Knuth ‘9) suggested that a glass
fiber filter (MSA 1106B) provides the best retention and minimizes
rebound. His tests, however, used polystyrene latex spheres, not
Pu aerosols, and operated the impactor with much heavier particle
loadings than encountered in this study. Limited -qualitative tests
at LASL has shown plutonium to adhere well to bare stainless steel
plates; therefore, rebound may be of minor significance. In
quantitative tests now under way, adjacent impactor sampling streams
9

have been installed at one sampling site. Samples have been
obtained covering the plates of one impactor with Gelman vinyl
metricel membrane filters and leaving the plates of the other
impactor bare. By alternating the MF coating on each impactor
each day, data indicating rebound (or no rebound) can be developed
despite possible slight differences between the two sampling
streams. Although some reduction in particle rebound may be
attained by application of a MF plate coating, efficiency of the
radiometric technique measuring plutonium concentration on each
impactor stage may suffer to an unknown extent due to absorption
of alpha particles imbedded in the filter media. The choice
would then be to select a material sufficiently hard to resist
burying of particles while reducing rebound. Vinyl metricel was
selected as a material which might meet these requirements.
Alpha spectroscopy has provided information on the
ratio of two plutonium isotopes present at one sampling site, and
a qualitative indication of absorption of alpha particles by filter
media applied to impactor plates as an anti-rebound agent. If
energy peaks are well defined and consistent with the 5.5 MeV
238Pu alpha and the 5.16 MeV 239Pu alpha, little alpha absorption
occurs in the media. 15 the energy peaks are degraded and show
significantly lower alpha energy, then use of the filter media and
the radiometric technique are not compatible. A limited number of
samples for spectroscopy have been collected on the following filter
media:
Gelman DM-800 vinyl metricel membrane
10
,

Whatman 41
Gelman Type E glass fiber
These data will be analyzed early in the next quarter. Preliminary
analysis of Gelman vinyl metricel media showed very little ab-
sorption and indicate its suitability for use as a sampling filter,
and impactor anti-rebound agent.
2. ACTIVITY CONCENTRATION MEASUREMENTS
A sampling stream parallel to the impactor stream,
contains a 47 mm Gelman DM-800 (0.8 pm pore size) vinyl metricel
membrane filter in a Gelman in-line filter holder. This sample
defines total alpha activity concentration. An air sample is
drawn through this filter at 1.0 cfm and should collect the same
amount of activity as the adjacent impactor. The sampling streams
are shown schematically in Figure 1. Alpha counting of the MF is
similar to that for impactor plates. The vinyl material is also
resistant to the acid mists found in the glovebox ventilation ducts.
Identical flow instrumentation and calibration
techniques have been used on all streams. Bendix O-2 cfm rotameters
have been calibrated and corrected for altitude differences between
sampling sites with a laboratory spirometer serving as the primary
calibration standard.
3. SELECTION OF SAMPLING LOCATIONS
Reasonably accurate samples of particulate matter
can be obtained from a rapidly flowing air stream, such as a
ventilation duct, if the following rules are observed:
11
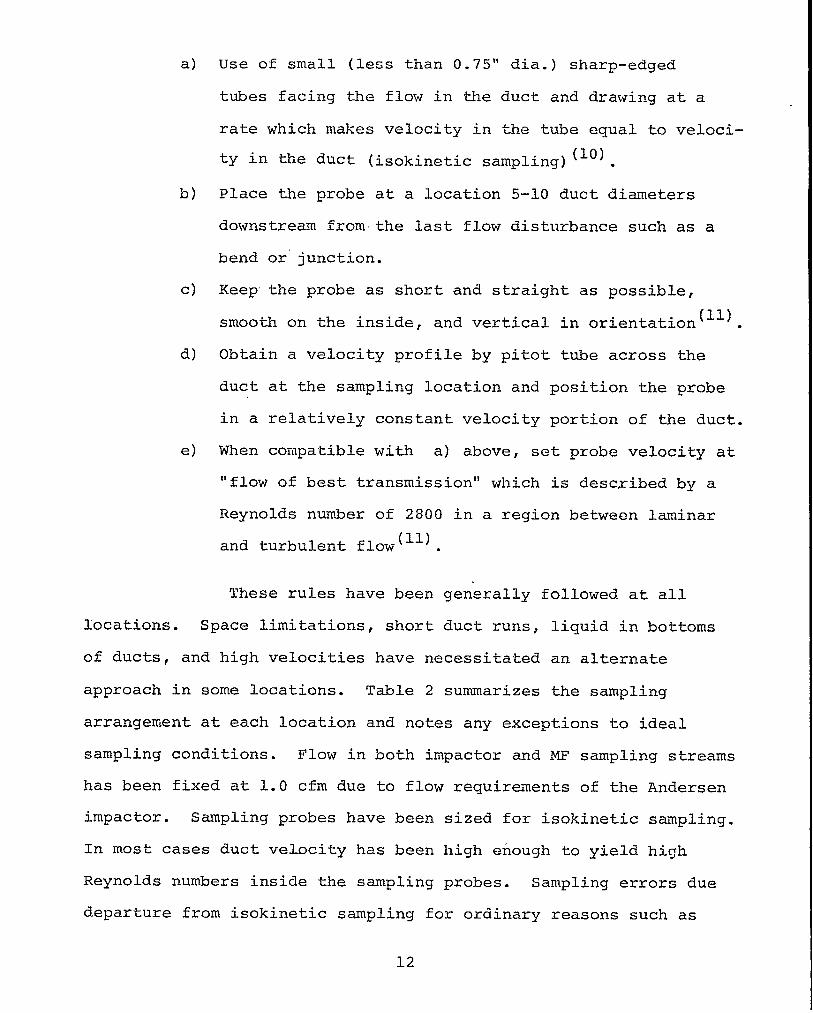
a)
b)
c)
d)
e)
Use of small (less than 0.75” dia.) sharp-edged
tubes facing the flow in ‘&e duct and drawing at a
rate which makes velocity in the tube equal to veloci-
ty in the duct (isokinetic sampling) (10) ●
Place the probe at a location 5-10 duct diameters
downstream fromthe last flow disturbance such as a
bend or junction.
Keep the probe as short and straight as possible,
smooth on the inside, and vertical in orientation (11).
Obtain a velocity profile by pitot tube across the
duct at the sampling location and position the probe
in a relatively constant velocity portion of the duct.
When compatible with a) above, set probe velocity at
“flow of best transmission” which is descxibed by a
Reynolds number of 2800 in a region between laminar
and turbulent flow ’11).
These rules have been generally followed at all
locations. Space limitations, short duct runs, liquid in bottoms
of ducts, and high velocities have necessitated an alternate
approach in some locations. Table 2 summarizes the sampling
arrangement at each location and notes any exceptions to ideal
sampling conditions. Flow in both impactor and MF sampling streams
has been fixed at 1.0 cfm due to flow requireiients of the Andersen
impactor. Sampling probes have been sized for isokinetic sampling.
In most cases duct velocity has been high enough to yield high
Reynolds numbers inside the sampling probes. Sampling errors due
departure from isokinetic sampling for ordinary reasons such as
12
I
erroneous sample flow settings or changes in ventilation flow are
expected to be less than 1% for the small particle sizes encountered
to date. Particles under 5 pm are sampled with greater than 99%
efficiency if a departure from isokinetic conditions of f 10%
occurs (10). It is believed that changes in actual flow conditions
are less than 10%, and maximum particle size is on the order of
Sampling locations at each plant were selected to I
monitor the more contaminated air streams in each plant.
4. SAMPLE COLLECTION AND PREPARATION
Sample sets consist of 8 impactor plates (or the
membrane filters used
(MF2), and the direct
to cover them) , the backup membrane filter
membrane filter sample (MF1). Samples are
lengths of time, depending on the activity in
counting, and shipping,
’105 dpm. The time required
collected for varying
the duct. For convenience of handling,
activity per sample is limited to about
to collect a sample of this order of magnitude varies greatly for
each sampling location. To arrive at the “worst normal” source
term, sampling periods are selected at times when normal activities
in the building are underway; i.e. , not at lunch time or break time
or near quitting time.
Samples are removed from impactor and MF holders at
convenient locations, usually in a nearby fume hood or at a table
in still air. To prepare’ each sample for shipment and counting,
the sample is placed temporarily in a disposable petri dish for
transport to the preparation area. The impactor plate or the MF
13
(with a blank backing plate) is then wrapped in a mylar film
(.00025” thickness); identified; and placed in an interlocking
plastic envelope. The samples are then shipped to LASL for counting
and analysis. The shipping department of each plant ships each
set as exempt quantities of radioactive material. To date,
packaging and shipping has proceeded without any difficulties.
5. SA14PLE COUNTING AND DATA ANALYSIS
A gas flow proportional counter with a 9“x4” detector
is presently used to count alpha activity on each sample. This
counter is approximately 33% efficient for bare samples and 22%
efficient for standard sources covered with a .00025” mylar film.
Net count rate is determined for each sample and utilized as
previously discussed in determining cumulative
a stated aerodynamic particle size. Net count
corresponding effective cutoff diameters (ECD)
computer analysis as a data set of 8 values to,.-,
percent smaller than
rates and the
are submitted for
be fit by minimum
chi-squares methodt~z~ and plotted on a log probability grid.
This analysis defines aerodynamic activity median diameter (aamd)
and geometric standard deviation (og) for the distribution and the
deviation of”each data point from.the best fit line. The latter
value can be utilized in a test to confirm or reject the assumption
of log normality of the distribution. After a large number of
samples are obtained and analyzed, a range of aamd and Ug will be
obtained to describe variation in the size characteristics of
typical Pu aerosols.
14
6. ESP SAMPLING
Size information by
supplement information obtained by
microscopy has been sought to
the Andersen impactor. The LASiI
point-to-plane electrostatic precipitator(13) was utilized to
collect samples on electron microscope grids. Physical size, numbers,
and appearance of the collected aerosol can be examined by electron-
microscopy at high magnification. Sampling and
culty encountered in this process are discussed
Discussion.
c. RESULTS AND DISCUSSION
resolution diffi-
in Results and
1. WORST NORMAL CONCENTRATIONS
Analyses of plutonium samples taken during the first
3-1/2 months of the program show wide variations in activity
concentrations. At one sampling location (00) concentrations were
relatively low and were averaged over 7 or 8 hours. By contrast,
another location occasionally yielded samples greater than 105 dpm
in only one minute’s sampling. Whether one minute samples taken
routinely at this plant coincide with worst normal conditions is a
matter of some concern and probably will only be answered by
analysis of additional samples obtained during periods of high
operational activity.
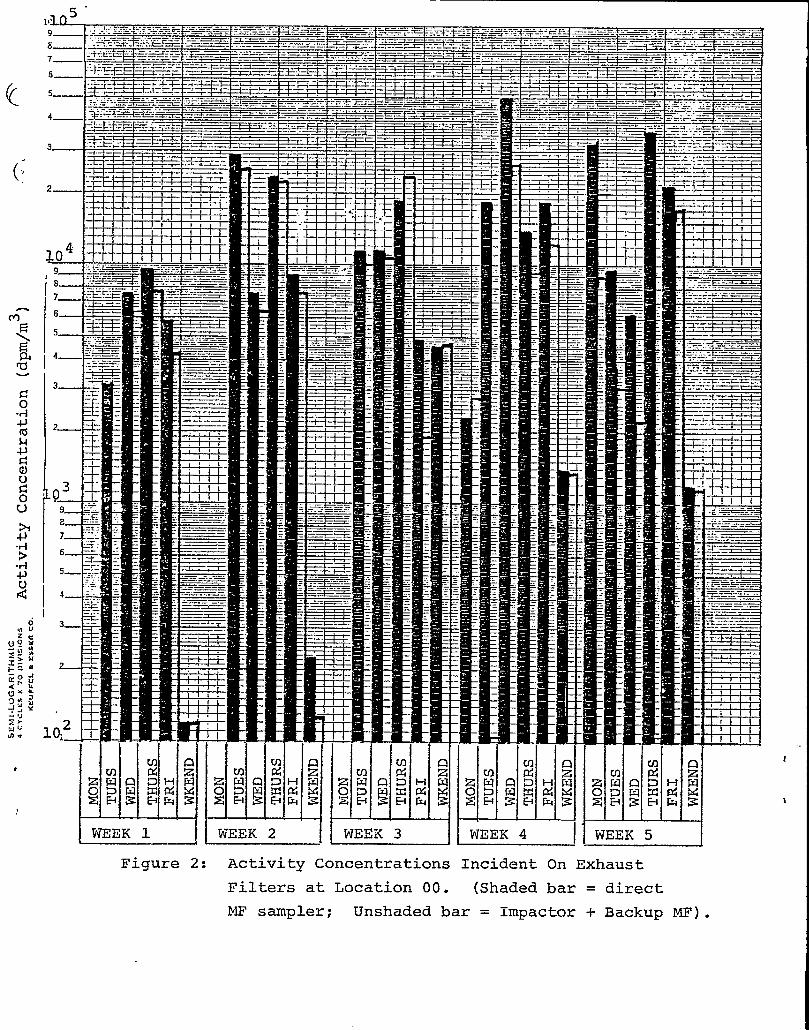
Daily data available for three of the five sampling
locations initially proposed for this study are expressed as
activity concentration versus time in Figures 2 through 6; (Location
00 - Fig. 2-4; Location 11 - Fig. 5; Location 14 - Fig. 6). The
lower activity on most weekends at Location 00 is apparent; however,
15
very large variations in total activity (factors of 10 or more)
also occur during the work week. Differences between these three
locations appear primarily in the magnitude of activity concen-
tration and in the frequency of peak values.
The arithmetic mean of all
normal working days (all three locations)
observations taken on
and on weekends (Location
00 only) , along with extremes, are presented in Table 3. Activity
concentration (As), determined by summing activity on 8 impactor
plates plus the backup filter MF2 is included for comparison with
activity indicated by the membrane filter (Al). Generally good
agreement exists ‘between the two sampling methods indicating no
serious sampling error. Data comprising the results in Table 3
will be analyzed in
source term as mean
values.
several other ways to establish the worst normal
values with confidence limits or percentile
2. AEROSOL SIZE CHARACTERISTICS
Size characteristics of the Pu aerosols defined by
the Andexsen impactors with various plate coating and bare plates
are summarized in Table 4, which also indicates the significance
of the rebound problem. Arithmetic mean values of aerodynamic
activity median diameter (aamd) and geometric standard deviation
(ag) are listed along with their extremes. Wide variations are
apparent, which is not too surprising considering the large number
of different aerosol-producing operations conducted in these plants.
Somewhat surprising was the size distribution of the
Pu aerosol at Location 11. Size characteristics of the aerosol
16

measured here are distinctive due to the high percentage of very
small particles in the distribution. In the 14 impactor measure-
ments made to datez the cumulative percent smaller than 0.43 pm
(final stage ECD) has averaged 60%; that is, 60% of total activity
measured in the impactor sampler passed through the impactor and
was collected on the backup membrane. filter. A distribution of
this type is not readily characterized by the Andersen im,pactor.
At this point in the program,
devised to accurately measure
11.
an alternative method has not been
the size characteristics at Location
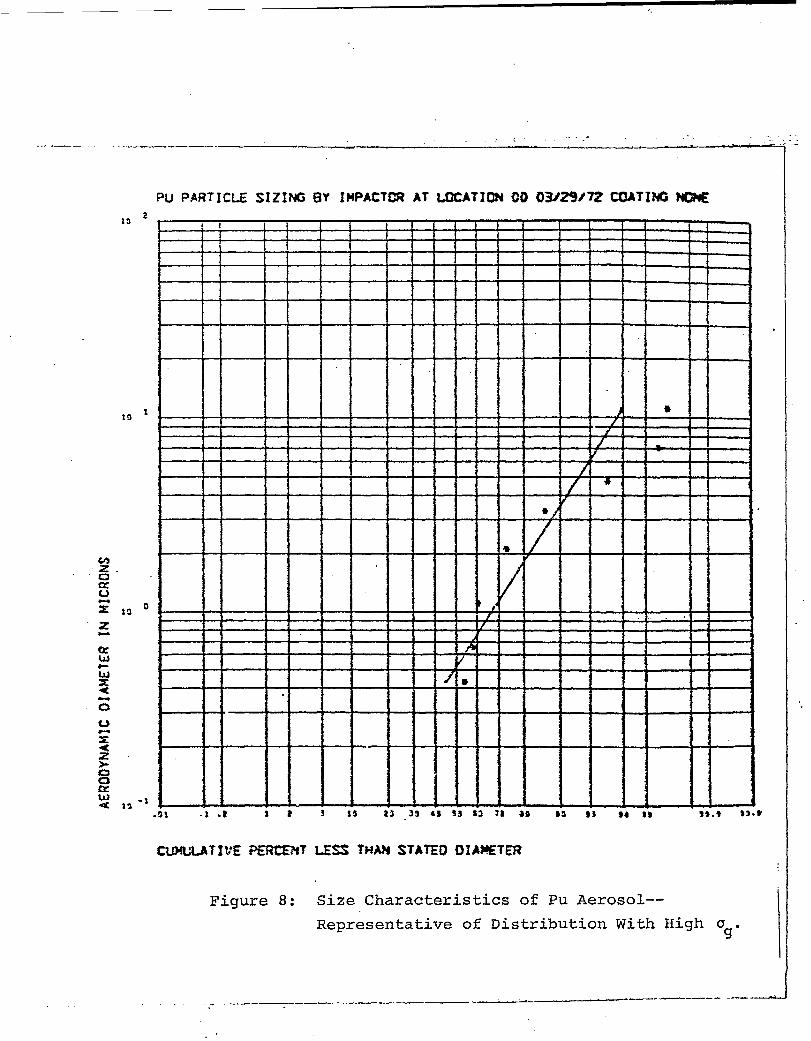
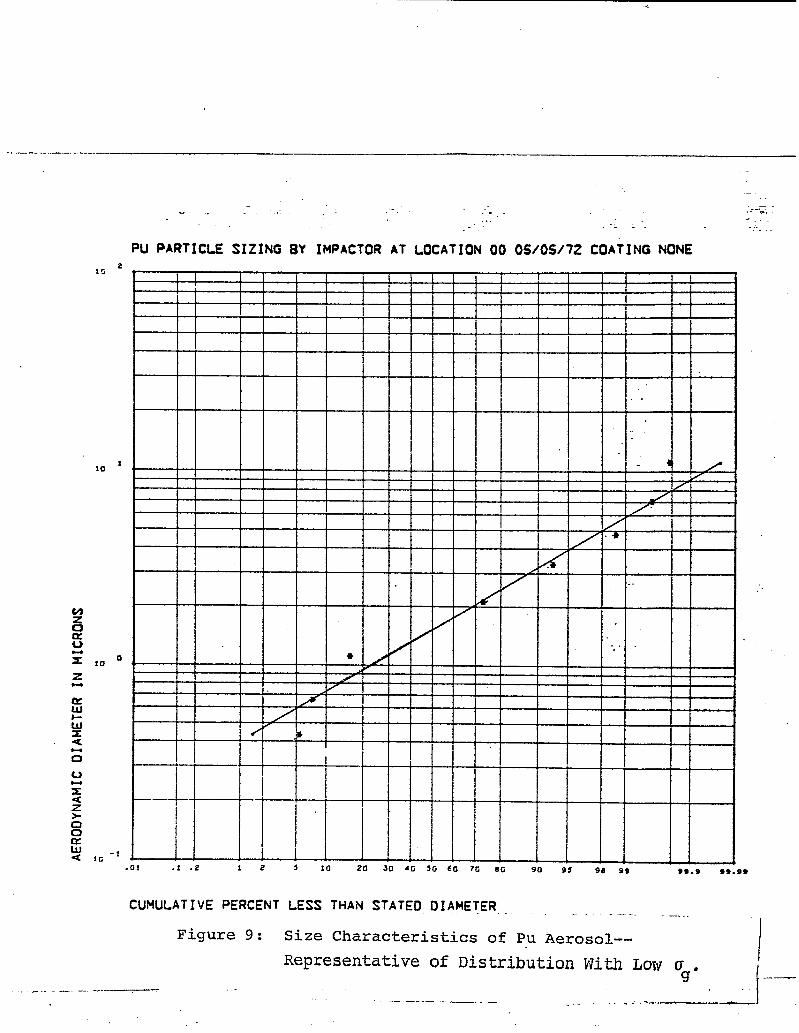
Figures 7, 8, and 9 are included as log probability
representations of a typical plutonium size distribution, and the
extremes. Figure 7 represents a real sample which,
mates the mean aerosol at Location 00 (aamd = 1.70
Figures 8 and 9 represent the two extremes of u .9....
closely approxi-
Um and o = 2.33).9
In each figure a
best fit line defined by the chi-squares methodt~z) is provided.
The aamd is obtained by projecting the “50% smaller th~n” point on
the best fit line to the diameter. The ag is the 84% value of the
diameter divided by the aamd.
Examination of the data in Table 4 reveals no
apparent particle rebound. Had the uncoated plates displayed a
lower aamd and higher u than -coated plates, or larger amounts of9
activity on the backup filter, a rebound problem would be suggested.
Preliminary results of rebound tests conducted with twin impactors
has also been reviewed. Two impactors, one w-ith plates coated
and the other uncoated; were operated concurrently in adjacent
17

parallel streams close to the same point in a ventilation duct.
They indicate very similar size characteristics and
any indication of particle rebound, consistent with
Table 4 noted above.
3. ESP SAMPLES
fail to show
data from
At one sampling location (00), a point-to-plane
electrostatic precipitator (ESP) was utilized to ~btain samples
(12)of the Pu aerosol for sizing by electron microscopy . It appears
that this technique will be of limited usefulness because 1)
plutonium particle concentrations are low, necessitating long-term
sampling and averaging of data which obscures short-term character-
istics of the size distribution, and 2) the presence of many non-
radioactive particles obscured the identity of Pu particles in
‘ electron micrographs. Useful information was derived from the ESP
sampling, since they show no chain agglomerates. This indicates
that the measured size data deals only with individual particles
and not with unstable agglomerates.
4. SPECTROSCOPY .
Spectroscopy of several samples has shown the
presence at Location 00 of 238Pu and 239Pu in similar quantities.
Spectroscopy at the other two locations has not been considered
necessary since only one principle isotope is used at these
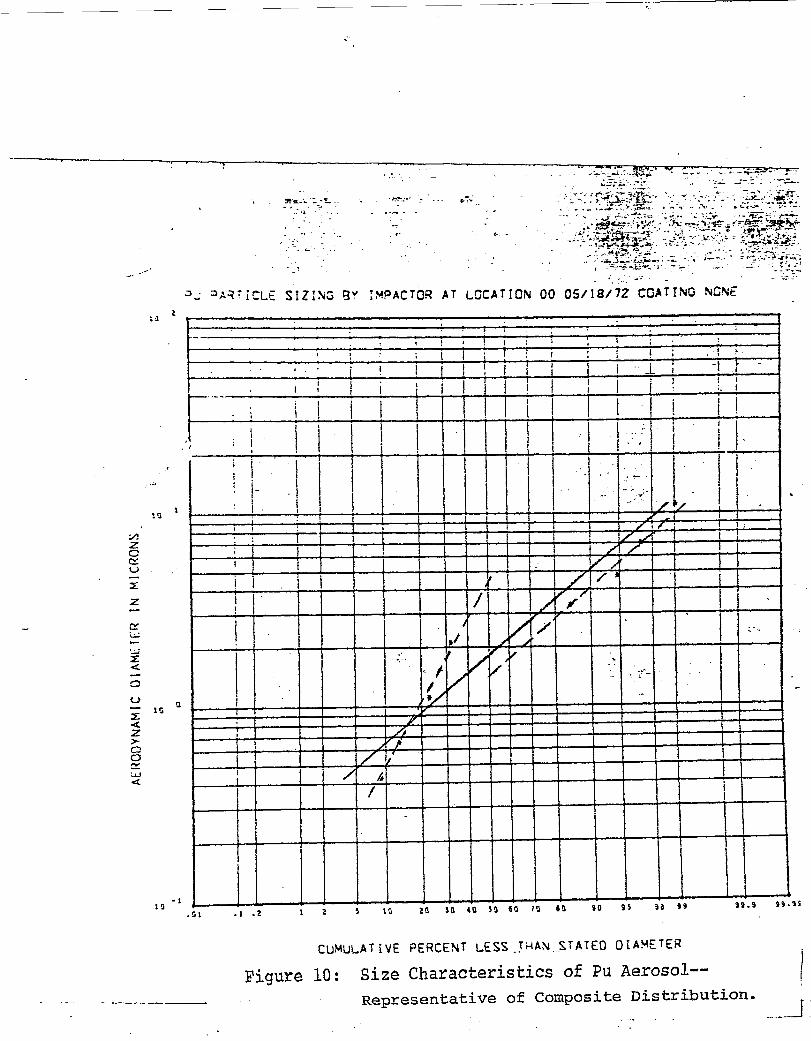
facilities. However, the mixture of two isotopes complicates
measurement of size characteristics because. the 238Pu and 239PU
particles contributing to the total alpha activity on each impactor
plate originate at different operations and probably are related
18
to different size distributions. Figure 11 represents a size
distribution which is very likely a composite of two different
aerosols with different size characteristics. The composite
distribution does not display log normal size characteristics
which are convenient in describing an aerosol size distribution.
Samples to investigate the makeup of composite
distributions by spectrographic means have been obtained and are
undergoing analysis. One set of samples, consisting of five MF
samples taken on consecutive w“orking days, has
23*PU to 239provide Pu ratios. Another set of
238Puto239 Pu ratios for each impactor stage.
may correlate
ponderance of
5.
with the composite
one isotope at one
distribution,
been obtained to
samples will provide
This information
showing a pre-
extreme of the size spectrum.
FILTER EFFICIENCY DATA
Sampling downstream of exhaust filters with an
impactor and membrane filter has been in’progress at Location 00
since mid-March. This site is suitable for efficiency measurements
because its exhaust HEPA filters are EOP tested in place to assure
a 99.95% or greater efficiency. This in place test indicates that
the filters and the filter housing are in satisfactory condition,
and radiometric efficiency measurements should be applicable to the
filter media performance, and not obscured by leakage. Daily down-
stream samples obtained concurrently with upstream samples yielded
too little activity for accurate count statistics. Longer sampling
times downstream were needed without losing the correlation of size
characteristics upstream and downstream of.the filter. This was
19
accomplished by operating the downstream samplers concurrently with
the daily upstream samplers, but without changing the downstream
sampler each day. The downstream sampler generally covered a one
week period.
Penetration data and size characteristics of particles
penetrating the filter are being analyzed.
.20
111. LABORATORY STUDIES
The laboratory experimental phase of this study v7ill use
field sampling data as a basis for defining the experimental
plutonium aerosols used to test multiple stages of HEPA filters.
A. QUALITY CONTROL HEPA FILTER TESTING
To have greater confidence tk,atthe HEPA filters used for
multiple HEPA filtration of the plutonium aerosols, are of high
quality and good physical condition, a quality control polydisperse
DOP test system has been constructed. This system consists of an
ATI 8-jet DOP aerosol generator, 3 inch duct with provision for
installing two 8“x8’’x3-l/l6” HEPA filters in series, sampling ports
upstream and downstream of the second HEPA filter, an orifice meter
for monitoring the air flow, a LASL light scattering photometer (14)1
and a Lamb electric high vacuum blower (Figure 11) . Air flow through
the system can be adjusted for operation at the rated filter - --
air flow rate {25 cfm) and at reduced air flow rates consistent
with more severe test methods.
B. ESTIMATION OF HEPA FILTER EFFICIENCY FOR THE SECOND OF
TWO FILTERS IN SERIES..
The quality control test system provides a means to estimate
the DOI?efficiency of a HEPA filter, which is preceded by a HEPA
filter. The DOP aerosol generator is operated at 15 psig producing
a highly concentrated (not measurable) aerosol upstream of the first
filter, so that the aerosol concentration downstream of this filter
ranges from 0.4 to 1.0%. This constitutes the upstream aerosol
concentration for the second HEPA filter in the series. The LA$=JL
21
light scattering photometer has several sensitivity range settings
from 100% full scale to .01% full scale. The minimum detectable
limit of the instrument is at least 5% of full scale on the .01%
scale since its linearity and stability are good. Using this
minimum detectable limit we can define a minimum efficiency of
99.9% to 99.95% for this second HEPA filter. This is based on the
following:
Minimum detectable limit = 5% of full scale, or
.05 x .01% = .0005% = minimum detectable limit.
If upstream photometer reading = 1.0%, then
.0005%1.0 % < .0,5%penetration, or
filter efficiency > 99.95%
If the upstream concentration is only 0.5%, then the
filter efficiency could only be defined to be > 99.9%. Assumptions
inherent in using this analysis are a) assurance of a minimum
detectable limit of 5% of full scale at the .01% range and b)
unimportance of loading of the first HEPA filter so that the source
term to the second filter is affected. Photometer stability is
adequate to satisfy a) , and the first filter is changed frequently
(for each test) to minimize any loading effect.
Table 5 shows data obtained for three HEPA filters tested
in the above manner. Upstream concentration varied from 0.38 to
1.55% while downstream concent~ations were measured as zero, but
assumed to be < .05%. HOW much below .05% is not known, so that
we can only say that the efficiency of the second HEPA filter is
greater than a calculated value. In all cases the efficiency is
greater than 99.9%
22
c. PLUTONIUM AEROSOL GENERATION
Several methods for the production of plutonium aerosol
are being investigated. High plutonium concentrations are
necessary to provide measurable activity after the second or third
HEPA filter in series.
Burning of plutonium metal was initially considered the
method of interest primarily because this has been done at LASiJ
and could be a relatively simple procedure. However aerosol output
may vary as a function of time and temperature, and aerosol size
(15)characteristics may be difficult to control .
nebulizer
Consideration was given to the use of an ultrasonic
because of its high output. This method produces a
highly variable aerosol output with high wall
abandoned.
The Lovelace nebulizer (16) seems to
losses and has been
meet the requirements
for this study. It is a cheap, simple, air operated, constant
output device, ,with the only drawback being its limited output of
approximately 50 ~1/min. To retain the good qualities of the
Lovelace nebulizer, but increase its output, an alternate aerosol
generation technique under consideration is the Re Tec nebulizer (17)
which reportedly will dispense 260 pl/min. In addition, the
Lovelace Foundation has
capable of aeros’olizing
.
developed a “vortex” nebulizer which is
more than 1 ml/min.
The possibility of applying heat
finely ground powder of PU02 is also under
and vibration to a
consideration. Control
23
of particle size depends on the degree of ball milling of the
oxide. The rate of output for
would have to be investigated.
Nebulization methods
above rely on the availability
this procedure is unknown and
for aerosol generation mentioned
of a suitable plutonium solution.
Various chemical processes exist for the formulation of these
solutions and should pose no great pro’blem. With atomizer methods,
the aerosol may have to be passed through at least one heating
column or through a mixing chamber for drying and thermal degra-
dation ’18).
D. EXPERIMENTAL TEST SYSTEM
Plans for the laboratory experiment include a 2-module
system for better containment and control of the airborne particu-
late.
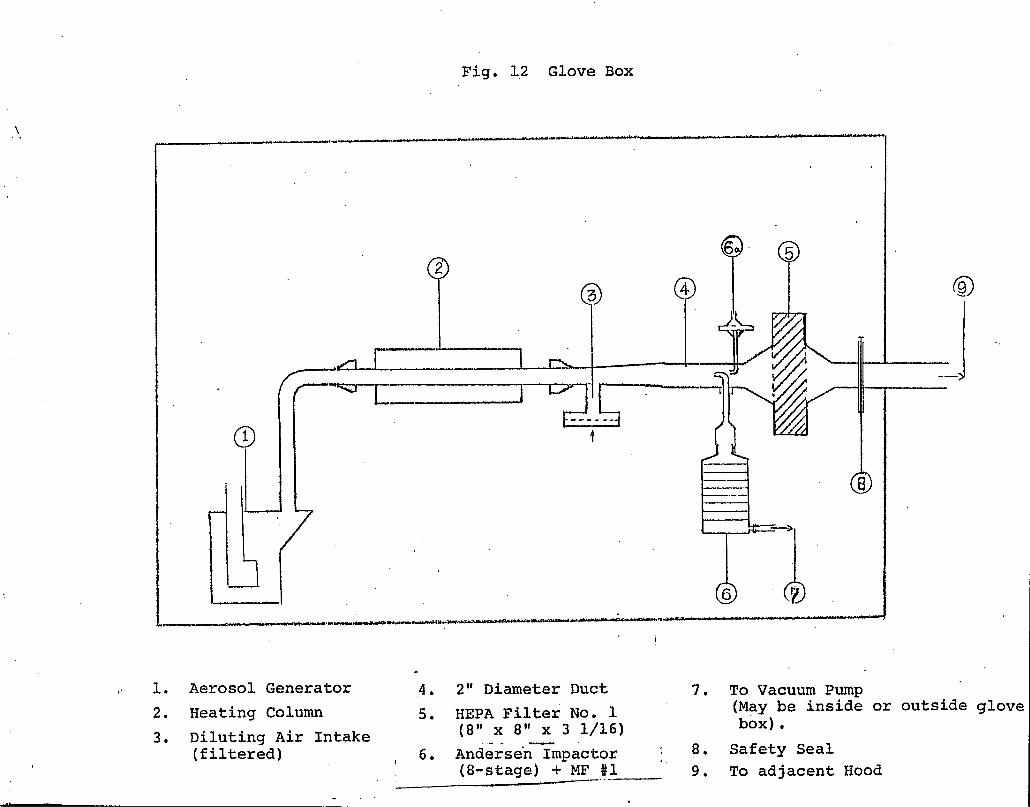
The first glove box module (Figure 12) will contain the
aerosol generator, heating columns, diluting air supply, upstream
sapler number 1, HEPA filter number 1 and a sealing device which
will allow the isolation of the glove box during HEPA filter
changes and loading and unloading of the air samples. An airlock
or passbox will be utilized to transfer the samples and change
filters in and out of the glove box.,
Module number 2 (Figure 13) will be made up of one or a
series of hoods which will house HEPA filters #2 and #3, samplers
#2 and #3, filter to be used as a sampler downstream of HEPA filter
#3 and the vacuum pump to be connected to the house exhaust system.
24

An orifice meter will be placed
monitoring air flow rate.
downstream of the last filter for
Andersen impactors will be used to sample upstream of the
first HEPA filter to verify the characteristics of the source
plutonium aerosol.. These samplers will also “be used downstream of
the first two HEPA filters. Millipore filter samples will also be
taken at each of those points, with an additional glass fiber
filter across the entire output downstream of the third HEPA
filter. Because such a small amount of aerosol is expected to
reach that point, it is desirable to collect it all to provide
better counting statistics. The Andersen impactor, which is
identical to the samplers used to collect the field data, will give
aerosol concentration as well as size information.
A new alpha counting system which will accommodate the
3-1/4” diameter samples obtained from the Andersen impactor, is
being constructed. This counter will utilize Sylvania Type 130
scintillator paper in intimate contact with the sample plates. In
this manner efficiency losses are minimized in that the alpha-
particles do not have to penetrate the mylar covering of the sample
or traverse any distance before interaction with the scintillator.
The counting system will be housed in a 30’ x 10’ trailer which
will be placed behind and adjacent to the OHL building.
Planning and design phase of the
is almost complete and assembly will begin
●
experimental test system
shortly.
25

n. WORK FOR NEXT QUARTER
. .
A. Activation of sampling locations 04 and 08 will
occur early in July. No additional sampling locations are planned
until analysis of data from present locations can be completed.
Location 08 will be abandoned after 2 - 4 weeks additional sampling
to provide a new more active location in the same building.
B. Alternate means of size analysis will be considered
to more adequately describe the small aerosol at Location 11 since
the Andersen impactor
aerosol.
c. Samples
does not appear to be adequate for this
taken simultaneously upstream and downstream
of Location 00 exhaust filters will be analyzed by spectroscopy to
define isotopic mixture.
D. Approximately one additional week of sampling with
twin impactors is planned to fully evaluate the particle rebound
problem.
E. Analysis of size and activity concentration data in
terms of mean values and
Results will be reviewed
locations.
F. Concurrent
confidence limits will be completed.
for need to continue sampling at individual.
upstream and downstream sampling data from
Location 00 operations will be analyzed to provide an estimate of
in-place filter efficiency against plutonium.
26

G. Size and space’requirements for the laboratory
experimental program will be finalized and arrangements
installation.
made for
H. A final decision will be made as to the choice of
aerosol generator and associated equipment, and assembly of the
multiple HEPA filter test system will be completed. Aerosol
generation procedures to check particle size characteristics will
be conducted. HEPA filters to be used will be quality control
tested at LASL.
27
. —.—-
v. REFERENCES
1.
2.
3.
4.
5.
6.
7.
8.
9.
10.
Andersen, A. A., A Sampler For Respiratory
Assessment, AIHA Journal, Vol. 27, March -
Health Hazard
April, 1966.
Anderson, sE. C., LASL Group H-4, private communication.
Flesch, J. P., Norris, C. H., Nugent, A. E., Jr,,
Calibrating Particulate Air Samplers With Monodisperse
Aerosols: Application to The Andersen Cascade Impactor,
AIHA Journal, November - December, 1967.
May, K. R., Calibration of a Modified Andersen Bacterial
Aerosol Sampler, Applied Microbiology, Vol. 12, January,
1964.
Mercer, T. T., On The Calibration of Cascade Ixnpactors,
Annals of Occupational Hygiene, Vol. 6, 1963.
Parker, G. W. , and Buchholz, H. , Size Classification of
Submicron Particles By A Low–Pressure Cascade Impactor,
ORNL - 4226, uC-80 Reactor Technology, June, 1968.
Whipple, G. C., “The Element of Chance In Sanitation”,
Journal of The Franklin Institute, Vol. 182, 1916.
Hu, J. N. H., An Improved Impactor For Aerosol Studies--
Modified Andersen Sampler, Environmental Sciences and
Technology, in press.
.
Knuth, R., Health Protection Engineering Division USAEC,
NYOO . Private Communication. May, 1972.
Davies, C. N., The Entry of Aerosols Into Sampling Tubes
and Heads, British Journal of Applied Physics (J. Phys. D),
Series 2, Vol. 1, 1968.

11.
12.
13.
14.
15.
16.
17.
18.
Strom, L., Transmission Efficiency of Aerosol Sampling
Lines, Atmospheric Environment, Vol. 6, 1972.
Sokal, R. R., and Rohlf, F. J., Biometry, W. H. Freeman
and Company, 1969.
.Ettinger, H. J., and Posner, S., Evaluation of Particle
Sizing and Aerosol Sizing Techniques, AIIIA Journal, Vol.
26, January - February, 1965.
Hiebert, R. D., Pollat, L. L. and Stafford, R. G.,
Improved Light-Scattering Photometer for Air Filtration
System Studies. LA-4627 - MS, 1971..-
Mishima, J., Plutonium Release Studies. BNWL 357,
Battelle Pacific Northwest Lab., Richland, Washington,
(Nov. 1966).
Kanapilly, G. M., Raabe, 0. G., and Newton, G. J., A New .
Method For The Generation of Aerosols of Insoluble
Particles, Aerosol Sci. Vol. 1, 1970.
Manufacturer’s Bulletin, Re Tec Development Laboratory,
Portland, Oregon..
Boydr H. A., Production of Plutonium Dioxide Aerosols
LF-44, Lovelace Foundation Fission Products Inhalation
Lab. , Albuquerque, New Mexico, (Nov. 1971) .
4

VI. ACKNOWLEDGMENT
The cooperation, guidance, and assistance of the following
people in establishing the program is,gratefully acknowledged:
N. D. Kittinger, Dow Chemical, Rocky Flats Plant
E. A. Putzier, Dow Chemical, Rocky Flats Plant ~
D. G. Carfagno, Monsanto Research, Mound Laboratories
W. H. Westendorf, Monsanto Research, Mound Laboratories
J. F. Bresson, AEC, Albuquerque Operations Office
W. L. Workman, H-1, LASL
W. D. McNeese, CMB-11, LASL
..I!E%.a
TABLE 1
ANDERSENIMPACTORCALIBRATION
AerodynamicEffectiveCutoffDiameters(Microns)SampleFlow 1.0 cfm . .
2000 Inc
o ll.a
1 7.
2 4.7
3 3.3
4“ 2.1
5 1.1
6 .65
7 .43a
a ~ Added Stageb = ModifiedStageIN = LighCMicroscopyEM = Electron.Microscopy
Flesch,et al(3) e’Methylene Methylene PolystyreneBlue L?? Blue EM Latex
6.2
3.6
2.0
5.35
2.95
1.53 1.75
0.86 .92
.54”
,
S.sb .
3.5
2.0 -
1.1

o0somG
In1-%
0.Nw-l
l-l
18
a“IiIia“0!-l
0l-lm
.00
00
Olfx
mJN
-Gm
..
.
40$-lP4
co
mml
m
-dw-l
$v+l-lcoo
l-l1+
—

TABLE 3
ACTIVITYCONCENTRATIONSOF Pu AEROSOLS
Description Location* obs
Weekdays 00 65
Weekends 00 15
Weekdays 11 19
Weekdays 14 26
Al (directMF)
Mean Max MiIl
11,388 34,590 286
988 4,579 51
(dpm/m3)
As (Impactor+Ml?2)
Mean
9980
1505
8.10x10⁶ 16.5x10⁶ 3.87x10⁶’ 6.72x10⁶
1.27x10⁵ 7.86x10⁵ 1,814 0.98x105
Max
36,325
4,798
15.2X3-O6
6.79x10⁵
Min
198
44
4.06x10⁵
2,611
$t~alyzed data from sapling Locations04 aid 08 not available
—

SIZE
Description
Weekdays,no coating
Weekends,no coating
All Samples,DM-800coating
All Samples,AA coating
Weekdays,no coating
Weekdays,AA coating
Weekdays,AA coating
* 60% smallerthan 0.43pm;
TABLE 4
ANDERSENIMPACTOR
CHARACTERISTICSOF PU AEROSOL
aamd(~m}#
Location obS mean max min—— . .
00 63 1.70 3.30 .52
00 12 1.92 3.32 1.03
00 5 2.10 2.50 1.25
00 10 1.86 2.70 .92
14 6 2.83 3.53 1.96
14 11 2.37 3.25 1.61
11 14 *
mean max min— . .
2.33 4.94 1.53
2.37 3.20 2.03
2.09 2.61 1.74
2.38 3.37 1.83
3.03 6.40 1.98
2.98 6.6 2.06
not amenableto analysisusingAndersenimpactor.
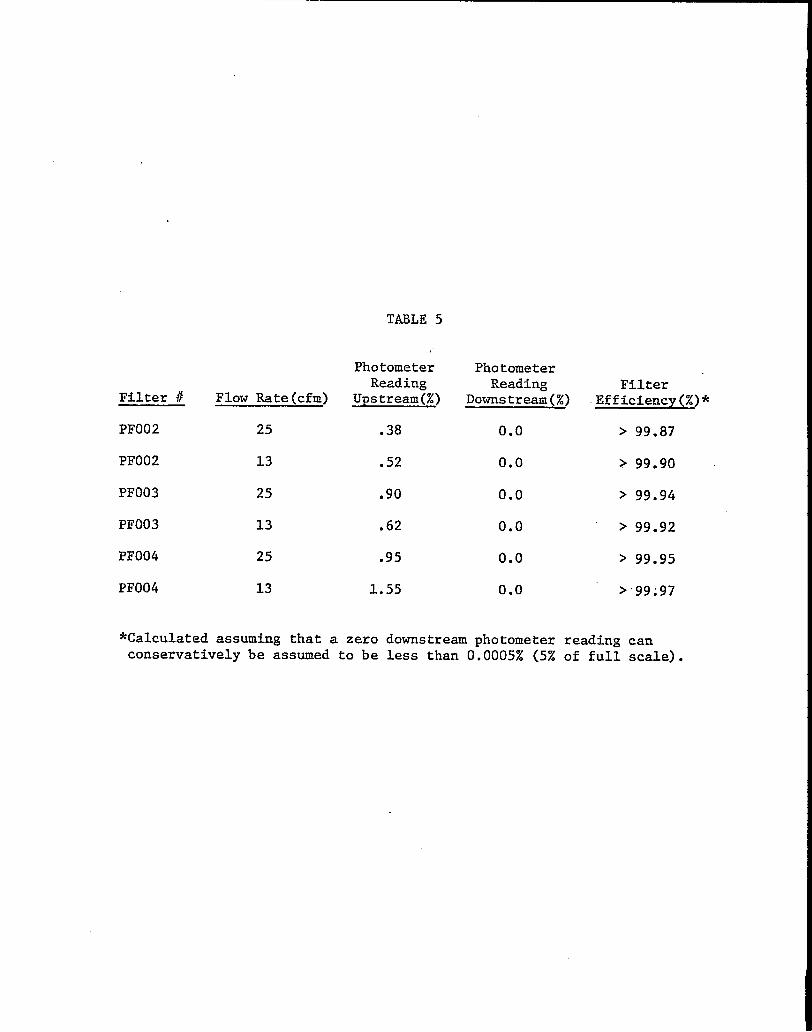
TABLE5
Filter#
PFO02
PFO02
PFO03
PFO03
PFO04
PFO04
Flow Rate(cfm)
25
13
25
13
25
13
*Calculatedassumingthat a
,.
PhotometerReading
Upstream(%)
.38
.52
.90
.62
.95
1.55
PhotometerReading Filter
Downstream(%) Efficiency(%)*
0.0 > 99.87
0.0 > 99.90
0.0 > 99.94
0.0 > 99.92
0.O > 99.95
0.0 >’99;97
zerodownstreamphotometerreadingcanconservativelybe assumedto be less than 0;0005%(5% of fuli scale).

—c
oa
4-I
EY-i
w
I---=7‘“’’v’f’[Q
’”-!
cowl
I..l-i
C&
sH
..
.m03
r-..
.Lw
m-N
“.*
,.
=0mr-...
nHI
II
.
.mr-l
d“d1-
—
9—
8_
7_
S_
5_
4_
3_
2_
d9_
8_
?_
6—
s_
4_
3—
L
d
9_
FL
7_
6_
S&
4_
3_
L
Nf_
WEEK 2 I 71:’’’”WEEK 4 II I 1
Figure 2: Activity Concentrations Incident On Exhaust
Filters at Location 00. (Shaded bar = direct
M? sampler; Unshaded bar = Impactor + Backup Ml?).
Id
4_
3_
(-’2_
U2A9_
8_
7_
6—
S_
4—
3__
L
Lff9_
8_
7-.
6_
S_
. 4–
3_
3-
E....j-=y=~:.~~=::=-,.==.-—.;,–...:.7= =*T-.~* –x. .--— — _
~ .*~:y&5-~ ~—=== — v
- —= -. . —,—,— —!=!= ---- +-, —-. ... L— --
. . . .. --—_ -= =.--=. _— .—
-. ._
, .— ..=---- _-
-— .-. —.-—. — —
: . ——-= —--
-—-—. _
:—~_
L_. u. -= .=
EEEEEEE
WEEK 9 I
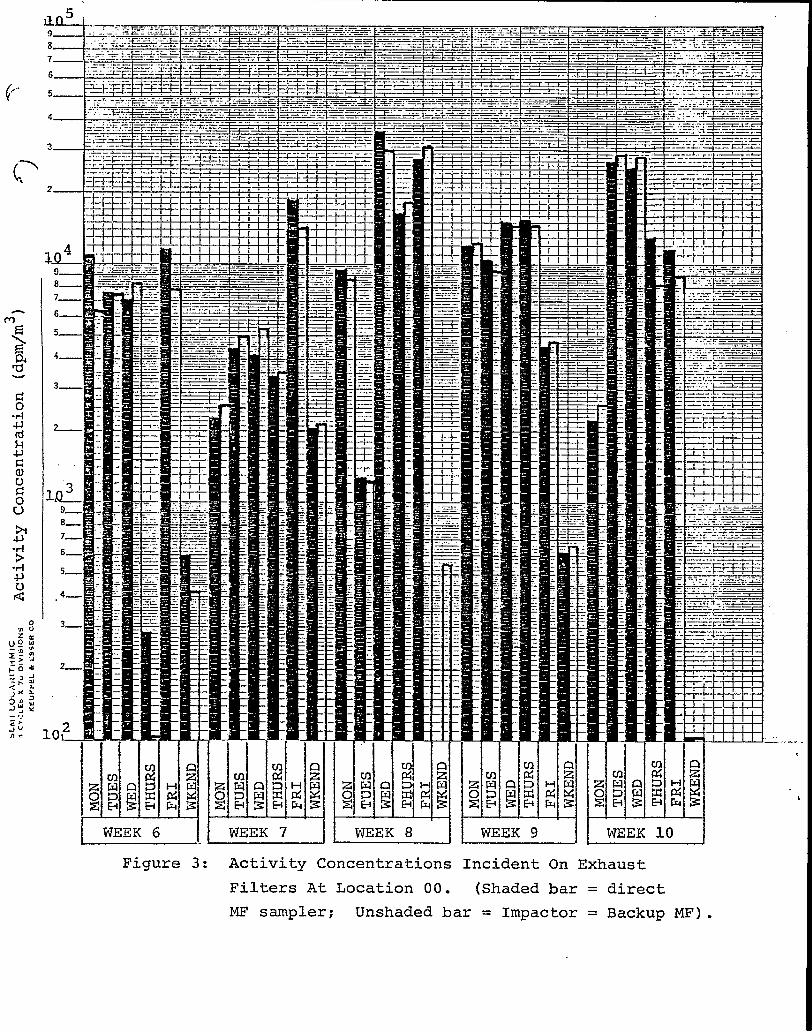
Figure 3: Activity Concentrations Incident On Exhaust
.,--,
L
Filters At Location 00. (Shaded bar = direct
MF sampler; Unshaded bar = Impactor = Backup MF) .

,105
I
1“
I WEEK 11 H WEEK 12 I WEEK 13 EYx__l i ‘EEK 15 IFigure 4: Activity Concentrations Incident On Exhaust
Filters At Location 00. (Shaded bar = direct
MF sampler; Unshaded bar = Impactor + Backup M,F).
.—.
,,.

1.a 8’ I
.
.
.
‘t
w3mKf5 HWEEK7 [
Figure 5: Activity Concentration Incident On Exhaust
Filters at Location 11. (Shaded bar = direct
NIP sampler; Unshaded = Impactor + Backup MF).

I
,.
‘J.-A f5r
i
r
;—
;—
j
1—
3
,,
?—
d!9_
8_
?_
6_
5_
4_
3_
L
M)
J—JJJJ+w—————l[
Figure
WEEK 3 d I WEEK 5 1~WEEK1 II WEEK2 \
6: Activity Concentration Incident On Exhaust
Filters At Location 14. (Shaded bar = direct
MF sampler; Unshaded = Impactor + Backup M.F).
—

----- ——....... . ...-=. - .— .— -—. —.= —.— -— ---- ~J-–.-
2
1
(1
—---10-!
.GI .1 .2 1 2 3 lG 20 so 43 33 $9 ?0 80 90 95 9a 93 39.9 93.99
CIMJLATiVE PERCENT LESS THAN S~ATEO !3iA!KTER
7: Size Characteristics of Pu Aerosol--
Representative of Mean azundand a .9
... ..-. . . . . . . ..-..—.——--- .——— - -—— ..—-.— -— —--.. I
I. .
..
...—.. . . .
.. —-—
z
aU
2
1
0
-1
LESS WAN STATED f)lAWEtER
Size Characteristics of Pu Aerosol--
Representative of Distribution With High ‘9“
. —.—.—..— — ..- .—-—..— ~ -—-. .— A
. .—.— ..———. .—
lZ
la
!0
2
x
a
z
iG-1
PIJ PARTICLE SIZING BY IMPACTOR AT LOCATION 00 05/05/72 COATING NONE
1 I 1 i I I I
I 1 I II
I
i
I
● / ‘A-
I =1 II J,~
!I
, I
‘T” ‘,—-- b\I
~ “4
.01 .1 .2 5 :0 20 30 SG
I I I I I I 1 II I I
I I I I
I
. .
....
I “ - */
( Y[ [ 4 i
I I /1 1
I I/l. ●
/ !.-
/
. .
1I I
II
I
EG 76 86 9a 9s 90 9* 9s.9 SS.9*
(xJMuLATIVE PERCENT LESS THAN STATED, DIANE?ER.. . _ . .__. ._
Figure 9: Size Characteristics of Pu Aerosol--
--- ._—— .,
Representative of Distribution With Low 0 .9 --1.——_-._.._._ .........-------
. .
..
..
.
.--. .—
,. FL. : --- . . .*.,., ,. .*:,. ..-
. ...>
... - . .
. . . . .
,,, . . . . ,.. ,
---- .—.
-..-.
.. . . . .. ..- :
a:
-.=
2A?TiCL~ slz~~~ ~V ;$fpACTo~ AT LCCATIC~ 00 05/18/’7~ cGATING NGNE
z
. ..4 ,
.,
1
.(
u-
1,(
:: [ Ii 1 I I I
I i I I Ii i ,1 I t j/ i“
/I
,
,/:..
.-‘f .‘.- ,,. ,, ... -
1’
1 i
1
.s1 .1 .2 12 5 ICI 2U Jo 40 50 60 70 85 90 95 3a 9999.9 99.95
—. —- -------
Figure
CWWLA~IVE PERCENT LESS,.T~AN STATEO OIA!+TER
10: Size Characteristicsof Pu Aerosol-- I
Representative of Composite Distribution._._J -..-.
e +—
.-
C m,—
.,,...
...
...
.
@---
c r=—
-u$-1al
..+ss(c co
\i.
\
-@
..
...
.“.“.
I
‘...
..
..
.,..
<
~~
~,&
—-.p
J.-.
,...
...
...-
,...,.
‘d‘A
.’”“=
it=*
‘
.$4a)l-l8V
I
—..-’
. “.’G-l
m“
.,-
,..,
.,
““”d.,N
[,.
-..,.
+“;””.
..
klm.
em”
1
c cm
)-----7
)
.
.5’1%
ni
f---i!
Mo
..
1-
m“.m
.—..
.I
●✎
✎
I-ltNc-n
1
.-
..

—
ii1
I\
-Pm
..
2!
“E!
+“
a*
--..-..,.
..,-.,.
.
--..
...
....-
.-+“”
m-.
*...
...
...
..
..
..
..
.
..
.01-l
oim”
I-il-1
1-it-i
WI
Q o
..-
.
Top Related