


Languages
Pages
Legal


PDMSSStudent Achievement Data
2008 & PDMSS Goals
Objectives
Share longitudinal CST achievement data
Review and reflect on school data
Review PDMSS Goals and Implementation of Programs
Q & A

Four kinds of data charts
Big Picture (combined grade levels)
Drilling Down (grade level charts)
Band Charts
Cohort Study
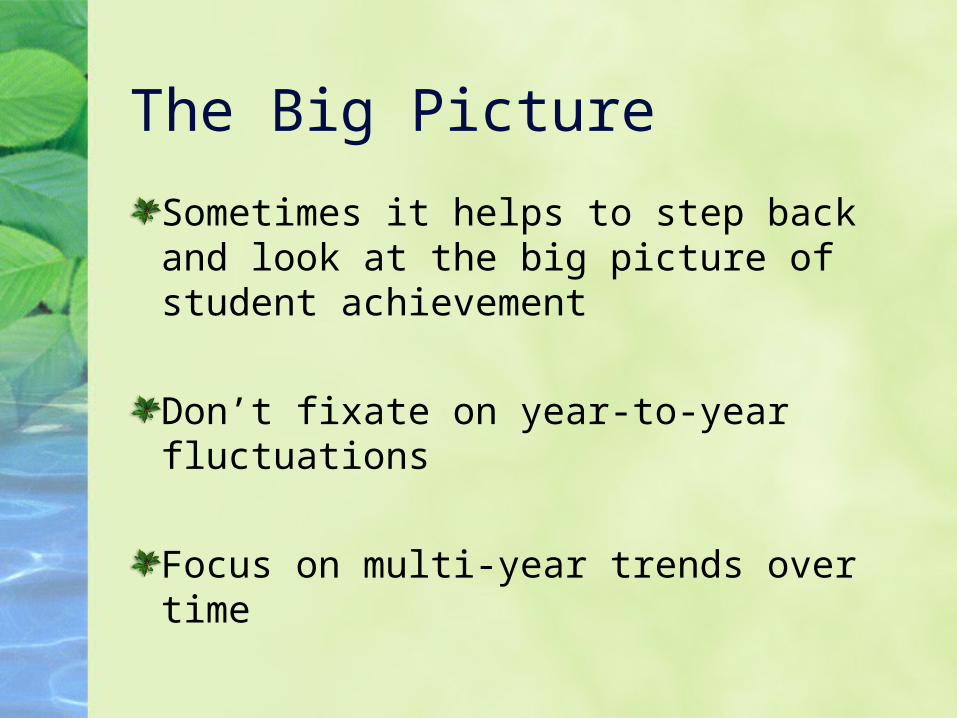
The Big Picture
Sometimes it helps to step back and look at the big picture of student achievement
Don’t fixate on year-to-year fluctuations
Focus on multi-year trends over time

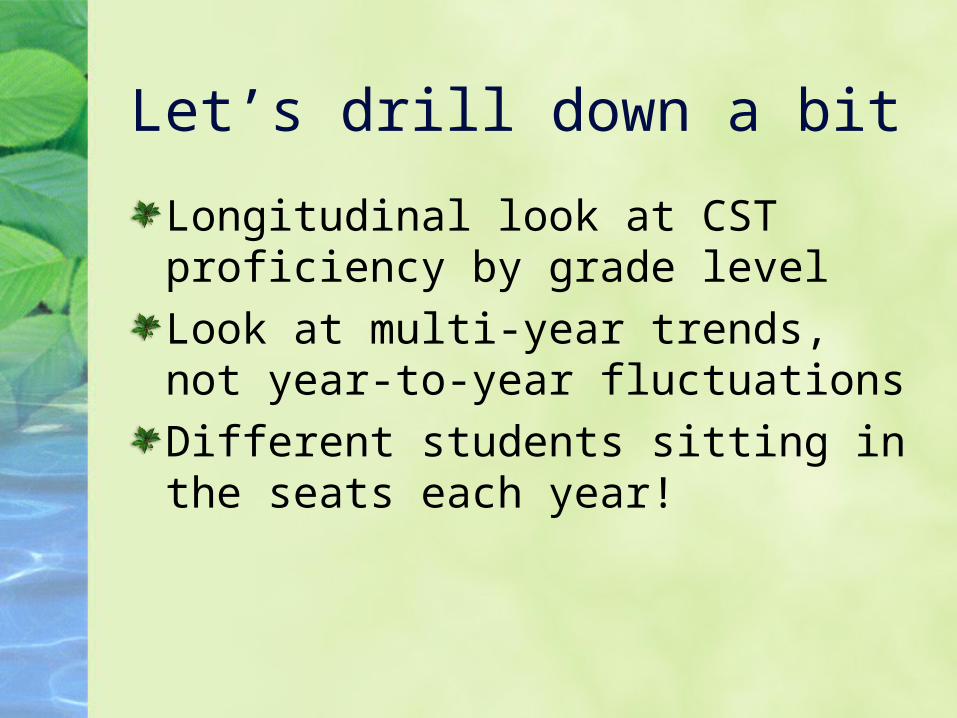
Let’s drill down a bit
Longitudinal look at CST proficiency by grade level
Look at multi-year trends, not year-to-year fluctuations
Different students sitting in the seats each year!


A different lens of analysisLooks at the same group of students over timeSample only includes students with CST over longitudinal study (matched scores)Allows us to look at how well students are improving on their own achievement over time.
Cohort Charts


Looking at performance bands
Sometimes we want to drill down and unpack a bit further in terms of student proficiency.The previous slides have combined students who are “Proficient or Advanced”When you have fewer years of data, or when students are already performing quite well, you may want to look at each of the five ranges of performance: Far Below, Below, Basic, Proficient and Advanced.


More on performance bands
Another great use of the bands is when looking at the CST Writing Rubric Scores. They range from 2 - 8.For the past 2 years there is only one reader and the score is simply doubled (only even number scores are possible)Target is 6 (Rubric Score of 3 out of 4 - then doubled)Most challenging assessment. Across the state, students who score Proficient in ELA typically receive a score of 2!


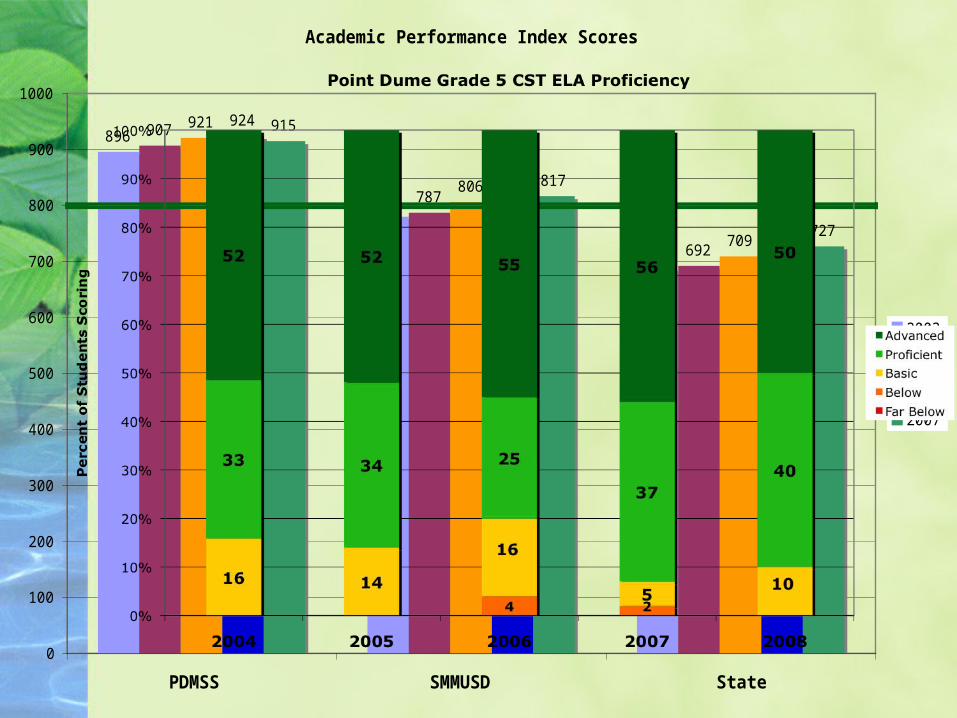
Academic Performance Index Scores
896
780
683
907
787
692
921
806
709
924
817
721
915
817
727
0
100
200
300
400
500
600
700
800
900
1000
PDMSS SMMUSD State
2003
2004
2005
2006
2007

Academic Performance Index Scores
896
780
683
907
787
692
921
806
709
924
817
721
915
817
727
0
100
200
300
400
500
600
700
800
900
1000
PDMSS SMMUSD State
2003
2004
2005
2006
2007

Academic Performance Index Scores
896
780
683
907
787
692
921
806
709
924
817
721
915
817
727
0
100
200
300
400
500
600
700
800
900
1000
PDMSS SMMUSD State
2003
2004
2005
2006
2007

Academic Performance Index Scores
896
780
683
907
787
692
921
806
709
924
817
721
915
817
727
0
100
200
300
400
500
600
700
800
900
1000
PDMSS SMMUSD State
2003
2004
2005
2006
2007

Academic Performance Index Scores
896
780
683
907
787
692
921
806
709
924
817
721
915
817
727
0
100
200
300
400
500
600
700
800
900
1000
PDMSS SMMUSD State
2003
2004
2005
2006
2007

Academic Performance Index Scores
896
780
683
907
787
692
921
806
709
924
817
721
915
817
727
0
100
200
300
400
500
600
700
800
900
1000
PDMSS SMMUSD State
2003
2004
2005
2006
2007
Academic Performance Index Scores
896
780
683
907
787
692
921
806
709
924
817
721
915
817
727
0
100
200
300
400
500
600
700
800
900
1000
PDMSS SMMUSD State
2003
2004
2005
2006
2007

Academic Performance Index Scores
896
780
683
907
787
692
921
806
709
924
817
721
915
817
727
0
100
200
300
400
500
600
700
800
900
1000
PDMSS SMMUSD State
2003
2004
2005
2006
2007
PDMSS School Goals:
•Increase all proficiency levels of all students who are at far below basic, below basic and basic students to increase one level by year’s end.
•Provide Professional Development for Teachers to increase skill building and strategy work in students
•Provide Reading Teacher Support for Grades 1-5 for students who are within these bands as well as using fluency data (conducted in September)
•Provide Support Materials for all classrooms that support improving reading school wide

Academic Performance Index Scores
896
780
683
907
787
692
921
806
709
924
817
721
915
817
727
0
100
200
300
400
500
600
700
800
900
1000
PDMSS SMMUSD State
2003
2004
2005
2006
2007
What has PDMSS done so far to reach goals?
•Assessed all students for fluency grades 2-5
•Assessed all students grade 2 and identified 3, 4, & 5 grade students with LRPAK for specific reading level and skill identification
•Created Reading Book Club for upper grades (4&5)
•Provided training for teachers Phonics and Word Work Mini Lessons by Dr. Cindy Kratzer, Literacy Coach; Accelerated Reader
•All Teachers teach On-Ramp Strategies for Reading Comprehension

Academic Performance Index Scores
896
780
683
907
787
692
921
806
709
924
817
721
915
817
727
0
100
200
300
400
500
600
700
800
900
1000
PDMSS SMMUSD State
2003
2004
2005
2006
2007
What has PDMSS done so far to reach goals?
•Hired Vonnie Van Note, Diane Farlow, Susan Cooley and Angela Whitman using PTA, SMMUSD, and School Improvement Funds to provide intervention support
•Purchased supplemental materials: Accelerated Reader, Plaid Phonics, Read Naturally One Minute Readers, Phonics from A to Z, Reading Comprehension Strategies
• Conducted Student Success Team (SST) meetings in October to work with School Team and Family and provide support for home intervention strategies and materials

Q & A
Top Related