


Languages
Pages
Legal


Our Invisible Print
Three DudezSanjay Gajiwala 0269206 Jesus Garcia 0244495 Juan Alvaraz 0270339
Table of Contents
• 3-4 about us• 5-8 Carbone foot print• 9- measures taken to prevent• 10- video of what to look forward to in the future
is no action is taken. • 11 Foot prints of the world • 12-13 Do this • 14-Conclusion • 15- work citation

All About Us
• Sanjay Gajiwala- Household: 7, Home: 2,000 SqFt. Vehicle: Jaguar X-Type, MPG- 18, Annual- 6,000 miles
• Jesus Garcia- Household: 8, Home: 2,2000 SqFt., Vehicle: Nissan Frontier-xe, MPG- 15, Annual- 13,000.
• Juan Alavarez- Household: 4, Home: 2,600 SqFt. Vehicle- VW Rabbit, MPG- 30, Annual- 10,000.

Our Impact
• Sanjay’s footprint- Household uses 12,000KWh. Appliances are all Energy Star, however much of the energy is used through the Winter and Summer with heating and air-conditioning.
• Jesus’s footprint- Household uses 14,00KWh. Appliances are energy star. Heating is used through the winter and air-conditioning in the summer. Drives the most out of the three dudes.
• Juan’s food print -10,000 kwh. Appliances are also energy star. Has the largest house but uses the least KWS out of the three dudes.

Jesus’s carbon print
.
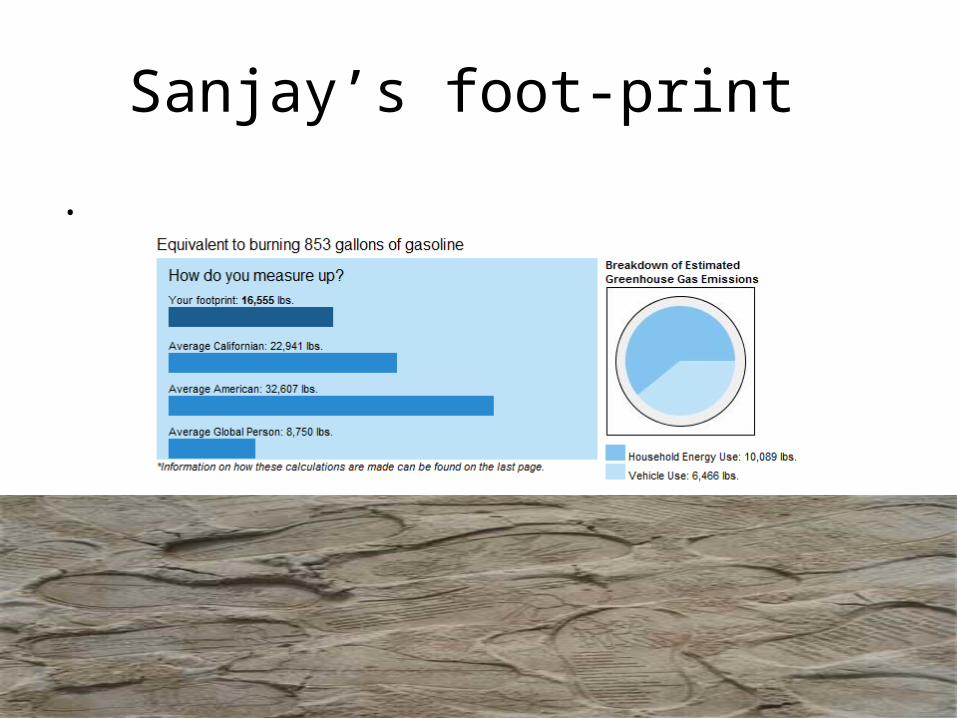
Sanjay’s foot-print
.
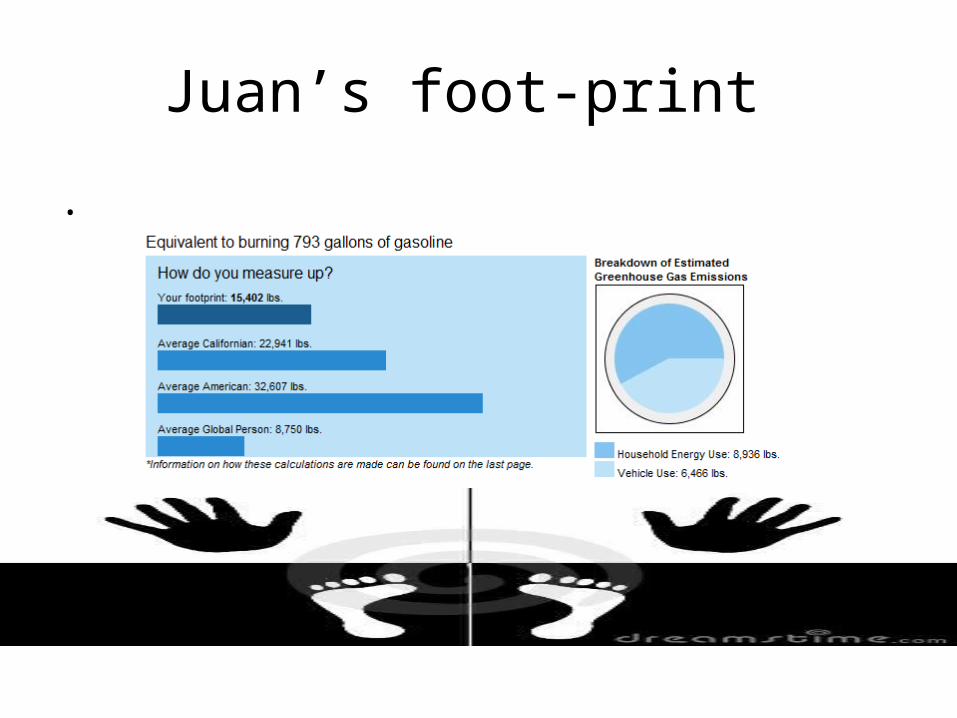
Juan’s foot-print
.
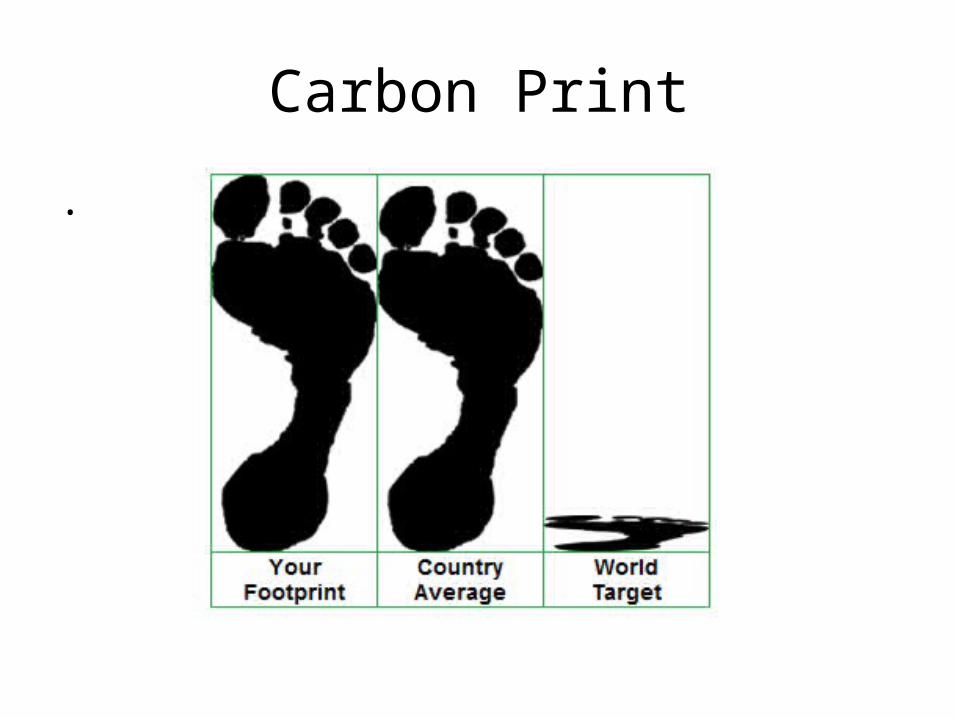
Carbon Print
.

Step without carbon
• Spare the Air Day- During these summer months when ground-level ozone, or "smog," becomes a pollution problem, the Air District issues Spare the Air Health Alerts on days when air quality is forecast to be unhealthy. On these days, people who are sensitive to unhealthy air are advised to limit their time outdoors, particularly in the afternoon hours.

Print of the WorldWorld 6,920,500,000 May 25, 2011 100% US Census Bureau's World Population Clock
1 People's Republic of Chinan2
1,339,724,852 November 1, 2010 19.36% 2010 China Census
2 India 1,210,193,422 March 1, 2011 17.49% Provisional 2011 Indian Census result
3 United States 311,417,000 May 25, 2011 4.5% Official United States Population Clock
4 Indonesia 237,556,363 May 2010 3.43% 2010 Indonesian Census
5 Brazil 190,732,694 August 1, 2010 2.76% 2010 Official Brazilian Census results
6 Pakistan 176,139,000 May 25, 2011 2.55% Official Pakistani Population clock
7 Nigeria 158,423,000 2010 2.29% UN estimate for 2010
8 Bangladesh 150,614,000 May 25, 2011 2.18% Official Bangladeshi Population Clock
9 Russia 142,905,200 January 1, 2011 2.06% 2010 Russian Census
10 Japan 127,960,000 March 1, 2011 1.84% Official Japan Statistics Bureau

Top 10 Polluters of Carbon
World 29,321,302 100%1 China[10] 6,534,367.00(2011) 22.30%2 United States 5,833,381.00(2011) 19.91%- European Union (27) 4,177,817.86[11] 14.04%3 Russia 1,729,357.00(2011) 5.50%4 India 1,495,362.00(2011) 5.24%5 Japan 1,214,543.00(2011) 4.28%6 Germany 829,936.000(2011) 2.69%7 Canada 574,340.00(2011) 1.90%8 United Kingdom 572,617.00(2011) 1.84%9 South Korea 542,321.00(2008) 1.72%10 Iran 511,987.00(2008) 1.69%
.

Do This.. NOT This
• Instead of “racing” your buddy to and from somewhere, car-pool with this individual.
• Sharing resources is a team-effort. Rather then filling up your child’s kiddie pool, WALK them to the community pool.
• Ride the bus or your bike to school/work. • Don’t leave electrical appliance plugged in, put the
extra effort to unplug your cell phone charger when done using it.
• $W@G3R!!

This ! Not • This !
This !!!!

Conclusion
• Yes this planet is big, but at the rate that we as humans are demanding natural resources, this planet will not be able to keep providing.
• “For the one planet earth that we live on , we consume 1.3 planet earth.”
- B. Riddell

Work Citation
• http://www.who.int/heli/risks/urban/en/uapmap.pdf
• http://by159w.bay159.mail.live.com/default.aspx?wa=wsignin1.0
• http://coolclimate.berkeley.edu/uscalc
Top Related