


Languages
Pages
Legal

New England Space Science Meeting 2:
Transition from the Open to Closed Corona
Nathan Schwadron
Jan 4, 2005

Ideas
• Where are the transitions
• Do we see them with TRACE?
• Source Surface Models .. Which field lines hae opened during CMEs
• What is the connection between a region with open field and a region that appears dark in a particular band?

Welcome
• Purpose: – To facilitate interaction among colleagues in space
science in the New England Area (UNH, CfA, BU, MIT, Hanscom/AFRL, Haystack, Dartmouth)
– To leverage these interactions for initiating new, cross-disciplinary and far-reaching projects
• Meetings:– Monthly meetings (first wed each month)– Workshop?

Relationship of open and closed field topologies
• Potential field models (static)• Role of time-dependency (continuous
transitions from open to closed states?)• Conservation of open magnetic flux
– Is open flux conserved, or just preserved
• Highly sectored open fields vs structured closed fields – Open field reflects dipole term– Closed fields on much smaller scales

Relationship of solar wind and coronal heating
• Open field regions free to form steady (supersonic) flows
• Closed field regions injected energy largely lost through radiation
• Is a transition between these regimes expected?

Paths for Deposited Coronal Energy
Injected Electromagnetic
Energy
DownwardConducted Heat,
Radiation,Siphon flows
Bound
, clos
ed
struc
ture
s
Slow wind Fast wind
Open
field
Tra
nsiti
on??
Hot & Bright Cool & DarkIntermediate?Fluctuating?
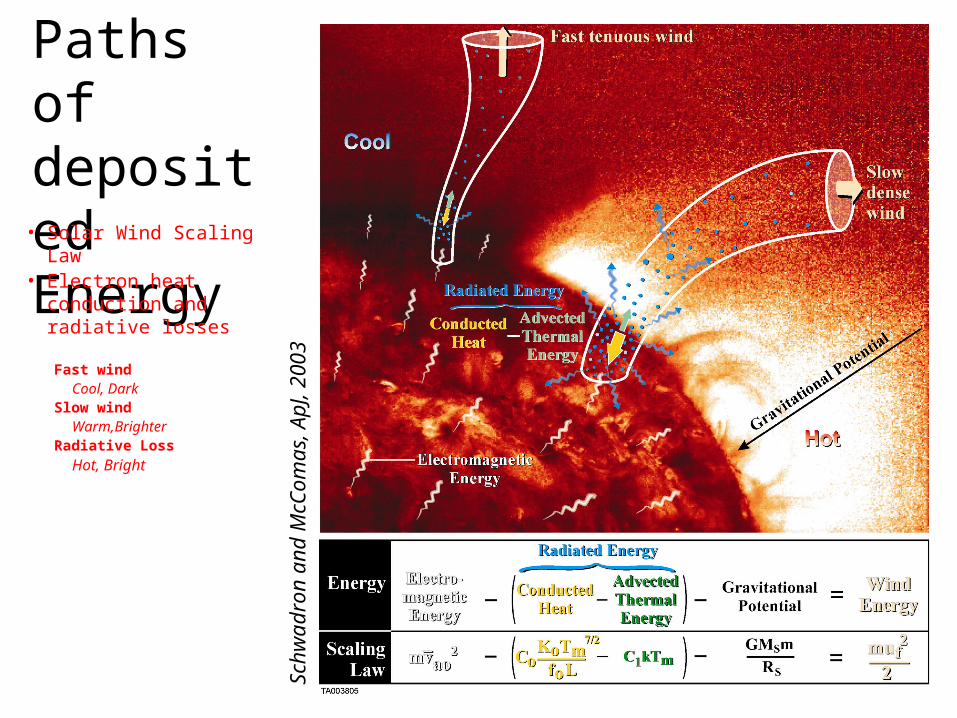
Paths of deposited Energy
Schw
adro
n an
d M
cCom
as, A
pJ, 2
003
• Solar Wind Scaling Law• Electron heat
conduction and radiative losses
Fast windCool, Dark
Slow windWarm,Brighter
Radiative LossHot, Bright

von Steiger et al., JGR, 2000
Background
Well known anti-correlation between solar wind speed and freezing-in temperature, low FIP elements (Geiss et al, Science, 1995; von Steiger et al., JGR, 2000, Gloeckler, et al. 2003)

Constant Energy/particle Source
Schw
adro
n an
d M
cCom
as, A
pJ, 2
003

Flux-Flux Scaling
Constant injected energy/particle implies injected power proportional to particle flux and magnetic flux:
Injected Power proportional to magnetic flux
Injected Elec.Mag. Energy/Particle (assumed constant)
c
4dS 0
E
B Ý N
f 0 d
S 0
B 0 d
S 0

From Solar Wind to X-rays
• Solar wind power
• Yohkoh (2.8-36.6 Å)
Lx~ 1-2% Pcorona ~ 500 0 ??
Psw mu fast
2
2
GM sm
Rs
f1
B1r
0
50,0000 (cgs units)
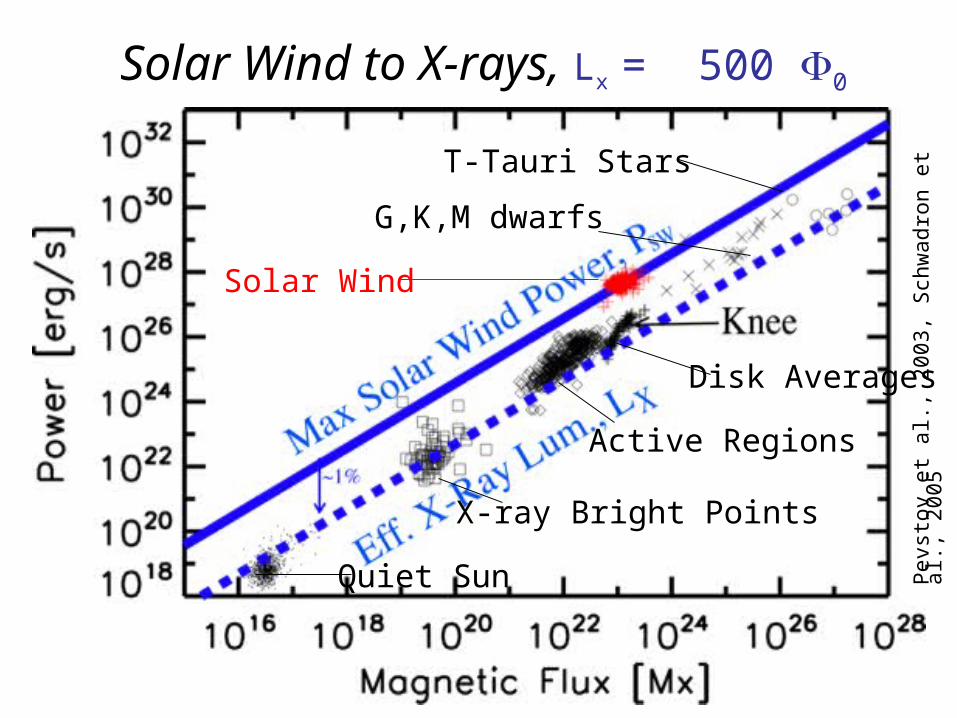
Solar Wind to X-rays, Lx = 500 0
Pev
stov
et a
l., 2
003,
Sch
wad
ron
et a
l., 2
005
Quiet Sun
X-ray Bright Points
Active Regions
Disk Averages
G,K,M dwarfs
T-Tauri Stars
Solar Wind

X-rays over the
Solar Cycle
Sch
wad
ron
et a
l., 2
005
Power proportional To MagneticFlux

X-rays over the solar cycle
• Solar Wind Power
• GOES (1-8 Å) Active Regions: Lx~ 2.5x10⁻⁴ Pcorona
Quiet Regions: Lx~ 5x10⁻⁵ Pcorona
Coronal Holes: Lx~9x10⁻¹⁰ Pcorona
Psw 50,0000 (cgs units)

McC
omas
et a
l., G
RL
, 200
3
Solar wind’s high degree of organization by speed
Solar Minimum vs Solar Max
Top Related