


Languages
Pages
Legal


NAPEEF © 1
Welcome!
Perkins Measures: Using Data Dashboards for Access, Equity, and DiversityMay 8, 2013

NAPEEF © 2
Agenda
Why data dashboards? What are data dashboards?
How can we use data dashboards to “make
meaning” of our Perkins data…and what do we do
next?
What do you want to learn or do today?

NAPEEF © 3
Why Data Dashboards?
3
• 1990 NAPE founded; relationship with State Education Agency in all 50 states.
• 2002 NAPE Education Foundation launched to provide equity and diversity solutions for educators to help every student fulfill his or her potential through access to the entire career spectrum.
• 2007-2012 STEM Equity Pipeline Project in 12 states, conducted research-based training with over 2000 educators, and trained school-based teams in 300 schools. NAPEEF ©
NAPEEF ©
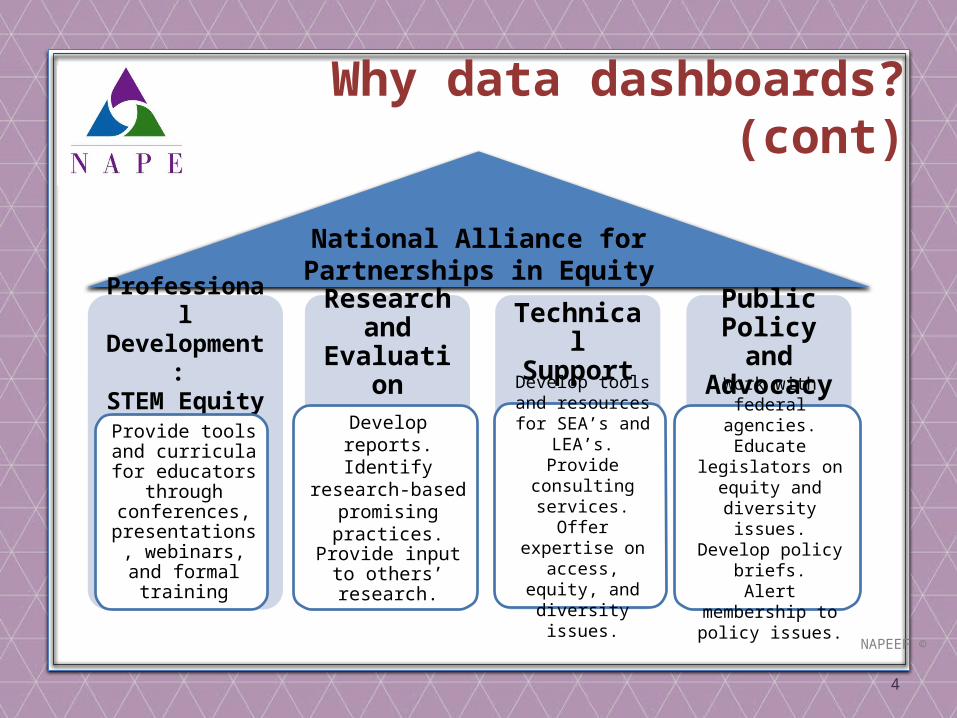
Why data dashboards? (cont)
4
National Alliance for Partnerships in Equity
ProfessionalDevelopment:
STEM Equity Pipeline
Provide tools and curricula for
educators through conferences,
presentations, webinars, and formal training
Research and Evaluation
Develop reports.Identify research-based promising
practices.Provide input to others’ research.
Technical Support
Develop tools and resources for SEA’s
and LEA’s.Provide consulting
services.Offer expertise on access, equity, and
diversity issues.
Public Policy and
Advocacy
Work with federal agencies.
Educate legislators on equity and diversity
issues.Develop policy briefs.Alert membership to
policy issues.

NAPEEF © 5
Why data dashboards? (cont)
Research on Gender in Science and Engineering

NAPEEF © 6
Why data dashboards? (cont)

7
Why data dashboards? (cont)
NAPEEF ©

NAPEEF © 8
What are your challenges to using Perkins data to drive change for access,
equity, and diversity?
NAPEEF © 9
What do you know about data dashboards?
NAPEEF © 10
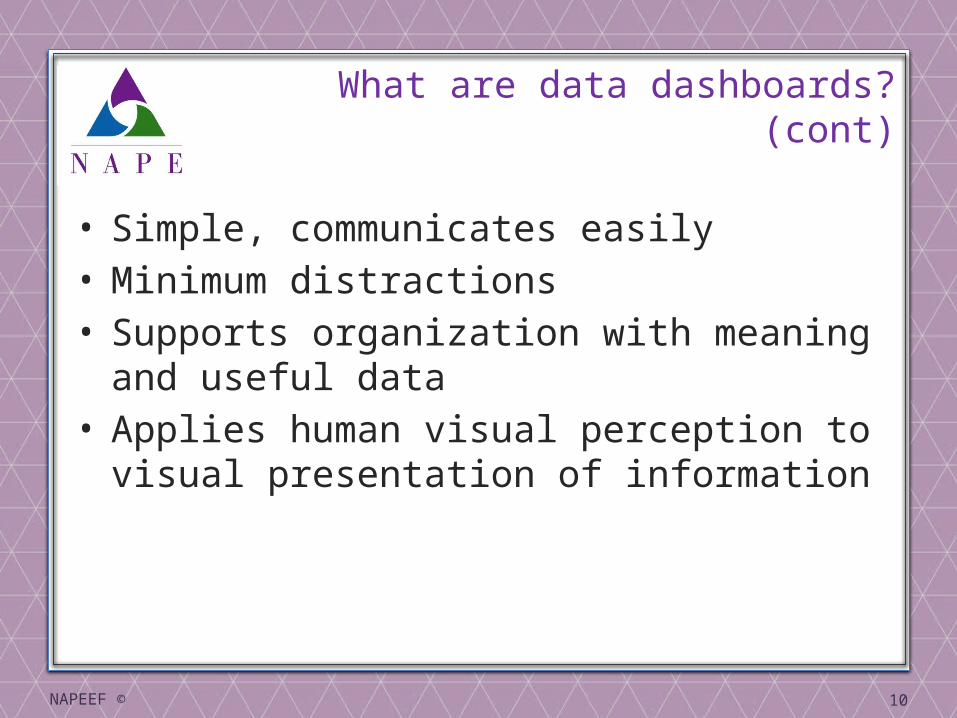
• Simple, communicates easily• Minimum distractions• Supports organization with meaning and useful
data• Applies human visual perception to visual
presentation of information
What are data dashboards? (cont)

NAPEEF © 11
What are some examples of data dashboards?

NAPEEF © 12
What are data dashboards? (cont)

NAPEEF © 13
What are data dashboards? (cont)

NAPEEF © 14
How can we use Dashboards for Equity?

NAPEEF © 15
Reflecting on today
• Did I meet your expectations?
• What questions do you have?
• How will you use this information?
Top Related