


Languages
Pages
Legal


Micro sized retailers’ usage of e-CRM A study about how far micro sized retailers have implemented e-CRM and exploration of what factors can describe their e-CRM adoption.
Author(s): Fredrik Fagerström Degree of Master in Science in Business and Economics Linda Sjögren Degree of Master in Science in Business and Economics
Tutor: Frederic Bill
Examiner: Professor Mosad Zineldin
Subject: Business in Administration and Marketing
Level and semester: Master thesis, Spring - 2012

Letter of gratitude
We would like to start with addressing our enormous gratitude to our tutor
Frederic Bill for invaluable discussion and tips contributing to our paper and all
of its areas and also topics not concerning our paper, but still thoughtful,
inspiring and motivating.
We would also like to address a big thanks to all participating companies of the
research and wish them a future of luck and good business, especially good luck
with their development of their e-‐CRM adoption on their web sites.
To all of our opponents, we would like to address a big gratitude for your
insightful analysis of and tips for the process of completing our research, thank
you.
A big thanks is also addressed to our examiner, Mosad Zineldin, for interesting
and motivating seminars.
Fredrik Fagerström Linda Sjögren
2012-‐05-‐25

Abstract Title: Micro sized retailers usage of e-‐CRM: A study about how far micro sized
retailers have implemented e-‐CRM and exploration of what factors can describe
the e-‐CRM adoption
Course code: 4FE03E
Authors: Fredrik Fagerström 880107
Linda Sjögren 880805
Research question: The research explores what factors can explain e-‐CRM
adoption of micro sized retailers through 6 hypotheses, derived from literature
review.
Purpose: The purpose of this study is to describe how far micro sized retailers
have implemented e-‐CRM and explore what factors can describe their e-‐CRM
adoption.
Methodology: The result of the study consists of the participation of 137 micro
sized retailers on the Swedish market. A quantitative questionnaire has been
developed out of theories and qualitative pilot-‐studies.
Conclusion: This research can conclude that micro sized retailers on the
Swedish market have, in average, implemented 5 e-‐CRM features per company.
This equals a 12% usage of the total e-‐CRM features explored for this research.
The one proved factor that can describe how retailers have adopted e-‐CRM is
their profitability rate. Companies with a profitability rate below market average
are more likely to have implemented more e-‐CRM features than companies with
higher profit rate than market average. The explanation to this might be that
companies with a low profit rate implement e-‐CRM as a tool to cure their low
profit rate, since e-‐CRM is supposed to bring benefits as lower costs and
increased sales with the purpose to increase their profit in the future.
Key words; e-‐CRM, growth orientation, micro sized companies, retailers

Table of Contents
1 Introduction ..................................................................................................................... 1 1.1 Background ........................................................................................................................... 1 1.2 Problem discussion ............................................................................................................. 2 1.3 Purpose ................................................................................................................................... 5 1.4 Hypotheses ............................................................................................................................ 5 1.5 Delimitations ........................................................................................................................ 6
2 Theory ................................................................................................................................ 7 2.1 Definition of the retail industry ...................................................................................... 7 2.2 Definition of Micro-‐ and Small enterprises ................................................................. 7 2.3 CRM ........................................................................................................................................... 7 2.3.1 CRM in SMEs ................................................................................................................................... 9
2.4 E-‐CRM .................................................................................................................................... 10 2.4.1 E-‐CRM in SMEs and micro sized enterprises ................................................................. 14
2.5 Growth intentions ............................................................................................................ 15 2.6 Deriving at hypothesis .................................................................................................... 16
3 Methodology ................................................................................................................. 20 3.1 Scientific approach ........................................................................................................... 20 3.2 Scientific procedure ......................................................................................................... 22 3.3 Gathering of data .............................................................................................................. 23 3.3.1 Triangulation ............................................................................................................................... 23 3.3.2 Population and sample ............................................................................................................ 24 3.3.3 Qualitative approach ................................................................................................................ 26 3.3.4 Quantitative approach ............................................................................................................. 26 3.3.5 Pilot study ..................................................................................................................................... 27 3.3.6 Operationalization ..................................................................................................................... 28
3.4 Interpretation of data ..................................................................................................... 34 3.5 Criteria of measurements .............................................................................................. 35
4 Empiric results ............................................................................................................. 37 4.1 E-‐CRM features usage ...................................................................................................... 37 4.2 Description of empirical material ............................................................................... 39 4.3 Results .................................................................................................................................. 46
5 Analysis .......................................................................................................................... 52 5.1 Overall analysis ................................................................................................................. 57
6 Conclusion ..................................................................................................................... 60 7 Further research and self-‐criticism ...................................................................... 61 References ......................................................................................................................... 63 Articles ........................................................................................................................................ 63 Books ........................................................................................................................................... 67 Internet sources ....................................................................................................................... 68
Appendix Appendix 1 E-‐CRM features description Appendix 2 Additional features with references Appendix 3 Sample frame Appendix 4 Questionnaire Appendix 5 Full-‐length operationalization Appendix 6 Empirical results

1
1 Introduction The introduction chapter will give the reader an insight to the subject of the
research by describing the background followed by a problem discussion, which
leads the reader to the purpose of the research.
1.1 Background
Between the years of 2003 and 2010 the number of persons with Internet access
through a personal computer at home in Sweden has more than doubled and
reached in 2010 6,3 millions of people having Internet access at home
(www.scb.se). This rapid development of Internet and the explosion of interest
among executives to implement Customer Relationship Management, CRM,
systems made born to an offspring to CRM, named e-‐CRM (Harrigan et al., 2010
and Bhanu and Magiswary, 2010). CRM systems, Customer Relationship
Management, emerged as a software tool to perform relationship marketing, RM,
acitivities (Payne, 2006 and Alshawi et al., 2009). Relationship marketing is said
by some to be the new paradigm of marketing replacing transactional marketing,
TM, and some state it’s just a rediscovery or a reshaped old paradigm (Harrigan
et al., 2010, Zinelding and Philpsson, 2007, Jagdish and Parwatiyar, 1995 and
Grönroos, 1994). Either if RM has replaced TM or not, RM is defined as to be a
business strategy focusing on establishing and maintaining relationships
between sellers, buyers and other stakeholders and these relationships are
successful and achieved by a mutual exchange and fulfilment of promises
(Grönroos, 1994). Through this business strategy and the principles of RM, CRM
emerged and suggests investing in business intelligence technology, which
enables a long-‐term customer focused relationships strategy (Alshawi et a.,
2009). The software used enables a company to identify, acquire, serve and
retain profitable customers through interactions (Padmanabhan and Tuzhilin,
2003), and by collecting and saving customer information with these software
tools (Payne and Frow, 2005). The interest and utilization of CRM systems
increased rapidly during the 1990’s and the development of Internet has, as said,
made born to an Internet oriented system named e-‐CRM (Boulding et al., 2005,
Bhanu and Magiswary, 2010).
2
E-‐CRM is described with the same objectives as CRM but with the use of Internet
based technology (Harrigan et al., 2010). Therefor e-‐CRM, in contrast to CRM,
refers to the marketing activities, tools and techniques delivered over the
Internet. The aim of the use is to locate, build and improve long-‐term customer
relationships, as in CRM but with the use of technology on the Internet (Lee-‐
Kelley et al., 2003). Through the e-‐CRM tools a company can meet and interact
with a customer in all interaction channel in a consistent way (Pan and Lee,
2003). The tools integrate, captures and distribute all data from a web site and
spreads it through the entire company (Pan and Lee, 2003). The data collected
and managed is useful while taking marketing decisions and the information
management increases the organisations flexibility, efficiency, integration,
communication, collaboration and, might even foster a culture of innovation and
creativity (Du Plessis and Boon, 2004). Richie and Brindley (2005) points out the
importance of face-‐to-‐face contact to establish relationships, but emphasize the
importance and usefulness of electronic methods to maintain these
relationships.
1.2 Problem discussion
There are 1,1 million enterprises in Sweden and of these only 0,09% are large
sized while 21% are micro sized (1 to 9 employees) (www.ekonomifakta.se).
This means that these companies have a major role in the national economy, still
not much room are made for micro sized companies in the academic research of
e-‐CRM. The micro sized companies are often researched together with small and
medium sized companies in a cluster called SME, even tough the sizes differ a lot.
The small sized companies refer to companies with 10 to 49 employees and the
medium sized by having 50 to 250 employees (www.ekonomifakta.se). SMEs,
including micro sized companies, have characteristics that differentiate their
operating manners compared to larger companies. The deficiencies can be
described as a lack of resources, expertise and impact on surrounding
environment (Harrigan et al., 2010). SMEs are also characterised by their close
relationship to their customers, which they manage with a flexibility and
adaptability (Harrigan et al., 2010). This is the competitive advantage of SMEs
towards larger companies, for whom these close relationships are expensive to
3
manage with face-‐to-‐face contact as SMEs do (Richite and Brindley, 2005). The
nature of SMEs daily operations, close relationships and face-‐to-‐face contact,
results in that they perform CRM activities intuitively and through personal
networking (Harrigan et al., 2010). SMEs must maintain a high level of
communication with their customer and at the same time acquire and manage
information on their customers in order to meet their needs and stay
competitive in the market (Keh et al., 2001). This is especially true for retailers,
who, according to Triversity (2001), always have had the consumer in focus and
these close relationships are of vital importance to their value creation.
In studies where research has been done of special characteristics of SMEs with
high growth it has been claimed that active management of product and market
development is the characteristic that mostly distinguish SMEs with high growth
from the ones with poorer growth pace (Smallbone et al., 1995). High growth
firms actively respond to new market opportunities, which include finding new
products or services to offer existing customers (Smallbone et al., 1995). In
general small firms are more resistant to technological changes than larger firms,
and openness to implementing changes is found to have a relationship to growth
orientation (Gray, 2002). If the firm is growth oriented there is a stronger
propensity that it implement technological changes, than if the objectives are not
focused on growth but only on survival or other (Gray, 2002). The most
important factor to achieve high growth in companies, according to Smallbone et.
al., (1995) is that the leader or manager of the company is fully committed to
achieve growth, but Gray (2002) has found a negative relationship between age
of owner-‐manager and growth orientation.
The most important marketing tool in SMEs is the communication with
customers that tends to be constant, informal and open with the purpose to
create mutual value (Harrigan, et al., 2010). A proper implementation for e–CRM
can be of a great success for companies, but according to Bhanu and Magiswary
(2010), 65% of all e-‐CRM projects fails due to lack of understanding. Ryals &
Payne (2001) have recognized that e-‐CRM is often mistaken as to be an exclusive
technological initiative and not as a complement to the ordinary face-‐to-‐face

4
customer relationship. Padmanabhan and Tuzhilin (2003) state that e-‐CRM
system easily can fail to build good relationship with customers due to
insufficient implementation. This can lead to unsatisfied customers and in worst
scenario, the relationship with customers can break. Harrigan et al., (2010), also
argues that the challenges of e-‐CRM are greater in SMEs then they are for large
organizations due to fewer financial resources, lower expertise and limited
management skills. Although, the potential benefits of implementing e-‐CRM in
SMEs are significant when succeeding. Adebanjo (2008) claims that process
improvement, business cost reduction, improved customer perception and
increased sales are some of the benefits, and also as stated before the importance
of valuable data when taking marketing decisions (Du Plessis and Boon, 2004).
The earlier stated development of Internet that resulted in the emergence of e-‐
CRM has also changed the prediction toward customer services where e-‐CRM
can be a great tool to maintain these services (Ashouri and Faed, 2010).
Feinberg et al., (2002), argues that retailers don´t understand the potential and
importance with e-‐CRM which, in todays market, is necessary to fulfil their
customer needs. Chen et al., (2011) have identified that e-‐CRM can be used to
identify customer preferences and their buying behaviour, which is useful to stay
competitive on the markets.
As said, not much research have been executed about e-‐CRM and the level of
implementation where the differences are respected between the SME sizes. But
as presented above the sizes differ a lot and these figures logically suggest that
differentiation should be made in between the company sizes. Due to that, this
research will investigate how e-‐CRM is implemented in micro sized companies
on the Swedish market of retailing. The research will use a 25-‐feature model
found by Feinberg et al., (2002) and used by others. Feinberg et al. (2002) also
found 16 more features but only some of these features will be used in the
research since the literature where they are found is not revealed and only these
few are found by other authors and fit to the objectives of e-‐CRM. In total, 18
additional features will be used to the 25 features discovered by Feinberg et al.
provided by the literature and other authors after the findings of Feinberg et al.
in 2002. The 43 features will be used to index e-‐CRM performance for micro

5
sixed companies on the Swedish market of retailing. As found by previous
studies it is also shown that small firms who actively respond to new market
opportunities by developing new products or services are more likely to be high
growth firms (Smallbone et al. 1995). Also the fact that firms, whose leader or
manager are committed to growth are more likely to achieve it (Smallbone et al.,
1995) arises an interesting question, whether firms that are growth oriented
have adopted e-‐CRM more thoroughly.
1.3 Purpose
The purpose of this study is to describe how far micro sized retailers have
implemented e-‐CRM and explore what factors can describe their e-‐CRM
adoption.
1.4 Hypotheses
In this chapter six hypothesis-‐pairs are presented which will be investigated in
this research to answer the purpose of this research. The hypotheses are
operationalized in the methodology chapter 3.3.6.
Hypothesis 1.
H1: Growth oriented enterprises have implemented more e-‐CRM features than
enterprises that aren’t growth oriented.
H0: Growth oriented enterprises have not implemented more e-‐CRM features
than enterprises that aren’t growth oriented.
Hypothesis 2.
H1: Enterprises where the owner prioritises to maintain current standard of
living have not implemented more e-‐CRM features than enterprises where the
owner don´t prioritise to maintain current standard of living
H0: Enterprises where the owner prioritises to maintain current standard of
living have implemented more e-‐CRM features than enterprises where the owner
don´t prioritise to maintain current standard of living

6
Hypothesis 3.
H1: Enterprises with owners with an age under 40 have implemented more e-‐
CRM features than enterprises with owners with an age over 40.
H0: Enterprises with owners with an age under 40 have not implemented more
e-‐CRM features than enterprises with owners with an age over 40.
Hypothesis 4.
H1: Enterprises with openness to changes have implemented more e-‐CRM
features than enterprises that aren’t open to changes.
H0: Enterprises with openness to changes have not implemented more e-‐CRM
features than enterprises that aren’t open to changes.
Hypothesis 5.
H1: Enterprises with high profitability have implemented more e-‐CRM features
than those enterprises with low profitability.
H0: Enterprises with high profitability have not implemented more e-‐CRM
features than those enterprises with low profitability.
Hypothesis 6.
H1: Enterprises with high growth rate have implemented more e-‐CRM features
than enterprises with low growth rate.
H0: Enterprises with high growth have not implemented more e-‐CRM features
than enterprises with low growth.
1.5 Delimitations The authors of the research have chosen to only study the micro sized
enterprises on the Swedish market of retailing, containing women-‐ men-‐ and
children clothes and shoes. The reason for this is because a limit to one market
might reduce the risk of biased result due to different market characteristics.

7
2 Theory The following chapter present theories relevant to the subject which will later on,
together with the empirical investigation, be the ground for the analysis and result.
The chapter ends with a derivation of the hypothesis provided in the introduction
chapter.
2.1 Definition of the retail industry The following definition of the retail industry is from Nationalencyklopedin and
defines the retail industry as the last link in the distribution chain and involves
all activities used to sell individual goods from producer to final consumer.
Retailers’ products can be divided into two main groups containing durable
goods and groceries. Groceries stands for products that are often bought by
consumers while durable goods, which contain everything from clothes to home-‐
and leisure goods and cars, are bought more rare than groceries (www.ne.se).
2.2 Definition of Micro- and Small enterprises The definition of micro-‐, small-‐ and medium sized companies are, according to
the European Union definition, defined to their number of staff. Micro
enterprises are defined as a company with less than 10 employees (1-‐9). Small
enterprises are companies with less than 50 employees (10-‐49). A medium sized
enterprise has a workforce up to 250 employees (50-‐249) (http://europa.eu).
2.3 CRM In today’s markets, where competition is higher than ever and focus on retaining
customer is of great importance, companies need to not only attract, but also
build a valuable and long lasting relationship to their customers for their long-‐
term survival (Chang, 2007). Because of this, businesses have start realised the
effect of Customer Relationship Management (CRM) which aim is to maximize
the value for customers in the long run by focusing on understanding customer
needs, maintain and build customer relationship (Kanji, 2002 found in Chang,
2007, Payne and Frow, 2005). Payne and Frow (2006), means that the term CRM
and its system are relatively new but the principles behind it is not.

8
Technology development has made relationship marketing a reality and
customer relationship management a new area where firms can gain competitive
advantages through systems (Rygielski, Wang, Yen, 2002). Because of todays
developing business culture, where customers are in focus, companies are facing
the needs of new solutions and strategies to keep up with these changes. The
goal is therefore to conduct business with existing customers and build long-‐
lasting relationships with these, as the costs of acquiring new ones are higher.
The increased interaction with customer means that companies must store
transactions records and responses in an online system that is available to staff
members, an CRM-‐system (Rygielski, Wang, Yen, 2002). According to Sheth
(2000), in the article of Payne and Frow (2006), CRM is today based on the
principles of relationship marketing and is one of the key development areas in
modern marketing when it comes to attracting, maintain and enhancing
customer relationships. Also Light (2001) means that CRM has evolved from
relationship marketing and the increased importance on improved customer
retention. Although, relationship marketing concerns the relationship with
multiple stakeholders, the principles of CRM are primarily on customers
(Gummesson, 2002). This is a combination of processes regarding customers,
sales, marketing effectiveness, responsiveness and market trends (Finnegan and
Currie, 2010). Which can be concluded that CRM is a tool to perform and/or help
the relationship marketing strategy a company is using.
The idea and the CRM software has existed a long time but not until 1990 the
interest and utilization of these software grew. The explanations and definitions
of what CRM is have changed during time (Boulding et al., 2005). These changing
explanations and definitions have caused confusion since the literature hasn’t
produced a unified definition of CRM, claimed by Zablah, Beunger and Johnston
(2004) as found in Payne and Frow (2006). Some literature describes it as a
business strategy (Parvatiyar and Sheth, 2002) and some as an technological tool
(Payne and Frow, 2005). Though, it is clear that CRM puts the customer of the
company in focus (Newell, 2000, Davenport, 2001, Xu et al. 2002, Bull, 2003 and
Payne and Frow, 2005). The CRM tool is an software that collects, saves and
distribute information about customers to enable the company to better meet
9
their needs (Payne and Frow, 2005). This information gathered about the
customer can be used to identify the right customer groups to focus on, meaning
which customer group to increase or decrease effort on (Newell, 2000). The CRM
software can be used to better perform in many areas of a company and where it
interacts with the customer. The information gathered is used to better perform
in marketing, management, sales, customer service and supply-‐chain functions
(Parvatiyar and Sheth, 2002, Xu et al., 2002 and Bull, 2003). The overall aim of
using CRM software is to achieve greater efficiencies and effectiveness in
delivering customer value (Parvatiyar and Sheth, 2002).
CRM requires the firm to know and understand its market and customers. It is a
system with essentially two-‐stage concept. The first stage aim is to build
customer focus, which means that focus should be on a customer-‐oriented
approach and not a product oriented. Focus should be on customers needs and
not on products features. Companies in the second stage are moving beyond the
basics and do not rest on their primary successes but push their development of
customer orientation by integrating CRM across the entire customer experience
chain (Rygielski, Wang, Yen, 2002).
2.3.1 CRM in SMEs As found in Alshawi et al., (2009), Lang and Calantone (1997) states that small
companies are mainly different from large companies when it comes to their
financial abilities, which affect their information-‐seeking process, and because of
this, their implementation of CRM is not as extended as in larger ones. Tereso
and Bernardino (2011) support this as they state that implementation of a CRM
system is not as common in small enterprises as in large ones. This can be
because of limited financial abilities but also lack of knowledge about CRM.
Although, King and Burgess (2008) means that a successfully implementation of
CRM will lead to competitiveness while Ramdani, Kawalek and Lorenzo (2009)
states that CRM is necessary for small companies to survive on the market. Also
Tereso and Bernardino (2011) means that implementation of CRM is of
importance of small enterprises to improve their business value and competitive
capabilities. Due to the fact that it is more costly to acquire new customers than

10
maintaining existing ones, CRM can be of great importance to small enterprises
with limited financial capabilities (Tereso and Bernardino, 2011).
2.4 E-CRM Shortly and on a fundamental level e-‐CRM can be described as Internet present
CRM and with the use of Internet technology (Harrigan et al., 2010). In e-‐CRM
marketing activities, tools and techniques are delivered over the Internet, with
the objective to locate, build and improve customer relationships on a long-‐term
basis, as in CRM (Lee-‐Kelley et al., 2003). Since Internet has had a dramatic
evolvement the last three decades companies have faced a new channel where
they need to meet the customers, the Internet (Lee-‐Kelley et al., 2003 and Pan
and Lee, 2003). The Internet have enabled marketing activities with improved
efficiency in the development and richness of its content, which would perhaps
not be available to SMEs if it weren’t developed (Gilmore et al., 2007). All
interaction channels where a company can interact with customers need to
represent the company in a consistent way, also all channels where customers
can interact with the company (Pan and Lee, 2003). This is a challenge that can
be handled with the aid of e-‐CRM if a company is present on the Internet, which
integrate, captures and distribute data from a homepage and spreads it through
the entire company (Pan and Lee, 2003). The growing market of e-‐commerce
proves a major attendance of customers on the Internet (Lee-‐Kelley et al., 2003).
The number of people with Internet access on a personal computer more than
doubled between the years of 2003 and 2010 in Sweden (www.scb.se). Since the
Internet always is available the market Internet provides is always available for
customers, which has resulted in better informed, more demanding customers
and customers likely to be less loyal (Pan and Lee, 2003). With the use of an e-‐
CRM system a company is taking advantage of this presence of people on the
Internet, using it with the same intention and objectives as CRM does. The
objectives are to gather data about customer behaviour patterns to better
understand their needs and through this enable profitable and long-‐term
relationship. The gathering of data occurs through several Internet based tools,
which register the customer actions on a web site (Feinberg et al., 2002,
Kimiloglu and Zarali, 2008 and Harrigan et al., 2011).

11
Feinberg, Kadam, Hokama and Kim (2002) found that Anton and Postmus (1999)
identified a 25 e-‐CRM feature index used to measure how well e-‐CRM was used
on a web site. To these 25 features, Feinberg et al. (2002) added 16 features
found in several literatures. These 25 features are also used by Sureshkumar and
Palanivelu (2011) in their research of e-‐CRM features on Airline E-‐ticketing
websites. The 25 features measures how many tools, which are used to gather
the data about customers and their behaviours and preferences are present on a
company web site. This research will use the 25 first identified features of e-‐CRM
found by Feinberg et al. (2002) and just some of the 16 later found features
because the literature where these are found is not revealed by Feinberg et al.
(2002). This research has gone through some literature to find new features that
might have been developed since the research was done by Feinberg et al., in
2002. When this literature review was conducted, some of the 16 newly added
features by Feinberg et al. (2002) was found by the authors in other authors’
researches and therefor is used in this research. In total the authors have found
18 additional features to index e-‐CRM performance on a web site. Following a
review of the 18 additional features are presented. The features are found when
using keywords: web site attribute, web site feature, web site customer
relationship, internet customer relationship etc. The features are evaluated
whether if they fit with the objectives of e-‐CRM as presented above.
Additional e-‐CRM feature index review
In an article by Seock and Norton, (2007) it is found that product information,
customer service and web site navigation has an inter-‐correlated relationship.
From this article it is found that features as price, up-‐to-‐date product information,
size, colours, quality photos, sales assistance, return policy and order tracking are
of importance to maintain customer relationships on a web site. The study is
done on college students, but it is figured that it is worth to test whether they are
representative for all kind of demographic groups.
In two articles it is found that privacy and security is of major importance for
enhancing customer relationship and to achieve their trust. The privacy concerns

12
the information the customer share when purchasing goods on an web site and
that the company tells what privacy policy they have, whether they share the
information to third parties or not (Yang et al., 2003, Rocha, 2012 and Feinberg
et al., 2002). Concerning the security the site should use trustful payment
methods and protect the credit card information (Yang et al., 2003 and Rocha,
2012). Rocha has also found several other web site features interesting for this
research; delivery within suitable time, the site is always available for business,
returning options are showed, and a phone number should be shown (Rocha,
2012). Concerning online selling, it has been found that apparel presented on
models on web sites effects the purchase intentions positively and also a positive
perception of the company and the web site (Kim and Lennon, 2009). The
authors has when going through the web sites of the sample identified features
that corresponds to the objects of e-‐CRM and therefor should be tested as an e-‐
CRM index. These four web site features has also been identified in Feinbergs et
al., (2002) 16 additional features and has therefor been added to this research,
these are find store(s), customer account information, member benefits and
company profile. Bradshaw and Brash (2001) identifies many of the 25 features
found by Feinberg et al., (2002) such as call back button, voice over IP and web
chat and they also identifies telephone number presented on the web site as an
important feature. It is also found that social medias has globalised and are used
by many people in the world (Hutton and Fosdick, 2011). Therefor the authors
have chosen to add Social media presence as an e-‐CRM feature in the research.
13
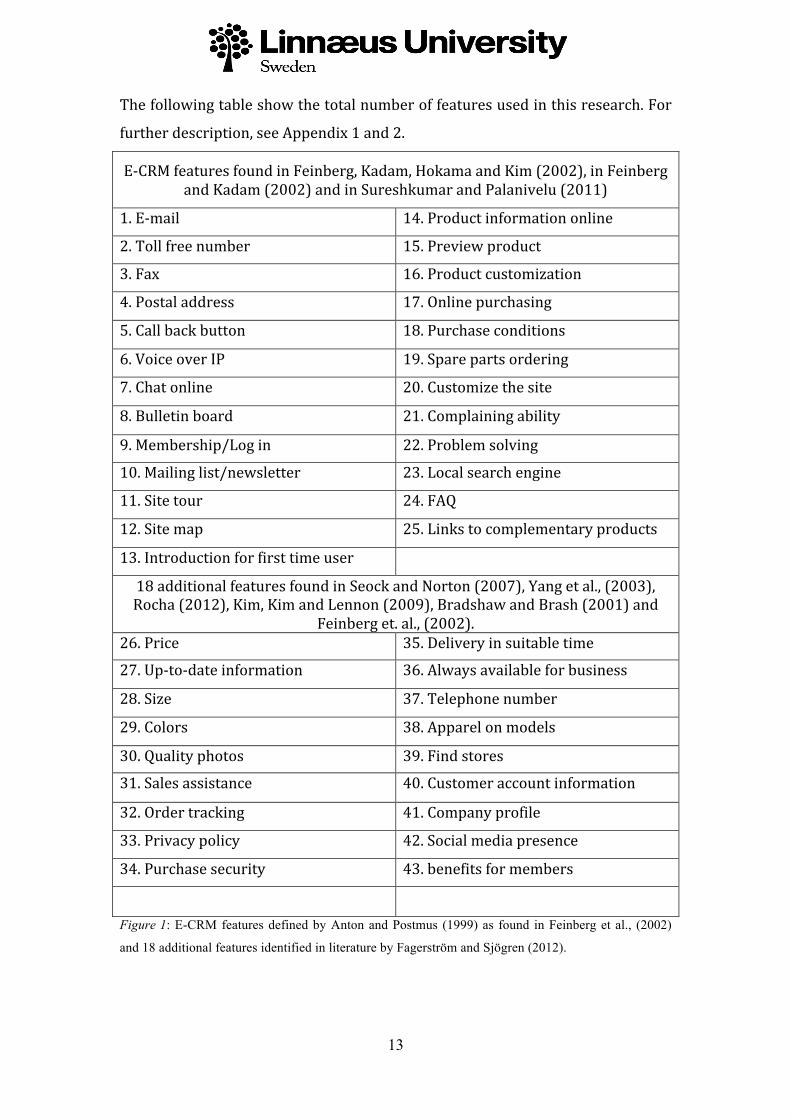
The following table show the total number of features used in this research. For
further description, see Appendix 1 and 2.
E-‐CRM features found in Feinberg, Kadam, Hokama and Kim (2002), in Feinberg and Kadam (2002) and in Sureshkumar and Palanivelu (2011)
1. E-‐mail 14. Product information online
2. Toll free number 15. Preview product
3. Fax 16. Product customization
4. Postal address 17. Online purchasing
5. Call back button 18. Purchase conditions
6. Voice over IP 19. Spare parts ordering
7. Chat online 20. Customize the site
8. Bulletin board 21. Complaining ability
9. Membership/Log in 22. Problem solving
10. Mailing list/newsletter 23. Local search engine
11. Site tour 24. FAQ
12. Site map 25. Links to complementary products
13. Introduction for first time user
18 additional features found in Seock and Norton (2007), Yang et al., (2003), Rocha (2012), Kim, Kim and Lennon (2009), Bradshaw and Brash (2001) and
Feinberg et. al., (2002). 26. Price 35. Delivery in suitable time
27. Up-‐to-‐date information 36. Always available for business
28. Size 37. Telephone number
29. Colors 38. Apparel on models
30. Quality photos 39. Find stores
31. Sales assistance 40. Customer account information
32. Order tracking 41. Company profile
33. Privacy policy 42. Social media presence
34. Purchase security 43. benefits for members
Figure 1: E-CRM features defined by Anton and Postmus (1999) as found in Feinberg et al., (2002)
and 18 additional features identified in literature by Fagerström and Sjögren (2012).

14
2.4.1 E-CRM in SMEs and micro sized enterprises Several drivers of motivation for SMEs to adopt Internet as a marketing and
communication tool is identified. The proactive reasons include the chance of
eliminating competitive disadvantages of competitors in peripheral areas, the
chance of lowering marketing costs and the promotion opportunity in a better
and enriched surrounding. The reactive reasons include the fear of competitive
disadvantage, increased local competition and shrinkage in domestic markets
(Gilmore, et al., 2007). SMEs and micro enterprises operate in a different manner
than larger companies since they are restricted due to their limited resources of
funding, expertise and limited impact on their environment (Gilmore, et al. 2007
and Harrigan, et al., 2010). As a result of their limited resources SMEs and micro
enterprises cannot perform at the same level as the theory describes, which is
prescribed for larger enterprises (Harrigan, et al., 2010). Harrigan et al., (2010)
claims that SMEs and micro enterprises perform CRM-‐like activities intuitively
since their daily operations consists of close relationships with their customers.
Due to the lack of resources SMEs and micro enterprises do perform CRM and e-‐
CRM in a simplified way, but with the same objectives and ground rules as the
theory (Harrigan, et al., 2010). The software used by SMEs and micro
enterprises are not as complex as those used by larger companies, but they
accomplish the same objectives. In SMEs and micro enterprises websites, email,
and data mining is utilised, still their performance of e-‐CRM is of no lower
importance than e-‐CRM activities performed by the larger companies (Harrigan,
et al., 2010). Because of the generic characteristics of SMEs some barriers to
adopt and maintain Internet technologies exists (Gilmore, et al., 2007). As said,
the financial, human and expertise resources limit the ability for SMEs to adopt
these technologies. These Internet based tools, IBT, also generate costs in both
time and absolute funding when it comes to maintenance (Gilmore, et. al., 2007).
As found in Gilmore, et al., (2007), Herbig and Hale (1997) and Downie (2002)
states that irregular updating and maintenance and lack of trained staff will
provide little incentive for customers to visit repeatedly and so have serious
financial implications for the company.
15
E-‐CRM performs customer communication and information management in
SMEs. Customer communication can be seen as the very heart of marketing in
SMEs and micro enterprises, since their daily operation often is interacting with
their customers, the interaction is constant, informal and open (Harrigan, et al.,
2010). The use of e-‐CRM and IBTs, website and email tools, can facilitate the
interaction between the company and the customers and it can be referred to as
“front office” e-‐CRM tools (Ang and Buttle, 2006). Customer communication
through website and email enable information gathering about the customers,
which the company needs to manage. The information is used for marketing
decisions and segmenting the markets. Information management increases the
organizational flexibility, efficiency, integration, communication, collaboration
and, as stated by Du Plessis and Boon (2004), might foster a culture of
innovation and creativity (Du Plessis and Boon, 2004). Information management
tools are referred to as “back office” tools of e-‐CRM (Ang and Buttle, 2006).
Harrigan et al., (2010) claims that SMEs and micro enterprises should adopt and
implement e-‐CRM as a strategic approach in order to reach full potential of
benefits. Geiger and Martin (1999), found in Harrigan et al., (2010) presents
three different strategies of a companys presence on the Internet when adopting
e-‐CRM systems. They differ in the level of integration with the customer: an
ornamental web presence, an informal web presence and a relational web
presence. In an ornamental web presence the company only offer contact
information, when having an informal web presence a company offer full contact
information together with product and service information. The last strategy is a
relational web presence which infers an interactive website, the interaction can
be implemented through log-‐in, e-‐commerce facilities linked to the e-‐CRM “back
office” (Harrigan, et al., 2010).
2.5 Growth intentions Not all small firms are growth oriented, which means they are not focusing their
business on financial growth (Smallbone et al., 1995). Often the strategic
objectives of small firms are characterized by the personal lifestyle of the owner
or managers’ lifestyle and they are more concerned with survival than of growth
16
(Gray, 2002). But it is found by Smallbone et al., (1995) that firms with managers
committed to growth are the best performing firms. What also distinguish the
most growing firms is their active response to market opportunities when it
comes to develop new products and services to existing customers (Smallbone et
al., 1995). This is also found by Gray (2002) who claims that firms with openness
to implementing changes are more growth oriented, and also that growth
orientation is linked to actual growth. What is also found is that smaller firms in
general are more resistant to changes. There are three levels of resistance to
changes found by Maurer (1996) in Gray (2002); informational, gut reaction and
cultural. Where the informational level represent resistance as a lack of
information or understanding of what is required for a change, the level of gut
reaction represent resistance of emotional, psychological and individual
reactions and the final level of culture represent resistance because of historical
failures or problems with past changes (Gray, 2002). The age of the owner or
manager also has a role in how growth oriented the firm is, after the age of 40
growth orientation among owner-‐managers decreases (Gray, 2002).
2.6 Deriving at hypothesis This chapter explains how the research derived at the presented hypotheses
through reviewing literature. The literature motivating each hypothesis is
presented before the hypothesis connected to the literature.
By Gray (2002) and Smallbone (1995) it is found that growth oriented
companies are more actively responding to market opportunities when it comes
to develop new products and services to existing customers. At the same time it
is found that in general small firms are more resistant to implement changes
(Gray, 2002). The benefits of e-‐CRM; process improvement, business cost
reduction, improved customer perception and increased sales (Adebanjo, 2002),
can result in growth of a company. From these facts hypothesis 1 derives:

17
Hypothesis 1.
H1: Growth oriented enterprises have implemented more e-‐CRM features than
enterprises that aren’t growth oriented.
H0: Growth oriented enterprises have not implemented more e-‐CRM features
than enterprises that aren’t growth oriented.
Gray (2002) claims that objectives of smaller firms often are characterized by the
owners personal lifestyle and growth is not a prioritised objective. If a company
is growth oriented they are more likely to actively respond to market
opportunities and develop their products and services (Smallbone, 1995). Which
can be concluded that if a companys objectives are characterized by the owners
preferred lifestyle the owner and the company will not be prioritising
implementing changes as growth oriented companies. From this discussion
hypothesis 2 derives. Please notice that here H1 is the negated hypothesis and
H0 is not.
Hypothesis 2.
H1:Enterprises where the owner prioritise to maintain current standard of living
before growth orientation have not implemented more e-‐CRM features than
growth oriented enterprises.
H0: Enterprises where the owner prioritise to maintain current standard of
living before growth orientation have implemented more e-‐CRM features than
growth oriented enterprises.
Gray (2002) claims that companies with owners under 40 years old are more
growth oriented than companies with older owners. Growth oriented companies
are more willing to implement changes and develop their products and services
(Smallbone, 1995). Through this hypothesis 3 derives:
Hypothesis 3.
H1: Enterprises with owners with an age under 40 have implemented more e-‐
CRM features than enterprises with owners with an age over 40.

18
H0: Enterprises with owners with an age under 40 have not implemented more
e-‐CRM features than enterprises with owners with an age over 40.
Companies with openness to changes are more growth oriented as found by Gray
(2002) and as found by Smallbone (1995) growth oriented companies are more
actively responding to market opportunities. Through these discussions
hypothesis 4 derives:
Hypothesis 4.
H1: Enterprises with openness to changes have implemented more e-‐CRM
features than enterprises that aren’t open to changes.
H0: Enterprises with openness to changes have not implemented more e-‐CRM
features than enterprises that aren’t open to changes.
Smallbone (1995), claims that companies with growth orientation is the best
performing companies and Gray (2002) states that growth orientation is linked
to the actual growth of a company. This concludes that it might be so that
companies with higher profitability are more growth oriented and therefor also
more open to implement changes and develop products and services as found by
Smallbone (1995) and Gray (2002), which derives at hypothesis 5:
Hypothesis 5.
H1: Enterprises with high profitability have implemented more e-‐CRM features
than those enterprises with low profitability.
H0: Enterprises with high profitability have not implemented more e-‐CRM
features than those enterprises with low profitability.
As growth orientation is linked to actual growth (Gray, 2002) and companies
which are growth oriented are more actively responding to market opportunities
(Smallbone, 1995). This derives at hypothesis 6:

19
Hypothesis 6.
H1: Enterprises with high growth rate have implemented more e-‐CRM features
than enterprises with low growth rate.
H0: Enterprises with high growth have not implemented more e-‐CRM features
than enterprises with low growth.
20
3 Methodology The methodology chapter will explain how the research was conducted and which
scientific approach was used. This will give the reader a clear view in why the
different steps of the research were used and which results they attempt to give.
3.1 Scientific approach How the nature of the world and its social reality is described is called ontology.
It consists of various perceptions of how the world and its social reality are
correlated. Objectivism is the perception, which explains objects and knowledge
to exist without the impact of human beings, which means that the world and
humans are separated, independently (Bryman and Bell, 2005). Realism is
described as the perception that objects exists independently of the experiences
of humans (Starrin and Svensson, 1994). Another ontology, constructionism, has
an opposite perception of the nature of the world and the social reality. This
perception describes the existence of humans and the world are non-‐separable,
which means they are dependent on each other. Bryman and Bell (2005)
explains that this means that social phenomena are created through and also
continuously changing through interactions.
The following study has an objectivistic approach, as this is a triangular study
with empirical data collected from retailers through qualitative interviews,
quantitative questionnaires and gathering of theories. Due to the fact that the
research has the perception of knowledge to be independent of human beings.
Qualitative interviews, based on the questionnaire developed through theories,
are used as a pilot-‐study. This is to make sure that the questions are perceived as
they are intended, and by this receive a deeper understanding about retailers’
implementation of e-‐CRM and explore what underlying factors that can describe
the e-‐CRM adoption. The quantitative questionnaire was then developed based
on the result of the qualitative interviews and theories and will strengthen the
result to reach the purpose of the study.

21
The theory of knowledge, also called epistemology, is a philosophy and
discussion of what knowledge is and how it is obtained (Kvale and Brinkmann,
2009). Bryman and Bell (2005) presents objectivistic, subjectivistic and inter-‐
subjectivistic epistemology as the three existing epistemological positions. The
two first epistemologies both belong to the quantitative research methods,
whilst the last belong to the qualitative research methods (Bryman and Bell,
2005). The objectivistic epistemology explains that knowledge is independent of
the actor and can be collected or obtained from “out there”, whilst the
subjectivistic epistemology explains knowledge to be created subjectively within
the mind of humans. The last of the three epistemological positions explains
knowledge to be created interactively between humans, which are the reason for
it to belong to the qualitative research methods (Bryman and Bell, 2005). The
authors relates to the subjectivist approach within this study where the result, in
the end, is based on quantitative questionnaires. The authors also believe that
the knowledge to answer these questionnaires is created subjectively within the
respondents.
When studying the social reality there are also different positioned perceptions
(Halvorsen, 1998). They are called the positivist and hermeneutic approaches.
The positivistic approach explains science to be neutral and value-‐free, which
means it is independent of human impacts (Halvorsen, 1998). Due to this
scientific research methods are used when this perception of the social reality is
used. The hermeneutic perception emphasizes a difference between physical and
social phenomena and therefor sees the humans as capable of deciding and
creating their own future. The hermeneutic perception means that if facts are
stressed as unilaterally the approach to the state of the objects is passive and
resigned. This is because if facts are stressed as unilaterally they are perceived as
givens of nature, unavoidable and decided by fait (Halvorsen, 1998). The
hermeneutic approach emphasizes the understanding and interpretation of
human actions through the actors point of view (Bryman and Bell, 2005).
This study will research and understand in which extend e-‐CRM has been
implemented in micro enterprises on the Swedish market of retailing and what

22
factors that can describe the adoption. This will be done through quantitative
questionnaires developed by qualitative interviews. Therefore, this study will be
of a positivistic approach.
3.2 Scientific procedure Inductive and deductive approach explains the relation between theory and
practices or empirics (Bryman and Bell, 2005). When a deductive approach is
used the researcher derives or deduces one or more hypothesis from theories.
These hypothesis are supposed to be empirical tested or evaluated (Bryman and
Bell, 2005). The theory, from where the hypothesis are deduced, acts as an
framework for the study (Creswell, 2009). The hypothesis that are supposed to
be empirical investigated there has to be an strong theoretical background and
the investigation aims at finding out if the theory is sustainable. This approach
fits favourable in scientific areas that are well explored and where large amounts
of theories can be obtained (Grønmo, 2006). The other explanation of the
relation between theory and practice is the inductive approach. This approach
formulates new theory through research. Through data collection hypotheses
and research questions are formulated and the observed data acts as an
foundation for drawn conclusions, which lays the foundation for the theory
(Bryman and Bell, 2005). When studying areas that aren’t earlier researched the
inductive approach is the preferred approach (Grønmo, 2006).
This study is of deductive approach where the authors, based on theoretical
information, have formulated hypotheses in an area where studies are limited,
and therefore interesting to research. Based on the theory, the empirical
investigation has been conducted and operationalized to strengthen this for the
purpose of the research. The analysis and conclusion is based on a quantitative
approach, where the qualitative interviews have helped the authors to develop
the questionnaires.

23
3.3 Gathering of data
3.3.1 Triangulation A method to see phenomena through different perspectives and at the same time
strengthen the reliability and validity of the results is called triangulation
(Johannessen and Tufte, 2003). The method involves both a quantitative and
qualitative technique when collecting the data for the research. If deviations
between the different perspectives occur it doesn’t necessary need to be a
problem, but it can be seen as a new full interpretation and description of the
research questions. The qualitative method offers flexibility and openness when
collecting data and therefor fits unexplored areas of research. In the opposite
way the quantitative method fits explored areas, where good knowledge already
exists. These two methods can therefor be joined and one way of joining them is
to use the qualitative method of data gathering as a preparation for the
quantitative data gathering (Johannessen and Tufte, 2003). The triangulation
method can also be used to verify the result with both a qualitative-‐ and
quantitative research (Deacon, Bryman and Fenton, 1998). When a triangulation
is made the collected data can be used as a framework or perspective for how the
study should be executed (Creswell, 2009).
This study has used three different approaches when conducting theory and
empirical information gathering. The authors started to collect theoretical
information to receive a deeper knowledge about the subject and potential
purposes for the study. Qualitative interviews were conducted, based on the
questionnaire, to help the authors make sure that the questions asked was
perceived as they where intended. The quantitative questionnaire was through
these qualitative interviews developed to correctly study the purpose of the
research.

24
3.3.2 Population and sample When the whole population is represented within a survey this is called a total
survey. This means that all companies of an industry are represented and are
mostly possible to conduct if the population is small. In many cases, it is not
possible with a total survey and therefore a sample can be made. When the
purpose of the sample is to represent the whole population, it is important for it
to be as representative as possible. Therefore, a designed sampling frame with a
distinct definition is necessary (Eliasson, 2010). There are different sorts of
sampling that are categorized as two main types, probability sampling and non-‐
probability sampling. The probability sampling is defined as everyone within the
population has an equal chance of being a part of the sampling. Within
probability sampling there are different type, simple random sampling, cluster
sampling and stratified sampling. In a simple random sampling, every actor of
the population has a chance of being a part of the sample, as the researchers
don’t make any differences within actors in the population. The simple random
sampling is also the sample with the highest reliability and credibility if the study
wants to understand the population as a whole. The cluster sampling is done
through different stages, which means that the researchers first divide the
population in different cluster, chose some of these cluster and make a sample
within each of the different clusters. A disadvantage with this method is that the
researchers don´t really know the probability that every actor can be a part of
the sample in accordance with the population. The stratified sampling is also a
sampling method done in different stages where the population is divided in
different clusters. The difference from cluster sampling is that all of the clusters
are part of the sample, instead of choosing some of them. This approach is to
prefer when the different clusters are of different sizes and the researchers
might want to collect percentages more from one cluster than another because of
this (Eliasson, 2010).
The definition of a non-‐probability sampling is that the actors within the
population do not have the same chance of being a part of the sample. The
researcher can´t make sure that the sample represent the whole population due

25
to that there is no sampling frame. Included in non-‐probability sampling there
are different types; convenience sampling, quota sampling, subjective sampling
and snowball sampling (Eliasson, 2010). Method ideal type is an additional type
of non-‐probability sampling which means that the researcher finds a number if
ideal types to be a part of the sample that are represented for the whole
population and its definition. To create an ideal type, the researcher must base
its choice on collected data and given knowledge about the subject to make sure
the have the highest probability to represent the whole population (Eneroth,
1979).
The Swedish retail industry has a total of approximately 5000 companies found
in the system of Business Data on the Linnaeus University library system. All
retailers are in accordance with the national ISN numbering, proving they are
retailers of women-‐, men, -‐ and children clothing and shoes. The purpose of this
research is to describe how far micro sized retailers have implemented e-‐CRM
and explore what factors can describe the e-‐CRM adoption. The whole
population of this study as well as the sample frame is therefore micro
enterprises, defined to have between 1-‐9 employees, on the Swedish market of
retailing, which stands for a total of approximately 2700 companies. The authors
of the paper want to create an understanding of the population as a whole, which
means that the sample method used in this research is a simple random
sampling. This is because this approach is able to reach the highest reliability
and credibility of the whole population. Due to this, the retailers participating in
the study will all have the same chance of being a part of the study. Both the
qualitative and quantitative approach is under the same conditions.
The authors have used a computer program online where all companies within
the sample frame have been entered and picked through simple random
sampling. Out of these, a number of 350 companies have been conducted to be a
part of the study. The authors wanted to have a sample based on 10 % of the
sample frame. Due to of the risk of loss, for example companies who don´t wont
to participate in the study, the authors increased the number of participated in
the sample to cover eventual losses. The pilot study contained a number of 15
26
companies, approximately 5 % of the sample, who where conducted in the same
way as the sample frame, but not belonging to the sample. In the end, the sample
of this study was based on 241 companies in total, due to the fact that some of
the sample companies failed to fit the characteristics set for this research. For
further information of the companies included in the sample, see Appendix 3.
3.3.3 Qualitative approach When using qualitative interviews within a study, the purpose is to understand
the subject from the respondents’ perspective (Kvale and Brinkmann, 2009). The
structure of the interview can be compared based on two views. Either to a
everyday conversation with open-‐ended answers or with a more structured
approach. The later one is called semi-‐structured interview and is based on a
theme with the purpose to understand the discussed area based on the
respondent interpretation and descriptions (Kvale and Brinkmann, 2009).
The authors have, through telephone semi-‐structured interviews based on the
questionnaire, received knowledge from the respondents’ perspective, if the
questions are perceived as they are suppose to be. By this, the authors have
developed the quantitative questionnaire. The qualitative interviews are of semi-‐
structured approach due to that the authors have, through theory gathering,
knowledge about the subject and want the interviews to follow a specific theme.
Although, the interviews follow the same questions and answers as the intended
questionnaire, with room for discussion, in order for the authors to found out if
the questions are perceived as they intend to. In total, 15 companies where
contacted for the pilot study and are the base for the development of the
quantitative questionnaire.
3.3.4 Quantitative approach When the purpose is to quantify data, the study should focus on quantitative
interviews or surveys. For quantitative interviews, standardize questionnaire
are preferable. These are easy to record the answer for further process. A
27
structure approach during each interview is therefore necessary to give advocate
answers to the research question.
Based on the pilot study, the developing of quantitative questionnaires have
been done. The quantitative questionnaires will be the ground for this papers
analysis and conclusion. The authors have chosen to use a structured
questionnaire as a quantitative method to increase the validity and reliability of
the study. The authors have decides that the most efficient and productive way
to receive as much responses as possible is to develop the questionnaire in two
parts. Part one includes questions where the authors themselves can found
answers, as this is official for everyone. Part two includes questions that need to
be answered from the participated perspective. For these questions, the authors
have chosen to call the participated within the sample frame to make sure that as
many answers as possible is received and also that the right person within the
company answer the questionnaire (owner/manager). To create a higher chance
of receiving as much responses as possible, all companies participating will
remain anonymous in the research. Even though the companies are shown in the
sample frame, they ones participating in the research are confidential. In total, a
number of 137 companies of the 241 companies within the sample participated
in the research. The respond-‐rate of the research is then 57 %.
3.3.5 Pilot study
Before the quantitative questionnaires are sent out to the represented in the
sample, it is important to know that the questions are perceived and answered
what it intend to. One way to do this is through a pilot-‐study (Eliasson, 2010).
This study can be answered by actors, who are not represented in the sample,
but still represents the population. Thanks to a pilot-‐study, the researchers can
receive feedback from the participated and develop their questionnaires, for
improvement (Eliasson, 2010). Bryman (1995) also indicate the importance to
receive feedback for further development for the quantitative research to be
perceived as it intends to. Qualitative research can in this case act as a pilot-‐
study for the quantitative study to be developed (Bryman, 1995).

28
This research has used a pilot-‐study in a qualitative approach to make sure that
all questions are perceived as they intend to. Thanks to this, the questionnaires
have further been developed, with help from feedback from the participated, to
make sure that the questions are perceived as they intend to, to reach the
purpose of the study. In total, a number of 15 pilot studies have been conducted.
The result of the pilot study will be found in the operationalization chapter
below, together with the operationalization of the final questionnaire.
3.3.6 Operationalization
Pilot study
This is a summary describing what changes were made with the questionnaire
after conducting a pilot study with 15 randomly chosen companies, not
belonging to the sample.
The questionnaire starts with one part that is written and researched by the
authors on their own and there were no problems found in finding the proper
information. This part consists of the name of the company, age of owner,
number of employees, city and inhabitants in this city, profitability, growth rate
and as well as the 43 e-‐CRM features which are tested on the company web site.
If there were no web site found no features were checked. The second part of the
questionnaire was conducted through personal interviews via telephone with
the owner of the company, where the questions were described and then asked.
Here, the authors found that some major adjustments were in order. The first
question was hard to understand for some of the respondents, therefor the
authors have re-‐formulated it to be able to phrase the same question to every
respondent in order to avoid biases. The authors have also found out that one of
the 4 statements couldn’t be asked in the same question because it would cause
the result to be biased. This is because the question is meant to describe how
growth oriented or not the company is, and this is done through a summation of
the points each answer responds to. But the statement preferred lifestyle is not
what defines the goals of the company is at firstly a negatively asked question,
which makes the interval introverted and it also results in that respondents
which adds up to the same amount of points can have a different intention in the
29
question of how growth oriented they are. This resulted in that this statement is
a question it self and is also hypothesis tested solely. The statement is also
rephrased for easier understanding and is phrased as to maintain current
standard of living as a statement to the question what are the goals of your
company.
Overall the pilot study felt comfortable. The respondents gladly respondent to
the questions and they felt the time it demanded was affordable, which
motivates the number of questions asked and it might hopefully also reduce the
risk of loss of respondents when the study is conducted.
Operationalization of questionnaire
According to Eliasson (2010), an operationalization is, that from the theory
develop concepts that will help to answer the problem question. The concepts
need to be relevant for the research question and in focus throughout the
research. It is important to test the concept before the actual research takes
place in order to make sure that they are clear and understood the same by all
participated. It is also important due to that the concept needs to be measurable,
both with a research of quantitative and qualitative approach (Eliasson, 2010).
The operationalization is based on the questionnaire used in the study. The
result of the pilot study can be read above and the operationalization is based on
the questionnaire after changes has been made. The operationalization below
only contains the questions directly used to answer the hypothesis. For the full-‐
length operationalization, see Appendix 5, and for the questionnaire, see
Appendix 4.
Part one:
Part one is based on questions that the authors themselves have found answers
to. This is because that the answers are official to everyone and therefore the
authors believed that the trust worthiest answers could be collected to make the
study as valid as possible.

30
Age of owner/manager
Theoretical purpose; According to Gary (2002), the age of the owner/manager
has a role in how growth oriented the firm is and state that after the age of 40,
growth orientation among them decrease.
Authors purpose; By knowing the age of the owner, the authors might see a
relationship between the age and implementation of the features of e-‐CRM and if
there are any relations to how far they have come.
Hypothesis: The purpose is to confirm or disconfirm hypothesis 3, if
owners/managers in the retail industry of micro sized enterprises, under the age
of 40 uses more e-‐CRM features than owners/managers over the age of 40. This
can be answered thanks to the question concluding how many e-‐CRM features
that retailers have implemented, and by this, help to answer the purpose of the
paper.
Which of the following e-‐CRM features exist on their website?
Theoretical purpose; According to Feinberg et al., (2002), found in Anton and
Postmus (1999), the 25 e-‐CRM features used in this questionnaire are identified
to be mostly used in the retail industry. In additional to these 25 features, 18
features have been used, found by Yang et al., (2003), Seock and Norton (2007),
Kim and Lennon, (2009) and Rocha (2012), which have been identified by
Fagerström and Sjögren (2012).
Authors purpose; By founding out which of the following features are
implemented, and in which extend, the authors can make a conclusion in how far
micro sized enterprises on the Swedish market of retailing have come. The
features work as an index to measure e-‐CRM implementation.
Hypothesis. All six of the hypothesis in this paper that the authors want to
confirm or disconfirm, requires that information of how many e-‐CRM features
that have been implemented for each retailer is answered. By knowing the
31
answer of this question, the authors will be able to confirm or disconfirm the
hypothesis used to answer the purpose of the paper.
Profit margin
Theoretical purpose: According to Smallbone et al., (1995), companies who are
best performing are more growth oriented. Also Gary (2002) states that growth
orientation is linked to actual growth.
Authors purpose: By founding out the profit of each retailer participating in the
research, the authors might be able to see a relationship between number of e-‐
CRM features and margin profit. The average margin profit will be calculated as a
mean value of the sample and retailers will be evaluated depending on if they are
above or below the average. The authors have choose two different methods to
calculate the mean value and the reason for this is because there are e few
companies that affecting the mean value to much because of to high differences
compared to the rest of the sample. Therefore, the calculation is based on rates
not including the over-‐ and under quartile of rates, and the top-‐ and bottom 5
procent.
Hypothesis: By asking this question, the authors will be able to confirm or
disconfirm hypothesis 5, that enterprises with higher profit margin than the
average of the industry use more e-‐CRM features than enterprises with lower
profit margin than the average. By knowing the answer of this question, the
authors will be able to confirm or disconfirm the hypothesis, together with the
number of e-‐CRM features used, and by this answer the purpose of the paper.
Growth rate (increase in turnover)
Theoretical purpose: According to Smallbone et al., (1995), companies who are
more commitment to growth are the ones who are performing the best and are
also actively responding to opportunities and developments. Gary (2002), states
that companies who are more open minded to change are more growth oriented.
The average growth rate will be calculated as a mean value of the sample and
retailers will be evaluated depending on if they are above or below the mean

32
value. The authors have choose two different methods to calculate the mean
value and the reason for this is because there are e few companies that affecting
the mean value to much because of to high differences compared to the rest of
the sample. Therefore, the calculation is based on rates not including the over-‐
and under quartile of rates, and the top-‐ and bottom 5 procent.
Authors purpose: By founding out the average growth rate of each retailer
participating in the research, the authors might be able to see a relationship
between number of e-‐CRM features and growth of each retailer and compare this
to the theory.
Hypothesis: By asking this question, the authors will be able to confirm or
disconfirm hypothesis 6, that enterprises with higher growth rate (increase in
turnover), than average in the retail industry use more e-‐CRM features than
retailers with lower growth rate (increase in turnover). By knowing the answer
of this question, the authors will be able to confirm or disconfirm the hypothesis,
together with the number of e-‐CRM features used, and by this answer the
purpose of the paper.
Part two:
Part two has been conducted through a telephone interview with the
participated retailers. The telephone interview has a strictly quantitative
approach with no input from the authors in order to limit the influence of
participated. Part two includes questions that necessary needs to be answered
by the participated themselves. The authors have therefore chosen to conduct
these answers with telephone interviews to make sure that the right person
within the company answer the question (owner) and also try to ensure a high
response rate.
What underlying factors is the basis for your goals of the company?
• Maintain current standard of living?
• Increase profits?
• Create innovation / develop new products and services?

33
• Increase sales?
Theoretical purpose; According to Smallbone et al., (1995), Maurer (1996) and
Gary (2002), the above statements are in one or another way related to the
objectives of the firm and small enterprises motivation for their enterprises
objectives. According to Smallbone et al., (1995), not all small firms are growth
oriented which means they are not focusing on financial growth. The theories
state that small firms are often characteristics by the personal lifestyle of the
owner/manager than of growth (Gary, 2002). Gary (2002) also states that firms
that are more open to changes are more growth oriented.
Authors Purpose; To found out the motivations for micro enterprises on the
Swedish industry of retiling in how to reach the objectives of the firm, the
authors might be able to found a relationship between micro enterprises on the
Swedish market of retailing and growth intention and compare these to how far
they have managed to implement e-‐CRM. This will help the authors to answer
the purpose of the paper.
Hypothesis: By asking this question, the authors will be able to confirm or
disconfirm hypothesis 1 and 2, that growth oriented enterprises use more e-‐CRM
features than enterprises who are less growth oriented and that companies
where the owner prioritise to maintain current standard of living before growth
orientation have not implemented more e-‐CRM features than growth oriented
enterprises. By knowing the answer of this question, the authors will be able to
confirm or disconfirm the hypothesis, together with the number of e-‐CRM
features used, and by this answer the purpose of the paper.
How often do you implement changes in the organisation? For example,
routines, technologies, marketing etc.
1. Changes are avoided
2. Changes only introduces when necessary
3. Changes are introduces occasionally
4. Changes are introduced constantly
34
Theoretical purpose; According to Maurer (1996) smaller firms are in general
more resistance to changes. Although, Smallbone et al., (1995) states that the
most growing firms are active in their response to market opportunities when it
comes to develop new products and services to existing customers. Gary (2002)
also claims that firms with openness to implementing changes are more growth
oriented, as well as growth orientation is linked to actual growth.
Authors purpose; As mention, smaller firms are more resistance to changes but as
stated, the more open they are to opportunities, the more can they grow.
According to this, it is of interest to see if retailers of micro size on the Swedish
market are open to changes and opportunities and by this see a relation to
implementation of e-‐CRM and growth intention.
Hypothesis: By asking this question, the authors will be able to confirm or
disconfirm hypothesis 4, that enterprises that are more openness for changes in
technology use more e-‐CRM features than enterprises that are not as openness to
changes in technology. By knowing the answer of this question, the authors will
be able to confirm or disconfirm the hypothesis, together with the number of e-‐
CRM features used, and by this answer the purpose of the paper.
3.4 Interpretation of data
When interpreting data, the researchers wants to create a meaning out of their
collected data and by this, compare the collected data from the empirical
investigation to the theory. With help from statistic techniques, quantitative data
can be translated (Eliasson, 2010). Normally, data from questionnaires are in
focus when measuring quantitative data and to reach the purpose of the study,
researchers want to establish causal relationships between concepts (Bryman,
1995). In a study based on questionnaires, the data forms the basis between
different variables that set out the purpose of the research. In these cases, it is
important to demonstrate causal relations (Bryman, 1995).

35
The qualitative interviews main purpose was to develop the questionnaires to
improve the quantitative study. The pilot-‐study has helped the authors to receive
feedback from the participated retailers for further development of the
quantitative questionnaires. All of the pilot-‐studies have been recorded for the
authors to make sure that nothing that has been said is missed. To interpret the
quantitative questionnaires, and find correlations between variables, which in
the end is the result of this paper purpose and conclusion, the computer program
PASW has been used. PASW has helped the authors to interpret the data and see
correlations between different variables that has answered the hypothesis and
purpose of the paper.
3.5 Criteria of measurements
For a qualitative study to reach the quality and standards that are required, there
are different criteria that need to be followed (Bryman and Bell, 2005). These
criteria are reliability, transferability, credibility and opportunity to demonstrate
and confirm. A reliable study is a research conducted in accordance with the
rules contained. One way to do this is through a respondent validation, which
means that the respondent controls that the researchers have understood what
they have given them by controlling the collected data. When a study can be used
in other setting and environments it is transferable, and therefore generalizable.
With creditability the study has been designed and used an approach right for
the study and its purpose. For the study to be as trustworthy as possible, it is of
importance that it does not contain any of the researchers own values, thoughts
and reflections. Due to this, the researchers ability to demonstrate and confirm
its research is also a criteria of measurements for a qualitative research (Bryman
and Bell, 2005)
The criteria of measurements for the quantitative study are reliability, validity,
generalizability and replication (Bryman and Bell, 2005). The trustworthiness of
the measurements is described by the reliability. If the study can be
generalizable and used in similar situations and environments it is generalizable.
Validity makes sure that the study measure what it intend to measure.

36
Replication is the last criteria of measurements and describes that the
researchers should have limited impact on the result. In other words, the result
should be independent of the researcher (Bryman and Bell, 2005).
This study can ensure a result in accordance to the criteria of measurements
described above. The qualitative interviews have been recorded to make sure
that nothing is missed when developing the questionnaire. It has also been
conducted in accordance with the rules and standards for a qualitative approach.
Before the actual interview, the authors performed a number of pilot-‐interviews
to make sure that the questions where understood by the respondent the way
they were intended to be understood. The interviews have also been conducted
objectively, and due to a consideration of each question, the result leading to the
quantitative questionnaires can be strengthen. The quantitative criteria of
measurements can be ensured by carefully conducted collection of data. For the
final questionnaire, an operationalization has been completed to ensure the
validity of the result. The operationalization has its ground in both theory and
development of the pilot-‐studies, and because of the authors objectivity when
conducting the study, the result can be classified as replicable. Due to that the
respondents of the questionnaire have been conducted through a probability
sample with a simple random sampling approach, with a respondent rate 57 %,
the authors believe that the result can be generalizable for the whole population,
and also that the study is transferable thanks to the structures questionnaires
based on development of qualitative interviews and theories. In accordance with
the method triangulation, the result can be strengthening thanks to that the
qualitative interviews are the ground for the development of quantitative
questionnaires. Also for the questionnaires, a pilot-‐study has been completed to
make sure the questions are understood the way they intend to, before the actual
research starts. The measurement credibility can be strengthening due to the
positivistic approach and the respondent validation from the qualitative pilot-‐
studies. As well as the structured questionnaires can strengthen the
measurement, which is an attempt to limit the authors own values and keep the
study objective.

37
4 Empiric results
The following chapter will show the result of the empirical investigation. The
investigation and result is based on questionnaires (see Appendix 4). The empirical
results will later be analysed together with used theories, which will answer the
purpose of the research. In total, 137 out of 241 companies in the sample
participated in the research. For more information about the empirical data, see
Appendix 6.
4.1 E-CRM features usage
The following chart describes the use and implementation of e-‐CRM features for
the participated companies in the research.
E-‐CRM FEATURES
General features No of companies E-‐mail 65 Telephone number 83 Fax 10 Toll-‐free nr 0 Postal address 76 Call back button 0 VoIP 0 Bulletin board 49 Site customization 2 Local search engine 8 Membership 13 Benefits for members 0 Mailing list 12 Site tour 0 Chat 1 Site map 3 Introduction for first time users 0 Social media presence 48 Store finder 38 Account information 9 Company profile 60
E-‐commerce and product information features

38
Figure 2: Results of number of e-‐CRM features used by the participated companies
The use of e-‐CRM features on company websites is low, as found in this research.
The total of 137 companies only use 12% of the possible features to use, which
adds up to approximately 5 features per company out of 43 features. Included in
these calculations are also the companies without a web site and use of e-‐CRM.
The figure is calculated through multiplying the number of companies
participating, 137, by the number of possible features, 43, which adds up to
5891. The number of e-‐CRM features used, as a total of all 137 companies, is 722,
Online purchasing 18 Product information online 21 Price 21 Information is up-‐to-‐date 21 Size 21 Colour 21 Photos of products 21 Sales assistance services 3 Product customization 3 Purchase conditions (Inc. Returning options) 18 Product review (customized products) 2 Links to complimenting products 0 Privacy policy 10 Security when buying 12 Delivery in suitable time 9 Always available 18 Apparel on models/3D 18 Order tracking 1
Post sales support FAQ 2 Problem solving 0 Complaining ability 5 Spare parts 0 Possible number of features that could be used by all 137 companies 5891 Number of e-‐CRM features used in total of all 137 companies 722 Number of e-‐CRM features used in total of all 138 companies in percentage 12%

39
0 20 40 60 80 100
Yes No
Companies with e-‐CRM features
Companies with e-‐CRM features
which leaves us a 12% usage. The most of the features used are general functions
and especially e-‐mail, telephone number shown on web site, postal address,
bulletin board, social media presence and company profile. The result shows that
not many of retail clothing stores are using e-‐commerce (18 of 137, 13%). If only
the companies with a web site at all are considered, 81 companies out of 137, the
average number of implemented e-‐CRM features are 9 features per company,
which equals 21% of the available features.
4.2 Description of empirical material The following charts will in an informative way show the description of the
empirical material conducted so the readers, in an easy way, can follow the
results in the next part of the empirical chapter. The results are based on the
answers of the 137 participated companies. For further information about the
questions asked, see the questionnaire in Appendix 4.
Figure 3: Shows number of the participated companies that have implemented e-‐CRM
In total, 81 of the 137 companies participated in the research, have implemented
one or more e-‐CRM features while 56 have not implemented any. This means
that 56 of the 137 companies are not present on the Internet.

40
0 10 20 30 40 50 60
Number of e-‐CRM features
Number of e-‐CRM features
0
20
40
60
80
100
Not Growth oriented
Semi Growth oriented
Growth oriented
Growth Oriented
Growth Oriented
Figure 4: Shows number of features divided by companies
The chart above shows how many features that are implemented by the 81
companies who have implemented e-‐CRM. The stable with the highest amount,
no e-‐CRM features, are the 56 companies that have no features at all. Otherwise,
the majority of companies have implemented between 1-‐10 features. The most
common ones can be seen in figure 2.
Figure 5: Shows the participated companies willing to grow
This chart shows how growth oriented the participated companies are. The data
is found by questioning four questions, question 2-‐5, part 2 in the questionnaire.
The majority of the companies are growth oriented with a total score of between
16 and 19 on these four questions.

41
0
20
40
60
80
Owmners interest in maintaining current standard of living
Interest in maintaining current standard of living
0
20
40
60
80
100
120
40 or under over 40
Age of owner
Age of owner
Figure 6: Shows if the participated owners’ goal with the company is to maintain current standard of living
Out of the 137 companies participated in the research, the majority state that the
goal of the company is, for the owner, to maintain his or hers current standard of
living. Only 21 of the participated state that is not the goal.
Figure 7: Shows the age of the owners participated in the research
This chart describes the variation of age between the owners participated in this
research. The majority of owners are above 40 years old.

42
0
20
40
60
80
100
Below 1,25 % Over 1,25
Proait margins -‐ below or over bransch mean (below-‐ and over quartile
not included)
Prorit margins -‐ below or over bransch mean (not over-‐ and under quartile included)
Figure 8: Shows the participated companies openness to changes
The chart describes that, in this research, the majority of participated states that
they introduce changes sometimes or constantly. Only 2 companies out 137
mean that they avoid changes while 19 introduce them when necessary.
Figure 9: Shows the variation of the participated companies profit margin below or over branch mean (over-‐ and under quartile not included)
0 10 20 30 40 50 60 70
Changes are avoided
Changes are introduces when
necessary
Changes are introduced sometimes
Changes are introduced constantly
Openness to changes
Openess to changes

43
0
20
40
60
80
100
Below 1,79 over 1,79
Proait margins -‐ below or over branch mean (top-‐ and bottom 5 procent
not included)
Prorit margins -‐ below or over branch mean (top-‐ and bottom 5 procent not included)
Figure 10: Shows the variation of the participated companies profit margin below or over branch mean (top-‐ and bottom 5 procent not included)
Figure 9 and 10 describes the variation of profit margins between the
participated companies where the below-‐ and over quartile of companies and
the top-‐ and bottom 5 procent of most dissimilar profit margin is not included
for the mean value to be trustworthy. The profit margin is calculated as a mean
value for all companies in the sample for the last three years. A mean profit
margin for the research sample was then calculated and the mean profit margin
for the branch, without over-‐ and under the quartile fences was calculated to be
1,25 %. The mean value for the branch, where top-‐ and bottom 5% is not
included is 1,79 %. The reason for these types of calculations is because a few of
the companies within the sample have profit margins that are very high/low
compared to the rest of the sample. Therefore, the authors have chosen to
calculate the mean value according to the two approaches explained. As
displayed, the majority of the companies have a mean profit margin above the
branch mean in both cases.

44
50
60
70
80
Below 1,3 % Over 1,3 %
Growth rate -‐ below or over branch mean (below-‐ and over quartile fence not included)
Growth rate -‐ below or over branch mean (below-‐ and over quartile not included)
0 20 40 60 80 100
Below 5,2 % Over 5,2 %
Growth rate -‐ below or over branch mean (below-‐ and over
quartile not included)
Growth rate -‐ below or over branch mean (below-‐ and over quartile not included)
Figure 11: Shows the variation of the participated companies growth rate below or over branch mean (below-‐ and over quartile not included)
Figure 12: Shows the variation of the participated companies profit margin below or over branch mean (top-‐ and bottom 5 procent not included)
Figure 11 and 12 describes the variation of growth rate between the participated
companies where the below-‐ and over quartile of companies and the top-‐ and
bottom 5% of most dissimilar profit margin is not included for the mean value to
be trustworthy. The growth rate is calculated as a mean value for all companies
in the sample for the last three years. A mean growth rate for the research
sample was then calculated and the mean growth rate for the branch, without
over-‐ and under the quartile fences was calculated to be 1,3 %. The reason for
these types of calculations is the same as for the calculation for profit margin.
The mean value for the branch, where top-‐ and bottom 5 procent is not included
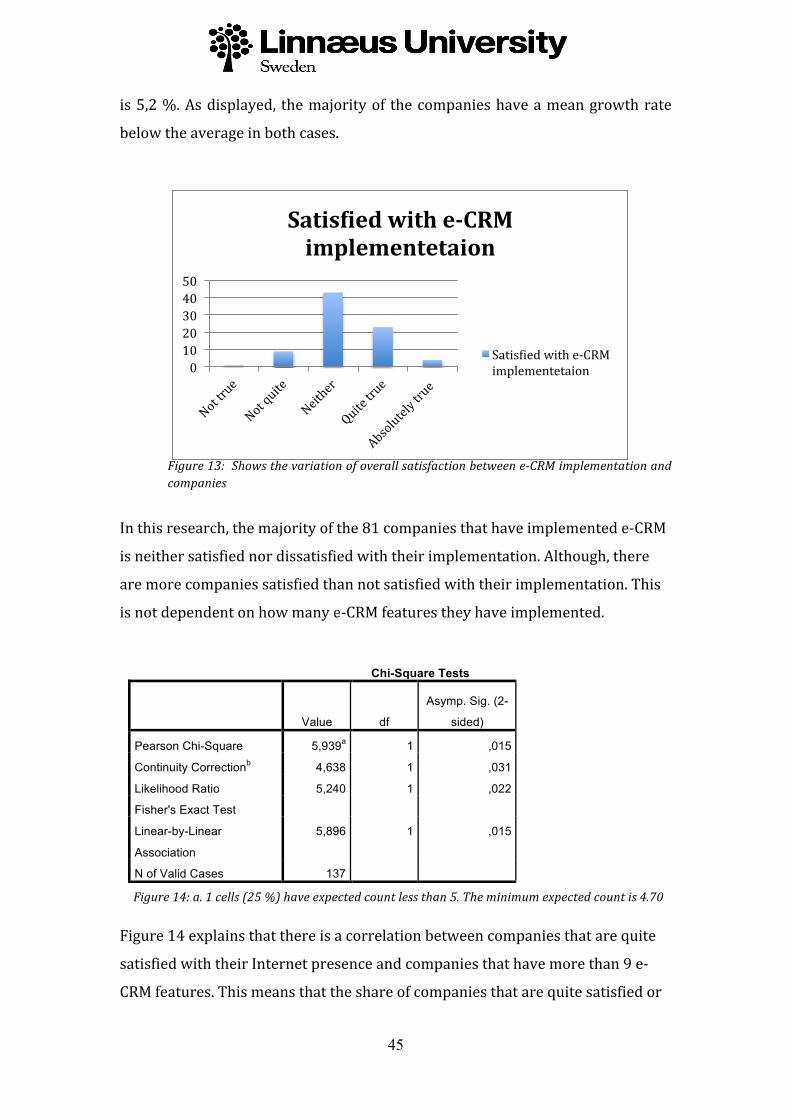
45
0 10 20 30 40 50
Satisaied with e-‐CRM implementetaion
Satisried with e-‐CRM implementetaion
is 5,2 %. As displayed, the majority of the companies have a mean growth rate
below the average in both cases.
Figure 13: Shows the variation of overall satisfaction between e-‐CRM implementation and companies
In this research, the majority of the 81 companies that have implemented e-‐CRM
is neither satisfied nor dissatisfied with their implementation. Although, there
are more companies satisfied than not satisfied with their implementation. This
is not dependent on how many e-‐CRM features they have implemented.
Chi-Square Tests
Value df
Asymp. Sig. (2-
sided)
Pearson Chi-Square 5,939a 1 ,015
Continuity Correctionb 4,638 1 ,031
Likelihood Ratio 5,240 1 ,022
Fisher's Exact Test Linear-by-Linear
Association
5,896 1 ,015
N of Valid Cases 137 Figure 14: a. 1 cells (25 %) have expected count less than 5. The minimum expected count is 4.70
Figure 14 explains that there is a correlation between companies that are quite
satisfied with their Internet presence and companies that have more than 9 e-‐
CRM features. This means that the share of companies that are quite satisfied or

46
more with their Internet presence and have more than 9 e-‐CRM features is
bigger than the share of companies that are less satisfied than quite with their
Internet presence and have less than 9 e-‐CRM features.
4.3 Results The hypotheses have been tested through chi-‐square tests in PASW. In all
hypotheses but one we cannot statistically prove a correlation between the two
variables tested in each hypothesis.
It is found, when testing Hypothesis 1, that growth orientation has no correlation
to implement more e-‐CRM features, (Chi-‐2>0.05), as seen in Figure 15 below.
Chi-‐Square Tests -‐ Growth Orientation
Value df
Asymp. Sig. (2-‐
sided)
Pearson Chi-‐Square 5,825a 10 ,830
Likelihood Ratio 6,978 10 ,728
Linear-‐by-‐Linear Association ,096 1 ,757
N of Valid Cases 137 Figure 15: a. 10 cells (55,6%) have expected count less than 5. The minimum expected count is ,12.
The same result appear when testing if owners who prioritise to maintain
current standard of living have not implemented more e-‐CRM features than
companies with owners who doesn’t prioritise to maintain current standard of
living, (Chi-‐2>0.05), as shown in Figure 16 below. This means that there is no
correlation between the two variables in Hypothesis 2, and that how the owner
prioritise to maintain his current standard of living or not it does not affect how
many e-‐CRM features the company carry on their web site.

47
Chi-‐Square Tests – Maintain current standard of living
Value df
Asymp. Sig. (2-‐
sided)
Pearson Chi-‐Square 25,154a 20 ,196
Likelihood Ratio 26,954 20 ,137
Linear-‐by-‐Linear Association ,876 1 ,349
N of Valid Cases 137 Figure 16: a. 21 cells (70,0%) have expected count less than 5. The minimum expected count is ,20.
The age of the owner, under or over 40 years old, doesn’t either show a
correlation to how many e-‐CRM features that are implemented on a companys
web site, (Chi-‐2>0.05). This is shown in Figure 17 below and corresponds to
Hypothesis 3.
Chi-‐Square Tests – Age of owner
Value df
Asymp. Sig. (2-‐
sided)
Pearson Chi-‐Square 1,228a 5 ,942
Likelihood Ratio 1,907 5 ,862
Linear-‐by-‐Linear Association ,075 1 ,784
N of Valid Cases 137 Figure 17: a. 5 cells (41,7%) have expected count less than 5. The minimum expected count is ,70.
When testing if companies that are more willing to implement changes have
more e-‐CRM features than companies who are not as willing to implement
changes, Hypothesis 4, the result shows that there is no correlation between the
two variables. The result, (Chi-‐2>0.05), cannot prove that willingness to
implement changes does not affect the number of e-‐CRM features a company is
carrying on their web site. The chi-‐square result is presented in Figure 18 below.

48
Chi-‐Square Tests – Openness to changes
Value df
Asymp. Sig. (2-‐
sided)
Pearson Chi-‐Square 10,962a 15 ,755
Likelihood Ratio 11,617 15 ,708
Linear-‐by-‐Linear Association ,001 1 ,977
N of Valid Cases 137 Figure 18: a. 17 cells (70,8%) have expected count less than 5. The minimum expected count is ,06.
As said only one of the hypotheses could be accepted and that is Hypothesis 5,
H0, and that’s the counter-‐hypothesis of H1, which is the hypothesis investigated
and thought of to be true. Two mean values have been used when testing this
hypothesis, the first is calculated by taking upper and lower quartiles into
account and the second mean value is calculated through deleting 5% of the
values from both the top and the bottom after sorting them accordingly to their
size. The quartile result gives an average profitability of 1,25% and the 5%-‐result
gives an average of 1,79%. Both tests give the same result with slightly different
significance value but both within the grid of showing correlation, (Chi-‐2<0.05).
The result shows that high profitability is not correlated to that a company is
carrying more e-‐CRM features than a company with low profitability. What can
be seen is that companies with low profitability do carry more e-‐CRM features on
their web sites than companies with high profitability, (Chi-‐2<0.05), as shown in
Figure 19 and 20 below. The research also found that there is a correlation
between having low profitability, when using the quartile calculated profitability
average, and having any e-‐CRM features at all, which mean that if a company
have below 1,25% profit margin there is a greater chance that they have any e-‐
CRM features at all, than it is for companies that have a profit margin above
1,25%., as showed in Figure 21. This result does not show when testing the 5%-‐
erasing from top and bottom average, where no correlation can be found as
shown in Figure 22.

49
Chi-Square Tests – Profitability, average 1,25%
Value df
Asymp. Sig. (2-
sided)
Pearson Chi-Square 12,736a 5 ,026
Likelihood Ratio 12,621 5 ,027
Linear-by-Linear
Association
10,682 1 ,001
N of Valid Cases 137 Figure 19: a. 4 cells (33,3%) have expected count less than 5. The minimum expected count is 1,49.
Chi-Square Tests – Profitability, average 1,79%
Value df
Asymp. Sig. (2-
sided)
Pearson Chi-Square 12,212a 5 ,032
Likelihood Ratio 12,915 5 ,024
Linear-by-Linear
Association
7,866 1 ,005
N of Valid Cases 137 Figure 20: a. 4 cells (33,3%) have expected count less than 5. The minimum expected count is 1,75.
Chi-Square Tests – 1,25% average profit margin vs. if any e-CRM features
Value df
Asymp. Sig. (2-
sided)
Pearson Chi-Square 4,418a 1 ,036
Continuity Correctionb 3,695 1 ,055
Likelihood Ratio 4,508 1 ,034
Fisher's Exact Test Linear-by-Linear
Association
4,386 1 ,036
N of Valid Cases 137 Figure 21: a. 0 cells (,0%) have expected count less than 5. The minimum expected count is 20,85.

50
Chi-Square Tests – 1,79% average profit margin vs. if any e-CRM features
Value df
Asymp. Sig. (2-
sided)
Pearson Chi-Square 2,513a 1 ,113
Continuity Correctionb 1,988 1 ,159
Likelihood Ratio 2,533 1 ,111
Fisher's Exact Test Linear-by-Linear
Association
2,495 1 ,114
N of Valid Cases 137 Figure 22: a. 0 cells (,0%) have expected count less than 5. The minimum expected count is 24,53.
When testing if companies with high growth rate have more e-‐CRM features
implemented than companies with low growth rate no correlation can be
proved. The result shows that, when testing Hypothesis 6, companies with high
growth rate does not have more e-‐CRM features implemented, (Chi-‐2>0.05). The
average growth rate has been calculated the same way as when calculating the
average profitability, quartile calculation and erasing top and bottom 5%. The
quartile calculation gave an average growth rate of 1,3% and the 5% erasing
method gave an average growth rate of 5,2% The result to this hypothesis is
showed in Figure 23 and 24 below.
Chi-Square Tests – Growth rate, average 1,3%
Value df
Asymp. Sig. (2-
sided)
Pearson Chi-Square 4,852a 5 ,434
Likelihood Ratio 6,386 5 ,270
Linear-by-Linear
Association
,973 1 ,324
N of Valid Cases 137 Figure 23: a. 5 cells (41,7%) have expected count less than 5. The minimum expected count is 1,84.

51
Chi-Square Tests – Growth rate, average 5,2%
Value df
Asymp. Sig. (2-
sided)
Pearson Chi-Square 5,395a 5 ,370
Likelihood Ratio 6,663 5 ,247
Linear-by-Linear
Association
,032 1 ,857
N of Valid Cases 137 Figure 24: a. 4 cells (33,3%) have expected count less than 5. The minimum expected count is 1,34.

52
5 Analysis The following chapter will discuss the theories and found research data presented
so far. The analysis will be divided after the researched hypothesis and end with a
overall discussion. After this, the authors will be able to present a conclusion and
answer the purpose of the research.
Hypothesis 1.
H1: Growth oriented enterprises have implemented more e-‐CRM features than
enterprises that aren’t growth oriented.
H0: Growth oriented enterprises have not implemented more e-‐CRM features than
enterprises that aren’t growth oriented.
Smallbone et al. (1995), states that not all small firms are growth oriented which
means they are not focusing their business on financial growth. But he did found
that firms with managers committed to growth are the best performing firms
and actively respond to market opportunities. According to the research, 97% of
the participated enterprises are growth oriented but there is no correlation
found between growth orientation and number of e-‐CRM features implemented,
therefore H1 is rejected. On an average, the participated companies have
implemented 5 e-‐CRM features, which is 12% of the total features available. Even
though the majority of the companies on the Swedish retail market are growth
oriented, obviously they do not focus on e-‐CRM. Micro sized enterprises operate
in a different manner than larger companies because of their restrictions in
financial capacity, level of expertise and their limited impact on their
environment and an implementation of e-‐CRM demands a lot of time, financial
resources and expertise (Gilmore et al., 2007 and Harrigan et al., 2010). This
might show the reason to why the growth-‐oriented companies on this market
not have implemented e-‐CRM very widely. Harrigan et al. (2010) claims that
SMEs and micro enterprises perform CRM-‐like activities intuitively and that
customer communication is the very heart of marketing in these companies. If
the very heart of marketing in SMEs and micro sized is this informal, open and
face-‐to-‐face contact with their customer, they might not have the need of

53
implementing e-‐CRM systems and put all their focus on what their close
customer contact.
Hypothesis 2.
H1: Enterprises where the owner prioritises to maintain current standard of living
have not implemented more e-‐CRM features than enterprises where the owner
don´t prioritise to maintain current standard of living
H0: Enterprises where the owner prioritises to maintain current standard of living
have implemented more e-‐CRM features than enterprises where the owner don´t
prioritise to maintain current standard of living
Gray (2002) presents that smaller firms with owners who prioritise their current
standard of living and therefor they are more concerned with survival than of
growth. In the research it is found that the prioritising of the owner have no
correlation to how many e-‐CRM features that have been implemented in the
company, therefore H1 is rejected. Implementing e-‐CRM demands a lot of time,
financial resources and expertise and SMEs lack of both financial resources and
expertise (Gilmore et al., 2007). As mentioned, the average of e-‐CRM features in
this market is 5 features per company, and the most usual features are email,
telephone number, postal address, bulletin board and company profile, which
concludes that the average web site of clothing retailers are on a ornamental
level (Harrigan et al., 2010). As Gray (2002) states, many small firms are not
focusing on growth but on survival and this might be a possible reason why this
research cannot prove any correlation between the prioritising of the owner and
the number of e-‐CRM features implemented. The risk of implementing e-‐CRM on
a higher level than ornamental might be to high since SMEs and micro sized
companies have a lack of financial resources and of expertise.
In the questionnaire the index of how growth oriented companies is found
through reviewing the theory of Smallbone et al., (1995), Maurer (1996) and
Gray (2002), who all claim that companies that are growth oriented are more
actively responding to market opportunities when it comes to develop new
products and services to existing customers. Gray (2002) states that the growth-‐
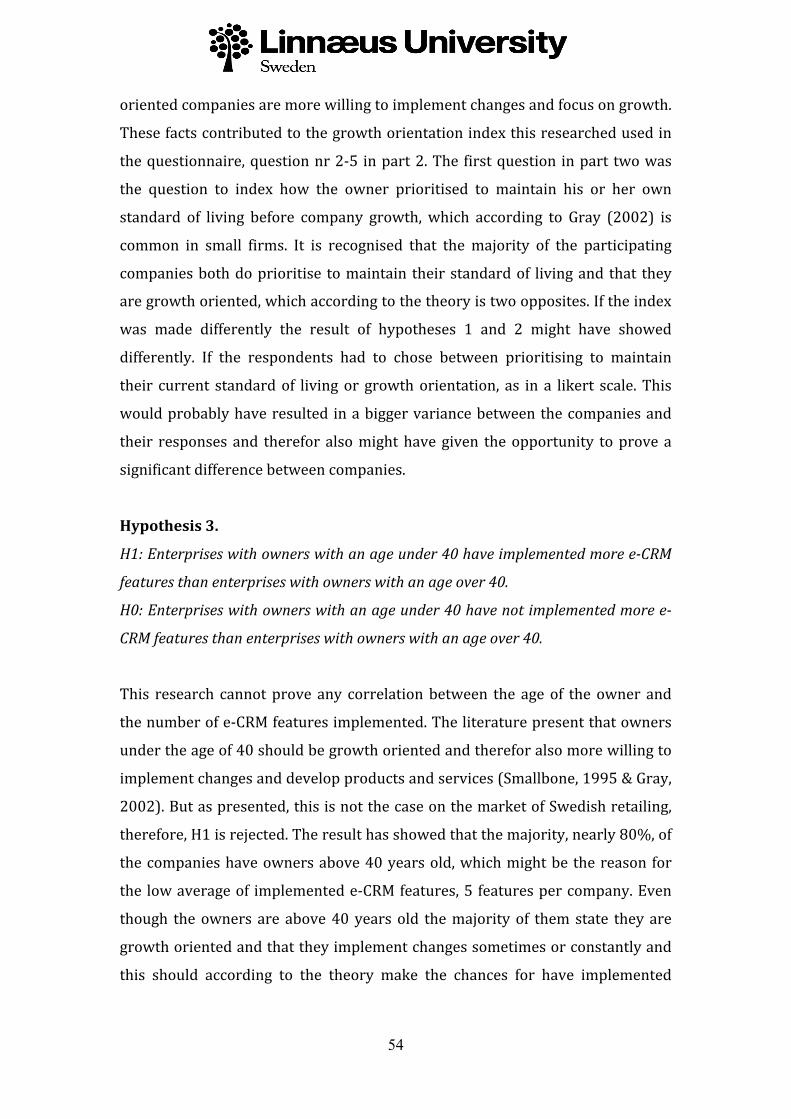
54
oriented companies are more willing to implement changes and focus on growth.
These facts contributed to the growth orientation index this researched used in
the questionnaire, question nr 2-‐5 in part 2. The first question in part two was
the question to index how the owner prioritised to maintain his or her own
standard of living before company growth, which according to Gray (2002) is
common in small firms. It is recognised that the majority of the participating
companies both do prioritise to maintain their standard of living and that they
are growth oriented, which according to the theory is two opposites. If the index
was made differently the result of hypotheses 1 and 2 might have showed
differently. If the respondents had to chose between prioritising to maintain
their current standard of living or growth orientation, as in a likert scale. This
would probably have resulted in a bigger variance between the companies and
their responses and therefor also might have given the opportunity to prove a
significant difference between companies.
Hypothesis 3.
H1: Enterprises with owners with an age under 40 have implemented more e-‐CRM
features than enterprises with owners with an age over 40.
H0: Enterprises with owners with an age under 40 have not implemented more e-‐
CRM features than enterprises with owners with an age over 40.
This research cannot prove any correlation between the age of the owner and
the number of e-‐CRM features implemented. The literature present that owners
under the age of 40 should be growth oriented and therefor also more willing to
implement changes and develop products and services (Smallbone, 1995 & Gray,
2002). But as presented, this is not the case on the market of Swedish retailing,
therefore, H1 is rejected. The result has showed that the majority, nearly 80%, of
the companies have owners above 40 years old, which might be the reason for
the low average of implemented e-‐CRM features, 5 features per company. Even
though the owners are above 40 years old the majority of them state they are
growth oriented and that they implement changes sometimes or constantly and
this should according to the theory make the chances for have implemented

55
more e-‐CRM features higher, but not according to the results of this research,
therefore H1 is rejected.
Hypothesis 4.
H1: Enterprises with openness to changes have implemented more e-‐CRM features
than enterprises that aren’t open to changes.
H0: Enterprises with openness to changes have not implemented more e-‐CRM
features than enterprises that aren’t open to changes.
The research haven’t been able to prove any correlation between how willing a
company is to implement changes and how many e-‐CRM features a company
carry on their web site, H1 is therefore rejected. What has been proved is that
companies in this market claim to be open-‐minded to changes, approximately
80% of the participating companies state that they implement changes
sometimes or constantly. Still the average of e-‐CRM features on a web site is 5
features. Tereso and Bernadino (2011) states that smaller companies don’t have
the same understanding about CRM in general as bigger companies do and they
are also limited in to use the same complex software as bigger companies
according to Harrigan et al. (2010). These facts might shed light on that these
companies apply changes on other things than developing their Internet services
by e-‐CRM systems. It could be that they develop their absolute core competence,
their informal and close relationship to customers as claimed by Triversity
(2001). Gray (2002) presents that smaller companies are more resistant to
changes than larger companies, the opposite is found by this research where
80% of the participants state they implement changes sometimes or constantly,
but still there is no correlation between willingness to implement changes and
implementing more e-‐CRM features. Which might be because the companies, as
said, put their focus on changing other things than their Internet presence.
Even though the research did take the precaution of avoiding biases by doing a
pilot study this questioned could have resulted differently if the question was
expressed even more clearly. The question in the questionnaire explains changes
as new marketing channels, new technologies, new routines etc. If the changes

56
were expressed more clearly as for example as changes with the purpose to seize
new market opportunities and changes that aren’t necessary for all actors in the
market the result might have turned out differently. These kinds of changes are
what Smallbone et al., (1995) and Gray (2002) explains in their researches.
There might have been that the respondents in this research have answered with
the thought of changes as new collection or minor adjustments in their shops,
which were not the changes meant by the researches.
Hypothesis 5.
H1: Enterprises with high profitability have implemented more e-‐CRM features
than those enterprises with low profitability.
H0: Enterprises with high profitability have not implemented more e-‐CRM features
than those enterprises with low profitability.
This research has statistically proved that companies with high profitability have
not implemented more e-‐CRM features than companies with lower profitability,
therefore H1 is rejected. In fact, when studying the chi-‐square test the opposite is
proved, that companies with lower profitability have implemented more e-‐CRM
features. This call for reasoning about that e-‐CRM can be used as a tool to get
more profitable as a company, still that isn’t proved. The companies with already
high profitability rate might have no need of developing their web site with e-‐
CRM features. The benefits of e-‐CRM is said to be improved processes, reduced
marketing costs, increased sales and improved customer perception, which all
would, if successful, gain a better profitability (Adebanjo, 2008). As mentioned,
where profitability rate is tested against how many e-‐CRM features is
implemented we can prove a correlation and that companies with higher
profitability have not implemented more e-‐CRM features, but that companies
with profitability below average has. The reason for how many e-‐CRM features is
implemented in a company might not be found in how growth oriented the
owner is, how willing the owner is to implement changes or which age the owner
has but how the company is financially going. And companies with profitability
below average have implemented e-‐CRM in a higher extend with the intention to
gain a higher profitability in the future.

57
Hypothesis 6.
H1: Enterprises with high growth rate have implemented more e-‐CRM features
than enterprises with low growth rate.
H0: Enterprises with high growth have not implemented more e-‐CRM features than
enterprises with low growth.
This research cannot prove any correlation between companies with a high
growth rate and number of implemented features, therefore H1 is rejected.
According to Gray (2002), growth orientation is linked to actual growth and
companies, which are growth oriented, are more actively responding to market
opportunities. According to the result of this research, neither companies who
sees themselves as growth oriented or have a higher growth rate are more open
to implement e-‐CRM. Of the companies participating in this research, the
majority has a growth rate below the mean value. Although, almost every one
sees themselves as growth oriented. As this result shows, and to the opposite of
what the theory states, there is no link to growth orientation and actual growth
for the companies.
5.1 Overall analysis The result has showed that in all but one hypothesis no correlation can be
proved. The only correlation that can be proved is that companies with high
profitability have not implemented more e-‐CRM features than companies with
low profitability, but that companies with low profitability have implemented
more e-‐CRM features. If e-‐CRM systems are implemented successfully a company
can await to benefit from improved processes, reduced costs, improved
customer perception and increased sales (Adebanjo, 2008). What the research
has found is that the companies with lower profitability are the ones with more
implemented features, and also when comparing the number of companies
having any features at all to the ones with none, the companies with lower
profitability are statistically proved to have more companies with e-‐CRM
features at all, which is shown in figure 19 and 20. It could be that companies
with lower profitability use e-‐CRM as a tool to achieve the above mentioned

58
benefits and by that raise their profitability. With an already satisfactory
profitability rate no demand of developing e-‐CRM is born, because it is said in the
theory that it is demanding time, expertise and money to implement e-‐CRM
systems (Gilmore et al., 2007). It could be that the only variable describing the
willingness to implement e-‐CRM systems, and according to this result it is
obviously, is the profitability rate of the company and the implementation is
used as a cure to low profitability. Gray (2002) and Smallbone et al. (1995) both
present that owners who are growth oriented, willing to implement changes and
under 40 years old are more likely to develop existing products and services for
existing customers. But maybe another incentives is needed and that, according
to this research, might be a low profitability rate or the companies of this
research have developed other products and services than their web sites and e-‐
CRM systems. This reasoning is likely because it is said that the heart of
marketing in small companies is their close, open and informal communication
with their customers (Harrigan et al., 2010).
Overall, the respondents with a web site and e-‐CRM features are more or less
satisfied with their Internet presence and therefor with their level of e-‐CRM
features. The average number of features of the companies with an web site is 9
features, and the most used features are e-‐mail, telephone number, postal
address, bulletin board, social media, store finder, company profile and product
information, including photos, price, colours, and size. Since these features
represent both contact information, product information and some customer
interaction elements the websites can be seen as to be on an relational level
according to Harrigan et al., (2010). But this is just the fact for the companies
that have a web site at all, for the average of the whole sample the mostly used
features are e-‐mail, telephone, postal address, company profile and bulletin
board. Which according to Harrigan et al., (2010) makes the level of the web site
an ornamental with some relational elements. Since both the average of the
companies with websites and the average of the whole population carries some
relational elements that’s might be why the companies in this market are more
or less satisfied with their Internet presence and e-‐CRM implementation, still not
using that many of the available features. Harrigan et al., (2010) claims that
59
smaller companies tend to perform e-‐CRM in a simplified way compared to large
companies, due to their lack of resources and expertise. Since social medias are
free of charge to use it can be seen as a simplified way of interacting with
customers and therefor fits and satisfies the smaller companies demands of their
Internet presence.
The numbers of companies with an website is 81 out of 137, and of these 81
companies 33% are satisfied (answer 4 or 5 in question 8 of the questionnaire)
and 53% are have answered with a three on the likert scale, which is decoded to
be neither unsatisfied nor absolutely satisfied. Even though no exploration of
what underlying factors determine how many e-‐CRM features are used by the
companies in the retail market, many of the companies are satisfied and the
majority is neither unsatisfied nor absolutely satisfied, which can be interpreted
as more or less satisfied. What also seen is that the companies with more than 9
features have a bigger share of companies that are quite satisfied or more than
among the companies with less than 9 features. This concludes that the
companies of this market are more or less quite satisfied with their level of e-‐
CRM features usage and presence on the Internet, and the more features that are
implemented the more likely a company is to be quite satisfied or more.

60
6 Conclusion In this chapter, the authors will summarise the final conclusion of the research and
answer to the studied purpose. The conclusion is derived from theories used to
explain the subject, empirical data investigated by the authors and the analysis,
where a discussion was made to finalise the result.
The purpose of this research was to describe how far micro sized companies on
the Swedish market of retailing have implemented e-‐CRM and explore what
factors that can describe their e-‐CRM adoption. This research can conclude that
micro sized retailers on the Swedish market have, in average, implemented 5 e-‐
CRM features per company. This is a total of 12 % of the total e-‐CRM features
explored for this research. Although, if only referring to those companies with
any implementation at all, this number adds up to 9 features per company and
21 % of the total 43 features. Even though the implementation has not reached
its full potential on the market, retailers are generally more or less satisfied with
their number of e-‐CRM features and performance, and by that, their
implementation. As mentioned, the informal and face-‐to-‐face contact is
important for micro sized retailers, and this might be the reason to why they
keep their implementation of e-‐CRM features on this level, which might be seen
as low. With this said, the research can suggest that the most common e-‐CRM
features used for micro retailers are e-‐mail, telephone number, postal address,
bulletin board, social media presence, store finder and company profile.
Companies with a profit rate below market average are more likely to have
implemented more e-‐CRM features than others. This can be that companies with
a low profit rate implement e-‐CRM features with the purpose to increase their
profit in the future. Retailers with already a higher profit rate might only
concentrate on their informal contact with their customers. The reason for how
many e-‐CRM features is implemented in a company cannot be found in how
growth oriented the owner is, how willing the owner is to implement changes,
which age the owner has or their willingness to maintain current standard of
living, but how the company is financially going. This concludes that the only
found factor that can explain how many e-‐CRM features that a company have
implemented is their profitability, and that factor explains that a company with a
profitability rate below market average have implemented more e-‐CRM features.

61
7 Further research and self-criticism In this chapter, the authors will propose suggestions for further research as well as
comments on what can be developed in the research that has been presented.
When doing the pilot study we hoped to ensure that the empirical data would be
free of biases. But after the data collection was executed we suspect that’s not
the case. When trying to find out if the respondent were prioritising to maintain
his or her current standard of living before company growth or that company
growth was the priority of the respondent we suspect we have faced some
biased answers, which might have led to the results.
We had structured the interviews with one question correlating to if the owner
was prioritising to maintain his or her current standard of living and four
questions that would answer if they were growth oriented. The questions to
answer if financial growth were prioritised can have been interpreted as obvious
answers by the respondents. The questions were if they wanted to increase their
profit, increase their sales, innovate new products and services and how often
they implement changes. Even if the respondent answered that they prioritise
their current standard of living before company growth the following questioned
might have been interpreted as tools to achieve the priority of maintaining their
current standard of living. Instinctively, profit and sales are something every
company needs to pay bills, salaries and every other expense there are in a
company. The question of how often changes are implemented is felt, after the
study is done, that its also interpreted wrong. Some answered they implemented
changes sometimes or often and referred to changes as new collection every
season, redecorating the shopping windows of the store etc., and changes that
are essential for companies in this business to stay alive and not changes that
show that they pursue new market opportunities. This happened even though
we explained changes as for example new technologies, new marketing channels,
new routines etc. We believe that the result might would have shown differently
if we would have managed to separate the companies in this two strategically
focuses and believe that would have been possible if a likert scale would have
been used. A single likert scale with the question of what do you, as an owner,
62
prioritise the most, either to maintain your current standard of living or financial
growth of the company and the respondents answer by giving a number between
for example 1 to 5, where 1 refers to standard of living and 5 refers to financial
growth. Its believed that if the questionnaire was executed this way the result
might have showed differently and might have been giving more satisfying data
to explore the factors determining how well e-‐CRM is performed.
Question 6 and 7 in part two has not been a part of the analysis discussion as
these questions has nothing to do with the answer of the purpose. This is
something we did know from the beginning and also has explained. The reason
for these questions was to develop the discussion in the analysis, which we
found out was not necessary.
The results could also be strengthening if the research took a non-‐response
analysis into account. But due to time limitations, this was not possible, but
something we do recommend if the research is performed again.

63
References Articles Adebanjo, D. (2008) ”E-CRM Implementation: A comparison on three approaches”. 4th IEEE international Conference on Management of Innovation and Technology. 2008. Pp 457-462. Alshawi, S., Missi, F. and Irani, Z. (2009) “Organisational, technical and data quality factors in CRM adoption – SMEs perspective”. Industrial Marketing Management. Vol, 40, 2011. Pp, 376-383. Ang, L. and Buttle, F. (2006) “Managing For Successful Customer Acquisition: An Exploration”. Journal of Marketing Management. Vol, 22. No, 3-4. Pp, 295-317. Anton, J. and Postmus, R. (1999). “The CRM performance index for web based customer relationship management”. Center for Customer Driven Quality, Purdue University. Available at: www.benchmarkportal.com. Ashouri, A. and Faed, A. (2010) ”The Impact on Multichannel Customer Management on e-CRM”. 2010 Fourth UKSim European Symposium on Computer Modeling and Simulation. 2010. Pp 183-187. Bhanu, F. and Magiswary, D. (2010) ”Electronic Customer Relationship Management System (E-CM): A knowledge management perspective”. International Conference on Education and Management Technology. 2010. Pp 409-413. Boulding, W., Staelin, R., Ehret, M. and Johnston, J.W. (2005) “A customer relationship management roadmap: What is known, potential pitfalls, and where to go”. The journal of marketing. Vol. 69, No. 4. 2005. Pp 155-166. Bradshaw, D. and Brash, C. (2001) "Managing customer relationships in the e-business world: how to personalize computer relationships for increased profitability". International Journal of Retail & Distribution Management. Vol. 29. No. 12. Pp. 520-530. Brindley, C. and Ritchie, B. (2005) ”Cultural determinations of competitiveness within SMEs”. Journal of Small Business and Enterprise Development. Vol. 12, No. 1. 2005. Pp 104-119. Brodie, R.J., Coviello. N.E., Brookes, R.W. and Little, V. (1997) "Towards a paradigm shift in marketing? An examination of current marketing practices". Journal of Marketing Management. Vol. 13, No.5. Pp 383-406. Bull, C. (2003) “Strategic issues in customer relationship management (CRM) implementation”. Business Process Management. Vol. 9, No.5. 2003. Pp, 592-602. Chang, H.H. (2007) “Critical factors and benefits in the implementation of customer

64
relationship management”. Total quality management. Vol. 18, No. 5. 2007. Pp 483-508. Chen, R.H., Lin, R.J. and Yang, P.C. (2011) ”The relationship between eCRM, innovation and Customer value-An Empirical Study”. International Summer Conference of Asia Pacific Business Innovation and Technology Management. 2011. Pp 299-302. Coviello, N.E., Brodie, R.J., Danaher, P.J. and Johnston, W. (2002) “How firms relate to their markets: An empirical examination of contemporary marketing practices”. Journal of Marketing, Vol. 66, No 3. Pp 33–46. Du Plessis, M. and Boon, A.J. (2004) “Knowledge management in e-business and customer relationship management: South African case study findings”. International Journal of Information Management. 2004. Vol, 24. No, 1. Pp, 73–86. Fayerman, M. (2002) “Customer Relationship Management”. New Directions for Institutional Research. No. 113, 2002. Pp, 57-67. Feinberg, R.A., Hokama, L., Kadam, R. and Kim, I. (2002) ”The state of electronic customer relationship management in retailing”. International Journal of Retail and Distribution Management. Vol. 30, No. 10. 2002. Pp 470-481. Finnegan, D.J. and Currie, W.L. (2010) “A multi-layered approach to CRM implementation: An integration perspectibe”. European Management Journal. Vol. 28, No. 2, 2010. Pp 153-167. Gilmore, A., Gallagher, D. and Henry, S. (2007) “E-marketing and SMEs: operational lessons for the future”. European Business Review. Vol, 19. No, 3. Pp, 234-247. Gray, C. (2002) “Entrepreneurship, resistance to change and growth in small firms”. Journal of Small Business and Enterprise Development. Vol 9. No, 1. 2002. Pp. 61-72. Grönroos, C. (1994) “From marketing mix to relationship marketing: Towards a paradigm shift in marketing”. Management decision. Vol. 32, No. 2. 1994. Pp 4-20. Grönroos, C. (1994) “Quo Vadis, Marketing? - Toward a Relationship Marketing Paradigm”, Journal of Marketing Management. Vol. 10, Pp, 347-360. Gummesson, E. (2002) “Relationship Marketing in the New Economy”. Journal of Relationship Marketing. 2002. Vol. 1, No. 1. Pp. 37-57. Harrigan, P., Ramsey, E. and Ibbotson, P. (2010) ”Critical factors underpinning the e-CRM activities in SMEs”. Journal of Marketing Management. Vol. 27, No. 5-6. 2011. Pp 503-529.

65
Holmlund, M. and Kock, S. (1996) "Relationship marketing: the importance of customer-perceived service quality in retail banking". Service Industrial Journal. Vol. 16, No.3. Pp 287-304. Hutton, G. and Fosdick, M. (2012) “The globalization of social media; Consumer relationships with branss evolve in the digital space”. Journal of advertising research. Vol.51, No. 4, Pp. 564-570. Jagdish, N.S. and Parvatiyar, A. (1995) “The Evolution of Relationship Marketing”. International Business Review. Vol, 4, No, 4. 1995. Pp, 397-418. Keh, H.T., Nguyen, T.T.M. and Ng, H.P. (2001) ”The effects of entrepreneurial orientation and marketing information on the performance of SMEs”. Journal of Business Venturing. Vol. 22, No. 4. 2007. Pp 592-611. King, S.F. and Burgess, T.F. (2008) “Understanding success and failure on customer relationship management”. Industrial Marketing Management. Vol. 37. 2008. Pp. 421-431. Kim, J.H. and Lennon, S.J. (2009) “Effects of web site atmospherics on consumer responses: music and product presentation” Direct Marketing An International Journal. Vol. 3. No. 1. 2009. Kimiloglu, H. and Zarali, H. (2009) “What signifies success in e-CRM?”. Marketing Intelligence & Planning. Vol. 27. No. 2. 2009. Pp. 246-267. Lee-Kelley, L., Gilbert, D. and Mannicom, R. (2003) “How e-CRM can enhance customer loyalty”. Marketing Intelligence & Planning. 2003. Pp, 239-248. Light, B. (2001) “A review of the issues associated with customer relationship management systems”. Proceedings of the 9th European Conference on Information Systems. Pp, 1232-41. McCarthy, E.J. (1960) “Basic Marketing: A Managerial Approach”, Richard D. Irwin, Inc., Homewood, IL. 7:th edition. McKie, S. (2000), “Customer role management”. Planet IT. 2000. Ostroff, F. and Smith, D. (1992) “The Horizontal Organization”. The McKinsey Quarterly. No. 1. Pp. 148-168. Padmanabhan, B. and Tuzhilin, A. (2003) ”On the Use of Optimization for Data Mining: Theoretical Interactions and e-CRM Opportunities”. Management Science. Vol. 49, No. 10. 2003. Pp 1327-1343. Pan, S.L. and Lee, J-N. (2003) “Using e-CRM for a Unified View of the Customer”- Communications of the ACM. 2003. Vol, 46. No, 4. Pp, 95-99. Payne, A. and Frow, P. (2005) “A strategic framework for customer relationship

66
management”. The journal of marketing. Vil. 69, No. 4. 2005. Pp 167-176. Payne, A. and Frow, P. (2006) “Customer relationship management: fro, strategy to implementation”. Journal of marketing management. Vol. 22. No1-2. 2006. Pp 135-168. Peppard, J. (2000) “Customer relationship management (CRM) in financial services”. European Management Journal. Vol. 18, No. 3. Pp. 312-27. Ramdani, B., Kawalek, P. and Lorenzo, O. “Predicting SMEs adoption of enterprise system”. Journal of Enterprise Information Management. Vol. 22. No. 1. 2009. Pp. 10-24. Reinartz, W., Krafft, M. and Hoyer, W.D. (2004) “The Customer Relationship Management Process: Its Measurement and Impact on Performance”. Journal of Marketing Research. Vol. 41. Pp. 293-305. Rocha, À. (2012) "Framework for a Global Quality Evaluation of a Website". Online Information Review. Vol. 36. No. 3. Pp. 3. Ryals, L. and Payne, A. (2001) “Customer relationship management in financial services: towards information-enabled relationship marketing”. Journal of Strategic Marketing. Vol. 9. No. 1. 2001. Pp. 3-27. Rygielski, C., Wang, J-C. and Yen, D.C. (2002) “Data mining techniques for customer relationship management”. Technology in Society. Vol. 24. 2002. Pp. 483-502. Seock, Y-K. and Norton, M. (2007) “Capturing college students on the web: analysis of clothing web sites attributes”. Journal of fashion marketing and management. Vol. 11. No. 4. Pp. 539-552. Sheth, J.N. and Parvatiyar, A. (1995) “The evolution of relationship marketing”. International business review. Vol. 4, No. 3. Pp 397-418. Smallbone, D., Leigh, R. and North, D. (1995) “The characteristics and strategies of high growth SMEs”. International Journal of Entrepreneurial Behaviour & Research. Vol. 1. No. 3, 1995.pp. 44-62. Sureshkumar, D. and Palanivelu, P. (2011). “Perception of Value e-CRM Features”. SCMS Journal of Indian Management. Vol. 8. No. 2. 2011. Pp. 106-111. Tereso, M. and Bernardino, J. (2011) “open source CRM system for SMES”. International Journal of Managing Information Technology. Vo. 3. No. 4. 2011. Pp 4-56. Triversity. (2001) ”Navigating a CRM journey”. Special advertising supplement, Store Magazine. 2001. Webster, F. (1992) “The changing role of marketing in the corporation”. Journal of

67
marketing. Vol 56. Pp 1-17. Xu, Y., Yen, D.C. Lin, B. and Chou, D.C. (2002) “Adopting customer relationship management technology”. Industrial management and data system. Vol 102, No. 8. Pp. 442-452. Yang, X., Ahmed, Z., Ghingold, M., Boon, G.S., Mei, T.S. and Hwa, L.L. (2003),"Consumer preferences for commercial Web site design: an Asia-Pacific perspective". Journal of Consumer Marketing Vol. 20. No. 1. Pp. 10 - 27. Yanhua, W. and Shaojie, Z. (2008) “System design customer relationship management system of small and medium-sized wholesale and retail enterprises”. International symposium on knowledge acquisition and modeling. Pp 789-793. Zablah, A.R., Bellenger, D.N. and Johnston, W.J. (2004) “Customer relationship management implementation gaps”. Journal of Personal Selling & Sales Management. Vol 14, No 4. Pp 279-95. Zineldin, M. and Philipson, S. (2007) “Kotler and Borden are not dead: myth of relationship marketing and the truth of the 4Ps”. Journal of Consumer Marketing. Vol, 24, No, 4, 2007. Pp, 229-241. Books Brinkmann, S. and Kvale, S. (2009) Den kvalitative forskningsintervjun. Lund. Studentlitteratur. 2:nd edition. Bryman, A. and Bell, E (2005) Företagsekonomisk forskningsmetod. Malmö. Liber ekonomi. Creswell, W. J. (2009) Research design Qualitative, Quantitative and Mixed Method Approach. California. SAGE Publications, Inc. 3rd edition. Edling, C. and Hedström, P. (2003) Kvantitativa metoder- Grundläggande analysmetoder för samhlls- och beteendevetare. Lund. Studentlitteratur. ISBN- 9144041578. Eliasson, A. (2010) Kvantitativ metod från början. Lund. Studentlitteratur. 2:nd edition. Eneroth, B. (1979) Kvalitativ metod för samhällsvetenskaplig forskning. Stockholm. Akademilitteratur. ISBN- 91-7410-078-5. Grønmo, S. (2006) Metoder i samhällsvetenskap. Malmö. Liber AB. 1st edition Halvorsen, K. (1998) Samhällsvetenskaplig metod. Lund. Studentlitteratur.
68
Jacobsen, D. (2002) Vad, hur och varför? Om metodval i företagsekonomi och andra samhällsvetenskapliga ämnen. Lund. Studentlitteratur. 10th edition. Johannessen, A. and Tufte, P.E (2003) Introduktion till samhällsvetenskaplig metod. Malmö. Liber AB. Newell, F. (2000) Customer Relationship Management in the New Era of Internet Marketing, New York NY. McGraw-Hill. Starrin, B. and Svensson, P.G. (1994) Kvalitativ metod och vetenskapsteori. Lund. Studentlitteratur. Internet sources http://www.ekonomifakta.se - 2012-02-12 http://europa.eu/legislation_summaries/enterprise/business_environment/n26026_en.htm - 2012-03-11 http://www.ne.se/lang/detaljhandel - 2012-03-11 http://www.ssd.scb.se/databaser/makro/Visavar.asp?yp=dkoqgv&xu=C3352001&huvudtabell=LE0108T08&deltabell=03&deltabellnamn=1%2E+Tillg%E5ng+till+IT%2Dutrustning+och+Internet+i+hemmet+f%F6r+personer+i+%E5ldern+16%2D74+%E5r+efter+k%F6n+och+%E5lder%2E+%C5r&omradekod=LE&omradetext=Levnadsf%F6rh%E5llanden&preskat=O&innehall=Datoranv1&starttid=2003&stopptid=2011&Prodid=LE0108&fromSok=&Fromwhere=S&lang=1&langdb=1 - 2012-03-11
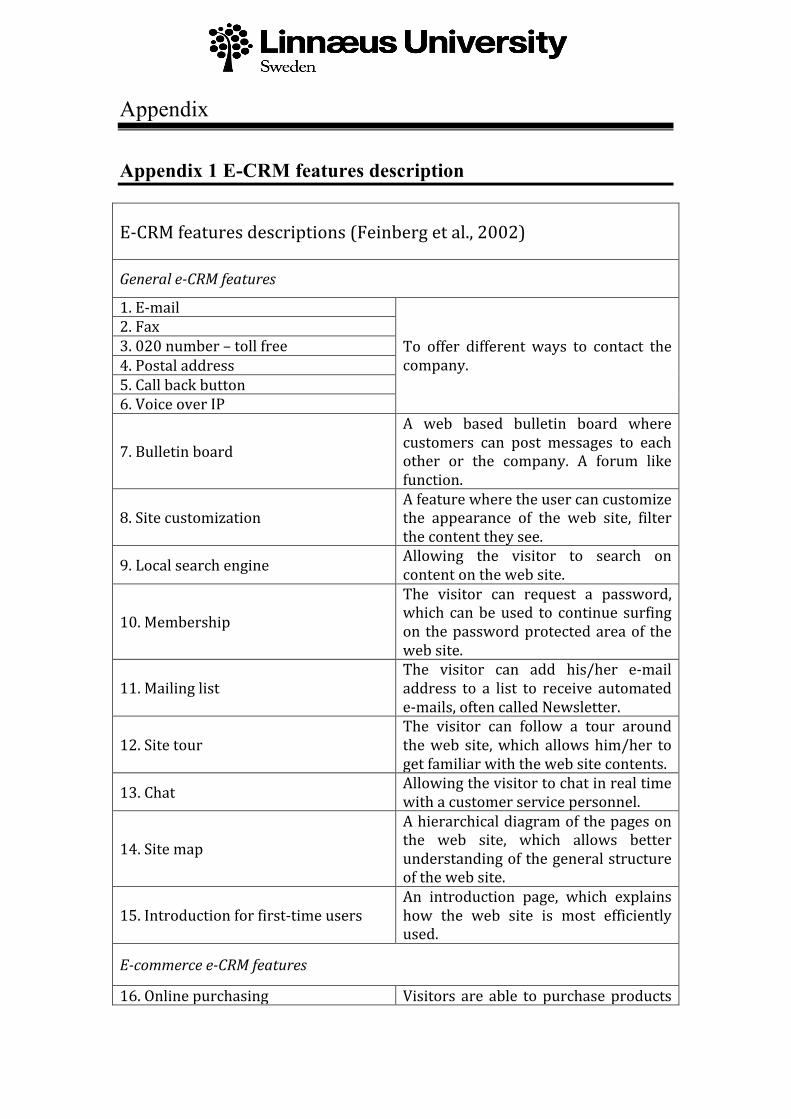
Appendix
Appendix 1 E-CRM features description
E-‐CRM features descriptions (Feinberg et al., 2002)
General e-‐CRM features
1. E-‐mail
To offer different ways to contact the company.
2. Fax 3. 020 number – toll free 4. Postal address 5. Call back button 6. Voice over IP
7. Bulletin board
A web based bulletin board where customers can post messages to each other or the company. A forum like function.
8. Site customization A feature where the user can customize the appearance of the web site, filter the content they see.
9. Local search engine Allowing the visitor to search on content on the web site.
10. Membership
The visitor can request a password, which can be used to continue surfing on the password protected area of the web site.
11. Mailing list The visitor can add his/her e-‐mail address to a list to receive automated e-‐mails, often called Newsletter.
12. Site tour The visitor can follow a tour around the web site, which allows him/her to get familiar with the web site contents.
13. Chat Allowing the visitor to chat in real time with a customer service personnel.
14. Site map
A hierarchical diagram of the pages on the web site, which allows better understanding of the general structure of the web site.
15. Introduction for first-‐time users An introduction page, which explains how the web site is most efficiently used.
E-‐commerce e-‐CRM features
16. Online purchasing Visitors are able to purchase products

or services online.
17. Product information online Product information is available on the web site.
18. Product customization The visitor is able to customize the product or service before purchasing it, online. Not only choose colour.
19. Purchase conditions
All conditions concerning shipping policies, return policies, warranty, guarantee and other company commitments can be viewed on the web site.
20. Product preview The customized product can be viewed in a motion picture or demo before purchase.
21. Links Allows the visitor to link to complementary products from other companies.
Post-‐sales support e-‐CRM features
22.FAQ Frequently asked questions and answers to these are available for the visitor.
23. Problem solving The customer can solve problems with products or services themselves through an online self-‐help service.
24. Complaining ability The customer can complain and detail problems on a specific area on the web site.
25. Spare parts The customer is offered to order spare parts and complementary products online.
19 additional features found in Seock and Norton (2007), Yang et al., (2003), Rocha (2012), Kim, Kim and Lennon (2009), Bradshaw & Brash (2001) and Feinberg et al., (2002). 26. Price The price is presented.
27. Up-‐to-‐date information Information about products and services are updated. Stock status, price changes etc.
28. Size The available sizes are presented 29. Colours The available colours are presented
30. Quality photos
Photos of products are in good quality, which means that the customer can easily see what features the product carries.
31. Sales assistance There are guides of how to purchase goods on the site.
32. Order tracking When good is ordered the customer is able to track where the good are in the

process of getting delivered.
33. Privacy policy The company presents its privacy policy containing information about how it uses the customer information
34. Purchase security
The web site offers safe payment methods and secures that credit card information is treated security. Can be detected through well known and respected payment organisations like VISA/MasterCard, PayPal, Payson etc.
35. Delivery in suitable time
Subjective. But if it’s longer than the normal delivery time, which in this case seems to be between 2-‐5 days, it is not suitable time.
36. always available for business The web site is never closed for ordering
37. Telephone number The company telephone number, not toll free, is presented
38. Apparel on models The clothes are photographed on models
39. Find store The web site provides a map of how to find the company store
40. Customer account information The account information can be showed and changed
41. Company profile The company presents its company on a page of the site
42. social media presence The company is present on a social media such as Facebook, Twitter, Tumblr etc.
43. Benefits for members The members of the site are offered benefits like discounts, invitation to events etc.

Appendix 2 Additional features with references This review discussed in the e-‐CRM chapter in the theory adds up to 18
additional features, which are listed below with references:
Feature Reference
Price Seock and Norton (2007)
Up-‐to-‐date information Seock and Norton (2007)
Size Seock and Norton (2007)
Colors Seock and Norton (2007)
Quality Photos Seock and Norton (2007)
Sales assistance Seock and Norton (2007)
Order tracking Seock and Norton (2007) and Feinberg et al.
(2002)
Privacy policy Yang et al. (2003), Feinberg et al. (2002) and
Rocha (2012)
Purchase security Yang et al. (2003) and Rocha (2012)
Delivery in suitable time Rocha (2012)
Always available for business Rocha (2012)
Apparel on models Kim and Lennon (2009)
Find stores Feinberg et al. (2002)
Customer account information Feinberg et al. (2002)
Company profile Feinberg et al. (2002)
Benefits for members Feinberg et al. (2002)
Telephone number Bradshaw and Brash (2001)
Social Media Presence Hutton and Fosdick (2011)
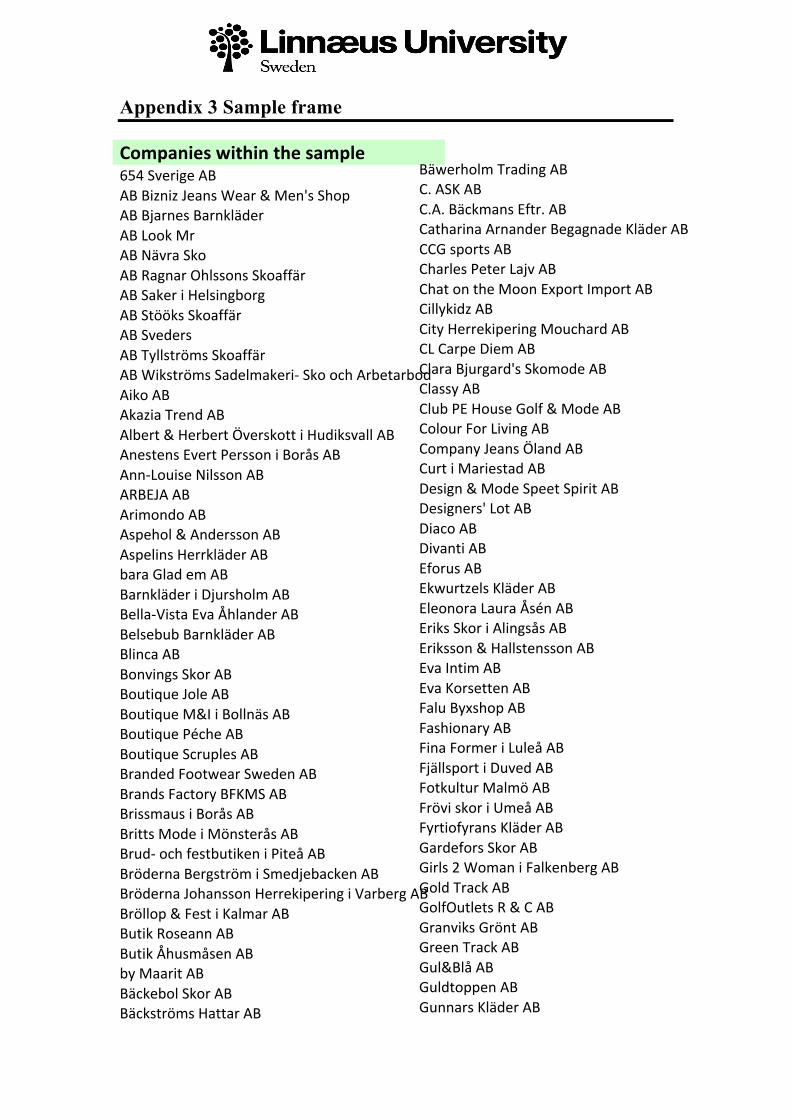
Appendix 3 Sample frame Companies within the sample 654 Sverige AB AB Bizniz Jeans Wear & Men's Shop AB Bjarnes Barnkläder AB Look Mr AB Nävra Sko AB Ragnar Ohlssons Skoaffär AB Saker i Helsingborg AB Stööks Skoaffär AB Sveders AB Tyllströms Skoaffär AB Wikströms Sadelmakeri-‐ Sko och Arbetarbod Aiko AB Akazia Trend AB Albert & Herbert Överskott i Hudiksvall AB Anestens Evert Persson i Borås AB Ann-‐Louise Nilsson AB ARBEJA AB Arimondo AB Aspehol & Andersson AB Aspelins Herrkläder AB bara Glad em AB Barnkläder i Djursholm AB Bella-‐Vista Eva Åhlander AB Belsebub Barnkläder AB Blinca AB Bonvings Skor AB Boutique Jole AB Boutique M&I i Bollnäs AB Boutique Péche AB Boutique Scruples AB Branded Footwear Sweden AB Brands Factory BFKMS AB Brissmaus i Borås AB Britts Mode i Mönsterås AB Brud-‐ och festbutiken i Piteå AB Bröderna Bergström i Smedjebacken AB Bröderna Johansson Herrekipering i Varberg AB Bröllop & Fest i Kalmar AB Butik Roseann AB Butik Åhusmåsen AB by Maarit AB Bäckebol Skor AB Bäckströms Hattar AB
Bäwerholm Trading AB C. ASK AB C.A. Bäckmans Eftr. AB Catharina Arnander Begagnade Kläder AB CCG sports AB Charles Peter Lajv AB Chat on the Moon Export Import AB Cillykidz AB City Herrekipering Mouchard AB CL Carpe Diem AB Clara Bjurgard's Skomode AB Classy AB Club PE House Golf & Mode AB Colour For Living AB Company Jeans Öland AB Curt i Mariestad AB Design & Mode Speet Spirit AB Designers' Lot AB Diaco AB Divanti AB Eforus AB Ekwurtzels Kläder AB Eleonora Laura Åsén AB Eriks Skor i Alingsås AB Eriksson & Hallstensson AB Eva Intim AB Eva Korsetten AB Falu Byxshop AB Fashionary AB Fina Former i Luleå AB Fjällsport i Duved AB Fotkultur Malmö AB Frövi skor i Umeå AB Fyrtiofyrans Kläder AB Gardefors Skor AB Girls 2 Woman i Falkenberg AB Gold Track AB GolfOutlets R & C AB Granviks Grönt AB Green Track AB Gul&Blå AB Guldtoppen AB Gunnars Kläder AB

GVF Good Value Fashion AB Gårdsbutiken Stallet AB Haglunds Mode AB HALIX i Stockholm AB Hamburgsunds Sko AB Hamre Ridsport AB Hans Nyström Skoaffär AB Harry Christiansson i Skene AB Henses Herrmode AB Hornspuckeln AB Insolo minor AB Irene Philippa i Göteborg AB J.G. Andersson, Garvarns AB Jab-‐Er i Uppsala AB JB:s Herr AB Jeans Factory AB Jeansgruvan AB Jeansterminalen i Luleå AB JF Möller AB Ji-‐Sko AB JM Öland AB JMR Fashion AB Johansson Company Young Fashion AB Kajsas Mode i Götene AB Kalendegatan 28 Fashion AB Kalix Outlet AB Kandelaria AB Katarina Fungdal AB Kids & Teens i Kalix AB Kjellbergs Skor AB Klaba Textil AB Klåva Modebutik AB Klädextra i Lunde AB Klädlagret Redbergslid AB Klädpiraten AB Knulp Sko AB Kurvans Sport AB Kvinns Skor i Tranås AB Kåges Herr AB L. W. Danielsson AB La Placa AB LaCaMi AB Lawinett Mode i Småland AB Lena Kasper AB Lilla W AB Lise J Mode & Present AB
Liten & Fin i Motala AB Look & like Mode AB Losell Fashion AB LS Brodin AB Lykkemaja AB Lönn Kläder AB Magasin 28 AB Mamsen & MaLou AB Mariestads Herrmode AB Mathildas Fönster AB Mats Konfektyr AB Matz Skor AB Michael Wiklander i Östersund AB Millie Wojcicki i Helsingborg AB Miss Elly AB MMRetail AB Modehuset Chic i Oskarshamn AB Modehuset Garantipäls AB Modehuset Labelle AB Morris Home Department AB Mos Vestis & Eventus AB Märkeshuset i Älmhult AB Nemi Mitchell AB New Look Boutique i Osby AB Nils Englunds Skor AB Nils-‐Olovs Sport AB Ninve's Jeans & Wear Co AB Norstedt Eftr. AB Now Mode i Upplands-‐Väsby AB Nya Wacko Skinnmode AB Oggio AB Olivia och Oliver i Lund AB Olsson & Hogengård AB Ottilias underverk AB P A Plummer Productions AB PAL Enterprises AB Par shoes i Höllviken AB Personell -‐ The Outdoorwear Shop AB Peter Östlund AB PH's Yrkeskläder AB Primavera Collection AB Primo Kläder AB PROMERA YRKESKLÄDER AB Päls AB Hafur Ramonas Design AB Renodia Fashion AB

Robert Sandqvist Mode AB Romona i Kinna AB Rooths Kläder AB Rundquist & Zälle Herrmode AB Ruth Lindeberg Boutique Kom In i Uppsala AB S G Skyddsgrossisten AB Sandahls Modehus S'34 AB Selma AB ShoeMe Concept Stores AB SIDINO AB Siw's Under-‐Wear AB Skinnmäster i Örebro AB Sko Design i Karlshamn AB Sko Hjalmar Försäljnings AB Skohuset i Lerum AB Skor T alla AB Skotrend, Gustafsson AB Små Hjärtan Barn & Tonårskläder AB Stenlund i Halmstad Ekipering AB Stiliga Högtidskläder i Malmö AB Stilmagazinet i Åmål AB Stingfish AB Stockholm Western Store AB Stockholms Militär Ekiperings AB StoraSysters Mode AB Strongarm AB Stylissimo AB Svedlindhs Herr & Dam AB Sweet & Tender AB Sweet Style AB Sänd i Strömstad AB TEME Agenturer AB
TETRE Jenny och Rikard AB The Stray Boys AB Thlund Tyresö AB Thwaites Design Store AB Tiny & More AB TPPS Tore Petersson Person och Säljutveckling AB Trend House i Värnamo AB Tricon in Sweden AB TRIX Smycken AB Trosan i Kristianstad AB Trots AB Twins Textil AB Uno Anderssons Kläder AB V.H Mode AB Vamlingbolaget Stockholm AB Vasagatans Fashionhouse AB Veguz Yrkeskläder AB Vera Stevens Velour of Sweden AB Väsk-‐Nilsson AB Västgöta Linnelager AB WALLMARK O LINDBERG AB Walthers i Karlstad AB WESTERDAHLS FÖRSÄLJNINGS AB Wide Handels AB Willaumes Herrmode AB Y.A.L.A Design Sweden AB Älvsbymannen AB Älvängens Skor AB Ängelholms Eva-‐Shop AB Öbergs Modehus i Ystad AB Örjans Jeans & Kläder i Boden AB
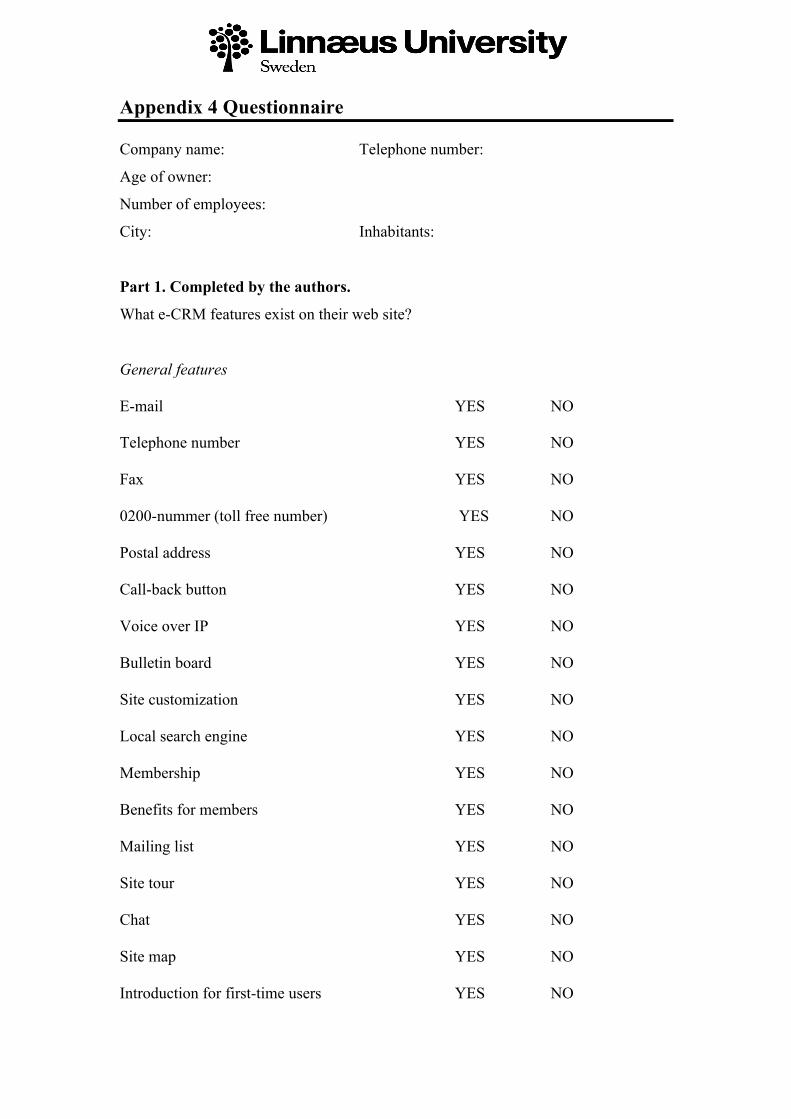
Appendix 4 Questionnaire Company name: Telephone number:
Age of owner:
Number of employees:
City: Inhabitants:
Part 1. Completed by the authors.
What e-CRM features exist on their web site?
General features
E-mail YES NO
Telephone number YES NO
Fax YES NO
0200-nummer (toll free number) YES NO
Postal address YES NO
Call-back button YES NO
Voice over IP YES NO
Bulletin board YES NO
Site customization YES NO
Local search engine YES NO
Membership YES NO
Benefits for members YES NO
Mailing list YES NO
Site tour YES NO
Chat YES NO
Site map YES NO
Introduction for first-time users YES NO

Social media presence YES NO
Store founder YES NO
Account information YES NO
Company profile YES NO
E-commerce e-CRM features
Online purchasing YES NO
Product information online YES NO
Price YES NO
Information is up to date YES NO
Size YES NO
Colour YES NO
Photos of products YES NO
Sales assistance services YES NO
Product customizations YES NO
Purchase conditions (including returns) YES NO
Product preview YES NO
Links to complementing products YES NO
Privacy policy YES NO
Security when buying YES NO
Deliveries in suitable time YES NO
Always available YES NO
Products apparel on model or 3D YES NO
Order tracking YES NO

Post-sales support e-CRM features
FAQ YES NO
Problem solving YES NO
Complaining ability YES NO
Spare parts YES NO
Profit margin:
Growth rate (increase in turnover):
Part 2. Research is done through telephone interviews with the owners of the
company and filled in by the authors
Does the following statement correspond to the goals of your company?
1 = not true. 5 = absolutely true.
1. Maintain current standard of living
1 2 3 4 5
Do the following statements correspond to the goals of your company?
2. Increase the profit 1 2 3 4 5
3. Innovation or creation of New products/services 1 2 3 4 5
4. Increase sales 1 2 3 4 5

Changes are avoided
Only when absolutely necessary
Changes are implemented sometimes
Changes are implemented constantly
Improved processes
Increased customer knowledge
Increased sales
Lower marketing costs
Collection of data for future decisions
Lower marketing costs
Increased sales
Increased customer knowledge
Improved processes
Collection of data for future decisions
5. How often are changes implemented? For example routines, technology, marketing
actions etc.
6. Which of the following results were expected when implementing e-CRM features
and Internet presence?
7. Which of these came as a result of implementing e-CRM and Internet presence?
8. Have your implementation of e-CRM and Internet presence been in accordance to
your expectations?
1=not true at all 5=absolutely true
1 2 3 4 5

Appendix 5 Full-length operationalization
Part one:
Part one is based on questions that the authors themselves have found answers
to. This is because that the answers are official to everyone and therefore the
authors believed that the trust worthiest answers could be collected to make the
study as valid as possible.
Age of owner/manager
Theoretical purpose; According to Gary (2002), the age of the owner/manager
has a role in how growth oriented the firm is and state that after the age of 40,
growth orientation among them decrease.
Authors purpose; By knowing the age of the owner, the authors might see a
relationship between the age, growth intention and implementation of the
features of e-‐CRM and if there are any relations to how far they have come.
Hypothesis: The purpose is to confirm or disconfirm hypothesis 3, if
owners/managers in the retail industry of micro sized enterprises, under the age
of 40 uses more e-‐CRM features than owners/managers over the age of 40. This
can be answered thanks to the question concluding how many e-‐CRM features
that retailers have implemented, and by this, help to answer the purpose of the
paper.
Number of employees
Theoretical purpose; The definition of micro enterprises is companies with less
than 10 employees (1-‐9) according to the European Union (http://europa.eu).
Authors purpose; This study only concerns micro enterprises on the Swedish
market of retailing. By asking this question, the authors can make sure that only
companies according to the sample frame are participating.
City and number of inhabitants

Authors purpose: By asking this question, the authors might be able to see
differences or similarities between micro sized retailers in different parts of the
country when it comes to e-‐CRM implementation. The authors might be able to
understand a relationship that could be useful when analysing the result. This
question is not a part of any hypothesis but will be interesting for the authors
when analysing the results.
Which of the following e-‐CRM features exist on their website?
Theoretical purpose; According to Feinberg et al., (2002), found in Anton and
Postmus (1999), the 25 e-‐CRM features used in this questionnaire are identified
to be mostly used in the retail industry. In additional to these 25 features, 19
features have been used, found by Yang et al., (2003), Seock and Norton (2007),
Kim and Lennon (2009) and Rocha (2012), which have been identified by
Fagerström and Sjögren (2012).
Author purpose; By founding out which of the following features are
implemented, and in which extend, the authors can make a conclusion in how far
micro sized enterprises on the Swedish market of retailing have come. The
features work as an index to measure e-‐CRM implementation.
Hypothesis. All six of the hypothesis in this paper that the authors want to
confirm or disconfirm, requires that information of how many e-‐CRM features
that have been implemented for each retailer is answered. By knowing the
answer of this question, the authors will be able to confirm or disconfirm the
hypothesis used to answer the purpose of the paper.
Profit margin
Theoretical purpose: According to Smallbone et al., (1995), companies who are
best performing are more growth oriented. Also Gary (2002) states that growth
orientation is linked to actual growth.
Authors purpose: By founding out the profit of each retailer participating in the
research, the authors might be able to see a relationship between number of e-‐

CRM features and margin profit. The average margin profit will be calculated as a
mean value of the sample and retailers will be evaluated depending on if they are
above or below the average. The authors have choose two different methods to
calculate the mean value and the reason for this is because there are e few
companies that affecting the mean value to much because of to high differences
compared to the rest of the sample. Therefore, the calculation is based on rates
not including the over-‐ and under quartile of rates, and the top-‐ and bottom 5
procent.
Hypothesis: By asking this question, the authors will be able to confirm or
disconfirm hypothesis 5, that enterprises with higher profit margin than the
average of the industry use more e-‐CRM features than enterprises with lower
profit margin than the average. By knowing the answer of this question, the
authors will be able to confirm or disconfirm the hypothesis, together with the
number of e-‐CRM features used, and by this answer the purpose of the paper.
Growth rate (increase in turnover)
Theoretical purpose: According to Smallbone et al., (1995), companies who are
more commitment to growth are the ones who are performing the best and are
also actively responding to opportunities and developments. Gary (2002), states
that companies who are more open minded to change are more growth oriented.
The average growth rate will be calculated as a mean value of the sample and
retailers will be evaluated depending on if they are above or below the mean
value. The authors have choose two different methods to calculate the mean
value and the reason for this is because there are e few companies that affecting
the mean value to much because of to high differences compared to the rest of
the sample. Therefore, the calculation is based on rates not including the over-‐
and under quartile of rates, and the top-‐ and bottom 5 procent.
Authors purpose: By founding out the average growth rate of each retailer
participating in the research, the authors might be able to see a relationship
between number of e-‐CRM features and growth of each retailer and compare this
to the theory.

Hypothesis: By asking this question, the authors will be able to confirm or
disconfirm hypothesis 6, that enterprises with higher growth rate (increase in
turnover), than average in the retail industry use more e-‐CRM features than
retailers with lower growth rate (increase in turnover). By knowing the answer
of this question, the authors will be able to confirm or disconfirm the hypothesis,
together with the number of e-‐CRM features used, and by this answer the
purpose of the paper.
Part two:
Part two has been conducted through a telephone interview with the
participated retailers. The telephone interview has a strictly quantitative
approach with no input from the authors in order to limit the influence of
participated. Part two includes questions that necessary needs to be answered
by the participated themselves. The authors have therefore chosen to conduct
these answers with telephone interviews to make sure that the right person
within the company answer the question (owner/manager) and also to ensure a
high response rate.
What underlying factors is the basis for your goals of the company?
• Maintain current standard of living?
• Increase profits?
• Create innovation / develop new products and services?
• Increase sales?
Theoretical purpose; According to Smallbone et al., (1995), Maurer (1996) and
Gary (2002), the above statements are in one or another way related to the
objectives of the firm and small enterprises motivation for their enterprises
objectives. According to Smallbone et al., (1995), not all small firms are growth
oriented which means they are not focusing on financial growth. The theories
state that small firms are often characteristics by the personal lifestyle of the
owner/manager than of growth (Gary, 2002). Gary (2002) also states that firms
that are more open to changes are more growth oriented.

Authors Purpose; To found out the motivations for micro enterprises on the
Swedish industry of retiling in how to reach the objectives of the firm, the
authors might be able to found a relationship between micro enterprises on the
Swedish market of retailing and growth intention and compare these to how far
they have managed to implement e-‐CRM. This will help the authors to answer
the purpose of the paper.
Hypothesis: By asking this question, the authors will be able to confirm or
disconfirm hypothesis 1 and 2, that growth oriented enterprises use more e-‐CRM
features than enterprises who are less growth oriented and that companies
where the owner prioritise to maintain current standard of living before growth
orientation have not implemented more e-‐CRM features than growth oriented
enterprises. By knowing the answer of this question, the authors will be able to
confirm or disconfirm the hypothesis, together with the number of e-‐CRM
features used, and by this answer the purpose of the paper.
How often do you implement changes in the organisation? For example,
routines, technologies, marketing etc.
5. Changes are avoided
6. Changes only introduces when necessary
7. Changes are introduces occasionally
8. Changes are introduced constantly
Theoretical purpose; According to Maurer (1996) smaller firms are in general
more resistance to changes. Although, Smallbone et al., (1995) states that the
most growing firms are active in their response to market opportunities when it
comes to develop new products and services to existing customers. Gary (2002)
also claims that firms with openness to implementing changes are more growth
oriented, as well as growth orientation is linked to actual growth.

Authors purpose; As mention, smaller firms are more resistance to changes but as
stated, the more open they are to opportunities, the more can they grow.
According to this, it is of interest to see if retailers of micro size on the Swedish
market are open to changes and opportunities and by this see a relation to
implementation of e-‐CRM and growth intention.
Hypothesis: By asking this question, the authors will be able to confirm or
disconfirm hypothesis 4, that enterprises that are more openness for changes in
technology use more e-‐CRM features than enterprises that are not as openness to
changes in technology. By knowing the answer of this question, the authors will
be able to confirm or disconfirm the hypothesis, together with the number of e-‐
CRM features used, and by this answer the purpose of the paper.
Which of the following results was expected when implementing e-‐CRM
features?
1. Decreased marketing costs
2. Increased sales
3. Increased customer understanding
4. Improved processes
5. Data collecting for future decisions
Theoretical purpose: According to the theory of CRM, which is the ground of e-‐
CRM, the above mentioned statements have an impact on companies who
implement CRM and e-‐CRM.
Authors purpose: By founding out the result retailers was expecting before
implementing e-‐CRM, the authors might be able to compare their expected
results to the actual result after implementing e-‐CRM and compare this to the
theory. This question is not a part of any hypothesis but will be important for the
authors when analysing the result.
Which of these came as a result of implementing e-‐CRM features?
1. Decreased marketing costs

2. Increased sales
3. Increased customer understanding
4. Improved processes
5. Data collecting for future decisions
Theoretical purpose: According to the theory of CRM, which is the ground of e-‐
CRM, the above mentioned statements have an impact on companies who
implement CRM and e-‐CRM.
Authors purpose: This question will be compared to the question mention above
to see if the result gained after implementing e-‐CRM did meet the expectations
that retailers had before implementation. This comparison will help the authors
in answering the purpose of the paper. This question is not a part of any
hypothesis but will be important for the authors when analysing the result.
Have you implementation of e-‐CRM been in accordance to your
expectations?
Authors purpose: With this question, the authors might be able to compare the
two mentioned questions above to the retailers actual expectations of e-‐CRM.
This question is not a part of any hypothesis but will be important for the
authors when analysing the result.
Other CRM-‐ and e-‐CRM Theories
Authors purpose; The authors have chosen to include theories about CRM and
more general theories about e-‐CRM to make an increased understanding of the
subject to the reader. Without any theories about the above mention subjects,
the readers would have difficult to understand the purpose and background of
the study.

Appendix 6 Empirical results The figures below are corresponding to the figure names in the empirical chapter. Figure 14.
comp. with more than 10 features * high satisfactions Crosstabulation
high satisfactions
Total <4 >4
comp. with more than 10
features
<10 Count 95 19 114
% within comp. with more
than 10 features
83,3% 16,7% 100,0%
>10 Count 14 9 23
% within comp. with more
than 10 features
60,9% 39,1% 100,0%
Total Count 109 28 137
% within comp. with more
than 10 features
79,6% 20,4% 100,0%
Chi-Square Tests
Value df
Asymp. Sig. (2-
sided)
Exact Sig. (2-
sided)
Exact Sig. (1-
sided)
Pearson Chi-Square 5,939a 1 ,015 Continuity Correctionb 4,638 1 ,031 Likelihood Ratio 5,240 1 ,022 Fisher's Exact Test ,023 ,020
Linear-by-Linear
Association
5,896 1 ,015
N of Valid Cases 137 a. 1 cells (25,0%) have expected count less than 5. The minimum expected count is 4,70.
b. Computed only for a 2x2 table
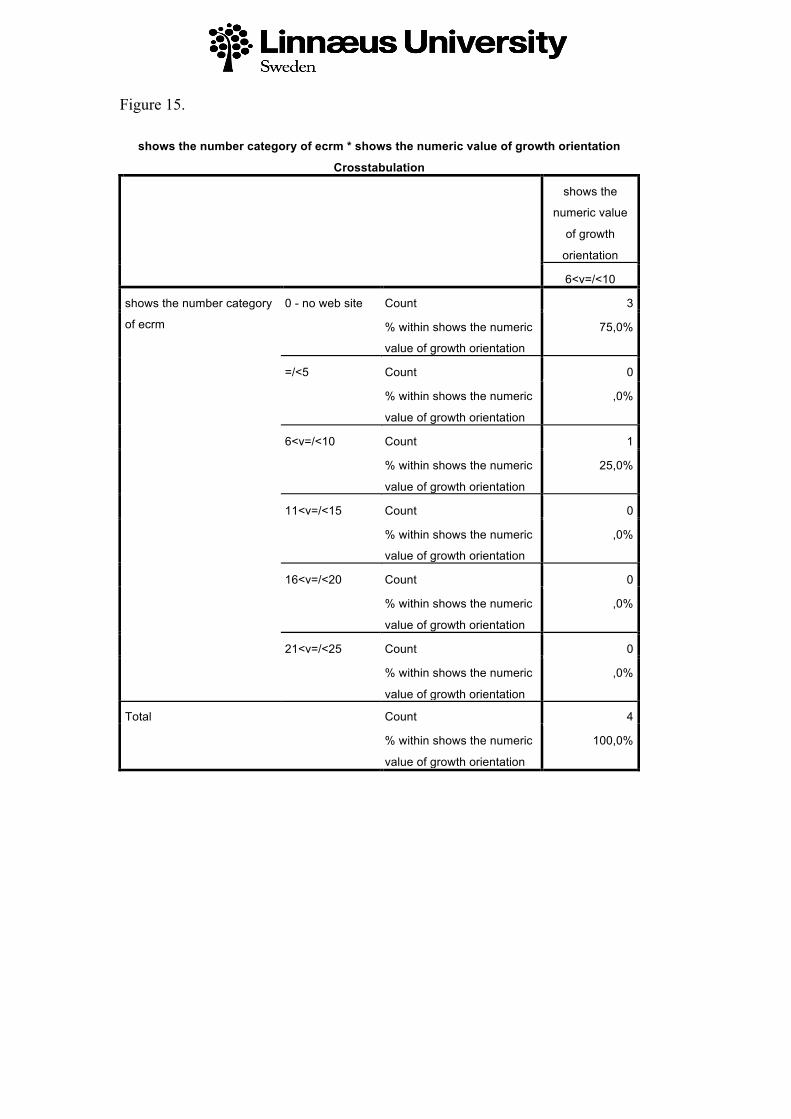
Figure 15.
shows the number category of ecrm * shows the numeric value of growth orientation
Crosstabulation
shows the
numeric value
of growth
orientation
6<v=/<10
shows the number category
of ecrm
0 - no web site Count 3
% within shows the numeric
value of growth orientation
75,0%
=/<5 Count 0
% within shows the numeric
value of growth orientation
,0%
6<v=/<10 Count 1
% within shows the numeric
value of growth orientation
25,0%
11<v=/<15 Count 0
% within shows the numeric
value of growth orientation
,0%
16<v=/<20 Count 0
% within shows the numeric
value of growth orientation
,0%
21<v=/<25 Count 0
% within shows the numeric
value of growth orientation
,0%
Total Count 4
% within shows the numeric
value of growth orientation
100,0%

shows the number category of ecrm * shows the numeric value of growth orientation Crosstabulation
shows the numeric value of
growth orientation
11<v=/<15 16<v=/<19
shows the number category
of ecrm
0 - no web site Count 13 40
% within shows the numeric
value of growth orientation
31,0% 44,0%
=/<5 Count 8 17
% within shows the numeric
value of growth orientation
19,0% 18,7%
6<v=/<10 Count 13 19
% within shows the numeric
value of growth orientation
31,0% 20,9%
11<v=/<15 Count 1 3
% within shows the numeric
value of growth orientation
2,4% 3,3%
16<v=/<20 Count 4 5
% within shows the numeric
value of growth orientation
9,5% 5,5%
21<v=/<25 Count 3 7
% within shows the numeric
value of growth orientation
7,1% 7,7%
Total Count 42 91
% within shows the numeric
value of growth orientation
100,0% 100,0%
shows the number category of ecrm * shows the numeric value of growth
orientation Crosstabulation
Total
shows the number category
of ecrm
0 - no web site Count 56
% within shows the numeric
value of growth orientation
40,9%
=/<5 Count 25
% within shows the numeric
value of growth orientation
18,2%
6<v=/<10 Count 33
% within shows the numeric
value of growth orientation
24,1%
11<v=/<15 Count 4

% within shows the numeric
value of growth orientation
2,9%
16<v=/<20 Count 9
% within shows the numeric
value of growth orientation
6,6%
21<v=/<25 Count 10
% within shows the numeric
value of growth orientation
7,3%
Total Count 137
% within shows the numeric
value of growth orientation
100,0%
Chi-Square Tests
Value df
Asymp. Sig. (2-
sided)
Pearson Chi-Square 5,825a 10 ,830
Likelihood Ratio 6,978 10 ,728
Linear-by-Linear
Association
,096 1 ,757
N of Valid Cases 137
a. 10 cells (55,6%) have expected count less than 5. The minimum
expected count is ,12. Figure 16.
shows the number category of ecrm * shows the interest to maintain present lifestyle Crosstabulation
shows the interest to maintain
present lifestyle
not at all not quite
shows the number category
of ecrm
0 - no web site Count 6 3
% within shows the interest
to maintain present lifestyle
42,9% 42,9%
=/<5 Count 1 2
% within shows the interest
to maintain present lifestyle
7,1% 28,6%
6<v=/<10 Count 2 2
% within shows the interest
to maintain present lifestyle
14,3% 28,6%
11<v=/<15 Count 1 0
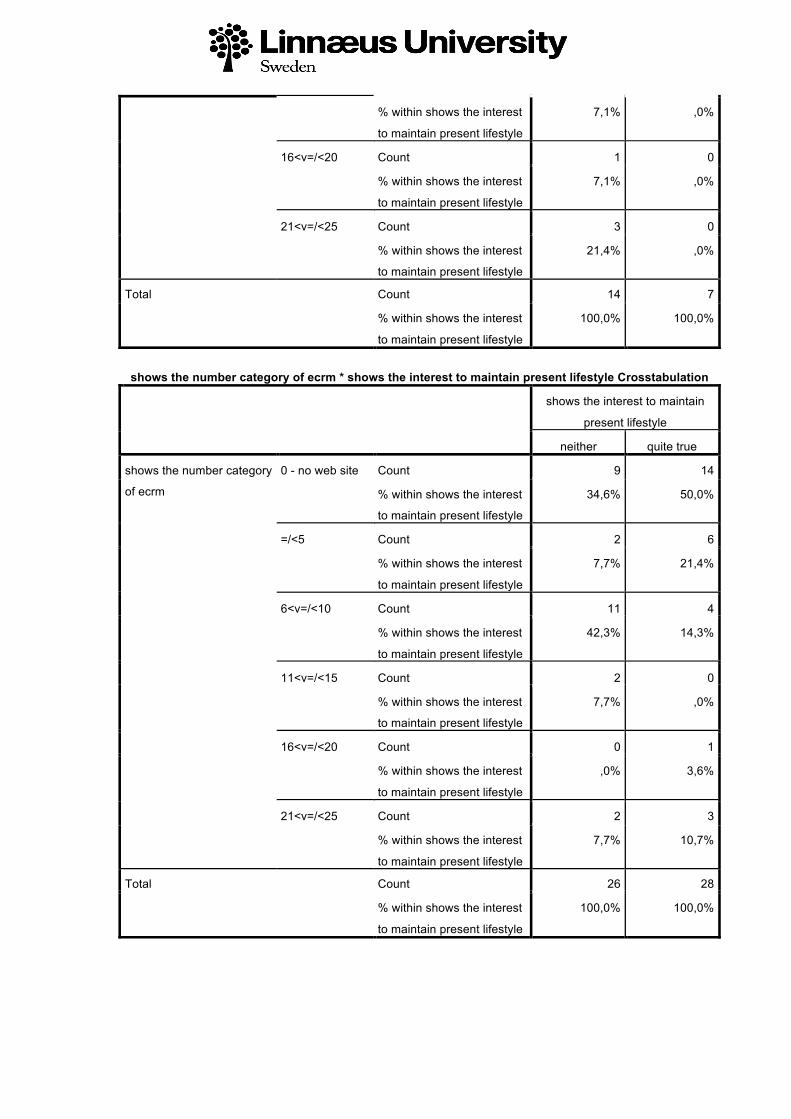
% within shows the interest
to maintain present lifestyle
7,1% ,0%
16<v=/<20 Count 1 0
% within shows the interest
to maintain present lifestyle
7,1% ,0%
21<v=/<25 Count 3 0
% within shows the interest
to maintain present lifestyle
21,4% ,0%
Total Count 14 7
% within shows the interest
to maintain present lifestyle
100,0% 100,0%
shows the number category of ecrm * shows the interest to maintain present lifestyle Crosstabulation
shows the interest to maintain
present lifestyle
neither quite true
shows the number category
of ecrm
0 - no web site Count 9 14
% within shows the interest
to maintain present lifestyle
34,6% 50,0%
=/<5 Count 2 6
% within shows the interest
to maintain present lifestyle
7,7% 21,4%
6<v=/<10 Count 11 4
% within shows the interest
to maintain present lifestyle
42,3% 14,3%
11<v=/<15 Count 2 0
% within shows the interest
to maintain present lifestyle
7,7% ,0%
16<v=/<20 Count 0 1
% within shows the interest
to maintain present lifestyle
,0% 3,6%
21<v=/<25 Count 2 3
% within shows the interest
to maintain present lifestyle
7,7% 10,7%
Total Count 26 28
% within shows the interest
to maintain present lifestyle
100,0% 100,0%

shows the number category of ecrm * shows the interest to maintain present lifestyle Crosstabulation
shows the
interest to
maintain
present lifestyle
Total absolutely true
shows the number category
of ecrm
0 - no web site Count 24 56
% within shows the interest
to maintain present lifestyle
38,7% 40,9%
=/<5 Count 14 25
% within shows the interest
to maintain present lifestyle
22,6% 18,2%
6<v=/<10 Count 14 33
% within shows the interest
to maintain present lifestyle
22,6% 24,1%
11<v=/<15 Count 1 4
% within shows the interest
to maintain present lifestyle
1,6% 2,9%
16<v=/<20 Count 7 9
% within shows the interest
to maintain present lifestyle
11,3% 6,6%
21<v=/<25 Count 2 10
% within shows the interest
to maintain present lifestyle
3,2% 7,3%
Total Count 62 137
% within shows the interest
to maintain present lifestyle
100,0% 100,0%
Chi-Square Tests
Value df
Asymp. Sig. (2-
sided)
Pearson Chi-Square 25,154a 20 ,196
Likelihood Ratio 26,954 20 ,137
Linear-by-Linear
Association
,876 1 ,349
N of Valid Cases 137
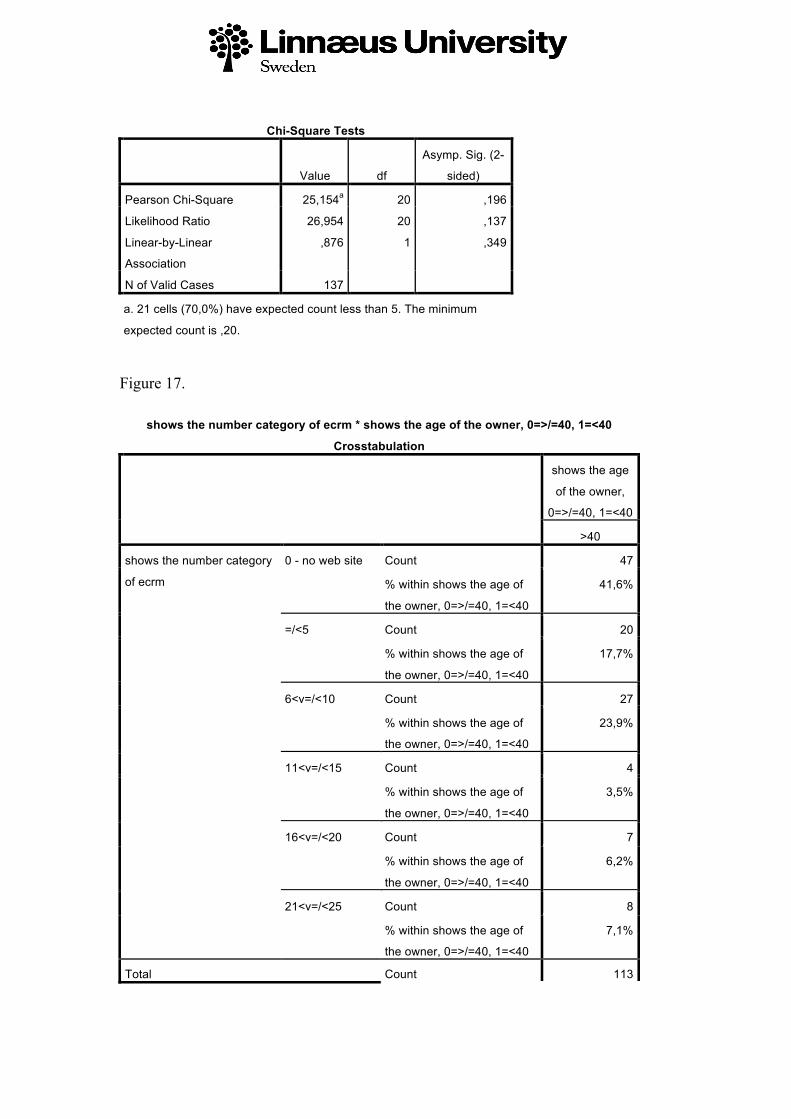
Chi-Square Tests
Value df
Asymp. Sig. (2-
sided)
Pearson Chi-Square 25,154a 20 ,196
Likelihood Ratio 26,954 20 ,137
Linear-by-Linear
Association
,876 1 ,349
N of Valid Cases 137 a. 21 cells (70,0%) have expected count less than 5. The minimum
expected count is ,20. Figure 17.
shows the number category of ecrm * shows the age of the owner, 0=>/=40, 1=<40
Crosstabulation
shows the age
of the owner,
0=>/=40, 1=<40
>40
shows the number category
of ecrm
0 - no web site Count 47
% within shows the age of
the owner, 0=>/=40, 1=<40
41,6%
=/<5 Count 20
% within shows the age of
the owner, 0=>/=40, 1=<40
17,7%
6<v=/<10 Count 27
% within shows the age of
the owner, 0=>/=40, 1=<40
23,9%
11<v=/<15 Count 4
% within shows the age of
the owner, 0=>/=40, 1=<40
3,5%
16<v=/<20 Count 7
% within shows the age of
the owner, 0=>/=40, 1=<40
6,2%
21<v=/<25 Count 8
% within shows the age of
the owner, 0=>/=40, 1=<40
7,1%
Total Count 113
% within shows the age of
the owner, 0=>/=40, 1=<40
100,0%
shows the number category of ecrm * shows the age of the owner, 0=>/=40, 1=<40 Crosstabulation
shows the age
of the owner,
0=>/=40, 1=<40
Total </=40
shows the number category
of ecrm
0 - no web site Count 9 56
% within shows the age of
the owner, 0=>/=40, 1=<40
37,5% 40,9%
=/<5 Count 5 25
% within shows the age of
the owner, 0=>/=40, 1=<40
20,8% 18,2%
6<v=/<10 Count 6 33

% within shows the age of
the owner, 0=>/=40, 1=<40
25,0% 24,1%
11<v=/<15 Count 0 4
% within shows the age of
the owner, 0=>/=40, 1=<40
,0% 2,9%
16<v=/<20 Count 2 9
% within shows the age of
the owner, 0=>/=40, 1=<40
8,3% 6,6%
21<v=/<25 Count 2 10
% within shows the age of
the owner, 0=>/=40, 1=<40
8,3% 7,3%
Total Count 24 137
% within shows the age of
the owner, 0=>/=40, 1=<40
100,0% 100,0%
Chi-Square Tests
Value df
Asymp. Sig. (2-
sided)
Pearson Chi-Square 1,228a 5 ,942
Likelihood Ratio 1,907 5 ,862
Linear-by-Linear
Association
,075 1 ,784
N of Valid Cases 137
a. 5 cells (41,7%) have expected count less than 5. The minimum
expected count is ,70. Figure 18.
shows the number category of ecrm * shows how willing to implement changes
Crosstabulation
shows how
willing to
implement
changes
changes are
avoided
shows the number category
of ecrm
0 - no web site Count 0
% within shows how willing
to implement changes
,0%

=/<5 Count 0
% within shows how willing
to implement changes
,0%
6<v=/<10 Count 2
% within shows how willing
to implement changes
100,0%
11<v=/<15 Count 0
% within shows how willing
to implement changes
,0%
16<v=/<20 Count 0
% within shows how willing
to implement changes
,0%
21<v=/<25 Count 0
% within shows how willing
to implement changes
,0%
Total Count 2
% within shows how willing
to implement changes
100,0%
shows the number category of ecrm * shows how willing to implement changes
Crosstabulation
shows how
willing to
implement
changes
only when
necessary
shows the number category
of ecrm
0 - no web site Count 8
% within shows how willing
to implement changes
42,1%
=/<5 Count 3
% within shows how willing
to implement changes
15,8%
6<v=/<10 Count 6
% within shows how willing
to implement changes
31,6%
11<v=/<15 Count 1
% within shows how willing
to implement changes
5,3%
16<v=/<20 Count 0

% within shows how willing
to implement changes
,0%
21<v=/<25 Count 1
% within shows how willing
to implement changes
5,3%
Total Count 19
% within shows how willing
to implement changes
100,0%
shows the number category of ecrm * shows how willing to implement changes
Crosstabulation
shows how
willing to
implement
changes
implemented
sometimes
shows the number category
of ecrm
0 - no web site Count 24
% within shows how willing
to implement changes
38,1%
=/<5 Count 12
% within shows how willing
to implement changes
19,0%
6<v=/<10 Count 16
% within shows how willing
to implement changes
25,4%
11<v=/<15 Count 2
% within shows how willing
to implement changes
3,2%
16<v=/<20 Count 5
% within shows how willing
to implement changes
7,9%
21<v=/<25 Count 4
% within shows how willing
to implement changes
6,3%
Total Count 63
% within shows how willing
to implement changes
100,0%
shows the number category of ecrm * shows how willing to implement changes Crosstabulation

shows how
willing to
implement
changes
Total
introduced
constantly
shows the number category
of ecrm
0 - no web site Count 24 56
% within shows how willing
to implement changes
45,3% 40,9%
=/<5 Count 10 25
% within shows how willing
to implement changes
18,9% 18,2%
6<v=/<10 Count 9 33
% within shows how willing
to implement changes
17,0% 24,1%
11<v=/<15 Count 1 4
% within shows how willing
to implement changes
1,9% 2,9%
16<v=/<20 Count 4 9
% within shows how willing
to implement changes
7,5% 6,6%
21<v=/<25 Count 5 10
% within shows how willing
to implement changes
9,4% 7,3%
Total Count 53 137
% within shows how willing
to implement changes
100,0% 100,0%
Chi-Square Tests
Value df
Asymp. Sig. (2-
sided)
Pearson Chi-Square 10,962a 15 ,755
Likelihood Ratio 11,617 15 ,708
Linear-by-Linear
Association
,001 1 ,977
N of Valid Cases 137
a. 17 cells (70,8%) have expected count less than 5. The minimum
expected count is ,06.
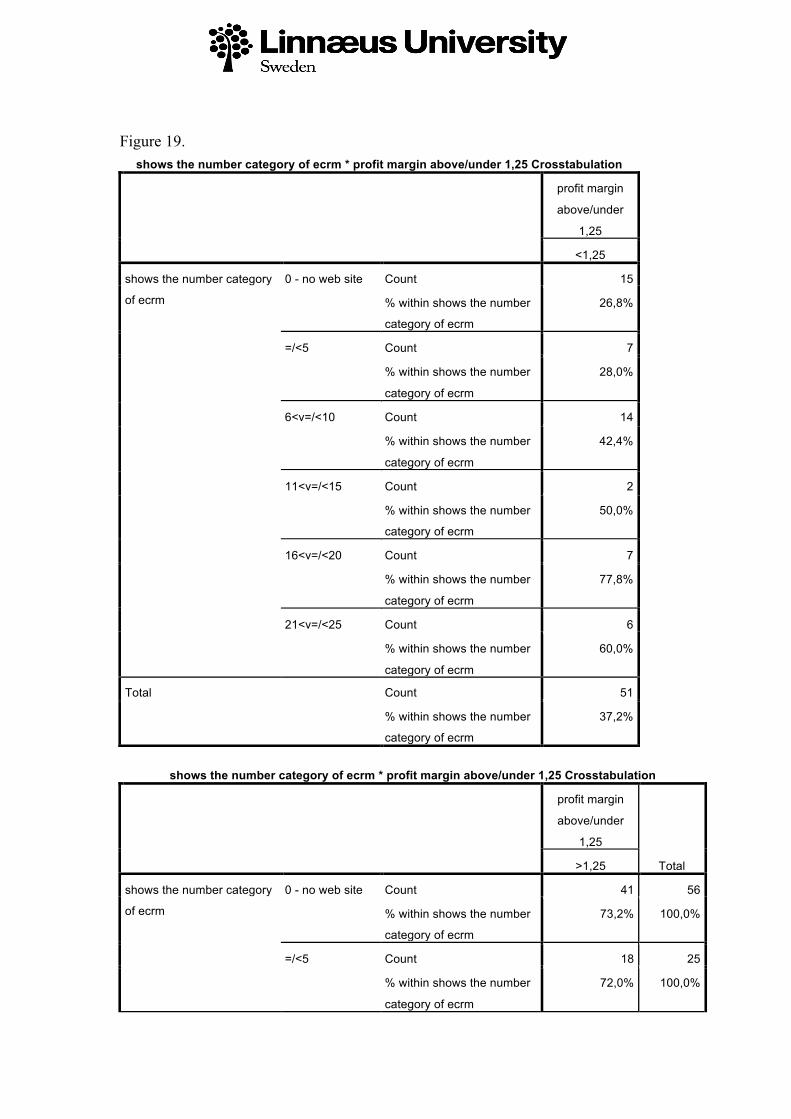
Figure 19.
shows the number category of ecrm * profit margin above/under 1,25 Crosstabulation
profit margin
above/under
1,25
<1,25
shows the number category
of ecrm
0 - no web site Count 15
% within shows the number
category of ecrm
26,8%
=/<5 Count 7
% within shows the number
category of ecrm
28,0%
6<v=/<10 Count 14
% within shows the number
category of ecrm
42,4%
11<v=/<15 Count 2
% within shows the number
category of ecrm
50,0%
16<v=/<20 Count 7
% within shows the number
category of ecrm
77,8%
21<v=/<25 Count 6
% within shows the number
category of ecrm
60,0%
Total Count 51
% within shows the number
category of ecrm
37,2%
shows the number category of ecrm * profit margin above/under 1,25 Crosstabulation
profit margin
above/under
1,25
Total >1,25
shows the number category
of ecrm
0 - no web site Count 41 56
% within shows the number
category of ecrm
73,2% 100,0%
=/<5 Count 18 25
% within shows the number
category of ecrm
72,0% 100,0%
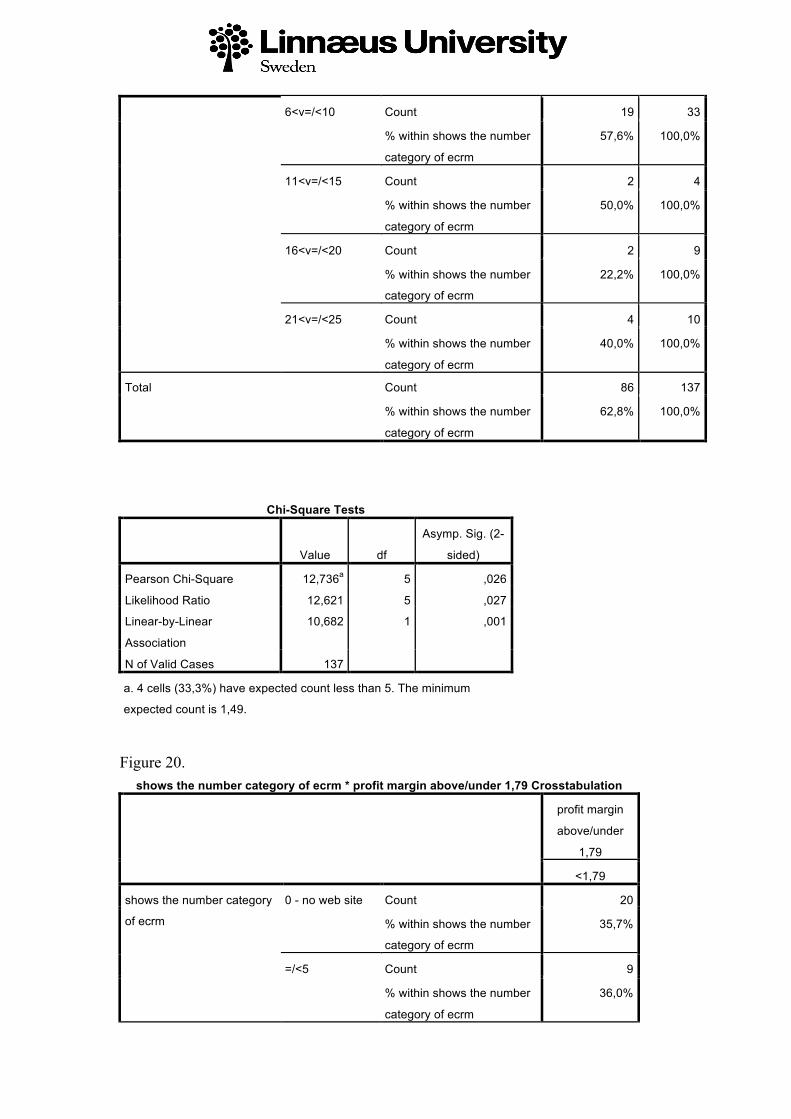
6<v=/<10 Count 19 33
% within shows the number
category of ecrm
57,6% 100,0%
11<v=/<15 Count 2 4
% within shows the number
category of ecrm
50,0% 100,0%
16<v=/<20 Count 2 9
% within shows the number
category of ecrm
22,2% 100,0%
21<v=/<25 Count 4 10
% within shows the number
category of ecrm
40,0% 100,0%
Total Count 86 137
% within shows the number
category of ecrm
62,8% 100,0%
Chi-Square Tests
Value df
Asymp. Sig. (2-
sided)
Pearson Chi-Square 12,736a 5 ,026
Likelihood Ratio 12,621 5 ,027
Linear-by-Linear
Association
10,682 1 ,001
N of Valid Cases 137
a. 4 cells (33,3%) have expected count less than 5. The minimum
expected count is 1,49. Figure 20.
shows the number category of ecrm * profit margin above/under 1,79 Crosstabulation
profit margin
above/under
1,79
<1,79
shows the number category
of ecrm
0 - no web site Count 20
% within shows the number
category of ecrm
35,7%
=/<5 Count 9
% within shows the number
category of ecrm
36,0%
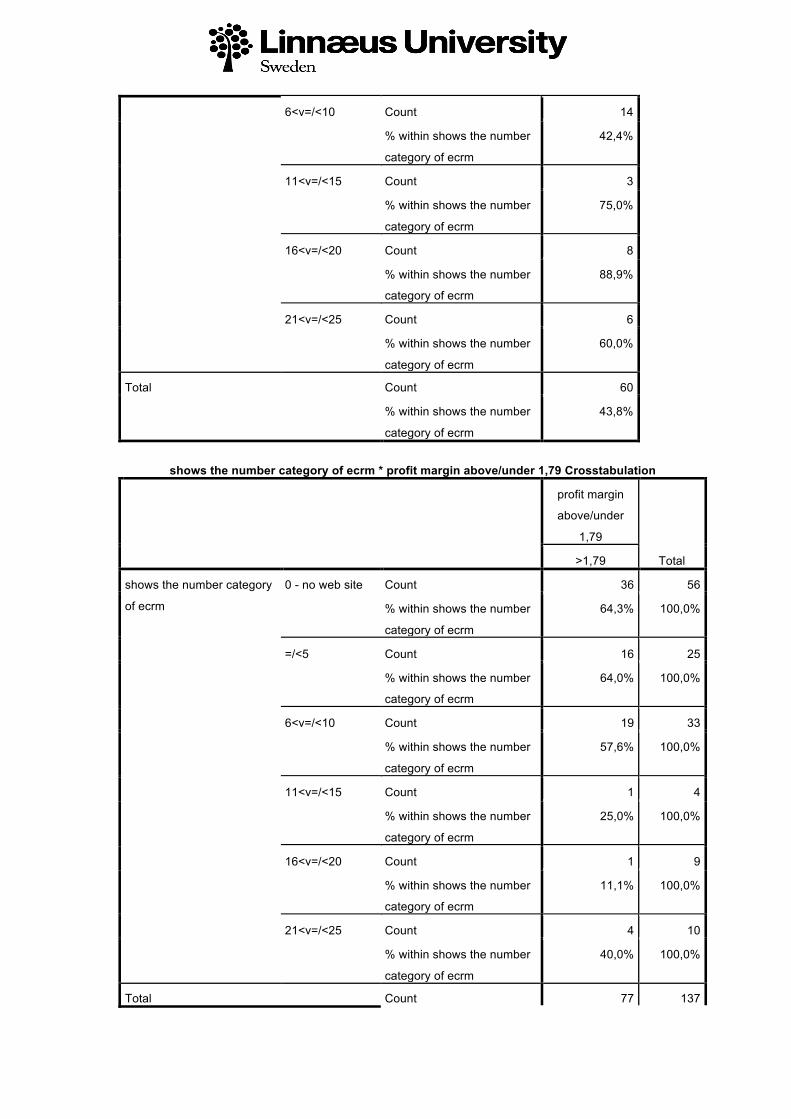
6<v=/<10 Count 14
% within shows the number
category of ecrm
42,4%
11<v=/<15 Count 3
% within shows the number
category of ecrm
75,0%
16<v=/<20 Count 8
% within shows the number
category of ecrm
88,9%
21<v=/<25 Count 6
% within shows the number
category of ecrm
60,0%
Total Count 60
% within shows the number
category of ecrm
43,8%
shows the number category of ecrm * profit margin above/under 1,79 Crosstabulation
profit margin
above/under
1,79
Total >1,79
shows the number category
of ecrm
0 - no web site Count 36 56
% within shows the number
category of ecrm
64,3% 100,0%
=/<5 Count 16 25
% within shows the number
category of ecrm
64,0% 100,0%
6<v=/<10 Count 19 33
% within shows the number
category of ecrm
57,6% 100,0%
11<v=/<15 Count 1 4
% within shows the number
category of ecrm
25,0% 100,0%
16<v=/<20 Count 1 9
% within shows the number
category of ecrm
11,1% 100,0%
21<v=/<25 Count 4 10
% within shows the number
category of ecrm
40,0% 100,0%
Total Count 77 137
% within shows the number
category of ecrm
56,2% 100,0%
Chi-Square Tests
Value df
Asymp. Sig. (2-
sided)
Pearson Chi-Square 12,212a 5 ,032
Likelihood Ratio 12,915 5 ,024
Linear-by-Linear
Association
7,866 1 ,005
N of Valid Cases 137
a. 4 cells (33,3%) have expected count less than 5. The minimum
expected count is 1,75.

Figure 21. profit margin above/under 1,25 * displays if any ecrm or not Crosstabulation
displays if any ecrm or not
no ecrm/no web
site ecrm exist
profit margin above/under
1,25
<1,25 Count 15 36
% within profit margin
above/under 1,25
29,4% 70,6%
>1,25 Count 41 45
% within profit margin
above/under 1,25
47,7% 52,3%
Total Count 56 81
% within profit margin
above/under 1,25
40,9% 59,1%
profit margin above/under 1,25 * displays if any ecrm or not
Crosstabulation
Total
profit margin above/under
1,25
<1,25 Count 51
% within profit margin
above/under 1,25
100,0%
>1,25 Count 86
% within profit margin
above/under 1,25
100,0%
Total Count 137
% within profit margin
above/under 1,25
100,0%
Chi-Square Tests
Value df
Asymp. Sig. (2-
sided)
Exact Sig. (2-
sided)
Exact Sig. (1-
sided)
Pearson Chi-Square 4,418a 1 ,036 Continuity Correctionb 3,695 1 ,055 Likelihood Ratio 4,508 1 ,034 Fisher's Exact Test ,048 ,027
Linear-by-Linear
Association
4,386 1 ,036
N of Valid Cases 137 a. 0 cells (,0%) have expected count less than 5. The minimum expected count is 20,85.
b. Computed only for a 2x2 table

Figure 22.
profit margin above/under 1,79 * displays if any ecrm or not Crosstabulation
displays if any ecrm or not
no ecrm/no web
site ecrm exist
profit margin above/under
1,79
<1,79 Count 20 40
% within profit margin
above/under 1,79
33,3% 66,7%
>1,79 Count 36 41
% within profit margin
above/under 1,79
46,8% 53,2%
Total Count 56 81
% within profit margin
above/under 1,79
40,9% 59,1%
profit margin above/under 1,79 * displays if any ecrm or not
Crosstabulation
Total
profit margin above/under
1,79
<1,79 Count 60
% within profit margin
above/under 1,79
100,0%
>1,79 Count 77
% within profit margin
above/under 1,79
100,0%
Total Count 137
% within profit margin
above/under 1,79
100,0%
Chi-Square Tests
Value df
Asymp. Sig. (2-
sided)
Exact Sig. (2-
sided)
Exact Sig. (1-
sided)
Pearson Chi-Square 2,513a 1 ,113 Continuity Correctionb 1,988 1 ,159 Likelihood Ratio 2,533 1 ,111 Fisher's Exact Test ,120 ,079
Linear-by-Linear
Association
2,495 1 ,114
N of Valid Cases 137

a. 0 cells (,0%) have expected count less than 5. The minimum expected count is 24,53.
b. Computed only for a 2x2 table Figure 23.
shows the number category of ecrm * growth margin >/< 1,3 Crosstabulation
growth margin >/< 1,3
<1,3 =/>1,3
shows the number category
of ecrm
0 - no web site Count 27 29
% within shows the number
category of ecrm
48,2% 51,8%
=/<5 Count 14 11
% within shows the number
category of ecrm
56,0% 44,0%
6<v=/<10 Count 18 15
% within shows the number
category of ecrm
54,5% 45,5%
11<v=/<15 Count 4 0
% within shows the number
category of ecrm
100,0% ,0%
16<v=/<20 Count 6 3
% within shows the number
category of ecrm
66,7% 33,3%
21<v=/<25 Count 5 5
% within shows the number
category of ecrm
50,0% 50,0%
Total Count 74 63
% within shows the number
category of ecrm
54,0% 46,0%
shows the number category of ecrm * growth margin >/< 1,3 Crosstabulation
Total
shows the number category
of ecrm
0 - no web site Count 56
% within shows the number
category of ecrm
100,0%
=/<5 Count 25
% within shows the number
category of ecrm
100,0%
6<v=/<10 Count 33

% within shows the number
category of ecrm
100,0%
11<v=/<15 Count 4
% within shows the number
category of ecrm
100,0%
16<v=/<20 Count 9
% within shows the number
category of ecrm
100,0%
21<v=/<25 Count 10
% within shows the number
category of ecrm
100,0%
Total Count 137
% within shows the number
category of ecrm
100,0%
Chi-Square Tests
Value df
Asymp. Sig. (2-
sided)
Pearson Chi-Square 4,852a 5 ,434
Likelihood Ratio 6,386 5 ,270
Linear-by-Linear
Association
,973 1 ,324
N of Valid Cases 137
a. 5 cells (41,7%) have expected count less than 5. The minimum
expected count is 1,84. Figure 24.
shows the number category of ecrm * growth margin >/< 5,2 Crosstabulation
growth margin >/< 5,2
<5,2 =/> 5,2
shows the number category 0 - no web site Count 36 20

of ecrm % within shows the number
category of ecrm
64,3% 35,7%
=/<5 Count 19 6
% within shows the number
category of ecrm
76,0% 24,0%
6<v=/<10 Count 20 13
% within shows the number
category of ecrm
60,6% 39,4%
11<v=/<15 Count 4 0
% within shows the number
category of ecrm
100,0% ,0%
16<v=/<20 Count 7 2
% within shows the number
category of ecrm
77,8% 22,2%
21<v=/<25 Count 5 5
% within shows the number
category of ecrm
50,0% 50,0%
Total Count 91 46
% within shows the number
category of ecrm
66,4% 33,6%
shows the number category of ecrm * growth margin >/< 5,2 Crosstabulation
Total
shows the number category
of ecrm
0 - no web site Count 56
% within shows the number
category of ecrm
100,0%
=/<5 Count 25
% within shows the number
category of ecrm
100,0%
6<v=/<10 Count 33
% within shows the number
category of ecrm
100,0%
11<v=/<15 Count 4
% within shows the number
category of ecrm
100,0%
16<v=/<20 Count 9
% within shows the number
category of ecrm
100,0%
21<v=/<25 Count 10

% within shows the number
category of ecrm
100,0%
Total Count 137
% within shows the number
category of ecrm
100,0%
Chi-Square Tests
Value df
Asymp. Sig. (2-
sided)
Pearson Chi-Square 5,395a 5 ,370
Likelihood Ratio 6,663 5 ,247
Linear-by-Linear
Association
,032 1 ,857
N of Valid Cases 137
a. 4 cells (33,3%) have expected count less than 5. The minimum
expected count is 1,34.

Linnaeus University – a firm focus on quality and competence On 1 January 2010 Växjö University and the University of Kalmar merged to form Linnaeus University. This new university is the product of a will to improve the quality, enhance the appeal and boost the development potential of teaching and research, at the same time as it plays a prominent role in working closely together with local society. Linnaeus University offers an attractive knowledge environment characterised by high quality and a competitive portfolio of skills. Linnaeus University is a modern, international university with the emphasis on the desire for knowledge, creative thinking and practical innovations. For us, the focus is on proximity to our students, but also on the world around us and the future ahead. Linnæus University SE-391 82 Kalmar/SE-351 95 Växjö Telephone +46 772-28 80 00
Top Related