


Languages
Pages
Legal

LECTURE 3:BASICS OF INVESTING IIEconomics 98/198 Decal Spring 2008
Today’s ScheduleAdministrative IssuesLast Week’s LectureLecture Content
Basics of InvestingMarket capitalizationEarning reportsStocks splits / stock buybacks Investing on MarginShort-selling Industries / Sectors
Current EventsAssigned Reading / Next Week
Administrative IssuesEnrollment
Make sure you’re signed up on Tele-Bears
Investopedia Simulation CompetitionSubmit your $5 into the class envelopeMake sure you write username on sign-up sheetStart trading!
Investor’s Business Daily online subscription
New Presentation

Lecture Content
Market Capitalization
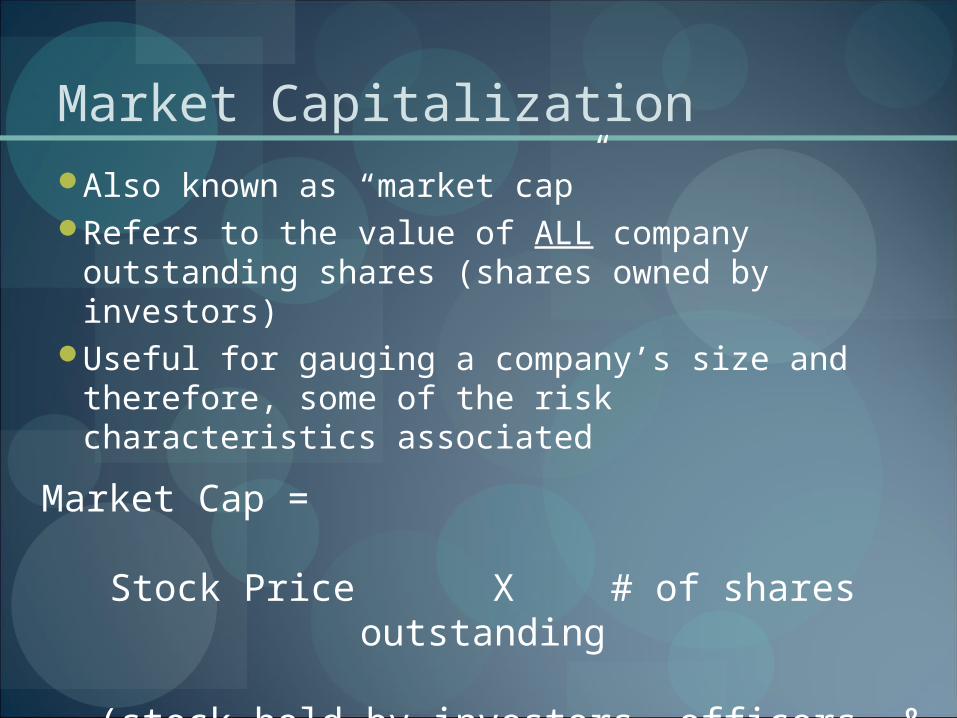
Market CapitalizationAlso known as “market cap”Refers to the value of ALL company
outstanding shares (shares owned by investors)
Useful for gauging a company’s size and therefore, some of the risk characteristics associated
Market Cap =
Stock Price X # of shares outstanding
(stock held by investors, officers, & insiders)
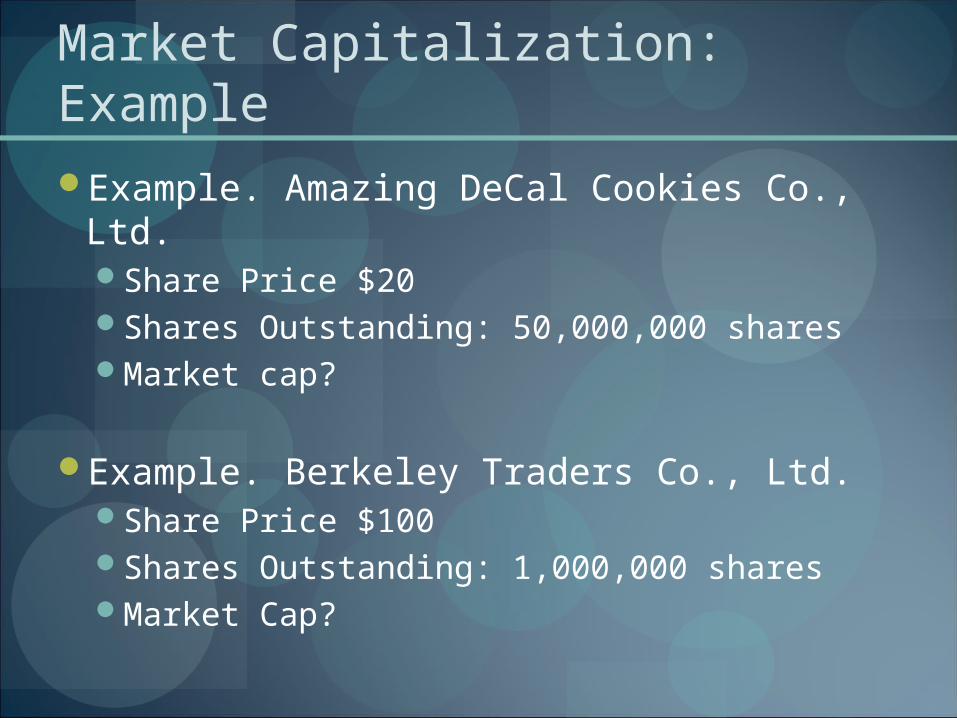
Market Capitalization: ExampleExample. Amazing DeCal Cookies Co., Ltd.
Share Price $20Shares Outstanding: 50,000,000 sharesMarket cap?
Example. Berkeley Traders Co., Ltd.Share Price $100Shares Outstanding: 1,000,000 sharesMarket Cap?
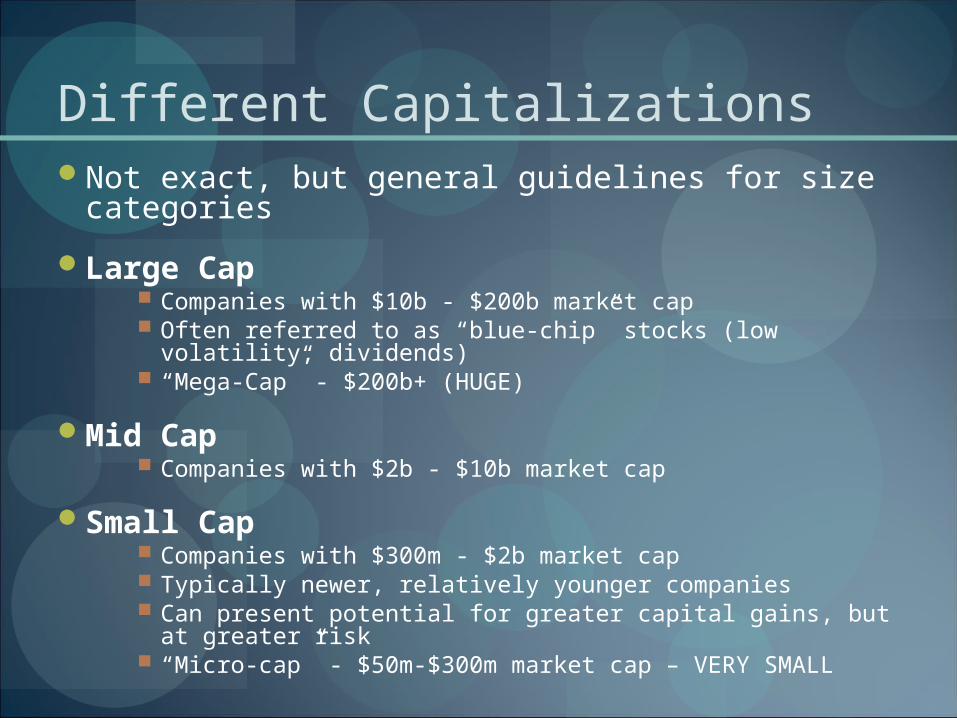
Different CapitalizationsNot exact, but general guidelines for size
categories
Large Cap Companies with $10b - $200b market cap Often referred to as “blue-chip” stocks (low volatility,
dividends) “Mega-Cap” - $200b+ (HUGE)
Mid Cap Companies with $2b - $10b market cap
Small Cap Companies with $300m - $2b market cap Typically newer, relatively younger companies Can present potential for greater capital gains, but at
greater risk “Micro-cap” - $50m-$300m market cap – VERY SMALL
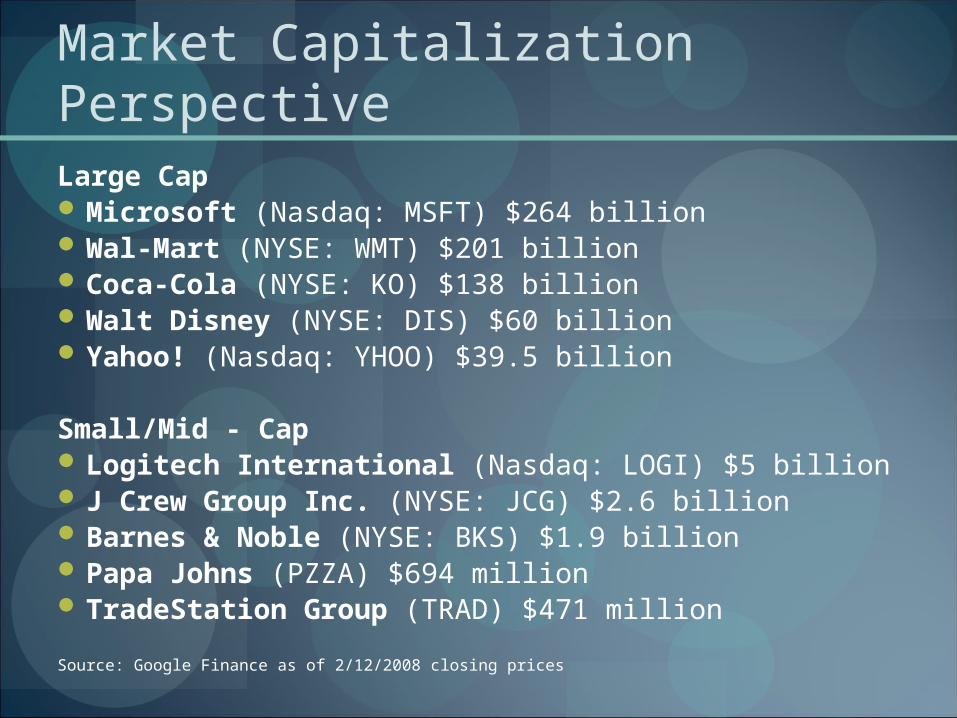
Market Capitalization PerspectiveLarge Cap Microsoft (Nasdaq: MSFT) $264 billion Wal-Mart (NYSE: WMT) $201 billion Coca-Cola (NYSE: KO) $138 billion Walt Disney (NYSE: DIS) $60 billion Yahoo! (Nasdaq: YHOO) $39.5 billion
Small/Mid - Cap Logitech International (Nasdaq: LOGI) $5 billion J Crew Group Inc. (NYSE: JCG) $2.6 billion Barnes & Noble (NYSE: BKS) $1.9 billion Papa Johns (PZZA) $694 million TradeStation Group (TRAD) $471 million
Source: Google Finance as of 2/12/2008 closing prices
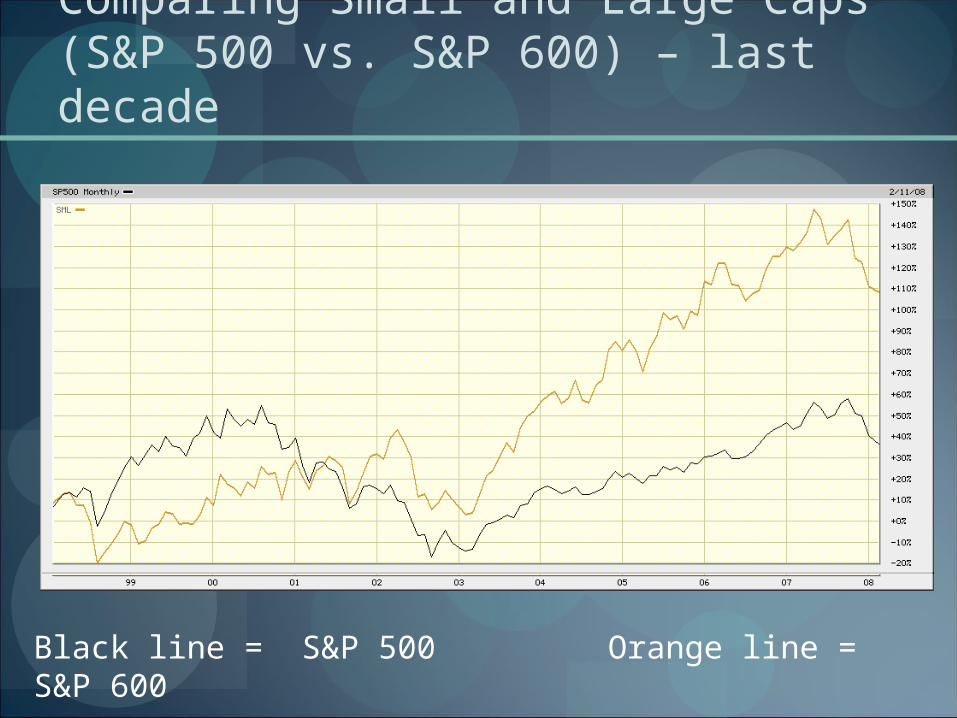
Comparing Small and Large Caps(S&P 500 vs. S&P 600) – last decade
Black line = S&P 500 Orange line = S&P 600
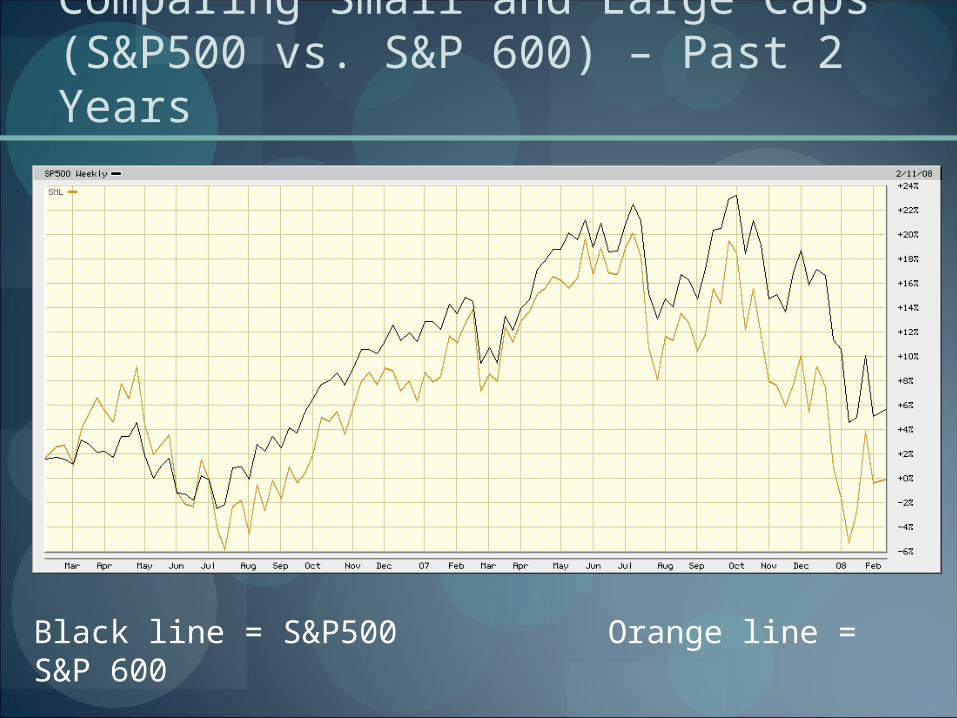
Comparing Small and Large Caps(S&P500 vs. S&P 600) – Past 2 Years
Black line = S&P500 Orange line = S&P 600
Stock SplitsStock Buybacks
Stock SplitsWhen a company divides the number of its
existing stocks into multiple shares
In 2-for-1 split, each stockholder gets an additional share for each share he or she holds
Also, value of each share is reduced in half:
2 shares now equal original value of 1 share before split (total value not changed)
Stock Splits
If you still don’t get it, think of it this way..
If you have a $100 bill, and I exchange with you two $50 bills
How many bills do you have?What is the total value of money you have?
Stock SplitsWhy do companies do this?
Brings the share price down to a more “attractive” level for smaller investors (purely psychological)Can potentially result in price increase because
these small investors will be more likely to buy the stock
Some also say stock split will increase price because it is a signal of strong growth
Increases stock’s liquidity (What is liquidity?)
Stock SplitsEffects
Excessive stock splits may hurt a stock’s pricePros and shrewd traders sometimes use
excitement generated by oversized or excessive split as an opportunity to sell and take their profits
Oversized splits create substantially larger supply
Stock BuybacksWhen a company buys back its own shares
in the market placeAlso known as “share repurchase”
Why do it?Management believes its stock value is
discounted too steeply (its too cheap)Management has confidence in the company
and want to send a message the market
Stock Buybacks# of shares outstanding go down as these
shares are bought by the company
Major impact is that it affects important financial ratios (ROA, ROE, P/E, EPS)
What do these ratios mean? Briefly, we use them to value or analyze a companyWe’ll discuss this more later
Are they good or bad?Not definitive answer, depends on the situation
Investing on Margin / Short Selling
Investing on MarginBorrowing money from brokerages to
invest
Generally, maximum 50% of a purchase can be on margin
However, when borrow money, have to pay an interest rate on money borrowed
Ex. I borrow $10,000 and broker charges 5% rate.
I have to pay $500 (10,00 x 0.05) to borrow that
money.
Investing on MarginPROS
Potential to get greater profits than investing with only cash because you profit from money you don’t have
CONSWorks against you when you lose
money – can get really ugly with lossesCharged interest for money you
borrow
Margin Example
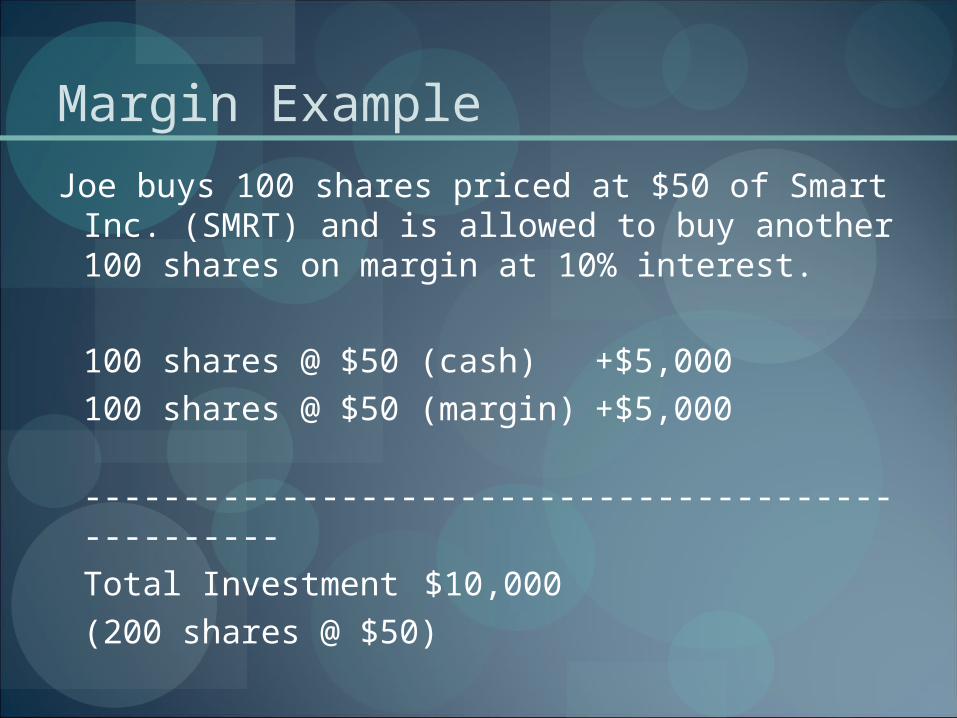
Joe buys 100 shares priced at $50 of Smart Inc. (SMRT) and is allowed to buy another 100 shares on margin at 10% interest.
100 shares @ $50 (cash) +$5,000
100 shares @ $50 (margin) +$5,000
---------------------------------------------------Total Investment $10,000
(200 shares @ $50)
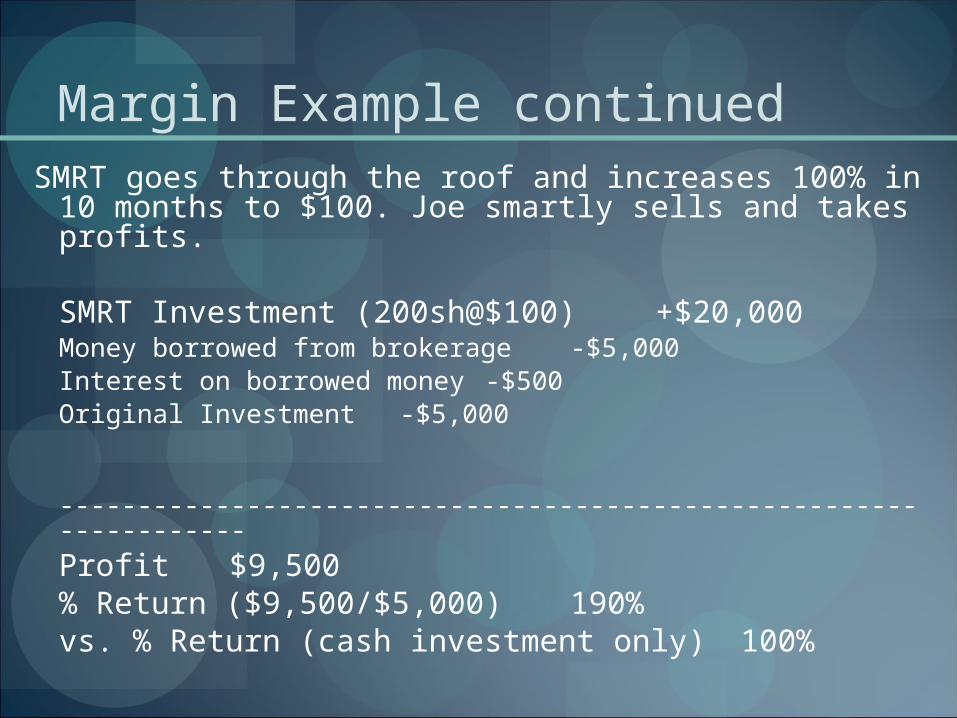
Margin Example continuedSMRT goes through the roof and increases 100% in 10
months to $100. Joe smartly sells and takes profits.
SMRT Investment (200sh@$100) +$20,000Money borrowed from brokerage -$5,000Interest on borrowed money -$500Original Investment -$5,000
-------------------------------------------------------------------Profit $9,500% Return ($9,500/$5,000) 190%vs. % Return (cash investment only) 100%
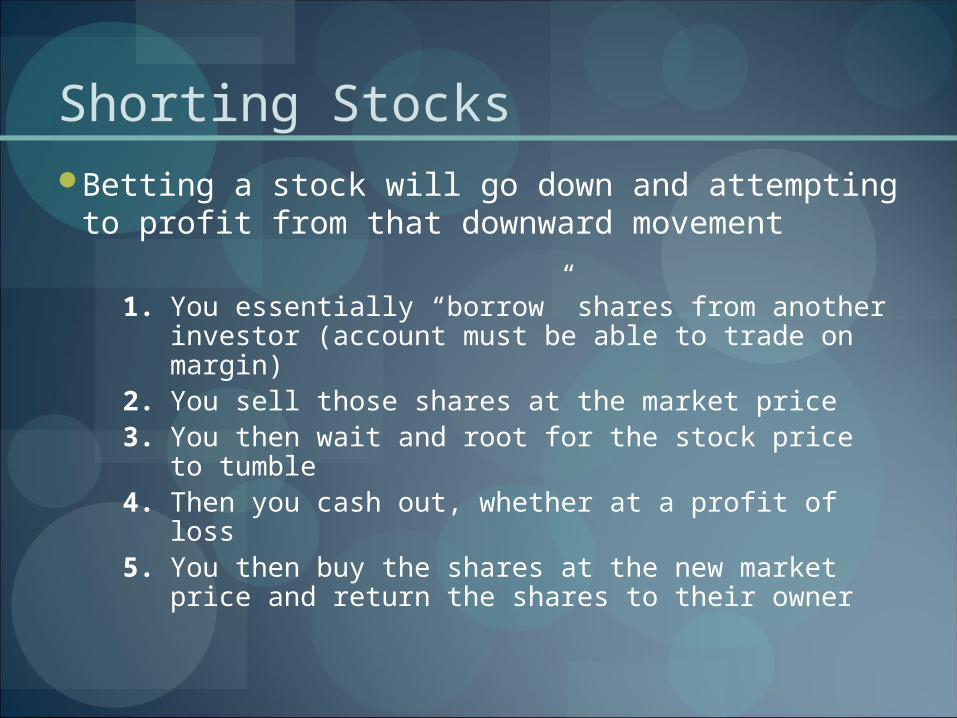
Shorting StocksBetting a stock will go down and attempting
to profit from that downward movement
1. You essentially “borrow” shares from another investor (account must be able to trade on margin)
2. You sell those shares at the market price3. You then wait and root for the stock price to
tumble4. Then you cash out, whether at a profit of loss5. You then buy the shares at the new market
price and return the shares to their owner

Shorting Example
Scenario 1Mr. Giant shorts 1000 shares of Lampere Co. at
$20 a share – his account gets credited with $20,000
Lampere Co. stock plummets to $10 a share
Borrowed and sold short 1000 shares at $20 +$20,000
Bought back and returned 1000 shares at $10 -$10,000
-----------------------------------------------------------------------------
Profit +$10,000
% Gain 100%
Shorting Example
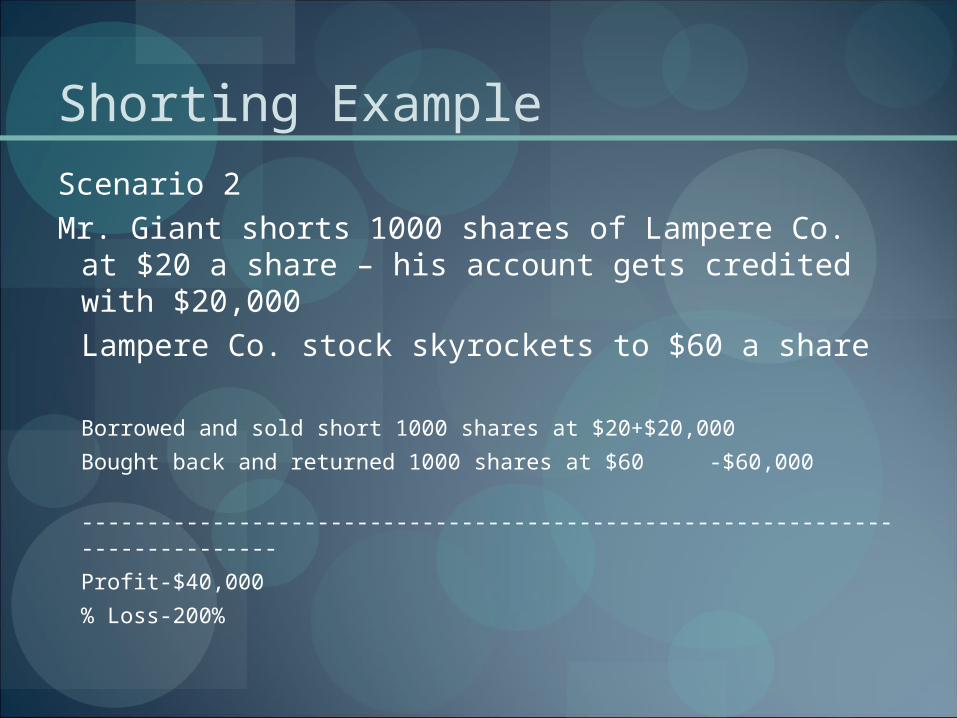
Scenario 2Mr. Giant shorts 1000 shares of Lampere Co. at
$20 a share – his account gets credited with $20,000
Lampere Co. stock skyrockets to $60 a share
Borrowed and sold short 1000 shares at $20 +$20,000
Bought back and returned 1000 shares at $60 -$60,000
-----------------------------------------------------------------------------
Profit -$40,000
% Loss -200%
Sector / IndustriesCyclical vs. Non-Cyclical
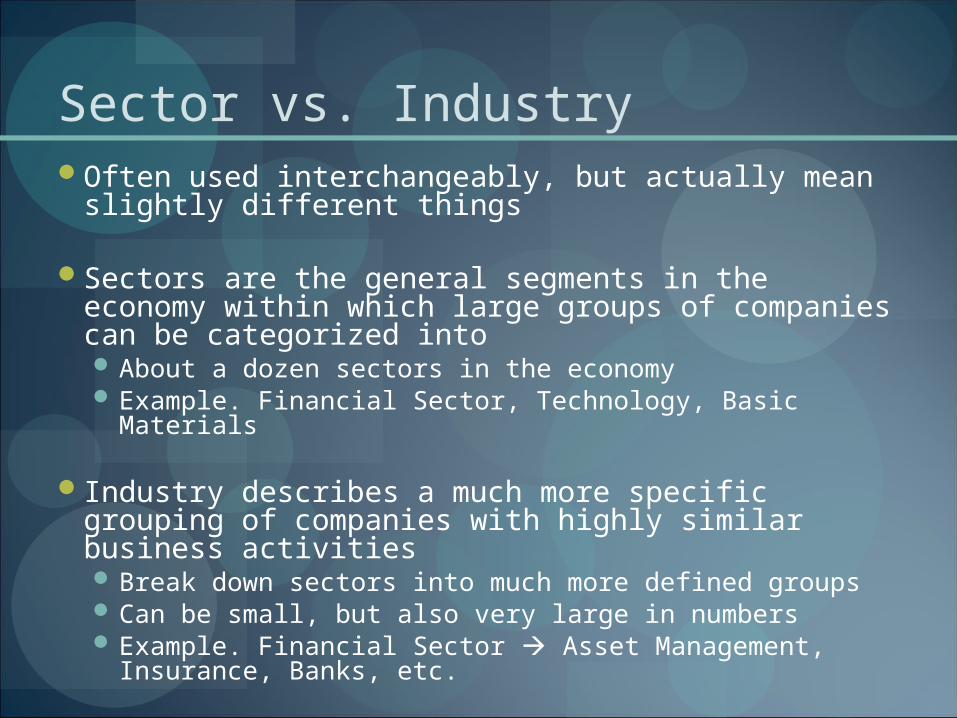
Sector vs. IndustryOften used interchangeably, but actually mean
slightly different things
Sectors are the general segments in the economy within which large groups of companies can be categorized into About a dozen sectors in the economy Example. Financial Sector, Technology, Basic Materials
Industry describes a much more specific grouping of companies with highly similar business activities Break down sectors into much more defined groups Can be small, but also very large in numbers Example. Financial Sector Asset Management,
Insurance, Banks, etc.
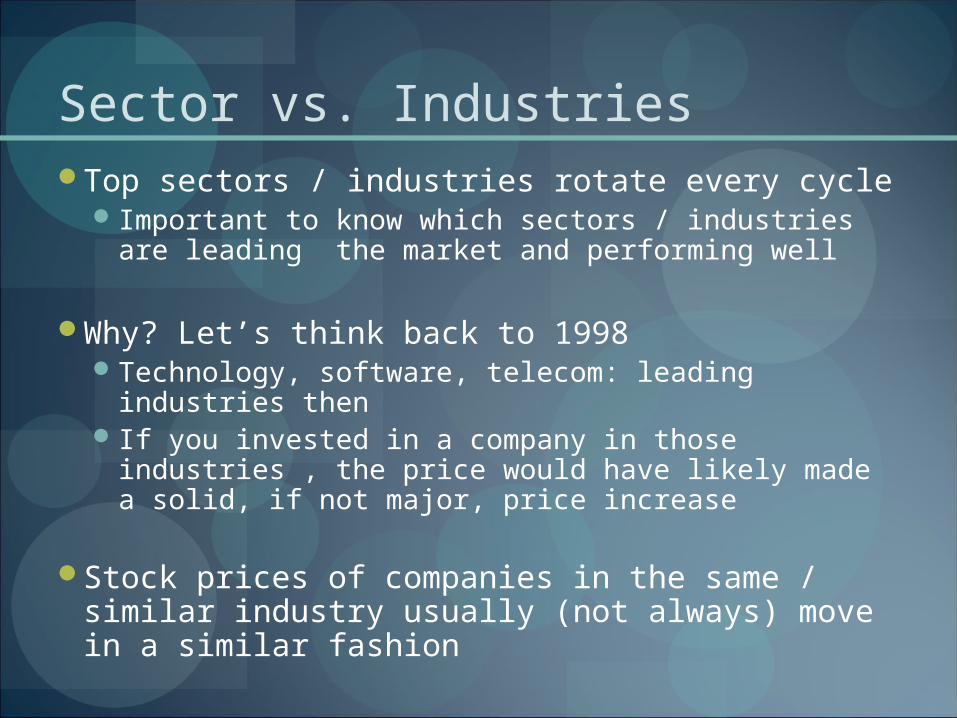
Sector vs. IndustriesTop sectors / industries rotate every cycle
Important to know which sectors / industries are leading the market and performing well
Why? Let’s think back to 1998Technology, software, telecom: leading industries
thenIf you invested in a company in those industries ,
the price would have likely made a solid, if not major, price increase
Stock prices of companies in the same / similar industry usually (not always) move in a similar fashion
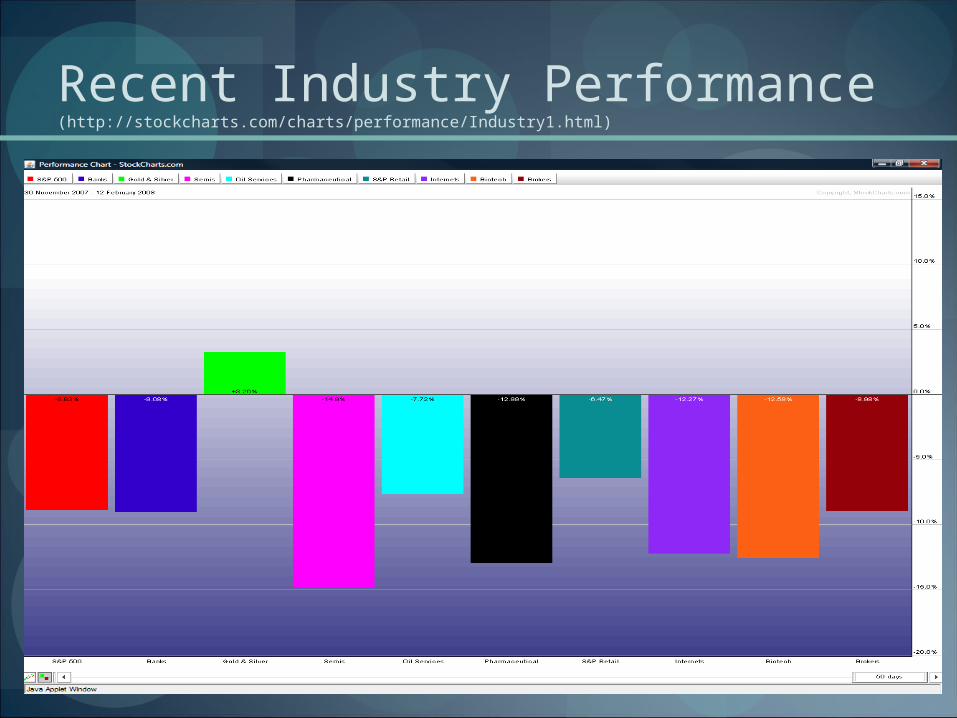
Recent Industry Performance(http://stockcharts.com/charts/performance/Industry1.html)
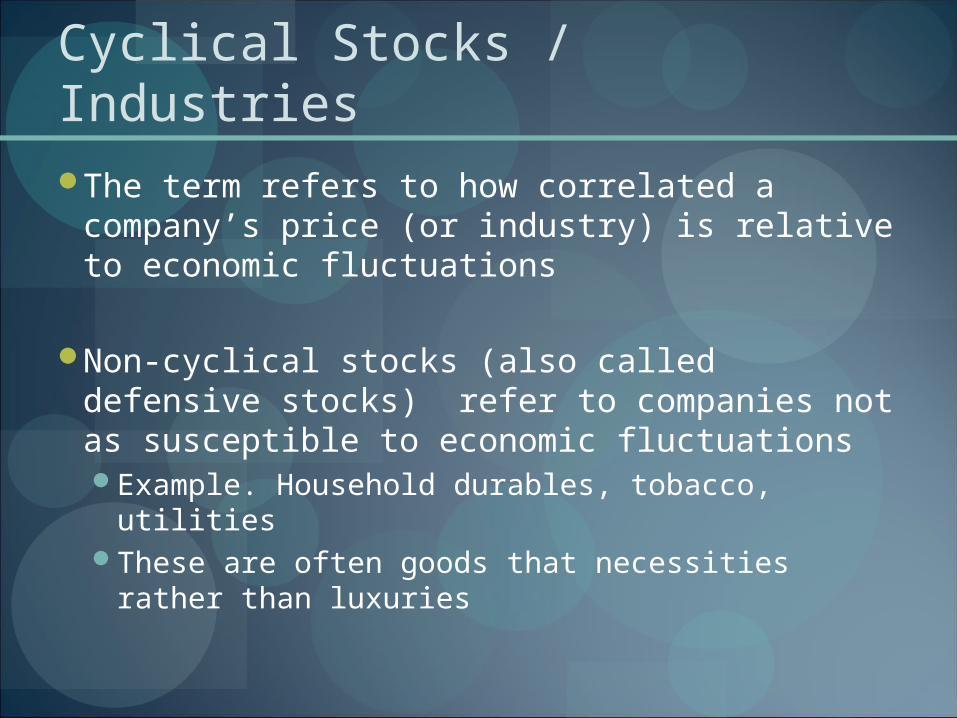
Cyclical Stocks / IndustriesThe term refers to how correlated a
company’s price (or industry) is relative to economic fluctuations
Non-cyclical stocks (also called defensive stocks) refer to companies not as susceptible to economic fluctuationsExample. Household durables, tobacco, utilitiesThese are often goods that necessities rather
than luxuries
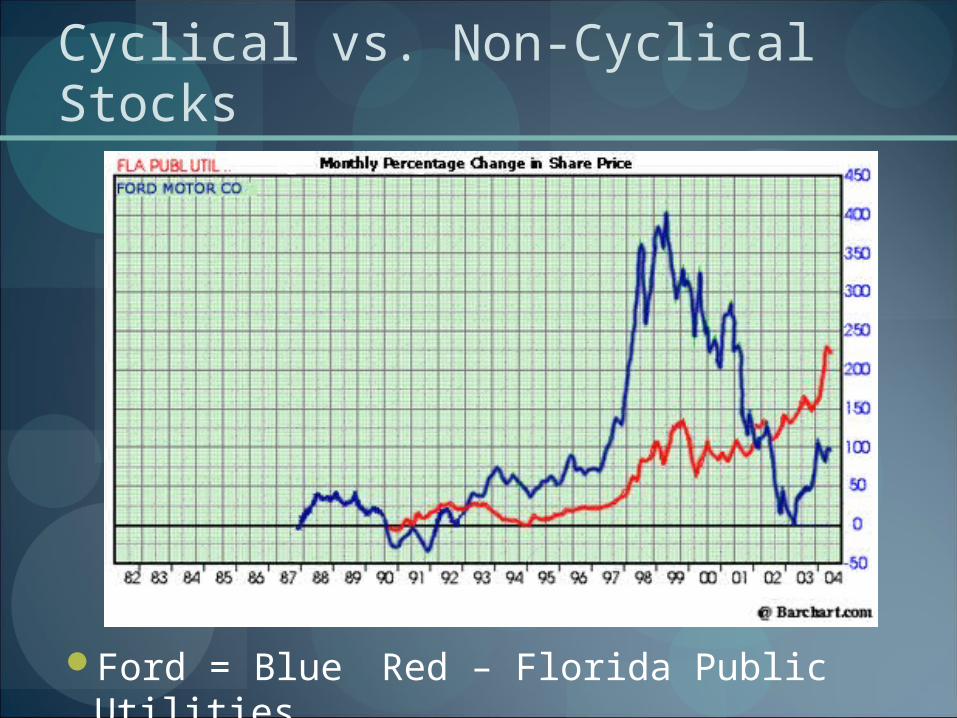
Cyclical vs. Non-Cyclical Stocks
Ford = Blue Red – Florida Public Utilities
SummaryMarket Capitalization
Small caps vs. large caps
Stock SplitsStock BuybacksEarning ReportsShorting StocksMarginIndustries vs. SectorsCyclical Stocks / Industries
For Next WeekQuiz on Stock Market Basics
Introduction to Other Investment SecuritiesBonds / Mutual Funds / Exchange-Traded Funds
Market PsychologyEmotions involved with stock investing
Basic Investing ConceptCompoundingInvesting versus SpeculatingDetermining your own financial goalsInvestment Style – Risk/Reward, Active/Passive
Managing your Portfolio
Current Events
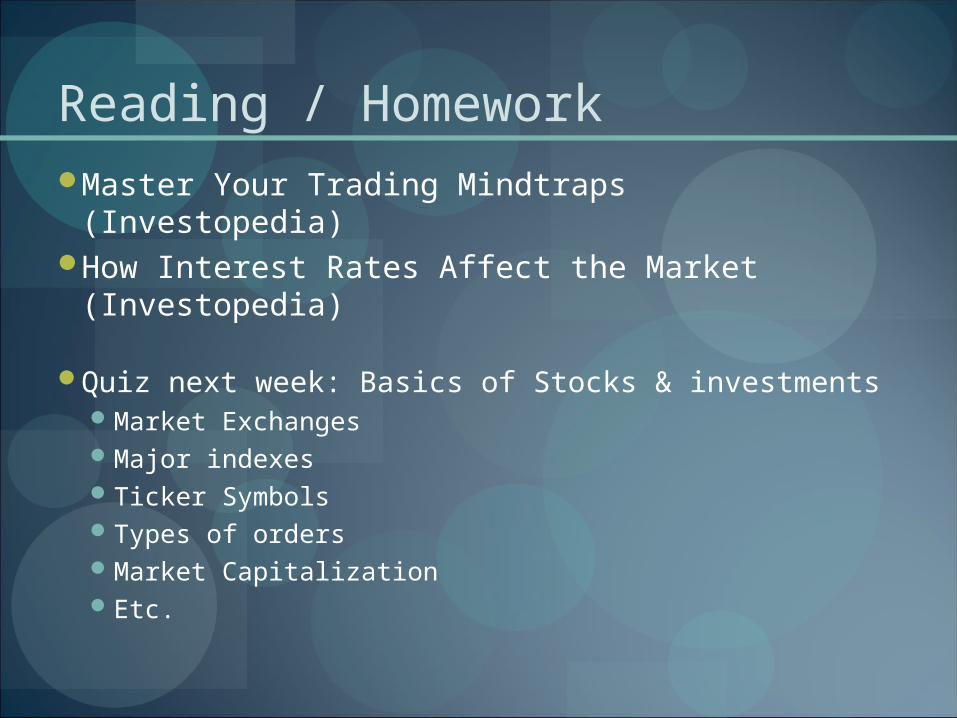
Reading / HomeworkMaster Your Trading Mindtraps (Investopedia)How Interest Rates Affect the Market
(Investopedia)
Quiz next week: Basics of Stocks & investmentsMarket ExchangesMajor indexesTicker SymbolsTypes of ordersMarket CapitalizationEtc.
Top Related