


Languages
Pages
Legal


Indicators of Inequality for Māori and Pacific People Lisa Marriott and Dalice Sim
WORKING PAPER 09/2014August 2014
Working Papers in Public Finance Chair in Public Finance Victoria Business School
The Working Papers in Public Finance series is published by the Victoria
Business School to disseminate initial research on public finance topics, from
economists, accountants, finance, law and tax specialists, to a wider audience. Any
opinions and views expressed in these papers are those of the author(s). They should
not be attributed to Victoria University of Wellington or the sponsors of the Chair in
Public Finance.
Further enquiries to:
The Administrator
Chair in Public Finance
Victoria University of Wellington
PO Box 600
Wellington 6041
New Zealand
Phone: +64-4-463-9656
Email: [email protected]
Papers in the series can be downloaded from the following website:
http://www.victoria.ac.nz/cpf/working-papers
1
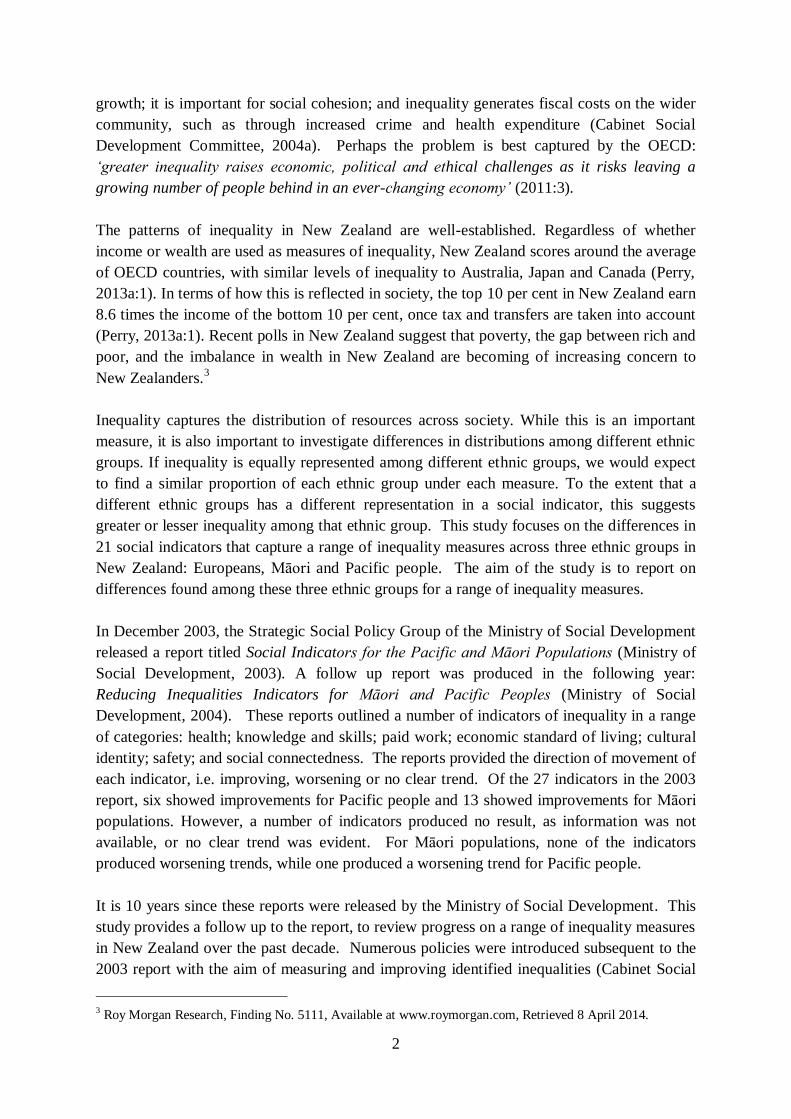
Indicators of Inequality for Māori and Pacific People
Lisa Marriott1 and Dalice Sim
2
ABSTRACT: This study investigates a number of inequality indicators in New
Zealand. The research examines the current gaps in the indicators between the
European population, and Māori and Pacific people. The study also undertakes a
comparison of the changes in the gaps over a period approximating 10 years for
each of the indicators. A total of 21 indicators are investigated in this study,
incorporating measures of health; knowledge and skills; employment; standards of
living; cultural identity; and social connectedness.
The aim of this research is to assess the extent to which indicators suggest that the
inequality gap is increasing or decreasing between European and Māori, and
European and Pacific people in New Zealand. In general, all ethnic group
measurements are moving in the same direction, that is, most ethnic groups are
improving or not improving for a specific measure. However, increases are visible
in gaps for the majority of the indicators examined in this article, that is, the
indicators suggest greater inequality has resulted over the 10-year period for both
Māori and Pacific people.
Of the 21 indicators assessed in this study, eight (38 per cent) show improvements in
the form of a decreasing gap between European and Māori, although not all of these
improvements are significant. Less positive results are visible in 12 indicators (57
per cent), which produce increasing gaps between European and Māori. One
indicator is largely unchanged. Not all indicators are available for Pacific people,
but of the indicators measured, five (29 per cent) showed an improvement in the form
of closing gaps between the European population and Pacific people. Again not all
of the decreases in gaps are significant. Worsening differences were found in 11 (65
per cent) of the indicators measuring inequality between the European population
and Pacific people. Similarly to the Māori population, one indicator remained
unchanged.
1.0 Introduction
Most OECD countries have seen an increase in the gaps between the wealthy and the less-
wealthy in recent times (OECD, 2008). Addressing inequality is important for multiple
reasons: it assists with creating a fair society where individuals have equality of opportunity
by identifying specific areas where improvement is required; it is important for economic
1 Associate Professor, School of Accounting and Commercial Law, Victoria Business School, Victoria
University of Wellington. Contact: [email protected]; telephone +64 4 463 5938. 2 Dalice Sim is the Statistical Consultant for Victoria University of Wellington, New Zealand. Contact details:
2
growth; it is important for social cohesion; and inequality generates fiscal costs on the wider
community, such as through increased crime and health expenditure (Cabinet Social
Development Committee, 2004a). Perhaps the problem is best captured by the OECD:
‘greater inequality raises economic, political and ethical challenges as it risks leaving a
growing number of people behind in an ever-changing economy’ (2011:3).
The patterns of inequality in New Zealand are well-established. Regardless of whether
income or wealth are used as measures of inequality, New Zealand scores around the average
of OECD countries, with similar levels of inequality to Australia, Japan and Canada (Perry,
2013a:1). In terms of how this is reflected in society, the top 10 per cent in New Zealand earn
8.6 times the income of the bottom 10 per cent, once tax and transfers are taken into account
(Perry, 2013a:1). Recent polls in New Zealand suggest that poverty, the gap between rich and
poor, and the imbalance in wealth in New Zealand are becoming of increasing concern to
New Zealanders.3
Inequality captures the distribution of resources across society. While this is an important
measure, it is also important to investigate differences in distributions among different ethnic
groups. If inequality is equally represented among different ethnic groups, we would expect
to find a similar proportion of each ethnic group under each measure. To the extent that a
different ethnic groups has a different representation in a social indicator, this suggests
greater or lesser inequality among that ethnic group. This study focuses on the differences in
21 social indicators that capture a range of inequality measures across three ethnic groups in
New Zealand: Europeans, Māori and Pacific people. The aim of the study is to report on
differences found among these three ethnic groups for a range of inequality measures.
In December 2003, the Strategic Social Policy Group of the Ministry of Social Development
released a report titled Social Indicators for the Pacific and Māori Populations (Ministry of
Social Development, 2003). A follow up report was produced in the following year:
Reducing Inequalities Indicators for Māori and Pacific Peoples (Ministry of Social
Development, 2004). These reports outlined a number of indicators of inequality in a range
of categories: health; knowledge and skills; paid work; economic standard of living; cultural
identity; safety; and social connectedness. The reports provided the direction of movement of
each indicator, i.e. improving, worsening or no clear trend. Of the 27 indicators in the 2003
report, six showed improvements for Pacific people and 13 showed improvements for Māori
populations. However, a number of indicators produced no result, as information was not
available, or no clear trend was evident. For Māori populations, none of the indicators
produced worsening trends, while one produced a worsening trend for Pacific people.
It is 10 years since these reports were released by the Ministry of Social Development. This
study provides a follow up to the report, to review progress on a range of inequality measures
in New Zealand over the past decade. Numerous policies were introduced subsequent to the
2003 report with the aim of measuring and improving identified inequalities (Cabinet Social
3 Roy Morgan Research, Finding No. 5111, Available at www.roymorgan.com, Retrieved 8 April 2014.

3
Development Committee, 2004a, 2004b, 2004c). The initial reports provided absolute and
relative measures of improvement against previous measures for the same population and a
comparison population, usually Europeans. This research adopts the same approach.
This study commences with a review of some of the recent literature on inequality. This is
followed in section three with a discussion of the methodology and data sources used in this
study. Section four outlines the data and the data analysis, while section five provides a
discussion of the findings. The article concludes in section six.
2.0 Background
The issues relating to inequality have become well known over the past decade. This may, at
least in part, be attributed to works such as The Spirit Level: Why Equality is Better for
Everyone (Wilkinson and Pickett, 2010) and The Price of Inequality (Stiglitz, 2013). Studies
such as these have raised the profile of inequality and communicated the potential wide-
ranging effects from inequality; not just among those who are among the lower deciles in
society. A further issue with inequality is the suggestion that it has a long-term effect, with
income inequality experienced early in life, resulting in reduced social mobility later in life
(Corak, 2013; Rashbrooke, 2014).
There are multiple other reasons why equality is desirable. Inequality limits the opportunities
for people to maximise their potential contribution to the economy and to society (Nana,
2013). The economic loss is explained by Nana (2013:60) as ‘a very real economic loss
incurred by the existence of unemployed, under-employed, untrained, disenchanted,
disconnected, disenfranchised and, indeed, disruptive resources’. Nana (2013:61) expands
on the inefficiency generated by inequality by highlighting the additional resources that are
diverted from wealth-enhancing activities and allocated to ‘picking up the pieces’. The
impacts of the inefficiency generated from inequality are felt across all of society, including
businesses who have a less skilled workforce; higher tax rates to fund the costs of inequality;
and the lost potential economic growth from under-utilisation of human resources.
Multiple studies link poor health measures to income inequality. For example, research
suggests that national mortality rates are lowest in countries that have smaller income
differences (Wilkinson, 1997); income inequality leads to increased mortality (Kawachi,
Kennedy, Lochner and Prothrow-Stith, 1997); and income inequality ‘is accompanied by
many differences in conditions of life at the individual and population levels, which may
adversely influence health’ (Lynch, Davey Smith, Kaplan and House, 2000).
While inequality has been shown to produce negative outcomes at the individual level, lower
levels of inequality have been shown to produce positive outcomes at a national level. For
example, Ostry, Berg and Tsangarides (2014:4) show that lower net inequality is robustly
correlated with faster and more durable economic growth. This was recognised by the New
Zealand Cabinet Social Development Committee (2004a), with the observation that
prosperity depends on improving the productivity of all citizens and that providing greater
opportunities for everyone will allow greater participation in, and contribution to, society.
4
While inequality is not solely related to income inequality, the income inequality measure is
one of the most common measures used as a determinant of standard of living. As noted by
the OECD (2013:66) high income inequalities ‘typically imply a waste of human resources,
in the form of a large share of the population out of work or trapped in low-paid and low-
skilled jobs’. However, one of the key difficulties with assessing income inequality is the
difficulty in obtaining measures that effectively capture differences in incomes (Cribb, Hood,
Joyce and Phillips, 2013). The most common measure of income inequality is the Gini
coefficient. The Gini coefficient ranges from zero to one, with higher numbers indicating
higher levels of inequality. The Gini coefficient is based on a comparison of cumulative
proportions of the population against cumulative proportions of income received (OECD,
2013). Thus, perfect equality is achieved when the Gini coefficient value is zero (that is,
where the bottom 10 per cent of the population receive 10 per cent of the income, the bottom
20 per cent of the population receive 20 per cent of the income, etc. (Stiglitz, 2013)). Perfect
inequality exists when the Gini coefficient value is one, as this represents a situation where
all income goes to one person. While there has been considerable variation in income
inequality among OECD countries as measured by the Gini coefficient in recent decades,
New Zealand has shown one of the strongest increases in income inequality over the period
from the mid-1980s to the mid-2000s (OECD, 2011:228). The most recent Gini coefficient
for New Zealand is 2011, where it was 0.32 (OECD, 2014). This is the same as Australia and
the OECD average. However, it is higher than Denmark (0.25), Finland (0.27), Norway
(0.25) and Sweden (0.27) (OECD, 2014).
The OECD (2008) raises a number of factors that have influenced changes in both income
inequality and poverty over time. The primary factors that are visible among OECD
countries include:
Changes in the structure of the population, including the increase in the number of
single-person households.
Earnings becoming more unequal. This is driven by globalisation, skill-biased
technical change and labour market institutions.
Falling employment rates among people who are less educated.
Unequal distribution of capital income and self-employment income (OECD, 2008).
Historically, on average, general outcomes for Māori and Pacific people have been less
positive than those for the European population. Perry (2013b:124) reports that Māori and
Pacific ethnic groups typically have poverty rates that are around double those of the
European/Pakeha ethnic group, regardless of the measure used. Using the measure of less
than 60 per cent of the median income, 23 per cent of Māori, 22 per cent of Pacific people,
and 11 per cent of European/Pakeha people had household incomes below this threshold
(Perry, 2013b:124). While poverty is a different issue to inequality, to the extent that greater
inequalities exist among certain ethnic groups, the result is higher levels of poverty among
these ethnic groups.
5
Other examples of reported gaps in performance include:
A secondary school retention rate (to age 17) for Māori students of 50.6% (75.4% for
non-Māori);
Unemployment rate for Māori youth of 25.7% (14.2% for non-Māori);
School leavers achieving University Entrance standard (NCEA Level 2) for Māori
Youth of 25% (47.9% for non-Māori);
A higher rate of Māori youth not in education or employment or training at 22.4 per
cent (9.1 per cent for the non-Māori population) (Te Puni Kōkiri, 2012).
At the time of the Ministry of Social Development (2003, 2004) reports that this study
replicates a number of policy initiatives were proposed to assist with addressing inequality.4
These policies included:
Ensuring a robust programme of early intervention for at-risk children and families;
Addressing the income needs of children in low-income families through
implementation of the Working for Families programme;
Continuing the focus on the health needs of families/whänau through improving
access to health services;
Increasing participation in early childhood education where participation is low;
Improving participation and achievement among young people who are at risk of
leaving school with few qualifications;
Improving access to education, training and employment for economically inactive
young people;
Addressing the barriers to employment;
Tackling risk factors of poor health and improving access to services for those
currently at risk of poor health outcomes (Cabinet Social Development Committee,
2004a:2).
A number of these policies were implemented at or around the time of the Ministry of Social
Development (2003, 2004) reports, or are ongoing at the present time, such as addressing the
barriers to employment and tackling risk factors relating to health. However, the focus that
was visible a decade ago on specifically addressing the drivers of inequality appears to have
diminished, with the last six-monthly report on reducing inequalities produced for the period
July to December 2003 (Cabinet Social Development Committee, 2004c).5 At the time of the
last six-monthly report, 109 initiatives were reported on by 12 government agencies. Of the
109 initiatives, 49 were from the Ministry of Education, 14 were from the Ministry of Health
and 10 were from the Ministry of Housing.
4 Refer to Cabinet Social Development Committee (2004a), p.11, Table 3: Reducing Inequalities Policies and
Programmes, for a more comprehensive overview of policies and programmes targeted towards reducing
inequalities. 5 The six-monthly report was a report of departmental activity on initiatives to reduce inequality.
6
3.0 Methodology
This study is a comparative study of the European, Māori, and Pacific people in New Zealand
using a number of inequality indicators. The study replicates work undertaken by the
Ministry of Social Development in New Zealand in 2003 and 2004, where two reports were
produced outlining a number of indicators intended to measure inequality among Māori and
Pacific people. This research reviews the same indicators after a period as close as possible
to 10 years. Not all of the measures reported in the initial studies have been replicated here.
For some indicators, data is not available, or due to measurement changes over the 10-year
period, it is not comparable over time. The following section outlines the data and statistical
methods used to assess the indicators outlined in section four.
3.1 Data
The four primary ethnic groups in New Zealand are European, Māori, Pacific people and
Asian. This study investigates European, Māori and Pacific people. Ethnicity is ‘the ethnic
group or groups that people identify with or feel they belong to’.6 The measure is based on
self-perception and it is possible to belong to more than one ethnic group. In census data, and
other official statistics, a person identifying with more than one ethnic group will be counted
once in each group.
As our primary research focus is on inequality differences between Māori and Pacific people,
we have not included Asian people in this analysis. Asian people are the third most common
ethnic grouping in New Zealand, with 12 per cent of the population identifying with at least
one Asian ethnic group in the 2013 census. Of the four primary ethnic groups, the Asian
group is increasing at the fastest pace, with a 33 per cent increase since the previous census in
2006.7 Of relevance to this study is that Asian people are often proportionately more highly
represented in positive indicators. Thus, this is changing outcomes for the other ethnic
groups, which is an important consideration in interpreting some of the indicators discussed
in this study.
There are demographic differences between the three populations investigated in this study.
In the most recent New Zealand census, 74 per cent of people identified with at least one
European ethnicity; 15 per cent identified as Māori; and 7 per cent identified as Pacific
people.8 The median age is 41 years for those identifying as European; 23.9 years for those
6 Statistics New Zealand. 2014. Statistical Standard for Ethnicity. Available at www.stats.govt.nz, Retrieved 9
July 2014. 7 Statistics New Zealand. 2013 Census – Major Ethnic Groups in New Zealand. Available at www.stats.govt.nz,
Retrieved 9 July 2014. 8 These figures show the proportion of people who identified with this ethnic group. As individuals may identify
with more than one ethnic group, the totals of the ethnic groups do not add to 100 per cent. Prioritisation (where
the ethnic group of a person with multiple ethnic group identifications is assigned to just one ethnic group) is no
longer used in official statistics in New Zealand, as it may mask diversity between ethnic groups. Statistics New
Zealand. 2006. The Impact of Prioritisation on the Interpretation of Ethnicity Data. Wellington: Statistics New
Zealand.
7
identifying as Māori; and 22.1 years for those identifying as Pacific people.9 Thus, the
population groups for Māori and Pacific people are younger than the European group.
Each of the indicators is presented in a table showing data in two time periods, with as close
as possible to a 10-year gap. Each of the tables also shows the absolute and relative change
over the two time periods shown, as well as the gaps between the European population, and
Māori and Pacific people over the specified periods.10
In some cases a negative difference
indicates that the gaps have closed, i.e., there is some degree of ‘catching-up’ in the indicator;
while in other cases a negative difference indicates that the gaps have widened. For the
purposes of clarity, we have also explicitly stated whether the data shows a closing or
increasing gap.
3.2 Statistical Methods
Data for this study come from a variety of public sources and institutions, including Statistics
New Zealand, the Ministry of Education and the Ministry of Social Development. For some
data (e.g. statistics on numbers enrolled in schools as recorded by the Ministry of Education),
the numbers presented come from a complete count of individuals or a census of individuals.
In such cases, the figures have been used as percentages without error, and no statistical
analysis has been done.
Other estimates of percentages come from survey data, for example the Household Labour
Force Survey conducted by Statistics New Zealand. In these cases, we have tried to determine
the sampling error in the percentages so that we can conduct the appropriate test to determine
if there is enough evidence for a difference between ethnic groups. This has not always been
possible, but when it has been possible, the relevant statistics and their significance have been
presented.
4.0 Indicators of Inequality
This section is comprised of six sub-sections. Each sub-section addresses a different group of
inequality indicators. As outlined above, the indicators are those used in earlier studies by
the Ministry of Social Development (2003, 2004). The measures are from the following
categories: health; knowledge and skills; paid work; economic standard of living; cultural
identity; and social connectedness.
4.1 Health
Studies indicate that greater inequality, typically measured by income, results in poorer
average health (Barnett, Moon and Kearns, 2004). The extent of inequalities in health in
New Zealand was described as ‘unacceptable’ by the Deputy Director-General of Public
Health in 2003 (Ajwani, Blakely, Robson, Tobias and Bonne, 2003:iii). Research typically
shows health outcomes for Māori people as poorer than other population groupings. For
example, research by Bramley, Hebert, Tuzzio and Chassin (2005) reports on differences in
9 Statistics New Zealand. 2013 Census – Major Ethnic Groups in New Zealand. Available at www.stats.govt.nz,
Retrieved 9 July 2014. 10
For some indicators a non-Māori, non-Pacific comparison group, or a non-Māori comparison group, is used.
8
health outcomes between the numerically dominant population group and the indigenous
population in the United States (Europeans and American Indians/Alaska Natives) and New
Zealand (Europeans and Māori). In both countries poorer health outcomes are reported
among the minority populations. However, in almost every health status indicator assessed in
the study, disparities were more pronounced for Māori people than for American
Indians/Alaska Natives, despite significant gains in the health measures investigated over
recent decades. Similarly, Ajwani et al. (2003) also find that indigenous people tend to have
poorer health outcomes when compared to the majority population.
It is also acknowledged that the association between income inequality and health measures
is contentious. While studies have shown correlations between income inequality and various
measures of health, studies have also reported no convincing evidence to support these
assertions. For example, Blakely, Atkinson and O’Dea (2003) find no association of income
inequality with all causes of mortality for either men or women in New Zealand.
This study reports on five measures of health over the following sub-sections: life expectancy
at birth; prevalence of cigarette smoking; obesity; suicide rates; and infant mortality.
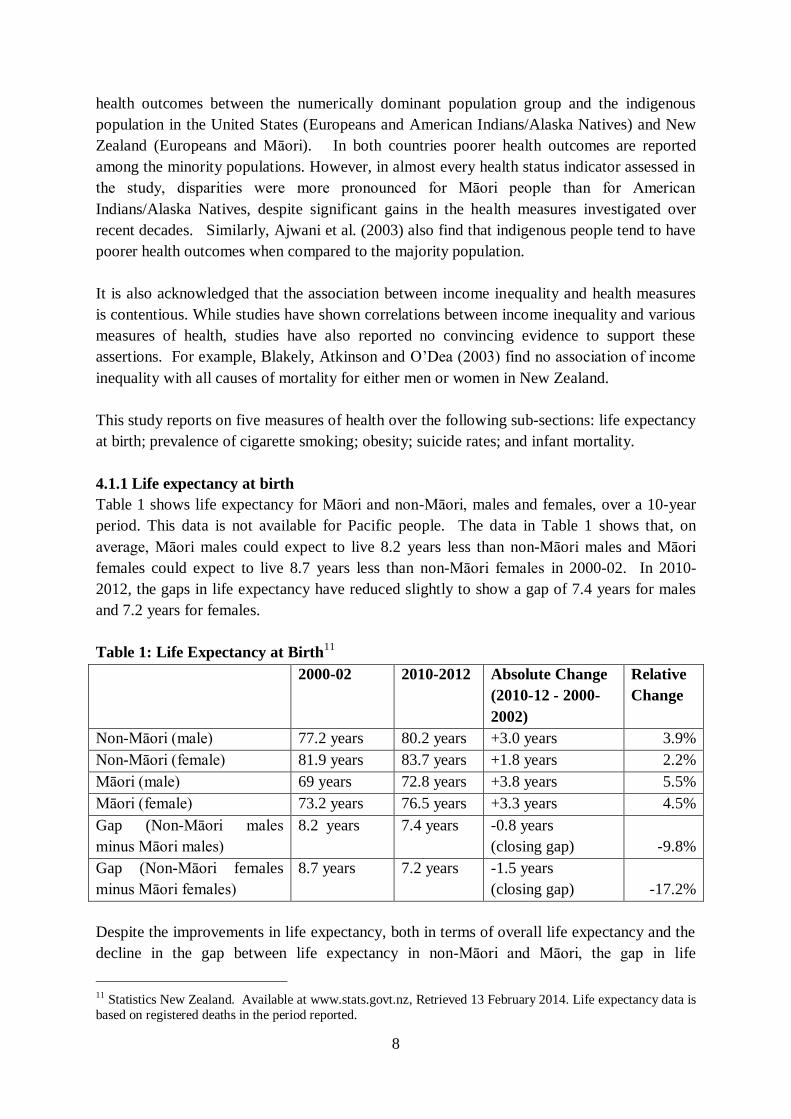
4.1.1 Life expectancy at birth
Table 1 shows life expectancy for Māori and non-Māori, males and females, over a 10-year
period. This data is not available for Pacific people. The data in Table 1 shows that, on
average, Māori males could expect to live 8.2 years less than non-Māori males and Māori
females could expect to live 8.7 years less than non-Māori females in 2000-02. In 2010-
2012, the gaps in life expectancy have reduced slightly to show a gap of 7.4 years for males
and 7.2 years for females.
Table 1: Life Expectancy at Birth11
2000-02 2010-2012 Absolute Change
(2010-12 - 2000-
2002)
Relative
Change
Non-Māori (male) 77.2 years 80.2 years +3.0 years 3.9%
Non-Māori (female) 81.9 years 83.7 years +1.8 years 2.2%
Māori (male) 69 years 72.8 years +3.8 years 5.5%
Māori (female) 73.2 years 76.5 years +3.3 years 4.5%
Gap (Non-Māori males
minus Māori males)
8.2 years 7.4 years -0.8 years
(closing gap) -9.8%
Gap (Non-Māori females
minus Māori females)
8.7 years 7.2 years -1.5 years
(closing gap) -17.2%
Despite the improvements in life expectancy, both in terms of overall life expectancy and the
decline in the gap between life expectancy in non-Māori and Māori, the gap in life
11 Statistics New Zealand. Available at www.stats.govt.nz, Retrieved 13 February 2014. Life expectancy data is
based on registered deaths in the period reported.
9
expectancy for both Māori males and females remains high at over seven years for both
males and females. These gaps are, at least in part, attributable to different rates of diabetes
and cigarette smoking, as well as socio-economic factors (Statistics New Zealand, 2009:15).
4.1.2 Cigarette Smoking
Smoking is an important social indicator due to its impact on health outcomes. Blakely,
Fawcett, Hunt and Wilson (2006) demonstrate a link between tobacco smoking and ethnic
inequalities in mortality in New Zealand; while Barnett, Pearce and Moon (2005) find that
levels of social inequality between Māori and European people have an independent effect on
Māori smoking rates.
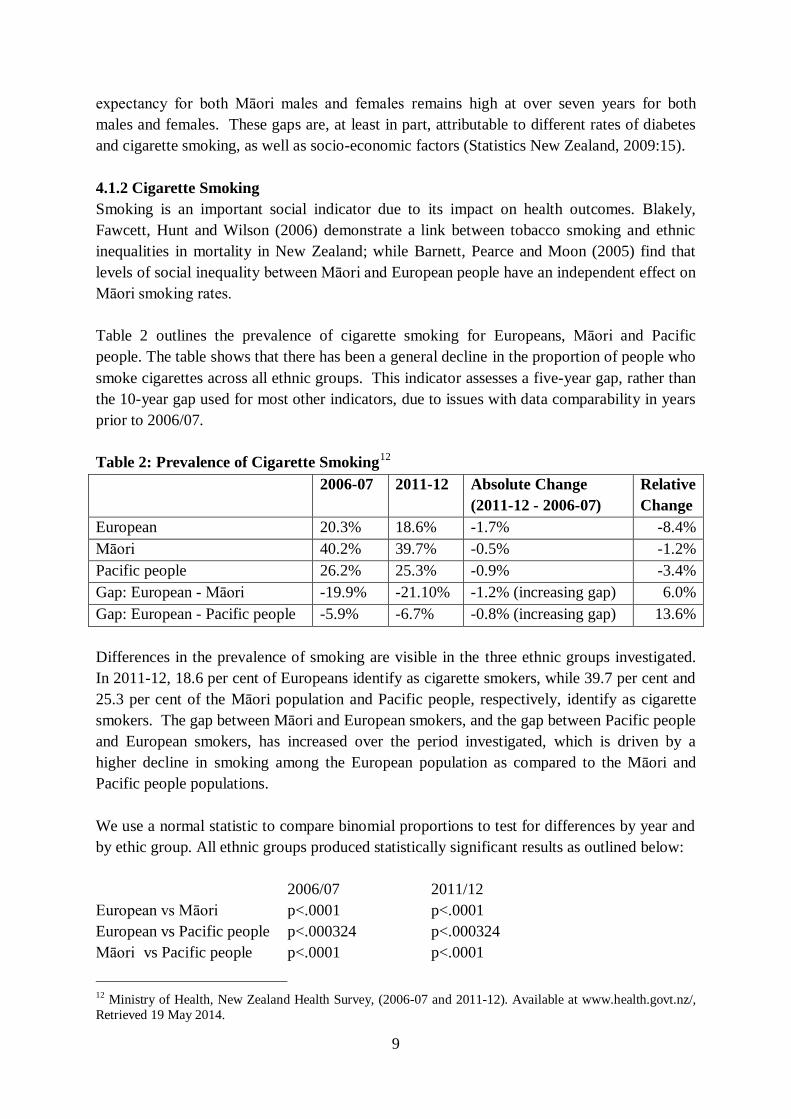
Table 2 outlines the prevalence of cigarette smoking for Europeans, Māori and Pacific
people. The table shows that there has been a general decline in the proportion of people who
smoke cigarettes across all ethnic groups. This indicator assesses a five-year gap, rather than
the 10-year gap used for most other indicators, due to issues with data comparability in years
prior to 2006/07.
Table 2: Prevalence of Cigarette Smoking12
2006-07 2011-12 Absolute Change
(2011-12 - 2006-07)
Relative
Change
European 20.3% 18.6% -1.7% -8.4%
Māori 40.2% 39.7% -0.5% -1.2%
Pacific people 26.2% 25.3% -0.9% -3.4%
Gap: European - Māori -19.9% -21.10% -1.2% (increasing gap) 6.0%
Gap: European - Pacific people -5.9% -6.7% -0.8% (increasing gap) 13.6%
Differences in the prevalence of smoking are visible in the three ethnic groups investigated.
In 2011-12, 18.6 per cent of Europeans identify as cigarette smokers, while 39.7 per cent and
25.3 per cent of the Māori population and Pacific people, respectively, identify as cigarette
smokers. The gap between Māori and European smokers, and the gap between Pacific people
and European smokers, has increased over the period investigated, which is driven by a
higher decline in smoking among the European population as compared to the Māori and
Pacific people populations.
We use a normal statistic to compare binomial proportions to test for differences by year and
by ethic group. All ethnic groups produced statistically significant results as outlined below:
2006/07 2011/12
European vs Māori p<.0001 p<.0001
European vs Pacific people p<.000324 p<.000324
Māori vs Pacific people p<.0001 p<.0001
12 Ministry of Health, New Zealand Health Survey, (2006-07 and 2011-12). Available at www.health.govt.nz/,
Retrieved 19 May 2014.
10
For this indicator we find that in terms of the overall reduction in smoking between 2006/07
and 2011/12, the European ethnic group produces a significant reduction. However, the
Māori and Pacific people groups do not have statistically significant reductions in overall
levels of smoking. The initial Ministry of Social Development report (Ministry of Social
Development, 2003) observes that while there were declines in cigarette smoking in the
1980s, the decline had slowed in more recent years. The data outlined above shows that the
declining trend remains, although this is weaker for Māori and Pacific people. However, the
declining trend in cigarette smoking is forecast to continue as higher taxes are imposed on
cigarettes.
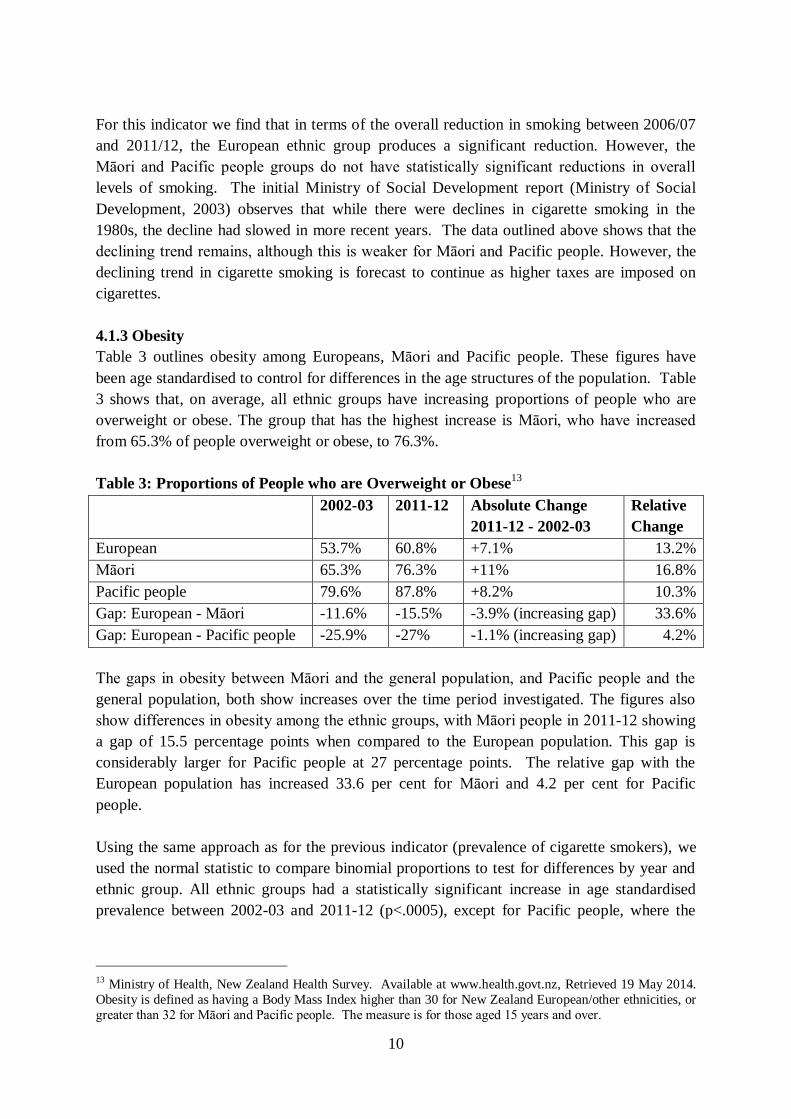
4.1.3 Obesity
Table 3 outlines obesity among Europeans, Māori and Pacific people. These figures have
been age standardised to control for differences in the age structures of the population. Table
3 shows that, on average, all ethnic groups have increasing proportions of people who are
overweight or obese. The group that has the highest increase is Māori, who have increased
from 65.3% of people overweight or obese, to 76.3%.
Table 3: Proportions of People who are Overweight or Obese13
2002-03 2011-12 Absolute Change
2011-12 - 2002-03
Relative
Change
European 53.7% 60.8% +7.1% 13.2%
Māori 65.3% 76.3% +11% 16.8%
Pacific people 79.6% 87.8% +8.2% 10.3%
Gap: European - Māori -11.6% -15.5% -3.9% (increasing gap) 33.6%
Gap: European - Pacific people -25.9% -27% -1.1% (increasing gap) 4.2%
The gaps in obesity between Māori and the general population, and Pacific people and the
general population, both show increases over the time period investigated. The figures also
show differences in obesity among the ethnic groups, with Māori people in 2011-12 showing
a gap of 15.5 percentage points when compared to the European population. This gap is
considerably larger for Pacific people at 27 percentage points. The relative gap with the
European population has increased 33.6 per cent for Māori and 4.2 per cent for Pacific
people.
Using the same approach as for the previous indicator (prevalence of cigarette smokers), we
used the normal statistic to compare binomial proportions to test for differences by year and
ethnic group. All ethnic groups had a statistically significant increase in age standardised
prevalence between 2002-03 and 2011-12 (p<.0005), except for Pacific people, where the
13 Ministry of Health, New Zealand Health Survey. Available at www.health.govt.nz, Retrieved 19 May 2014.
Obesity is defined as having a Body Mass Index higher than 30 for New Zealand European/other ethnicities, or
greater than 32 for Māori and Pacific people. The measure is for those aged 15 years and over.

11
difference between years was significant at the p=.0036 level. In addition, each ethnic group
was significantly different from the other two in both 2002-03 and 2011-12 (p<.00005).
4.1.4 Age-Standardised Suicide Rates
The age-standardised suicide indicator measures deaths by suicide per 100,000 people. These
figures for 2000 and 2010 are shown in Table 4. It is noted that relative to the size of the
populations, deaths by suicide are small and therefore significant fluctuations may occur
year-on-year. The analysis in this study also investigated the previous three years for
variance, which produced similar results to that shown in Table 4. Figures for Pacific people
are not available for this indicator.
Table 4: Age-Standardised Suicide Rates for Māori and Non-Māori14
2000 2010 Absolute Change
(2010-2000)
Relative
Change
Non-Māori (male) 18.8 15.4 -3.4 -18.1%
Non-Māori (female) 4.2 5.7 +1.5 35.7%
Māori (male) 25.5 23.9 -1.6 -6.3%
Māori (female) 3.8 8.8 +5.0 131.6%
Gap: Non-Māori male - Māori male -6.7 -8.5 -1.8 (increasing gap) 26.9%
Gap: Non-Māori female - Māori female 0.4 -3.1 -3.5 (increasing gap) -875.0%
The male Māori suicide rate is higher than the male non-Māori suicide rate with a rate of 25.5
and 23.9 suicides per 100,000 of population in 2000 and 2010, respectively. This compares to
18.8 and 15.4 suicides per 100,000 of population in 2000 and 2010 for non-Māori males. The
female Māori suicide rate increased from 3.8 in 2000 to 8.8 suicides per 100,000 between
2000 and 2010, while non-Māori females increased from 4.2 to 5.7. The general trend for
male suicide has been downward, while the trend for female suicide has been increasing,
although more so for Māori females than non-Māori females. However, female suicide rates
remain lower than males. The gap in suicide rates has increased between the two groups over
the 10-year period investigated: Māori male suicides have increased by 1.8 per 100,000 of
population (26.9 per cent) while Māori female suicides have increased by 3.5 per 100,000 of
population.
4.1.5 Infant Mortality Rates
The infant mortality indicator is measured by infant mortality per 1,000 live births. Infant
mortality captures deaths of infants aged less than one year old. Table 5 shows infant
mortality rates in 2000 and 2010. The comparison population is to non-Māori, non-Pacific
for this indicator.
14 Ministry of Health (2010). Suicide Facts: Deaths and intentional self-harm hospitalisations. Wellington:
Ministry of Health.

12
Table 5: Infant Mortality Rates (per 1,000 live births)15
2000 2010 Absolute Change
(2010-2000)
Relative
Change
Non-Māori; Non-Pacific 6.3 5.5 -0.8 -12.7%
Māori 8.5 7.0 -1.5 -17.6%
Pacific people 10.2 8 -2.2 -21.6%
Gap: Non-Māori; Non-Pacific - Māori -2.2 -1.5 +0.7 (closing gap) -31.8%
Gap: Non-Māori; Non-Pacific - Pacific
people
-3.9 -2.5 +1.4 (closing gap)
-35.9%
All ethnic groups show improvements in infant mortality rates. However, the greatest
improvements are in the Māori and Pacific people groups. While the rates for Māori and
Pacific people in 2010 are still higher than the non-Māori; non-Pacific population, the gap is
less pronounced than 10 years earlier, with both Māori and Pacific people showing relative
improvements in infant mortality rates of over 30 per cent.
4.2 Knowledge and Skills
Enhancing people’s knowledge and skills provides them with greater options in life.
Education is one of the most well-known keys to success (Stiglitz, 2013). It is generally
accepted that educational achievement is linked with multiple positive outcomes: higher
incomes, greater employment opportunities and positive health associations.16
Education has
been linked to higher productivity and economic growth, which in turn can lead to improved
standards of living. Moreover, possessing knowledge and skills can enhance peoples’ sense
of self-worth, security and belonging (Ministry of Social Development, 2010). This section
provides data on four measures of knowledge and skills: participation in early childhood
education; school leaver qualifications; the proportion of the population with a tertiary
qualification; and tertiary participation rates.
4.2.1 Participation in Early Childhood Education
The data in Table 6 shows prior participation in early childhood education by Europeans,
Māori and Pacific people in 2000 and 2012. This measure captures the proportion of children
who have had early childhood education prior to starting school in the year shown.
Table 6: Participation in Early Childhood Education17
2000 2012 Absolute Change
(2012-2000)
Relative
Change
European 94.2% 98% +3.8% 4.0%
Māori 83.1% 90.9% +7.8% 9.4%
15 Ministry of Health, New Zealand Mortality Collection, Available at www.moh.govt.nz, Retrieved 15
February 2014. 16 Ministry of Education, EducationCounts, Available at www.educationcounts.govt.nz, Retrieved 2 February
2014. 17 Ministry of Education, Prior Participation in Early Childhood Education: new entrants, Available at
www.educationcounts.govt.nz/statistics, Retrieved 2 April 2014.

13
Pacific people 75.8% 86.7% +10.9% 14.4%
Gap: European - Māori 11.1% 7.1% -4.0% (closing gap) -36.0%
Gap: European - Pacific people 18.4% 11.3% -7.1% (closing gap) -38.6%
Table 6 shows that there have been increases in early childhood education for all ethnic
groups. The European population increased from 94.2 per cent to 98 per cent (four per cent);
the Māori population increased from 83.1 to 90.9 per cent (9.4 per cent); and the Pacific
population increased from 75.8 to 86.7 per cent (14.4 per cent). Both the Māori and Pacific
people indicators showed decreases of over 30 per cent in the gap between early childhood
education of European and Māori, and European and Pacific people.
4.2.2 School Leavers with a Qualification of NCEA Level 2 or Equivalent
Educational achievement is an important indicator of knowledge and skills in society.
Moreover, the achievements of students during the period where education is mandatory can
influence their transition into higher education and the labour market (Te Puni Kōkiri, 2012).
Changes in educational achievement provides information on access to education as well as
equity of the education system.18
The following three indicators all relate to qualifications
gained and participation in higher education. Table 7 shows school leavers holding the
minimum qualification of National Certificate of Educational Achievement (NCEA) Level 2
or higher. NCEA is the primary secondary school qualification in New Zealand. It comprises
three levels, typically undertaken in the final three years of secondary education.
Table 7: School Leavers with a Minimum of NCEA Level 2 or Equivalent19
2001 2012 Absolute Change
(2012-2001)
Relative
Change
European 68.5% 82.1% +13.6% 19.9%
Māori 40.6% 60.9% +20.3% 50.0%
Pacific people 54.7% 68.1% +13.4% 24.5%
Gap: European and Māori 27.9% 21.2% -6.7% (closing gap) -24.0%
Gap: European and Pacific people 13.8% 14.0% +0.2% (increasing gap) 1.4%
Table 7 shows improvements in educational achievement among all groups. The largest
improvement is among the Māori students, with a 20.3 percentage point change (50 per cent)
over the 11 year period shown. Pacific people and European school leavers both showed
close to a 13.5 percentage point improvement (19.9 per cent for European and 24.5 per cent
for Pacific people). There was a large difference in attaining educational achievements
between the Māori and European students in 2001 at nearly 28 percentage points. While this
has improved in 2012, a large gap of 21.2 percentage points remains. Moreover, the 13.8
18 Ministry of Education, Education Counts, Available at www.educationcounts.govt.nz/statistics, Retrieved 2
April 2014. 19 Earlier statistical reports show the equivalent qualification as ‘Sixth Form Certificate or Higher’. Data source:
Ministry of Education. Percentage of 18-year-olds with a minimum of NCEA Level 2 or Equivalent, Available
at www.educationcounts.govt.nz/statistics, Retrieved 2 April 2014.

14
percentage point gap in school leaver attainment among European and Pacific people has not
improved and instead shows a small increase of 1.4 per cent.
4.2.4 Proportion of the Population with a Bachelor’s degree or higher
Table 8 shows the proportion of the European; Māori; and Pacific people aged 15 years and
over holding a Bachelor’s degree or above as their highest qualification. This measure
captures people holding bachelor’s degrees and other post-graduate qualifications. As census
data is used for this measure, a 12-year time period is presented.
Table 8: Proportion of the Population with a Bachelor’s Degree or Above20
2001 2013 Absolute Change (2013-
2001)
Relative
Change
European 10.8% 18.6% +7.8% 72.2%
Māori 4.0% 9.1% +5.1% 127.5%
Pacific people 3.2% 7.1% +3.9% 121.9%
Gap: European - Māori 6.8% 9.5% +2.7% (increasing gap) 39.7%
Gap: European - Pacific people 7.6% 11.5% +3.9% (increasing gap) 51.3%
Table 8 shows that while proportions of the population holding Bachelor degrees or above
have increased for all ethnic groups, the gaps between the European population and Māori,
and the European and Pacific people have increased. The gap in degree holders among Māori
has increased from 6.8 percentage points to 9.5 percentage points, an increase of 39.7 per
cent, while the gap between the European population and Pacific people has increased from
7.6 percentage points to 11.5 percentage points, an increase of 51.3 per cent.
4.2.5 Tertiary Participation Rates
Table 9 shows age-standardised tertiary participation rates. This measure shows the
percentage of the population aged 15 years and older who are enrolled in tertiary education at
any time during the year. The measure does not capture private training establishments.
Table 9: Age-Standardised Tertiary Participation Rates21
2001 2012 Absolute Change (2012-
2001)
Relative
Change
European 7.5% 8.0% +0.5% 6.7%
Māori 6.6% 9.9% +3.3% 50.0%
Pacific people 5.0% 8.2% +3.2% 64.0%
Gap: European - Māori 0.9% -1.9% -2.8% (gap is gone) -311.1%
Gap: European - Pacific people 2.5% -0.2 % -2.7% (gap is gone) -108.0%
20 Statistics New Zealand, Census 2013 and 2001, Available at www.statistics.govt.nz, Retrieved 10 July 2014. 21 Ministry of Education, Education Counts, Available at www.educationcounts.govt.nz, Retrieved 25 February
2014. We include individuals participating in level four certificates (e.g. trade qualifications); diplomas;
Bachelors; and other post-graduate qualifications (such as Masters and Doctorates) in the measure.
15
Table 9 shows increases in tertiary participation among all three groups. However, greater
participation rates are visible for Pacific people and Māori, with both achieving growth in
participation of over 50 per cent in the 11-year period investigated. This high growth result
has resulted in higher age-standardised tertiary participation rates for Pacific people and
Māori than the European population. Thus, the gap in tertiary participation rates has now
been eliminated. However, a similar trend over the 11-year time period investigated was
visible for all three ethnic groups. This pattern shows increases in tertiary participation for the
first part of the period examined (to participation levels of 8.7 per cent, 11.4 per cent and 8.5
per cent for Europeans, Māori and Pacific people respectively), which have been in decline in
recent years.
4.3 Paid Work
This section examines indicators relating to work. There are multiple reasons why
participation in paid work is desirable. The Welfare Working Group (2011:55) outlines these
as providing access to higher incomes, increasing social contact, enhancing self-esteem,
together with increasing evidence that it is beneficial for mental and physical health.
Moreover, the wider community benefits through increased economic activity, as well as
reducing the overall burden on the welfare system. This section provides data on five
indicators relating to work: unemployment; employment; workplace injury; weekly earnings;
and people receiving welfare benefits.
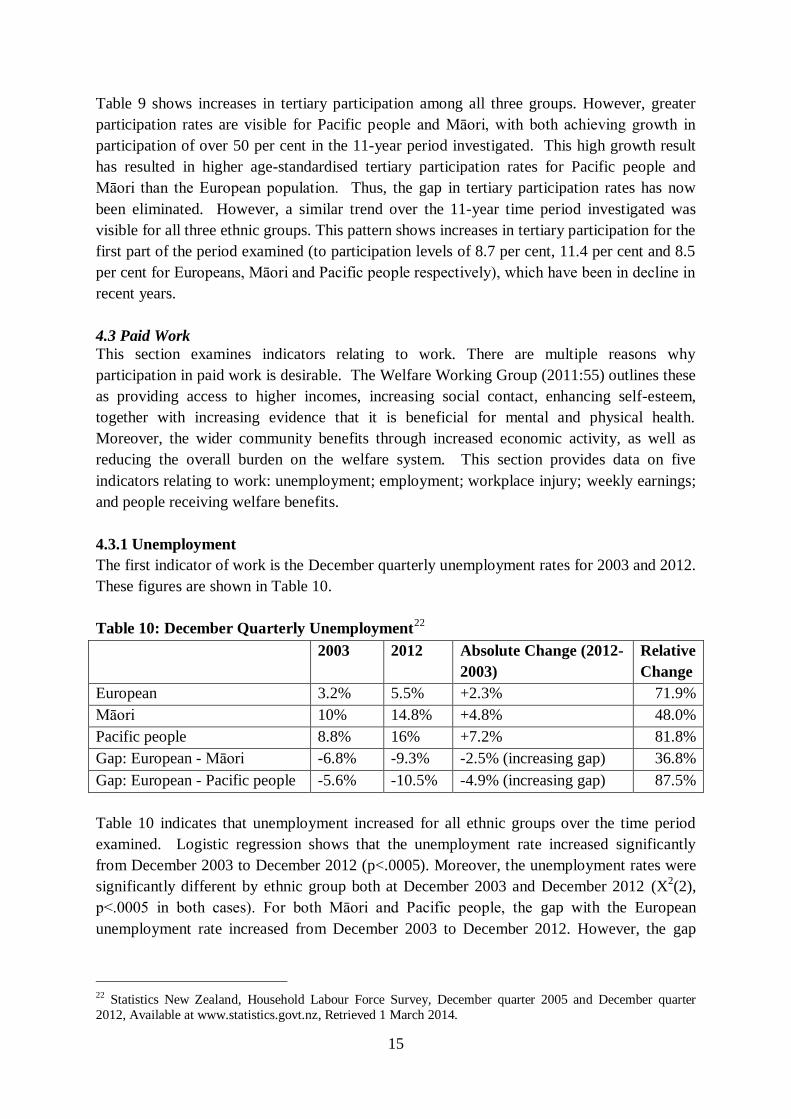
4.3.1 Unemployment
The first indicator of work is the December quarterly unemployment rates for 2003 and 2012.
These figures are shown in Table 10.
Table 10: December Quarterly Unemployment22
2003 2012 Absolute Change (2012-
2003)
Relative
Change
European 3.2% 5.5% +2.3% 71.9%
Māori 10% 14.8% +4.8% 48.0%
Pacific people 8.8% 16% +7.2% 81.8%
Gap: European - Māori -6.8% -9.3% -2.5% (increasing gap) 36.8%
Gap: European - Pacific people -5.6% -10.5% -4.9% (increasing gap) 87.5%
Table 10 indicates that unemployment increased for all ethnic groups over the time period
examined. Logistic regression shows that the unemployment rate increased significantly
from December 2003 to December 2012 (p<.0005). Moreover, the unemployment rates were
significantly different by ethnic group both at December 2003 and December 2012 (X2(2),
p<.0005 in both cases). For both Māori and Pacific people, the gap with the European
unemployment rate increased from December 2003 to December 2012. However, the gap
22 Statistics New Zealand, Household Labour Force Survey, December quarter 2005 and December quarter
2012, Available at www.statistics.govt.nz, Retrieved 1 March 2014.

16
increased by a significantly higher proportion for Pacific people as compared to Māori: 87.5
per cent for Pacific people and 36.8 per cent for Māori.
4.3.2 Employment
The employment indicator investigates the employment rate among Europeans, Māori and
Pacific people. The employment rate measure captures those aged between 15 and 64, who
work for one hour or more per week. These figures are outlined in Table 11.
Table 11: December Quarterly Employment23
2003 2012 Absolute Change
(2012-2003)
Relative
Change
European 66.7% 65.0% -1.7% -2.5%
Māori 58.1% 55.2% -2.9% -5.0%
Pacific people 56.7% 50.1% -6.6% -11.6%
Gap: European - Māori 8.6% 9.8% +1.2% (increasing gap) 14.0%
Gap: European - Pacific people 10.0% 14.9% +4.9% (increasing gap) 49.0%
All ethnic groups show decreases in employment over the period examined. Logistic
regression analysis shows that the employment rate decreased significantly between
December 2003 and December 2012. Moreover, in both December 2003 and December 2012
the employment rate was significantly different by ethnic group (X2, p<.0005). The
employment rate for both Māori and Pacific people decreased significantly more than the
employment rate for Europeans over this time, with a larger decrease for Pacific people than
for Māori at 49 per cent for Pacific people and 14 per cent for Māori. While the overall
reduction in employment is likely to reflect the harsher economic environment in 2012, as
compared to 2002, this does not account for the increasing gaps in employment between
Europeans and Māori, or Europeans and Pacific people.
4.3.3 Workplace Injury
Workplace injury rates are outlined in Table 12. This indicator reports the rate of workplace
injury per 1,000 full-time equivalent employees.
Table 12: Workplace Injury Claims (per 1,000 full-time equivalent workers)24
2003 2012 Absolute Change
(2012-2003)
Relative
Change
European 129 87 -42 -32.6%
Māori 179 90 -89 -49.7%
Pacific people 150 111 -39 -26.0%
Gap: European - Māori -50 -3 +47 (closing gap) -94.0%
23 Statistics New Zealand, Household Labour Force Survey, December quarter 2005 and December quarter
2012, Available at www.statistics.govt.nz, Retrieved 1 March 2014. 24 Statistics New Zealand, Injury Statistics – Work-related claims, Available at www.statistics.govt.nz,
Retrieved 14 March 2014.

17
Gap: European - Pacific people -21 -24 -3 (increasing gap) 14.3%
While all three ethnic groups have reduced workplace injury claims over the time period
shown, the most significant decline is visible among the Māori population, at 94 per cent.
For both 2003 and 2012, there was a significant difference in incidence of workplace injury
claims between the three ethnic groups (X2 test, p<.0005). When the data from 2003 was
compared with the data from 2012, again there was a significant reduction in incident rate
(logistic regression model, p<.0005). However, although the gap between Pacific people and
Europeans was greater in 2012 than in 2003 (p<.005), for Māori, the gap with Europeans was
significantly lower in 2012 than in 2003 (p<.0005).
4.3.4 Weekly Earnings
The median weekly earnings indicator reports on incomes received from wages and salaries.
These figures are outlined in Table 13 for 2003 and 2013.
Table 13: Median Weekly Earnings25
2003 2013 Absolute
Change
(2013-2003)
Relative
Change
(2013-2003)
European $614 ± 12.28 $863 ± 17.26 +$249 40%
Māori $540 ± 10.8 $767 ± 15.34 +$227 42%
Pacific people $500 ± 10.0 $712 ± 14.24 +$212 42.4%
Gap: European - Māori $74 $96 +$22 29.7%
Gap: European - Pacific
people
$114 $151 +$37 32.5%
All groups show increased median weekly earnings over the period investigated. Europeans’
median weekly earnings increased by 40 per cent, while both Māori and Pacific peoples’
median weekly earnings increased by 42 per cent. Both Māori and Pacific people have
significantly lower median weekly earnings in both 2003 and 2013 (z test, p<.05). In
addition, for each ethnicity, the change from 2003 to 2012 is statistically significant (z test,
p<.05). However, for both Māori people and Pacific people the difference from the European
ethnic group does not change significantly from 2003 to 2013.
4.3.5 Benefit Receipt
The final indicator in the category of paid work investigates the percentage of the population
receiving a core welfare benefit. These measures are reported as at 2001 and 2013 as the
population prevalence has been calculated using census data. Long-term benefit receipt is
strongly associated with low levels of education and training, as well as poorer health
(Welfare Working Group, 2011:46). This indicator uses a non-Māori, non-Pacific people
25 Statistics New Zealand, Household Labour Force Survey, Available at www.statistics.govt.nz, Retrieved 15
March 2014. Note: standard errors quoted are ± 2% as per the approach adopted by Statistics New Zealand.
18
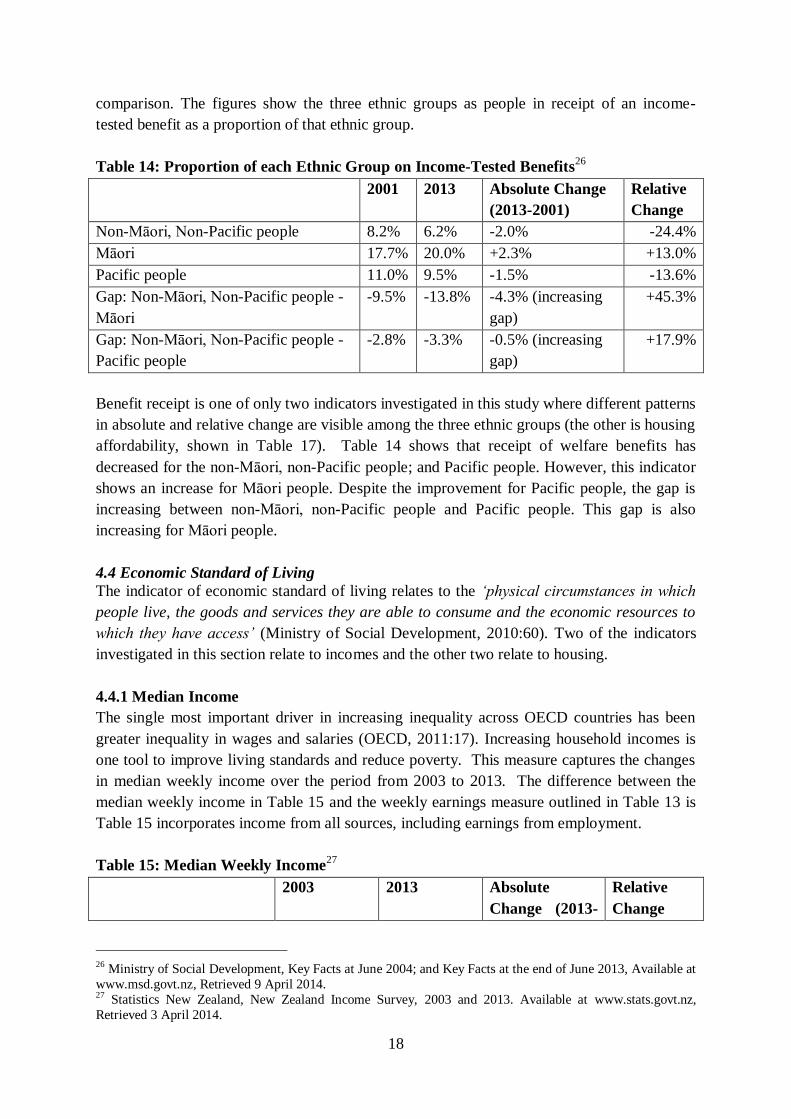
comparison. The figures show the three ethnic groups as people in receipt of an income-
tested benefit as a proportion of that ethnic group.
Table 14: Proportion of each Ethnic Group on Income-Tested Benefits26
2001 2013 Absolute Change
(2013-2001)
Relative
Change
Non-Māori, Non-Pacific people 8.2% 6.2% -2.0% -24.4%
Māori 17.7% 20.0% +2.3% +13.0%
Pacific people 11.0% 9.5% -1.5% -13.6%
Gap: Non-Māori, Non-Pacific people -
Māori
-9.5% -13.8% -4.3% (increasing
gap)
+45.3%
Gap: Non-Māori, Non-Pacific people -
Pacific people
-2.8% -3.3% -0.5% (increasing
gap)
+17.9%
Benefit receipt is one of only two indicators investigated in this study where different patterns
in absolute and relative change are visible among the three ethnic groups (the other is housing
affordability, shown in Table 17). Table 14 shows that receipt of welfare benefits has
decreased for the non-Māori, non-Pacific people; and Pacific people. However, this indicator
shows an increase for Māori people. Despite the improvement for Pacific people, the gap is
increasing between non-Māori, non-Pacific people and Pacific people. This gap is also
increasing for Māori people.
4.4 Economic Standard of Living
The indicator of economic standard of living relates to the ‘physical circumstances in which
people live, the goods and services they are able to consume and the economic resources to
which they have access’ (Ministry of Social Development, 2010:60). Two of the indicators
investigated in this section relate to incomes and the other two relate to housing.
4.4.1 Median Income
The single most important driver in increasing inequality across OECD countries has been
greater inequality in wages and salaries (OECD, 2011:17). Increasing household incomes is
one tool to improve living standards and reduce poverty. This measure captures the changes
in median weekly income over the period from 2003 to 2013. The difference between the
median weekly income in Table 15 and the weekly earnings measure outlined in Table 13 is
Table 15 incorporates income from all sources, including earnings from employment.
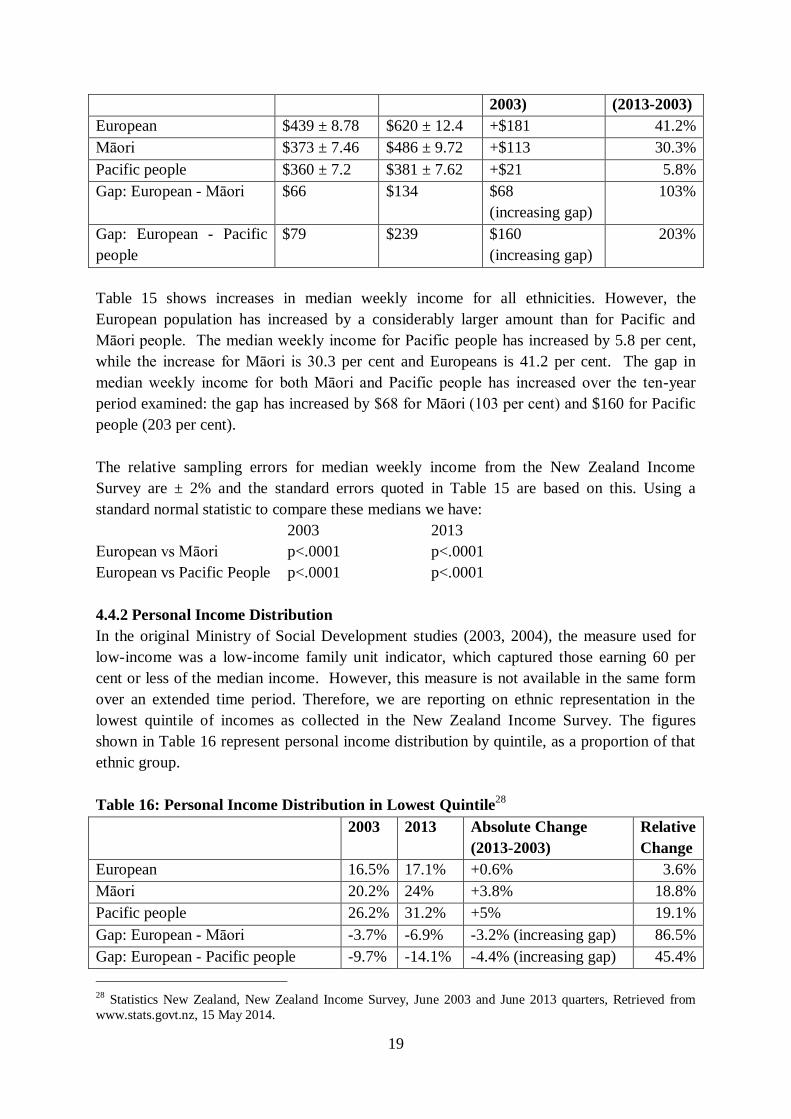
Table 15: Median Weekly Income27
2003 2013 Absolute
Change (2013-
Relative
Change
26 Ministry of Social Development, Key Facts at June 2004; and Key Facts at the end of June 2013, Available at
www.msd.govt.nz, Retrieved 9 April 2014. 27 Statistics New Zealand, New Zealand Income Survey, 2003 and 2013. Available at www.stats.govt.nz,
Retrieved 3 April 2014.
19
2003) (2013-2003)
European $439 ± 8.78 $620 ± 12.4 +$181 41.2%
Māori $373 ± 7.46 $486 ± 9.72 +$113 30.3%
Pacific people $360 ± 7.2 $381 ± 7.62 +$21 5.8%
Gap: European - Māori $66 $134 $68
(increasing gap)
103%
Gap: European - Pacific
people
$79 $239 $160
(increasing gap)
203%
Table 15 shows increases in median weekly income for all ethnicities. However, the
European population has increased by a considerably larger amount than for Pacific and
Māori people. The median weekly income for Pacific people has increased by 5.8 per cent,
while the increase for Māori is 30.3 per cent and Europeans is 41.2 per cent. The gap in
median weekly income for both Māori and Pacific people has increased over the ten-year
period examined: the gap has increased by $68 for Māori (103 per cent) and $160 for Pacific
people (203 per cent).
The relative sampling errors for median weekly income from the New Zealand Income
Survey are ± 2% and the standard errors quoted in Table 15 are based on this. Using a
standard normal statistic to compare these medians we have:
2003 2013
European vs Māori p<.0001 p<.0001
European vs Pacific People p<.0001 p<.0001
4.4.2 Personal Income Distribution
In the original Ministry of Social Development studies (2003, 2004), the measure used for
low-income was a low-income family unit indicator, which captured those earning 60 per
cent or less of the median income. However, this measure is not available in the same form
over an extended time period. Therefore, we are reporting on ethnic representation in the
lowest quintile of incomes as collected in the New Zealand Income Survey. The figures
shown in Table 16 represent personal income distribution by quintile, as a proportion of that
ethnic group.
Table 16: Personal Income Distribution in Lowest Quintile28
2003 2013 Absolute Change
(2013-2003)
Relative
Change
European 16.5% 17.1% +0.6% 3.6%
Māori 20.2% 24% +3.8% 18.8%
Pacific people 26.2% 31.2% +5% 19.1%
Gap: European - Māori -3.7% -6.9% -3.2% (increasing gap) 86.5%
Gap: European - Pacific people -9.7% -14.1% -4.4% (increasing gap) 45.4%
28 Statistics New Zealand, New Zealand Income Survey, June 2003 and June 2013 quarters, Retrieved from
www.stats.govt.nz, 15 May 2014.
20
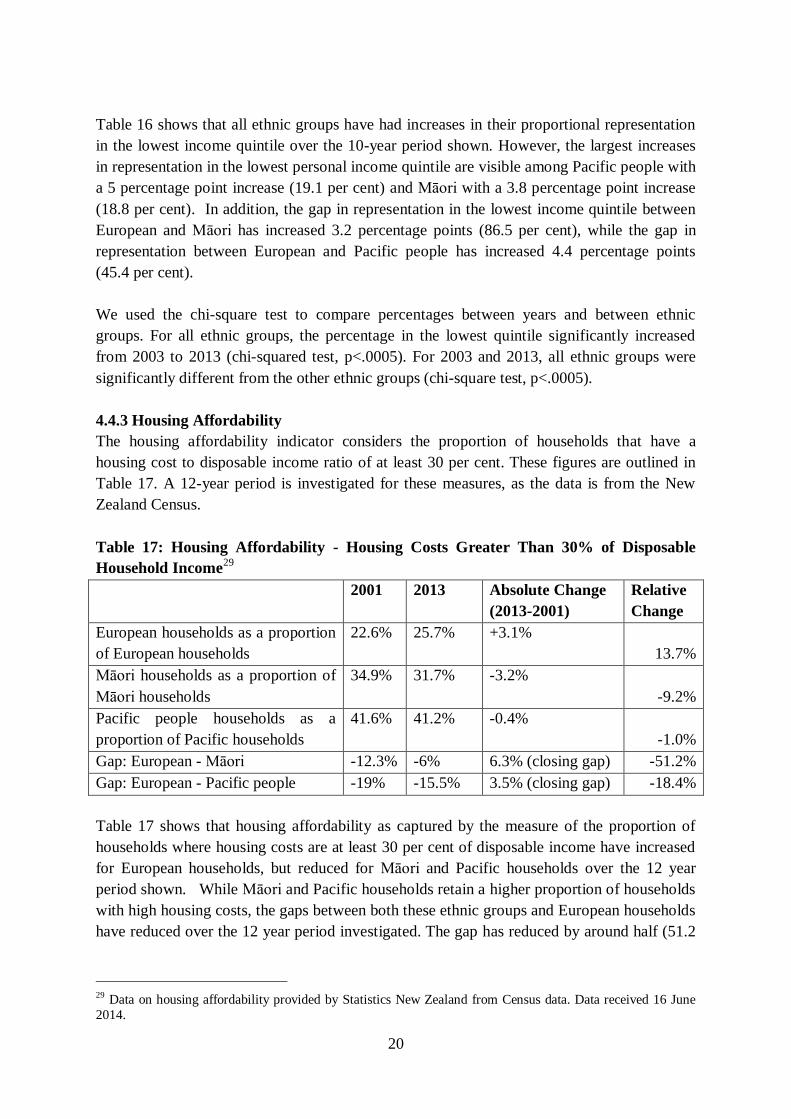
Table 16 shows that all ethnic groups have had increases in their proportional representation
in the lowest income quintile over the 10-year period shown. However, the largest increases
in representation in the lowest personal income quintile are visible among Pacific people with
a 5 percentage point increase (19.1 per cent) and Māori with a 3.8 percentage point increase
(18.8 per cent). In addition, the gap in representation in the lowest income quintile between
European and Māori has increased 3.2 percentage points (86.5 per cent), while the gap in
representation between European and Pacific people has increased 4.4 percentage points
(45.4 per cent).
We used the chi-square test to compare percentages between years and between ethnic
groups. For all ethnic groups, the percentage in the lowest quintile significantly increased
from 2003 to 2013 (chi-squared test, p<.0005). For 2003 and 2013, all ethnic groups were
significantly different from the other ethnic groups (chi-square test, p<.0005).
4.4.3 Housing Affordability
The housing affordability indicator considers the proportion of households that have a
housing cost to disposable income ratio of at least 30 per cent. These figures are outlined in
Table 17. A 12-year period is investigated for these measures, as the data is from the New
Zealand Census.
Table 17: Housing Affordability - Housing Costs Greater Than 30% of Disposable
Household Income29
2001 2013 Absolute Change
(2013-2001)
Relative
Change
European households as a proportion
of European households
22.6% 25.7% +3.1%
13.7%
Māori households as a proportion of
Māori households
34.9% 31.7% -3.2%
-9.2%
Pacific people households as a
proportion of Pacific households
41.6% 41.2% -0.4%
-1.0%
Gap: European - Māori -12.3% -6% 6.3% (closing gap) -51.2%
Gap: European - Pacific people -19% -15.5% 3.5% (closing gap) -18.4%
Table 17 shows that housing affordability as captured by the measure of the proportion of
households where housing costs are at least 30 per cent of disposable income have increased
for European households, but reduced for Māori and Pacific households over the 12 year
period shown. While Māori and Pacific households retain a higher proportion of households
with high housing costs, the gaps between both these ethnic groups and European households
have reduced over the 12 year period investigated. The gap has reduced by around half (51.2
29 Data on housing affordability provided by Statistics New Zealand from Census data. Data received 16 June
2014.

21
per cent) for Māori households, while a smaller reduction of 18.4 per cent is visible for
Pacific households.
4.4.4 Household Crowding
The household crowding measure uses the Canadian National Occupancy standard, which
allocates bedrooms based on age, sex and relationships of household members. The measure
shown in Table 18 is where at least one more bedroom is needed in the household. As census
data is also used for this indicator, a 12 year period is used for analysis.
Table 18: Household Crowding30
2001 2013 Absolute Change
(2013-2001)
Relative
Change
European households as a
proportion of European households
3% 2.7% -0.3%
-10.0%
Māori households as a proportion of
Māori households
13.1% 11% -2.1%
-16.0%
Pacific people households as a
proportion of Pacific households
25.8% 23.7% -2.1%
-8.1%
Gap: European - Māori -10.1% -8.3% 1.8% (closing gap) -17.8%
Gap: European - Pacific people -22.8% -21% 1.8% (closing gap) -7.9%
Table 18 shows that both Māori households and Pacific households have significantly higher
levels of household crowding than European households. All ethnic groups have shown
declines in the overall proportions of household crowing and reductions in gaps are visible
between Māori households and European households (17.8 per cent), and Pacific households
and European households (7.9 per cent). Despite the reductions in these gaps over the 12 year
period, large gaps in household crowding remain.
4.5 Cultural Identity
Reference to culture relates to ‘the customs, practices, languages, values and world views
that define social groups’ (Ministry of Social Development, 2010:84). Cultural identity can
contribute to a person’s wellbeing (Ministry of Social Development, 2010). Two measures of
cultural identity are examined in this study: proportions of Māori people who speak Māori
language and proportions of people in Māori medium education.
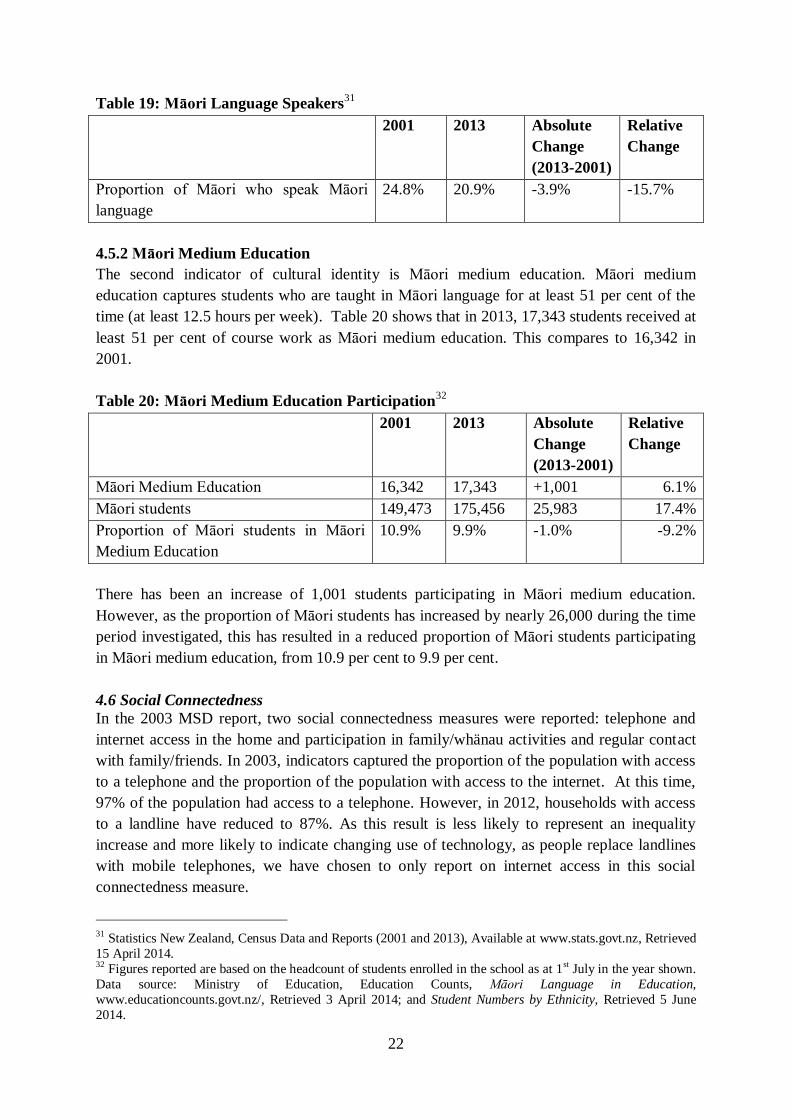
4.5.1 Māori Language Speakers
The first indicator is the proportion of individuals who identify as Māori who speak the
Māori language. Table 19 shows a decline in this indicator of 3.9 percentage points over the
12 year period investigated. The decline was evident in the 2006 census results, where a 1.5
percentage point decline was visible. However, there has been a further 2.4 percentage point
decline over the subsequent seven year period since the 2006 census.
30
Data on housing crowding provided by Statistics New Zealand from Census data. Data received 16 June 2014.
22
Table 19: Māori Language Speakers31
2001 2013 Absolute
Change
(2013-2001)
Relative
Change
Proportion of Māori who speak Māori
language
24.8% 20.9% -3.9% -15.7%
4.5.2 Māori Medium Education
The second indicator of cultural identity is Māori medium education. Māori medium
education captures students who are taught in Māori language for at least 51 per cent of the
time (at least 12.5 hours per week). Table 20 shows that in 2013, 17,343 students received at
least 51 per cent of course work as Māori medium education. This compares to 16,342 in
2001.
Table 20: Māori Medium Education Participation32
2001 2013 Absolute
Change
(2013-2001)
Relative
Change
Māori Medium Education 16,342 17,343 +1,001 6.1%
Māori students 149,473 175,456 25,983 17.4%
Proportion of Māori students in Māori
Medium Education
10.9% 9.9% -1.0% -9.2%
There has been an increase of 1,001 students participating in Māori medium education.
However, as the proportion of Māori students has increased by nearly 26,000 during the time
period investigated, this has resulted in a reduced proportion of Māori students participating
in Māori medium education, from 10.9 per cent to 9.9 per cent.
4.6 Social Connectedness
In the 2003 MSD report, two social connectedness measures were reported: telephone and
internet access in the home and participation in family/whänau activities and regular contact
with family/friends. In 2003, indicators captured the proportion of the population with access
to a telephone and the proportion of the population with access to the internet. At this time,
97% of the population had access to a telephone. However, in 2012, households with access
to a landline have reduced to 87%. As this result is less likely to represent an inequality
increase and more likely to indicate changing use of technology, as people replace landlines
with mobile telephones, we have chosen to only report on internet access in this social
connectedness measure.
31 Statistics New Zealand, Census Data and Reports (2001 and 2013), Available at www.stats.govt.nz, Retrieved
15 April 2014. 32 Figures reported are based on the headcount of students enrolled in the school as at 1st July in the year shown.
Data source: Ministry of Education, Education Counts, Māori Language in Education,
www.educationcounts.govt.nz/, Retrieved 3 April 2014; and Student Numbers by Ethnicity, Retrieved 5 June
2014.
23
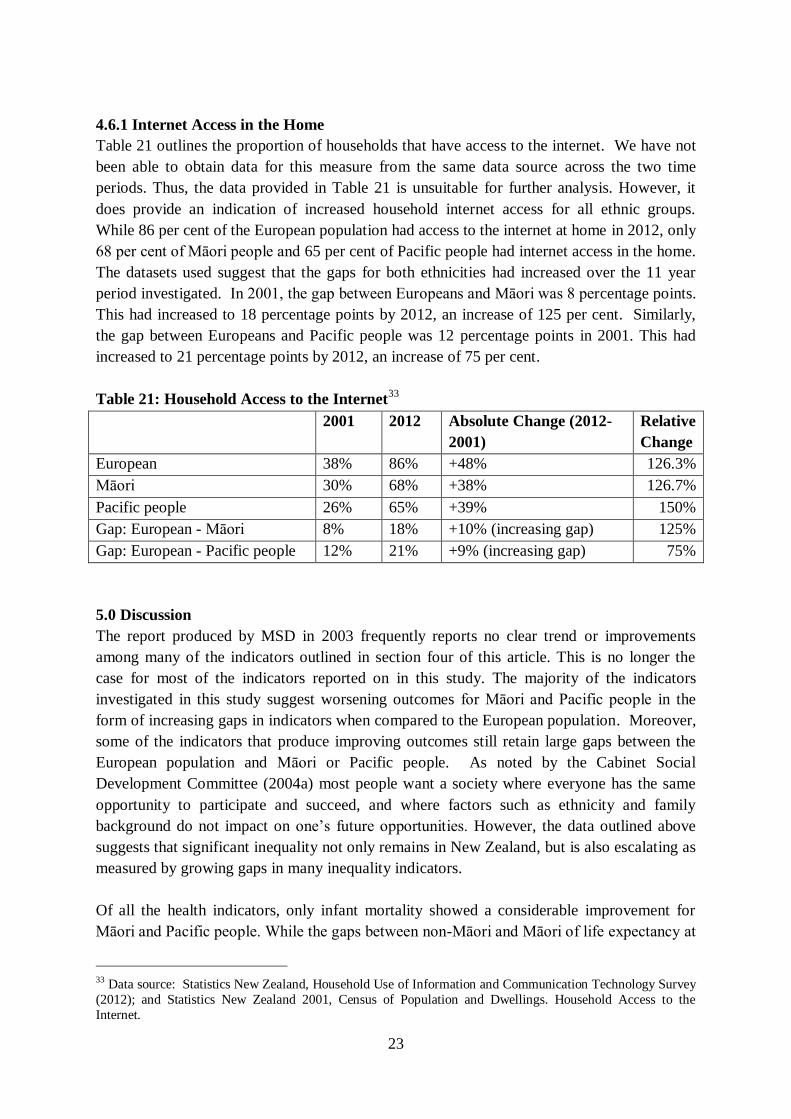
4.6.1 Internet Access in the Home
Table 21 outlines the proportion of households that have access to the internet. We have not
been able to obtain data for this measure from the same data source across the two time
periods. Thus, the data provided in Table 21 is unsuitable for further analysis. However, it
does provide an indication of increased household internet access for all ethnic groups.
While 86 per cent of the European population had access to the internet at home in 2012, only
68 per cent of Māori people and 65 per cent of Pacific people had internet access in the home.
The datasets used suggest that the gaps for both ethnicities had increased over the 11 year
period investigated. In 2001, the gap between Europeans and Māori was 8 percentage points.
This had increased to 18 percentage points by 2012, an increase of 125 per cent. Similarly,
the gap between Europeans and Pacific people was 12 percentage points in 2001. This had
increased to 21 percentage points by 2012, an increase of 75 per cent.
Table 21: Household Access to the Internet33
2001 2012 Absolute Change (2012-
2001)
Relative
Change
European 38% 86% +48% 126.3%
Māori 30% 68% +38% 126.7%
Pacific people 26% 65% +39% 150%
Gap: European - Māori 8% 18% +10% (increasing gap) 125%
Gap: European - Pacific people 12% 21% +9% (increasing gap) 75%
5.0 Discussion
The report produced by MSD in 2003 frequently reports no clear trend or improvements
among many of the indicators outlined in section four of this article. This is no longer the
case for most of the indicators reported on in this study. The majority of the indicators
investigated in this study suggest worsening outcomes for Māori and Pacific people in the
form of increasing gaps in indicators when compared to the European population. Moreover,
some of the indicators that produce improving outcomes still retain large gaps between the
European population and Māori or Pacific people. As noted by the Cabinet Social
Development Committee (2004a) most people want a society where everyone has the same
opportunity to participate and succeed, and where factors such as ethnicity and family
background do not impact on one’s future opportunities. However, the data outlined above
suggests that significant inequality not only remains in New Zealand, but is also escalating as
measured by growing gaps in many inequality indicators.
Of all the health indicators, only infant mortality showed a considerable improvement for
Māori and Pacific people. While the gaps between non-Māori and Māori of life expectancy at
33 Data source: Statistics New Zealand, Household Use of Information and Communication Technology Survey
(2012); and Statistics New Zealand 2001, Census of Population and Dwellings. Household Access to the
Internet.
24
birth improved slightly, the gaps remain considerable at over seven years for both males and
females. The indicators for cigarette smoking and obesity show increasing gaps between
Europeans and Māori, and Europeans and Pacific People. The gaps in suicide rates have also
increased between Māori and non-Māori.
The indicator relating to paid work produces a partial positive result for workplace injury
claims. Workplace injuries have reduced for all ethnic groups, and particularly so for Māori.
However, the gap has increased slightly for Pacific people. The measures of unemployment
and employment produce unfavourable results for both Māori and Pacific people. While all
ethnic groups have increasing unemployment, the gaps between European and Māori, and
between European and Pacific people, have increased. A similar situation is visible with the
employment figures. The indicator reporting median weekly earnings produces no clear
improvement or worsening of the situation for Māori and Pacific people. While all the
measures of paid work show all ethnic groups moving in the same direction, that is,
increasing levels of unemployment and decreasing levels of employment, the figures show
that Māori and Pacific people are over-represented in both categories, and have increased as a
proportion of total welfare beneficiaries. This suggests that the economic downturn has had
greater impact on Māori and Pacific people, which may result from Māori and Pacific people
being over-represented in lower-skill occupations that are more susceptible to job losses in
harsher economic environments.
The Royal Society of New Zealand (2014) observe the contrast between ‘work-rich’
households and ‘work-poor’ households. Work-rich households are generally those where
individuals hold post-secondary qualifications. Work-poor households ‘either have
qualifications inappropriate to a changed labour market or lack advanced credentials
altogether’ (Royal Society of New Zealand, 2014:26).
The economic standard of living indicators examine income and housing measures. The
median weekly income shows greater increases for Europeans as compared to Pacific people
and Māori. The gap in median weekly income for Māori over the 10-year period has
increased by 103 per cent. However, the increase in the gap for Pacific people is 203 per cent.
The distribution of income measure used was representation in the lowest personal income
quintile, which also shows increases in gaps between Europeans and Pacific people, and
Europeans and Māori. The measure of housing affordability shows a decrease in the gap
between European households and Māori households, and European and Pacific households.
Household crowding shows small improvements. However, these improvements are not
significant for any of the ethnic groups shown. Large gaps remain between European and
Māori, and European and Pacific people, under both housing measures.
In relation to cultural identity, over the 12 year period from 2001 to 2013 there has been a
reduction in the proportion of Māori who speak Māori language. In addition, there has been a
reduction in Māori medium education participation. Internet access has increased
considerably for all ethnic groups. However, the gaps between European household access to
25
the internet, and those of Pacific people and Māori have both increased over the 11-year
period examined.
New Zealand has a relatively generous welfare system, as well as a system of taxes and
transfers that are intended to redistribute income to those in need. Redistribution through
taxes and transfers reduces income inequality to well below where it would otherwise be
(Perry, 2013a). However, despite the redistribution, the gaps in many of the inequality
indicators between Europeans and Māori, and Europeans and Pacific people remain high.
This issue is highlighted by the OECD (2008) in observing that inequality, as measured by
the gini coefficient, has not improved as significantly as might be expected, given the
increased focus on inequality in recent times. However, the OECD (2008) note that the
relatively modest increase in inequality over the previous 20 years ‘hides a larger underlying
trend’, which is the practice in developed countries to tax more and spend more to offset the
movement towards higher inequality. As noted by the OECD, spending on social policy now
is higher than at any time in history and ‘if governments stop trying to offset the inequalities
by either spending less on social benefits, or by making taxes and benefits less targeted to the
poor, then the growth in inequality would be much more rapid’ (OECD, 2008:3). Moreover,
the OECD (2008:3) observes that relying on taxing more and spending more as a response to
inequality can only be a temporary measure.
The OECD (2013) suggest that tax pays a less important role than benefits in reducing
income inequalities. This has become more the case over the past decade or two, where
income taxes have become less progressive and traditional forms of ‘wealth’ taxes (such as
estate taxes and gift duties) have reduced or been repealed. The New Zealand tax system is
no different: goods and services tax has increased; the progressiveness of the income tax
system has reduced; no comprehensive capital gains tax exists; and no estate or gift duty is in
place.
The OECD (2008, 2013) suggest that the labour market should be the first place that
governments look towards to address rising inequality: ‘the only sustainable way to reduce
inequality is to stop the underlying widening of wages and income from capital. In particular,
we have to make sure that people are capable of being in employment and earning wages that
keep them and their families out of poverty’. Well educated, high-income earning workers
have achieved higher gains in recent times, while those with fewer skills have not (OECD,
2013). The outcome of greater disparities in wages has contributed to greater involvement of
the state in assisting low-income earners to maintain a moderate standard of living.
Reforming tax and benefit policies is ‘the most direct and powerful instrument for
redistribution’ (OECD, 2011:18). However, the tool that has the most promise for addressing
inequality is employment. This has a clear link to education and ensuring that workers have
sufficient skills to take on skilled employment. The OECD (2011:19) propose that ‘upskilling
is singled out as the only force which succeeded not only in reducing wage dispersion but
also in increasing employment rates’. Thus, the OECD note the importance of investing in
people – a process that must begin in early childhood and be followed through into more

26
formal education (OECD, 2011:19) to ensure that children from households with fewer
resources have opportunities to engage in education and achieve their full potential.
The knowledge and skills indicators investigated in section four show a mixed result. The
indicators measuring participation in early childhood education and tertiary participation
show improvement. The gap is also closing between Māori and Europeans in the measure of
school leaver qualifications. However, the improvements do not extend to tertiary education
outputs, with increases in gaps of those holding bachelor’s degrees or above. Thus, it appears
that the gains made in early childhood, secondary education and tertiary participation are yet
to flow through to achievement of higher levels of qualifications. However, it is the higher
levels of qualifications that are most likely to significantly impact on other inequality
measures such as employment and income.
The event of Māori and Pacific people being disproportionately poorly represented in social
indicators is not a new trend. Despite considerable attention paid to the issue, the data
outlined in this research indicates that New Zealand’s strategy to address inequality as it
relates to Māori and Pacific people has not been successful. Some indicators have improved,
but the majority have not. Redistribution minimises the symptoms of the problem, at least to
some extent, but it does not address the underlying causes of inequality. Ten years ago, when
the MSD reports that this study is based on were produced, there appeared to be a strategic
multi-agency approach towards addressing inequality, with reports suggesting 109 initiatives
were ongoing in 2004. This no longer appears to be the case. During the course of this
research, we found no multi-agency attempts to monitor progress of these social measures.
Moreover, the difficulty experienced in obtaining comparable data suggests that, in some
cases, data is no longer captured on some of the original measures. We acknowledge the
recent release of the Te Kupenga 2013 survey data, which is an encouraging sign in potential
monitoring of Māori indicators of wellbeing. However, currently this is a single survey. A
similar survey for Pacific people would appear warranted, along with an indication that the
survey will be repeated at regular intervals to allow monitoring to continue.
As observed by the OECD (2011:19) there is nothing inevitable about either high or
increasing inequalities. The majority of the indicators investigated in this study show
worsening outcomes for Māori and Pacific people. Of those indicators where closing gaps
are visible, in many cases, large gaps still remain. This growing gap in inequality between
Māori and Pacific people with the European population, warrants greater government
attention if the gaps are not to continue increasing into the future.
6.0 Conclusion
This study examines a number of indicators of inequality across a range of categories. The
data shows a mixed result. Poor results are found in the measures of health, paid work and
economic standard of living. The category that produces the best results is knowledge and
skills. However, within this category the results are also mixed, with improvements visible in
early childhood education, secondary school achievement, and tertiary participation, but not
in tertiary education outcomes.
27
Inequality in New Zealand is mitigated to some extent through the tax and transfer system.
However, this is not a long-term solution to address inequality. The OECD suggests that
focusing on ensuring people can engage effectively in employment is crucial to reducing
inequality. One way to achieve this is through education and skill development. The
measures discussed above suggest that success in education measures for Māori and Pacific
people has yet to flow through to the tertiary level where it may have greatest impact.
This research indicates that while New Zealand has had some successes in reducing
inequalities, the gaps in inequality among the majority of the indicators investigated in this
study show worsening outcomes for Māori and Pacific people. This growing gap in inequality
between Māori and Pacific people, and the European population, warrants greater
government attention if the gaps are not to continue increasing into the future.

28
Appendix I: Summary of Indicators and Findings
Group Table Indicator European Māori Pacific
Gap
(European
& Māori)
Gap
(European
& Pacific)
Health
1 Life expectancy at birth Improved Improved N/A Closing N/A
2 Prevalence of cigarette smoking Improved Improved Improved Increasing Increasing
3 Obesity Worse Worse Worse Increasing Increasing
4 Age-standardised suicide rates Mixed Mixed N/A Increasing N/A
5 Infant mortality rates Improved Improved Improved Closing Closing
Knowledge
and Skills
6 Participation in early childhood
education Improved Improved Improved Closing Closing
7
School leavers with a
qualification of NCEA Level 2 or
higher
Improved Improved Improved Closing Increasing
8 Proportion of the population with
a Bachelor’s degree or higher Improved Improved Improved Increasing Increasing
9 Tertiary participation rates Improved Improved Improved Gap is gone Gap is gone
Paid Work
10 Unemployment Worse Worse Worse Increasing Increasing
11 Employment Worse Worse Worse Increasing Increasing
12 Workplace injury claims Improved Improved Improved Closing Increasing
13 Median weekly earnings Improved Improved Improved Same Same
14 Percentage of the population
receiving a core benefit Improved Worse Improved Increasing Increasing
Economic
Standard of
Living
15 Median weekly income Improved Improved Improved Increasing Increasing
16 Personal income distribution Worse Worse Worse Increasing Increasing
17 Housing affordability Worse Improved Improved Closing Closing
18 Household crowding Improved Improved Improved Closing Closing
Cultural
Identity
19 Māori language speakers N/A Worse N/A Worse N/A
20 Māori medium education N/A Worse N/A Worse N/A
Social
Connected-
ness
21 Internet access in the home Improved Improved Improved Increasing Increasing
29
References
Ajwani, S., Blakely, T., Robson, B., Tobias, M., and Bonne, M. 2003. Decades of Disparity:
Ethnic mortality trends in New Zealand 1980-1999. Wellington: Ministry of Health.
Barnett, R., Pearce, J., and Moon, G. 2005. “Does social inequality matter? Changing ethnic
socio-economic disparities and Maori smoking in New Zealand, 1981-1996”, Social Science
and Medicine, 60:1515-1526.
Barnett, R., Moon, G., and Kearns, R. 2004. “Social Inequality and Ethnic Differences in
Smoking in New Zealand”, Social Science and Medicine, 59:129-143.
Blakely, T., Atkinson, J., and O’Dea, D. 2003. “No Association of Income Inequality with
Adult Mortality within New Zealand: A multi-level study of 1.4 million 25-64 year olds”,
Journal of Epidemiology and Community Health, 57:279-284.
Blakely, T., Fawcett, J., Hunt, D., and Wilson, N. 2006. “What is the Contribution of
Smoking and Socioeconomic Position to Ethnic Inequalities in Mortality in New Zealand?”
The Lancet, 368:44-52.
Bramley, D., Hebert, P., Tuzzio, L., and Chassin, M. 2005. “Disparities in Indigenous Health:
A cross-country comparison between New Zealand and the United States”, American Journal
of Public Health, 95(5):844-850.
Cabinet Social Development Committee. 2004a. Reducing Inequalities: Next Steps. Cabinet
Social Development Committee paper, Available at http://www.msd.govt.nz/ Retrieved 1
April 2014.
Cabinet Social Development Committee. 2004b. Six-Monthly Report on Reducing
Inequalities: January to June 2003. Cabinet Social Development Committee paper, Available
at http://www.msd.govt.nz/ Retrieved 1 April 2014
Cabinet Social Development Committee. 2004c. Six-Monthly Report on Reducing
Inequalities: July to December 2003. Cabinet Social Development Committee paper,
Available at http://www.msd.govt.nz/ Retrieved 1 April 2014.
Corak, M. 2013. “Income Inequality, Equality of Opportunity and Intergenerational
Mobility”, Journal of Economic Perspectives, 27(3):79-102.
Cribb, J., Hood, A., Joyce, R., and Phillips, D. 2012. Living Standards, Poverty and
Inequality in the UK: 2013. IFS Reports, Institute for Fiscal Studies, No. R81.
Kawachi, I., Kennedy, B.P., Lochner, K., and Prothrow-Stith, D. 1997. “Social Capital,
Income Inequality, and Mortality”, American Journal of Public Health, 87(9):1491-1498.
Lynch, J.W., Davey Smith, G., Kaplan, G.A., and House, J.S. 2000. “Income Inequality and
Mortality”, British Medical Journal, 320:1200-1204.
Ministry of Health. 2010. Suicide Facts: Deaths and intentional self-harm hospitalisations.
Wellington: Ministry of Health.
Ministry of Social Development. 2003. Social Indicators for the Pacific and Maori
Populations. Wellington: Ministry of Social Development.
Ministry of Social Development. 2004. Attachment 1: Reducing Inequalities Indicators for
Maori and Pacific Peoples. Wellington: Ministry of Social Development.
Ministry of Social Development. 2010. The Social Report: 2010. Wellington: Ministry of
Social Development.
Nana, G. 2013. Why Inequality Matters, In M Rashbrooke (ed) Inequality: a New Zealand
crisis. Wellington: Bridget Williams Books.
30
Organisation for Economic Cooperation and Development. 2008. Growing Unequal?:
Income distribution and poverty in OECD Countries. Paris: OECD Publishing.
Organisation for Economic Cooperation and Development. 2011. Divided We Stand: Why
Inequality Keeps Rising. Paris: OECD Publishing.
Organisation for Economic Cooperation and Development. 2013. OECD Factbook 2013:
Economic, Environment and Social Statistics. Paris: OECD Publishing.
Organisation for Economic Cooperation and Development. 2014. Datalab. Available at
www.oecd.org/statistics/datalab/income-distribution-poverty.htm. Retrieved 3 April 2014.
Ostry, J.D., Berg, A., and Tsangarides, C.G. 2014. Redistribution, Inequality and Growth.
International Monetary Fund, IMF Staff Discussion Note SDN 14/02.
Perry, B. 2013a. 2013 Household Incomes Report – Key Findings. Wellington: Ministry of
Social Development.
Perry, B. 2013b. Household Incomes in New Zealand: Trends in indicators of inequality and
hardship 1982 to 2012. Wellington: Ministry of Social Development.
Perry, B. 2014. Impact of Corrections to Disposable Income Data for 2009/10 to 2011/12 on
key figures and findings in the Household Incomes Report: What changes and what does not
change? Summary. Wellington: Ministry of Social Development.
Rashbrooke, M. 2014. “Why Income Gaps Matter: The Treasury and the tricky issue of
inequality”, Policy Quarterly, 10(1):3-8.
Royal Society of New Zealand. 2014. Our Futures: Te Pae Tāwhiti: The 2013 Census and
New Zealand’s Changing Population, Wellington: Royal Society of New Zealand.
Statistics New Zealand. 2009. New Zealand Life Tables: 2005-07. Wellington: Statistics New
Zealand.
Stiglitz, J.E. 2013. The Price of Inequality. London: Penguin Books.
Te Puni Kōkiri. 2012. Māori Youth in Education and Employment, Fact Sheet 022-2012.
Wellington: Te Puni Kōkiri.
Welfare Working Group. 2011. Welfare Working Group: Reducing Long-Term Benefit
Dependency – Recommendations. Available at www.igps.victoria.ac.nz/, Retrieved 2 April
2014.
Wilkinson, R.G. 1997. “Health Inequalities: Relative or absolute material standards?” British
Medical Journal, 314:591-599.
Wilkinson, R.G, and Pickett, K. 2010. The Spirit Level: Why equality is better for everyone.
London: Penguin Books.

Working Papers in Public FinanceChair in Public Finance Victoria Business School
About the Authors Dr Lisa Marriott is an Associate Professor and the Honours Programme Director in the School of Accounting and Commercial Law at Victoria University of Wellington. Dr Marriott's research interests include taxation, comparitive international accounting and experimental approaches to taxation research. She has particular interest in the behavioural impacts of taxation.Email: [email protected] Dr Dalice Sim is the Victoria University Statistical Consultant. Dr Sim studied Mathematics and Statistics at Auckland University before completing a PhD in Biostatistics at the University of Washington in Seattle, USA. Her statistical interests include clinical trials, longitudinal data analysis, survival analysis and categorical data analysis.
Top Related