


Languages
Pages
Legal


Implementing Renewable Energy at Water Utilities
Case Studies Prepared by: Bryan Lisk Hazen and Sawyer, P.C., 4011 West Chase Boulevard, Raleigh, North Carolina 27607 Ely Greenberg Hazen and Sawyer, P.C., 498 Seventh Avenue, New York, New York 10018 and Frederick Bloetscher Public Utility Management and Planning Services, Inc., P.O. Box 221890, Hollywood, Florida 33022 Sponsored by: Water Research Foundation 6666 West Quincy Avenue, Denver, CO 80235 Published by:
©2012 Water Research Foundation. ALL RIGHTS RESERVED.
20
INTRODUCTION Implementing a renewable energy project provides water utilities benefits such as
reducing fluctuations in the quality or price of electricity, environmental stewardship, providing a buffer in case of emergency, and generating positive publicity. However, there are also many obstacles. The complexity of incorporating renewable energy options is site-specific and state- or even region-specific. In some cases, power companies have disincentives for water utilities wishing to take advantage of renewable energy such as using a higher electricity rate due to the reduction of electricity purchased. In other cases, climatic and/or geologic conditions may limit what technologies may be used.
Despite these barriers, many utilities have found means for including renewable energy options at their facility, either through direct purchasing and operating of equipment, leasing space on-site to third-party renewable energy companies, through purchase power agreements, or purchasing offsets from third parties off-site to account for power use in high-energy applications such as desalination.
To provide context for WaterRF subscribers on this issue, the efforts of a few municipalities with successful renewable energy projects are highlighted as case studies. These case studies have been selected for the type of renewable energy technology, project scale, and location.
Solar photovoltaic technology was (and is) the most prevalent technology choice among water utilities. It is a mature technology that is easy to install and operate. However, it is not suited to every site. Other technologies that have been implemented include wind, micro-hydro, or geothermal. There are additional options from utilities that were not included in the case studies such as, self-powered water meters being piloted by Fairfax Water (VA, USA), geothermal and/or using water as a heat source or sink for building systems such as those systems in Keene (NH, USA), and the purchase of renewable energy (wind) from a third party such as the case with Water Corporation (NSW, Australia). Tidal and wave energy harvesting is relatively young, though it may be a viable (but less common) option for utilities. The use of Totally Enclosed Water to Air Cooled (TEWAC) pump motors may also provide a means for energy savings using water as a coolant.
The table that follows lists the case studies that are included in this report and encompass the most common technologies as well as different options for incorporating their use into a renewable energy portfolio. The case studies provide information about treatment processes at the facility, project costs, contracting arrangements, and challenges or peculiar circumstances related to implementing the project.
The intent is not to compare one facility to another, but rather to show the myriad of ways that renewable energy may be implemented. The case studies illustrate a variety of financing mechanisms like grants, rebates, or tax credits, and construction challenges. Striving for sustainability and reducing energy costs were common reasons for implementing the projects.
Also highlighted in the case studies are two facilities that achieved a LEED certification during their building renovation. LEED (Leadership in Energy and Environmental Design) is a rating system that promotes green building, design, construction, and operation of buildings. Rather than implement a specific renewable energy, these utilities were able to take advantage of making their facilities more energy efficient as a means to reducing operating costs.
©2012 Water Research Foundation. ALL RIGHTS RESERVED.

21
As part of the case studies, local community response to the project was also investigated. Of the projects listed below only one received negative feedback from the community in response to the need to remove trees for a solar project. The solution was to keep the trees and structure the purchase power agreement to account for possible lower efficiencies due to shading. In the case of micro-turbines the projects are below ground, invisible to the community.
Case Study Participants Utility Name Location Technology
1 City of Portsmouth NH LEED Silver Building 2 City of Raleigh NC Solar PV 3 Dania Beach FL LEED Gold Building 4 East Bay MUD – Sobrante WTP CA Solar PV 5 East Bay MUD – Walnut Creek WTP CA Solar PV 6 Inland Empire CA Wind 7 Metropolitan Water District CA Solar PV 8 Portland Water Bureau OR Solar PV 9 Portland Water Bureau OR Micro-hydro
10 Southern Nevada Water Authority NV Solar PV 11 Southern Nevada Water Authority NV Solar Thermal 12 Sydney Water, NSW AUS Micro-hydro Based on the information and experience gained from the utilities and from the process of
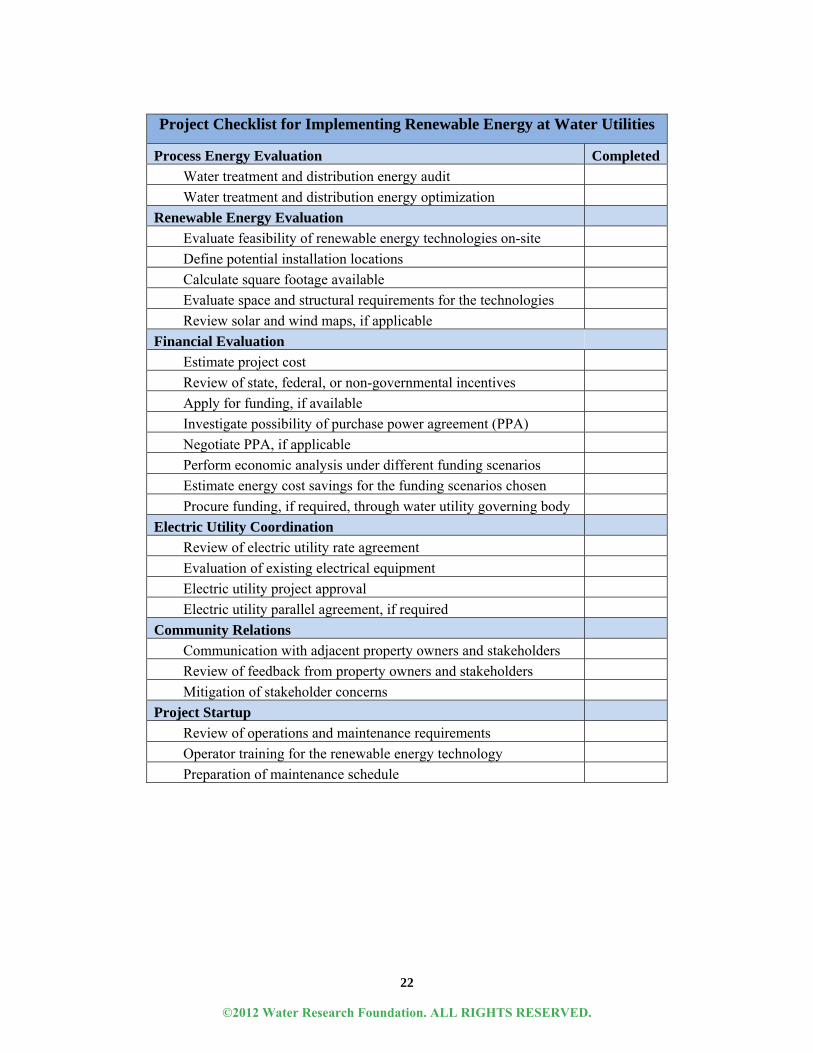
writing these case studies, a checklist has been developed for implementing a renewable energy project at a water utility. The check list should be used as guide for water utilities to ensure that that all major aspects of the project have been reviewed.
Ultimately, implementation of a renewable energy project is dependent on the unique circumstances of the water utility. Each facility faces its own geographic, financial, regulatory, or construction challenges. However, as these case studies and the associated report show, water utilities will need to become more involved in the energy sector to reduce operating costs associated with energy consumption. Higher electricity bills will either have to be absorbed by the water utility or passed on to the customer. For water utilities, active involvement in the energy sector translates to lower energy bills and ensuring a consistent supply of energy that is not subject to fluctuations in price or availability.
©2012 Water Research Foundation. ALL RIGHTS RESERVED.
22
Project Checklist for Implementing Renewable Energy at Water Utilities
Process Energy Evaluation Completed
Water treatment and distribution energy audit
Water treatment and distribution energy optimization
Renewable Energy Evaluation
Evaluate feasibility of renewable energy technologies on-site
Define potential installation locations
Calculate square footage available
Evaluate space and structural requirements for the technologies
Review solar and wind maps, if applicable
Financial Evaluation
Estimate project cost
Review of state, federal, or non-governmental incentives
Apply for funding, if available
Investigate possibility of purchase power agreement (PPA)
Negotiate PPA, if applicable
Perform economic analysis under different funding scenarios
Estimate energy cost savings for the funding scenarios chosen
Procure funding, if required, through water utility governing body
Electric Utility Coordination
Review of electric utility rate agreement
Evaluation of existing electrical equipment
Electric utility project approval
Electric utility parallel agreement, if required
Community Relations
Communication with adjacent property owners and stakeholders
Review of feedback from property owners and stakeholders
Mitigation of stakeholder concerns
Project Startup
Review of operations and maintenance requirements
Operator training for the renewable energy technology
Preparation of maintenance schedule
©2012 Water Research Foundation. ALL RIGHTS RESERVED.

23
DEFINITIONS OF TERMS USED IN THE CASE STUDIES
Annual Electricity Consumption, 2011 – The annual electric energy consumption for the water treatment plant. Annual Energy Consumption, non-electric sources, 2011 – The annual energy consumption for sources other than electricity. This includes natural gas (MMBTU, SCF, or Therms), or liquid fuels such as fuel oil (Gallons or liters). Capital Cost, USD – The total capital cost of the renewable energy installation. Average Utility Energy Cost, $/kWh – The average electricity cost paid by the facility. Energy Savings, USD – The cost savings per year since the renewable energy was installed. Financing:
Government Financing – Funding from a federal, state, or municipal source that does not control the water utility. Owner Financing – Funding from the municipal government or authority which controls the water utility. Third-Party - Funding from an energy services company or non-governmental organization.
O&M Cost, USD – The operation and maintenance cost per year for the renewable energy installation. This may include, for example cleaning solar panels, checking batteries, or exercising electrical controls. Annual Energy Generated – The annual energy generated by the renewable source. Population Served – The population served by the treatment plant. Rated Power Output, kW – The rated power output of the renewable energy installation. Simple Rate of Return – The number of years for payback for the project. This is calculated by dividing the cost of the project by the cost savings per year. Design-build contract - A contract in which the design engineering and construction services are provided by a single entity. Design-bid-build contract - A project where the design engineering and construction services are provided by different entities. Typically, the project owner contracts and engineering firm for the design, and then tenders bids to contractors to build the project. Power Purchase agreement (PPA) - A contract between an energy supplier and an energy consumer. The PPA defines the commercial terms for the sale of electricity, including when the
©2012 Water Research Foundation. ALL RIGHTS RESERVED.

24
project will begin, schedule for delivery of electricity, penalties for under delivery, payment terms, and termination. Utility governance structure - The city, county, district, authority, or private entity which governs the water utility and makes decisions about capital projects.
©2012 Water Research Foundation. ALL RIGHTS RESERVED.
25
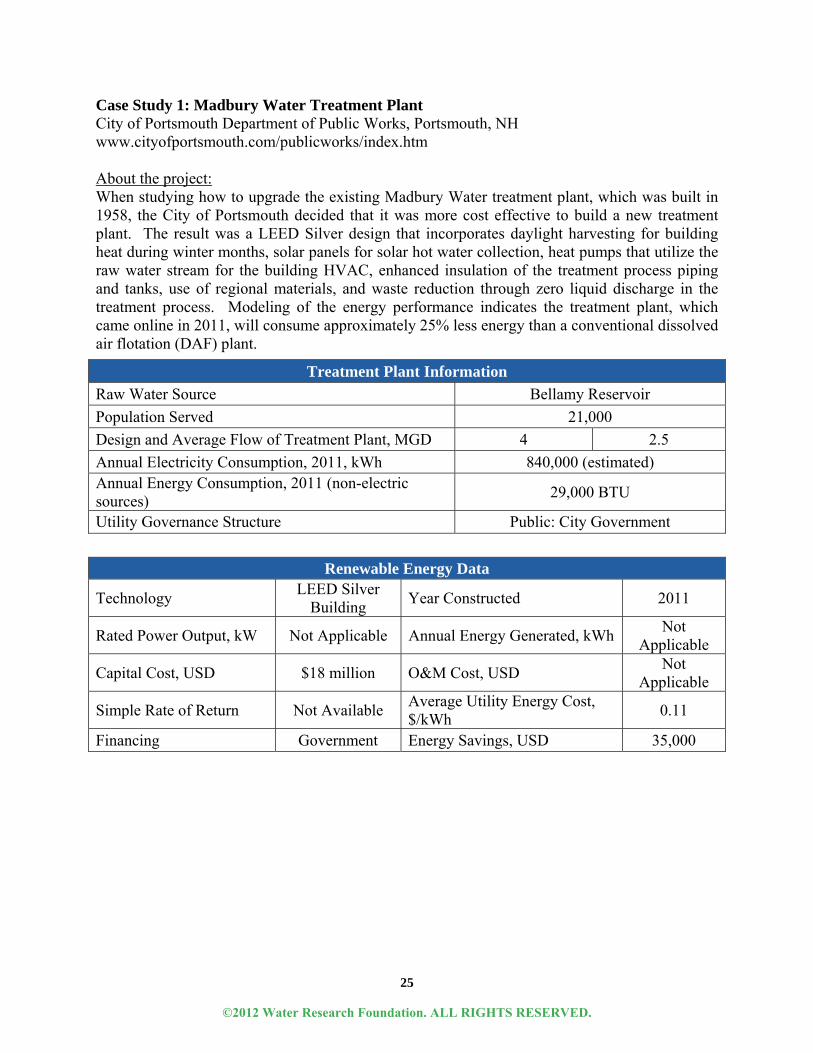
Case Study 1: Madbury Water Treatment Plant City of Portsmouth Department of Public Works, Portsmouth, NH www.cityofportsmouth.com/publicworks/index.htm About the project: When studying how to upgrade the existing Madbury Water treatment plant, which was built in 1958, the City of Portsmouth decided that it was more cost effective to build a new treatment plant. The result was a LEED Silver design that incorporates daylight harvesting for building heat during winter months, solar panels for solar hot water collection, heat pumps that utilize the raw water stream for the building HVAC, enhanced insulation of the treatment process piping and tanks, use of regional materials, and waste reduction through zero liquid discharge in the treatment process. Modeling of the energy performance indicates the treatment plant, which came online in 2011, will consume approximately 25% less energy than a conventional dissolved air flotation (DAF) plant.
Treatment Plant Information
Raw Water Source Bellamy Reservoir
Population Served 21,000
Design and Average Flow of Treatment Plant, MGD 4 2.5
Annual Electricity Consumption, 2011, kWh 840,000 (estimated) Annual Energy Consumption, 2011 (non-electric sources)
29,000 BTU
Utility Governance Structure Public: City Government
Renewable Energy Data
Technology LEED Silver
Building Year Constructed 2011
Rated Power Output, kW Not Applicable Annual Energy Generated, kWh Not
Applicable
Capital Cost, USD $18 million O&M Cost, USD Not
Applicable
Simple Rate of Return Not Available Average Utility Energy Cost, $/kWh
0.11
Financing Government Energy Savings, USD 35,000
©2012 Water Research Foundation. ALL RIGHTS RESERVED.
26
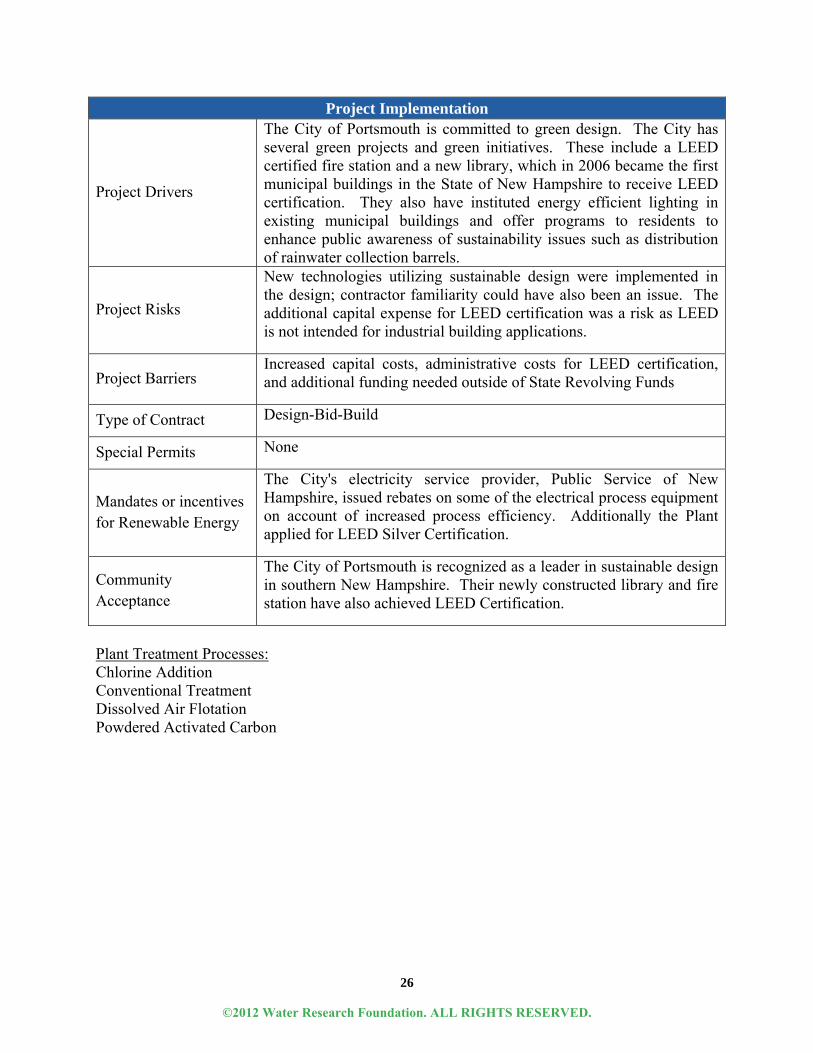
Plant Treatment Processes: Chlorine Addition Conventional Treatment Dissolved Air Flotation Powdered Activated Carbon
Project Implementation
Project Drivers
The City of Portsmouth is committed to green design. The City has several green projects and green initiatives. These include a LEED certified fire station and a new library, which in 2006 became the first municipal buildings in the State of New Hampshire to receive LEED certification. They also have instituted energy efficient lighting in existing municipal buildings and offer programs to residents to enhance public awareness of sustainability issues such as distribution of rainwater collection barrels.
Project Risks
New technologies utilizing sustainable design were implemented in the design; contractor familiarity could have also been an issue. The additional capital expense for LEED certification was a risk as LEED is not intended for industrial building applications.
Project Barriers Increased capital costs, administrative costs for LEED certification, and additional funding needed outside of State Revolving Funds
Type of Contract Design-Bid-Build
Special Permits None
Mandates or incentives for Renewable Energy
The City's electricity service provider, Public Service of New Hampshire, issued rebates on some of the electrical process equipment on account of increased process efficiency. Additionally the Plant applied for LEED Silver Certification.
Community Acceptance
The City of Portsmouth is recognized as a leader in sustainable design in southern New Hampshire. Their newly constructed library and fire station have also achieved LEED Certification.
©2012 Water Research Foundation. ALL RIGHTS RESERVED.
27
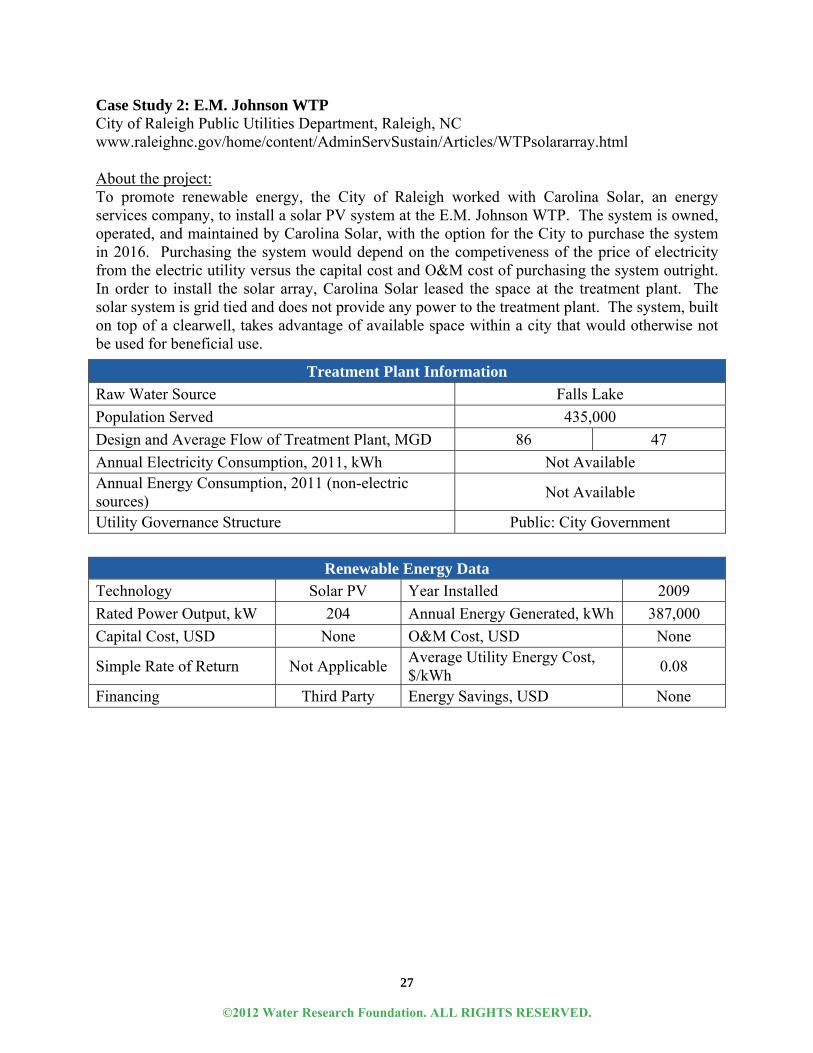
Case Study 2: E.M. Johnson WTP City of Raleigh Public Utilities Department, Raleigh, NC www.raleighnc.gov/home/content/AdminServSustain/Articles/WTPsolararray.html About the project: To promote renewable energy, the City of Raleigh worked with Carolina Solar, an energy services company, to install a solar PV system at the E.M. Johnson WTP. The system is owned, operated, and maintained by Carolina Solar, with the option for the City to purchase the system in 2016. Purchasing the system would depend on the competiveness of the price of electricity from the electric utility versus the capital cost and O&M cost of purchasing the system outright. In order to install the solar array, Carolina Solar leased the space at the treatment plant. The solar system is grid tied and does not provide any power to the treatment plant. The system, built on top of a clearwell, takes advantage of available space within a city that would otherwise not be used for beneficial use.
Treatment Plant Information
Raw Water Source Falls Lake
Population Served 435,000
Design and Average Flow of Treatment Plant, MGD 86 47
Annual Electricity Consumption, 2011, kWh Not Available Annual Energy Consumption, 2011 (non-electric sources)
Not Available
Utility Governance Structure Public: City Government
Renewable Energy Data
Technology Solar PV Year Installed 2009
Rated Power Output, kW 204 Annual Energy Generated, kWh 387,000
Capital Cost, USD None O&M Cost, USD None
Simple Rate of Return Not Applicable Average Utility Energy Cost, $/kWh
0.08
Financing Third Party Energy Savings, USD None
©2012 Water Research Foundation. ALL RIGHTS RESERVED.
28
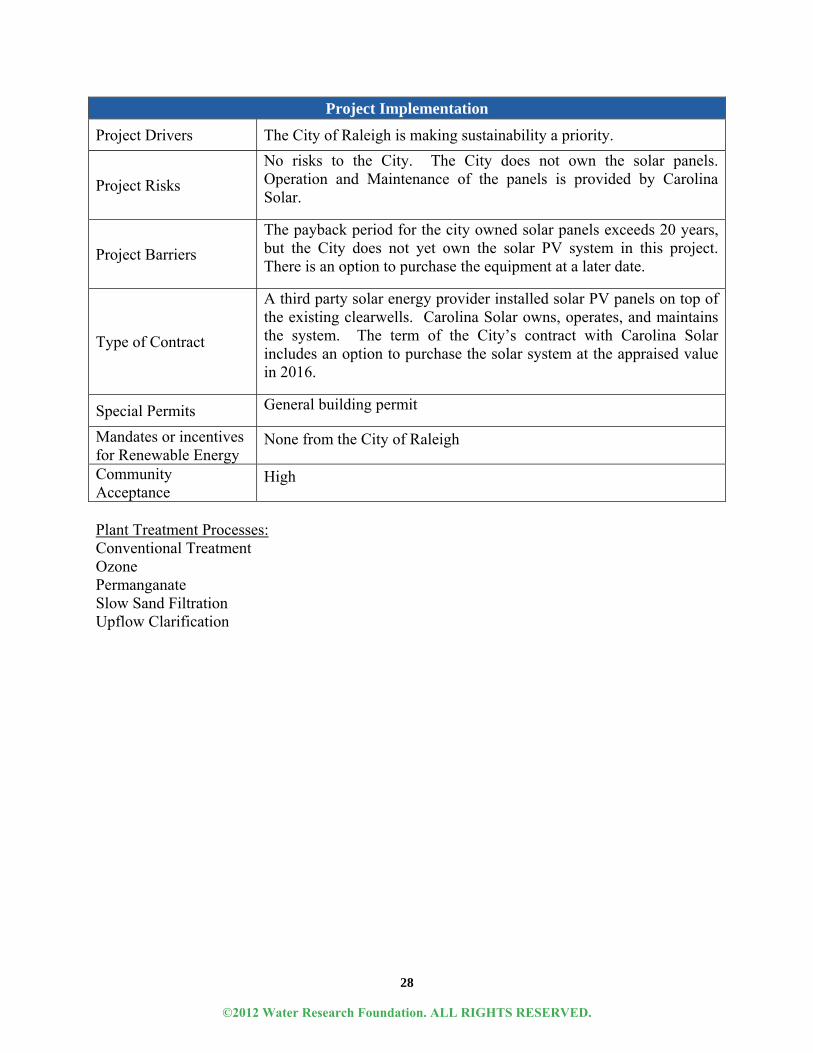
Plant Treatment Processes: Conventional Treatment Ozone Permanganate Slow Sand Filtration Upflow Clarification
Project Implementation
Project Drivers The City of Raleigh is making sustainability a priority.
Project Risks
No risks to the City. The City does not own the solar panels. Operation and Maintenance of the panels is provided by Carolina Solar.
Project Barriers
The payback period for the city owned solar panels exceeds 20 years, but the City does not yet own the solar PV system in this project. There is an option to purchase the equipment at a later date.
Type of Contract
A third party solar energy provider installed solar PV panels on top of the existing clearwells. Carolina Solar owns, operates, and maintains the system. The term of the City’s contract with Carolina Solar includes an option to purchase the solar system at the appraised value in 2016.
Special Permits General building permit
Mandates or incentives for Renewable Energy
None from the City of Raleigh
Community Acceptance
High
©2012 Water Research Foundation. ALL RIGHTS RESERVED.

29
Case Study 3: Dania Beach Water Treatment Plant Dania Beach, FL http://ci.dania-beach.fl.us/index.aspx About the project: In order to expand treatment capacity to improve water quality, the City of Dania Beach, FL chose to construct a nanofiltration (NF) facility. The proposed facility requires approximately 50% more power than a facility without nanofiltration. To meet the increased energy requirements, solar PV, wind turbines, and micro-hydro technologies were investigated. Solar PV was selected as the best option, but in order for a solar PV project to provide enough power to operate the facility an additional $4,500,000 would have been added to the cost. Consequently, it was decided to build the new nanofiltration facility as a LEED gold building, which reduced energy consumption by 20% versus a non-LEED certified plant of a similar size.
Treatment Plant Information
Raw Water Source Shallow aquifer
Population Served 17,000
Design and Average Flow of Treatment Plant, MGD 5.0 2.4
Annual Electricity Consumption, 2011, kWh 100,000 (projected to rise to 250,000
with new NF process Annual Energy Consumption, 2011 (non-electric sources)
None
Utility Governance Structure Public: City Government
Renewable Energy Data
Technology LEED Gold
Building Year Constructed 2012
Rated Power Output, kW Not Applicable Annual Energy Generated, kWh Not
Applicable
Capital Cost, USD $8.8 million O&M Cost, USD Not
Applicable
Simple Rate of Return Not Available Average Utility Energy Cost, $/kWh
Not Available
Financing Owner Energy Savings, USD Not
Available
©2012 Water Research Foundation. ALL RIGHTS RESERVED.
30
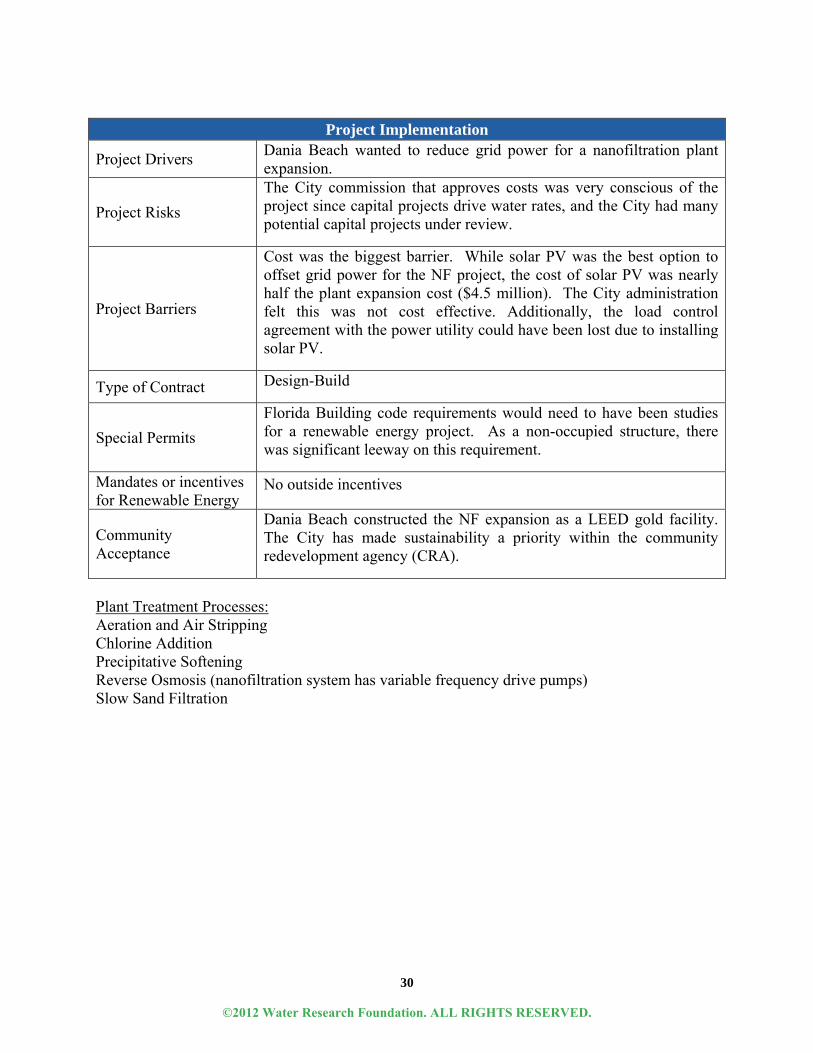
Plant Treatment Processes: Aeration and Air Stripping Chlorine Addition Precipitative Softening Reverse Osmosis (nanofiltration system has variable frequency drive pumps) Slow Sand Filtration
Project Implementation
Project Drivers Dania Beach wanted to reduce grid power for a nanofiltration plant expansion.
Project Risks
The City commission that approves costs was very conscious of the project since capital projects drive water rates, and the City had many potential capital projects under review.
Project Barriers
Cost was the biggest barrier. While solar PV was the best option to offset grid power for the NF project, the cost of solar PV was nearly half the plant expansion cost ($4.5 million). The City administration felt this was not cost effective. Additionally, the load control agreement with the power utility could have been lost due to installing solar PV.
Type of Contract Design-Build
Special Permits
Florida Building code requirements would need to have been studies for a renewable energy project. As a non-occupied structure, there was significant leeway on this requirement.
Mandates or incentives for Renewable Energy
No outside incentives
Community Acceptance
Dania Beach constructed the NF expansion as a LEED gold facility. The City has made sustainability a priority within the community redevelopment agency (CRA).
©2012 Water Research Foundation. ALL RIGHTS RESERVED.

31
Case Study 4: Sobrante Water Treatment Plant East Bay Municipal Utility District, Oakland, CA www.ebmud.com About the project: East Bay Municipal Utility District (EBMUD) financed and installed this 430 kW solar project that provides 10% of the power to the Sobrante WTP. This plant, which only operates 9 months per year to meet summer demand, serves a variety of residential and industrial users. The system was partially financed by a grant from the California Solar Generation Incentive Program, which provided about 30% of the cost. Installation of the solar system did not change the electricity rate. Of the power generated about 95% is used on-site and 5% percent is exported through net metering.
Treatment Plant Information
Raw Water Source San Pablo Reservoir
Population Served Residential and Industrial
Design and Average Flow of Treatment Plant, MGD 30 12 (in service 9
months per year) Annual Electricity Consumption, 2011, kWh 2,755,823 Annual Energy Consumption, 2011 (non-electric sources)
28,357
Utility Governance Structure Municipal Utility District: Publicly Elected Board of Directors/Manager
Renewable Energy Data
Technology Solar PV Year Installed 2007
Rated Power Output, kW 430 Annual Energy Generated, kWh 600,000
Capital Cost, USD $3.6 Million O&M Cost, USD None
Simple Rate of Return ~3% per year Average Utility Energy Cost, $/kWh
0.14
Financing Government Energy Savings, USD $100,000
FY12
©2012 Water Research Foundation. ALL RIGHTS RESERVED.
32
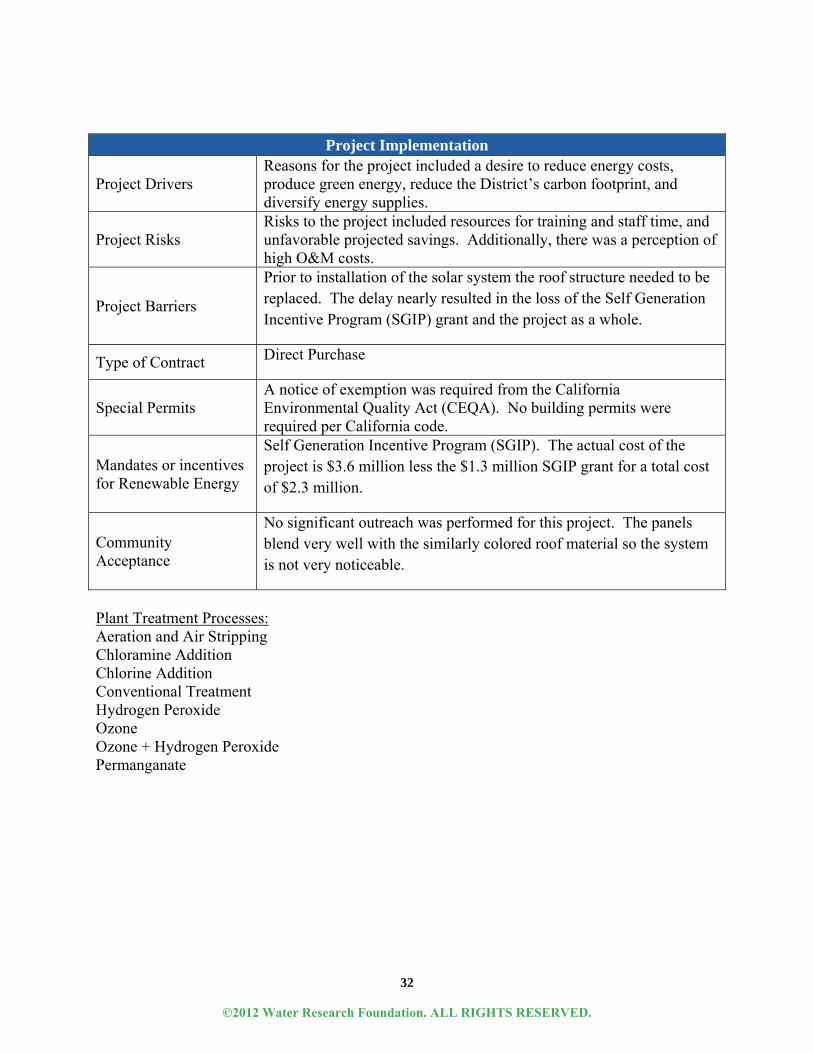
Plant Treatment Processes: Aeration and Air Stripping Chloramine Addition Chlorine Addition Conventional Treatment Hydrogen Peroxide Ozone Ozone + Hydrogen Peroxide Permanganate
Project Implementation
Project Drivers Reasons for the project included a desire to reduce energy costs, produce green energy, reduce the District’s carbon footprint, and diversify energy supplies.
Project Risks Risks to the project included resources for training and staff time, and unfavorable projected savings. Additionally, there was a perception of high O&M costs.
Project Barriers
Prior to installation of the solar system the roof structure needed to be replaced. The delay nearly resulted in the loss of the Self Generation Incentive Program (SGIP) grant and the project as a whole.
Type of Contract Direct Purchase
Special Permits A notice of exemption was required from the California Environmental Quality Act (CEQA). No building permits were required per California code.
Mandates or incentives for Renewable Energy
Self Generation Incentive Program (SGIP). The actual cost of the project is $3.6 million less the $1.3 million SGIP grant for a total cost of $2.3 million.
Community Acceptance
No significant outreach was performed for this project. The panels blend very well with the similarly colored roof material so the system is not very noticeable.
©2012 Water Research Foundation. ALL RIGHTS RESERVED.
33
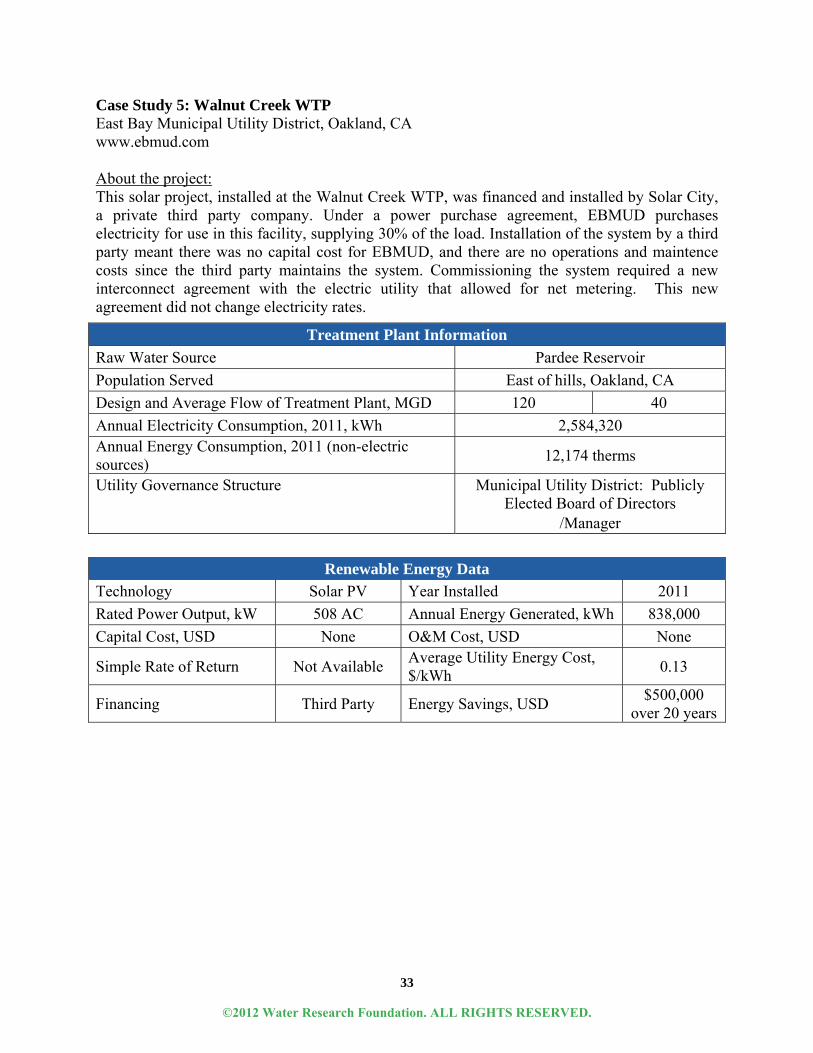
Case Study 5: Walnut Creek WTP East Bay Municipal Utility District, Oakland, CA www.ebmud.com About the project: This solar project, installed at the Walnut Creek WTP, was financed and installed by Solar City, a private third party company. Under a power purchase agreement, EBMUD purchases electricity for use in this facility, supplying 30% of the load. Installation of the system by a third party meant there was no capital cost for EBMUD, and there are no operations and maintence costs since the third party maintains the system. Commissioning the system required a new interconnect agreement with the electric utility that allowed for net metering. This new agreement did not change electricity rates.
Treatment Plant Information
Raw Water Source Pardee Reservoir
Population Served East of hills, Oakland, CA
Design and Average Flow of Treatment Plant, MGD 120 40
Annual Electricity Consumption, 2011, kWh 2,584,320 Annual Energy Consumption, 2011 (non-electric sources)
12,174 therms
Utility Governance Structure Municipal Utility District: Publicly Elected Board of Directors
/Manager
Renewable Energy Data
Technology Solar PV Year Installed 2011
Rated Power Output, kW 508 AC Annual Energy Generated, kWh 838,000
Capital Cost, USD None O&M Cost, USD None
Simple Rate of Return Not Available Average Utility Energy Cost, $/kWh
0.13
Financing Third Party Energy Savings, USD $500,000
over 20 years
©2012 Water Research Foundation. ALL RIGHTS RESERVED.
34
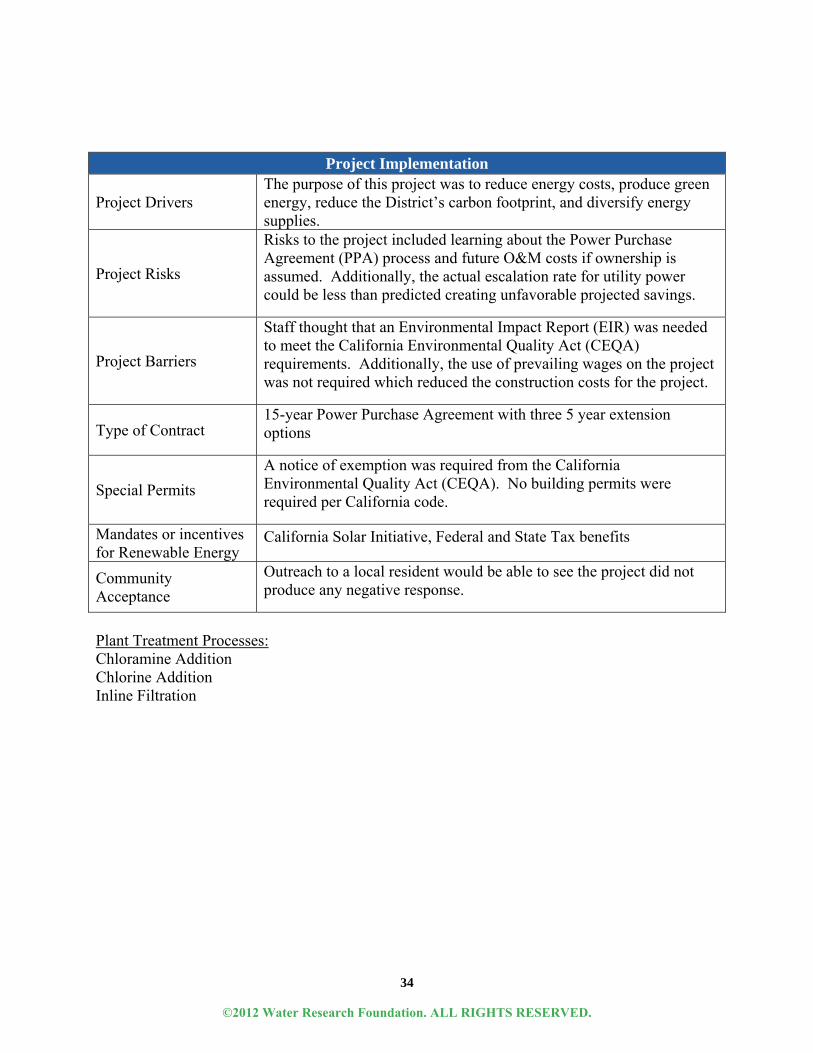
Plant Treatment Processes: Chloramine Addition Chlorine Addition Inline Filtration
Project Implementation
Project Drivers The purpose of this project was to reduce energy costs, produce green energy, reduce the District’s carbon footprint, and diversify energy supplies.
Project Risks
Risks to the project included learning about the Power Purchase Agreement (PPA) process and future O&M costs if ownership is assumed. Additionally, the actual escalation rate for utility power could be less than predicted creating unfavorable projected savings.
Project Barriers
Staff thought that an Environmental Impact Report (EIR) was needed to meet the California Environmental Quality Act (CEQA) requirements. Additionally, the use of prevailing wages on the project was not required which reduced the construction costs for the project.
Type of Contract 15-year Power Purchase Agreement with three 5 year extension options
Special Permits
A notice of exemption was required from the California Environmental Quality Act (CEQA). No building permits were required per California code.
Mandates or incentives for Renewable Energy
California Solar Initiative, Federal and State Tax benefits
Community Acceptance
Outreach to a local resident would be able to see the project did not produce any negative response.
©2012 Water Research Foundation. ALL RIGHTS RESERVED.
35
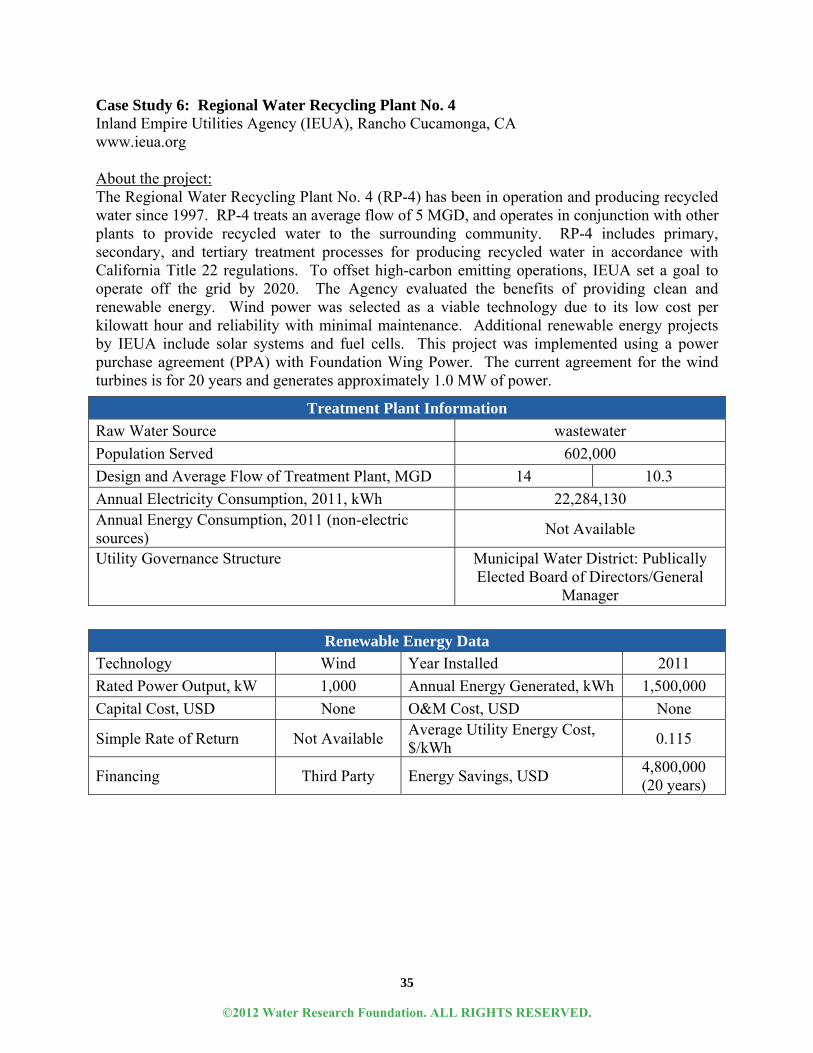
Case Study 6: Regional Water Recycling Plant No. 4 Inland Empire Utilities Agency (IEUA), Rancho Cucamonga, CA www.ieua.org About the project: The Regional Water Recycling Plant No. 4 (RP-4) has been in operation and producing recycled water since 1997. RP-4 treats an average flow of 5 MGD, and operates in conjunction with other plants to provide recycled water to the surrounding community. RP-4 includes primary, secondary, and tertiary treatment processes for producing recycled water in accordance with California Title 22 regulations. To offset high-carbon emitting operations, IEUA set a goal to operate off the grid by 2020. The Agency evaluated the benefits of providing clean and renewable energy. Wind power was selected as a viable technology due to its low cost per kilowatt hour and reliability with minimal maintenance. Additional renewable energy projects by IEUA include solar systems and fuel cells. This project was implemented using a power purchase agreement (PPA) with Foundation Wing Power. The current agreement for the wind turbines is for 20 years and generates approximately 1.0 MW of power.
Treatment Plant Information
Raw Water Source wastewater
Population Served 602,000
Design and Average Flow of Treatment Plant, MGD 14 10.3
Annual Electricity Consumption, 2011, kWh 22,284,130 Annual Energy Consumption, 2011 (non-electric sources)
Not Available
Utility Governance Structure Municipal Water District: Publically Elected Board of Directors/General
Manager
Renewable Energy Data
Technology Wind Year Installed 2011
Rated Power Output, kW 1,000 Annual Energy Generated, kWh 1,500,000
Capital Cost, USD None O&M Cost, USD None
Simple Rate of Return Not Available Average Utility Energy Cost, $/kWh
0.115
Financing Third Party Energy Savings, USD 4,800,000 (20 years)
©2012 Water Research Foundation. ALL RIGHTS RESERVED.

36
Additional Information: This facility is a wastewater recycling plant with preliminary and primary treatment (bar screens, grit chambers, chemical addition, and primary clarifiers), secondary treatment (aeration basins with oxic and anoxic zones, and secondary clarifiers), tertiary treatment (coagulation / flocculation, filtration, chlorination), and solids handling.
Project Implementation
Project Drivers Drivers for this project included cost containment, operational reliability, electricity rate stabilization, and carbon footprint reduction.
Project Risks This project was a power purchase agreement, which reduced the risks.
Project Barriers Approval from the Federal Aviation Administration (FAA)
Type of Contract Power Purchase Agreement
Special Permits Southern California Edison Interconnection Agreement
Mandates or incentives for Renewable Energy
Self Generation Incentive Program (SGIP)
Community Acceptance
Positive
©2012 Water Research Foundation. ALL RIGHTS RESERVED.

37
Case Study 7: Skinner Water Treatment Plant Metropolitan Water District of Southern California, Winchester, CA www.mwdh2o.com The Robert A. Skinner Treatment Plant is one of five treatment plants of the Metropolitan Water District of Southern California (MWD). Located in Temecula Valley, the plant supplies treated water for roughly 3 million residents of Eastern and Municipal Water Districts in Riverside County and the San Diego County Water Authority. Skinner is the only MWD facility which features both conventional and direct filtration processes. It switched from chlorine to ozone disinfection as part of a district-wide conversion program. Skinner’s solar energy installation is part of their commitment to promoting energy and water conservation and reducing their carbon footprint.
Treatment Plant Information
Raw Water Source Colorado River
Population Served 3,000,000
Design and Average Flow of Treatment Plant, MGD 630 135
Annual Electricity Consumption, 2011, kWh 13,826,000 Annual Energy Consumption, 2011 (non-electric sources)
20 MMBTU
Utility Governance Structure Metropolitan Water District: Board of Directors, representing 26 member
agencies
Renewable Energy Data
Technology Solar PV Year Installed 2008
Rated Power Output, kW 955 Annual Energy Generated, kWh 2,370,000
Capital Cost, USD $9,984,000 O&M Cost, USD $20,000/year
Simple Rate of Return 10-12 years Average Utility Energy Cost, $/kWh
0.12
Financing Owner Energy Savings, USD $300,000 per
year
©2012 Water Research Foundation. ALL RIGHTS RESERVED.

38
Plant Treatment Processes: Biological Filtration Chloramine Addition Chlorine Addition Conventional Treatment Direct Filtration Hydrogen Peroxide Ozone Ozone + Hydrogen Peroxide Additional Information: Annual electricity consumption total includes solar PV generation consumed on-site. The non-electric energy source is propane.
Project Implementation
Project Drivers The project was driven by cost control and environmental stewardship.
Project Risks
Risks included meeting California’s Solar Initiative (CSI) rebate timelines. Additionally, under the type of capital construction contract, there was limited time to implement the project within the eighteen months as required under CSI.
Project Barriers None
Type of Contract Design-bid-build
Special Permits None
Mandates or incentives for Renewable Energy
Projected five million dollars in rebates from the 2008 – 2013.
Community Acceptance
Although the site is visible from the adjacent highway, no community comments have been received to date. During the design there was no reaction from the community.
©2012 Water Research Foundation. ALL RIGHTS RESERVED.

39
Case Study 8: Groundwater Pump Station Portland Water Bureau, Portland, OR www.portlandoregon.gov/water/ About the project: The Portland Water Bureau operates a groundwater pump station to provide emergency and supplemental water supply capacity. A 267 kW solar PV system was installed to provide power to the station and the pumps. The project was financed by a third party, energy services company (ESCO) that wanted to take advantage of Oregon tax rebates, and was designed by an outside consultant. The cost of the project was not passed on to customers. Since the station is not continuously in operation a bi-directional electric utility meter was installed in conjunction with the power company and the solar system is net-metered. To balance community concerns that prevented cutting of trees, the output of the solar panels in evaluated from year to year. If the output drops below a pre-set level, Portland Water Bureau will pay the ESCO a fee to make up for the loss in revenue.
Treatment Plant Information
Raw Water Source Groundwater
Population Served by the Facility 900,000
Design and Average Flow of Treatment Plant, MGD 110 85
Annual Electricity Consumption, 2011, kWh 2,935,000 Annual Energy Consumption, 2011 (non-electric sources)
None
Utility Governance Structure Public: City Government
Renewable Energy Data
Technology Solar PV Year Installed 2009
Rated Power Output, kW 267.54 Annual Energy Generated, kWh 255,000
Capital Cost, USD $2,100,000
($350,000 PWB Contribution)
O&M Cost, USD 2,000
Simple Rate of Return 20 years Average Utility Energy Cost, $/kWh
0.07
Financing Third Party Energy Savings, USD $17,800
©2012 Water Research Foundation. ALL RIGHTS RESERVED.
40
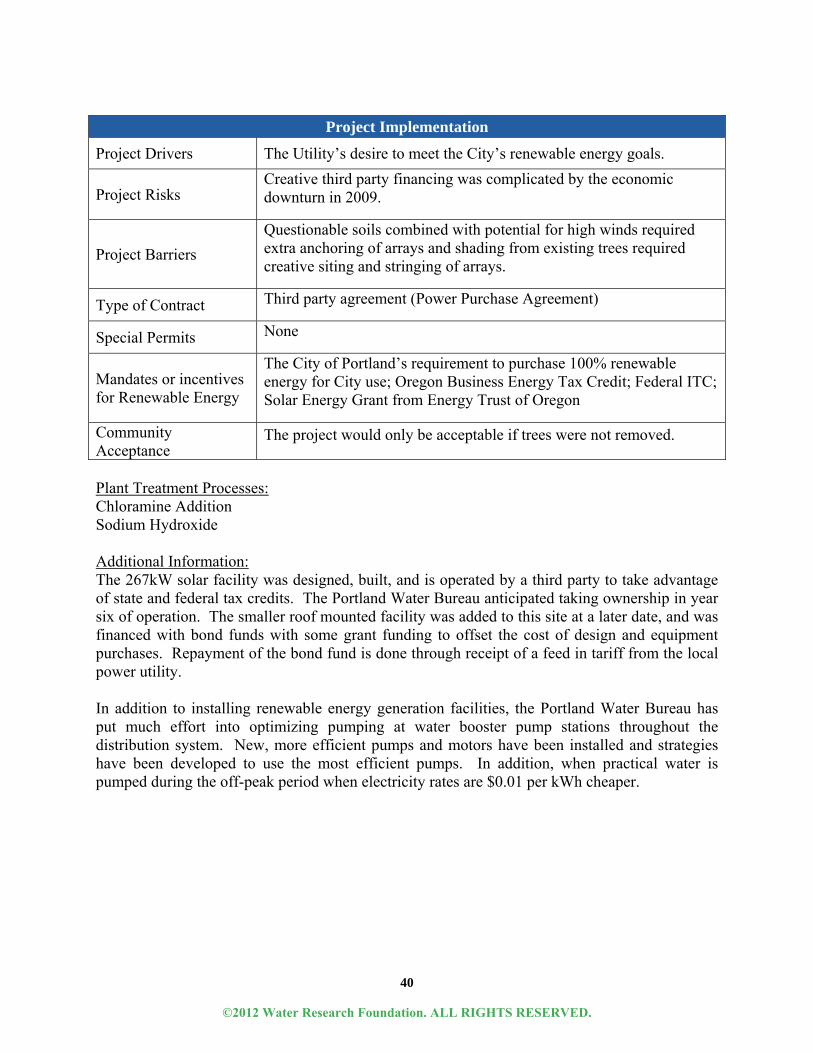
Plant Treatment Processes: Chloramine Addition Sodium Hydroxide Additional Information: The 267kW solar facility was designed, built, and is operated by a third party to take advantage of state and federal tax credits. The Portland Water Bureau anticipated taking ownership in year six of operation. The smaller roof mounted facility was added to this site at a later date, and was financed with bond funds with some grant funding to offset the cost of design and equipment purchases. Repayment of the bond fund is done through receipt of a feed in tariff from the local power utility. In addition to installing renewable energy generation facilities, the Portland Water Bureau has put much effort into optimizing pumping at water booster pump stations throughout the distribution system. New, more efficient pumps and motors have been installed and strategies have been developed to use the most efficient pumps. In addition, when practical water is pumped during the off-peak period when electricity rates are $0.01 per kWh cheaper.
Project Implementation
Project Drivers The Utility’s desire to meet the City’s renewable energy goals.
Project Risks Creative third party financing was complicated by the economic downturn in 2009.
Project Barriers
Questionable soils combined with potential for high winds required extra anchoring of arrays and shading from existing trees required creative siting and stringing of arrays.
Type of Contract Third party agreement (Power Purchase Agreement)
Special Permits None
Mandates or incentives for Renewable Energy
The City of Portland’s requirement to purchase 100% renewable energy for City use; Oregon Business Energy Tax Credit; Federal ITC; Solar Energy Grant from Energy Trust of Oregon
Community Acceptance
The project would only be acceptable if trees were not removed.
©2012 Water Research Foundation. ALL RIGHTS RESERVED.
41
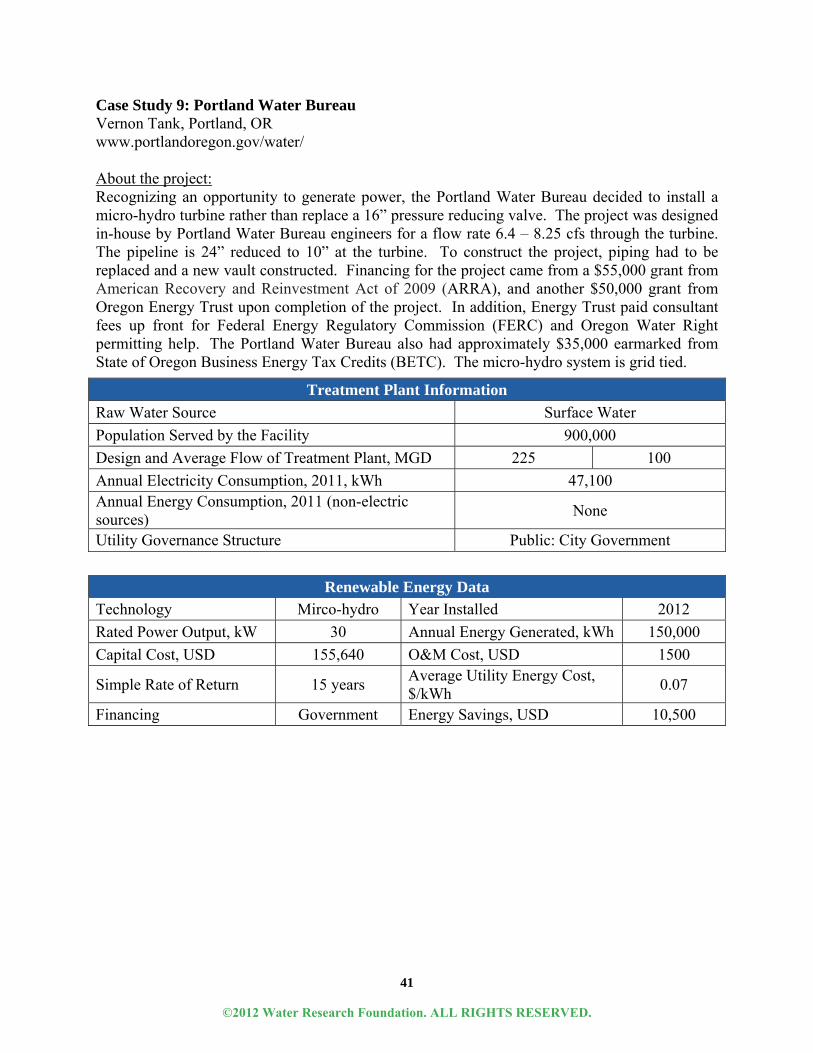
Case Study 9: Portland Water Bureau Vernon Tank, Portland, OR www.portlandoregon.gov/water/ About the project: Recognizing an opportunity to generate power, the Portland Water Bureau decided to install a micro-hydro turbine rather than replace a 16” pressure reducing valve. The project was designed in-house by Portland Water Bureau engineers for a flow rate 6.4 – 8.25 cfs through the turbine. The pipeline is 24” reduced to 10” at the turbine. To construct the project, piping had to be replaced and a new vault constructed. Financing for the project came from a $55,000 grant from American Recovery and Reinvestment Act of 2009 (ARRA), and another $50,000 grant from Oregon Energy Trust upon completion of the project. In addition, Energy Trust paid consultant fees up front for Federal Energy Regulatory Commission (FERC) and Oregon Water Right permitting help. The Portland Water Bureau also had approximately $35,000 earmarked from State of Oregon Business Energy Tax Credits (BETC). The micro-hydro system is grid tied.
Treatment Plant Information
Raw Water Source Surface Water
Population Served by the Facility 900,000
Design and Average Flow of Treatment Plant, MGD 225 100
Annual Electricity Consumption, 2011, kWh 47,100 Annual Energy Consumption, 2011 (non-electric sources)
None
Utility Governance Structure Public: City Government
Renewable Energy Data
Technology Mirco-hydro Year Installed 2012
Rated Power Output, kW 30 Annual Energy Generated, kWh 150,000
Capital Cost, USD 155,640 O&M Cost, USD 1500
Simple Rate of Return 15 years Average Utility Energy Cost, $/kWh
0.07
Financing Government Energy Savings, USD 10,500
©2012 Water Research Foundation. ALL RIGHTS RESERVED.
42
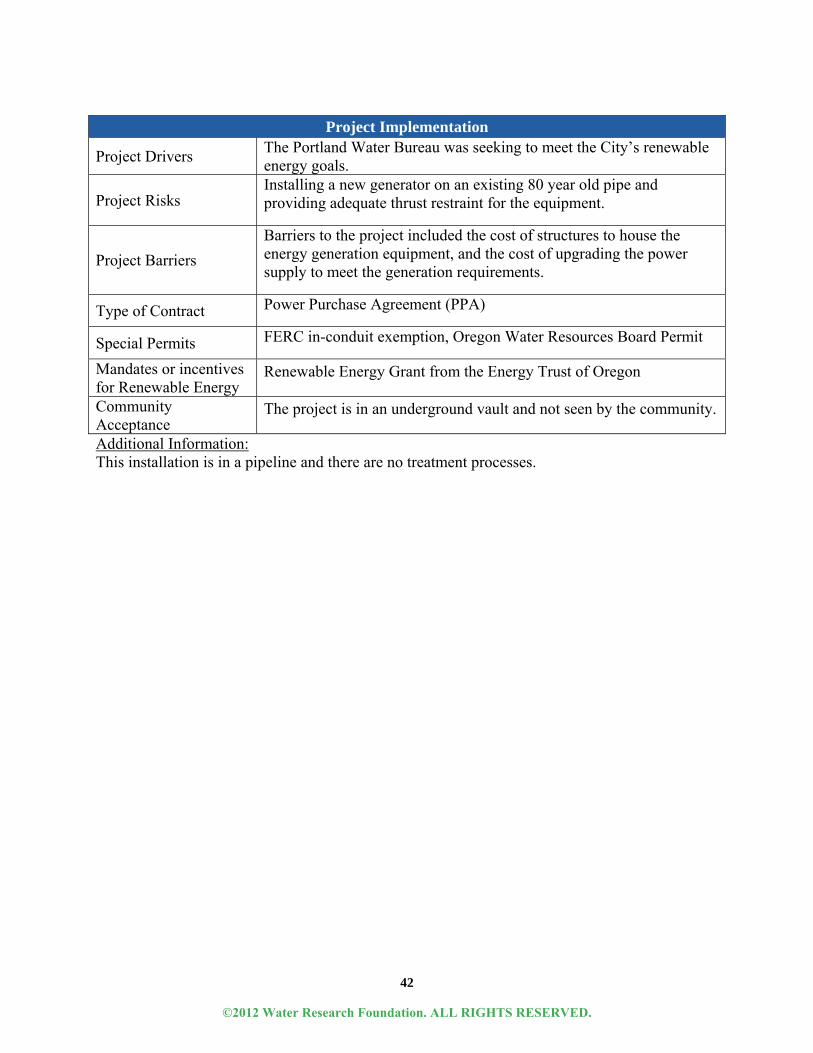
Additional Information: This installation is in a pipeline and there are no treatment processes.
Project Implementation
Project Drivers The Portland Water Bureau was seeking to meet the City’s renewable energy goals.
Project Risks Installing a new generator on an existing 80 year old pipe and providing adequate thrust restraint for the equipment.
Project Barriers
Barriers to the project included the cost of structures to house the energy generation equipment, and the cost of upgrading the power supply to meet the generation requirements.
Type of Contract Power Purchase Agreement (PPA)
Special Permits FERC in-conduit exemption, Oregon Water Resources Board Permit
Mandates or incentives for Renewable Energy
Renewable Energy Grant from the Energy Trust of Oregon
Community Acceptance
The project is in an underground vault and not seen by the community.
©2012 Water Research Foundation. ALL RIGHTS RESERVED.

43
Case Study 10: Alfred Merritt Smith Water Treatment Facility Southern Nevada Water Authority, Boulder City, NV www.snwa.com/env/sustain_solar.html About the project: At the Alfred Merritt Smith Water Treatment Facility, Southern Nevada Water Authority (SNWA) installed a 130 kW solar PV system on a car port. The project was installed as a demonstration project with a local university and serves to offset conventional power consumption. SNWA generates most of its power through a gas-fired combined cycle power plant and smaller hydropower facilities. As a result, they did not have to coordinate the solar installation with a power company. The local vegetation is a mix of typical desert vegetation, and does not require much trimming of trees around the solar panels. SNWA wrote the RFP, completed the preliminary design, and contracted the final design and permits to a consulting engineering firm. To reduce electricity costs SNWA does most pumping and treatment at night from 11pm to 6 am, when electricity rates are at their lowest.
Treatment Plant Information
Raw Water Source Lake Mead National Recreation Area
Population Served 1,200,000
Design and Average Flow of Treatment Plant, MGD 600 300
Annual Electricity Consumption, 2011, kWh 498,151,037 Annual Energy Consumption, 2011 (non-electric sources)
Not Available
Utility Governance Structure Board of Directors representing 7 member agencies
Renewable Energy Data
Technology Solar PV Year Installed 2007
Rated Power Output, kW 130 Annual Energy Generated, kWh 240,000
Capital Cost, USD $1.4 Million O&M Cost, USD Not
Available
Simple Rate of Return 30+ years Average Utility Energy Cost, $/kWh
0.06
Financing Government Energy Savings, USD $14,400
©2012 Water Research Foundation. ALL RIGHTS RESERVED.
44
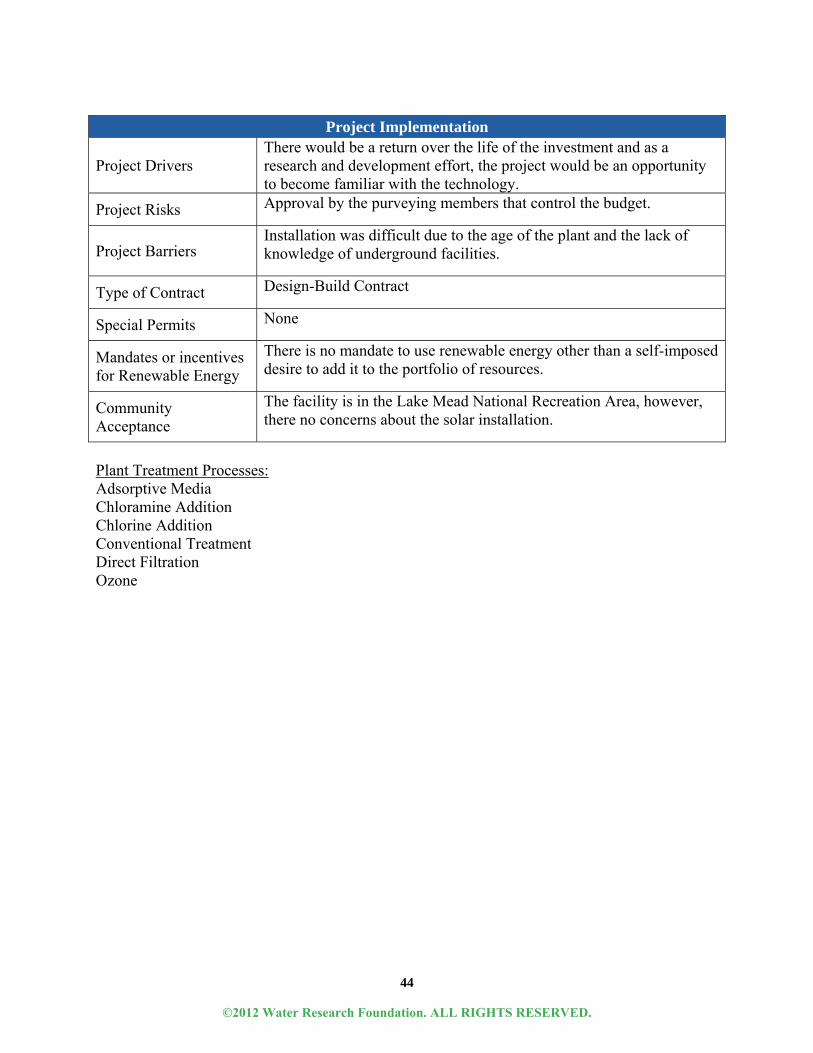
Plant Treatment Processes: Adsorptive Media Chloramine Addition Chlorine Addition Conventional Treatment Direct Filtration Ozone
Project Implementation
Project Drivers There would be a return over the life of the investment and as a research and development effort, the project would be an opportunity to become familiar with the technology.
Project Risks Approval by the purveying members that control the budget.
Project Barriers Installation was difficult due to the age of the plant and the lack of knowledge of underground facilities.
Type of Contract Design-Build Contract
Special Permits None
Mandates or incentives for Renewable Energy
There is no mandate to use renewable energy other than a self-imposed desire to add it to the portfolio of resources.
Community Acceptance
The facility is in the Lake Mead National Recreation Area, however, there no concerns about the solar installation.
©2012 Water Research Foundation. ALL RIGHTS RESERVED.

45
Case Study 11: River Mountains Water Treatment Facility Southern Nevada Water Authority, Henderson, NV www.snwa.com/env/sustain_solar.html About the project: Southern Nevada Water Authority (SNWA) installed concentrated solar power at this 300 MGD treatment plant. The project was conceived as a demonstration project with a local university. SNWA wrote the RFP, completed the preliminary design, and contracted the final design and permits to a consulting engineering firm. The project was paid for by SNWA. This project offsets power consumption from conventional sources. To address community concerns SNWA made a model for local home owner associations and community members to preview the finished project. Maintenance of the concentrated solar requires power washing of the panels.
Treatment Plant Information
Raw Water Source Lake Mead National Recreation Area
Population Served 1,200,000
Design and Average Flow of Treatment Plant, MGD 300 150
Annual Electricity Consumption, 2011, kWh 166,752,630 Annual Energy Consumption, 2011 (non-electric sources)
None
Utility Governance Structure Board of Directors representing 7 member agencies
Renewable Energy Data
Technology Solar PV Year Installed 2007/8
Rated Power Output, kW 360 Annual Energy Generated, kWh 864,000
Capital Cost, USD $2.3 Million O&M Cost, USD $15,000/yr
Simple Rate of Return 30+ years Average Utility Energy Cost, $/kWh
0.06
Financing Government Energy Savings, USD ~$5,000
©2012 Water Research Foundation. ALL RIGHTS RESERVED.

46
Plant Treatment Processes: Adsorptive Media Chloramine Addition Chlorine Addition Conventional Treatment Direct Filtration Ozone
Project Implementation
Project Drivers This project was executed since as a research and development effort, and to become acquainted with the technology.
Project Risks Approval by the purveying members that control the budget.
Project Barriers None
Type of Contract Design-Build
Special Permits None
Mandates or incentives for Renewable Energy
There is no mandate to use renewable energy other than a self-imposed desire to add it to the portfolio of resources.
Community Acceptance
The facility is in the Lake Mead National Recreation Area, however, there no concerns about the solar installation during a town meeting.
©2012 Water Research Foundation. ALL RIGHTS RESERVED.
47
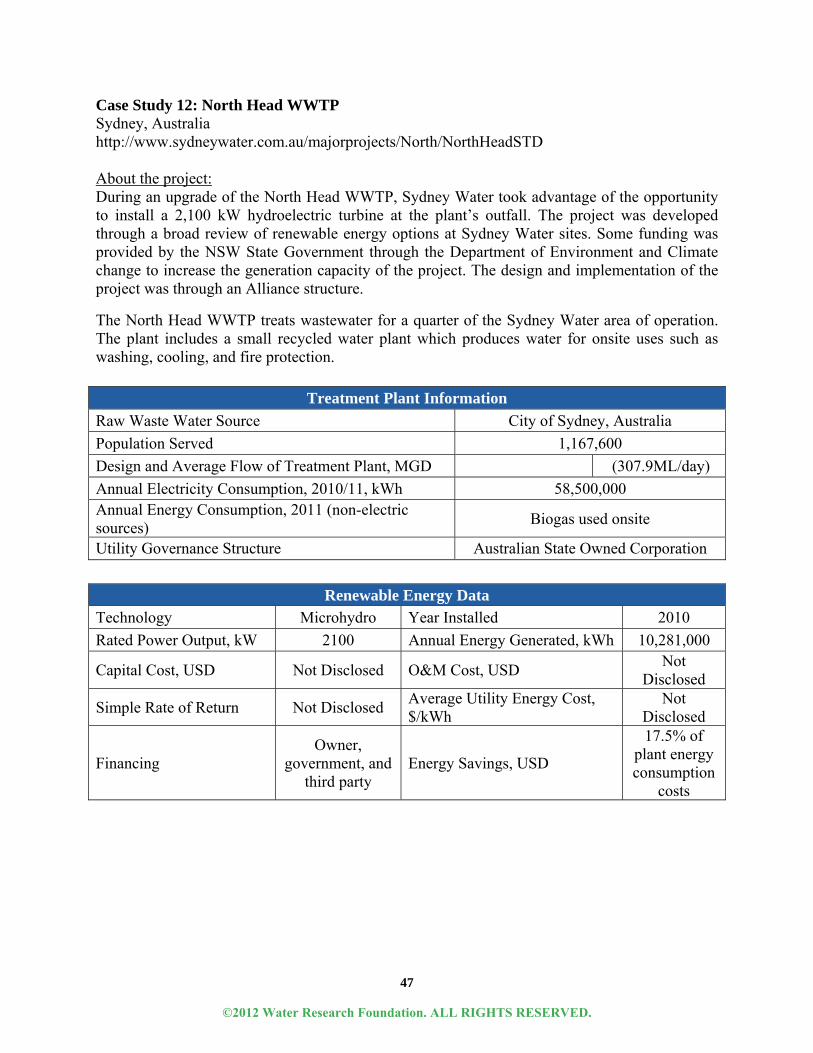
Case Study 12: North Head WWTP Sydney, Australia http://www.sydneywater.com.au/majorprojects/North/NorthHeadSTD About the project: During an upgrade of the North Head WWTP, Sydney Water took advantage of the opportunity to install a 2,100 kW hydroelectric turbine at the plant’s outfall. The project was developed through a broad review of renewable energy options at Sydney Water sites. Some funding was provided by the NSW State Government through the Department of Environment and Climate change to increase the generation capacity of the project. The design and implementation of the project was through an Alliance structure.
The North Head WWTP treats wastewater for a quarter of the Sydney Water area of operation. The plant includes a small recycled water plant which produces water for onsite uses such as washing, cooling, and fire protection.
Treatment Plant Information
Raw Waste Water Source City of Sydney, Australia
Population Served 1,167,600
Design and Average Flow of Treatment Plant, MGD (307.9ML/day)
Annual Electricity Consumption, 2010/11, kWh 58,500,000 Annual Energy Consumption, 2011 (non-electric sources)
Biogas used onsite
Utility Governance Structure Australian State Owned Corporation
Renewable Energy Data
Technology Microhydro Year Installed 2010
Rated Power Output, kW 2100 Annual Energy Generated, kWh 10,281,000
Capital Cost, USD Not Disclosed O&M Cost, USD Not
Disclosed
Simple Rate of Return Not Disclosed Average Utility Energy Cost, $/kWh
Not Disclosed
Financing Owner,
government, and third party
Energy Savings, USD
17.5% of plant energy consumption
costs
©2012 Water Research Foundation. ALL RIGHTS RESERVED.
48
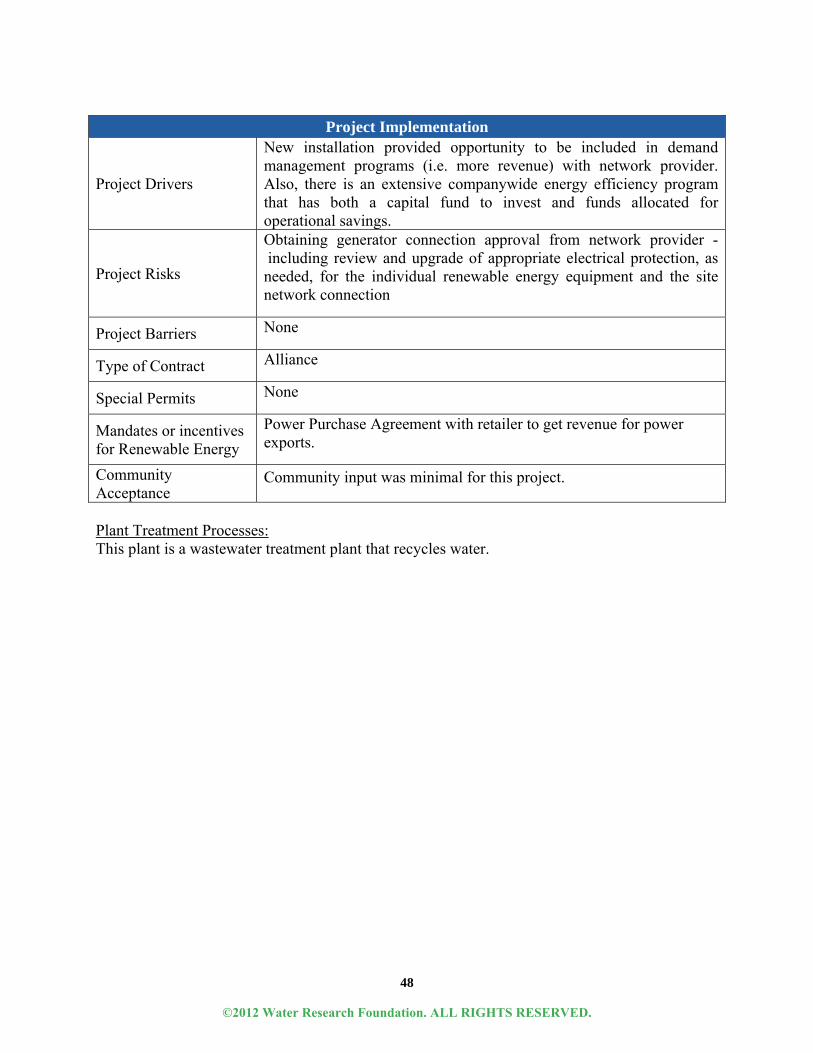
Plant Treatment Processes: This plant is a wastewater treatment plant that recycles water.
Project Implementation
Project Drivers
New installation provided opportunity to be included in demand management programs (i.e. more revenue) with network provider. Also, there is an extensive companywide energy efficiency program that has both a capital fund to invest and funds allocated for operational savings.
Project Risks
Obtaining generator connection approval from network provider - including review and upgrade of appropriate electrical protection, as needed, for the individual renewable energy equipment and the site network connection
Project Barriers None
Type of Contract Alliance
Special Permits None
Mandates or incentives for Renewable Energy
Power Purchase Agreement with retailer to get revenue for power exports.
Community Acceptance
Community input was minimal for this project.
©2012 Water Research Foundation. ALL RIGHTS RESERVED.
Top Related