


Languages
Pages
Legal


By: Dr Rashmi Sood Consultant & Incharge Department of Transfusion Medicine & Immunohematology Saket City Hospital , New Delhi
Haemoglobin Quality Control By Maintaining
“LEVEY JENNINGS chart”

Pre -do natio n Haemo g lo bin scre e ning
Pre-donation Hemoglobin screening
Is an important and foremost tests done for blood donor selection.
For blood donation, the minimum acceptable hemoglobin (Hb) is 12.5 g/dl or
haematocrit (Hct) of 38% for both males and females.(1)
This level is set :
1.to ensure that donors have enough blood to give and also have enough iron available
in their bodies to make more blood after they donate.
2. for preventing blood collection from an anaemic donor.
(1)The Indian Drugs and Cosmetics Act, 1940 .

.
An appro priate Hb scre e ning me tho d
Should be available for blood collection
So as to accept as many suitable donors as possible and to prevent any inappropriate deferrals.
Method for Hb screening should
o Save time o Be Cost effective
o Be accurate and easily validated for Internal Quality control

Various methods of hemoglobin estimation in Blood
Banks
1.Semi-quantitative gravimetric copper sulfate (CuSO4) method
2.Cyanmethemoglobin spectrophotometric method
3. HemoCue Hb photometer azidemethemoglobin test system - a portable,
battery-operated photometric device for rapid determination of hemoglobin.
4. WHO hemoglobin color scale (HCS) , at places where laboratory based
hemoglobinometry methods are not available.
5. Automated hematology analyzers.

Various Hb analysers available in the market

Calibration: factory calibrated needs no further calibration.
(Against the ICSH-International Council for Standardization
in Haematology Reference Method.)
Quality control: Liquid controls ,Eurotrol Hemotrol
Daily Quality control and Periodic Verification of
the precision and accuracy of the system :
Done as per local guidelines
using manufacturer recommended stabilized control reagents
Using Hemocue in the Blood Bank
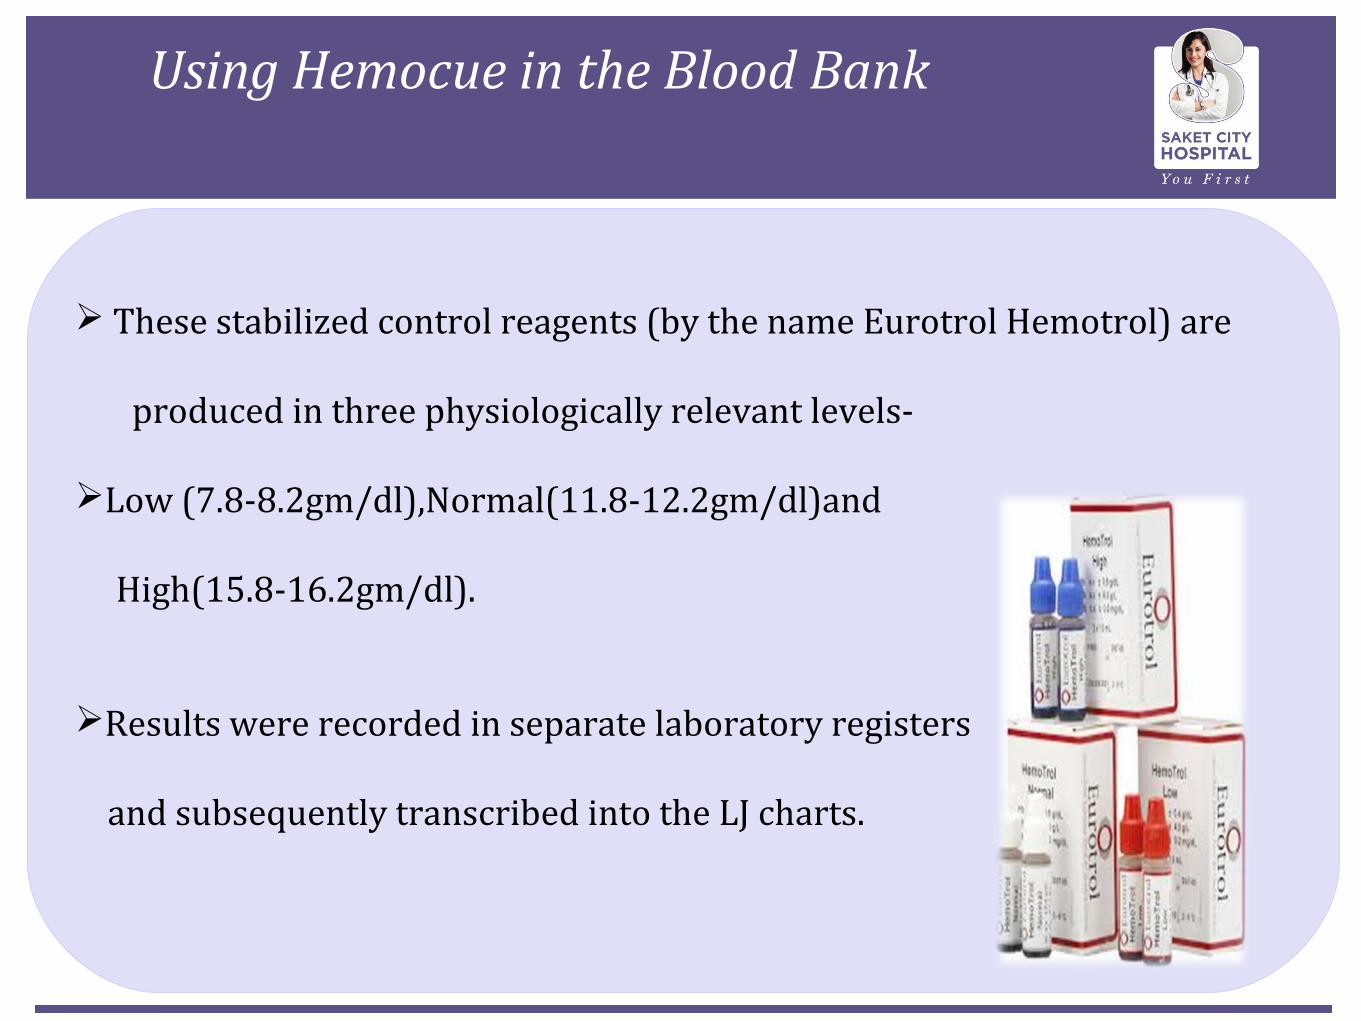
These stabilized control reagents (by the name Eurotrol Hemotrol) are
produced in three physiologically relevant levels-
Low (7.8-8.2gm/dl),Normal(11.8-12.2gm/dl)and
High(15.8-16.2gm/dl).
Results were recorded in separate laboratory registers
and subsequently transcribed into the LJ charts.
Using Hemocue in the Blood Bank

Quality Assurance is process oriented and focuses on
defect prevention.
It is a set of activities for ensuring quality in the processes
by which products are developed.
Quality control is product oriented and focuses on
defect identification.
It is a set of activities for ensuring quality in products ,the
activities focussing on identifying defects in the techniques of
producing products .
QUALITY ASSURANCE & QUALITY CONTROL

IQC is used on daily basis
IQC helps to decide whether to accept or reject results of patient
samples
IQC refers to the process of minimizing analytical(Testing)
errors related to operational techniques and activities.
INTERNAL QUALITY CONTROL & EXTERNAL QUALITY CONTROL

EQC – comparison of quality between the laboratories.
EQC confirms results of IQC.
EXTERNAL QUALITY CONTROL
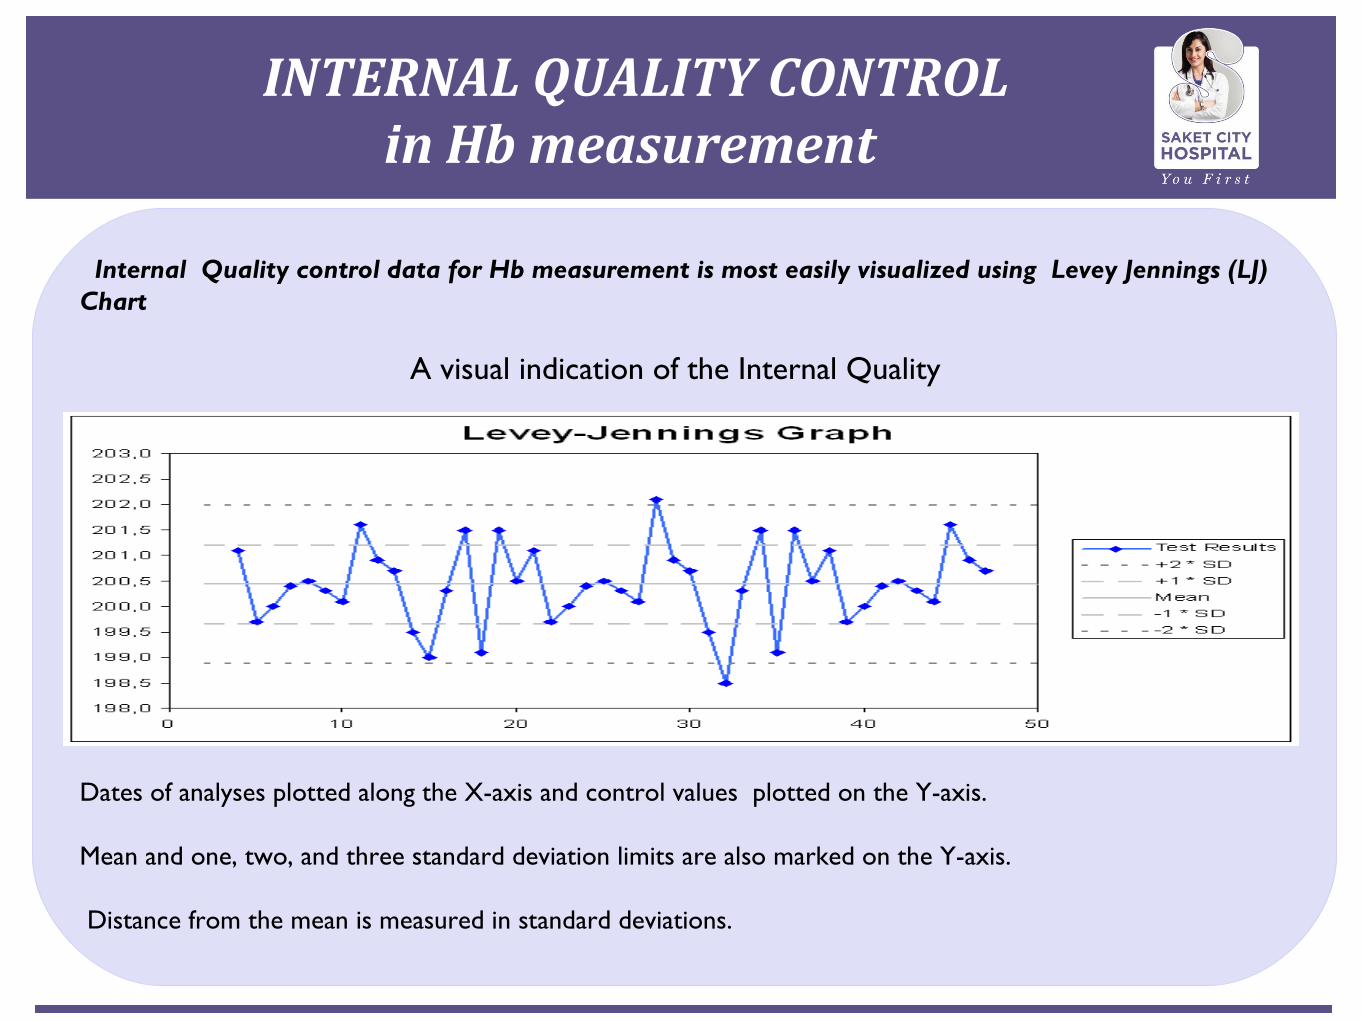
Internal Quality control data for Hb measurement is most easily visualized using Levey Jennings (LJ) Chart
A visual indication of the Internal Quality
Dates of analyses plotted along the X-axis and control values plotted on the Y-axis.
Mean and one, two, and three standard deviation limits are also marked on the Y-axis.
Distance from the mean is measured in standard deviations.
INTERNAL QUALITY CONTROL in Hb measurement

Named after S. Levey and E. R. Jennings who in 1950 suggested the use of Shewart’s individual control chart in the clinical laboratory .
LJ charts plot daily QC values .
Levey Jennings (LJ)Charts

Westgard rules are applied to
Interpret daily QC values on the LJ charts whether the results are in -control or not whether they can be released, or need to be rerun.
Indicate the type of laboratory errorthe pattern of plotted points is noted to detect random errors and shifts or trends of the performance in Hb measurement .
(Ref :Grant, E.L. and R.S. Leavenworth (1988). "Statistical Quality Control", Sixth Edition, McGraw-Hill Book Company.)
Westgard Rules for Evaluation of LJ charts for QC
Stable control material/s which mimics patients sample are analyzed (day to day) by plotting a mark daily on the control chart(Levey Jennings Chart).
Evaluation whether measurements is in control done using Westgard multi–rules.
The distance from the mean is measured in standard
deviations (SD).
Lines run across the graph at the mean, as well as one,
two or three standard deviations on either side of the
mean.
Application of LJ charts for QC

Standard deviation calculated from the following
equations:
Calculation of Control Limits

Errors

Formulation of Westgard rules is based on statistical
methods.
Westgard rules are used to detect both random and
systematic errors.
Can be programmed on to automated analyzers .
Careful application to prevent false rejections.
Westgard rules

The 12s rule is used as a warning rule and prompts a more
detailed inspection of the data using the other control rules.
If neither control observation exceeds a 2s limit, the analytical
run is in-control and patients’ data may be reported.
If either observation exceeds a 2s limit, the control data are
tested by applying the13s, 22s, R4s,41s, and 10x rules.
If none of these rules is violated, the run is in-control.
If any one of them is violated, the run is out-of-control.
Application of the Rules
12s- the control rule where one control observation exceeds
control limits set as x ± 2s.
The warning rule for a Shewhart chart and is interpreted
as a requirement for additional inspection of the control data.
13s - the control rule when one control observation exceeds
control limits set as x ± 3s.
Run is rejected.
Westgard rules -Control Rules (Decision Criteria)

22s - is the control rule when two consecutive
control observations on same control or two
observations within a run, one on each of two
different control materials, exceed the same
limit, which is either x + 2s or x - 2s.
the run is rejected
Westgard rules-Control Rules (Decision Criteria)

R4s control rule
when the range or difference between the two
control observations within the run exceeds 4s.
run is rejected
Westgard rules-Control Rules (Decision Criteria)

41s control rule
when four consecutive control observations exceed the
same limit, which is either x + 1s or x - 1s.
the run is rejected
Westgard rules-Control Rules (Decision Criteria)

10x control rule
the run is rejected when 10 consecutive observations fall on the
same side of the mean (x).
These consecutive observations can occur within one control
material or across control materials. This would require
inspection of 10 or five consecutive runs, respectively.
Westgard rules -Control Rules (Decision Criteria)

Type of errors:
(i) Random errors (affect precision) – Usually 13s and R 4s
errors
These errors can either be positive or negative.
Their direction and exact magnitude cannot be predicted.
Usually are due to error in Techniques.
Applying the control rules -Random and Systematic Errors
(ii) Systematic errors (affect accuracy) – Usually 22s, 41s and 10x errors
/or Inaccuracy
They are always in one direction.
They displace the mean of the distribution from its original value.
When the change in the mean is gradual, it is demonstrated as trend in
control values .
When the change is abrupt, it is demonstrated as shift in the control
values.
Cause all the test results to be either high or low.
Usually due to change in testing process.
Applying the control rules -Random and Systematic Errors

Random and Systematic Errors

The level of QC (Low, Normal, High) applied varies according to the
number of specimens analyzed per day.
The following protocol may be adopted according to the total number of
specimens analysed :
Less than 40 per day - apply at least one level (Low,Normal,High) QC
once a day.
Between 40-80 per day - apply two level QC at least once a day.
More than 80 per day - apply two level QC at least twice a day.
Level of QC applied in a laboratory

Material & Methods of the study
A prospective study at our centre.
Over a period of 1 year1 month.
Hemo –Controls (Eurotrol): Low Control (7.8 to 8.2gm/dl ) High
Control ( 15.8 to 16.2 gm/dl ) Normal Control ( 11.8 to 12.2
gm/dl) were run in the Hemocue machine daily and Levey –
Jennings chart were maintained .

Study was carried out from July 2013 to Aug 2014
Deviation observed in low QC – control value no 07 in Jan14
Deviation observed in normal QC- control value13 in Jan14
Deviation observed in high QC- control value 14 in Feb14
1 Standard Deviation
Deviation sorted out after re testing.
They disappeared on retesting.
Change of the staff doing the test was the reason found for these
random errors .
Results

For responding to out-of control situations , guidelines should be established and
properly implemented.
Withhold patients’ results till the out of control situation is sorted out
Identify the cause of the problem
Avoid false rejections.
Start with checking the simplest and most frequent faults and continue further
depending on the method and the equipment involved.
It is essential to determine the type of error (random or systematic) in order to
specifically correct the problem.
(i) Random errors (affect precision) – Usually 13s and R 4s errors
(ii) Systematic errors (affect accuracy) – Usually 22s, 41s and 10x errors
Corrective Actions

Control material viscid as was in the refrigerator
Insufficient mixing of the samples
Presence of air bubbles in the cuvette
Excess blood on the back of the cuvettes, due to over filling
Reading the results too soon or too late (beyond 10 minutes)
Filling from the optical eye rather than the filling end
Common causes of erroneous results

Bring controls to room temp before testing
Check control storage conditions
Check control expiry date/contamination
Mix samples adequately
Adequate training on the technique of proper filling the cuvettes to
avoid air bubbles and over filling
Remedy
Reading result after few seconds of filling the cuvette
Repeat QC from the same vial or fresh vial taken out
from the refrigerator or from a fresh QC lot
Relate causes to any recent changes
Remedy

Quality control data is most easily visualized using a
Levey Jennings chart.
We suggest, all blood banks to maintain L-J chart as a
Quality Indicator to validate the working of the Hemocue.
Conclusions

Ref:
1. Hemocue Hb 201+ Operating Manual, Page 20-21
2.Grant, E.L. and R.S. Leavenworth (1988). "Statistical
Quality Control", Sixth Edition, McGraw-Hill Book Company
3.GUIDELINES FOR GOOD CLINICAL LABORATORY PRACTICES (GCLP)
Indian Council of Medical Research New Delhi 2008
4.Westgard, J.O, P.L. Barry, and M.R. Hunt (1981). "A Multi-rule
Shewhart Chart for Quality Control in Clinical Chemistry, “Clinical
Chemistry, vol. 27, pp. 493-501
References

Top Related