


Languages
Pages
Legal


SAMPLE
FOREWORD GuideStar’s mission is to revolutionize philanthropy and nonprofit practice by providing information that advances transparency, enables users to make better decisions, and encourages charitable giving. At its Web site, www.guidestar.org, users access information on more than 1,600,000 United States nonprofit organizations. The 2014 GuideStar Nonprofit Compensation Report reviews key employee compensation practices at approximately 92,000 charitable nonprofit organizations. It relies exclusively upon data derived from the GuideStar database of digitized IRS Form 990 information. © 2014 by GuideStar USA All rights reserved. No part of this report may be reproduced in any form without written permission of GuideStar USA GuideStar USA 4801 Courthouse St., Suite 220 Williamsburg, VA 23188 (757) 229-4631 www.guidestar.org

Welcome to the 2014 GuideStar Nonprofit Compensation Report. This year’s report, the 14th in our annual series, is derived from information on more than 129,000 individual positions at more than 91,000 tax-exempt organizations. The executive summary presents findings based not only on this report but also on data for previous years. The GuideStar Nonprofit Compensation Report remains the only large-scale analysis of its kind based entirely on data reported to the IRS. It also continues to be the most comprehensive nonprofit compensation study available. Accurate, complete, and authoritative information on the nonprofit sector is more important than ever. The Pension Protection Act of 2006 increased the penalties for excessive benefit transactions, including overpayment of nonprofit executives. Meanwhile, Congress, donors, and the media continue to scrutinize nonprofit salaries. Nonprofits must demonstrate to oversight agencies, grantmakers of all types (government, corporations, and private foundations), and individual donors that the salaries and benefits they offer are justified. They must document their compensation practices and be prepared to help their supporters understand why these practices are appropriate. The GuideStar Nonprofit Compensation Report is a valuable tool for achieving these goals. This volume was conceived, designed, and compiled by Chuck McLean, GuideStar’s vice president for research. We welcome your comments and suggestions. Please e-mail your thoughts to [email protected]. Thank you for acquiring the 2014 GuideStar Nonprofit Compensation Report. We look forward to hearing your comments as we plan for the 2015 edition. Chuck McLean Vice President, Research August 26, 2014

Count Average 10th Percentile 25th Percentile Median 75th Percentile 90th Percentile
Compensation by Budget Size
$250 thousand or less
8,494 $48,647 $23,172 $32,296 $44,806 $60,000 $77,881CEO/Executive Director
335 $35,116 $18,339 $24,497 $31,526 $41,995 $56,788Top Administrative Position
80 $63,202 $28,444 $39,401 $63,227 $87,705 $95,585Top Business Position
18 $52,728 $33,301 $48,430 $65,348Top Development Position
23 $50,161 $19,480 $24,491 $41,800 $71,890 $98,185Top Education Position
15 $32,823 $23,085 $33,305 $39,679Top Facilities Position
358 $38,083 $18,080 $24,000 $33,485 $46,515 $61,694Top Finance Position
5 $73,256 $78,500Top Legal Position
7 $53,133 $37,861Top Marketing Position
92 $44,383 $21,344 $30,186 $37,350 $50,567 $79,555Top Operations Position
158 $39,178 $22,893 $27,937 $37,625 $45,586 $58,593Top Program Position
Between $250 thousand and $500 thousand
13,669 $65,485 $32,717 $44,862 $59,763 $78,483 $104,574CEO/Executive Director
541 $43,967 $22,732 $28,947 $40,000 $52,977 $67,589Top Administrative Position
221 $84,244 $35,551 $55,597 $78,010 $107,511 $138,635Top Business Position
43 $53,798 $28,254 $34,715 $43,011 $56,231 $85,754Top Development Position
66 $66,859 $29,187 $40,574 $62,359 $87,099 $113,161Top Education Position
24 $40,525 $27,405 $29,595 $35,831 $48,725 $54,463Top Facilities Position
733 $50,858 $22,811 $30,492 $42,188 $62,029 $91,466Top Finance Position
7 $88,329 $90,483Top Legal Position
7 $37,795 $38,010Top Marketing Position
181 $52,537 $26,854 $33,106 $46,385 $65,000 $87,546Top Operations Position
176 $47,905 $27,241 $33,732 $44,538 $58,227 $72,390Top Program Position
Between $500 thousand and $1 million
14,902 $83,573 $41,154 $55,418 $74,089 $100,000 $137,665CEO/Executive Director
587 $61,509 $29,440 $38,915 $53,957 $74,589 $101,100Top Administrative Position
420 $101,186 $44,623 $66,935 $96,298 $130,625 $154,880Top Business Position
Page 1 of 5

Count Average 10th Percentile 25th Percentile Median 75th Percentile 90th Percentile
Compensation Data by Budget Size and Gender
Gender
$250 thousand or less
CEO/Executive Director
4,032 $46,295 $23,855 $32,346 $43,408 $56,220 $71,091F
2,790 $52,535 $22,622 $32,928 $48,000 $65,000 $87,297M
Top Administrative Position
164 $35,464 $20,153 $25,706 $31,810 $42,057 $55,737F
109 $35,067 $17,552 $22,111 $31,200 $42,000 $58,940M
Top Business Position
12 $44,151 $31,403 $34,347 $53,623F
57 $69,173 $30,179 $52,216 $68,478 $90,822 $98,642M
Top Development Position
9 $54,038 $53,942F
6 $51,613 $38,012M
Top Education Position
6 $36,873 $26,674F
11 $61,057 $30,725 $61,915 $96,584M
Top Facilities Position
11 $31,315 $20,137 $27,582 $37,037M
Top Finance Position
180 $34,797 $18,296 $23,488 $31,665 $41,951 $57,224F
107 $44,393 $18,213 $25,945 $39,955 $57,124 $67,563M
Top Marketing Position
5 $40,756 $28,090F
Top Operations Position
46 $44,913 $21,140 $30,666 $36,750 $48,752 $80,000F
25 $45,392 $21,423 $27,710 $40,625 $53,698 $79,213M
Page 1 of 15

Count Average 10th Percentile 25th Percentile Median 75th Percentile 90th Percentile
Compensation by NTEE Major Group and Budget Size
501(c) (4) - Civic Leagues, Social Welfare Organizations, and Local Associations of Employees
$500 thousand or less
416 $73,587 $29,000 $42,117 $64,417 $95,399 $131,175CEO/Executive Director
22 $42,739 $26,857 $35,160 $37,278 $49,963 $65,410Top Administrative Position
31 $41,619 $21,750 $26,421 $38,700 $55,153 $71,661Top Finance Position
7 $61,291 $57,305Top Operations Position
Between $500 thousand and $1 million
258 $104,820 $39,843 $61,239 $93,709 $132,683 $179,110CEO/Executive Director
17 $65,443 $44,084 $60,582 $79,568Top Administrative Position
18 $72,204 $40,736 $54,527 $74,302Top Finance Position
Between $1 million and $5 million
358 $156,262 $60,021 $87,603 $136,675 $196,289 $265,517CEO/Executive Director
45 $98,742 $50,289 $60,030 $84,985 $116,810 $150,841Top Administrative Position
5 $93,545 $112,772Top Facilities Position
48 $111,085 $36,746 $55,355 $103,303 $136,567 $187,304Top Finance Position
25 $144,815 $52,569 $67,874 $122,899 $218,359 $272,710Top Operations Position
6 $117,548 $126,669Top Program Position
Greater than $5 million
217 $448,077 $121,759 $168,428 $258,053 $488,232 $890,673CEO/Executive Director
27 $170,594 $112,421 $119,719 $146,338 $173,547 $212,218Top Administrative Position
38 $290,035 $117,824 $142,293 $195,923 $310,564 $413,567Top Business Position
8 $140,862 $129,674Top Development Position
125 $238,510 $80,930 $129,131 $185,796 $269,181 $406,811Top Finance Position
19 $215,848 $153,811 $194,888 $257,699Top Human Resources Position
37 $278,367 $130,036 $165,128 $219,003 $302,228 $535,057Top Legal Position
24 $330,476 $136,001 $168,802 $188,720 $227,370 $513,472Top Marketing Position
55 $298,518 $138,670 $172,910 $240,829 $370,497 $560,883Top Operations Position
9 $191,178 $148,518Top Program Position
Page 1 of 42

Count Average 10th Percentile 25th Percentile Median 75th Percentile 90th Percentile
Compensation by NTEE Major Group, Budget Size and Gender
Gender
501(c) (4) - Civic Leagues, Social Welfare Organizations, and Local Associations of Employees$500 thousand or less
CEO/Executive Director
145 $63,822 $27,504 $37,831 $55,200 $83,546 $109,210F
197 $80,184 $30,010 $46,350 $71,411 $108,037 $140,334M
Top Administrative Position
8 $37,049 $37,278F
7 $45,198 $36,287M
Top Finance Position
13 $36,112 $25,991 $30,238 $38,700F
12 $49,681 $41,357 $49,050 $59,557M
Top Operations Position
5 $64,664 $57,305M
Between $500 thousand and $1 million
CEO/Executive Director
79 $104,408 $52,061 $66,279 $92,252 $118,642 $187,826F
144 $109,072 $39,454 $61,197 $104,906 $139,918 $180,283M
Top Administrative Position
7 $56,533 $57,382F
7 $60,113 $65,813M
Top Finance Position
10 $76,977 $31,638 $64,266 $74,302F
5 $71,439 $48,625M
Between $1 million and $5 million
CEO/Executive Director
81 $148,699 $62,096 $86,000 $116,753 $173,341 $241,853F
229 $154,345 $60,000 $90,464 $140,640 $193,500 $257,209M
Page 1 of 84

Count Average 10th Percentile 25th Percentile Median 75th Percentile 90th Percentile
Compensation by NTEE Centile Group and Budget Size
Animal-Related: Alliances & Advocacy$250 thousand or less
6 $50,226 $46,275CEO/Executive Director
Between $250 thousand and $500 thousand
8 $46,009 $47,467CEO/Executive Director
Between $500 thousand and $1 million
5 $85,779 $70,504CEO/Executive Director
Between $1 million and $2.5 million
11 $98,851 $69,033 $87,310 $121,719CEO/Executive Director
Between $5 million and $10 million
5 $140,675 $128,445CEO/Executive Director
Animal-Related: Animal Protection & Welfare$250 thousand or less
94 $36,905 $19,766 $25,905 $32,393 $44,043 $54,115CEO/Executive Director
5 $22,369 $19,616Top Finance Position
Page 1 of 471

Count Average 10th Percentile 25th Percentile Median 75th Percentile 90th Percentile
Compensation by State and Budget Size
Alabama$250 thousand or less
143 $45,216 $23,598 $31,745 $40,540 $53,898 $69,849CEO/Executive Director
Between $250 thousand and $500 thousand
166 $66,398 $35,244 $42,083 $58,029 $83,227 $116,911CEO/Executive Director
8 $45,343 $47,398Top Administrative Position
13 $52,670 $31,500 $37,999 $68,135Top Finance Position
Between $500 thousand and $1 million
149 $84,438 $44,269 $57,751 $75,759 $96,239 $121,002CEO/Executive Director
7 $51,258 $53,640Top Administrative Position
13 $89,879 $65,499 $88,888 $100,179Top Business Position
19 $58,012 $29,977 $64,547 $73,044Top Finance Position
Between $1 million and $2.5 million
143 $96,629 $49,685 $62,991 $81,151 $113,358 $160,978CEO/Executive Director
12 $68,627 $54,644 $76,311 $79,204Top Administrative Position
21 $62,901 $25,267 $34,934 $48,985 $69,279 $119,741Top Finance Position
8 $59,532 $61,693Top Operations Position
Between $2.5 million and $5 million
76 $126,665 $60,115 $80,320 $106,853 $144,480 $212,857CEO/Executive Director
6 $94,053 $87,096Top Administrative Position
23 $77,658 $38,051 $54,988 $66,819 $83,085 $153,970Top Finance Position
9 $84,561 $78,965Top Operations Position
Between $5 million and $10 million
67 $154,636 $87,697 $104,554 $129,846 $184,637 $261,387CEO/Executive Director
8 $147,516 $129,315Top Administrative Position
23 $100,503 $57,692 $65,917 $84,490 $106,250 $155,734Top Finance Position
13 $125,431 $90,300 $117,902 $136,436Top Operations Position
Page 1 of 111

Count Average 10th Percentile 25th Percentile Median 75th Percentile 90th Percentile
Compensation by State, Budget Size and Gender
Gender
Alabama$500 thousand or less
CEO/Executive Director
137 $50,288 $26,464 $33,136 $45,000 $60,629 $82,968F
116 $68,055 $35,730 $43,200 $58,315 $85,631 $122,527M
Top Administrative Position
5 $39,198 $39,600F
Top Finance Position
9 $61,129 $57,532M
Between $500 thousand and $1 million
CEO/Executive Director
57 $71,000 $34,274 $51,946 $66,730 $84,425 $96,429F
63 $95,852 $50,872 $59,782 $85,000 $112,596 $140,779M
Top Business Position
10 $95,446 $72,048 $93,585 $112,832M
Top Finance Position
6 $38,010 $35,155F
9 $71,853 $72,431M
Between $1 million and $5 million
CEO/Executive Director
61 $88,334 $55,000 $63,531 $78,544 $106,000 $138,819F
112 $115,888 $51,274 $70,461 $96,244 $141,876 $184,220M
Top Administrative Position
5 $65,361 $71,955F
9 $74,943 $79,052M
Page 1 of 125
Count Average 10th Percentile 25th Percentile Median 75th Percentile 90th Percentile
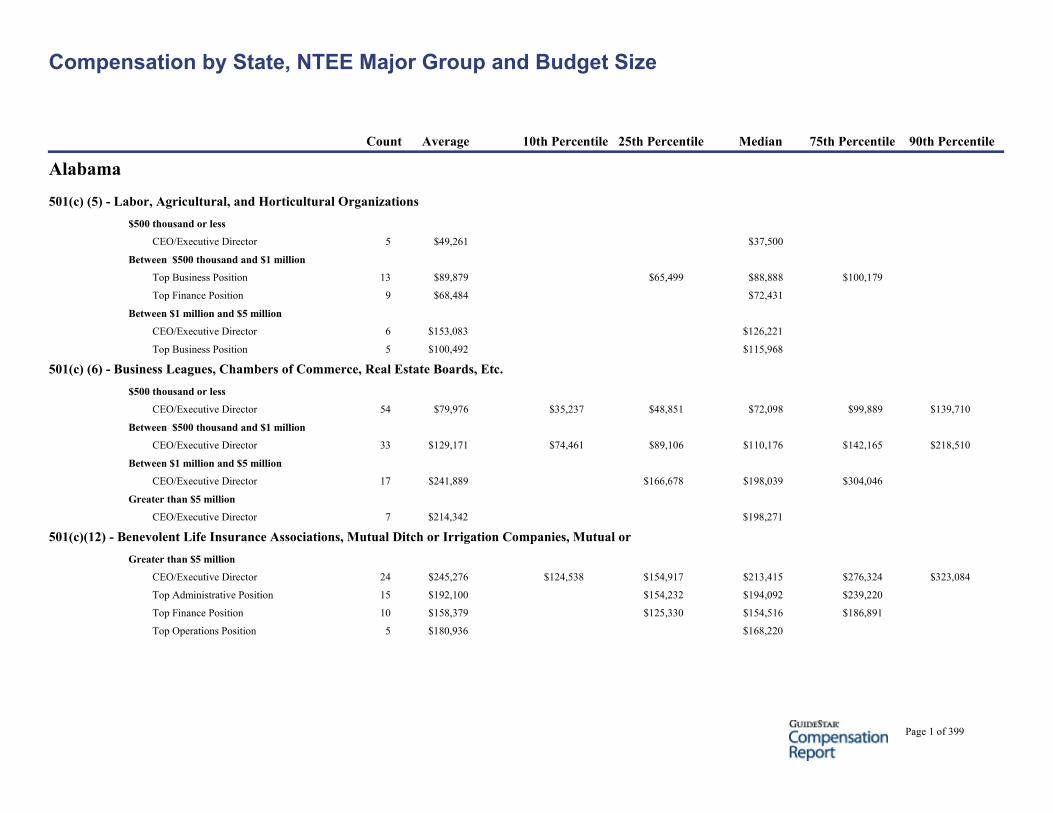
Compensation by State, NTEE Major Group and Budget Size
Alabama
501(c) (5) - Labor, Agricultural, and Horticultural Organizations$500 thousand or less
CEO/Executive Director 5 $49,261 $37,500
Between $500 thousand and $1 million
Top Business Position 13 $89,879 $65,499 $88,888 $100,179
Top Finance Position 9 $68,484 $72,431
Between $1 million and $5 million
CEO/Executive Director 6 $153,083 $126,221
Top Business Position 5 $100,492 $115,968
501(c) (6) - Business Leagues, Chambers of Commerce, Real Estate Boards, Etc.$500 thousand or less
CEO/Executive Director 54 $79,976 $35,237 $48,851 $72,098 $99,889 $139,710
Between $500 thousand and $1 million
CEO/Executive Director 33 $129,171 $74,461 $89,106 $110,176 $142,165 $218,510
Between $1 million and $5 million
CEO/Executive Director 17 $241,889 $166,678 $198,039 $304,046
Greater than $5 million
CEO/Executive Director 7 $214,342 $198,271
501(c)(12) - Benevolent Life Insurance Associations, Mutual Ditch or Irrigation Companies, Mutual orGreater than $5 million
CEO/Executive Director 24 $245,276 $124,538 $154,917 $213,415 $276,324 $323,084
Top Administrative Position 15 $192,100 $154,232 $194,092 $239,220
Top Finance Position 10 $158,379 $125,330 $154,516 $186,891
Top Operations Position 5 $180,936 $168,220
Page 1 of 399

Count Average 10th Percentile 25th Percentile Median 75th Percentile 90th Percentile
Compensation by State and NTEE Decile Group
AlabamaArts, Culture and Humanities: Arts & Culture
CEO/Executive Director 8 $53,399 $51,674
Arts, Culture and Humanities: Historical OrganizationsCEO/Executive Director 5 $46,420 $38,428
Arts, Culture and Humanities: MuseumsCEO/Executive Director 7 $93,225 $90,000
Arts, Culture and Humanities: Performing ArtsCEO/Executive Director 10 $83,353 $56,365 $69,638 $87,376
Community Improvement, Capacity Building: Business & IndustryCEO/Executive Director 65 $115,250 $44,315 $66,415 $90,000 $136,496 $210,811
Community Improvement, Capacity Building: Community & Neighborhood DevelopmentCEO/Executive Director 9 $81,489 $80,427
Community Improvement, Capacity Building: Economic DevelopmentCEO/Executive Director 11 $96,865 $72,991 $92,143 $123,233
Crime, Legal-Related: Legal ServicesCEO/Executive Director 5 $162,866 $113,495
Crime, Legal-Related: Protection Against AbuseCEO/Executive Director 14 $57,192 $46,045 $51,094 $61,375
Educational Institutions and Related Activities: Education N.E.C.CEO/Executive Director 7 $104,880 $112,118
Educational Institutions and Related Activities: Educational ServicesCEO/Executive Director 9 $55,354 $36,000
Page 1 of 336

Count Average 10th Percentile 25th Percentile Median 75th Percentile 90th Percentile
Compensation by MSA, NTEE Major Group and Budget Size
Abilene, TX
Arts, Culture and Humanities$500 thousand or less
CEO/Executive Director 5 $46,328 $38,030
Human Services – Multipurpose and OtherBetween $1 million and $5 million
CEO/Executive Director 5 $88,949 $97,415
Akron, OH
Educational Institutions and Related ActivitiesBetween $1 million and $5 million
CEO/Executive Director 5 $86,330 $77,336
Greater than $5 million
CEO/Executive Director 6 $240,618 $256,605
Top Finance Position 5 $123,834 $104,731
Employment, Job-RelatedBetween $1 million and $5 million
CEO/Executive Director 5 $95,580 $88,904
Human Services – Multipurpose and Other$500 thousand or less
CEO/Executive Director 10 $40,196 $25,945 $38,319 $53,478
Between $500 thousand and $1 million
CEO/Executive Director 7 $62,141 $58,905
Between $1 million and $5 million
CEO/Executive Director 7 $109,226 $117,437
Page 1 of 435
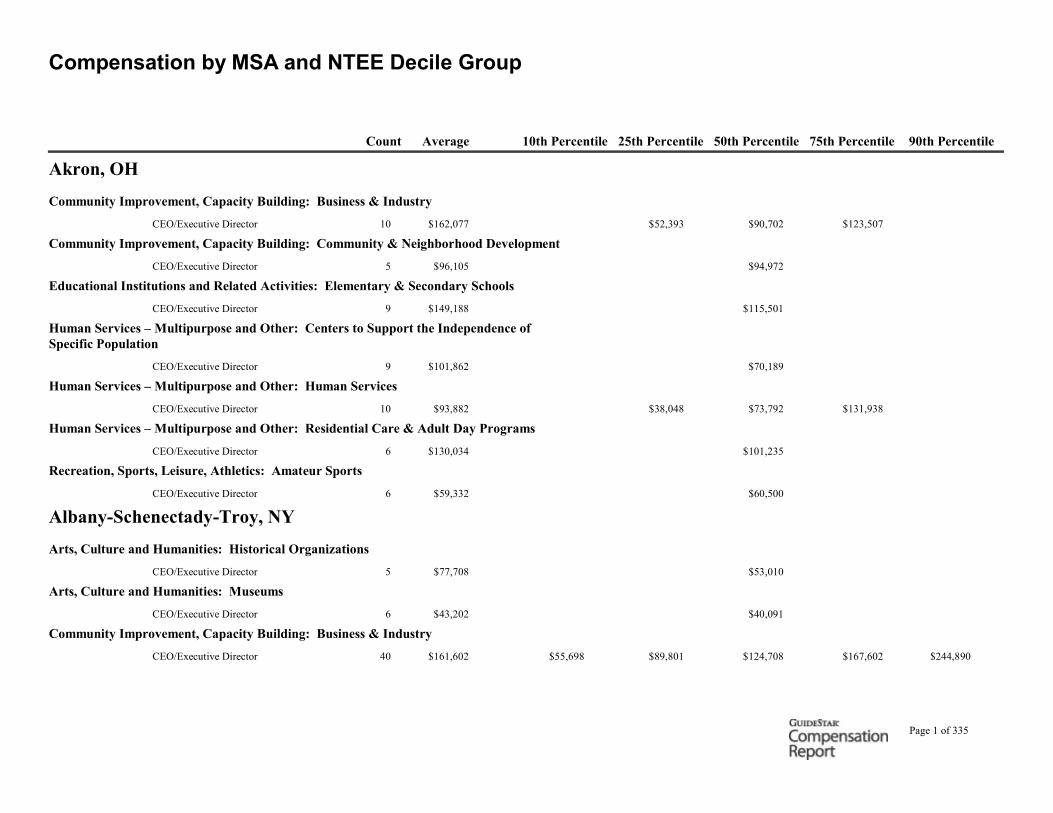
Count Average 10th Percentile 25th Percentile 50th Percentile 75th Percentile 90th Percentile
Compensation by MSA and NTEE Decile Group
Akron, OH
Community Improvement, Capacity Building: Business & Industry
CEO/Executive Director 10 $162,077 $52,393 $90,702 $123,507
Community Improvement, Capacity Building: Community & Neighborhood Development
CEO/Executive Director 5 $96,105 $94,972
Educational Institutions and Related Activities: Elementary & Secondary Schools
CEO/Executive Director 9 $149,188 $115,501
Human Services – Multipurpose and Other: Centers to Support the Independence of Specific Population
CEO/Executive Director 9 $101,862 $70,189
Human Services – Multipurpose and Other: Human Services
CEO/Executive Director 10 $93,882 $38,048 $73,792 $131,938
Human Services – Multipurpose and Other: Residential Care & Adult Day Programs
CEO/Executive Director 6 $130,034 $101,235
Recreation, Sports, Leisure, Athletics: Amateur Sports
CEO/Executive Director 6 $59,332 $60,500
Albany-Schenectady-Troy, NY
Arts, Culture and Humanities: Historical Organizations
CEO/Executive Director 5 $77,708 $53,010
Arts, Culture and Humanities: Museums
CEO/Executive Director 6 $43,202 $40,091
Community Improvement, Capacity Building: Business & Industry
CEO/Executive Director 40 $161,602 $55,698 $89,801 $124,708 $167,602 $244,890
Page 1 of 335

Count Average 10th Percentile 25th Percentile Median 75th Percentile 90th Percentile
Incumbent Compensation Increases by Budget Size
$250 thousand or less
4,203 1.7% -8.3% -0.8% 0.9% 5.4% 12.5%CEO/Executive Director
145 2.1% -7.1% -0.1% 1.2% 5.0% 12.0%Top Administrative Position
52 0.4% -11.9% -0.8% 1.7% 4.2% 7.0%Top Business Position
7 1.0% 2.4%Top Development Position
12 -1.2% -4.4% 0.2% 2.8%Top Education Position
171 0.3% -11.7% -1.2% 0.0% 3.8% 9.4%Top Finance Position
36 3.3% -1.1% 0.0% 2.7% 5.8% 10.4%Top Operations Position
61 -0.5% -16.9% -0.9% 0.0% 4.3% 8.7%Top Program Position
Between $250 thousand and $500 thousand
8,757 2.2% -6.9% -0.3% 1.6% 5.8% 12.2%CEO/Executive Director
302 2.3% -4.8% 0.0% 2.1% 5.5% 10.4%Top Administrative Position
135 2.2% -3.9% 0.0% 2.0% 4.7% 8.0%Top Business Position
22 0.6% -5.7% -2.1% 0.0% 3.5% 9.4%Top Development Position
38 0.8% -9.3% -0.1% 1.9% 3.4% 8.6%Top Education Position
12 5.2% -0.2% 1.4% 10.7%Top Facilities Position
412 1.4% -6.9% -1.3% 0.5% 4.9% 11.4%Top Finance Position
6 -1.7% 0.0%Top Legal Position
90 3.2% -4.0% 0.0% 1.8% 6.4% 14.7%Top Operations Position
101 2.7% -10.8% 0.0% 2.0% 7.2% 13.4%Top Program Position
Between $500 thousand and $1 million
10,224 2.4% -6.4% -0.5% 1.8% 6.0% 12.1%CEO/Executive Director
359 2.1% -7.8% 0.0% 2.3% 5.8% 10.9%Top Administrative Position
269 3.0% -2.2% 0.0% 2.2% 5.2% 10.7%Top Business Position
38 3.3% -8.1% -0.3% 2.0% 9.5% 16.1%Top Development Position
44 3.0% -3.7% -0.9% 2.4% 7.3% 11.7%Top Education Position
14 0.0% -1.6% 2.2% 3.3%Top Facilities Position
694 2.0% -6.2% -0.4% 1.8% 5.4% 10.5%Top Finance Position
Page 1 of 5
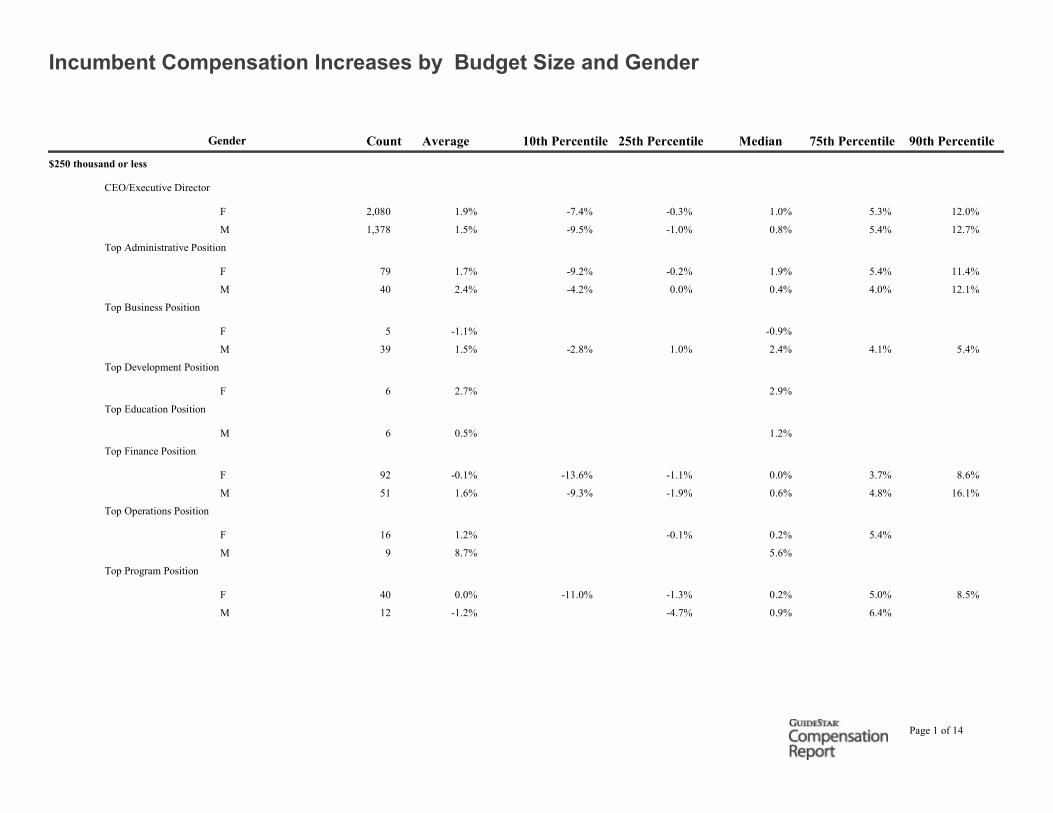
Count Average 10th Percentile 25th Percentile Median 75th Percentile 90th Percentile
Incumbent Compensation Increases by Budget Size and Gender
Gender
$250 thousand or less
CEO/Executive Director
2,080 1.9% -7.4% -0.3% 1.0% 5.3% 12.0%F
1,378 1.5% -9.5% -1.0% 0.8% 5.4% 12.7%M
Top Administrative Position
79 1.7% -9.2% -0.2% 1.9% 5.4% 11.4%F
40 2.4% -4.2% 0.0% 0.4% 4.0% 12.1%M
Top Business Position
5 -1.1% -0.9%F
39 1.5% -2.8% 1.0% 2.4% 4.1% 5.4%M
Top Development Position
6 2.7% 2.9%F
Top Education Position
6 0.5% 1.2%M
Top Finance Position
92 -0.1% -13.6% -1.1% 0.0% 3.7% 8.6%F
51 1.6% -9.3% -1.9% 0.6% 4.8% 16.1%M
Top Operations Position
16 1.2% -0.1% 0.2% 5.4%F
9 8.7% 5.6%M
Top Program Position
40 0.0% -11.0% -1.3% 0.2% 5.0% 8.5%F
12 -1.2% -4.7% 0.9% 6.4%M
Page 1 of 14

Count Average 10th Percentile 25th Percentile Median 75th Percentile 90th Percentile
Incumbent Compensation Increases by NTEE Major Group and Budget Size
501(c) (4) - Civic Leagues, Social Welfare Organizations, and Local Associations of Employees
$500 thousand or less
229 2.1% -5.7% 0.0% 1.3% 5.4% 12.5%CEO/Executive Director
11 7.2% 1.9% 7.7% 10.5%Top Administrative Position
20 0.6% -5.9% -0.9% 0.0% 3.2% 8.0%Top Finance Position
Between $500 thousand and $1 million
175 2.2% -5.4% -0.5% 1.3% 5.3% 12.6%CEO/Executive Director
9 1.5% 4.3%Top Administrative Position
11 2.7% 0.0% 0.3% 4.3%Top Finance Position
Between $1 million and $5 million
262 2.5% -6.0% -0.2% 2.3% 6.4% 11.6%CEO/Executive Director
25 3.1% -1.5% 0.1% 2.6% 7.5% 9.1%Top Administrative Position
32 3.2% -7.1% 0.0% 4.0% 7.2% 9.9%Top Finance Position
15 2.2% -0.1% 2.1% 4.9%Top Operations Position
Greater than $5 million
154 3.0% -8.3% -1.0% 3.4% 7.7% 11.8%CEO/Executive Director
15 2.8% -1.0% 2.5% 4.8%Top Administrative Position
17 4.8% 0.6% 4.8% 12.1%Top Business Position
86 5.4% -1.6% 1.5% 4.6% 8.2% 15.8%Top Finance Position
13 8.5% 4.0% 7.9% 14.2%Top Human Resources Position
27 3.1% -5.8% -1.1% 3.5% 7.4% 11.9%Top Legal Position
14 3.9% -4.8% 2.4% 13.0%Top Marketing Position
31 6.2% -2.9% 2.4% 5.8% 11.1% 16.8%Top Operations Position
6 -2.7% 1.4%Top Program Position
26 6.0% -5.1% 1.6% 7.0% 10.0% 18.9%Top Technology Position
Page 1 of 35

Count Average 10th Percentile 25th Percentile Median 75th Percentile 90th Percentile
Incumbent Compensation Increases by NTEE Major Group, Budget Size and Gender
Gender
501(c) (4) - Civic Leagues, Social Welfare Organizations, and Local Associations of Employees$500 thousand or less
CEO/Executive Director
78 0.7% -10.2% -0.6% 0.5% 3.0% 9.6%F
111 2.5% -4.3% 0.0% 1.6% 5.4% 13.1%M
Top Finance Position
8 0.8% 1.3%F
8 0.6% -0.1%M
Between $500 thousand and $1 million
CEO/Executive Director
61 3.1% -2.8% 0.0% 2.2% 5.4% 10.7%F
95 1.2% -6.7% -1.8% 0.5% 4.4% 10.9%M
Top Finance Position
6 2.3% 0.4%F
Between $1 million and $5 million
CEO/Executive Director
61 3.3% -2.2% 0.0% 2.7% 8.2% 9.9%F
164 2.4% -6.8% -0.7% 2.3% 6.3% 12.7%M
Top Administrative Position
8 4.9% 4.5%F
14 1.8% 0.1% 0.9% 7.3%M
Top Finance Position
14 0.6% -1.5% 2.0% 4.5%F
13 4.2% 1.6% 5.4% 8.3%M
Top Operations Position
7 0.2% -0.1%F
8 4.0% 4.2%M
Page 1 of 69

Count Average 10th Percentile 25th Percentile Median 75th Percentile 90th Percentile
Incumbent Compensation Increases by NTEE Centile Group and Budget Size
Animal-Related: Alliances & AdvocacyBetween $250 thousand and $500 thousand
5 6.3% 9.7%CEO/Executive Director
Between $1 million and $2.5 million
10 0.5% 0.0% 0.5% 2.2%CEO/Executive Director
Animal-Related: Animal Protection & Welfare$250 thousand or less
41 1.2% -6.4% 0.0% 0.0% 3.3% 12.0%CEO/Executive Director
Between $250 thousand and $500 thousand
90 2.3% -2.7% 0.0% 0.5% 5.4% 10.9%CEO/Executive Director
8 4.7% 2.6%Top Finance Position
Between $500 thousand and $1 million
100 3.3% -4.8% -0.2% 2.2% 7.2% 15.1%CEO/Executive Director
7 2.0% 1.9%Top Finance Position
Between $1 million and $2.5 million
100 2.8% -3.8% 0.0% 1.3% 6.5% 12.4%CEO/Executive Director
5 -2.0% -1.1%Top Finance Position
Between $2.5 million and $5 million
47 3.4% -3.2% -0.9% 1.7% 6.4% 14.3%CEO/Executive Director
5 2.7% 0.8%Top Finance Position
Between $5 million and $10 million
24 4.9% -4.1% 1.2% 5.9% 8.7% 13.5%CEO/Executive Director
11 4.3% 1.2% 5.6% 8.6%Top Finance Position
Between $10 million and $25 million
9 3.9% 3.0%CEO/Executive Director
6 9.3% 5.5%Top Finance Position
Page 1 of 205
Count Average 10th Percentile 25th Percentile Median 75th Percentile 90th Percentile
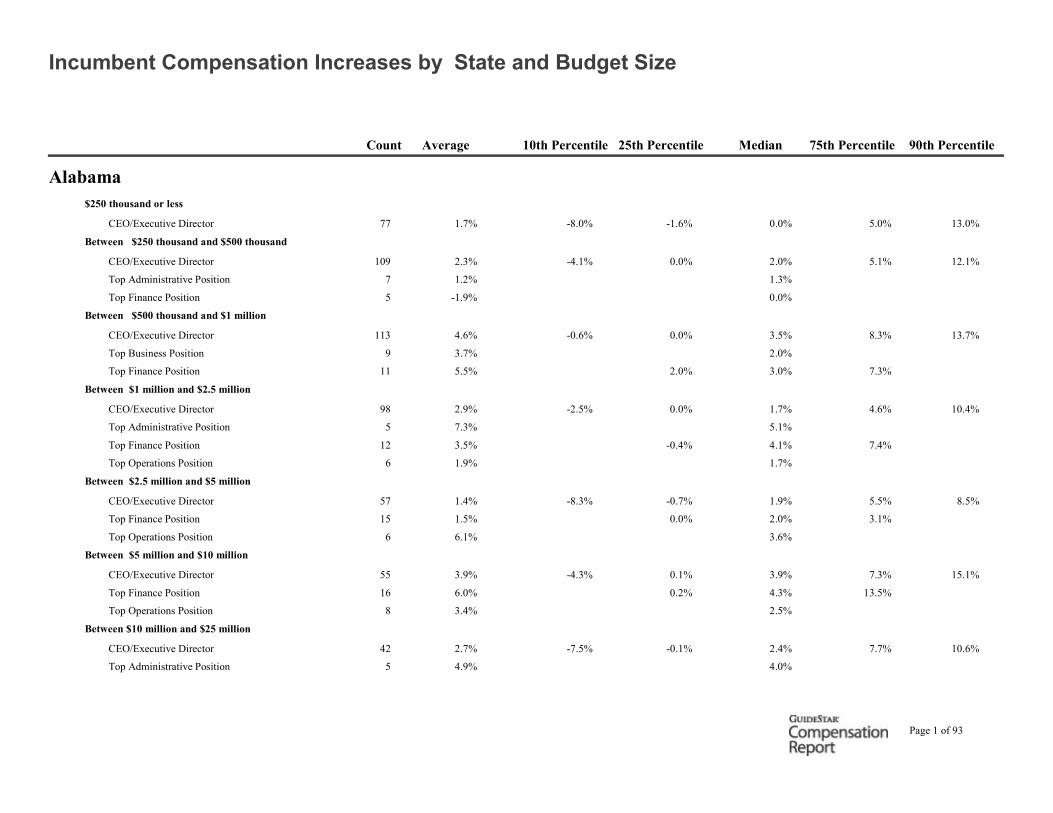
Incumbent Compensation Increases by State and Budget Size
Alabama$250 thousand or less
77 1.7% -8.0% -1.6% 0.0% 5.0% 13.0%CEO/Executive Director
Between $250 thousand and $500 thousand
109 2.3% -4.1% 0.0% 2.0% 5.1% 12.1%CEO/Executive Director
7 1.2% 1.3%Top Administrative Position
5 -1.9% 0.0%Top Finance Position
Between $500 thousand and $1 million
113 4.6% -0.6% 0.0% 3.5% 8.3% 13.7%CEO/Executive Director
9 3.7% 2.0%Top Business Position
11 5.5% 2.0% 3.0% 7.3%Top Finance Position
Between $1 million and $2.5 million
98 2.9% -2.5% 0.0% 1.7% 4.6% 10.4%CEO/Executive Director
5 7.3% 5.1%Top Administrative Position
12 3.5% -0.4% 4.1% 7.4%Top Finance Position
6 1.9% 1.7%Top Operations Position
Between $2.5 million and $5 million
57 1.4% -8.3% -0.7% 1.9% 5.5% 8.5%CEO/Executive Director
15 1.5% 0.0% 2.0% 3.1%Top Finance Position
6 6.1% 3.6%Top Operations Position
Between $5 million and $10 million
55 3.9% -4.3% 0.1% 3.9% 7.3% 15.1%CEO/Executive Director
16 6.0% 0.2% 4.3% 13.5%Top Finance Position
8 3.4% 2.5%Top Operations Position
Between $10 million and $25 million
42 2.7% -7.5% -0.1% 2.4% 7.7% 10.6%CEO/Executive Director
5 4.9% 4.0%Top Administrative Position
Page 1 of 93

Count Average 10th Percentile 25th Percentile Median 75th Percentile 90th Percentile
Incumbent Compensation Increases by State, Budget Size and Gender
Gender
Alabama$500 thousand or less
CEO/Executive Director
89 2.6% -3.9% 0.0% 0.9% 5.0% 15.2%F
67 1.1% -8.8% -1.7% 0.0% 4.7% 11.2%M
Top Administrative Position
5 2.2% 3.1%F
Between $500 thousand and $1 million
CEO/Executive Director
40 6.5% 0.0% 0.6% 4.3% 11.1% 14.4%F
49 3.7% -1.1% 0.0% 3.0% 6.0% 12.5%M
Top Business Position
7 4.4% 3.2%M
Top Finance Position
5 6.5% 3.6%M
Between $1 million and $5 million
CEO/Executive Director
45 3.3% -2.7% 0.0% 1.4% 4.0% 12.4%F
79 1.8% -5.1% -0.1% 1.9% 5.2% 8.4%M
Top Administrative Position
6 3.0% 3.6%M
Top Finance Position
14 3.3% 0.2% 2.5% 5.8%F
6 -1.2% 1.1%M
Top Operations Position
6 5.7% 2.2%F
Page 1 of 102

Count Average 10th Percentile 25th Percentile Median 75th Percentile 90th Percentile
Incumbent Compensation Increases by State, NTEE Major Group and Budget Size
Alabama
501(c) (5) - Labor, Agricultural, and Horticultural OrganizationsBetween $500 thousand and $1 million
Top Business Position 9 3.7% 2.0%
Top Finance Position 6 7.5% 3.3%
Between $1 million and $5 million
CEO/Executive Director 5 -0.1% 0.1%
501(c) (6) - Business Leagues, Chambers of Commerce, Real Estate Boards, Etc.$500 thousand or less
CEO/Executive Director 39 2.6% -1.4% -0.1% 0.8% 5.2% 8.4%
Between $500 thousand and $1 million
CEO/Executive Director 24 4.1% -0.2% 0.1% 2.7% 5.0% 13.6%
Between $1 million and $5 million
CEO/Executive Director 13 4.0% 1.2% 3.7% 10.0%
Greater than $5 million
CEO/Executive Director 6 -0.8% 0.7%
501(c)(12) - Benevolent Life Insurance Associations, Mutual Ditch or Irrigation Companies, Mutual or Cooperative Telephone Companies, Etc.Greater than $5 million
CEO/Executive Director 19 6.4% 1.2% 6.0% 10.2%
Top Administrative Position 11 3.4% -1.5% 1.5% 7.4%
Top Finance Position 8 5.2% 3.8%
501(c)(14) - State Chartered Credit Unions, Mutual Reserve Funds$500 thousand or less
CEO/Executive Director 5 8.9% 8.8%
Between $500 thousand and $1 million
CEO/Executive Director 9 10.6% 11.6%
Page 1 of 307

Count Average 10th Percentile 25th Percentile Median 75th Percentile 90th Percentile
Incumbent Compensation Increases by State and NTEE Decile Group
AlabamaArts, Culture and Humanities: Arts & Culture
CEO/Executive Director 5 1.3% 0.0%
Arts, Culture and Humanities: MuseumsCEO/Executive Director 5 1.2% 0.0%
Arts, Culture and Humanities: Performing ArtsCEO/Executive Director 6 5.0% 4.2%
Community Improvement, Capacity Building: Business & IndustryCEO/Executive Director 47 2.7% -3.2% -0.1% 2.2% 5.2% 10.1%
Community Improvement, Capacity Building: Community & Neighborhood DevelopmentCEO/Executive Director 6 5.2% 4.0%
Community Improvement, Capacity Building: Economic DevelopmentCEO/Executive Director 7 2.3% 1.5%
Crime, Legal-Related: Legal ServicesCEO/Executive Director 5 6.4% 3.7%
Crime, Legal-Related: Protection Against AbuseCEO/Executive Director 10 6.8% 0.0% 2.9% 11.8%
Educational Institutions and Related Activities: Education N.E.C.CEO/Executive Director 6 3.0% 0.3%
Educational Institutions and Related Activities: Educational ServicesCEO/Executive Director 6 4.3% 2.7%
Educational Institutions and Related Activities: Elementary & Secondary SchoolsCEO/Executive Director 23 1.3% -0.7% 0.0% 0.0% 6.0% 8.5%
Page 1 of 254

Count Average 10th Percentile 25th Percentile Median 75th Percentile 90th Percentile
Incumbent Compensation Increases by MSA, NTEE Major Group and Budget Size
Abilene, TX
Human Services – Multipurpose and OtherBetween $1 million and $5 million
CEO/Executive Director 5 0.0% 0.0%
Akron, OH
Educational Institutions and Related ActivitiesGreater than $5 million
CEO/Executive Director 6 5.0% 3.4%
Human Services – Multipurpose and Other$500 thousand or less
CEO/Executive Director 6 0.7% 1.0%
Between $1 million and $5 million
CEO/Executive Director 5 3.9% 2.7%
Greater than $5 million
CEO/Executive Director 9 2.6% 3.6%
Top Finance Position 8 5.5% 4.7%
Mental Health, Crisis InterventionGreater than $5 million
CEO/Executive Director 5 1.6% 1.8%
Albany-Schenectady-Troy, NY
501(c) (5) - Labor, Agricultural, and Horticultural OrganizationsBetween $1 million and $5 million
CEO/Executive Director 5 3.7% 3.0%
Page 1 of 296

Count Average 10th Percentile 25th Percentile 50th Percentile 75th Percentile 90th Percentile
Incumbent Compensation Increases by MSA and NTEE Decile Group
Akron, OHCommunity Improvement, Capacity Building: Business & Industry
CEO/Executive Director 7 5.2% 3.2%
Educational Institutions and Related Activities: Elementary & Secondary SchoolsCEO/Executive Director 7 6.4% 3.6%
Human Services – Multipurpose and Other: Centers to Support the Independence of Specific Populations
CEO/Executive Director 5 4.5% 4.9%
Human Services – Multipurpose and Other: Human ServicesCEO/Executive Director 6 -0.7% 1.4%
Human Services – Multipurpose and Other: Residential Care & Adult Day ProgramsCEO/Executive Director 6 2.3% 0.6%
Albany-Schenectady-Troy, NYCommunity Improvement, Capacity Building: Business & Industry
CEO/Executive Director 27 6.2% 0.2% 1.2% 4.8% 9.8% 18.3%
Community Improvement, Capacity Building: Community & Neighborhood DevelopmentCEO/Executive Director 5 1.2% 0.0%
Community Improvement, Capacity Building: Economic DevelopmentCEO/Executive Director 5 6.3% 5.3%
Educational Institutions and Related Activities: Education N.E.C.CEO/Executive Director 7 1.8% 1.5%
Educational Institutions and Related Activities: Educational ServicesCEO/Executive Director 5 4.8% 3.0%
Page 1 of 216
Top Related