


Languages
Pages
Legal


Government of the People’s Republic of Bangladesh
Urban Primary Health Care Services Delivery Project ADB Loan 2878 BAN (SF)/SIDA Grant 0298/UNFPA Grant BGD8U201,BGD8U202
Local Government Division
Ministry of Local Government, Rural Development & Cooperatives
Quarterly Performance Report
January-March 2018
Implementing Agencies
Dhaka South, Dhaka North, Rajshahi, Khulna, Barisal, Sylhet, Comilla, Narayangonj,
Rangpur, Gazipur City Corporations
&
Gopalgonj, Kishoregonj, Kushtia, Sirajgonj Municipalities
Project Management Unit
Nagar Bhaban, 5 Phoenix Road, Dhaka-1000, Bangladesh.
Phone: +880 2 955 0917, Fax: +880 956 9124. email: [email protected]
web: www.uphcp.gov.bd
ACRONYMS
AAAQ Availability, Acceptability, Affordability, Quality
ADB Asian Development Bank
AIDS Acquired Immune Deficiency Syndrome
ANC Antenatal Care
ARH Adolescent Reproductive Health
ARI Acute Respiratory Infection
BAPSA Association for Prevention of Septic Abortion Bangladesh
BCC Barisal City Corporation
BCC Behavior Change Communication
BCCM Behavior Change Communication & Marketing
BDHS Bangladesh Demographic and Health Survey
BRAC Bangladesh Rural Advancement Committee
BSMMU Bangabondhu Shaikh Mujib Medical University
CMC City Maternity Center
CoCC Comilla City Corporation
CRHCC Comprehensive Reproductive Health Care Center
CS Caesarian Section
CWM Clinical Waste Management
DNCC Dhaka North City Corporation
DOTS Directly Observed Treatment Short course
DPP Development Project Proforma
DSCC Dhaka South City Corporation
ECD Early Childhood Development
ECP Emergency Contraceptive Pill
EOC Emergency Obstetric Care
EPI Expanded Program on Immunization
ESD Essential Service Delivery
ESDO Eco-Social Development Organization
ESP Essential Service Package
FGD Focus Group Discussion

FP Family Planning
GACC Gazipur City Corporation
GAP Gender Action Plan
GM Gopalgonj Municipality
GoB Government of Bangladesh
HEC Health Entitlement Card
HIV Human Immunodeficiency Virus
HMIS Health Management Information System
HMN Health Matrix Network
HNPSP Health Nutrition and Population Sector Program
HPSP Health and Population Sector Program
ICDDR,B International Centre for Diarrheal Disease Research, Bangladesh
ICMH Institute of Child and Mother Health
IEC Information Education Communication
IPC Inter Personnel Communication
ISI Integrated Supervisory Instrument
IUD Intra Uterine Device
KAP Knowledge Attitude and Practice
KCC Khulna City Corporation
KMSS Khulna Mukti Seba Sangstha
KsM Kishoregonj Municipality
LCC Limited Curative Care
LGD Local Government Division
LGED Local Government Engineering Department
M&E Monitoring & Evaluation
MCH Maternal and Child Health
MFSTC Mohammadpur Fertility Services and Training Center
MIS Management Information System
MoHFW Ministry of Health and Family Welfare
MoLGRD&C Ministry of Local Government, Rural Development & Cooperatives
MoU Memorandum of Understanding
MR Menstrual Regulation
NACC Narayangonj City Corporation

NGO Non-Government Organization
NID National Immunization Day
NIPORT National Institute of Population Research and Training
NIPSOM National Institute of Preventive and Social Medicine
NM Nari Maitree
NNC Neonatal Care
NNT Neonatal Tetanus
NSV Non-Scalpel Vasectomy
NTP National Tuberculosis Control Program
NVD Normal Vaginal Delivery
OGSB Obstetrical and Gynecological Society of Bangladesh
ORS Oral Rehydration Salt
OT Operation Theater
PA HQ Partnership Area/Agreement Headquarter
PA Partnership Area/Agreement
PAC Post Abortion Care
PEC Primary Eye Care
PHC Primary Health Care
PHCC Primary Health Care Center
PIU Project Implementation Unit
PM Project Manager
PMU Project Management Unit
PNC Postnatal Care
PP Project Proforma
PPM&E Project Performance Monitoring and Evaluation
PPR Public Procurement Rules
PSKP & PPS Progoti Samaj Kallyan Protisthan & Paribar Porikalpana Songstha
PSTC Population Services and Training Center
QoC Quality of Care
QPR Quarterly Performance Report
RACC Rangpur City Corporation
RBM Result Based Management
RCC Rajshahi City Corporation
RDU Rational Drug Use
RH Reproductive Health
RIC Resource Integration Center
RTI Reproductive Tract Infection
SBA Skilled Birth Attendant
SCC Sylhet City Corporation
SDGs Sustainable Development Goals
SIDA Swedish International Development Cooperation Agency
SM Sirajgonj Municipality
STD Sexually Transmitted Disease
STI Sexually Transmitted Infection
TB Tuberculosis
TBA Traditional Birth Attendant
TT Tetanus Toxoid
UHS Urban Health Strategy
UNFPA United Nations Population Fund
UPHCSDP Urban Primary Health Care Services Delivery Project
UTPS Unity Through Population Services
VAW Violence Against Women
WHO World Health Organization

TABLE OF CONTENTS
Preface 1
Executive Summary 2
Basic Data 3
Utilization of Fund 5
Project Purpose and Components 6
Implementation Progress 9
Design and Monitoring Framework 12
Project Implementation Schedule with Activities and Weights 20
Compliance with Loan Covenants 21
Report on Gender Action Plan 30
Appendix A: Status of Civil Works 37
Services Statistics (Performance of Partnership Agreements) 50


Pag
e1

Pag
e1
Preface
The Government of the People’s Republic of Bangladesh has
been implementing Urban Primary Health Care Project since
1998. After successful completion of previous two phases, the
present project has commenced from July 2012.
The goal of the project is to improve health of urban population
specially the poor through improved, efficient, effective and
sustainable Primary Health Care Services. At least 30% of
services are provided free of cost to poor people under the project.
The services are managed by selected NGOs through partnership
agreement in 25 partnership areas (PAs) of 10 City Corporations
and selected 04 Municipalities. The project is funded by GoB
grant, ADB loan, SIDA and UNFPA grants.
Any suggestions to improve the QPR will be highly appreciated.
Md. Abdul Hakim Majumder Ndc
Project Director
15 June 2018 Ph: 02-9550917

Pag
e2
Executive Summary
This Quarterly Performance Report (QPR) covers activities accomplished by the Urban
Primary Health Care Services Delivery Project, its Partner NGOs and Consulting Firms from
January to March 2018 quarter. It includes key information about the project, implementation
progress and activities performed during the quarter. This will enable relevant stakeholders to
understand project progress, become aware of problems and assess implementation status vis-
à-vis project objectives.
This report contains following sections:
1. Basic Data
2. Utilization of fund
3. Project purpose and components
4. Implementation Progress
5. Design and Monitoring Framework & Implementation Schedule
6. Compliance with Loan Covenants
7. Gender Action Plan
8. Service Statistics
At the end of this quarter, the project has finished 69 months which is 100% of revised total
project period. By this time, it has achieved 91% cumulative contract award and 83%
cumulative disbursement of total allocation. Against this year’s targets, achievement of
disbursement was 36% for three months. From the beginning of the project to end of this
quarter, the project has provided over 41 million service contacts. In the current quarter, the
total client contacts were around 2.07 million, among them 81% were female.
At the end of the quarter, the project performance is consistent with the targets of the
procurement plan, Design and Monitoring Framework (DMF), and Loan Covenants.

Pag
e3
Basic Data
1.1 ADB Loan Number: 2878 BAN (SF)
1.2 SIDA Grant Number: 0298 BAN (EF)
1.3 UNFPA Grant Number: BGD8U201, BGD8U202
1.4 Project Title: Urban Primary Health Care Services Delivery Project
1.5 Borrower: Government of Bangladesh
1.6 Executing Agency: Local Government Division
Ministry of Local Government, Rural Development and
Cooperatives
1.7 Implementing Agencies
1. Dhaka South City Corporation
2. Dhaka North City Corporation
3. Rajshahi City Corporation
4. Khulna City Corporation
5. Sylhet City Corporation
6. Barisal City Corporation
7. Comilla City Corporation
8. Narayangonj City Corporation
9. Rangpur City Corporation
10. Gazipur City Corporation
11. Gopalgonj Municipality
12. Kishoregonj Municipality
13. Kushtia Municipality
14. Sirajgonj Municipality

Pag
e4
1.8 Total Estimated Project Cost: US$ 82.46 million
1.9 Financing Plan
Source Amount ($ millions) % Share of Total
Asian Development Bank (ADB) 47.98 61.91
Government of Sweden (SIDA) 20.00 25.81
Government of Bangladesh 9.52 12.28
Total 77.50 100
UNFPA (Parallel grant) 3.00
Grand Total 80.50
1.10 Dates of approval, signing and effectiveness of ADB loan
(i) Date of Approval: 18 July 2012
(ii) Date of Signing: 26 September 2012
(iii) Date of Loan Effectiveness: 3 December 2012
1.11 Original and revised ADB loan closing date and elapsed loan period based
on original and revised loan closing dates:
(i) Original Loan Closing Date: 30 June 2017
(ii) Revised Loan Closing Date: 31 March 2018
(iii) Elapsed time (as per original): 69 months (as of 31 March 2018)
1.12 Date of ADB Special Administration mission: 11 February -15 February 2018
Pag
e5
Utilization of Fund
(ADB Loan, Co-financing and Counterpart funds)
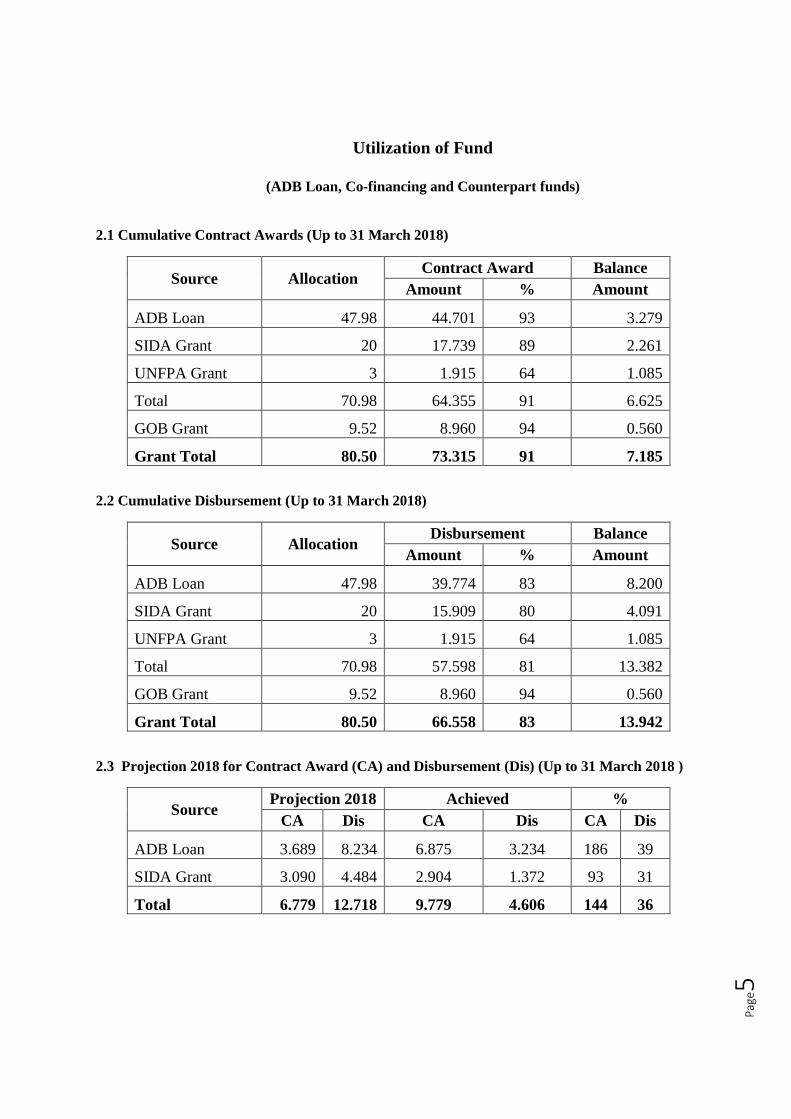
2.1 Cumulative Contract Awards (Up to 31 March 2018)
Source Allocation Contract Award Balance
Amount % Amount
ADB Loan 47.98 44.701 93 3.279
SIDA Grant 20 17.739 89 2.261
UNFPA Grant 3 1.915 64 1.085
Total 70.98 64.355 91 6.625
GOB Grant 9.52 8.960 94 0.560
Grant Total 80.50 73.315 91 7.185
2.2 Cumulative Disbursement (Up to 31 March 2018)
Source Allocation Disbursement Balance
Amount % Amount
ADB Loan 47.98 39.774 83 8.200
SIDA Grant 20 15.909 80 4.091
UNFPA Grant 3 1.915 64 1.085
Total 70.98 57.598 81 13.382
GOB Grant 9.52 8.960 94 0.560
Grant Total 80.50 66.558 83 13.942
2.3 Projection 2018 for Contract Award (CA) and Disbursement (Dis) (Up to 31 March 2018 )
Source Projection 2018 Achieved %
CA Dis CA Dis CA Dis
ADB Loan 3.689 8.234 6.875 3.234 186 39
SIDA Grant 3.090 4.484 2.904 1.372 93 31
Total 6.779 12.718 9.779 4.606 144 36

Pag
e6
Project Purpose and Components
3.1 Project Scope and objectives
The ultimate aim of the Urban Primary Health Care Services Delivery Project is to
improve health status of the urban poor, especially women and children, in the project
area. The immediate outcome of the project is to improve quality of Primary Health
Care (PHC) utilization sustainably by the urban poor, particularly women and
children.
The following objectives are being contributed to achieve the ultimate aim as well as
the immediate outcomes of the project:
(i) Improving accessibility (financial and physical) to PHC services in the
urban areas covered by the project;
(ii) Ensuring the delivery of quality PHC services to urban population – the project
will ensure the MoHFW’s essential service delivery package (ESD+) focused
maternal and child health in urban areas, particularly for the poor. The project
will increase focus on family planning, nutrition, adolescent health, and
neonatal care;
(iii) Increasing the utilization of PHC services by the urban poor, especially
women, newborn, and children;
(iv) Strengthening institutional arrangements for the delivery of PHC services in
urban areas;
(v) Increasing capacity of the Urban Local Bodies (ULBs) to ensure the delivery
of PHC services, according to their mandate; and
(vi) Increasing sustainability of the delivery of urban PHC services by
strengthening ownership and commitment of the ULBs to ensure the delivery
of PHC services particularly for the poor.
3.2 Project Components
The project has three major components as stated below:
Component 1: Strengthened Institutional Governance and Local Government
Capacity to Sustainably Deliver Urban Primary Health Care Services
1.1 Strengthened strategy and coordination framework for urban PHC
1.1.1 National Urban Health Strategy
1.2 Strengthened institutions and management capacity of LGD and ULBs for urban
PHC
1.2.1 Institutional support to LGD
1.3 Strengthened local ownership and commitment for urban PHC
1.3.1 PHC advocacy and awareness building

Pag
e7
1.3.2 Improved planning and budgeting for basic social services
1.4 Management systems, learning, and innovations on urban PHC
1.4.1 Urban Health Management Information System (Urban HMIS)
1.4.2 Facility Mapping
1.4.3 Operational Research
Component 2: Improved accessibility, quality, and utilization of Urban PHC
services delivery system through public‐private partnership.
2.1 Urban PHC se rv ices delivery, including health education and behavior
change communication.
2.1.1 Partnership Agreement
2.1.2 Behavior change communication program
2.2 Effective Reaching of the urban poor
2.2.1 Poverty Targeting
2.2.2 Mobile Services
2.2.3 Collaboration agreement
2.3 Ensuring Quality of PHC services
2.3.1 Health workers training
2.3.2 Equipment and Drugs
2.3.3 Quality monitoring and assurance
2.3.4 Performance management of NGOs and encouraging innovations
2.4 Access to urban PHC through improved infrastructure network
2.4.1 Construction of new health facilities and up gradation
2.4.2 Green Clinics
Component 3: Effective Support for Decentralized Project Management
3.1 Core project management
3.2 Technical support for project management
3.3 Project financial management system
3.4 Training coordination
3.4.1 Training coordination unit
3.4.2 E‐learning and assessment
3.5 Monitoring and evaluation
3.3 Implementation Arrangement
The Local Government Division of the Ministry of Local Government, Rural Development,
and Cooperatives is the executing agency of the project. A Project Management Unit (PMU)
headed by Project Director provides technical, administrative and logistical leadership for
project implementation. PMU has been assisted by National and International Individual
Consultants and Consulting Firms. A National Project Steering Committee chaired by the
Pag
e8
Secretary, Local Government Division provides guidance to the PMU. Director General of
Monitoring, Inspection and Evaluation Wing of the Local Government Division is the Chief
Coordinator of the project. The Health Department of the City Corporations and selected
municipalities are the implementing agencies in their respective project areas through a Project
Implementation Unit (PIU). The PIUs are assisted by Partnership NGOs to deliver primary
health care services to the people of the project areas. Each city corporation and municipality
has a Partnership Committee chaired by the Mayor. There is a Ward Primary Health Care
Coordination Committee (WPHCCC) chaired by the respective local Ward Councilor and co-
chaired by the female Ward Councilor and Zonal Health Officer.
3.4 Consultants
The project has provision for Consultancy Firms and Individual Consultants to provide
management and technical support to the project. The firms are: Project Performance
Monitoring & Evaluation (PPM&E) Firm, Behavior Change and Communication Marketing
(BCCM) Firm and Operations Research Firms. Individual Consultants are: Urban Health
Strategy Expert, Resource Management Specialist, PPP Transaction Specialist, Urban PHC
Specialist, Procurement Specialist, Quality Assurance Specialist, Gender Specialist,
Environment Specialist, Financial Management Specialist, Human Resource Development
Specialist, and Training Management Specialist.
3.5 Partnership Areas
The service delivery area of the project has been divided into 25 partnership areas. One NGO
has been selected through competitive bidding for delivering services in a partnership area.
Each selected PA NGO has been delivering services through one Comprehensive Reproductive
Health Care Centre (CRHCC), selected number of Primary Health Care Centers (PHCCs) and
Satellite or Mini Clinics.

Pag
e9
Implementation Progress
4.1 Contract award
1 Total allocation: $80.50 million
2 Cumulative Contract Award from starting of the project: $73.318 million
3 % cumulative contract award against allocation: 91%
4 Target of CA this year: $6.779 million
5 Amount of CA till 31 March 2018: $9.779 million
6 % CA against target of the year: 144%
4.1 Disbursement
1 Total allocation: $80.50 million
2 Total disbursement from starting of the project: $66.558 million
3 % cumulative disbursement against allocation: 83%
4 Target of disbursement for this year: $ 12.718 million
5 Amount of disbursement till 31 March 2018: $ 4.606 million
J % Disbursement against this year target: 36%
4.2 Procurement progress
1 Recruitment of Consultants
1.1 NIL
1.2 NIL
2 Procurement of Goods
2.2 NIL
3 Civil Works
NIL
4.3 Trainings (As per approved training plan July 2017-Mar 2018)
1 In country Training
Training on Innovative Approaches of Medical Facilities Initiatives, 11-15 February 2018
2 Out-country Training
---NIL---
4.4 Service delivery
1 Number of services provided from starting of the project: 48,746,562
2 Number of services provided January-March quarter 2018: 2,071,131

Pag
e10
4.5 Major Implementation Activities (January-March 2018)
Sl Activities Date
1. --Nil--
2. --Nil--
Monitoring and Visits
3. PO (Clinical) QAT visit NaCC, PSKP 23 January 2018
4.6 Major Activities Accomplished by Consulting Firms (January-March 2018)
A. Project Performance Monitoring and Evaluation Firm (Eusuf and Associates)
During the quarter, the first one and a half months were devoted to completing the
simultaneously on-going field survey works started already in December 2017 of four major
surveys on Endline Survey 2018, Baseline Survey of UPHCSDP-II 2018, Slum Survey 2018,
and ISI Monitoring Survey – Round IV.
The following 14 different reports and deliverable outputs were prepared and simultaneously
shared with the client (PMU) and relevant stakeholders.
(1) ISI-Monitoring Survey – Round IV – One Volume;
(2) Baseline Survey of UPHCSDP-II – Four Volumes for Combined, DCC, OCC &
Municipalities;
(3) Slum Survey 2018 for Impact of Slum Population – Three Volumes for Combined, DCC &
OCC (Municipalities were excluded from Slum Survey);
(4) Endline Household Survey 2018 - Four Volumes for Combined, DCC, OCC & Municipalities;
(5) Upgrading GIS based Web-enable Mapping of existing 25 PAs – One Volume; and
(6) GIS-Based Web-enable mapping of UPHCSDP-II – One Volume.
B. Operations Research Firm (ICDDR,B)
(1) HDSS eighth round- Data collection
(2) HDSS eighth round- Repeated visits to absentee households
(3) HDSS eighth round - Data cleaning/field verification
(4) HDSS ninth round- Data collection
(5) HDSS ninth round- Repeated visits to absentee households
(6) HDSS ninth round- Data cleaning/field verification

Pag
e11
(7) Migration and Health second round survey- Report presented to TRC meeting and revised
(8) NCD risk factors second round survey- Report presented to TRC meeting and revised
(9) MNCH, and violence against women second round survey- Report presented to TRC meeting and
revised
(10) Expenditure survey second round - Report presented to TRC meeting and revised
Pag
e12
DESIGN AND MONITORING
FRAMEWORK
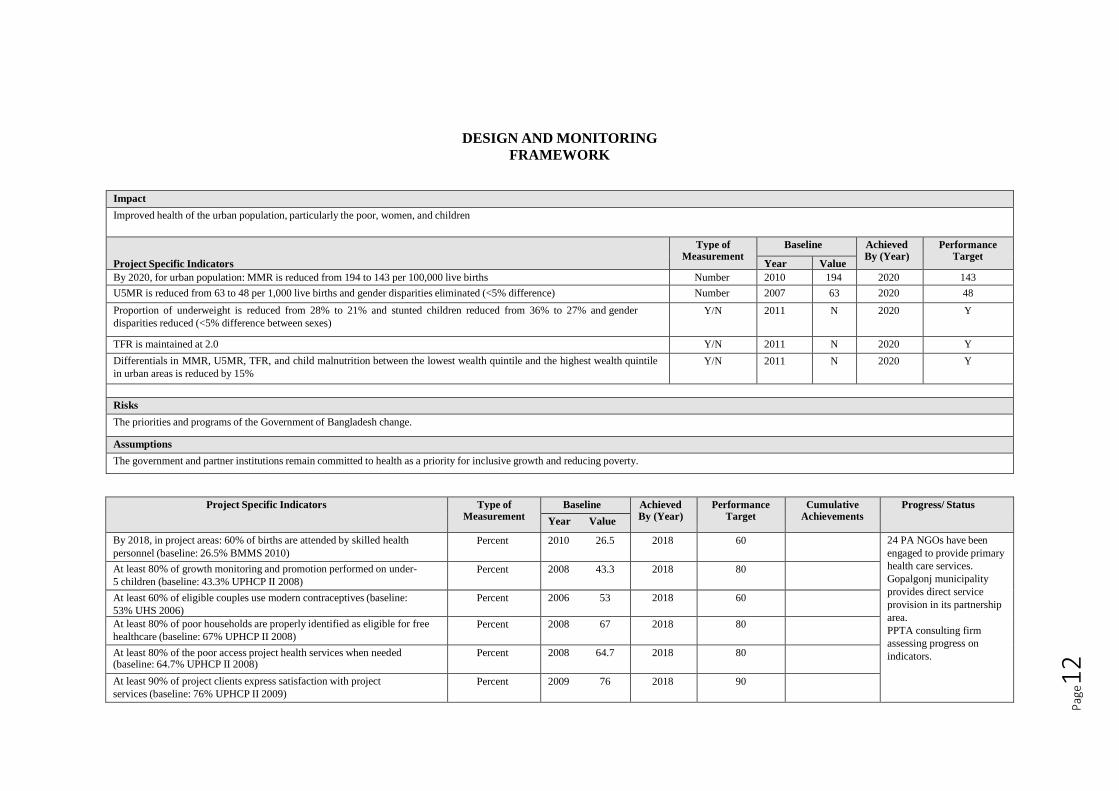
Impact Improved health of the urban population, particularly the poor, women, and children
Project Specific Indicators
Type of
Measurement Baseline Achieved
By (Year) Performance
Target Year Value
By 2020, for urban population: MMR is reduced from 194 to 143 per 100,000 live births Number 2010 194 2020 143 U5MR is reduced from 63 to 48 per 1,000 live births and gender disparities eliminated (<5% difference) Number 2007 63 2020 48 Proportion of underweight is reduced from 28% to 21% and stunted children reduced from 36% to 27% and gender
disparities reduced (<5% difference between sexes) Y/N 2011 N 2020 Y
TFR is maintained at 2.0 Y/N 2011 N 2020 Y Differentials in MMR, U5MR, TFR, and child malnutrition between the lowest wealth quintile and the highest wealth quintile
in urban areas is reduced by 15% Y/N 2011 N 2020 Y
Risks The priorities and programs of the Government of Bangladesh change.
Assumptions The government and partner institutions remain committed to health as a priority for inclusive growth and reducing poverty.
Project Specific Indicators Type of
Measurement Baseline Achieved
By (Year) Performance
Target Cumulative
Achievements Progress/ Status
Year Value
By 2018, in project areas: 60% of births are attended by skilled health
personnel (baseline: 26.5% BMMS 2010) Percent 2010 26.5 2018 60 24 PA NGOs have been
engaged to provide primary
health care services.
Gopalgonj municipality
provides direct service
provision in its partnership
area.
PPTA consulting firm
assessing progress on
indicators.
At least 80% of growth monitoring and promotion performed on under-
5 children (baseline: 43.3% UPHCP II 2008) Percent 2008 43.3 2018 80
At least 60% of eligible couples use modern contraceptives (baseline:
53% UHS 2006) Percent 2006 53 2018 60
At least 80% of poor households are properly identified as eligible for free
healthcare (baseline: 67% UPHCP II 2008) Percent 2008 67 2018 80
At least 80% of the poor access project health services when needed (baseline: 64.7% UPHCP II 2008)
Percent 2008 64.7 2018 80
At least 90% of project clients express satisfaction with project
services (baseline: 76% UPHCP II 2009) Percent 2009 76 2018 90
Pag
e13
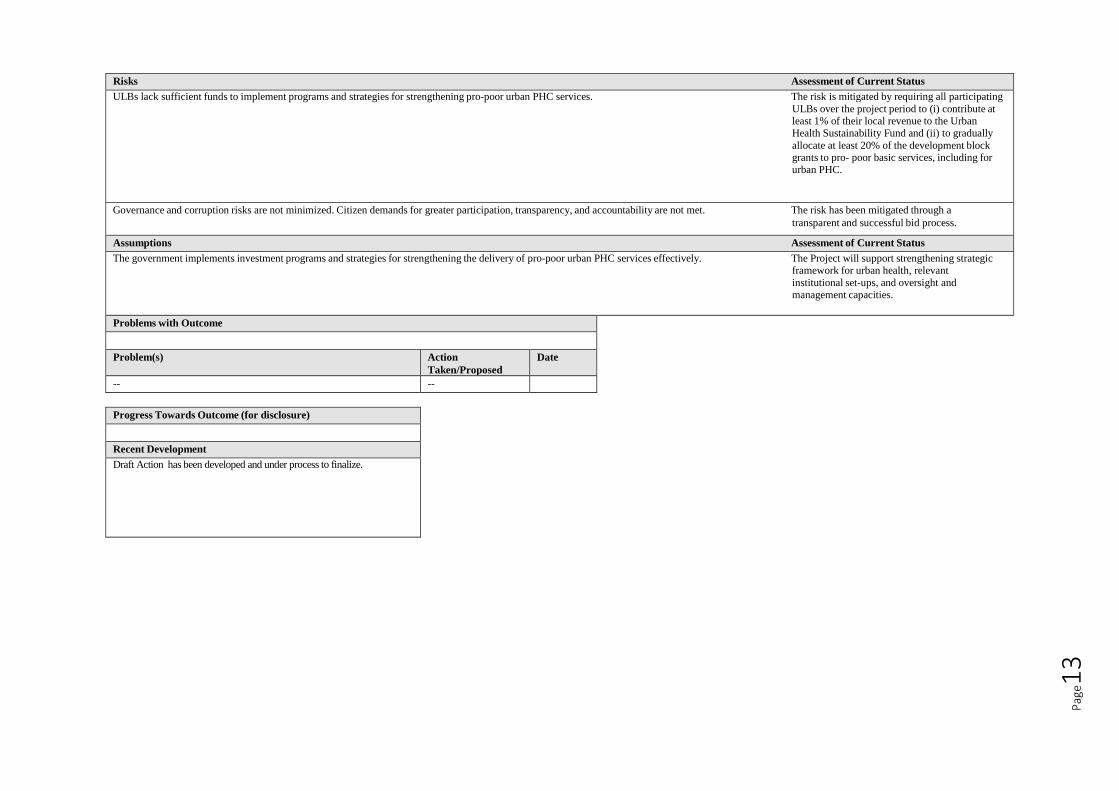
Risks Assessment of Current Status ULBs lack sufficient funds to implement programs and strategies for strengthening pro-poor urban PHC services. The risk is mitigated by requiring all participating
ULBs over the project period to (i) contribute at least 1% of their local revenue to the Urban Health Sustainability Fund and (ii) to gradually
allocate at least 20% of the development block grants to pro- poor basic services, including for urban PHC.
Governance and corruption risks are not minimized. Citizen demands for greater participation, transparency, and accountability are not met. The risk has been mitigated through a
transparent and successful bid process.
Assumptions Assessment of Current Status The government implements investment programs and strategies for strengthening the delivery of pro-poor urban PHC services effectively. The Project will support strengthening strategic
framework for urban health, relevant
institutional set-ups, and oversight and management capacities.
Problems with Outcome
Problem(s) Action
Taken/Proposed Date
-- --
Progress Towards Outcome (for disclosure)
Recent Development Draft Action has been developed and under process to finalize.
Pag
e14
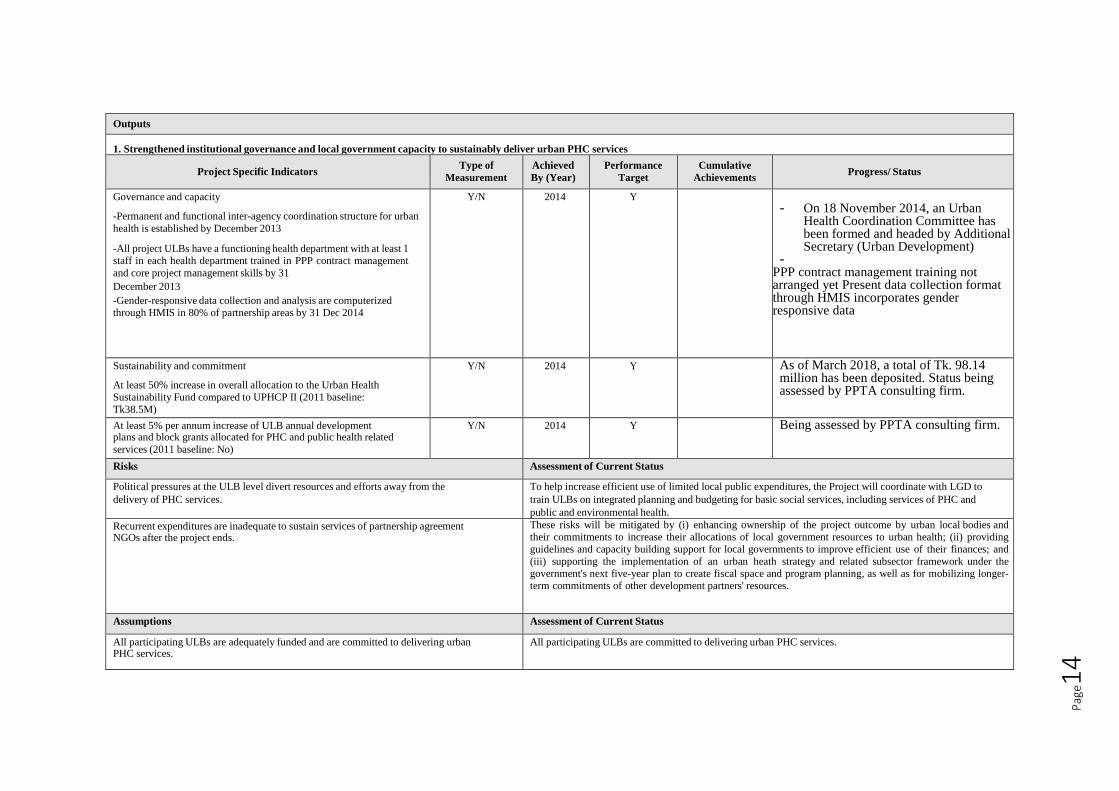
Outputs
1. Strengthened institutional governance and local government capacity to sustainably deliver urban PHC services
Project Specific Indicators Type of
Measurement Achieved
By (Year) Performance
Target Cumulative
Achievements
Progress/ Status
Governance and capacity
-Permanent and functional inter-agency coordination structure for urban
health is established by December 2013
-All project ULBs have a functioning health department with at least 1 staff in each health department trained in PPP contract management
and core project management skills by 31
December 2013
-Gender-responsive data collection and analysis are computerized through HMIS in 80% of partnership areas by 31 Dec 2014
Y/N 2014 Y - On 18 November 2014, an Urban
Health Coordination Committee has been formed and headed by Additional Secretary (Urban Development)
- - PPP contract management training not
arranged yet Present data collection format through HMIS incorporates gender responsive data
Sustainability and commitment
At least 50% increase in overall allocation to the Urban Health
Sustainability Fund compared to UPHCP II (2011 baseline:
Tk38.5M)
Y/N 2014 Y As of March 2018, a total of Tk. 98.14 million has been deposited. Status being assessed by PPTA consulting firm.
At least 5% per annum increase of ULB annual development plans and block grants allocated for PHC and public health related
services (2011 baseline: No)
Y/N 2014 Y Being assessed by PPTA consulting firm.
Risks Assessment of Current Status
Political pressures at the ULB level divert resources and efforts away from the
delivery of PHC services. To help increase efficient use of limited local public expenditures, the Project will coordinate with LGD to
train ULBs on integrated planning and budgeting for basic social services, including services of PHC and
public and environmental health. Recurrent expenditures are inadequate to sustain services of partnership agreement NGOs after the project ends.
These risks will be mitigated by (i) enhancing ownership of the project outcome by urban local bodies and their commitments to increase their allocations of local government resources to urban health; (ii) providing
guidelines and capacity building support for local governments to improve efficient use of their finances; and
(iii) supporting the implementation of an urban heath strategy and related subsector framework under the government's next five-year plan to create fiscal space and program planning, as well as for mobilizing longer-term commitments of other development partners' resources.
Assumptions Assessment of Current Status
All participating ULBs are adequately funded and are committed to delivering urban PHC services.
All participating ULBs are committed to delivering urban PHC services.
Pag
e15
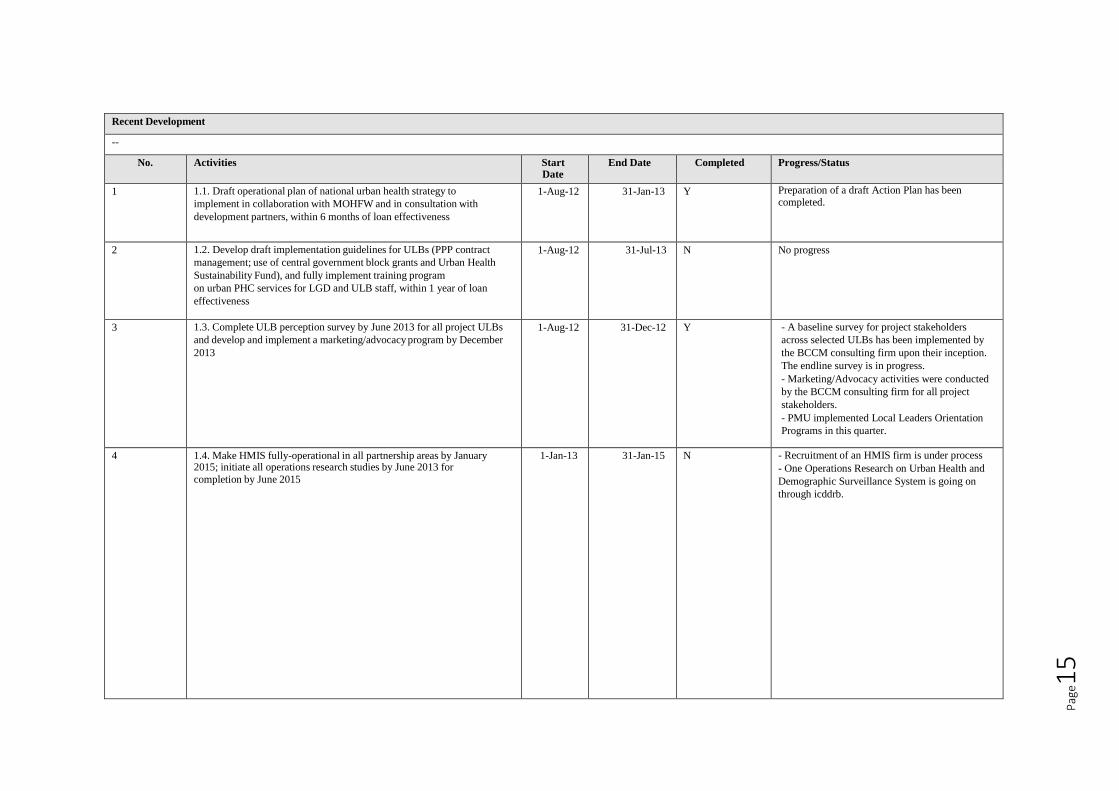
Recent Development
--
No. Activities Start
Date End Date Completed Progress/Status
1 1.1. Draft operational plan of national urban health strategy to
implement in collaboration with MOHFW and in consultation with
development partners, within 6 months of loan effectiveness
1-Aug-12 31-Jan-13 Y Preparation of a draft Action Plan has been completed.
2 1.2. Develop draft implementation guidelines for ULBs (PPP contract
management; use of central government block grants and Urban Health
Sustainability Fund), and fully implement training program
on urban PHC services for LGD and ULB staff, within 1 year of loan
effectiveness
1-Aug-12 31-Jul-13 N No progress
3 1.3. Complete ULB perception survey by June 2013 for all project ULBs
and develop and implement a marketing/advocacy program by December
2013
1-Aug-12 31-Dec-12 Y - A baseline survey for project stakeholders
across selected ULBs has been implemented by
the BCCM consulting firm upon their inception.
The endline survey is in progress.
- Marketing/Advocacy activities were conducted
by the BCCM consulting firm for all project
stakeholders.
- PMU implemented Local Leaders Orientation
Programs in this quarter.
4 1.4. Make HMIS fully-operational in all partnership areas by January 2015; initiate all operations research studies by June 2013 for
completion by June 2015
1-Jan-13 31-Jan-15 N - Recruitment of an HMIS firm is under process
- One Operations Research on Urban Health and
Demographic Surveillance System is going on
through icddrb.

Pag
e16
Outputs
2. Improved accessibility, quality, and utilization of urban PHC services, with a focus on the poor, women, and children, through PPP
Project Specific Indicators
Type of
Measurement
Achieved By
(Year)
Performance
Target
Cumulative
Achievements
Progress/ Status
By midterm review and sustained until project completion:
Accessibility and utilization
At least 30% of each of the major project healthcare services
(including caesarian section) is provided free-of-charge to holders
of government-issued red cards that identify them as poor.
At least 80% of facilities planned for construction and upgrading are functioning normally within 3 years of loan
effectiveness (12 CRHCCs and 26 PHCCs)
Y/N 2015 Y Y
- All major services are delivered free of cost to
the red card holders
- Construction of 9 CRHCC buildings and 19
PHCC buildings is progressing
Quality
At least 80% of children consulting project PHC services for
acute respiratory infection receive correct treatment.
At least 80% of children consulting for diarrhea receive correct
treatment.
Y/N 2015 Y Y Indicators are being monitored through the project
quality assurance system: regular self-assessment as
well as semiannual independent supervisory
instrument (ISI) surveys.
PPP performance and accountability
100% of partnership area NGOs achieves internal quality compliance (financial management, updated clinical registers,
clinical waste management, inventory management).
Y/N 2015 Y Y Indicators are being monitored through the project
quality assurance system: regular self-assessment as
well as semiannual independent supervisory
instrument (ISI) surveys.
Risks Assessment of Current Status
Procedural problems arise in contracting process, because relations between ULBs and
contracted NGOs do not remain smooth or NGO partners are not supervised effectively. This risk is mitigated by providing management and technical support by PMU and PIUs.
Assumptions Assessment of Current Status
Social and cultural factors do not bar the poor and women from accessing facility-based
PHC services. PHC outreach and ward primary health care coordination committee meetings ensure greater access.
NGOs and the government are committed to accountability and performance in PPP contract management.
NGO contract performance is reviewed on regular basis by PMU and PIUs.
Recent Development
No. Activities Start Date End Date Completed Progress/Status
Pag
e17
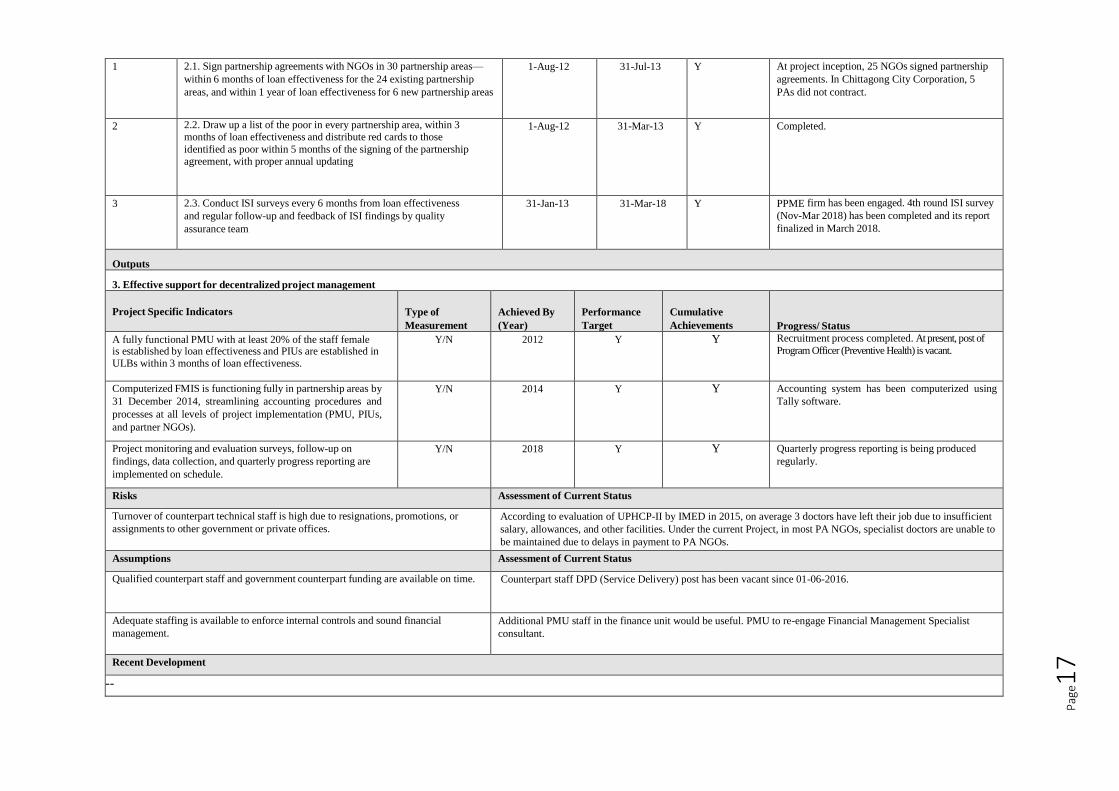
1 2.1. Sign partnership agreements with NGOs in 30 partnership areas—
within 6 months of loan effectiveness for the 24 existing partnership
areas, and within 1 year of loan effectiveness for 6 new partnership areas
1-Aug-12 31-Jul-13 Y At project inception, 25 NGOs signed partnership
agreements. In Chittagong City Corporation, 5
PAs did not contract.
2 2.2. Draw up a list of the poor in every partnership area, within 3 months of loan effectiveness and distribute red cards to those
identified as poor within 5 months of the signing of the partnership agreement, with proper annual updating
1-Aug-12 31-Mar-13 Y Completed.
3 2.3. Conduct ISI surveys every 6 months from loan effectiveness
and regular follow-up and feedback of ISI findings by quality
assurance team
31-Jan-13 31-Mar-18 Y PPME firm has been engaged. 4th round ISI survey
(Nov-Mar 2018) has been completed and its report
finalized in March 2018.
Outputs
3. Effective support for decentralized project management
Project Specific Indicators
Type of
Measurement
Achieved By
(Year)
Performance
Target
Cumulative
Achievements
Progress/ Status A fully functional PMU with at least 20% of the staff female
is established by loan effectiveness and PIUs are established in ULBs within 3 months of loan effectiveness.
Y/N 2012 Y Y Recruitment process completed. At present, post of
Program Officer (Preventive Health) is vacant.
Computerized FMIS is functioning fully in partnership areas by
31 December 2014, streamlining accounting procedures and
processes at all levels of project implementation (PMU, PIUs,
and partner NGOs).
Y/N 2014 Y Y Accounting system has been computerized using
Tally software.
Project monitoring and evaluation surveys, follow-up on
findings, data collection, and quarterly progress reporting are
implemented on schedule.
Y/N 2018 Y Y Quarterly progress reporting is being produced
regularly.
Risks Assessment of Current Status
Turnover of counterpart technical staff is high due to resignations, promotions, or
assignments to other government or private offices. According to evaluation of UPHCP-II by IMED in 2015, on average 3 doctors have left their job due to insufficient
salary, allowances, and other facilities. Under the current Project, in most PA NGOs, specialist doctors are unable to
be maintained due to delays in payment to PA NGOs. Assumptions Assessment of Current Status
Qualified counterpart staff and government counterpart funding are available on time. Counterpart staff DPD (Service Delivery) post has been vacant since 01-06-2016.
Adequate staffing is available to enforce internal controls and sound financial
management.
Additional PMU staff in the finance unit would be useful. PMU to re-engage Financial Management Specialist
consultant.
Recent Development
--

Pag
e18
No. Activities Start Date End Date Completed Progress/Status
1 3.1. Establish a fully functional PMU with at least 20% of the staff
female and PIUs in ULBs within 3 months of loan effectiveness 1-Aug-12 31-Oct-12 Y Complied.
2 3.2. Recruit consultants to provide technical support to PMU 1-Aug-12 31-Jan-13 Y Completed.
3 3.3. Have fully functional FMIS in place by January 2015 1-Jan-13 31-Jan-15 Y A computerized accounting system using Tally
software has been established.
4 3.4. Finalize training plan by 31 March 2013. Ensure that
training activities are timely and at least 80% of scheduled
participants attend the training sessions
1-Jan-13 31-Mar-13 Y Training plan has been finalized for the period of
2017-2018.

Pag
e19
PROJECT IMPLEMENTATION SCHEDULE WITH ACTIVITIES AND WEIGHTS
Adv. Act.
2012 2012-13 2013-14 2014-15 2015-16 2016-17
Q1 Q2 Q3 Q4 Q1 Q2 Q3 Q4 Q1 Q2 Q3 Q4 Q1 Q2 Q3 Q4 Q1 Q2 Q3 Q4 Q1 Q2
Component 1: Strengthened Institutional Governance and Local Government Capacity to Sustainably Deliver Urban PHC services
Sub-component 1.1: National Urban Health Strategy and operational plan
1.1.1 Draft operational plan to implement the National Urban Health Strategy 2% 95% 1.9%
Sub-component 1.2: Strengthen LGD and ULBs' capacity to ensure delivery of urban PHC
1.2.1 Review/update LGD policies and guidelines for urban health 1% 75% 0.8%
1.2.2 Assist LGD to develop guidelines for ULBs related to urban health services 3% 75% 2.3%
1.2.3 Implement training program for ULB staff (health department + management) 3% 90% 2.7%
1.2.4 Implement planning/budgeting training program for ULB staff 2% 90% 1.8%
Sub-component 1.3: Complete ULB perception survey for all ULBs and develop and implement an advocacy program
1.3.1 Develop ULB perception survey 1% 70% 0.7%
1.3.2 Implement ULB perception survey for all ULB officials and staff 2% 50% 1.0%
1.3.3 Develop and implement a marketing/policy advocacy program for ULBs 3% 75% 2.3%
1.3.4 Recruit firm / Develop BCCM (behavior change and communication) program 1% 100% 1.0%
1.3.5 Implement BCCM program 4% 98% 3.9%
Sub-component 1.4: Management systems, learning, and innovations on urban PHC
1.4.1 Recruit HMIS and IT solutions firm 1% 90% 0.9%
1.4.2 Design and operationalize HMIS (including GIS and learning modules) 4% 30% 1.2%
1.4.3 Develop and implement e-teaching/e-learning capacity in project area 2% 60% 1.2%
1.4.4 Procurement of IT equipment for HMIS / e-learning 1% 25% 0.3%
1.4.5 Maintenance and troubleshooting of HMIS 1% 25% 0.3%
1.4.6 Implement action-oriented, participatory operational research 3% 95% 2.9%
Component 2: Improved accessibility, quality, and utilization of urban PHC services delivery system, with a focus on the poor, women, and children, through PPP
Sub-component 2.1: Partnership Area NGOs and Infrastructure
2.1.1 Invite bids and process contracts for first batch of NGOs 2% 100% 2.0%
2.1.2 Invite bids and process contracts for second batch of NGOs 2% 100% 2.0%
2.1.3 Invite bids, award contracts, monitor construction CRHCC packages W1-12 (10 packages) 3% 97% 2.9%
2.1.4 Invite bids, award contracts, monitor construction PHCC package W13-38 (19 packages per RDPP) 3% 97% 2.9%
2.1.5 Invite bids, contract greening of existing clinics W40 3% 0% 0.0%
2.1.6 Periodic maintenance of PHCC and CRHCCs W41.1-41.10 1% 100% 1.0%
Sub-component 2.2: Pro-Poor Targeting
2.2.1 Establish list of poor in every PA 2% 100% 2.0%
2.2.2 Distribute red cards in every PA 2% 98% 2.0%
2.2.3 Update list of the poor in every PA 3% 100% 3.0%
2.2.4 Support to NGOs for management of red cards 1% 98% 1.0%
2.2.5 Weekly mobile outreach to the "ultra poor" and floating population 2% 97% 1.9%
2.2.6 Sign collaboration agreements with BGMEA and other partners in project area 1% 0% 0.0%
Sub-component 2.3: Ensuring Quality of PHC services
2.3.1 Implement training plan for health workers in delivery of the ESD+ package 3% 90% 2.7%
2.3.2 Recruit M&E firm 1% 100% 1.0%
2.3.3 Pilot performance linked incentives (annual) 3% 75% 2.3%
2.3.4 Independent monitoring of partner NGO performance using ISIs (biannual) 3% 100% 3.0%
2.3.5 Prepare procurement of medical equipment: field inventory - bidding documents 1% 100% 1.0%
2.3.6 Procure medical equipment as required 3% 100% 3.0%
2.3.7 Procure vehicles to PA NGOs as required 3% 90% 2.7%
2.3.8 Procure drugs/supplies to PHCC and CRHCC 3% 97% 2.9%
Assigned
Weight
Actual
Progress
Weighted
Progress
ACTIVITIES
Year 4 Year 5Year 1 Year 2 Year 3

Pag
e20
Component 3: Effective Project Management
Sub-component 3.1: Core Project Management Staff
Establish PMU/PIUs with complete staffing 2% 90% 1.8%
Procure approved vehicles for PMU and PIUs 2% 100% 2.0%
Publish quarterly progress reports and Gender Action Plan updates 1% 95% 1.0%
Sub-component 3.2: Technical support for Project management
Establish PMU Technical Support Team of Consultants 2% 100% 2.0%
Sub-component 3.3: Project Financial Management System
Design and Installation of Project Financial Management System 3% 95% 2.9%
Training and Implementation of the Financial Management System 4% 85% 3.4%
Sub-component 3.4: Training Coordination Unit
Establish Training Coordination Unit 1% 100% 1.0%
Develop training guidelines and modules according to program 2% 100% 2.0%
Implement training program 4% 90% 3.6%
Total 100% 83.8%
Pag
e21
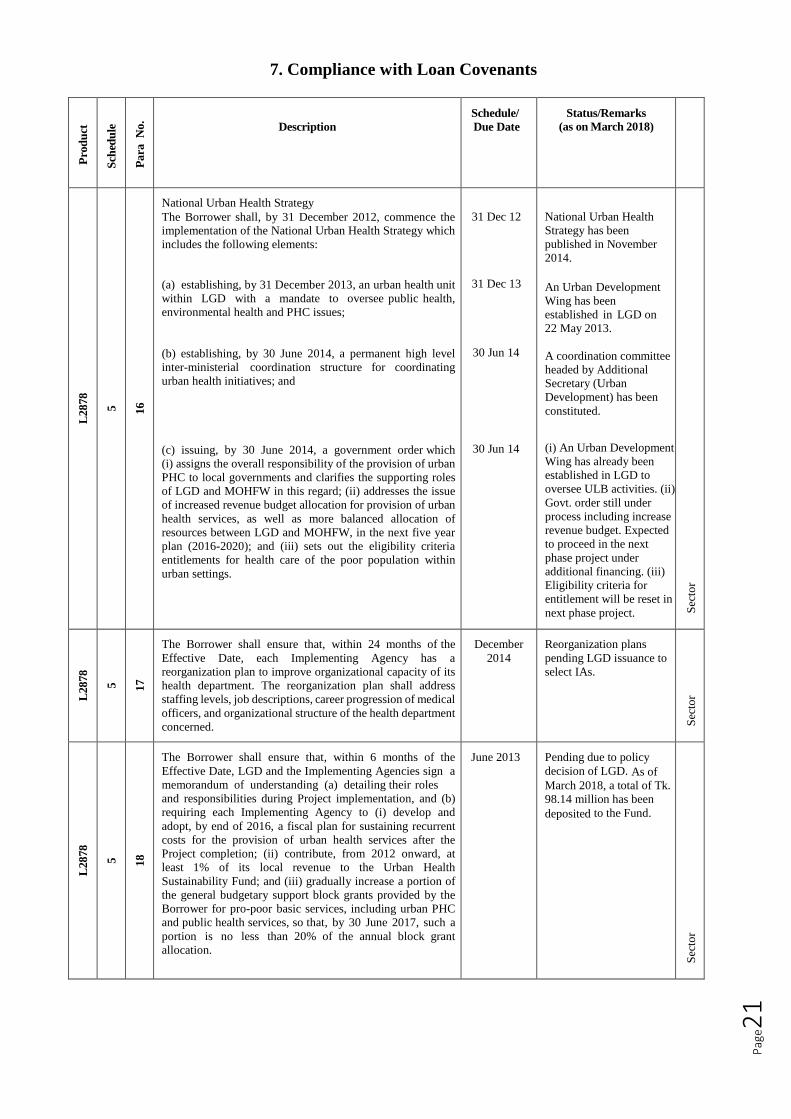
7. Compliance with Loan Covenants
Pro
du
ct
Sch
edu
le
Para
N
o.
Description
Schedule/
Due Date
Status/Remarks (as on March 2018)
L2878
5
16
National Urban Health Strategy
The Borrower shall, by 31 December 2012, commence the implementation of the National Urban Health Strategy which
includes the following elements:
(a) establishing, by 31 December 2013, an urban health unit
within LGD with a mandate to oversee public health,
environmental health and PHC issues;
(b) establishing, by 30 June 2014, a permanent high level
inter-ministerial coordination structure for coordinating
urban health initiatives; and
(c) issuing, by 30 June 2014, a government order which
(i) assigns the overall responsibility of the provision of urban
PHC to local governments and clarifies the supporting roles
of LGD and MOHFW in this regard; (ii) addresses the issue
of increased revenue budget allocation for provision of urban
health services, as well as more balanced allocation of
resources between LGD and MOHFW, in the next five year
plan (2016-2020); and (iii) sets out the eligibility criteria
entitlements for health care of the poor population within
urban settings.
31 Dec 12
31 Dec 13
30 Jun 14
30 Jun 14
National Urban Health
Strategy has been
published in November
2014.
An Urban Development
Wing has been
established in LGD on
22 May 2013.
A coordination committee
headed by Additional
Secretary (Urban
Development) has been
constituted.
(i) An Urban Development
Wing has already been
established in LGD to
oversee ULB activities. (ii)
Govt. order still under
process including increase
revenue budget. Expected
to proceed in the next
phase project under
additional financing. (iii)
Eligibility criteria for
entitlement will be reset in
next phase project.
Sec
tor
L2878
5
17
The Borrower shall ensure that, within 24 months of the
Effective Date, each Implementing Agency has a
reorganization plan to improve organizational capacity of its
health department. The reorganization plan shall address
staffing levels, job descriptions, career progression of medical
officers, and organizational structure of the health department
concerned.
December
2014
Reorganization plans
pending LGD issuance to
select IAs.
Sec
tor
L2878
5
18
The Borrower shall ensure that, within 6 months of the
Effective Date, LGD and the Implementing Agencies sign a
memorandum of understanding (a) detailing their roles
and responsibilities during Project implementation, and (b)
requiring each Implementing Agency to (i) develop and
adopt, by end of 2016, a fiscal plan for sustaining recurrent
costs for the provision of urban health services after the
Project completion; (ii) contribute, from 2012 onward, at
least 1% of its local revenue to the Urban Health
Sustainability Fund; and (iii) gradually increase a portion of
the general budgetary support block grants provided by the
Borrower for pro-poor basic services, including urban PHC
and public health services, so that, by 30 June 2017, such a
portion is no less than 20% of the annual block grant
allocation.
June 2013
Pending due to policy
decision of LGD. As of
March 2018, a total of Tk.
98.14 million has been
deposited to the Fund.
Sec
tor

Pag
e22
Pro
du
ct
Sch
edu
le
Para
N
o.
Description
Schedule/
Due Date
Status/Remarks
(as on 31 March 2018)
Typ
e
L2878
5
19
Partnership Agreements
The Borrower shall take, and shall cause each Implementing
Agency to take, all measures stipulated in the implementation
plan, as set forth in Annex 5 to the PAM, to effect, and permit
full and effective implementation of, the Partnership
Agreements.
Dec 2013
Complied
Sec
tor
L2878
5
21
Health Care Centers
The Borrower shall ensure that site selection for all CRHC
and PHC centers to be constructed under the Project is based
upon (a) safety and privacy concerns of patients, particularly
women and children; and (b) convenience for slum dwellers
to maximize access for the poor populations.
Oct 2013
Complied.
Sec
tor
L2878
5
21
The CRHCC and PHCC centers for piloting solar energy
efficiency and rainwater harvesting shall be selected during
the first year of Project implementation based on the criteria
to be agreed upon between the Borrower and ADB.
Dec 2013
The completed new
construction of CRHCC &
PHCC which already been
handed over included solar
energy system.
L2878
5
3
Environment Safeguards
The Borrower shall ensure, and shall cause each
Implementing Agency to ensure, that the preparation, design,
construction, implementation, operation and
decommissioning of the Project and each subproject under the Project comply with (a) all applicable laws and regulations of
the Borrower relating to environment, health, and safety; (b)
the Environmental Safeguards; (c) the EARF; and (d) all
measures and requirements set forth in the IEE and the EMP,
and any corrective or preventative actions set forth in the
Safeguards Monitoring Reports.
Jun 2015
(Ongoing
throughout
implementa
tion)
As per recommendation of
the PMU Environmental
Specialist consultant, steps
have been taken.
En
vir
on
men
tal
L2878
5
4
Involuntary Resettlement Safeguards
The Borrower shall ensure, and shall cause each
Implementing Agency to ensure, that all land and all rights-
of-way required for the Project are made available to the
Works contractor in accordance with schedules agreed under
the related Works contracts. The Borrower shall further
ensure that the Project does not have any impacts with
regards to involuntary resettlement and indigenous peoples
within the meaning of the Safeguard Policy Statement. In the
event that the Project does have any such impacts, the
Borrower shall take, or shall cause each Implementing
Agency to take, all steps required to ensure that the Project
complies with (a) the applicable laws and regulations of the
Borrower, (b) the SPS, and (c) the Resettlement Framework.
Jun 2015
(Ongoing
throughout implementa
tion)
Complied.
En
vir
on
men
tal

Pag
e23
Pro
du
ct
Sch
edu
le
Para
N
o.
Description
Schedule/
Due Date
Status/Remarks
(as on 31 March 2018)
Typ
e
L2878
5
5
Human and Financial Resources to Implement
Safeguards Requirements
The Borrower shall make available, and shall cause each
Implementing Agency to make available, necessary
budgetary and human resources to fully implement the EMP
and the Resettlement Framework, as required.
Jun 2015
(Ongoing
throughout
implementa
tion)
LGD has been
enforcing compliance
of EMP.
En
vir
on
men
tal
L2878
5
6
Safeguards – Related Provisions in Bidding
Documents and Works Contracts The Borrower shall ensure, and shall cause each
Implementing Agency to ensure, that all bidding documents
and contracts for Works contain provisions that require
contractors to:
(a) comply with the measures and requirements relevant to the
contractor set forth in the IEE, the EMP and the Resettlement
Framework (to the extent they concern impacts on
affected people during
construction), and any corrective or preventative Schedule 5,
Section 5.0actions set out in a Safeguards Monitoring Report;
(b) make available a budget for all such environmental and
social safeguards measures; and
(c) provide the Borrower and ADB with a written notice of
any unanticipated environmental and other
safeguards-related risks or impacts that arise during
construction, implementation or operation of the Project
that were not considered in the IEE, the EMP and the
Resettlement Framework.
Jun 2015
(Ongoing
throughout
implementa
tion)
Bidding documents
incorporate the
provisions mentioned.
En
vir
on
men
tal
L2878
5
7
Safeguards Monitoring and Reporting
The Borrower shall do, and shall cause each
Implementing Agency to do, the following:
(a) submit semi-annual Safeguards Monitoring Reports to
ADB and disclose relevant information from such reports to
affected persons promptly upon submission;
(b) if any unanticipated environmental and/or social risks and
impacts arise during construction,
implementation or operation of the Project that were not
considered in the IEE, the EMP and the Resettlement
Framework, promptly inform ADB of the occurrence of such
risks or impacts, with detailed description of the event and
proposed corrective action plan; and
(c) report any actual or potential breach of compliance with
the measures and requirements set forth in the EMP and the
Resettlement Framework promptly after becoming aware of
the breach.
Semi-
annual
No progress
En
vir
on
men
tal

Pag
e24
Pro
du
ct
Sch
edu
le
Para
N
o.
Description
Schedule/
Due Date
Status/Remarks
(as on 31 March 2018)
Typ
e
L2878
5
9
Labor Standards
The Borrower shall ensure, and shall cause each
Implementing Agency to ensure, that the core labor standards
and all applicable laws and regulations of the Borrower and
pertinent occupational health and safety regulations, are
complied with during Project implementation. The Borrower
shall include, and shall cause each Implementing Agency to include, specific provisions in the bidding documents and
contracts financed under the Project requiring that the
contractors, other providers of goods and services and their
subcontractors: (a) comply with the Borrower’s applicable
laws and regulations; (b) do not use child labor; (c) do not
discriminate workers in respect of employment and occupation by providing, inter alia, equal pay for men and
women or people from different ethnic groups for work of
equal value, and to the extent possible, employing women
and local people, including disadvantaged people, living in
the Project area, provided that the requirements for efficiency
are adequately met; (d) do not use forced labor; (e) allow freedom of association and effectively recognize the right to
collective bargaining; and (f) disseminate, or engage
appropriate service providers to disseminate, information on
the risks of sexually transmitted diseases, including
HIV/AIDS, to the employees of contractors engaged under
the Project and to members of the local communities surrounding the Project area, particularly women.
10. The Borrower shall strictly monitor compliance with the
labor standards and provide ADB with regular reports.
Mar 2018
(Ongoing
throughout
implementa
tion)
In progress.
So
cial
L2878
5
11
Gender and Development
The Borrower shall ensure, and shall cause each
Implementing Agency to ensure, that (a) the GAP is
implemented in accordance with its terms; (b) the bidding
documents and contracts include relevant provisions for
contractors to comply with the measures set forth in the GAP;
(c) adequate resources are allocated for the implementation of
the GAP; and (d) key gender outcome and output targets are
monitored regularly and achieved, including, but not limited
to the following: (i) at least 75% of beneficiaries receiving
PHC services in each Partnership Area are women; (ii) at least
20% of PMU staff are women; (iii) at least 40% of recipients
of overseas training under the Project are women; and (iv)
monitoring and evaluation data is disaggregated by sex and
ethnicity
Quarterly
Progress
Report
In progress.
So
cial

Pag
e25
Pro
du
ct
Sch
edu
le
Para
N
o.
Description
Schedule/ Due
Date
Status/Remarks
(as on 31 March 2018)
Ty
pe
L2878
Art
icle
4
4.0
2a
Section 4.02. (a) The Borrower shall (i) maintain separate
accounts and records for the Project; (ii) prepare annual
financial statements for the Project in accordance with
accounting principles acceptable to ADB; (iii) have such
financial statements audited annually by independent auditors
whose qualifications, experience and terms of reference are
acceptable to ADB, in accordance with international
standards for auditing or the national equivalent acceptable
to ADB; (iv) as part of each such audit, have the auditors
prepare a report (which includes the auditors’ opinion on the
use of the Loan proceeds and compliance with the financial
covenants of this Loan Agreement as well as on the use of the
procedures for the imprest account(s) and statement of
expenditures) and a management letter (which sets out the
deficiencies in the internal control of the Project that were
identified in the course of the audit, if any); and (v) furnish to
ADB, no later than 6 months after the end of each related
fiscal year, copies of such audited financial
statements, auditors’ report and management letter, all in the
English language, and such other information concerning
these documents and the audit thereof as ADB shall from time
to time reasonably request.
December
Project management
accounting system to
be improved.
Financial
Management
Specialist consultant
is supporting PMU.
Fin
anci
al
L2878
Art
icle
4
4.0
2b
Section 4.02. (b) ADB shall disclose the annual audited
financial statements for the Project within 30 days of the date
of their receipt by posting them on ADB’s website.
Januarys
ADB to upload the
audited financial
statements on the
ADB website.
Disclosure of APA
is required for all
new projects.
Fin
anci
al
L2878
Art
icle
4
4.0
2c
(c) The Borrower shall enable ADB, upon ADB’s request, to
discuss the financial statements for the Project and the
Borrower's financial affairs where they relate to the Project
with the auditors appointed pursuant to subsection (a)(iii)
hereinabove, and shall authorize and require any
representative of such auditors to participate in any such
discussions requested by ADB. This is provided that such
discussions shall be conducted only in the presence of an
authorized officer of the Borrower, unless the Borrower shall
otherwise agree.
As needed
Being complied.
Fin
anci
al
L2878
Art
icle
4
4.0
3
Section 4.03. The Borrower shall enable ADB's
representatives to inspect the Project, the Goods and Works,
and any relevant records and documents.
As needed
Being complied.
Fin
anci
al

Pag
e26
Pro
du
ct
Sch
edu
le
Para
N
o.
Description
Schedule/
Due Date
Status/Remarks
(as on 31 Mar 2018)
Typ
e
G0298
1
3a
(a) if the amount of the Grant allocated to any Category
appears to be insufficient to finance all agreed expenditures
in that Category, ADB may, by notice to the Recipient, (i)
reallocate to such Category, to the extent required to meet the
estimated shortfall, amounts of the Grant which have been
allocated to another Category but, in the opinion of ADB, are
not needed to meet other expenditures, and (ii) if such
reallocation cannot fully meet the estimated shortfall, reduce
the withdrawal percentage applicable to such expenditures in
order that further withdrawals under such Category may
continue until all expenditures thereunder shall have been
made; and
As needed
Being complied.
Fin
anci
al
G0298
1
3b
(b) if the amount of the Grant allocated to any Category
appears to exceed all agreed expenditures in that Category,
ADB may, by notice to the Recipient, reallocate such excess
amount to any other Category.
As needed
Being complied.
Fin
anci
al
L2878
3
4a
(a) if the amount of the Loan allocated to any Category
appears to be insufficient to finance all agreed expenditures in
that Category, ADB may, by notice to the Borrower, (i)
reallocate to such Category, to the extent required to meet
the estimated shortfall, amounts of the Loan which have
been allocated to another Category but, in the opinion of
ADB, are not needed to meet other expenditures, and (ii) if
such reallocation cannot fully meet the estimated shortfall,
reduce the withdrawal percentage applicable to such
expenditures in order that further withdrawals under such
Category may continue until all expenditures thereunder shall
have been made; and
As needed
Being complied.
Fin
anci
al
L2878
3
4b
(b) if the amount of the Loan allocated to any Category
appears to exceed all agreed expenditures in that Category,
ADB may, by notice to the Borrower, reallocate such excess
amount to any other Category.
As needed
Being complied.
Fin
anci
al
G0298
1
4
Disbursement Procedures
Except as ADB may otherwise agree, the Grant proceeds
shall be disbursed in accordance with the Loan
Disbursement Handbook.
March 2018
(throughout
project
period)
Being complied.
Fin
anci
al
L2878
3
5
Disbursement Procedures
Except as ADB may otherwise agree, the Loan proceeds shall
be disbursed in accordance with the Loan Disbursement
Handbook.
March 2018
(throughout
project
period)
Being complied.
Fin
anci
al

Pag
e27
Pro
du
ct
Sch
edu
le
Para
N
o.
Description
Schedule/
Due Date
Status/Remarks
(as on 31 Mar 2018)
Typ
e
G0298
1
5a
Imprest Account and Statement of Expenditures
Except as ADB may otherwise agree, the Recipient shall
establish, or cause to be established, immediately after the
Effective Date, (i) a first generation imprest account for
LGD at the Bangladesh Bank, and (ii) a second generation
imprest account for each Implementing Agency at a
commercial bank acceptable to ADB (collectively, imprest
accounts). The imprest accounts shall be established,
managed, replenished and liquidated in accordance with
ADB’s Loan Disbursement Handbook and detailed
arrangements agreed upon between the Recipient and ADB.
The imprest accounts shall only be used for the purposes of
the Project. The currency of the first generation imprest
account shall be the Dollar, and the currency of the second
generation imprest accounts shall be the Taka. The aggregate
amount to be deposited into the imprest accounts shall not
exceed the lower of (i) the estimated expenditure to be
financed from the imprest accounts for the 6 months of
Project implementation, or (ii) the equivalent of 10% of the
Grant amount.
Dec 2012
Complied.
Fin
anci
al
G0298
1
6
The statement of expenditures procedure may be used for
reimbursement of eligible expenditures and to liquidate
advances provided into the imprest account, in accordance
with the Loan Disbursement Handbook and detailed
arrangements agreed upon between the Recipient and ADB.
Any individual payment to be reimbursed shall not exceed
the equivalent of
$100,000.
March 2018
Being complied.
Fin
anci
al
L2878
3
6a
Except as ADB may otherwise agree, the Borrower shall
establish, or cause to be established, immediately after the
Effective Date, (i) a first generation imprest account for LGD
at the Bangladesh Bank, and (ii) a second generation imprest
account for each Implementing Agency at a commercial bank
acceptable to ADB (collectively, imprest accounts). The
imprest accounts shall be established, managed, replenished
and liquidated in accordance with ADB's Loan Disbursement
Handbook and detailed arrangements agreed upon between
the Borrower and ADB. The imprest accounts shall only be
used for the purposes of the Project. The currency of the first
generation imprest account shall be the Dollar, and the
currency of the second generation imprest accounts shall be
the Taka. The aggregate amount to be deposited into the
imprest accounts shall not exceed the lower of (i) the
estimated expenditure to be financed from the imprest
accounts for 6 months of Project implementation, or (ii) the
equivalent of 10% of the Loan amount.
Dec 2012
Complied.
Fin
anci
al

Pag
e28
Pro
du
ct
Sch
edu
le
Para
N
o.
Description
Schedule/
Due Date
Status/Remarks
(as on 31 Mar 2018)
Typ
e
L2878
3
6b
(c) The statement of expenditures procedure may be used for
reimbursement of eligible expenditures and to liquidate
advances provided into the imprest account, in accordance
with Loan Disbursement Handbook and detailed
arrangements agreed upon between the Borrower and ADB.
Any individual payment to be reimbursed shall not exceed
the equivalent of
$100,000.
Mar 2018
Being complied.
Fin
anci
al
G0298
1
7
Retroactive Financing
Withdrawals from the Grant Account may be made for
reimbursement of reasonable expenditures incurred under the
Project before the Effective Date, but not earlier than 12
months before the date of this Grant Agreement in connection
with procurement for the Partnership Agreements under Part
B of the Project, subject to a maximum amount equivalent
to 20% of the Grant amount.
Dec 2012
Being complied.
Fin
anci
al
L2878
3
7
Retroactive Financing
Withdrawals from the Loan Account may be made for
reimbursement of reasonable expenditures incurred under
the Project before the Effective Date, but not earlier than
12 months before the date of this Loan Agreement in
connection with procurement for the Partnership Agreements
under Part B of the Project, subject to a maximum amount
equivalent to 20% of the Loan amount.
Dec 2012
Being complied.
Fin
anci
al
L2878
5
5
Counterpart Support
The Borrower shall ensure timely provision of counterpart
funds for the Project by making timely submission of annual
budgetary appropriation requests and ensuring prompt
disbursement of appropriated funds during each year of the
Project implementation.
Quarterly
Progress
Report
Being complied.
Fin
anci
al
L2878
Art
icle
4
4.0
5a
The Borrower shall exercise its rights under the financing
arrangements with the Implementing Agencies in such a
manner as to protect the interests of the Borrower and ADB
and to accomplish the purposes of the Loan. (b) No rights or
obligations under the financing arrangements shall be
assigned, amended, or waived without the prior concurrence
of ADB.
March 2018
Being complied.
Eco
no
mic
L2878
5
13
Governance and Anti-Corruption
The Borrower shall, and shall cause each Implementing
Agency to, (i) comply with ADB’s Anticorruption Policy
(1998, as amended to date) and acknowledge that ADB
reserves the right to investigate directly, or through its agents,
any alleged corrupt, fraudulent, collusive or coercive practice
relating to the Project; and (ii) cooperate with any such
investigation and extend all necessary assistance for
satisfactory completion of such investigation.
March 2018
Being complied.
Eco
no
mic
Pag
e29
Pro
du
ct
Sch
edu
le
Para
N
o.
Description
Schedule/
Due Date
Status/Remarks
(as on 31 December
2018)
Typ
e
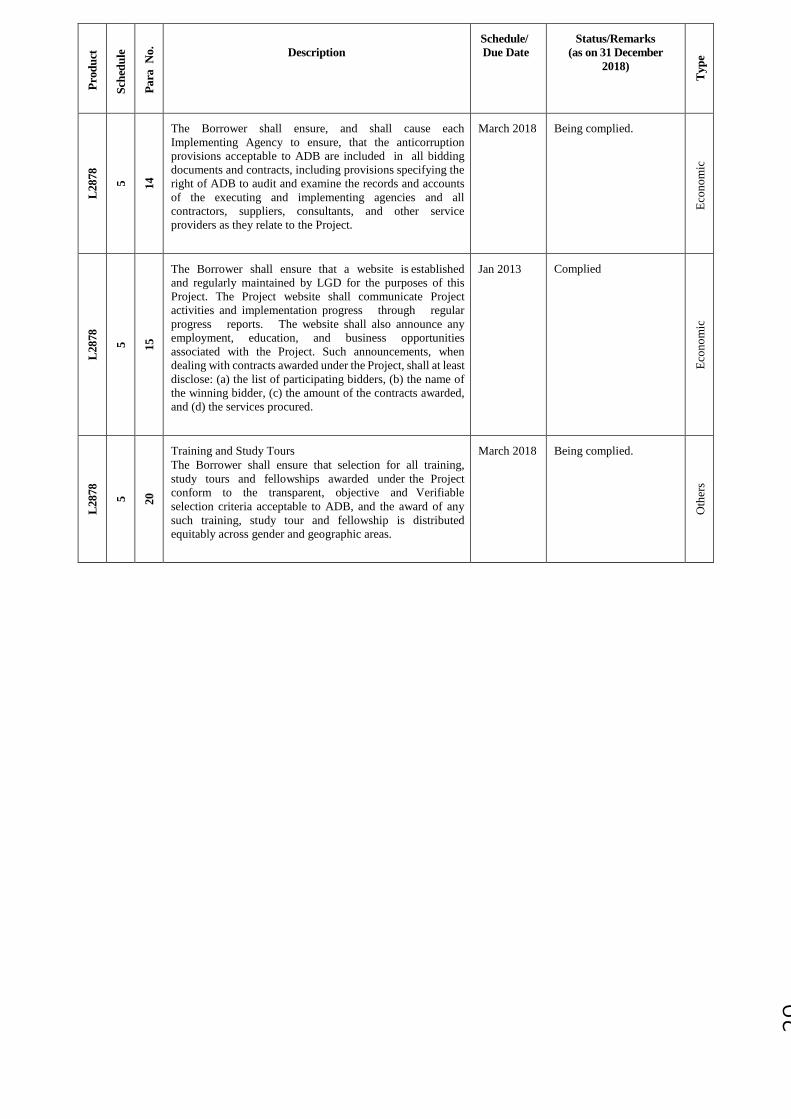
L2878
5
14
The Borrower shall ensure, and shall cause each
Implementing Agency to ensure, that the anticorruption
provisions acceptable to ADB are included in all bidding
documents and contracts, including provisions specifying the
right of ADB to audit and examine the records and accounts
of the executing and implementing agencies and all
contractors, suppliers, consultants, and other service
providers as they relate to the Project.
March 2018
Being complied.
Eco
no
mic
L2878
5
15
The Borrower shall ensure that a website is established
and regularly maintained by LGD for the purposes of this
Project. The Project website shall communicate Project
activities and implementation progress through regular
progress reports. The website shall also announce any
employment, education, and business opportunities
associated with the Project. Such announcements, when
dealing with contracts awarded under the Project, shall at least
disclose: (a) the list of participating bidders, (b) the name of
the winning bidder, (c) the amount of the contracts awarded,
and (d) the services procured.
Jan 2013
Complied
Eco
no
mic
L2878
5
20
Training and Study Tours
The Borrower shall ensure that selection for all training,
study tours and fellowships awarded under the Project
conform to the transparent, objective and Verifiable
selection criteria acceptable to ADB, and the award of any
such training, study tour and fellowship is distributed
equitably across gender and geographic areas.
March 2018
Being complied.
Oth
ers

Pag
e30
PROGRESS REPORT OF GENDER ACTION PLAN (GAP)
Project Title: Urban Primary Health Care Services Delivery Project (UPHCSDP)
Date of Update: January 2018– March 2018 Submission Date: May 15, 2018
Agency: 25 Partnership Agreements of under Local Government Division, Ministry of
LGRD&C, Bangladesh
Timeframe: July 2012 to Mar 2018
Gender Category: GEN
Project Impact: Improved health status of the urban population, especially the poor in the ten
city corporations and four municipalities
Project Outcome: Improve access to and use of efficient, effective and sustainable good
quality primary health care services for the poor in urban areas covered by the project with a
particular focus on women and girls.
Whether there is a Gender Action Plan: Yes (inherited from previous phase)
Is there a gender specialist: Not available from February 2015 (Contract terminated in Jan
2015)
If not, how gender mainstreaming is supported: Since the project GAP is very much target
oriented for women, men, adolescent (boys and girls) and children with specified service
delivery system, officials of the project have been implementing GAP activities as per plan.
Acting Deputy Project Direct (Service Delivery) has been playing as the Focal Point role for
GAP implementation with active support from the BCC and Research Officer.

Pag
e31
ACTIVITIES OF GENDER ACTION PLAN (January-March 2018)
Activities. Indicators and Targets Progress of
Reporting
Quarter
Cumulative Progress Qualitative aspects of Accomplished
activities and Comments /
Explanations
Output 1: Strengthened institutional governance and local government capacity to sustainably deliver urban PHC services
1.1: Strengthened strategy and coordination framework for urban PHC
Activity:
Orientation and preparation of target – Oriented GAP
implementation plan conducted at all relevant levels.
Training curriculum developed in line with gender in
MCH and PHC, RH, ARH
(i) Module 1 for management levels
(ii) Module 2 for field level personnel
(iii) Module 3 for Training of Trainers(TOT) and
training imparted to management staff of PMU, PIU,
CCS, municipalities and PA NGOs.
TOT provided to core gender trainers of PA-NGO’s
Indicators & Target: PMU, PA-NGOs, CCs, PIU develop and own gender
action plan at their level.
At least three training modules developed
100% management staff of PMU/PIU, including
Account Officers receives Gender Training.
At least 80% of management level personnel of
CRHCCs and PHCC receive gender training.
Selected management staff of PA-NGO receives
Training.
Each PA, CC/PIU, PMU should have at least one
trained Gender Trainers
January-March
2018
The Project has a Gender Action
Plan (GAP) where PMU, PIU &
PA-NGO follow it as per rules.
At PMU & PIU level, PMU doesn’t
conduct any Training program.
Training is conducted by various
institutes and PMU & PIU follow
their developed module. At PA-
NGO level, 60% of PA-NGOs have
developed their own three training
modules.
At PA-NGO level, 48% of PA-
NGOs have their own trained
Gender Trainer.
90% management staff of
PMU/PIU, including Account
Officers have received Gender
Training.
78% of management level personnel
of CRHCCs and PHCC have
received gender training.

Pag
e32
1.2 Strengthened institutional and management capacity of LGD/ULBs for Urban PHC
Activity: Strengthened institutional and management capacity of
LGD/ULBs for Urban PHC
Indicators & Target:
All PA-NGOs’ HR policies comply with national HR
policy within 2 years of engagement.
All PMU, PIU & PA-NGOs HR
policies comply with national HR
policy.
1.3 Strengthen local ownership of and commitment to, urban PHC
Activity: Gender Coordination committee functioning at the
City Corp/Municipality level
Indicators & Target:
Committee formed in all partner IAs led by a female.
Counselor and consisting of representative form, PIU,
PA-NGOs and terms of reference developed.
At least 90% of Gender Coordination Committee
decisions carried out with reporting.
Gender & health issues are
discussed at monthly Coordination
meeting regularly in City
Corporation level.
1.4. Management Systems, Learning and innovations in Urban PHC
Activity: Project is monitored as per sex disaggregated data and
gender responsive indicator and shared on
HMIS/Website.
All operation research studies look into gender issues
and two studies conducted with specific focus on
gender aspects of PHC
Indicators & Target:
Project is monitored as per sex disaggregated data and
gender responsive indicator and shared on
HMIS/Website.
All operation research studies look into gender issues
and two studies conducted with specific focus on
gender aspects of PHC
The Project has an HMIS that is
entirely gender responsive and the
indicators for data collection system
at bottom level is totally gender
based. The QPR published at
quarterly basis is uploaded on the
project website.
The Operations Research consulting
firm icddr,b has been appointed on
8 July 2015. They are working as
per GAP and each of the four
studies are conducted with specific
focus on gender aspects of PHC.
Pag
e33
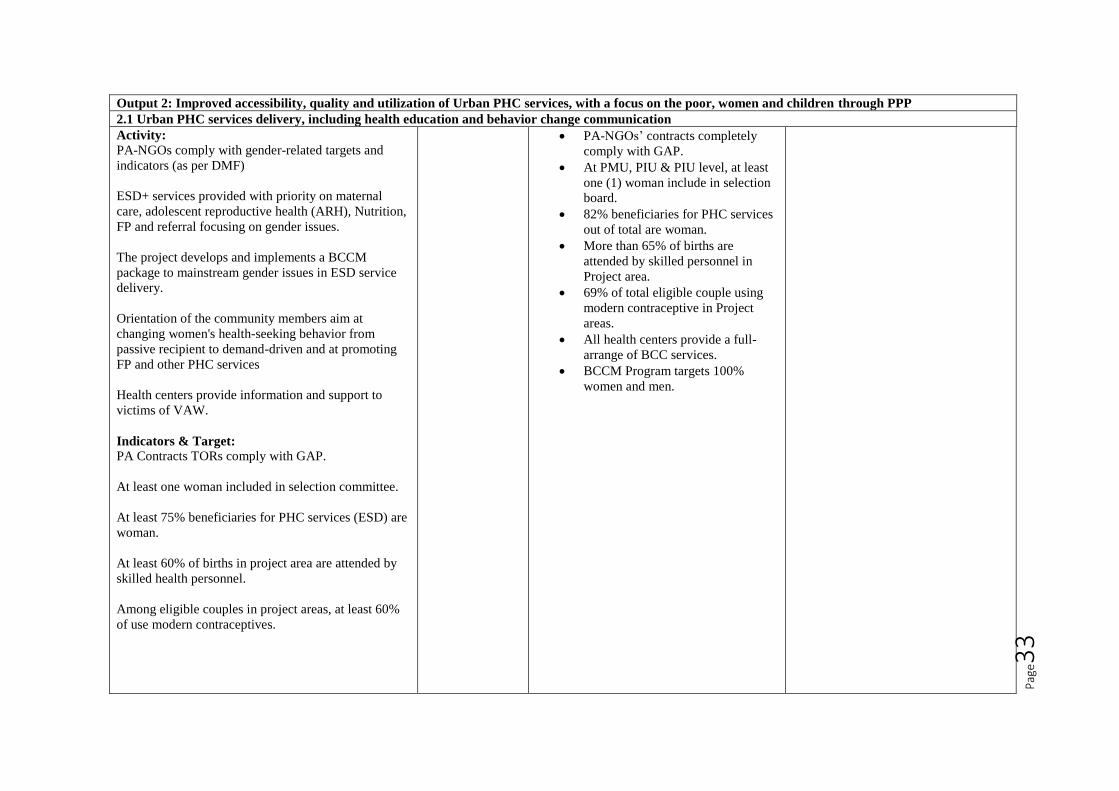
Output 2: Improved accessibility, quality and utilization of Urban PHC services, with a focus on the poor, women and children through PPP
2.1 Urban PHC services delivery, including health education and behavior change communication
Activity: PA-NGOs comply with gender-related targets and
indicators (as per DMF)
ESD+ services provided with priority on maternal
care, adolescent reproductive health (ARH), Nutrition,
FP and referral focusing on gender issues.
The project develops and implements a BCCM
package to mainstream gender issues in ESD service
delivery.
Orientation of the community members aim at
changing women's health-seeking behavior from
passive recipient to demand-driven and at promoting
FP and other PHC services
Health centers provide information and support to
victims of VAW.
Indicators & Target: PA Contracts TORs comply with GAP.
At least one woman included in selection committee.
At least 75% beneficiaries for PHC services (ESD) are
woman.
At least 60% of births in project area are attended by
skilled health personnel.
Among eligible couples in project areas, at least 60%
of use modern contraceptives.
PA-NGOs’ contracts completely
comply with GAP.
At PMU, PIU & PIU level, at least
one (1) woman include in selection
board.
82% beneficiaries for PHC services
out of total are woman.
More than 65% of births are
attended by skilled personnel in
Project area.
69% of total eligible couple using
modern contraceptive in Project
areas.
All health centers provide a full-
arrange of BCC services.
BCCM Program targets 100%
women and men.

Pag
e34
2.2 Effective reaching of the Urban poor
Activity: Identify the poor men and women groups, particularly
in slums, and among floating people and PHC services
provided by PA-NGOs.
PHC services provided by PA-NGOs.
Indicators & Target: At least 30% each major UPHCP healthcare services
are provided (75% women) free of charge to identified
poor.
At least 80% of poor households are properly
identified as eligible for receiving ‘red cards’.
Functional outreach services provided to 100% of
pavement dwellers and floating people through mobile
and mini clinics and outreach workers as per times of
clinic operations set in consultations with women and
men in the community.
78% of poor woman red card
holders are getting services out of
total red card holder.
90% of poor households are
properly identified as eligible for
receiving red card in project area.
Outreach Services provided 100%
of pavement dwellers & floating
people through Satellite Clinic and
operations set in consultations with
women and men in the community.
2.3 Ensuring quality of PHC services
Activity: “One stop” information website provides availability
of services for women and reports based on sex
disaggregated data.
PA-NGOs given training on gender sensitization and
the gender issues of PHC services, motivation,
organization and different BCCM packages.
Gender perspective is integrated in all health care
training curriculum.
Indicators & Target: 100% compliance of PA-NGOs performance-linked
bonus scheme indicators.
100% field-level service providers of NGO receiving
training.
Project website includes QPRs that
contain Service Statistics with sex
disaggregated data.
100% of field-level service
providers receives training on
Gender issues.
All health care training is 100%
gender responsive.

Pag
e35
All health care training curriculums are gender
responsive.
2.4. Access to urban PHC services through improved infrastructure network
Activity:
Building designs comply with women's needs.
Poor women and men are employed in construction of
infrastructure facilities.
Gender-related core labor standards clause
incorporated in bid documents.
Contractor are oriented on core labor standards (equal
wages, water, sanitation, health and safety).
Indicators & Target:
100% health facilities have provision for separate
toilets (high commode) for women and women’s
privacy and breastfeeding corner.
Bid document includes clause on gender related core
labor standards.
At least 20% of the unskilled laborers are women.
Equal wages paid to woman and men for work of
equal value by all contractors.
100% of separate toilet & breast-
feeding corner for woman provision
are implementing at PMU, PIU &
PA-NGO level.
Bid document includes clause on
gender related core labor standards.
At least 14% of the unskilled labor
are women.
Paid equal wages to women labor
and follow equal value by all
contractors.
Output 3: Effective support for decentralized project management
3.1 Core Project management Staff
Activity: Female staff recruited for management and other
levels
Respective staff is assigned with responsibilities for
GAP implementation
Indicators & Target:
At least 20% women recruited at management,
technical and support staff levels in PMU, PIU, PA-
NGOs.
At PMU, PIU & PA-NGO level
remarkably 73% of total staff are
recruited female.
Staff recruited by PMU, PIU
carrying out gender responsibilities
through team or individual
assignment.
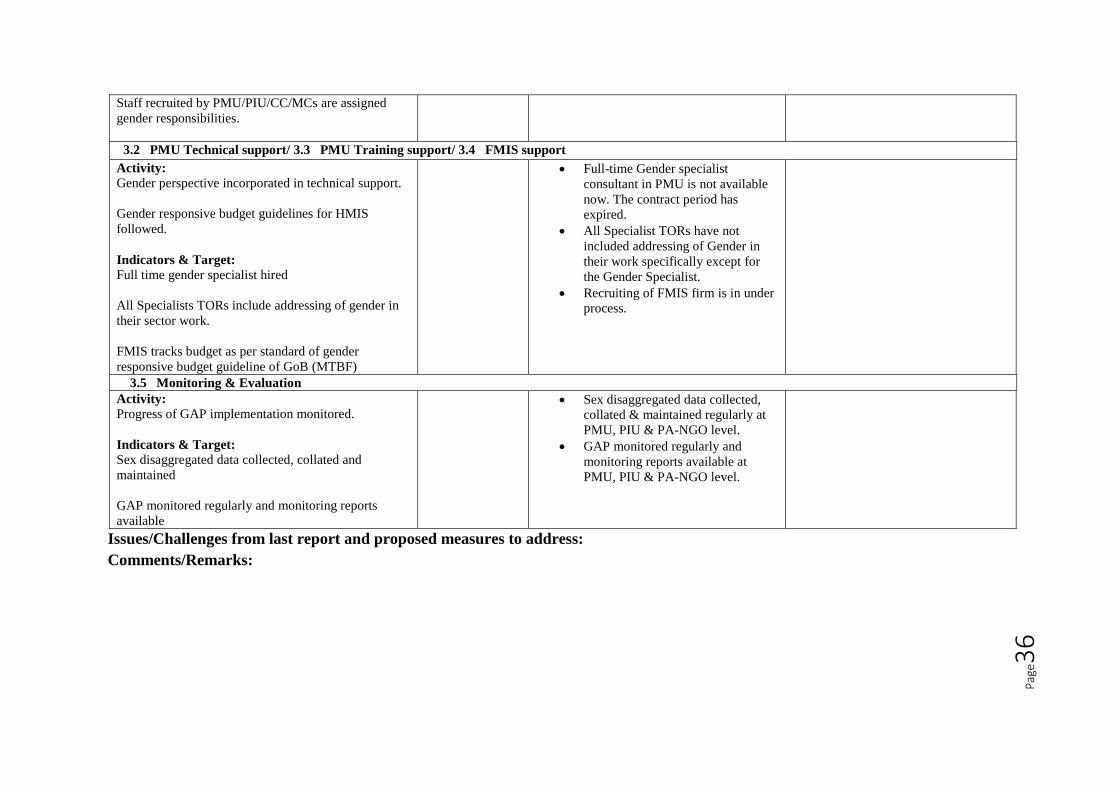
Pag
e36
Staff recruited by PMU/PIU/CC/MCs are assigned
gender responsibilities.
3.2 PMU Technical support/ 3.3 PMU Training support/ 3.4 FMIS support
Activity: Gender perspective incorporated in technical support.
Gender responsive budget guidelines for HMIS
followed.
Indicators & Target: Full time gender specialist hired
All Specialists TORs include addressing of gender in
their sector work.
FMIS tracks budget as per standard of gender
responsive budget guideline of GoB (MTBF)
Full-time Gender specialist
consultant in PMU is not available
now. The contract period has
expired.
All Specialist TORs have not
included addressing of Gender in
their work specifically except for
the Gender Specialist.
Recruiting of FMIS firm is in under
process.
3.5 Monitoring & Evaluation
Activity: Progress of GAP implementation monitored.
Indicators & Target: Sex disaggregated data collected, collated and
maintained
GAP monitored regularly and monitoring reports
available
Sex disaggregated data collected,
collated & maintained regularly at
PMU, PIU & PA-NGO level.
GAP monitored regularly and
monitoring reports available at
PMU, PIU & PA-NGO level.
Issues/Challenges from last report and proposed measures to address:
Comments/Remarks:
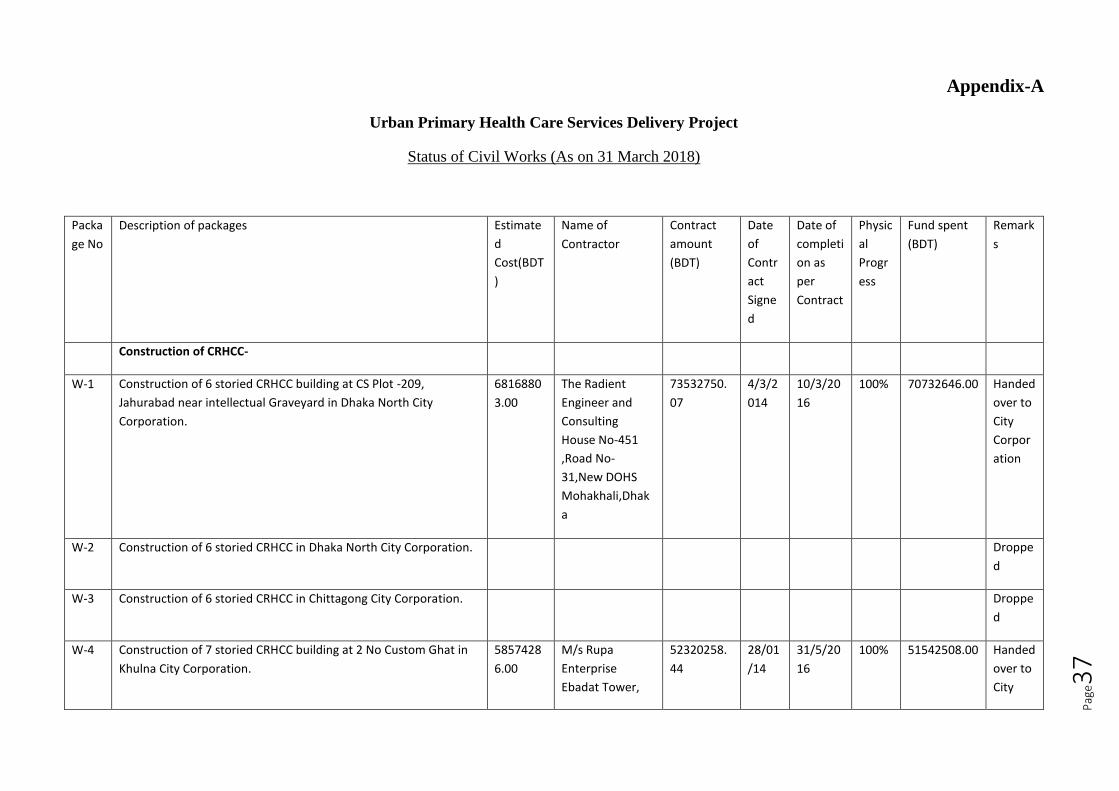
Pag
e37
Appendix-A
Urban Primary Health Care Services Delivery Project
Status of Civil Works (As on 31 March 2018)
Packa
ge No
Description of packages Estimate
d
Cost(BDT
)
Name of
Contractor
Contract
amount
(BDT)
Date
of
Contr
act
Signe
d
Date of
completi
on as
per
Contract
Physic
al
Progr
ess
Fund spent
(BDT)
Remark
s
Construction of CRHCC-
W-1 Construction of 6 storied CRHCC building at CS Plot -209,
Jahurabad near intellectual Graveyard in Dhaka North City
Corporation.
6816880
3.00
The Radient
Engineer and
Consulting
House No-451
,Road No-
31,New DOHS
Mohakhali,Dhak
a
73532750.
07
4/3/2
014
10/3/20
16
100% 70732646.00 Handed
over to
City
Corpor
ation
W-2 Construction of 6 storied CRHCC in Dhaka North City Corporation. Droppe
d
W-3 Construction of 6 storied CRHCC in Chittagong City Corporation. Droppe
d
W-4 Construction of 7 storied CRHCC building at 2 No Custom Ghat in
Khulna City Corporation.
5857428
6.00
M/s Rupa
Enterprise
Ebadat Tower,
52320258.
44
28/01
/14
31/5/20
16
100% 51542508.00 Handed
over to
City

Pag
e38
Boishakhi Super
Market,
Shiromony
Bazar, Khulna
Corpor
ation
W-5 Construction of 6 storied CRHCC building at Tikapara adjacent to
UCEF school in Rajshahi City Corporation.
6856196
2.00
FU-DE (JV)
Upashahar,
Sapura, Rajshahi
59931665.
63
26/02
/14
2/10/20
16
100% 54822732.00 Fund
neede.
Handed
over to
City
Corpor
ation
W-6 Construction of 6 storied CRHCC building at Bandar Shahi Masjid
Road in Narayanganj City Corporation.
6835944
2.00
M/s Ahasan
Enterprise & M/s
M R
Construction JV
60(Old), 78(New)
Shahsuja Road,
Paikpara,
Narayanganj
74857805.
19
20/01
/14
31/12/2
015
100% 73156826.00 Handed
over to
City
Corpor
ation
W-7 Construction of 6 storied CRHCC in Gazipur City Corporation. 6240125
9.00
M/s Iqbal
Trading
Corporation,
Tezgaon Dhaka
62149661.
63
12/6/
2016
28/2/18 90% 19478451.00 Fund
needed
W-8 Construction of 6 storied CRHCC building at Dhirasom
Dakkhinkhan to Kolar Bazar road in Gazipur City Corporation.
6171827
5.00
MDJ Associates
House#08, Road
#10,
Sector#06,Uttara
, Dhaka-1230.
66597535.
70
19/03
/14
30/6/16 100% 66530851.00 Handed
over to
City
Corpor
ation

Pag
e39
W-9 Construction of 6 storied CRHCC building at East Khasbag
(Mahiganj near Satmatha) in Rangpur City Corporation.
6044771
6.00
SCAN-MAA (JV)
House No-1&2,
Road No-
4(Concord
Arcadia
Shopping Mall) ,
Dhanmandi,
Dhaka-1205
54225711.
91
11/3/
2014
30/05/1
7
100% 51098304.00 Fund
needed
Packa
ge No
Description of packages Estimate
d
Cost(BDT
)
Name of
Contractor
Contract
amount
(BDT)
Date
of
Contr
act
Signe
d
Date of
completi
on as
per
Contract
Physic
al
Progr
ess
Fund spent
(BDT)
Remark
s
W-10 Construction of 6 storied CRHCC building at Millpara Moha
Shoshan Road in Kushtia Municipality.
6151034
7.00
Mondol-NI-SH
(JV) 63/1,L.C.A
Road, Amlapara
,Kushtia.
67593691.
20
12/2/
2014
10/8/20
16
100% 59401685.00 Handed
over to
City
Corpor
ation
W-11 Construction of 6 storied CRHCC building at Harua in Kishoreganj
Municipality.
6994594
3.00
MSE-MRK (JV)
Solakia,
Kishoreganj.
65380215.
84
3/11/
2014
9/2/201
6
100% 53003600.00 Handed
over to
City
Corpor
ation
Fund
needed
W-12 Construction of 6 storied CRHCC building at Pourashava
Compound (Kuadanga Bus Stand) in Gopalganj Municipality.
6867758
9.00
M/s Sajib
Enterprise (JV)
Gopalganj.
60821764.
33
26/02
/14
30/6/16 100% 55783734.00 Handed
over to
City
Corpor
ation.
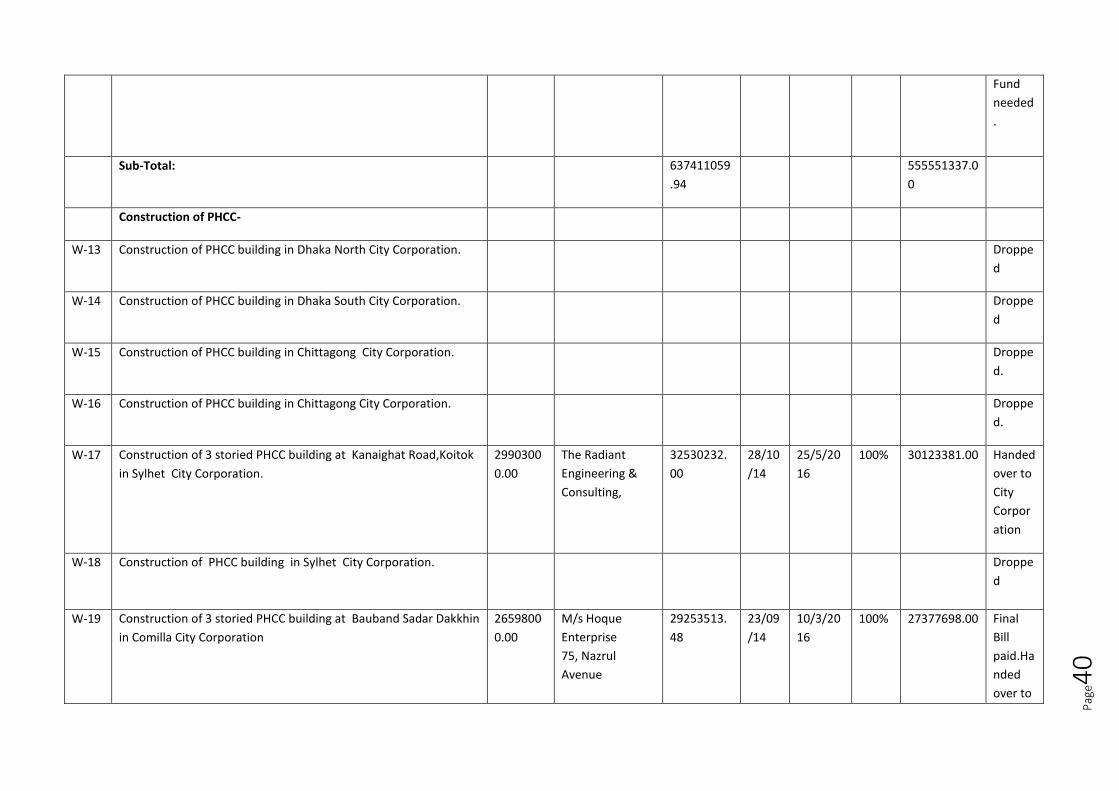
Pag
e40
Fund
needed
.
Sub-Total: 637411059
.94
555551337.0
0
Construction of PHCC-
W-13 Construction of PHCC building in Dhaka North City Corporation. Droppe
d
W-14 Construction of PHCC building in Dhaka South City Corporation. Droppe
d
W-15 Construction of PHCC building in Chittagong City Corporation. Droppe
d.
W-16 Construction of PHCC building in Chittagong City Corporation. Droppe
d.
W-17 Construction of 3 storied PHCC building at Kanaighat Road,Koitok
in Sylhet City Corporation.
2990300
0.00
The Radiant
Engineering &
Consulting,
32530232.
00
28/10
/14
25/5/20
16
100% 30123381.00 Handed
over to
City
Corpor
ation
W-18 Construction of PHCC building in Sylhet City Corporation. Droppe
d
W-19 Construction of 3 storied PHCC building at Bauband Sadar Dakkhin
in Comilla City Corporation
2659800
0.00
M/s Hoque
Enterprise
75, Nazrul
Avenue
29253513.
48
23/09
/14
10/3/20
16
100% 27377698.00 Final
Bill
paid.Ha
nded
over to

Pag
e41
Kandirpar,
Comilla
City
Corpor
ation
W-20 Construction of 3 storied PHCC building at Dulipara, Dakkhin
Rasulpur in Comilla City Corporation.
3074600
0.00
M/s Hoque
Enterprise
75, Nazrul
Avenue
Kandirpar,
Comilla
33811258.
00
23/09
/14
10/3/20
16
100% 33176209.00 Do
Packa
ge No
Description of packages Estimate
d
Cost(BDT
)
Name of
Contractor
Contract
amount
(BDT)
Date
of
Contr
act
Signe
d
Date of
completi
on as
per
Contract
Physic
al
Progr
ess
Fund spent
(BDT)
Remark
s
W-21 Construction of 3 storied PHCC building at Sadar Dakkhin
Kamalapur in Comilla City Corporation.
3027700
0.00
M/s Hoque
Enterprise
75, Nazrul
Avenue
Kandirpar,
Comilla
33285280.
00
23/9/
14
10/3/20
16
100% 32731855.00 Handed
over to
City
Corpor
ation
W-22 Construction of 3 storied PHCC building at Laxmon Khola in
Narayanganj City Corporation.
3081700
0.00
SCAN-MAA (JV)
349/a,East Goran
Dhaka-1219.
33653369.
00
15/10
/14
15/7/16 100% 33422582.00 Do
W-23 Construction of 3 storied PHCC building at Godnail in Narayanganj
City Corporation.
2961400
0.00
M/s Ahsan
Enterprise & S R
Enterprise (JV)
60, Shahsuja
32393638.
20
15/10
/14
30/6/16 100% 32125644.00 Do

Pag
e42
Road, Paikpara,
Narayanganj
W-24 Construction of 3 storied PHCC building at Bara Dewbhog in
Narayanganj City Corporation.
2998500
0.00
M/s Asif &
Brothers
Murapara,
Rupganj,
Narayanganj.
32837842.
36
15/10
/14
15/07/1
6
100% 32593334.00 Do
W-25 Construction of 3 storied PHCC building at Neelerpara in Gazipur
City Corporation.
2696100
0.00
AE-FE-AFEC(JV)
F/180 ,North
Sayabithi,
Joydebpur,Gazip
ur
29202268.
48
9/10/
2014
30/12/2
016
100% 25404768.00 Handed
over to
City
Corpor
ation.
Fund
needed
.
W-26 Construction of 3 storied PHCC building at Laxmipura (Teen Sarak)
in Gazipur City Corporation.
2702000
0.00
M/S The Radiant
Engineering &
Consulting 24,
Mirpur Road, JA-
17, Globe
Shoping Centre,
Dhaka.
29059930.
31
13/10
/14
30/6/20
16
100% 28565261.00 Handed
over to
City
Corpor
ation.
W-27 Construction of PHCC in Gazipur City Corporation. Droppe
d
W-28 Construction of PHCC in Gazipur City Corporation. Droppe
d

Pag
e43
W-29 Construction of 3 storied PHCC building at Shommanipur in
Rangpur City Corporation.
2599700
0.00
M/S Rabeya
Enterprise &
Md.Abu Taleb
Milu(JV) New
Engineerpara,
Rangpur
27549172.
93
2/7/2
015
28/3/20
17
100% 22683212.00 Fund
needed
W-30 Construction of 3 storied PHCC building at Ershad Nagar in
Rangpur City Corporation.
2650800
0.00
SMAH-GME&
RC(JV), Rangpur
28093754.
93
29/6/
15
28/2/20
17
100% 27791615.00 Handed
over to
City
Corpor
ation.
Fund
needed
.
W-31 Construction of 3 storied PHCC building at New Jummapara in
Rangpur City Corporation.
2902500
0.00
M/S Taz Monjil
Kamal Kachna,
Rangpur
30749850.
61
29/6/
15
30/12/2
016
100% 29709894.00 Handed
over to
City
Corpor
ation.
Fund
needed
.
Packa
ge No
Description of packages Estimate
d
Cost(BDT
)
Name of
Contractor
Contract
amount
(BDT)
Date
of
Contr
act
Signe
d
Date of
completi
on as
per
Contract
Physic
al
Progr
ess
Fund spent
(BDT)
Remark
s
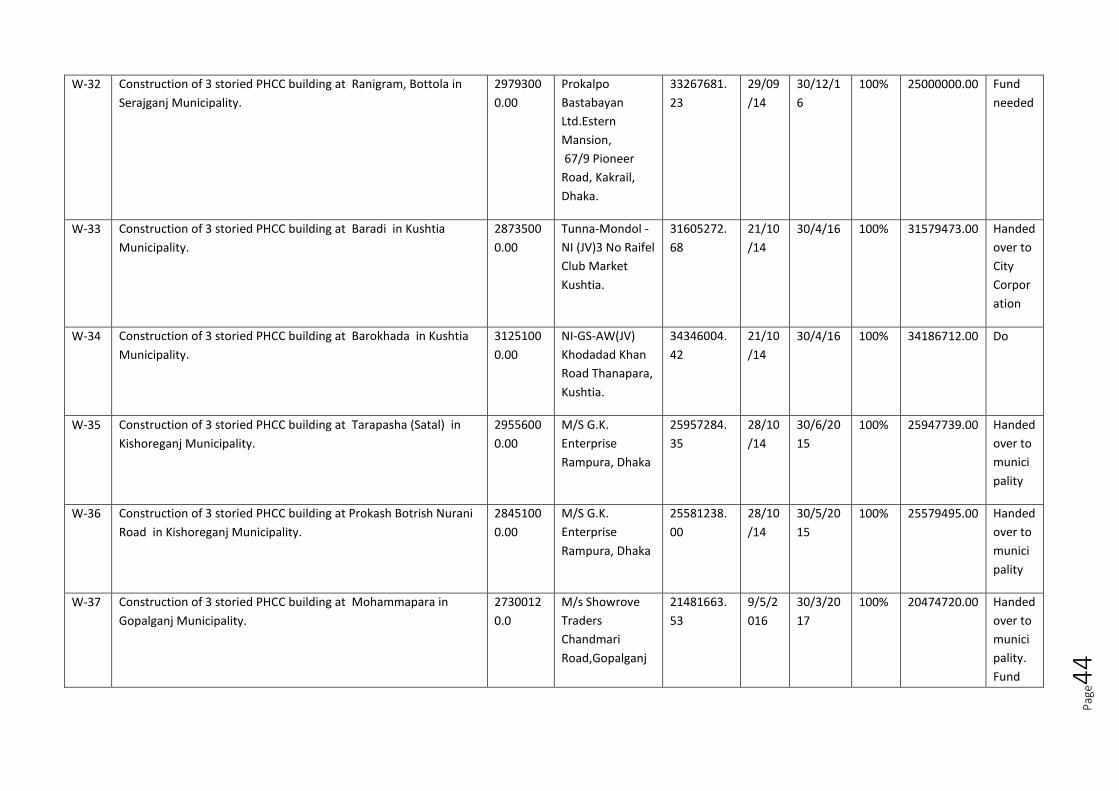
Pag
e44
W-32 Construction of 3 storied PHCC building at Ranigram, Bottola in
Serajganj Municipality.
2979300
0.00
Prokalpo
Bastabayan
Ltd.Estern
Mansion,
67/9 Pioneer
Road, Kakrail,
Dhaka.
33267681.
23
29/09
/14
30/12/1
6
100% 25000000.00 Fund
needed
W-33 Construction of 3 storied PHCC building at Baradi in Kushtia
Municipality.
2873500
0.00
Tunna-Mondol -
NI (JV)3 No Raifel
Club Market
Kushtia.
31605272.
68
21/10
/14
30/4/16 100% 31579473.00 Handed
over to
City
Corpor
ation
W-34 Construction of 3 storied PHCC building at Barokhada in Kushtia
Municipality.
3125100
0.00
NI-GS-AW(JV)
Khodadad Khan
Road Thanapara,
Kushtia.
34346004.
42
21/10
/14
30/4/16 100% 34186712.00 Do
W-35 Construction of 3 storied PHCC building at Tarapasha (Satal) in
Kishoreganj Municipality.
2955600
0.00
M/S G.K.
Enterprise
Rampura, Dhaka
25957284.
35
28/10
/14
30/6/20
15
100% 25947739.00 Handed
over to
munici
pality
W-36 Construction of 3 storied PHCC building at Prokash Botrish Nurani
Road in Kishoreganj Municipality.
2845100
0.00
M/S G.K.
Enterprise
Rampura, Dhaka
25581238.
00
28/10
/14
30/5/20
15
100% 25579495.00 Handed
over to
munici
pality
W-37 Construction of 3 storied PHCC building at Mohammapara in
Gopalganj Municipality.
2730012
0.0
M/s Showrove
Traders
Chandmari
Road,Gopalganj
21481663.
53
9/5/2
016
30/3/20
17
100% 20474720.00 Handed
over to
munici
pality.
Fund

Pag
e45
needed
.
W-38 Construction of 3 storied PHCC building at Miapara in Gopalganj
Municipality.
2660719
1.00
M/s Showrove
Traders
Chandmari
Road,Gopalganj
20867191.
54
9/5/2
016
30/3/20
17
100% 16725900.00 Handed
over to
munici
pality.
Fund
needed
.
Sub-Total: 565526446
.05
535199492.0
0
Packa
ge No
Description of packages Estimate
d
Cost(BDT
)
Name of
Contractor
Contract
amount
(BDT)
Date
of
Contr
act
Signe
d
Date of
completi
on as
per
Contract
Physic
al
Progr
ess
Fund spent
(BDT)
Remark
s
Maintenance:

Pag
e46
W41.
1
Maintenance of PHCC at (1) Narinda-Ward No-7 (2) Balur Math-
Ward No-83 (3) East Jurain-Ward No-59 (4)Nolgola Rajbari-Ward
No-66 (5) Moulovi Bazar-Ward No-67 (6) Mazed Sarder
Community Centre-Ward No-69 (7) Ward No-77 near Shahid
Matiur Rahman School at (8) Lalkuti-Ward No-79 (9) Bakshi Bazar -
Ward No-63 & CRHCC at (10) Dhalpur-Ward No-85 in DSCC
4073878.
00
M/s Maz
Business
Syndicate
Prop: Md.
Asaduzzaman
79/2/3 West
Agargaon
Dhaka-1207.
4328000.9
2
21/04
/14
27/10/1
4
100% 4328000.00 i8
W41.
2
Maintenance of PHCC at (1) Kalu Nagar-Ward No-58 (2)
Nawabgonj-Ward No-59 (3) Azimpur-Ward No-59 (4) Shahid
Nagar-Ward No-60 (5)Shahid Nagar ( Bou Bazar ) -Ward No-60
(6)Rasul Bagh Park-Ward No-62 (7) Ward No-65 near Islam Bagh
Community Centre (8) Chadni Ghat-Ward No-65 & CRHCC at (9)
Mukdapara -Ward No-29 (10)Hazari Bagh-Ward No-58 in DSCC.
4604752.
00
M/s Maz
Business
Syndicate
Prop: Md.
Asaduzzaman
79/2/3 West
Agargaon
Dhaka-1207.
4916996.8
5
20/04
/14
26/10/1
4
100% 4915841.00
W41.
3
Maintenance of PHCC at (1) Uttara-Ward No-01(2) Mirpur-1-Ward
No-08 (3) Naki Para, Mirpur-1-Ward No-10 (4) Shajahanpur-Ward
No-34 (5) Salimullah Road-Ward No-44 (6) Noor Jahan Road-Ward
No-44 (7) Rayer Bazar (Pulpar)-Ward No-47(8) Rayer Bazar
(Battala) -Ward No-47 & CRHCC at (9) Pallabi-Ward No-06 (10)
Katasur- Ward No-46 (11) Noyatola-Ward No-55 in DNCC
5795510.
00
M/s Maz
Business
Syndicate
Prop: Md.
Asaduzzaman
79/2/3 West
Agargaon
Dhaka-1207.
6186919.9
3
21/04
/14
27/10/1
4
100% 6178917.00
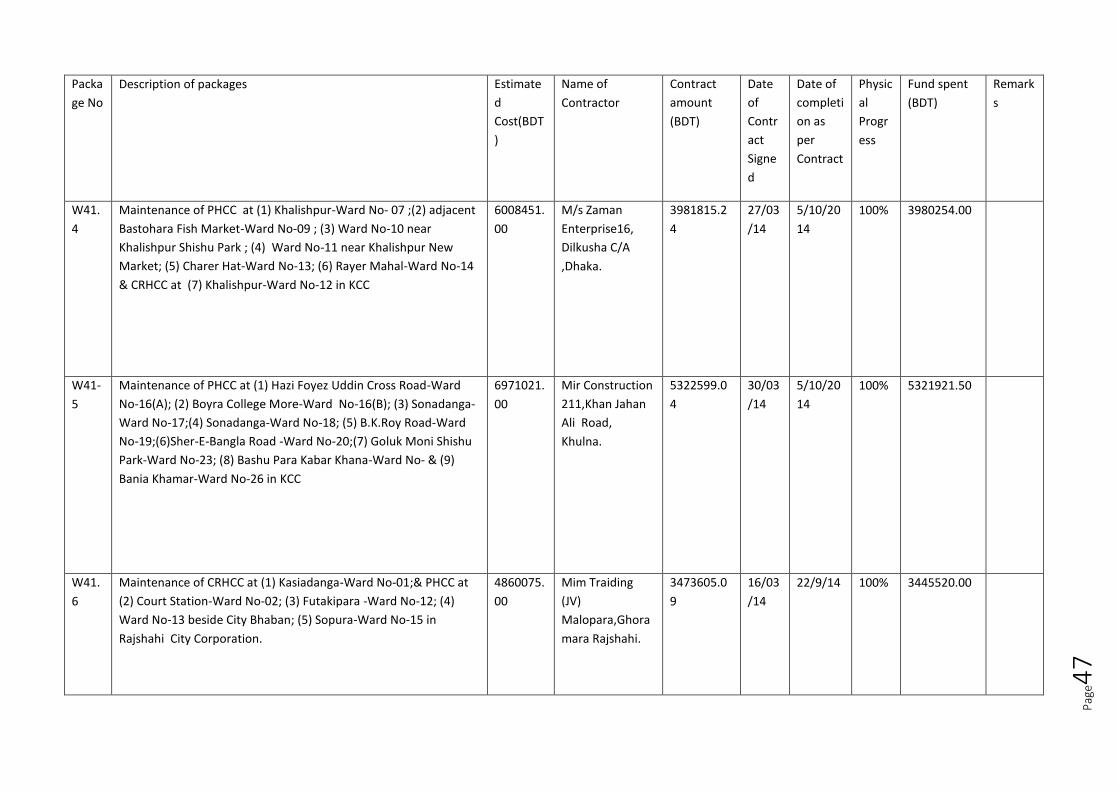
Pag
e47
Packa
ge No
Description of packages Estimate
d
Cost(BDT
)
Name of
Contractor
Contract
amount
(BDT)
Date
of
Contr
act
Signe
d
Date of
completi
on as
per
Contract
Physic
al
Progr
ess
Fund spent
(BDT)
Remark
s
W41.
4
Maintenance of PHCC at (1) Khalishpur-Ward No- 07 ;(2) adjacent
Bastohara Fish Market-Ward No-09 ; (3) Ward No-10 near
Khalishpur Shishu Park ; (4) Ward No-11 near Khalishpur New
Market; (5) Charer Hat-Ward No-13; (6) Rayer Mahal-Ward No-14
& CRHCC at (7) Khalishpur-Ward No-12 in KCC
6008451.
00
M/s Zaman
Enterprise16,
Dilkusha C/A
,Dhaka.
3981815.2
4
27/03
/14
5/10/20
14
100% 3980254.00
W41-
5
Maintenance of PHCC at (1) Hazi Foyez Uddin Cross Road-Ward
No-16(A); (2) Boyra College More-Ward No-16(B); (3) Sonadanga-
Ward No-17;(4) Sonadanga-Ward No-18; (5) B.K.Roy Road-Ward
No-19;(6)Sher-E-Bangla Road -Ward No-20;(7) Goluk Moni Shishu
Park-Ward No-23; (8) Bashu Para Kabar Khana-Ward No- & (9)
Bania Khamar-Ward No-26 in KCC
6971021.
00
Mir Construction
211,Khan Jahan
Ali Road,
Khulna.
5322599.0
4
30/03
/14
5/10/20
14
100% 5321921.50
W41.
6
Maintenance of CRHCC at (1) Kasiadanga-Ward No-01;& PHCC at
(2) Court Station-Ward No-02; (3) Futakipara -Ward No-12; (4)
Ward No-13 beside City Bhaban; (5) Sopura-Ward No-15 in
Rajshahi City Corporation.
4860075.
00
Mim Traiding
(JV)
Malopara,Ghora
mara Rajshahi.
3473605.0
9
16/03
/14
22/9/14 100% 3445520.00

Pag
e48
W41.
7
Maintenance of CRHCC at (1) Noadapara-Ward No-17 & PHCC at
(2) Choto Bonograme-Ward No-18 (3) Shakerchar-Ward No-23 ;
(5) Meherchandi -Ward No-26; (6) Kajla-Ward No-28; (7) Dasmari -
Ward No-29;(8) Budh Para-Ward No-30 in Rajshahi City
Corporation.
5648678.
00
Mim Traiding
(JV)
Malopara,Ghora
mara Rajshahi.
4164201.2
4
16/03
/14
22/9/14 100% 4151351.00
Sub-Total: 32374138.
31
32321804.50
Packa
ge No
Description of packages Estimate
d
Cost(BDT
)
Name of
Contractor
Contract
amount
(BDT)
Date
of
Contr
act
Signe
d
Date of
completi
on as
per
Contract
Physic
al
Progr
ess
Fund spent
(BDT)
Remark
s
Remaining works of PHCCs under UPHCP-II:
W-42 Incomplete work of PHCC building at Bujjarhat in Barisal City
Corporation.
5500000.
00
M/s Esad &
Emad Enterprise
5768787.8
2
17.09.
17
24.03.18 100% Fund
needed
.
W-43 Construction of 2nd Floor of PHCC at Gobindapur in Comilla City
Corporation.
3800000.
00
M/s Hamim &
Brothers
3989776.0
4
18.9.1
7
24.03.18 90% Do
W-44 Construction of 2nd Floor of PHCC at Vatpara in Comilla City
Corporation.
3800000.
00
M/s M I
Construction
3988135.1
7
18.9.1
7
24.03.18 95% Do
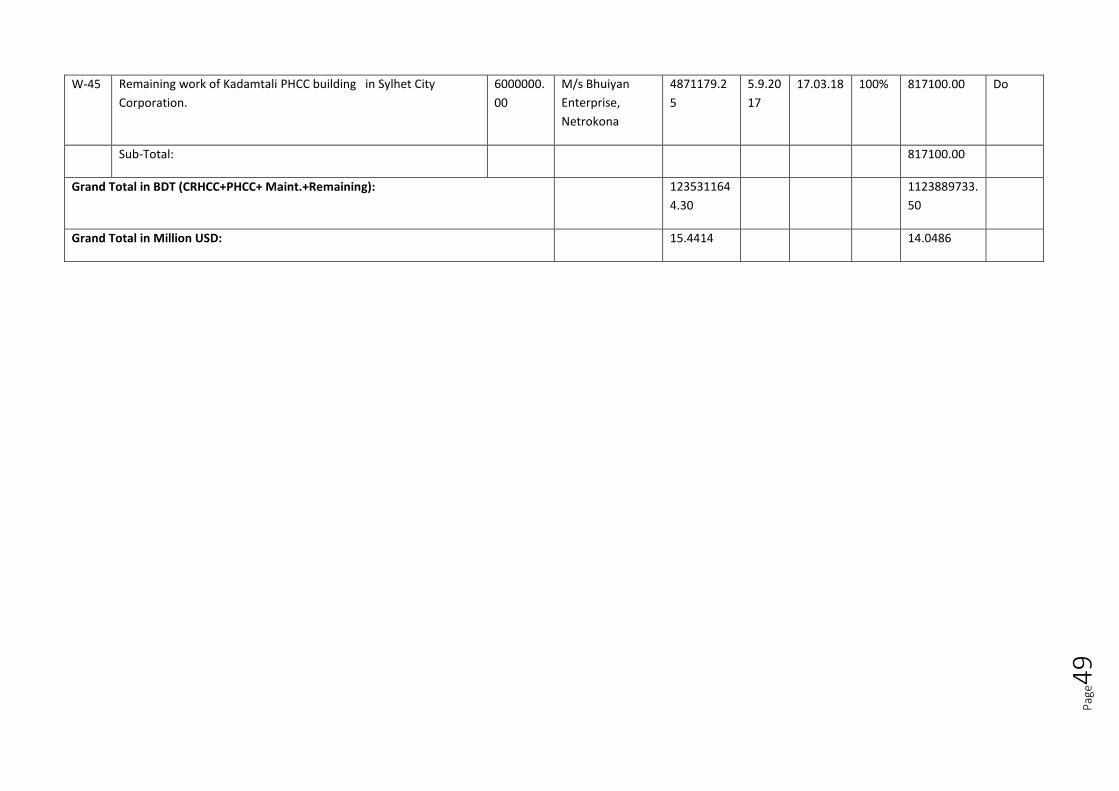
Pag
e49
W-45 Remaining work of Kadamtali PHCC building in Sylhet City
Corporation.
6000000.
00
M/s Bhuiyan
Enterprise,
Netrokona
4871179.2
5
5.9.20
17
17.03.18 100% 817100.00 Do
Sub-Total: 817100.00
Grand Total in BDT (CRHCC+PHCC+ Maint.+Remaining): 123531164
4.30
1123889733.
50
Grand Total in Million USD: 15.4414 14.0486

Pag
e50
SERVICE STATISTICS
(January-March,2018)
TABLE 02: Unique Client Flow by Sex and Age (January-March,2018)
Age Group Male Female Total Male % Female % Total %
0-28 Days 27,324 30,938 58,262 46.898% 53.102% 0.004 %
29 to 364 Days 66,150 78,491 144,641 45.734% 54.266% 0.009 %
12 to 23 Months 34,754 45,606 80,360 43.248% 56.752% 0.005 %
24 to 59 Months 30,239 43,322 73,561 41.107% 58.893% 0.005 %
05 to 09 Years 14,338 28,779 43,117 33.254% 66.746% 0.003 %
10 to 14 Years 12,384 43,479 55,863 22.169% 77.831% 0.003 %
15 to 19 Years 15,088 150,733 165,821 9.099% 90.901% 0.010 %
20 to 49 Years 88,916 830,482 919,398 9.671% 90.329% 0.057 %
50 to 59 Years 11,761 38,783 50,544 23.269% 76.731% 0.003 %
60+ Years 5,699 14,323 20,022 28.464% 71.536% 0.001 %
Total 306,653 1,304,936 1,611,589 19.03% 80.97% ---
Note: This table shows Unique Clients only for a particular day
TABLE 03: Service Composition (January-March,2018)
Service Type Up to Previous
Quarter
Current Quarter
Grand Total
Current (%)
Overall (%)
ESP+ Clinical Service 36,270,629 1,524,923 37,795,552 73.625% 77.534%
ESP+ BCC Service 10,358,384 544,576 10,902,960 26.296% 22.368%
Other Service 46,418 1,632 48,050 0.079% 0.099%
Grand Total 46,675,431 2,071,131 48,746,562 -- --

Pag
e51
53.10 % 46.90 %
54.27 % 45.73 %
56.75 % 43.25 %
58.89 % 41.11 %
66.75 % 33.25 %
77.83 % 22.17 %
90.90 % 9.10 %
90.33 % 9.67 %
76.73 % 23.27 %
71.54 % 28.46 %
Ag
e G
rou
ps
CHART 01-04: UNIQUE CLIENT FLOW DISTRIBUTION (January-March,2018)
Chart 01: Gender Distribution
Male: 19.0 %
Female: 81.0 %
Male : 306,653 Female : 1,304,936
Chart 02: Age Distribution
0-28 Days
29 to 364 Days
12 to 23 Months
24 to 59 Months
05 to 09 Years
10 to 14 Years
15 to 19 Years
20 to 49 Years
50 to 59 Years
60+ Years
3.62 %
4.99 %
4.56 %
2.68 %
3.47 %
3.14 %
1.24 %
8.98 %
10.29 %
57.05 %
0 5 10 15 20 25 30 35 40 45 50 55 60
Client(%)
Chart 03: Gender Distribution by different Age Groups
0-28 Days
29 to 364 Days
12 to 23 Months
24 to 59 Months
05 to 09 Years
10 to 14 Years
15 to 19 Years
20 to 49 Years
50 to 59 Years
60+ Years
0 10 20 30 40 50 60 70 80 90 100 110
Client (%)
FEMALE MALE
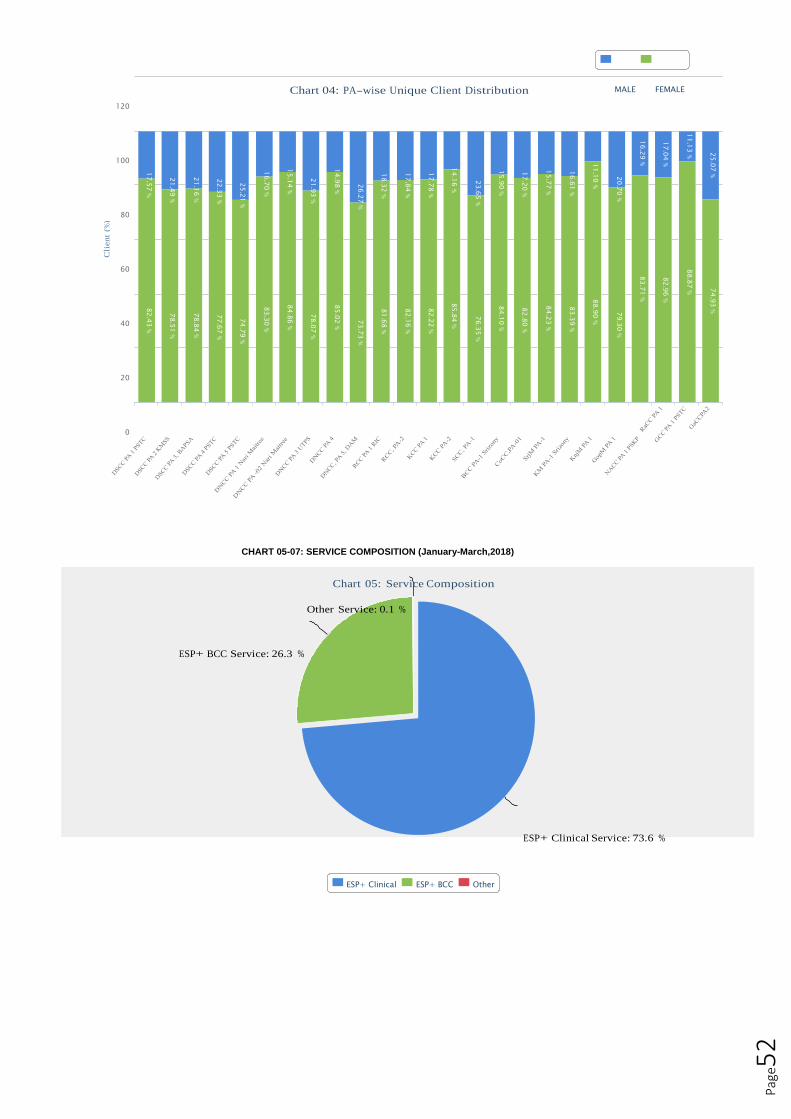
Pag
e52
25
.07
%
74
.93
%
11
.13
%
88
.87
%
17
.04
%
82
.96
%
16
.29
%
83
.71
%
20
.70
%
79
.30
%
11
.10
%
88
.90
%
16
.61
%
83
.39
%
15
.77
%
84
.23
%
17
.20
%
82
.80
%
15
.90
%
84
.10
%
23
.65
%
76
.35
%
14
.16
%
85
.84
%
17
.78
%
82
.22
%
17
.84
%
82
.16
%
18
.32
%
81
.68
%
26
.27
%
73
.73
%
14
.98
%
85
.02
%
21
.93
%
78
.07
%
15
.14
%
84
.86
%
16
.70
%
83
.30
%
25
.21
%
74
.79
%
22
.33
%
77
.67
%
21
.16
%
78
.84
%
21
.49
%
78
.51
%
17
.57
%
82
.43
%
Cli
en
t (%
)
Chart 04: PA-wise Unique Client Distribution MALE FEMALE
120
100
80
60
40
20
0
CHART 05-07: SERVICE COMPOSITION (January-March,2018)
Chart 05: Service Composition
Other Service: 0.1 %
ESP+ BCC Service: 26.3 %
ESP+ Clinical Service: 73.6 %
ESP+ Clinical ESP+ BCC Other

Pag
e53
Th
ou
san
ds U
nit
Chart 06: ESP+ Clinical Services (Distribution by Center Type)
CRHCC: 14.4 %
SATELLITE: 40.5 %
PHCC: 45.0 %
CRHCC : 219,682 PHCC : 686,840 SATELLITE : 618,232
Chart 07: ESP+ BCC Services (Distribution by Center Type)
SATELLITE: 23.4 % CRHCC: 20.4 %
PHCC: 56.2 %
CRHCC : 110,976 PHCC : 306,019 SATELLITE : 127,581
200k
Chart 08: PA wise Client-Contact-Service Mix
150k
100k
50k
0k
New Client Unique Client Contract Service
New Client: A client who visits for the first time in any service center and is included in the master register. Unique client: A client who visits at any one time on a particular day. Contact: A client who visits any service center at any certain times for receiving any specific service. Service: Number of services provided under certain components for any number of contacts.
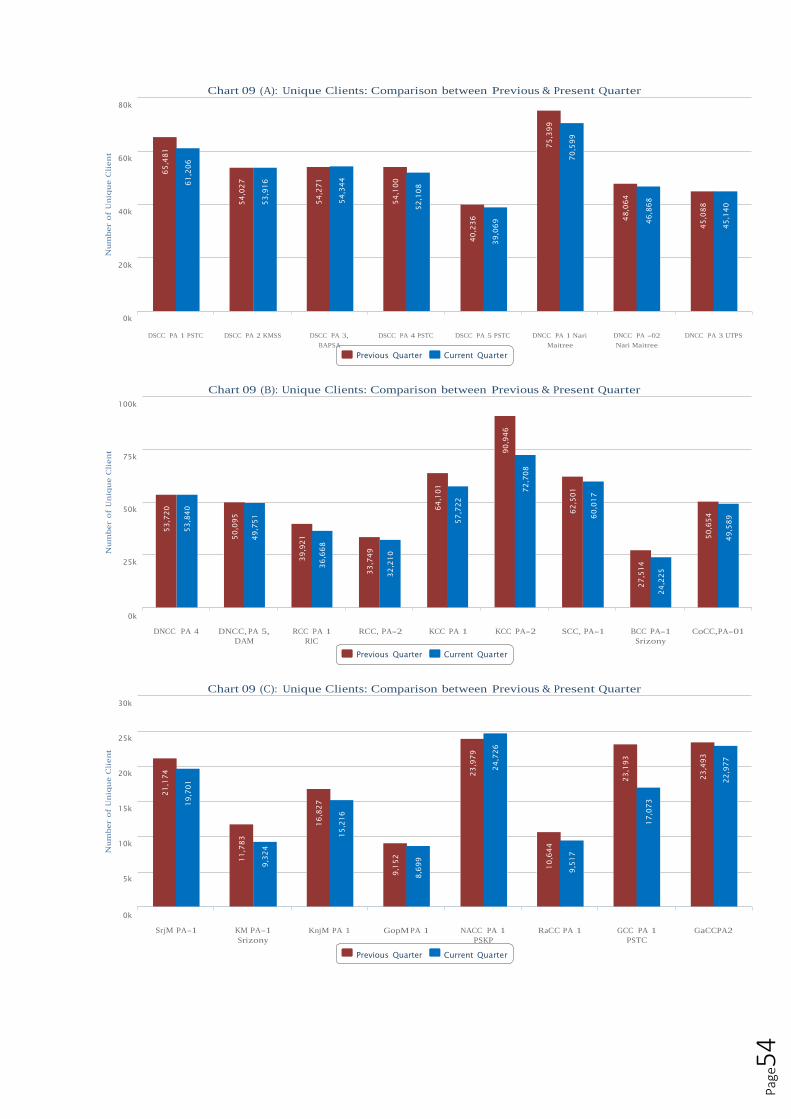
Pag
e54
Num
ber
of
Un
iqu
e C
lient
Num
ber
of
Un
iqu
e C
lient
Num
ber
of
Un
iqu
e C
lient
21
,17
4
65
,48
1
53
,72
0
53
,84
0
19
,70
1
61
,20
6
50
,09
5
11
,78
3
54
,02
7
49
,75
1
9,3
24
5
3,9
16
39
,92
1
16
,82
7
54
,27
1
36
,66
8
15
,21
6
54
,34
4
33
,74
9
32
,21
0
9,1
52
5
4,1
00
8,6
99
5
2,1
08
64
,10
1
57
,72
2
23
,97
9
40
,23
6
24
,72
6
39
,06
9
90
,94
6
72
,70
8
10
,64
4
75
,39
9
9,5
17
7
0,5
99
6
2,5
01
60
,01
7
23
,19
3
48
,06
4
27
,51
4
17
,07
3
46
,86
8
24
,22
5
23
,49
3
45
,08
8
50
,65
4
22
,97
7
45
,14
0
49
,58
9
80k
Chart 09 (A): Unique Clients: Comparison between Previous & Present Quarter
60k
40k
20k
0k
DSCC PA 1 PSTC DSCC PA 2 KMSS DSCC PA 3,
BAPSA
DSCC PA 4 PSTC DSCC PA 5 PSTC DNCC PA 1 Nari
Maitree
Previous Quarter Current Quarter
DNCC PA -02
Nari Maitree
DNCC PA 3 UTPS
100k
Chart 09 (B): Unique Clients: Comparison between Previous & Present Quarter
75k
50k
25k
0k
DNCC PA 4 DNCC, PA 5,
DAM
RCC PA 1
RIC
RCC, PA-2 KCC PA 1 KCC PA-2 SCC, PA-1 BCC PA-1
Srizony
Previous Quarter Current Quarter
CoCC,PA-01
30k
Chart 09 (C): Unique Clients: Comparison between Previous & Present Quarter
25k
20k
15k
10k
5k
0k
SrjM PA-1 KM PA-1
Srizony
KnjM PA 1 GopM PA 1 NACC PA 1
PSKP
Previous Quarter Current Quarter
RaCC PA 1 GCC PA 1
PSTC
GaCCPA2
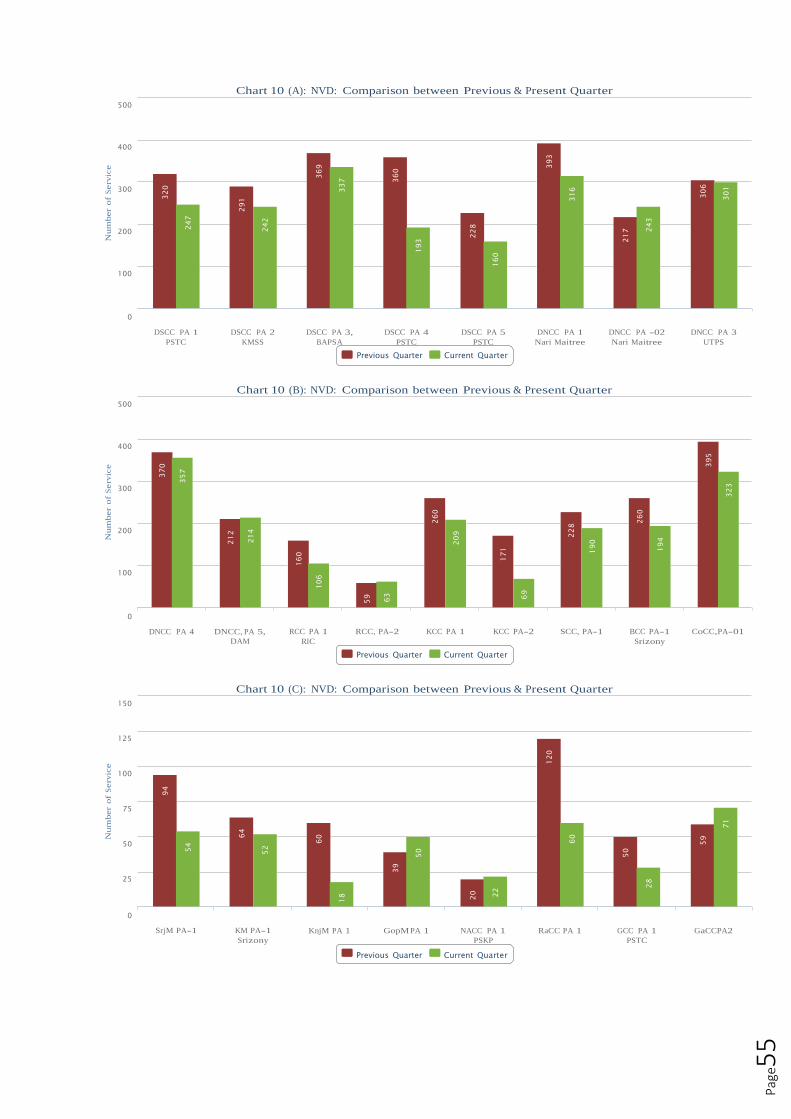
Pag
e55
Num
ber
of
Serv
ice
N
um
ber
of
Serv
ice
N
um
ber
of
Serv
ice
37
0
94
3
20
35
7
54
2
47
21
2
64
2
91
2
14
52
2
42
16
0
60
1
06
3
69
18
3
37
59
63
3
9
36
0
50
1
93
26
0
20
9
20
2
28
22
1
60
1
71
69
12
0
39
3
22
8
60
3
16
19
0
50
2
17
26
0
28
2
43
19
4
59
3
06
3
95
71
3
01
3
23
500
Chart 10 (A): NVD: Comparison between Previous & Present Quarter
400
300
200
100
0 DSCC PA 1 DSCC PA 2 DSCC PA 3, DSCC PA 4 DSCC PA 5 DNCC PA 1 DNCC PA -02 DNCC PA 3 PSTC KMSS BAPSA PSTC PSTC Nari Maitree Nari Maitree UTPS
Previous Quarter Current Quarter
500
Chart 10 (B): NVD: Comparison between Previous & Present Quarter
400
300
200
100
0
DNCC PA 4 DNCC, PA 5,
DAM
RCC PA 1
RIC
RCC, PA-2 KCC PA 1 KCC PA-2 SCC, PA-1 BCC PA-1
Srizony
Previous Quarter Current Quarter
CoCC,PA-01
150
Chart 10 (C): NVD: Comparison between Previous & Present Quarter
125
100
75
50
25
0
SrjM PA-1 KM PA-1
Srizony
KnjM PA 1 GopM PA 1 NACC PA 1
PSKP
Previous Quarter Current Quarter
RaCC PA 1 GCC PA 1
PSTC
GaCCPA2

TABLE 04: Service Component-wise Service Delivery
Current Quarter (January-March,2018)
Pag
e56
Component Up to
Previous
Quarter
CRHCC 3
PHCC 4
Other 5
Static 6
Satellite 7
Total 8
Grand Total
Reproductive Health 11,436,597 100,118 245,200 0 345,318 245,371 590,689 12,027,286
Maternal Care 4,216,492 62,300 88,715 0 151,015 72,365 223,380 4,439,872
Antenatal Care 2,643,375 34,617 64,374 0 98,991 43,990 142,981 2,786,356
Delivery Care (NVD) 102,711 4,119 0 0 4,119 0 4,119 106,830
Delivery Care (CS) 59,583 2,400 0 0 2,400 0 2,400 61,983
Postnatal Care 868,083 13,957 14,891 0 28,848 16,712 45,560 913,643
Neonatal Care 542,740 7,207 9,450 0 16,657 11,663 28,320 571,060
Menstrual Regulation 123,058 346 5,195 0 5,541 0 5,541 128,599
Post Abortion Care 7,108 233 137 0 370 0 370 7,478
Family Planning 3,799,958 13,546 67,803 0 81,349 104,113 185,462 3,985,420
Emergency Contraceptive Pill 2,218 33 105 0 138 25 163 2,381
Maternal Nutrition 334,195 2,749 10,486 0 13,235 3,250 16,485 350,680
Violence Against Women 33,428 251 1,171 0 1,422 0 1,422 34,850
Adolescent Reproductive Health Care 1,487,328 7,779 31,313 0 39,092 39,371 78,463 1,565,791
RTI/STI Care 860,970 7,097 19,229 0 26,326 21,338 47,664 908,634
Other Reproductive Health Care 571,842 5,784 21,046 0 26,830 4,909 31,739 603,581
3 Number of services delivered in CRHCCs |
4 Number of services delivered in PHCCs |
5 Other Static Service Delivery Points (PECC, DOTS, VCCT etc)
6 Number of services delivered in Static clinics (i.e. in CRHCCs, PHCCs and Other Static Centers)
7 Number of services delivered in Satellite clinics
8 Total = Static + Satellite or Total = CRHCC + PHCC + Other + Satellite

TABLE 04: Service Component-wise Service Delivery
Current Quarter (January-March,2018)
Pag
e57
Component Up to
Previous
Quarter
CRHCC 3
PHCC 4
Other 5
Static 6
Satellite 7
Total 8
Grand Total
Child Health Care 9,592,419 25,948 127,833 0 153,781 98,287 252,068 9,844,487
Immunization Program - EPI 2,056,729 9,551 63,267 0 72,818 50,860 123,678 2,180,407
Immunization Program - NID 5,007,607 0 13,010 0 13,010 0 13,010 5,020,617
Control of Diarrhoea & Other Childhood
Diseases
778,585
4,112
14,324
0
18,436
17,683
36,119 814,704
Diarrhea 773,453 4,097 14,240 0 18,337 17,496 35,833 809,286
Measles 5,132 15 84 0 99 187 286 5,418
Control of Acute Respiratory Infections 1,034,881 7,826 19,967 0 27,793 20,024 47,817 1,082,698
Control of Micronutrient Deficiency 714,617 4,459 17,265 0 21,724 9,720 31,444 746,061
Child Nutrition 436,504 1,918 12,422 0 14,340 5,976 20,316 456,820
Vitamin A Deficiency 275,900 2,526 4,749 0 7,275 3,744 11,019 286,919
Iodine Deficiency 2,213 15 94 0 109 0 109 2,322
Communicable Diseases Control 1,591,822 368 1,163 0 1,531 0 1,531 1,593,353
Tuberculosis Control 1,564,308 0 0 0 0 0 0 1,564,308
Other Communicable Diseases Control 27,514 368 1,163 0 1,531 0 1,531 29,045
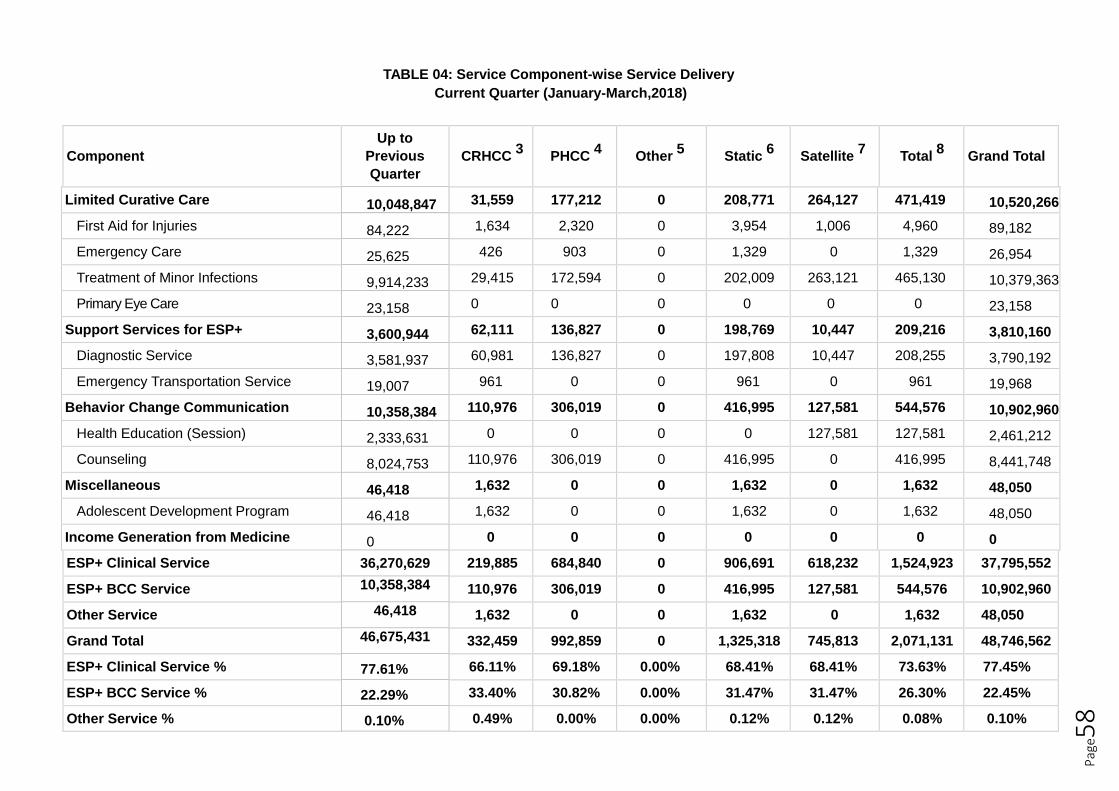
TABLE 04: Service Component-wise Service Delivery
Current Quarter (January-March,2018)
Pag
e58
Component Up to
Previous
Quarter
CRHCC 3
PHCC 4
Other 5
Static 6
Satellite 7
Total 8
Grand Total
Limited Curative Care 10,048,847 31,559 177,212 0 208,771 264,127 471,419 10,520,266
First Aid for Injuries 84,222 1,634 2,320 0 3,954 1,006 4,960 89,182
Emergency Care 25,625 426 903 0 1,329 0 1,329 26,954
Treatment of Minor Infections 9,914,233 29,415 172,594 0 202,009 263,121 465,130 10,379,363
Primary Eye Care 23,158 0 0 0 0 0 0 23,158
Support Services for ESP+ 3,600,944 62,111 136,827 0 198,769 10,447 209,216 3,810,160
Diagnostic Service 3,581,937 60,981 136,827 0 197,808 10,447 208,255 3,790,192
Emergency Transportation Service 19,007 961 0 0 961 0 961 19,968
Behavior Change Communication 10,358,384 110,976 306,019 0 416,995 127,581 544,576 10,902,960
Health Education (Session) 2,333,631 0 0 0 0 127,581 127,581 2,461,212
Counseling 8,024,753 110,976 306,019 0 416,995 0 416,995 8,441,748
Miscellaneous 46,418 1,632 0 0 1,632 0 1,632 48,050
Adolescent Development Program 46,418 1,632 0 0 1,632 0 1,632 48,050
Income Generation from Medicine 0 0 0 0 0 0 0 0
ESP+ Clinical Service 36,270,629 219,885 684,840 0 906,691 618,232 1,524,923 37,795,552
ESP+ BCC Service 10,358,384 110,976 306,019 0 416,995 127,581 544,576 10,902,960
Other Service 46,418 1,632 0 0 1,632 0 1,632 48,050
Grand Total 46,675,431 332,459 992,859 0 1,325,318 745,813 2,071,131 48,746,562
ESP+ Clinical Service % 77.61% 66.11% 69.18% 0.00% 68.41% 68.41% 73.63% 77.45%
ESP+ BCC Service % 22.29% 33.40% 30.82% 0.00% 31.47% 31.47% 26.30% 22.45%
Other Service % 0.10% 0.49% 0.00% 0.00% 0.12% 0.12% 0.08% 0.10%
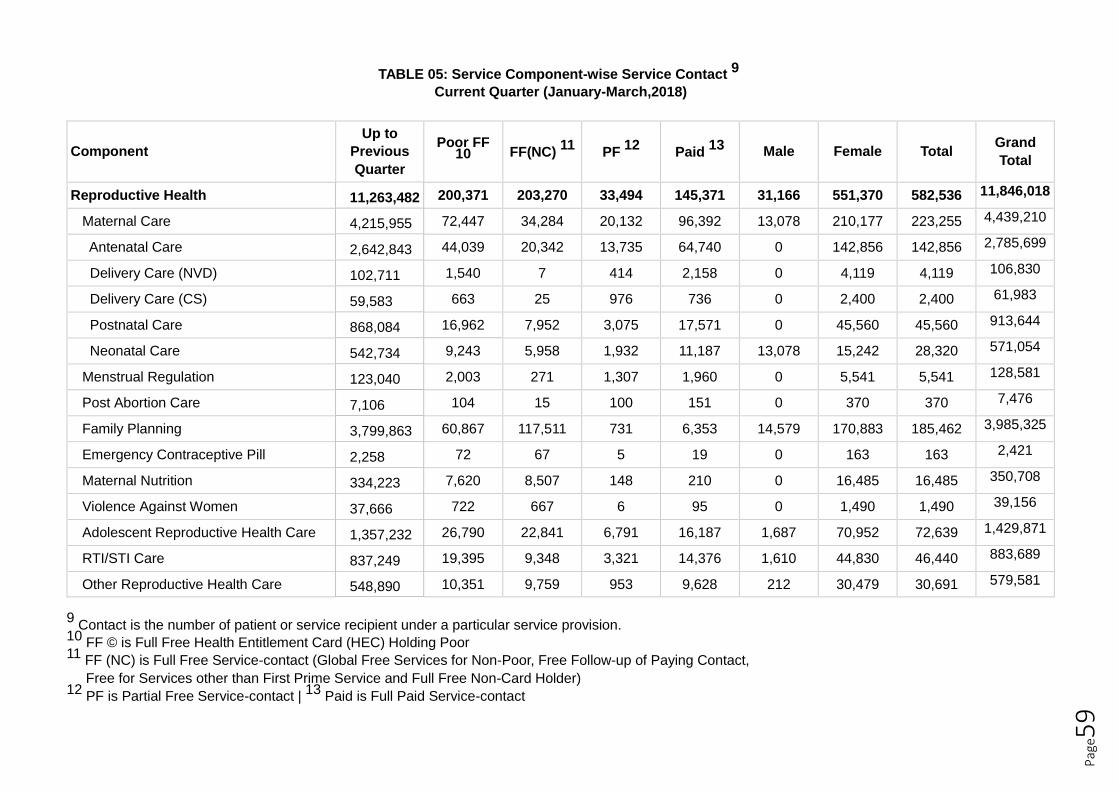
TABLE 05: Service Component-wise Service Contact 9
Pag
e59
Current Quarter (January-March,2018)
Component Up to
Previous
Quarter
Poor FF 10
11
FF(NC)
12
PF
13
Paid
Male
Female
Total
Grand
Total
Reproductive Health 11,263,482 200,371 203,270 33,494 145,371 31,166 551,370 582,536 11,846,018
Maternal Care 4,215,955 72,447 34,284 20,132 96,392 13,078 210,177 223,255 4,439,210
Antenatal Care 2,642,843 44,039 20,342 13,735 64,740 0 142,856 142,856 2,785,699
Delivery Care (NVD) 102,711 1,540 7 414 2,158 0 4,119 4,119 106,830
Delivery Care (CS) 59,583 663 25 976 736 0 2,400 2,400 61,983
Postnatal Care 868,084 16,962 7,952 3,075 17,571 0 45,560 45,560 913,644
Neonatal Care 542,734 9,243 5,958 1,932 11,187 13,078 15,242 28,320 571,054
Menstrual Regulation 123,040 2,003 271 1,307 1,960 0 5,541 5,541 128,581
Post Abortion Care 7,106 104 15 100 151 0 370 370 7,476
Family Planning 3,799,863 60,867 117,511 731 6,353 14,579 170,883 185,462 3,985,325
Emergency Contraceptive Pill 2,258 72 67 5 19 0 163 163 2,421
Maternal Nutrition 334,223 7,620 8,507 148 210 0 16,485 16,485 350,708
Violence Against Women 37,666 722 667 6 95 0 1,490 1,490 39,156
Adolescent Reproductive Health Care 1,357,232 26,790 22,841 6,791 16,187 1,687 70,952 72,639 1,429,871
RTI/STI Care 837,249 19,395 9,348 3,321 14,376 1,610 44,830 46,440 883,689
Other Reproductive Health Care 548,890 10,351 9,759 953 9,628 212 30,479 30,691 579,581
9 Contact is the number of patient or service recipient under a particular service provision.
10 FF © is Full Free Health Entitlement Card (HEC) Holding Poor
11 FF (NC) is Full Free Service-contact (Global Free Services for Non-Poor, Free Follow-up of Paying Contact,
Free for Services other than First Prime Service and Full Free Non-Card Holder) 12
PF is Partial Free Service-contact | 13
Paid is Full Paid Service-contact
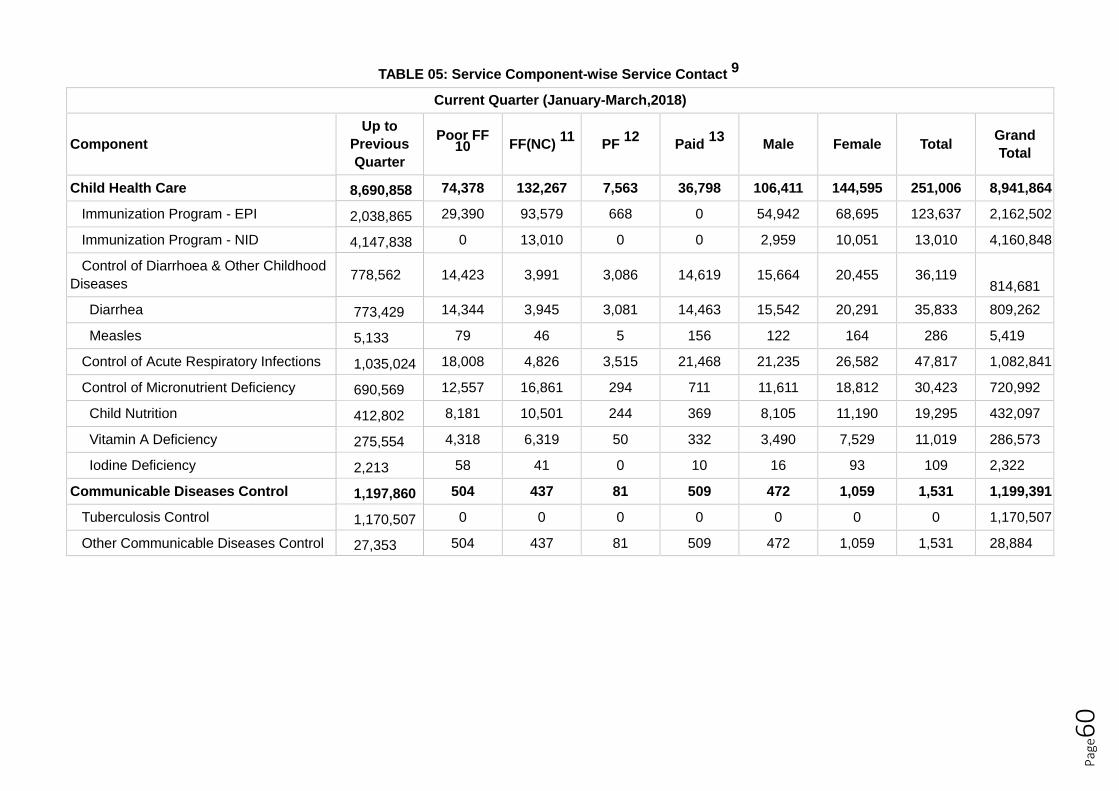
TABLE 05: Service Component-wise Service Contact 9
Pag
e60
Current Quarter (January-March,2018)
Component Up to
Previous
Quarter
Poor FF 10
FF(NC)
PF
Paid
Male
Female
Total
Grand
Total
Child Health Care 8,690,858 74,378 132,267 7,563 36,798 106,411 144,595 251,006 8,941,864
Immunization Program - EPI 2,038,865 29,390 93,579 668 0 54,942 68,695 123,637 2,162,502
Immunization Program - NID 4,147,838 0 13,010 0 0 2,959 10,051 13,010 4,160,848
Control of Diarrhoea & Other Childhood
Diseases
778,562
14,423
3,991
3,086
14,619
15,664
20,455
36,119
814,681
Diarrhea 773,429 14,344 3,945 3,081 14,463 15,542 20,291 35,833 809,262
Measles 5,133 79 46 5 156 122 164 286 5,419
Control of Acute Respiratory Infections 1,035,024 18,008 4,826 3,515 21,468 21,235 26,582 47,817 1,082,841
Control of Micronutrient Deficiency 690,569 12,557 16,861 294 711 11,611 18,812 30,423 720,992
Child Nutrition 412,802 8,181 10,501 244 369 8,105 11,190 19,295 432,097
Vitamin A Deficiency 275,554 4,318 6,319 50 332 3,490 7,529 11,019 286,573
Iodine Deficiency 2,213 58 41 0 10 16 93 109 2,322
Communicable Diseases Control 1,197,860 504 437 81 509 472 1,059 1,531 1,199,391
Tuberculosis Control 1,170,507 0 0 0 0 0 0 0 1,170,507
Other Communicable Diseases Control 27,353 504 437 81 509 472 1,059 1,531 28,884
11 12 13

TABLE 05: Service Component-wise Service Contact 9
Pag
e61
Current Quarter (January-March,2018)
Component Up to
Previous
Quarter
Poor FF 10
11
FF(NC)
12
PF
13
Paid
Male
Female
Total
Grand
Total
Limited Curative Care 9,230,787 154,390 102,294 59,293 118,858 95,006 339,829 433,352 9,664,139
First Aid for Injuries 84,301 1,850 1,144 380 1,586 1,527 3,433 4,960 89,261
Emergency Care 25,637 483 296 97 453 252 1,077 1,329 26,966
Treatment of Minor Infections 9,095,691 151,439 100,570 58,530 116,524 92,740 334,323 427,063 9,522,754
Primary Eye Care 23,158 0 0 0 0 0 0 0 23,158
Support Services for ESP+ 2,460,355 44,983 7,115 19,983 65,876 15,090 122,867 137,957 2,598,312
Diagnostic Service 2,440,081 44,682 7,008 19,835 65,471 14,954 122,042 136,996 2,577,077
Emergency Transportation Service 20,274 301 107 148 405 136
825 961 21,235
Behavior Change Communication 13,874,062 226,182 435,746 0 589 130,314 532,203 662,517 14,536,579
Health Education (Session) 4,020,961 57,403 109,790 0 0 33,410 133,783 167,193 4,188,154
Counseling 9,853,101 168,779 325,956 0 589 96,904 398,420 495,324 10,348,425
Miscellaneous 103,803 903 2,892 0 0 597 3,198 3,795 107,598
Adolescent Development Program 103,803 903 2,892 0 0 597 3,198 3,795 107,598
Income Generation from Medicine 0 0 0 0 0 0 0 0 0
ESP+ Clinical Service 32,843,342 474,008 445,099 120,128 367,117 247,658 1,158,724 1,406,382 34,249,724
ESP+ BCC Service 13874062 226,182 435,746 0 589 130,314 532,203 662,517 14,536,579
Other Service 103803 903 2,892 0 0 597 3,198 3,795 107,598
Grand Total 46,821,207
816
701,093 883,737 120,128 367,706 378,569 1,694,125 2,072,694 48,893,901
ESP+ Clinical Service % 72.83% 67.61% 50.36% 100.00% 99.84% 65.42% 68.39% 67.85% 72.61%
ESP+ BCC Service % 26.95% 32.26% 49.31% 0.00% 0.16% 34.43% 31.42% 31.97% 27.17%
Other Service % 0.22% 0.13% 0.33% 0.00% 0.00% 0.16% 0.19% 0.18% 0.22%
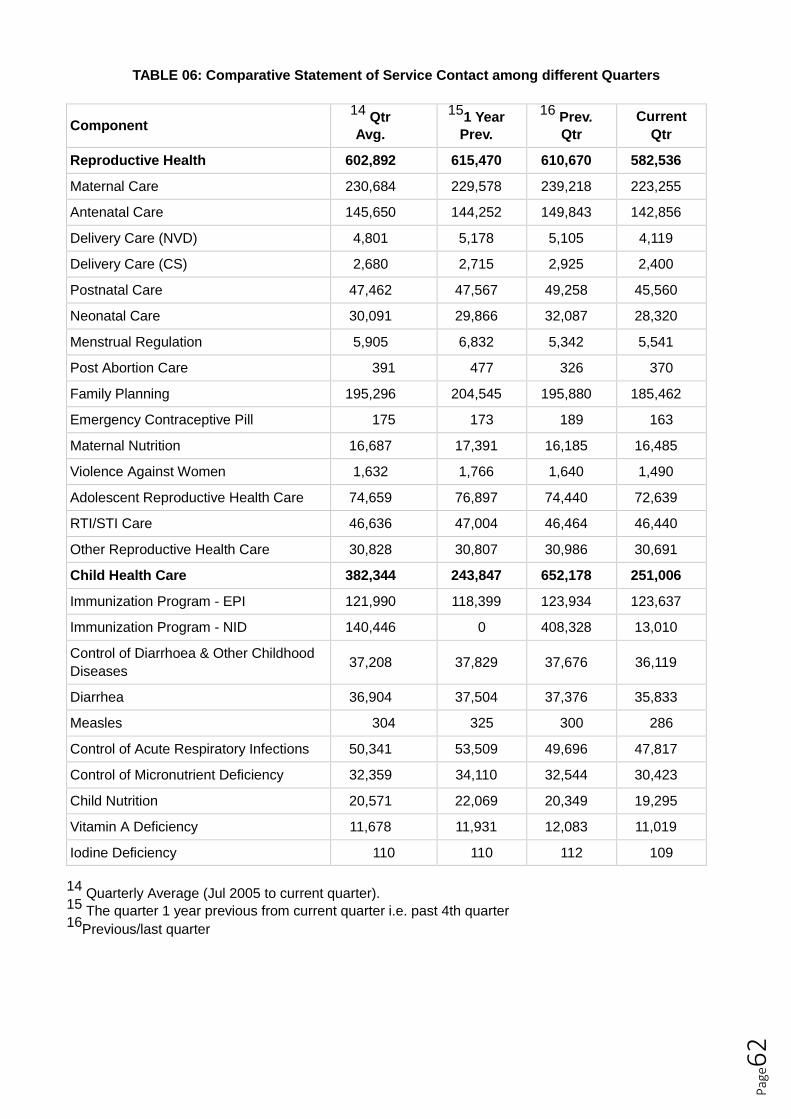
Pag
e62
TABLE 06: Comparative Statement of Service Contact among different Quarters
Component 14
Qtr
Avg.
15 1 Year
Prev.
16 Prev.
Qtr Current
Qtr
Reproductive Health 602,892 615,470 610,670 582,536
Maternal Care 230,684 229,578 239,218 223,255
Antenatal Care 145,650 144,252 149,843 142,856
Delivery Care (NVD) 4,801 5,178 5,105 4,119
Delivery Care (CS) 2,680 2,715 2,925 2,400
Postnatal Care 47,462 47,567 49,258 45,560
Neonatal Care 30,091 29,866 32,087 28,320
Menstrual Regulation 5,905 6,832 5,342 5,541
Post Abortion Care 391 477 326 370
Family Planning 195,296 204,545 195,880 185,462
Emergency Contraceptive Pill 175 173 189 163
Maternal Nutrition 16,687 17,391 16,185 16,485
Violence Against Women 1,632 1,766 1,640 1,490
Adolescent Reproductive Health Care 74,659 76,897 74,440 72,639
RTI/STI Care 46,636 47,004 46,464 46,440
Other Reproductive Health Care 30,828 30,807 30,986 30,691
Child Health Care 382,344 243,847 652,178 251,006
Immunization Program - EPI 121,990 118,399 123,934 123,637
Immunization Program - NID 140,446 0 408,328 13,010
Control of Diarrhoea & Other Childhood
Diseases
37,208
37,829
37,676
36,119
Diarrhea 36,904 37,504 37,376 35,833
Measles 304 325 300 286
Control of Acute Respiratory Infections 50,341 53,509 49,696 47,817
Control of Micronutrient Deficiency 32,359 34,110 32,544 30,423
Child Nutrition 20,571 22,069 20,349 19,295
Vitamin A Deficiency 11,678 11,931 12,083 11,019
Iodine Deficiency 110 110 112 109
14 Quarterly Average (Jul 2005 to current quarter).
15 The quarter 1 year previous from current quarter i.e. past 4th quarter
16 Previous/last quarter
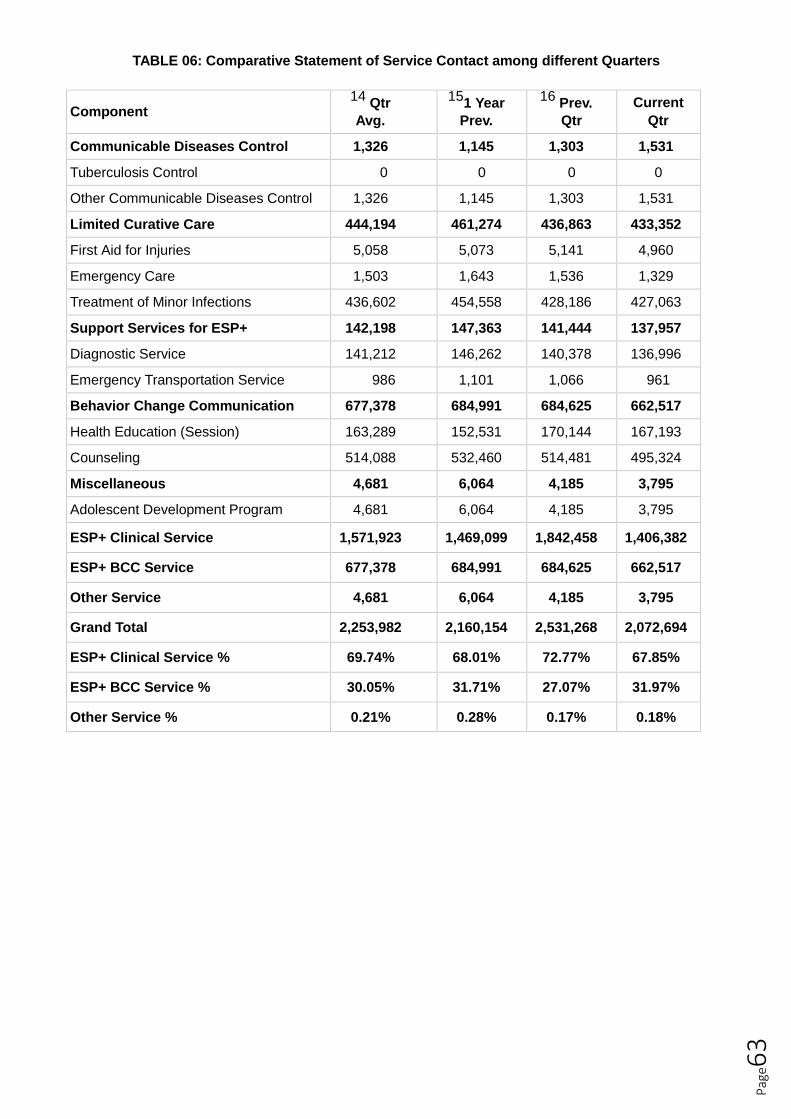
Pag
e63
TABLE 06: Comparative Statement of Service Contact among different Quarters
Component 14
Qtr
Avg.
15 1 Year
Prev.
16 Prev.
Qtr Current
Qtr
Communicable Diseases Control 1,326 1,145 1,303 1,531
Tuberculosis Control 0 0 0 0
Other Communicable Diseases Control 1,326 1,145 1,303 1,531
Limited Curative Care 444,194 461,274 436,863 433,352
First Aid for Injuries 5,058 5,073 5,141 4,960
Emergency Care 1,503 1,643 1,536 1,329
Treatment of Minor Infections 436,602 454,558 428,186 427,063
Support Services for ESP+ 142,198 147,363 141,444 137,957
Diagnostic Service 141,212 146,262 140,378 136,996
Emergency Transportation Service 986 1,101 1,066 961
Behavior Change Communication 677,378 684,991 684,625 662,517
Health Education (Session) 163,289 152,531 170,144 167,193
Counseling 514,088 532,460 514,481 495,324
Miscellaneous 4,681 6,064 4,185 3,795
Adolescent Development Program 4,681 6,064 4,185 3,795
ESP+ Clinical Service 1,571,923 1,469,099 1,842,458 1,406,382
ESP+ BCC Service 677,378 684,991 684,625 662,517
Other Service 4,681 6,064 4,185 3,795
Grand Total 2,253,982 2,160,154 2,531,268 2,072,694
ESP+ Clinical Service % 69.74% 68.01% 72.77% 67.85%
ESP+ BCC Service % 30.05% 31.71% 27.07% 31.97%
Other Service % 0.21% 0.28% 0.17% 0.18%

Pag
e64
Current Quarter (January-March,2018)
TABLE 07:
Performance Summary
Contact
Service
RC
Contact
Propoor 17
%
Revenue
Subsidy
Reproductive Health 582,536 590,689 200371 34.40% 22,935,485 20,722,123
Maternal Care 223,255 223,380 72447 32.45% 18,925,927 14,038,675
Antenatal Care 142,856 142,981 44039 30.83% 2,866,638 2,555,498
Delivery Care (NVD) 4,119 4,119 1540 37.39% 2,206,708 1,487,465
Delivery Care (CS) 2,400 2,400 663 27.63% 12,642,583 8,451,738
Postnatal Care 45,560 45,560 16962 37.23% 734,700 969,259
Neonatal Care 28,320 28,320 9243 32.64% 475,298 574,715
Menstrual Regulation 5,541 5,541 2003 36.15% 1,993,172 2,045,708
Post Abortion Care 370 370 104 28.11% 271,082 128,418
Family Planning 185,462 185,462 60867 32.82% 42,104 877,655
Emergency Contraceptive Pill 163 163 72 44.17% 685 4,625
Maternal Nutrition 16,485 16,485 7620 46.22% 6,570 469,458
Violence Against Women 1,490 1,422 722 48.46% 3,605 20,799
Adolescent Reproductive Health
Care
72,639
78,463
26790
36.88%
685,122
1,525,377
RTI/STI Care 46,440 47,664 19395 41.76% 590,465 996,804
Other Reproductive Health Care 30,691 31,739 10351 33.73% 416,753 614,604
Child Health Care 251,006 252,068 74378 29.63% 1,500,428 2,621,725
Immunization Program - EPI 123,637 123,678 29390 23.77% 700 461,330
Immunization Program - NID 13,010 13,010 0 0.00% 0 0
Control of Diarrhoea & Other
Childhood Diseases
36,119
36,119
14423
39.93%
612,387
688,801
Diarrhea 35,833 35,833 14344 40.03% 607,812 686,286
Measles 286 286 79 27.62% 4,575 2,515
Control of Acute Respiratory
Infections
47,817
47,817
18008
37.66%
863,695
866,588
Control of Micronutrient
Deficiency
30,423
31,444
12557
41.27%
23,646
605,006
Child Nutrition 19,295 20,316 8181 42.40% 16,466 492,226
Vitamin A Deficiency 11,019 11,019 4318 39.19% 6,820 109,770
Iodine Deficiency 109 109 58 53.21% 360 3,010
17 Propoor is the percentage of poor (Health Entitlement Cardholder) contact excluding NID program.
UPHCP-II is committed to achieve at least 30% propoor targeting in each service component. 0% means
service provided to poor is 0 (zero). Blank Cell (null value) means respective service has not been
delivered from particular entity during the reporting period.

Pag
e65
Current Quarter (January-March,2018)
TABLE 07:
Performance Summary
Contact
Service
RC
Contact
Propoor 17
%
Revenue
Subsidy
Communicable Diseases
Control
1,531
1,531
504
32.92%
21,641
37,249
Tuberculosis Control 0 0 0 0.00% 0 0
Other Communicable Diseases
Control
1,531
1,531
504
32.92%
21,641
37,249
Limited Curative Care 433,352 471,419 154390 35.51% 5,127,574 8,917,629
First Aid for Injuries 4,960 4,960 1850 37.30% 86,775 112,885
Emergency Care 1,329 1,329 483 36.34% 38,875 31,535
Treatment of Minor Infections 427,063 465,130 151439 35.46% 4,978,869 8,721,399
Support Services for ESP+ 137,957 209,216 44983 68.60% 12,827,822 7,727,968
Diagnostic Service 136,996 208,255 44682 32.62% 12,595,504 7,596,198
Emergency Transportation
Service
961
961
301
35.98%
232,318
131,770
Behavior Change
Communication
662,517
544,576
226182
34.14%
0
38,870
Health Education (Session) 167,193 127,581 57403 34.33% 0 25,640
Counseling 495,324 416,995 168779 34.07% 0 13,230
Miscellaneous 3,795 1,632 903 23.79% 0 0
Adolescent Development
Program
3,795
1,632
903
23.79%
0
0
Income Generation from
Medicine
-
-
-
33.97%
9,338,529
4,804,690
ESP+ Clinical Service
1,406,382
1,524,923
474,008
33.71%
42,389,965
39,974,884
ESP+ BCC Service
662,517
544,576
226182
34.14%
0
38,870
Other Service
3,795
1,632
903
23.79%
0
0
Grand Total 2,072,694 2,071,131 701,093
33.83%
42,389,965
40,013,754
ESP+ Clinical Service %
67.85%
73.63%
-
-
100.00%
99.90%
ESP+ BCC Service %
31.97%
26.30%
-
-
0.00%
0.10%
Other Service %
0.18%
0.08%
-
-
0.00%
0.00%

Pag
e66
DSCC PA 1 PSTC (January-March,2018)
TABLE 08.01:
PA wise Performance Summary
Contact
Service
Propoor %
Revenue
Subsidy
Reproductive Health 50,919 52,762 41.55% 2,119,475 1,773,766
Maternal Care 24,345 24,345 41.27% 1,562,118 1,230,315
Antenatal Care 15,792 15,792 39.11% 409,808 379,792
Delivery Care (NVD) 247 247 33.60% 146,700 75,075
Delivery Care (CS) 153 153 39.87% 804,800 572,200
Postnatal Care 4,926 4,926 47.50% 116,960 129,340
Neonatal Care 3,227 3,227 42.95% 83,850 73,908
Menstrual Regulation 351 351 30.20% 220,470 63,570
Post Abortion Care 10 10 0.00% 24,800 200
Family Planning 9,667 9,667 38.17% 0 0
Emergency Contraceptive Pill 0 0 0.00% 0 0
Maternal Nutrition 120 120 78.33% 0 0
Violence Against Women 104 104 40.38% 0 0
Adolescent Reproductive Health Care 4,555 5,369 44.28% 94,900 123,500
RTI/STI Care 6,668 7,594 48.32% 114,016 219,392
Other Reproductive Health Care 5,099 5,202 38.03% 103,171 136,789
Child Health Care 16,640 16,640 23.40% 167,870 138,430
Immunization Program - EPI 10,380 10,380 13.39% 0 0
Immunization Program - NID 0 0 0.00% 0 0
Control of Diarrhoea & Other
Childhood Diseases
2,656
2,656
40.47%
72,180
61,220
Diarrhea 2,656 2,656 40.47% 72,180 61,220
Measles 0 0 0.00% 0 0
Control of Acute Respiratory
Infections
3,458
3,458
39.04%
95,690
77,210
Control of Micronutrient Deficiency 146 146 53.42% 0 0
Child Nutrition 146 146 53.42% 0 0
Vitamin A Deficiency 0 0 0.00% 0 0
Iodine Deficiency 0 0 0.00% 0 0

Pag
e67
DSCC PA 1 PSTC (January-March,2018)
TABLE 08.01:
PA wise Performance Summary
Contact
Service
Propoor %
Revenue
Subsidy
Communicable Diseases Control 0 0 0.00% 0 0
Tuberculosis Control 0 0 0.00% 0 0
Other Communicable Diseases
Control
0
0
0.00%
0
0
Limited Curative Care 22,027 23,308 34.75% 618,628 482,033
First Aid for Injuries 20 20 45.00% 550 450
Emergency Care 57 57 33.33% 12,910 3,680
Treatment of Minor Infections 21,950 23,231 34.75% 605,168 477,903
Support Services for ESP+ 7,540 17,486 31.29% 1,282,610 626,800
Diagnostic Service 7,501 17,447 31.21% 1,272,410 617,700
Emergency Transportation Service 39 39 46.15% 10,200 9,100
Behavior Change Communication 46,096 44,372 38.42% 0 0
Health Education (Session) 7,542 7,091 42.06% 0 0
Counseling 38,554 37,281 37.71% 0 0
Miscellaneous 44 44 31.82% 0 0
Adolescent Development Program 44 44 31.82% 0 0
Income Generation from Medicine
-
-
29.88%
638,805
272,177
ESP+ Clinical Service
97,126
110,196
36.10%
4,188,583
3,021,029
ESP+ BCC Service
46,096
44,372
38.42%
0
0
Other Service
44
44
31.82%
0
0
Grand Total
143,266
154,612
36.85%
4,188,583
3,021,029
ESP+ Clinical Service %
67.79%
71.27%
-
100%
100%
ESP+ BCC Service %
32.18%
28.70%
-
0%
0%
Other Service %
0.03%
0.03%
-
0%
0%

Pag
e68
DSCC PA 2 KMSS (January-March,2018)
TABLE 08.02:
PA wise Performance Summary
Contact
Service
Propoor %
Revenue
Subsidy
Reproductive Health
29,807
30,493
29.66%
748,075
381,436
Maternal Care 9,173 9,173 28.08% 362,015 144,435
Antenatal Care 5,675 5,675 29.06% 110,050 60,130
Delivery Care (NVD) 242 242 28.10% 86,150 21,000
Delivery Care (CS) 28 28 28.57% 100,800 27,000
Postnatal Care 1,918 1,918 26.80% 38,735 21,465
Neonatal Care 1,310 1,310 25.73% 26,280 14,840
Menstrual Regulation 487 487 31.01% 172,360 56,010
Post Abortion Care 14 14 35.71% 0 0
Family Planning 5,676 5,676 30.06% 0 0
Emergency Contraceptive Pill 0 0 0.00% 0 0
Maternal Nutrition 111 111 54.05% 420 280
Violence Against Women 48 48 43.75% 0 0
Adolescent Reproductive Health Care 5,159 5,389 31.63% 84,440 58,621
RTI/STI Care 4,264 4,297 32.43% 70,960 57,670
Other Reproductive Health Care 4,875 5,298 26.83% 57,880 64,420
Child Health Care
11,773
11,773
30.75%
117,565
75,935
Immunization Program - EPI 5,229 5,229 25.84% 0 0
Immunization Program - NID 0 0 0.00% 0 0
Control of Diarrhoea & Other
Childhood Diseases
2,593
2,593
34.59%
53,125
35,015
Diarrhea 2,593 2,593 34.59% 53,125 35,015
Measles 0 0 0.00% 0 0
Control of Acute Respiratory
Infections
3,290
3,290
33.86%
63,100
39,880
Control of Micronutrient Deficiency 661 661 39.03% 1,340 1,040
Child Nutrition 221 221 33.03% 1,340 1,040
Vitamin A Deficiency 440 440 42.05% 0 0
Iodine Deficiency 0 0 0.00% 0 0

Pag
e69
DSCC PA 2 KMSS (January-March,2018)
TABLE 08.02:
PA wise Performance Summary
Contact
Service
Propoor %
Revenue
Subsidy
Communicable Diseases Control
0
0
0.00%
0
0
Tuberculosis Control 0 0 0.00% 0 0
Other Communicable Diseases
Control
0
0
0.00%
0
0
Limited Curative Care
27,383
28,177
31.67%
532,565
268,092
First Aid for Injuries 284 284 34.51% 5,320 4,390
Emergency Care 244 244 34.02% 5,330 4,590
Treatment of Minor Infections 26,855 27,649 31.62% 521,915 259,112
Support Services for ESP+
4,160
7,705
28.37%
370,330
98,050
Diagnostic Service 4,160 7,705 28.37% 370,330 98,050
Emergency Transportation Service 0 0 0.00% 0 0
Behavior Change Communication
65,467
65,046
32.30%
0
0
Health Education (Session) 24,085 23,775 30.40% 0 0
Counseling 41,382 41,271 33.41% 0 0
Miscellaneous
313
313
24.92%
0
0
Adolescent Development Program 313 313 24.92% 0 0
Income Generation from Medicine
-
-
35.01%
259,451
139,790
ESP+ Clinical Service
73,123
78,148
30.52%
1,768,535
823,513
ESP+ BCC Service
65,467
65,046
32.30%
0
0
Other Service
313
313
24.92%
0
0
Grand Total
138,903
143,507
31.34%
1,768,535
823,513
ESP+ Clinical Service %
52.64%
54.46%
-
100%
100%
ESP+ BCC Service %
47.13%
45.33%
-
0%
0%
Other Service %
0.23%
0.22%
-
0%
0%

Pag
e70
DSCC PA 3, BAPSA (January-March,2018)
TABLE 08.03:
PA wise Performance Summary
Contact
Service
Propoor %
Revenue
Subsidy
Reproductive Health
28,065
28,256
38.87%
1,628,318
1,330,730
Maternal Care 11,677 11,677 39.29% 1,281,038 904,652
Antenatal Care 6,646 6,646 36.44% 140,170 125,350
Delivery Care (NVD) 337 337 38.87% 194,800 142,200
Delivery Care (CS) 156 156 32.69% 885,000 519,000
Postnatal Care 2,674 2,674 46.75% 33,955 72,635
Neonatal Care 1,864 1,864 39.38% 27,113 45,467
Menstrual Regulation 527 527 42.69% 204,165 205,700
Post Abortion Care 103 103 34.95% 40,860 19,280
Family Planning 8,315 8,315 32.51% 4,207 2,924
Emergency Contraceptive Pill 0 0 0.00% 0 0
Maternal Nutrition 0 0 0.00% 0 0
Violence Against Women 82 82 52.44% 360 1,400
Adolescent Reproductive Health Care 3,804 3,930 44.01% 35,686 101,264
RTI/STI Care 2,135 2,200 51.99% 38,157 55,433
Other Reproductive Health Care 1,422 1,422 37.27% 23,845 40,077
Child Health Care
16,438
16,438
30.48%
106,466
138,860
Immunization Program - EPI 9,778 9,778 21.31% 0 120
Immunization Program - NID 0 0 0.00% 0 0
Control of Diarrhoea & Other
Childhood Diseases
2,548
2,548
45.92%
43,324
58,472
Diarrhea 2,548 2,548 45.92% 43,324 58,472
Measles 0 0 0.00% 0 0
Control of Acute Respiratory
Infections
3,223
3,223
41.86%
59,742
67,188
Control of Micronutrient Deficiency 889 889 45.89% 3,400 13,080
Child Nutrition 440 440 47.50% 2,160 6,560
Vitamin A Deficiency 435 435 43.68% 1,080 6,120
Iodine Deficiency 14 14 64.29% 160 400

Pag
e71
DSCC PA 3, BAPSA (January-March,2018)
TABLE 08.03:
PA wise Performance Summary
Contact
Service
Propoor %
Revenue
Subsidy
Communicable Diseases Control
0
0
0.00%
0
0
Tuberculosis Control 0 0 0.00% 0 0
Other Communicable Diseases
Control
0
0
0.00%
0
0
Limited Curative Care
14,842
14,842
47.51%
244,050
344,049
First Aid for Injuries 203 203 65.52% 3,190 5,470
Emergency Care 45 45 53.33% 740 1,140
Treatment of Minor Infections 14,448 14,448 47.25% 237,800 333,919
Support Services for ESP+
10,924
10,984
34.41%
747,591
485,229
Diagnostic Service 10,919 10,979 34.42% 746,391 484,929
Emergency Transportation Service 5 5 20.00% 1,200 300
Behavior Change Communication
23,611
23,476
39.28%
0
0
Health Education (Session) 9,231 9,177 40.14% 0 0
Counseling 14,380 14,299 38.73% 0 0
Miscellaneous
0
0
0.00%
0
0
Adolescent Development Program 0 0 0.00% 0 0
Income Generation from Medicine
-
-
40.30%
559,518
377,719
ESP+ Clinical Service
70,123
70,374
38.02%
2,724,105
2,295,348
ESP+ BCC Service
23,611
23,476
39.28%
0
0
Other Service
0
0
0.00%
0
0
Grand Total
93,734
93,850
38.34%
2,724,105
2,295,348
ESP+ Clinical Service %
74.81%
74.99%
-
100%
100%
ESP+ BCC Service %
25.19%
25.01%
-
0%
0%
Other Service %
0.00%
0.00%
-
0%
0%

Pag
e72
P
age7
2
DSCC PA 4 PSTC (January-March,2018)
TABLE 08.04:
PA wise Performance Summary
Contact
Service
Propoor %
Revenue
Subsidy
Reproductive Health
29,050
30,052
36.17%
1,395,074
631,298
Maternal Care 12,527 12,527 32.59% 1,167,709 504,855
Antenatal Care 8,782 8,782 31.13% 338,494 104,395
Delivery Care (NVD) 193 193 33.68% 111,600 62,100
Delivery Care (CS) 105 105 27.62% 660,500 284,500
Postnatal Care 2,279 2,279 37.91% 46,950 43,480
Neonatal Care 1,168 1,168 33.39% 10,165 10,380
Menstrual Regulation 228 228 24.12% 150,300 41,100
Post Abortion Care 8 8 0.00% 20,000 0
Family Planning 9,206 9,206 38.34% 665 1,288
Emergency Contraceptive Pill 0 0 0.00% 0 0
Maternal Nutrition 35 35 71.43% 0 0
Violence Against Women 57 57 38.60% 0 0
Adolescent Reproductive Health Care 3,011 4,013 38.09% 31,390 46,240
RTI/STI Care 2,862 2,862 44.10% 24,530 34,585
Other Reproductive Health Care 1,116 1,116 34.32% 480 3,230
Child Health Care
13,109
13,109
23.22%
102,515
55,295
Immunization Program - EPI 8,214 8,214 13.93% 0 0
Immunization Program - NID 0 0 0.00% 0 0
Control of Diarrhoea & Other
Childhood Diseases
1,880
1,880
41.28%
49,300
29,100
Diarrhea 1,880 1,880 41.28% 49,300 29,100
Measles 0 0 0.00% 0 0
Control of Acute Respiratory
Infections
1,948
1,948
35.11%
53,215
26,195
Control of Micronutrient Deficiency 1,067 1,067 41.24% 0 0
Child Nutrition 50 50 56.00% 0 0
Vitamin A Deficiency 1,017 1,017 40.51% 0 0
Iodine Deficiency 0 0 0.00% 0 0
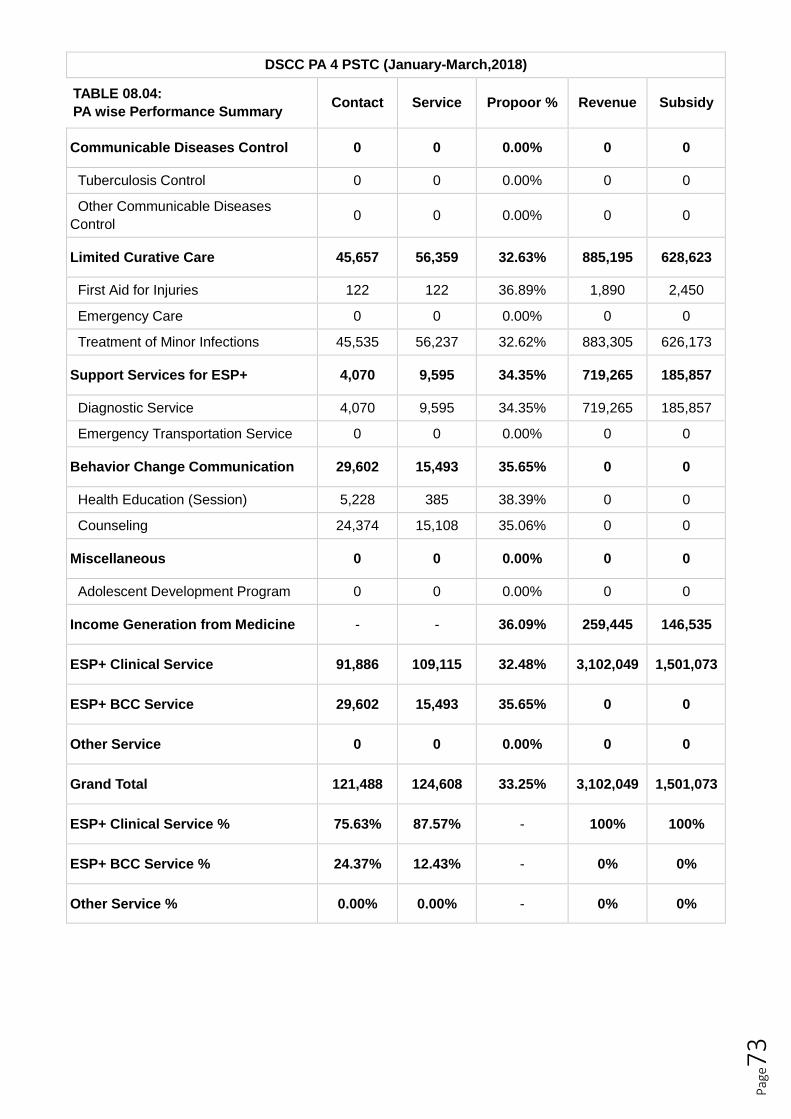
Pag
e73
DSCC PA 4 PSTC (January-March,2018)
TABLE 08.04:
PA wise Performance Summary
Contact
Service
Propoor %
Revenue
Subsidy
Communicable Diseases Control
0
0
0.00%
0
0
Tuberculosis Control 0 0 0.00% 0 0
Other Communicable Diseases
Control
0
0
0.00%
0
0
Limited Curative Care
45,657
56,359
32.63%
885,195
628,623
First Aid for Injuries 122 122 36.89% 1,890 2,450
Emergency Care 0 0 0.00% 0 0
Treatment of Minor Infections 45,535 56,237 32.62% 883,305 626,173
Support Services for ESP+
4,070
9,595
34.35%
719,265
185,857
Diagnostic Service 4,070 9,595 34.35% 719,265 185,857
Emergency Transportation Service 0 0 0.00% 0 0
Behavior Change Communication
29,602
15,493
35.65%
0
0
Health Education (Session) 5,228 385 38.39% 0 0
Counseling 24,374 15,108 35.06% 0 0
Miscellaneous
0
0
0.00%
0
0
Adolescent Development Program 0 0 0.00% 0 0
Income Generation from Medicine
-
-
36.09%
259,445
146,535
ESP+ Clinical Service
91,886
109,115
32.48%
3,102,049
1,501,073
ESP+ BCC Service
29,602
15,493
35.65%
0
0
Other Service
0
0
0.00%
0
0
Grand Total
121,488
124,608
33.25%
3,102,049
1,501,073
ESP+ Clinical Service %
75.63%
87.57%
-
100%
100%
ESP+ BCC Service %
24.37%
12.43%
-
0%
0%
Other Service %
0.00%
0.00%
-
0%
0%

Pag
e74
DSCC PA 5 PSTC (January-March,2018)
TABLE 08.05:
PA wise Performance Summary
Contact
Service
Propoor %
Revenue
Subsidy
Reproductive Health
33,579
34,126
34.84%
1,178,120
912,897
Maternal Care 18,611 18,611 34.26% 1,010,865 647,714
Antenatal Care 10,565 10,565 33.79% 210,072 185,360
Delivery Care (NVD) 160 160 30.63% 99,900 44,100
Delivery Care (CS) 108 108 28.70% 518,300 291,700
Postnatal Care 4,811 4,811 35.21% 113,773 72,162
Neonatal Care 2,967 2,967 34.82% 68,820 54,392
Menstrual Regulation 32 32 40.63% 13,200 18,800
Post Abortion Care 6 6 0.00% 12,000 0
Family Planning 4,345 4,345 33.00% 1,315 228
Emergency Contraceptive Pill 0 0 0.00% 0 0
Maternal Nutrition 131 131 45.04% 0 0
Violence Against Women 73 73 58.90% 0 0
Adolescent Reproductive Health Care 5,525 6,020 34.05% 67,010 143,105
RTI/STI Care 3,893 3,897 40.30% 59,115 82,590
Other Reproductive Health Care 963 1,011 33.54% 14,615 20,460
Child Health Care
13,398
13,398
35.09%
157,810
123,310
Immunization Program - EPI 5,824 5,824 34.68% 0 0
Immunization Program - NID 0 0 0.00% 0 0
Control of Diarrhoea & Other
Childhood Diseases
3,157
3,157
35.76%
64,945
57,700
Diarrhea 3,157 3,157 35.76% 64,945 57,700
Measles 0 0 0.00% 0 0
Control of Acute Respiratory
Infections
4,081
4,081
34.53%
92,865
65,610
Control of Micronutrient Deficiency 336 336 42.86% 0 0
Child Nutrition 256 256 38.67% 0 0
Vitamin A Deficiency 80 80 56.25% 0 0
Iodine Deficiency 0 0 0.00% 0 0
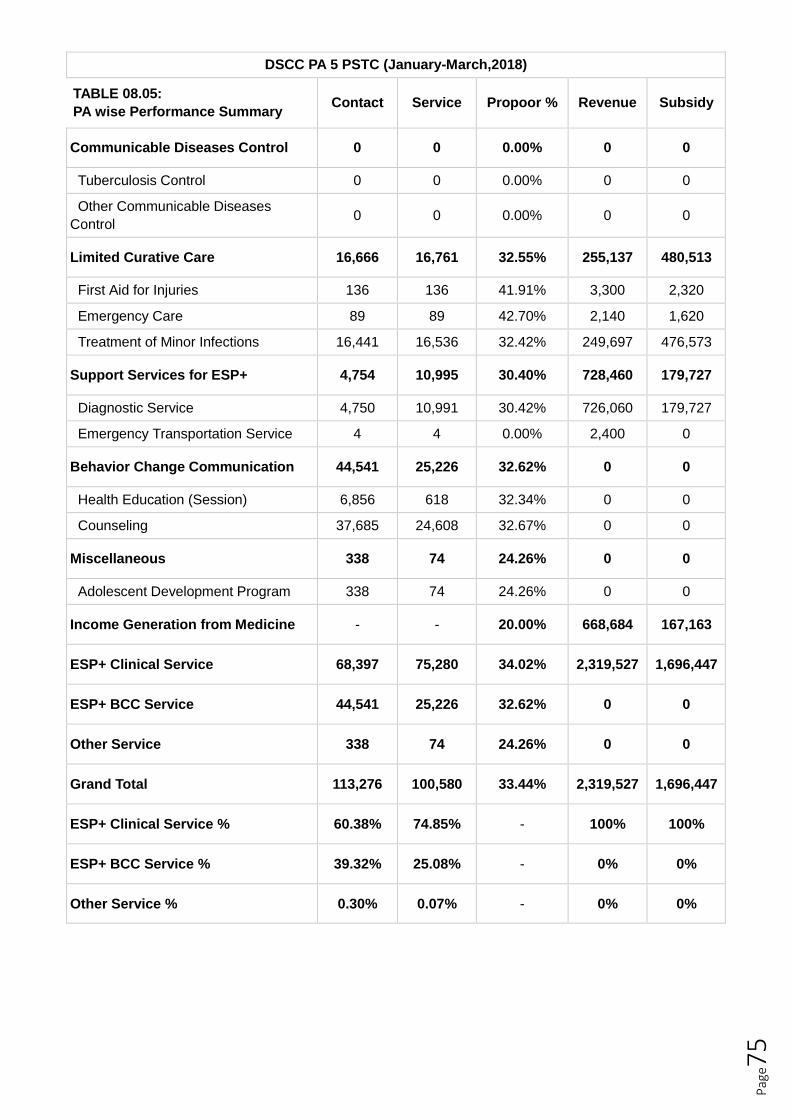
Pag
e75
DSCC PA 5 PSTC (January-March,2018)
TABLE 08.05:
PA wise Performance Summary
Contact
Service
Propoor %
Revenue
Subsidy
Communicable Diseases Control
0
0
0.00%
0
0
Tuberculosis Control 0 0 0.00% 0 0
Other Communicable Diseases
Control
0
0
0.00%
0
0
Limited Curative Care
16,666
16,761
32.55%
255,137
480,513
First Aid for Injuries 136 136 41.91% 3,300 2,320
Emergency Care 89 89 42.70% 2,140 1,620
Treatment of Minor Infections 16,441 16,536 32.42% 249,697 476,573
Support Services for ESP+
4,754
10,995
30.40%
728,460
179,727
Diagnostic Service 4,750 10,991 30.42% 726,060 179,727
Emergency Transportation Service 4 4 0.00% 2,400 0
Behavior Change Communication
44,541
25,226
32.62%
0
0
Health Education (Session) 6,856 618 32.34% 0 0
Counseling 37,685 24,608 32.67% 0 0
Miscellaneous
338
74
24.26%
0
0
Adolescent Development Program 338 74 24.26% 0 0
Income Generation from Medicine
-
-
20.00%
668,684
167,163
ESP+ Clinical Service
68,397
75,280
34.02%
2,319,527
1,696,447
ESP+ BCC Service
44,541
25,226
32.62%
0
0
Other Service
338
74
24.26%
0
0
Grand Total
113,276
100,580
33.44%
2,319,527
1,696,447
ESP+ Clinical Service %
60.38%
74.85%
-
100%
100%
ESP+ BCC Service %
39.32%
25.08%
-
0%
0%
Other Service %
0.30%
0.07%
-
0%
0%
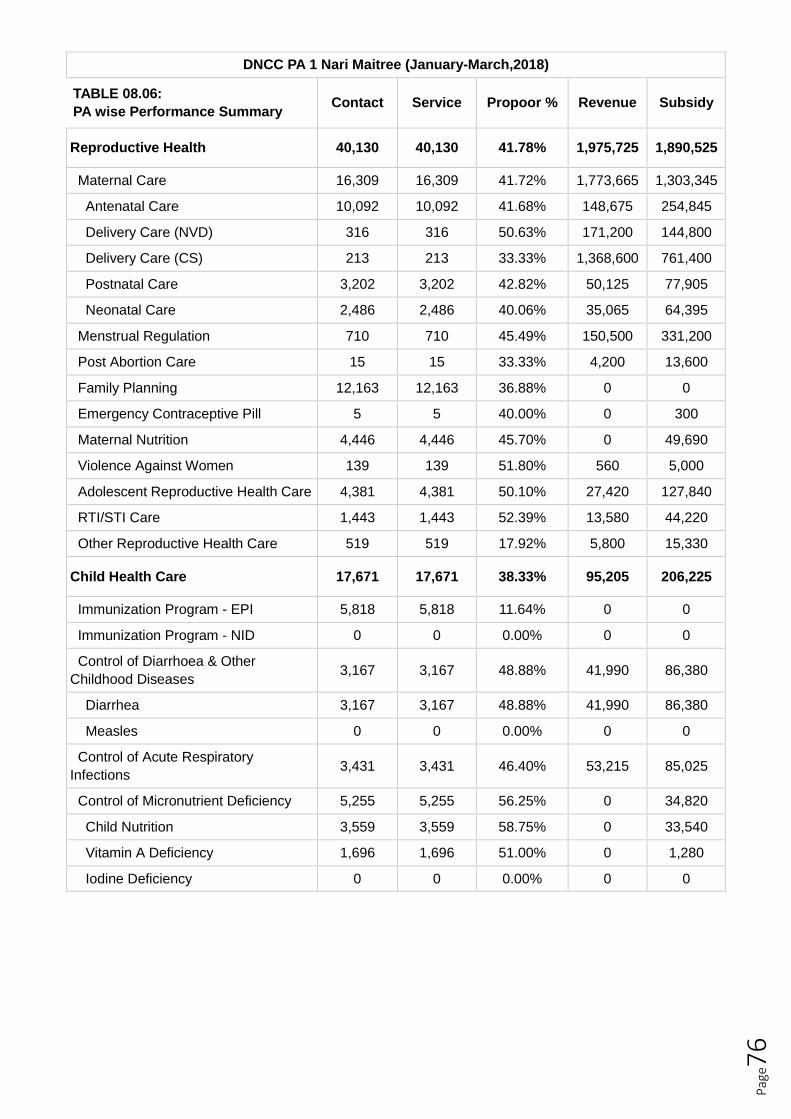
Pag
e76
DNCC PA 1 Nari Maitree (January-March,2018)
TABLE 08.06:
PA wise Performance Summary
Contact
Service
Propoor %
Revenue
Subsidy
Reproductive Health
40,130
40,130
41.78%
1,975,725
1,890,525
Maternal Care 16,309 16,309 41.72% 1,773,665 1,303,345
Antenatal Care 10,092 10,092 41.68% 148,675 254,845
Delivery Care (NVD) 316 316 50.63% 171,200 144,800
Delivery Care (CS) 213 213 33.33% 1,368,600 761,400
Postnatal Care 3,202 3,202 42.82% 50,125 77,905
Neonatal Care 2,486 2,486 40.06% 35,065 64,395
Menstrual Regulation 710 710 45.49% 150,500 331,200
Post Abortion Care 15 15 33.33% 4,200 13,600
Family Planning 12,163 12,163 36.88% 0 0
Emergency Contraceptive Pill 5 5 40.00% 0 300
Maternal Nutrition 4,446 4,446 45.70% 0 49,690
Violence Against Women 139 139 51.80% 560 5,000
Adolescent Reproductive Health Care 4,381 4,381 50.10% 27,420 127,840
RTI/STI Care 1,443 1,443 52.39% 13,580 44,220
Other Reproductive Health Care 519 519 17.92% 5,800 15,330
Child Health Care
17,671
17,671
38.33%
95,205
206,225
Immunization Program - EPI 5,818 5,818 11.64% 0 0
Immunization Program - NID 0 0 0.00% 0 0
Control of Diarrhoea & Other
Childhood Diseases
3,167
3,167
48.88%
41,990
86,380
Diarrhea 3,167 3,167 48.88% 41,990 86,380
Measles 0 0 0.00% 0 0
Control of Acute Respiratory
Infections
3,431
3,431
46.40%
53,215
85,025
Control of Micronutrient Deficiency 5,255 5,255 56.25% 0 34,820
Child Nutrition 3,559 3,559 58.75% 0 33,540
Vitamin A Deficiency 1,696 1,696 51.00% 0 1,280
Iodine Deficiency 0 0 0.00% 0 0

Pag
e77
DNCC PA 1 Nari Maitree (January-March,2018)
TABLE 08.06:
PA wise Performance Summary
Contact
Service
Propoor %
Revenue
Subsidy
Communicable Diseases Control
0
0
0.00%
0
0
Tuberculosis Control 0 0 0.00% 0 0
Other Communicable Diseases
Control
0
0
0.00%
0
0
Limited Curative Care
10,995
11,025
27.70%
239,993
211,362
First Aid for Injuries 190 190 20.53% 11,050 6,480
Emergency Care 171 171 32.16% 4,495 3,280
Treatment of Minor Infections 10,463 10,493 27.50% 221,258 197,952
Support Services for ESP+
7,848
15,478
41.41%
944,456
938,858
Diagnostic Service 7,740 15,370 41.03% 937,976 912,938
Emergency Transportation Service 108 108 68.52% 6,480 25,920
Behavior Change Communication
42,141
42,131
39.93%
0
0
Health Education (Session) 13,463 13,453 39.23% 0 0
Counseling 28,678 28,678 40.26% 0 0
Miscellaneous
0
0
0.00%
0
0
Adolescent Development Program 0 0 0.00% 0 0
Income Generation from Medicine
-
-
57.66%
446,045
607,382
ESP+ Clinical Service
76,473
84,133
38.92%
3,252,189
3,243,320
ESP+ BCC Service
42,141
42,131
39.93%
0
0
Other Service
0
0
0.00%
0
0
Grand Total
118,614
126,264
39.28%
3,252,189
3,243,320
ESP+ Clinical Service %
64.47%
66.63%
-
100%
100%
ESP+ BCC Service %
35.53%
33.37%
-
0%
0%
Other Service %
0.00%
0.00%
-
0%
0%
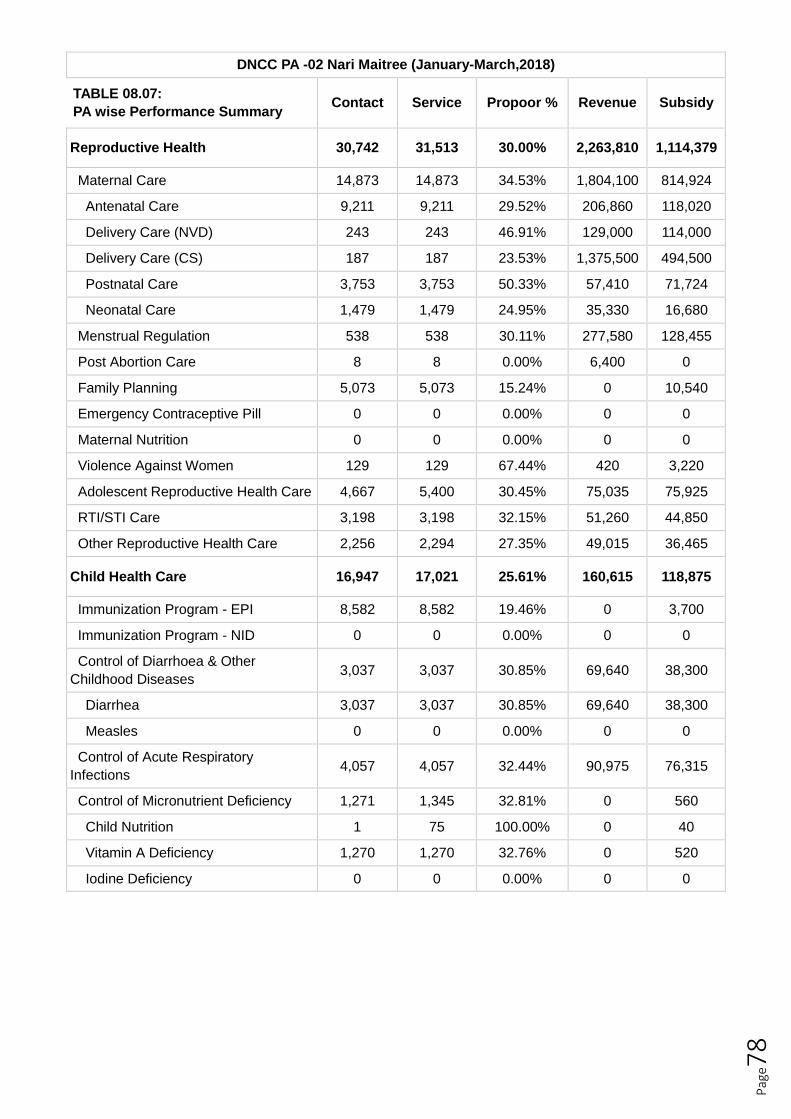
Pag
e78
DNCC PA -02 Nari Maitree (January-March,2018)
TABLE 08.07:
PA wise Performance Summary
Contact
Service
Propoor %
Revenue
Subsidy
Reproductive Health
30,742
31,513
30.00%
2,263,810
1,114,379
Maternal Care 14,873 14,873 34.53% 1,804,100 814,924
Antenatal Care 9,211 9,211 29.52% 206,860 118,020
Delivery Care (NVD) 243 243 46.91% 129,000 114,000
Delivery Care (CS) 187 187 23.53% 1,375,500 494,500
Postnatal Care 3,753 3,753 50.33% 57,410 71,724
Neonatal Care 1,479 1,479 24.95% 35,330 16,680
Menstrual Regulation 538 538 30.11% 277,580 128,455
Post Abortion Care 8 8 0.00% 6,400 0
Family Planning 5,073 5,073 15.24% 0 10,540
Emergency Contraceptive Pill 0 0 0.00% 0 0
Maternal Nutrition 0 0 0.00% 0 0
Violence Against Women 129 129 67.44% 420 3,220
Adolescent Reproductive Health Care 4,667 5,400 30.45% 75,035 75,925
RTI/STI Care 3,198 3,198 32.15% 51,260 44,850
Other Reproductive Health Care 2,256 2,294 27.35% 49,015 36,465
Child Health Care
16,947
17,021
25.61%
160,615
118,875
Immunization Program - EPI 8,582 8,582 19.46% 0 3,700
Immunization Program - NID 0 0 0.00% 0 0
Control of Diarrhoea & Other
Childhood Diseases
3,037
3,037
30.85%
69,640
38,300
Diarrhea 3,037 3,037 30.85% 69,640 38,300
Measles 0 0 0.00% 0 0
Control of Acute Respiratory
Infections
4,057
4,057
32.44%
90,975
76,315
Control of Micronutrient Deficiency 1,271 1,345 32.81% 0 560
Child Nutrition 1 75 100.00% 0 40
Vitamin A Deficiency 1,270 1,270 32.76% 0 520
Iodine Deficiency 0 0 0.00% 0 0

Pag
e79
DNCC PA -02 Nari Maitree (January-March,2018)
TABLE 08.07:
PA wise Performance Summary
Contact
Service
Propoor %
Revenue
Subsidy
Communicable Diseases Control
0
0
0.00%
0
0
Tuberculosis Control 0 0 0.00% 0 0
Other Communicable Diseases
Control
0
0
0.00%
0
0
Limited Curative Care
9,334
9,338
26.70%
246,969
94,941
First Aid for Injuries 15 15 53.33% 280 320
Emergency Care 12 12 58.33% 200 280
Treatment of Minor Infections 9,293 9,297 26.61% 246,249 94,021
Support Services for ESP+
6,723
15,939
32.43%
1,220,626
595,498
Diagnostic Service 6,715 15,931 32.46% 1,218,426 595,298
Emergency Transportation Service 8 8 0.00% 2,200 200
Behavior Change Communication
52,037
51,569
26.26%
0
0
Health Education (Session) 28,638 28,200 25.10% 0 0
Counseling 23,399 23,369 27.68% 0 0
Miscellaneous
763
763
0.00%
0
0
Adolescent Development Program 763 763 0.00% 0 0
Income Generation from Medicine
-
-
26.45%
881,723
317,049
ESP+ Clinical Service
63,732
73,797
28.61%
3,891,780
1,923,373
ESP+ BCC Service
52,037
51,569
26.26%
0
0
Other Service
763
763
0.00%
0
0
Grand Total
116,532
126,129
27.37%
3,891,780
1,923,373
ESP+ Clinical Service %
54.69%
58.51%
-
100%
100%
ESP+ BCC Service %
44.65%
40.89%
-
0%
0%
Other Service %
0.65%
0.60%
-
0%
0%

Pag
e80
DNCC PA 3 UTPS (January-March,2018)
TABLE 08.08:
PA wise Performance Summary
Contact
Service
Propoor %
Revenue
Subsidy
Reproductive Health
24,975
25,050
37.39%
832,109
818,181
Maternal Care 10,786 10,786 36.40% 720,659 656,151
Antenatal Care 6,622 6,622 35.62% 90,840 107,820
Delivery Care (NVD) 301 301 36.54% 152,800 88,000
Delivery Care (CS) 103 103 33.98% 431,179 392,821
Postnatal Care 2,378 2,378 37.17% 27,680 44,210
Neonatal Care 1,382 1,382 38.93% 18,160 23,300
Menstrual Regulation 233 233 50.64% 48,500 91,300
Post Abortion Care 28 28 35.71% 10,200 6,600
Family Planning 8,442 8,442 37.15% 0 0
Emergency Contraceptive Pill 0 0 0.00% 0 0
Maternal Nutrition 129 129 45.74% 0 0
Violence Against Women 93 93 61.29% 0 0
Adolescent Reproductive Health Care 2,194 2,269 40.34% 12,940 31,880
RTI/STI Care 1,396 1,396 43.55% 9,330 16,290
Other Reproductive Health Care 1,674 1,674 32.26% 30,480 15,960
Child Health Care
12,035
12,035
37.70%
44,970
70,190
Immunization Program - EPI 7,314 7,314 34.84% 0 0
Immunization Program - NID 0 0 0.00% 0 0
Control of Diarrhoea & Other
Childhood Diseases
1,731
1,731
43.39%
18,470
32,460
Diarrhea 1,731 1,731 43.39% 18,470 32,460
Measles 0 0 0.00% 0 0
Control of Acute Respiratory
Infections
2,154
2,154
41.23%
26,500
37,730
Control of Micronutrient Deficiency 836 836 41.87% 0 0
Child Nutrition 159 159 38.99% 0 0
Vitamin A Deficiency 677 677 42.54% 0 0
Iodine Deficiency 0 0 0.00% 0 0
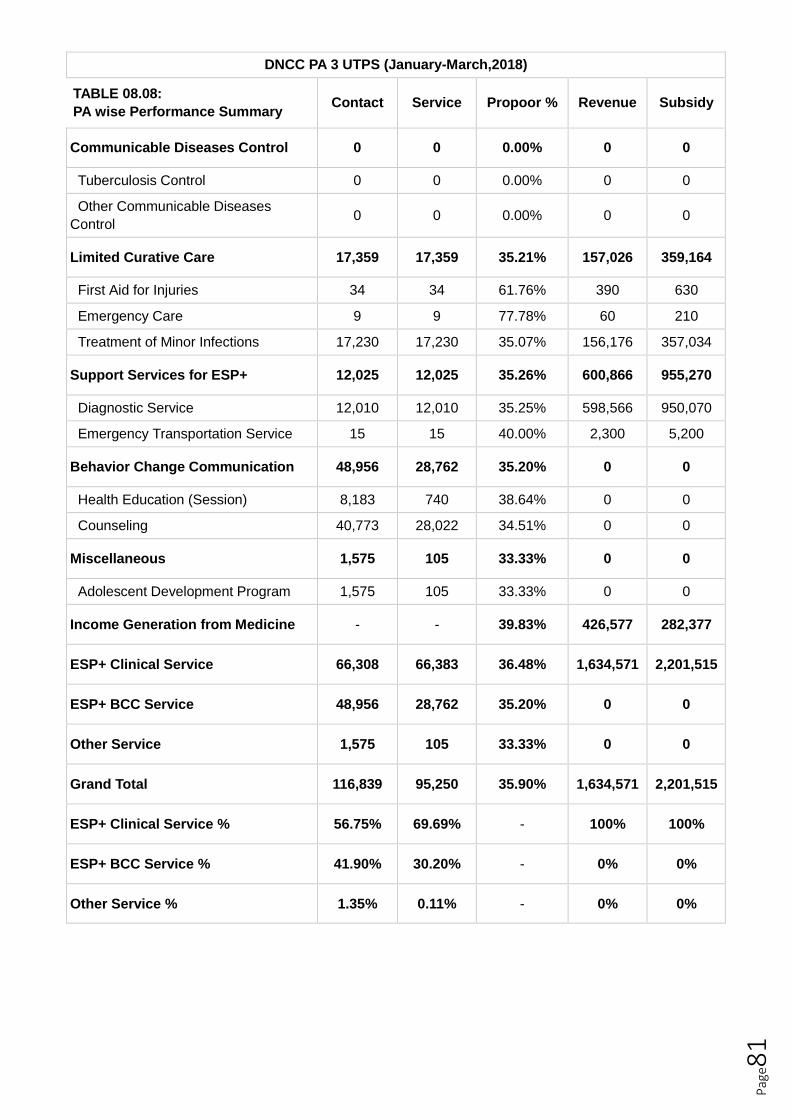
Pag
e81
DNCC PA 3 UTPS (January-March,2018)
TABLE 08.08:
PA wise Performance Summary
Contact
Service
Propoor %
Revenue
Subsidy
Communicable Diseases Control
0
0
0.00%
0
0
Tuberculosis Control 0 0 0.00% 0 0
Other Communicable Diseases
Control
0
0
0.00%
0
0
Limited Curative Care
17,359
17,359
35.21%
157,026
359,164
First Aid for Injuries 34 34 61.76% 390 630
Emergency Care 9 9 77.78% 60 210
Treatment of Minor Infections 17,230 17,230 35.07% 156,176 357,034
Support Services for ESP+
12,025
12,025
35.26%
600,866
955,270
Diagnostic Service 12,010 12,010 35.25% 598,566 950,070
Emergency Transportation Service 15 15 40.00% 2,300 5,200
Behavior Change Communication
48,956
28,762
35.20%
0
0
Health Education (Session) 8,183 740 38.64% 0 0
Counseling 40,773 28,022 34.51% 0 0
Miscellaneous
1,575
105
33.33%
0
0
Adolescent Development Program 1,575 105 33.33% 0 0
Income Generation from Medicine
-
-
39.83%
426,577
282,377
ESP+ Clinical Service
66,308
66,383
36.48%
1,634,571
2,201,515
ESP+ BCC Service
48,956
28,762
35.20%
0
0
Other Service
1,575
105
33.33%
0
0
Grand Total
116,839
95,250
35.90%
1,634,571
2,201,515
ESP+ Clinical Service %
56.75%
69.69%
-
100%
100%
ESP+ BCC Service %
41.90%
30.20%
-
0%
0%
Other Service %
1.35%
0.11%
-
0%
0%

Pag
e82
DNCC PA 4 (January-March,2018)
TABLE 08.09:
PA wise Performance Summary
Contact
Service
Propoor %
Revenue
Subsidy
Reproductive Health
40,699
40,699
40.06%
761,941
2,425,208
Maternal Care 14,421 14,421 40.39% 663,691 1,172,958
Antenatal Care 8,314 8,314 39.14% 124,016 211,010
Delivery Care (NVD) 357 357 74.23% 70,550 285,950
Delivery Care (CS) 92 92 33.70% 420,200 499,800
Postnatal Care 3,353 3,353 43.36% 27,705 106,355
Neonatal Care 2,305 2,305 35.62% 21,220 69,843
Menstrual Regulation 371 371 44.20% 50,850 241,950
Post Abortion Care 8 8 87.50% 800 14,280
Family Planning 10,050 10,050 37.50% 0 402,320
Emergency Contraceptive Pill 43 43 53.49% 140 1,580
Maternal Nutrition 7,107 7,107 42.75% 0 285,380
Violence Against Women 45 45 55.56% 80 1,720
Adolescent Reproductive Health Care 4,803 4,803 39.75% 20,820 170,300
RTI/STI Care 2,604 2,604 41.28% 18,790 90,070
Other Reproductive Health Care 1,247 1,247 37.53% 6,770 44,650
Child Health Care
22,880
22,925
36.13%
49,150
844,910
Immunization Program - EPI 7,679 7,679 34.77% 0 314,820
Immunization Program - NID 0 0 0.00% 0 0
Control of Diarrhoea & Other
Childhood Diseases
1,718
1,718
40.80%
17,600
49,300
Diarrhea 1,718 1,718 40.80% 17,600 49,300
Measles 0 0 0.00% 0 0
Control of Acute Respiratory
Infections
2,438
2,438
42.95%
28,470
69,870
Control of Micronutrient Deficiency 11,045 11,090 34.85% 3,080 410,920
Child Nutrition 8,665 8,710 33.71% 1,360 317,440
Vitamin A Deficiency 2,380 2,380 38.99% 1,720 93,480
Iodine Deficiency 0 0 0.00% 0 0
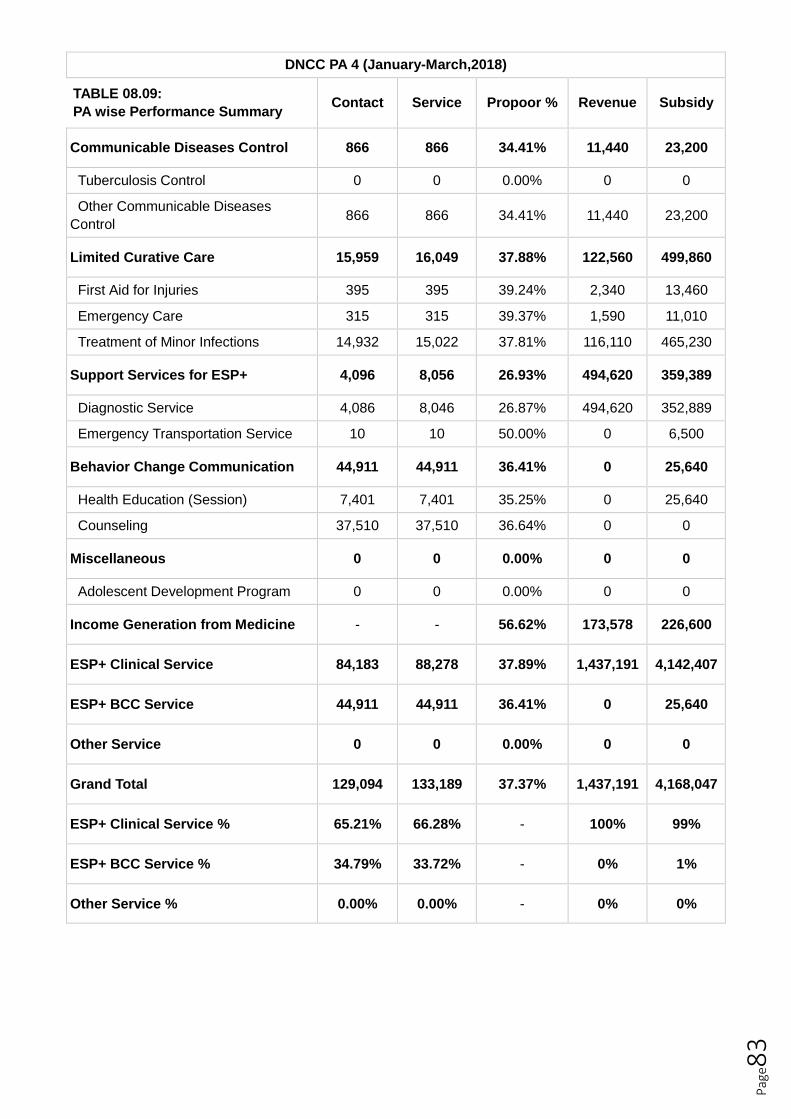
Pag
e83
DNCC PA 4 (January-March,2018)
TABLE 08.09:
PA wise Performance Summary
Contact
Service
Propoor %
Revenue
Subsidy
Communicable Diseases Control
866
866
34.41%
11,440
23,200
Tuberculosis Control 0 0 0.00% 0 0
Other Communicable Diseases
Control
866
866
34.41%
11,440
23,200
Limited Curative Care
15,959
16,049
37.88%
122,560
499,860
First Aid for Injuries 395 395 39.24% 2,340 13,460
Emergency Care 315 315 39.37% 1,590 11,010
Treatment of Minor Infections 14,932 15,022 37.81% 116,110 465,230
Support Services for ESP+
4,096
8,056
26.93%
494,620
359,389
Diagnostic Service 4,086 8,046 26.87% 494,620 352,889
Emergency Transportation Service 10 10 50.00% 0 6,500
Behavior Change Communication
44,911
44,911
36.41%
0
25,640
Health Education (Session) 7,401 7,401 35.25% 0 25,640
Counseling 37,510 37,510 36.64% 0 0
Miscellaneous
0
0
0.00%
0
0
Adolescent Development Program 0 0 0.00% 0 0
Income Generation from Medicine
-
-
56.62%
173,578
226,600
ESP+ Clinical Service
84,183
88,278
37.89%
1,437,191
4,142,407
ESP+ BCC Service
44,911
44,911
36.41%
0
25,640
Other Service
0
0
0.00%
0
0
Grand Total
129,094
133,189
37.37%
1,437,191
4,168,047
ESP+ Clinical Service %
65.21%
66.28%
-
100%
99%
ESP+ BCC Service %
34.79%
33.72%
-
0%
1%
Other Service %
0.00%
0.00%
-
0%
0%

Pag
e84
DNCC, PA 5, DAM (January-March,2018)
TABLE 08.10:
PA wise Performance Summary
Contact
Service
Propoor %
Revenue
Subsidy
Reproductive Health
28,028
28,642
35.69%
1,146,150
788,230
Maternal Care 12,056 12,056 33.08% 1,030,990 593,850
Antenatal Care 7,177 7,177 31.21% 161,960 110,700
Delivery Care (NVD) 214 214 31.78% 144,000 70,000
Delivery Care (CS) 104 104 31.73% 637,000 335,000
Postnatal Care 2,767 2,767 35.53% 56,350 45,520
Neonatal Care 1,794 1,794 37.01% 31,680 32,630
Menstrual Regulation 181 181 42.54% 52,950 65,500
Post Abortion Care 19 19 47.37% 6,600 7,200
Family Planning 7,904 7,904 35.70% 0 24,640
Emergency Contraceptive Pill 0 0 0.00% 0 0
Maternal Nutrition 377 377 41.91% 0 0
Violence Against Women 82 82 57.32% 0 120
Adolescent Reproductive Health Care 4,086 4,655 37.57% 21,290 37,320
RTI/STI Care 1,790 1,811 45.08% 27,970 40,520
Other Reproductive Health Care 1,533 1,557 36.46% 6,350 19,080
Child Health Care
22,478
22,622
36.07%
94,731
130,750
Immunization Program - EPI 16,675 16,675 33.53% 0 27,800
Immunization Program - NID 0 0 0.00% 0 0
Control of Diarrhoea & Other
Childhood Diseases
2,011
2,011
45.95%
32,480
41,400
Diarrhea 2,011 2,011 45.95% 32,480 41,400
Measles 0 0 0.00% 0 0
Control of Acute Respiratory
Infections
3,219
3,219
42.44%
61,971
60,510
Control of Micronutrient Deficiency 573 717 39.62% 280 1,040
Child Nutrition 466 610 39.06% 160 960
Vitamin A Deficiency 95 95 42.11% 0 0
Iodine Deficiency 12 12 41.67% 120 80
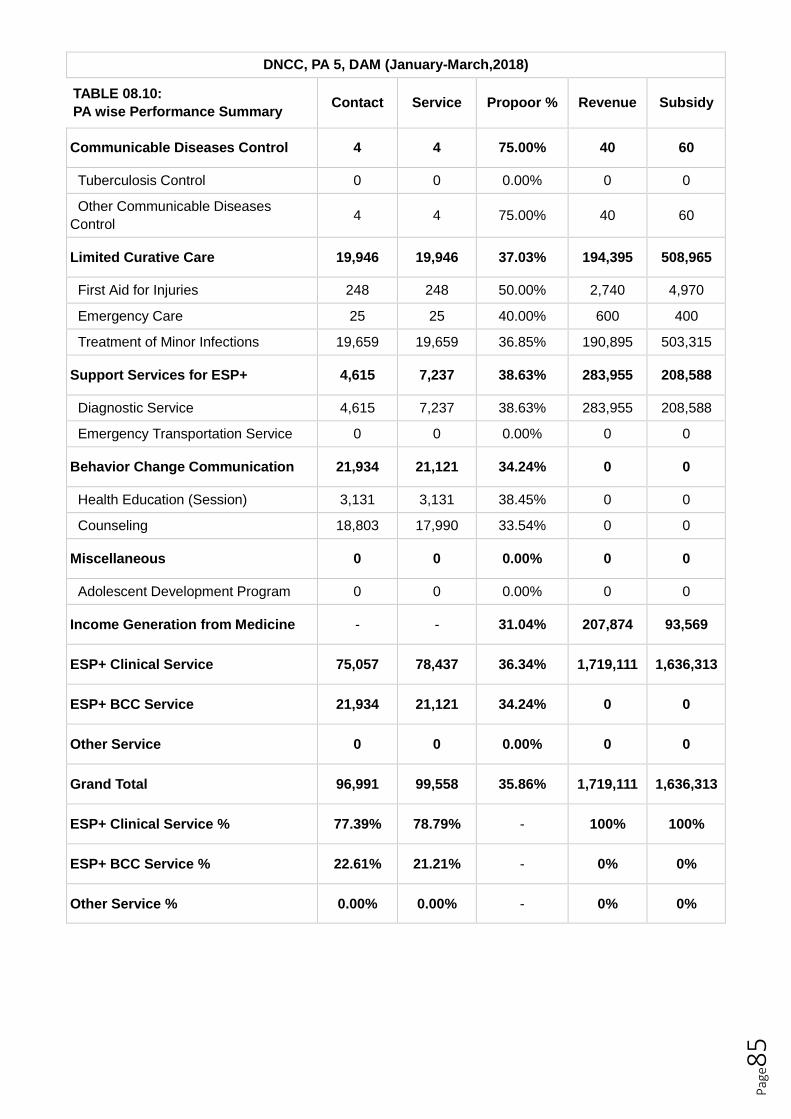
Pag
e85
DNCC, PA 5, DAM (January-March,2018)
TABLE 08.10:
PA wise Performance Summary
Contact
Service
Propoor %
Revenue
Subsidy
Communicable Diseases Control
4
4
75.00%
40
60
Tuberculosis Control 0 0 0.00% 0 0
Other Communicable Diseases
Control
4
4
75.00%
40
60
Limited Curative Care
19,946
19,946
37.03%
194,395
508,965
First Aid for Injuries 248 248 50.00% 2,740 4,970
Emergency Care 25 25 40.00% 600 400
Treatment of Minor Infections 19,659 19,659 36.85% 190,895 503,315
Support Services for ESP+
4,615
7,237
38.63%
283,955
208,588
Diagnostic Service 4,615 7,237 38.63% 283,955 208,588
Emergency Transportation Service 0 0 0.00% 0 0
Behavior Change Communication
21,934
21,121
34.24%
0
0
Health Education (Session) 3,131 3,131 38.45% 0 0
Counseling 18,803 17,990 33.54% 0 0
Miscellaneous
0
0
0.00%
0
0
Adolescent Development Program 0 0 0.00% 0 0
Income Generation from Medicine
-
-
31.04%
207,874
93,569
ESP+ Clinical Service
75,057
78,437
36.34%
1,719,111
1,636,313
ESP+ BCC Service
21,934
21,121
34.24%
0
0
Other Service
0
0
0.00%
0
0
Grand Total
96,991
99,558
35.86%
1,719,111
1,636,313
ESP+ Clinical Service %
77.39%
78.79%
-
100%
100%
ESP+ BCC Service %
22.61%
21.21%
-
0%
0%
Other Service %
0.00%
0.00%
-
0%
0%

Pag
e86
RCC PA 1 RIC (January-March,2018)
TABLE 08.11:
PA wise Performance Summary
Contact
Service
Propoor %
Revenue
Subsidy
Reproductive Health
15,734
15,858
23.41%
568,978
399,634
Maternal Care 5,559 5,559 20.13% 503,902 304,518
Antenatal Care 4,043 4,043 20.43% 73,628 75,892
Delivery Care (NVD) 106 106 12.26% 93,300 8,700
Delivery Care (CS) 76 76 19.74% 316,200 187,100
Postnatal Care 814 814 18.43% 13,984 20,456
Neonatal Care 520 520 22.12% 6,790 12,370
Menstrual Regulation 39 39 23.08% 13,190 14,200
Post Abortion Care 22 22 18.18% 5,640 3,070
Family Planning 6,282 6,282 25.21% 4,922 13,570
Emergency Contraceptive Pill 7 7 0.00% 185 55
Maternal Nutrition 178 178 29.78% 140 180
Violence Against Women 16 16 25.00% 200 200
Adolescent Reproductive Health Care 1,726 1,726 23.41% 18,064 23,746
RTI/STI Care 717 798 32.78% 12,825 15,065
Other Reproductive Health Care 1,188 1,231 22.81% 9,910 25,030
Child Health Care
4,528
4,528
30.63%
16,808
16,680
Immunization Program - EPI 2,923 2,923 27.03% 0 0
Immunization Program - NID 0 0 0.00% 0 0
Control of Diarrhoea & Other
Childhood Diseases
423
423
38.77%
7,473
5,525
Diarrhea 423 423 38.77% 7,473 5,525
Measles 0 0 0.00% 0 0
Control of Acute Respiratory
Infections
535
535
47.10%
8,425
6,945
Control of Micronutrient Deficiency 647 647 27.98% 910 4,210
Child Nutrition 465 465 32.90% 910 4,210
Vitamin A Deficiency 182 182 15.38% 0 0
Iodine Deficiency 0 0 0.00% 0 0

Pag
e87
RCC PA 1 RIC (January-March,2018)
TABLE 08.11:
PA wise Performance Summary
Contact
Service
Propoor %
Revenue
Subsidy
Communicable Diseases Control
0
0
0.00%
0
0
Tuberculosis Control 0 0 0.00% 0 0
Other Communicable Diseases
Control
0
0
0.00%
0
0
Limited Curative Care
19,828
20,446
30.64%
167,139
540,347
First Aid for Injuries 117 117 29.91% 2,920 1,400
Emergency Care 11 11 45.45% 240 60
Treatment of Minor Infections 19,700 20,318 30.63% 163,979 538,887
Support Services for ESP+
4,070
8,250
26.39%
529,990
246,955
Diagnostic Service 4,026 8,206 26.43% 527,290 238,005
Emergency Transportation Service 44 44 22.73% 2,700 8,950
Behavior Change Communication
16,284
16,251
28.48%
0
0
Health Education (Session) 4,430 4,406 34.27% 0 0
Counseling 11,854 11,845 26.31% 0 0
Miscellaneous
168
168
21.43%
0
0
Adolescent Development Program 168 168 21.43% 0 0
Income Generation from Medicine
-
-
34.03%
425,777
219,616
ESP+ Clinical Service
44,160
49,082
27.67%
1,282,915
1,203,616
ESP+ BCC Service
16,284
16,251
28.48%
0
0
Other Service
168
168
21.43%
0
0
Grand Total
60,612
65,501
27.87%
1,282,915
1,203,616
ESP+ Clinical Service %
72.86%
74.93%
-
100%
100%
ESP+ BCC Service %
26.87%
24.81%
-
0%
0%
Other Service %
0.28%
0.26%
-
0%
0%

Pag
e88
RCC, PA-2 (January-March,2018)
TABLE 08.12:
PA wise Performance Summary
Contact
Service
Propoor %
Revenue
Subsidy
Reproductive Health
14,235
14,252
20.62%
554,121
517,749
Maternal Care 6,341 6,341 17.55% 513,135 437,084
Antenatal Care 4,864 4,864 17.93% 79,570 118,360
Delivery Care (NVD) 63 63 34.92% 25,623 31,077
Delivery Care (CS) 72 72 11.11% 393,917 254,083
Postnatal Care 767 767 17.21% 10,325 17,904
Neonatal Care 575 575 13.74% 3,700 15,660
Menstrual Regulation 38 38 21.05% 14,222 10,348
Post Abortion Care 7 7 0.00% 4,490 410
Family Planning 5,082 5,082 22.65% 4,976 2,436
Emergency Contraceptive Pill 0 0 0.00% 0 0
Maternal Nutrition 215 215 31.63% 555 6,550
Violence Against Women 52 27 36.54% 790 1,030
Adolescent Reproductive Health Care 1,259 1,300 22.64% 5,628 32,386
RTI/STI Care 814 814 28.26% 7,975 20,580
Other Reproductive Health Care 427 428 14.29% 2,350 6,925
Child Health Care
3,215
3,215
12.29%
15,125
28,935
Immunization Program - EPI 1,927 1,927 3.53% 0 0
Immunization Program - NID 0 0 0.00% 0 0
Control of Diarrhoea & Other
Childhood Diseases
412
412
25.97%
5,682
8,736
Diarrhea 412 412 25.97% 5,682 8,736
Measles 0 0 0.00% 0 0
Control of Acute Respiratory
Infections
565
565
27.43%
7,562
11,825
Control of Micronutrient Deficiency 311 311 20.90% 1,881 8,374
Child Nutrition 311 311 20.90% 1,881 8,374
Vitamin A Deficiency 0 0 0.00% 0 0
Iodine Deficiency 0 0 0.00% 0 0

Pag
e89
RCC, PA-2 (January-March,2018)
TABLE 08.12:
PA wise Performance Summary
Contact
Service
Propoor %
Revenue
Subsidy
Communicable Diseases Control
0
0
0.00%
0
0
Tuberculosis Control 0 0 0.00% 0 0
Other Communicable Diseases
Control
0
0
0.00%
0
0
Limited Curative Care
16,501
16,511
34.73%
133,831
426,714
First Aid for Injuries 343 343 19.83% 8,615 3,850
Emergency Care 29 29 37.93% 560 455
Treatment of Minor Infections 16,090 16,100 34.99% 124,361 421,339
Support Services for ESP+
8,887
8,887
27.96%
471,667
211,484
Diagnostic Service 8,864 8,864 28.01% 466,867 209,384
Emergency Transportation Service 23 23 8.70% 4,800 2,100
Behavior Change Communication
19,663
19,643
24.14%
0
0
Health Education (Session) 3,769 3,769 26.19% 0 0
Counseling 15,894 15,874 23.65% 0 0
Miscellaneous
0
0
0.00%
0
0
Adolescent Development Program 0 0 0.00% 0 0
Income Generation from Medicine
-
-
14.45%
564,210
95,330
ESP+ Clinical Service
42,799
42,826
26.93%
1,174,449
1,183,812
ESP+ BCC Service
19,663
19,643
24.14%
0
0
Other Service
0
0
0.00%
0
0
Grand Total
62,462
62,469
26.05%
1,174,449
1,183,812
ESP+ Clinical Service %
68.52%
68.56%
-
100%
100%
ESP+ BCC Service %
31.48%
31.44%
-
0%
0%
Other Service %
0.00%
0.00%
-
0%
0%
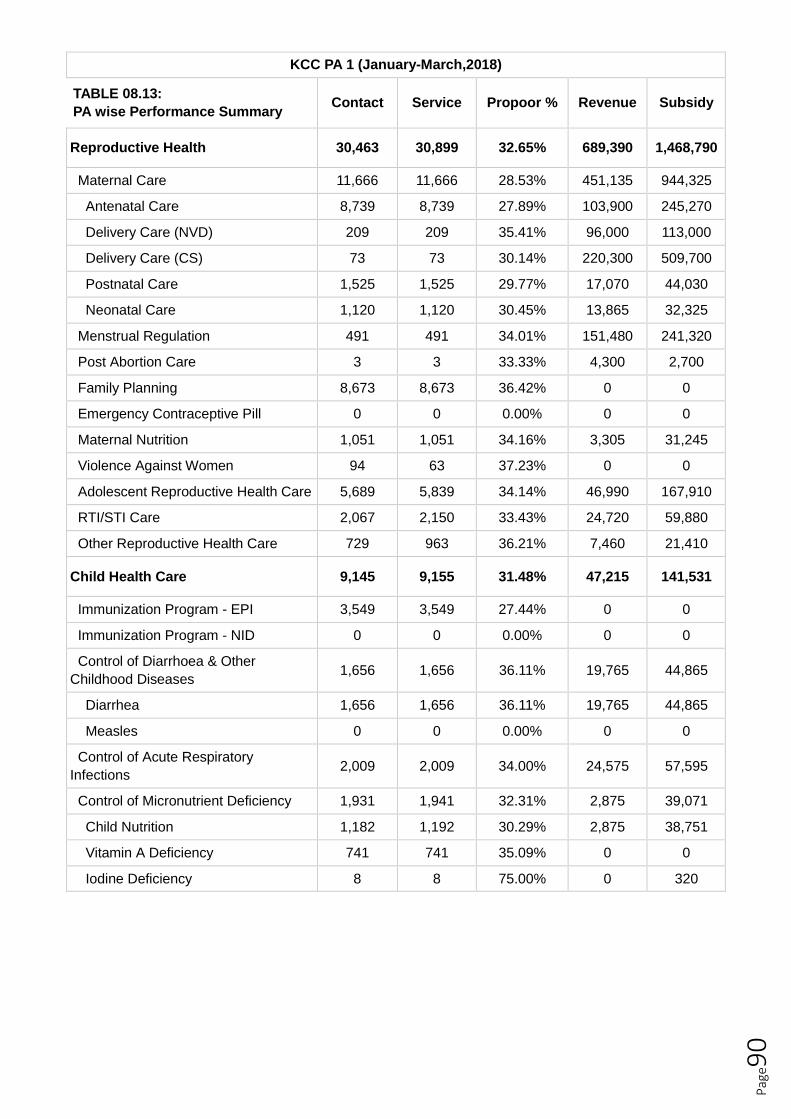
Pag
e90
KCC PA 1 (January-March,2018)
TABLE 08.13:
PA wise Performance Summary
Contact
Service
Propoor %
Revenue
Subsidy
Reproductive Health
30,463
30,899
32.65%
689,390
1,468,790
Maternal Care 11,666 11,666 28.53% 451,135 944,325
Antenatal Care 8,739 8,739 27.89% 103,900 245,270
Delivery Care (NVD) 209 209 35.41% 96,000 113,000
Delivery Care (CS) 73 73 30.14% 220,300 509,700
Postnatal Care 1,525 1,525 29.77% 17,070 44,030
Neonatal Care 1,120 1,120 30.45% 13,865 32,325
Menstrual Regulation 491 491 34.01% 151,480 241,320
Post Abortion Care 3 3 33.33% 4,300 2,700
Family Planning 8,673 8,673 36.42% 0 0
Emergency Contraceptive Pill 0 0 0.00% 0 0
Maternal Nutrition 1,051 1,051 34.16% 3,305 31,245
Violence Against Women 94 63 37.23% 0 0
Adolescent Reproductive Health Care 5,689 5,839 34.14% 46,990 167,910
RTI/STI Care 2,067 2,150 33.43% 24,720 59,880
Other Reproductive Health Care 729 963 36.21% 7,460 21,410
Child Health Care
9,145
9,155
31.48%
47,215
141,531
Immunization Program - EPI 3,549 3,549 27.44% 0 0
Immunization Program - NID 0 0 0.00% 0 0
Control of Diarrhoea & Other
Childhood Diseases
1,656
1,656
36.11%
19,765
44,865
Diarrhea 1,656 1,656 36.11% 19,765 44,865
Measles 0 0 0.00% 0 0
Control of Acute Respiratory
Infections
2,009
2,009
34.00%
24,575
57,595
Control of Micronutrient Deficiency 1,931 1,941 32.31% 2,875 39,071
Child Nutrition 1,182 1,192 30.29% 2,875 38,751
Vitamin A Deficiency 741 741 35.09% 0 0
Iodine Deficiency 8 8 75.00% 0 320

Pag
e91
KCC PA 1 (January-March,2018)
TABLE 08.13:
PA wise Performance Summary
Contact
Service
Propoor %
Revenue
Subsidy
Communicable Diseases Control
224
224
29.91%
1,350
6,870
Tuberculosis Control 0 0 0.00% 0 0
Other Communicable Diseases
Control
224
224
29.91%
1,350
6,870
Limited Curative Care
18,521
18,609
33.31%
158,135
563,495
First Aid for Injuries 173 173 39.88% 3,115 4,125
Emergency Care 108 108 37.04% 1,890 2,580
Treatment of Minor Infections 17,761 17,853 33.27% 140,135 530,425
Support Services for ESP+
4,795
7,576
31.87%
177,730
466,170
Diagnostic Service 4,795 7,576 31.87% 177,730 466,170
Emergency Transportation Service 0 0 0.00% 0 0
Behavior Change Communication
24,725
24,264
32.48%
0
0
Health Education (Session) 8,538 8,508 29.87% 0 0
Counseling 16,187 15,756 33.86% 0 0
Miscellaneous
60
60
31.67%
0
0
Adolescent Development Program 60 60 31.67% 0 0
Income Generation from Medicine
-
-
92.12%
7,214
84,350
ESP+ Clinical Service
62,669
65,988
32.61%
1,060,825
2,620,491
ESP+ BCC Service
24,725
24,264
32.48%
0
0
Other Service
60
60
31.67%
0
0
Grand Total
87,454
90,312
32.57%
1,060,825
2,620,491
ESP+ Clinical Service %
71.66%
73.07%
-
100%
100%
ESP+ BCC Service %
28.27%
26.87%
-
0%
0%
Other Service %
0.07%
0.07%
-
0%
0%
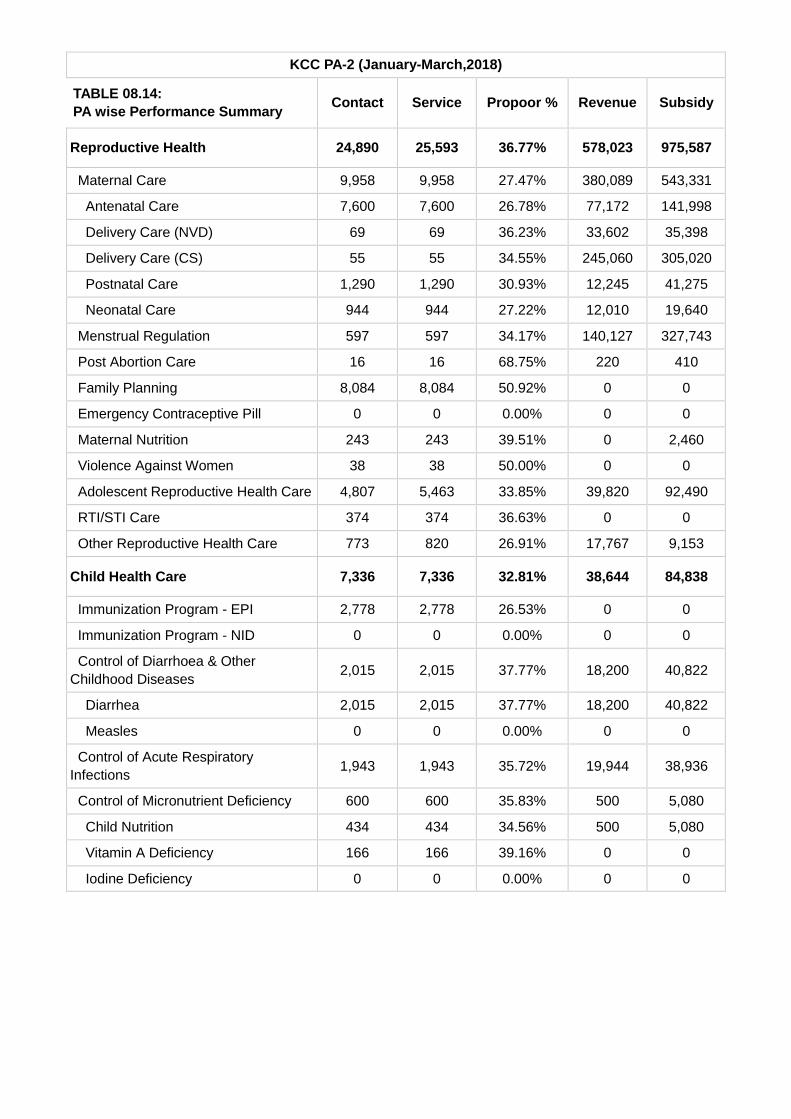
KCC PA-2 (January-March,2018)
TABLE 08.14:
PA wise Performance Summary
Contact
Service
Propoor %
Revenue
Subsidy
Reproductive Health
24,890
25,593
36.77%
578,023
975,587
Maternal Care 9,958 9,958 27.47% 380,089 543,331
Antenatal Care 7,600 7,600 26.78% 77,172 141,998
Delivery Care (NVD) 69 69 36.23% 33,602 35,398
Delivery Care (CS) 55 55 34.55% 245,060 305,020
Postnatal Care 1,290 1,290 30.93% 12,245 41,275
Neonatal Care 944 944 27.22% 12,010 19,640
Menstrual Regulation 597 597 34.17% 140,127 327,743
Post Abortion Care 16 16 68.75% 220 410
Family Planning 8,084 8,084 50.92% 0 0
Emergency Contraceptive Pill 0 0 0.00% 0 0
Maternal Nutrition 243 243 39.51% 0 2,460
Violence Against Women 38 38 50.00% 0 0
Adolescent Reproductive Health Care 4,807 5,463 33.85% 39,820 92,490
RTI/STI Care 374 374 36.63% 0 0
Other Reproductive Health Care 773 820 26.91% 17,767 9,153
Child Health Care
7,336
7,336
32.81%
38,644
84,838
Immunization Program - EPI 2,778 2,778 26.53% 0 0
Immunization Program - NID 0 0 0.00% 0 0
Control of Diarrhoea & Other
Childhood Diseases
2,015
2,015
37.77%
18,200
40,822
Diarrhea 2,015 2,015 37.77% 18,200 40,822
Measles 0 0 0.00% 0 0
Control of Acute Respiratory
Infections
1,943
1,943
35.72%
19,944
38,936
Control of Micronutrient Deficiency 600 600 35.83% 500 5,080
Child Nutrition 434 434 34.56% 500 5,080
Vitamin A Deficiency 166 166 39.16% 0 0
Iodine Deficiency 0 0 0.00% 0 0

Pag
e93
KCC PA-2 (January-March,2018)
TABLE 08.14:
PA wise Performance Summary
Contact
Service
Propoor %
Revenue
Subsidy
Communicable Diseases Control
279
279
26.88%
8,111
3,049
Tuberculosis Control 0 0 0.00% 0 0
Other Communicable Diseases
Control
279
279
26.88%
8,111
3,049
Limited Curative Care
33,295
35,910
37.21%
122,994
474,490
First Aid for Injuries 170 170 45.88% 2,020 4,710
Emergency Care 31 31 45.16% 40 1,200
Treatment of Minor Infections 33,094 35,709 37.15% 120,934 468,580
Support Services for ESP+
2,947
5,001
34.27%
225,320
189,409
Diagnostic Service 2,947 5,001 34.27% 225,320 189,409
Emergency Transportation Service 0 0 0.00% 0 0
Behavior Change Communication
24,661
24,511
32.87%
0
0
Health Education (Session) 2,825 2,791 26.05% 0 0
Counseling 21,836 21,720 33.75% 0 0
Miscellaneous
0
0
0.00%
0
0
Adolescent Development Program 0 0 0.00% 0 0
Income Generation from Medicine
-
-
92.32%
27,825
334,308
ESP+ Clinical Service
68,747
74,119
36.41%
973,092
1,727,373
ESP+ BCC Service
24,661
24,511
32.87%
0
0
Other Service
0
0
0.00%
0
0
Grand Total
93,408
98,630
35.48%
973,092
1,727,373
ESP+ Clinical Service %
73.60%
75.15%
-
100%
100%
ESP+ BCC Service %
26.40%
24.85%
-
0%
0%
Other Service %
0.00%
0.00%
-
0%
0%
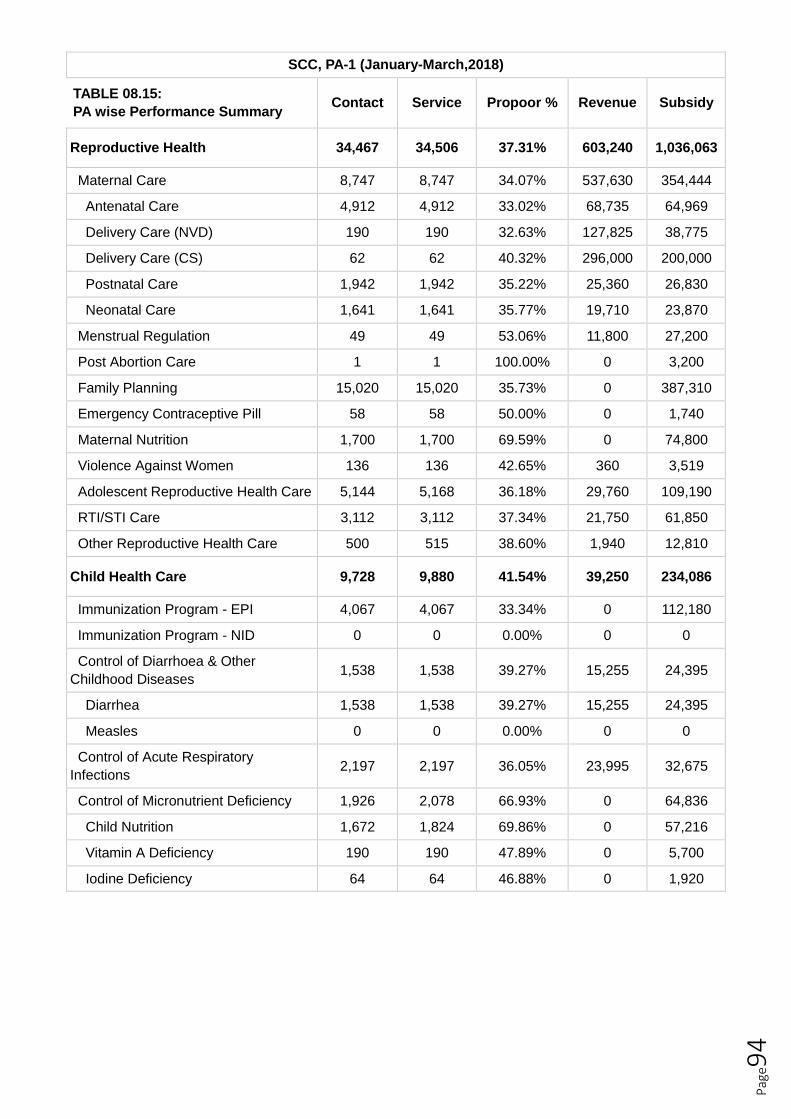
Pag
e94
SCC, PA-1 (January-March,2018)
TABLE 08.15:
PA wise Performance Summary
Contact
Service
Propoor %
Revenue
Subsidy
Reproductive Health
34,467
34,506
37.31%
603,240
1,036,063
Maternal Care 8,747 8,747 34.07% 537,630 354,444
Antenatal Care 4,912 4,912 33.02% 68,735 64,969
Delivery Care (NVD) 190 190 32.63% 127,825 38,775
Delivery Care (CS) 62 62 40.32% 296,000 200,000
Postnatal Care 1,942 1,942 35.22% 25,360 26,830
Neonatal Care 1,641 1,641 35.77% 19,710 23,870
Menstrual Regulation 49 49 53.06% 11,800 27,200
Post Abortion Care 1 1 100.00% 0 3,200
Family Planning 15,020 15,020 35.73% 0 387,310
Emergency Contraceptive Pill 58 58 50.00% 0 1,740
Maternal Nutrition 1,700 1,700 69.59% 0 74,800
Violence Against Women 136 136 42.65% 360 3,519
Adolescent Reproductive Health Care 5,144 5,168 36.18% 29,760 109,190
RTI/STI Care 3,112 3,112 37.34% 21,750 61,850
Other Reproductive Health Care 500 515 38.60% 1,940 12,810
Child Health Care
9,728
9,880
41.54%
39,250
234,086
Immunization Program - EPI 4,067 4,067 33.34% 0 112,180
Immunization Program - NID 0 0 0.00% 0 0
Control of Diarrhoea & Other
Childhood Diseases
1,538
1,538
39.27%
15,255
24,395
Diarrhea 1,538 1,538 39.27% 15,255 24,395
Measles 0 0 0.00% 0 0
Control of Acute Respiratory
Infections
2,197
2,197
36.05%
23,995
32,675
Control of Micronutrient Deficiency 1,926 2,078 66.93% 0 64,836
Child Nutrition 1,672 1,824 69.86% 0 57,216
Vitamin A Deficiency 190 190 47.89% 0 5,700
Iodine Deficiency 64 64 46.88% 0 1,920

Pag
e95
SCC, PA-1 (January-March,2018)
TABLE 08.15:
PA wise Performance Summary
Contact
Service
Propoor %
Revenue
Subsidy
Communicable Diseases Control
153
153
39.87%
570
4,020
Tuberculosis Control 0 0 0.00% 0 0
Other Communicable Diseases
Control
153
153
39.87%
570
4,020
Limited Curative Care
66,557
66,585
33.68%
289,347
1,367,843
First Aid for Injuries 140 140 36.43% 1,460 2,740
Emergency Care 0 0 0.00% 0 0
Treatment of Minor Infections 66,356 66,384 33.66% 287,887 1,363,273
Support Services for ESP+
12,869
12,942
37.83%
565,826
581,060
Diagnostic Service 12,615 12,688 37.85% 544,826 551,260
Emergency Transportation Service 254 254 36.61% 21,000 29,800
Behavior Change Communication
37,060
17,137
48.86%
0
13,230
Health Education (Session) 5,207 448 53.41% 0 0
Counseling 31,853 16,689 48.12% 0 13,230
Miscellaneous
96
8
33.33%
0
0
Adolescent Development Program 96 8 33.33% 0 0
Income Generation from Medicine
-
-
40.42%
445,986
302,589
ESP+ Clinical Service
123,713
124,005
35.74%
1,498,233
3,221,242
ESP+ BCC Service
37,060
17,137
48.86%
0
13,230
Other Service
96
8
33.33%
0
0
Grand Total
160,869
141,150
38.76%
1,498,233
3,234,472
ESP+ Clinical Service %
76.90%
87.85%
-
100%
100%
ESP+ BCC Service %
23.04%
12.14%
-
0%
0%
Other Service %
0.06%
0.01%
-
0%
0%

Pag
e96
BCC PA-1 Srizony (January-March,2018)
TABLE 08.16:
PA wise Performance Summary
Contact
Service
Propoor %
Revenue
Subsidy
Reproductive Health
16,249
16,251
25.95%
591,550
423,910
Maternal Care 5,490 5,490 22.42% 450,460 372,120
Antenatal Care 3,611 3,611 21.13% 70,000 17,270
Delivery Care (NVD) 194 194 33.51% 58,050 29,250
Delivery Care (CS) 112 112 21.43% 311,100 304,900
Postnatal Care 944 944 27.44% 6,070 11,590
Neonatal Care 629 629 19.08% 5,240 9,110
Menstrual Regulation 159 159 20.13% 95,000 18,900
Post Abortion Care 11 11 9.09% 18,000 2,200
Family Planning 6,266 6,266 16.09% 0 0
Emergency Contraceptive Pill 0 0 0.00% 0 0
Maternal Nutrition 0 0 0.00% 0 0
Violence Against Women 9 9 11.11% 0 270
Adolescent Reproductive Health Care 1,944 1,944 34.10% 3,340 8,050
RTI/STI Care 1,471 1,471 64.85% 9,340 12,850
Other Reproductive Health Care 899 901 36.26% 15,410 9,520
Child Health Care
17,827
17,827
10.02%
20,840
15,893
Immunization Program - EPI 2,517 2,517 22.77% 0 0
Immunization Program - NID 13,010 13,010 0.00% 0 0
Control of Diarrhoea & Other
Childhood Diseases
749
749
57.01%
7,330
6,513
Diarrhea 749 749 57.01% 7,330 6,513
Measles 0 0 0.00% 0 0
Control of Acute Respiratory
Infections
1,167
1,167
52.96%
13,510
9,380
Control of Micronutrient Deficiency 384 384 44.01% 0 0
Child Nutrition 0 0 0.00% 0 0
Vitamin A Deficiency 384 384 44.01% 0 0
Iodine Deficiency 0 0 0.00% 0 0

Pag
e97
BCC PA-1 Srizony (January-March,2018)
TABLE 08.16:
PA wise Performance Summary
Contact
Service
Propoor %
Revenue
Subsidy
Communicable Diseases Control
0
0
0.00%
0
0
Tuberculosis Control 0 0 0.00% 0 0
Other Communicable Diseases
Control
0
0
0.00%
0
0
Limited Curative Care
4,299
4,299
84.60%
10,740
47,670
First Aid for Injuries 29 29 82.76% 180 480
Emergency Care 0 0 0.00% 0 0
Treatment of Minor Infections 4,262 4,262 84.58% 10,560 46,980
Support Services for ESP+
6,568
6,568
17.27%
383,361
83,946
Diagnostic Service 6,555 6,555 17.27% 380,761 82,646
Emergency Transportation Service 13 13 15.38% 2,600 1,300
Behavior Change Communication
16,772
16,746
29.32%
0
0
Health Education (Session) 4,234 4,211 47.35% 0 0
Counseling 12,538 12,535 23.23% 0 0
Miscellaneous
0
0
0.00%
0
0
Adolescent Development Program 0 0 0.00% 0 0
Income Generation from Medicine
-
-
31.28%
267,943
121,972
ESP+ Clinical Service
44,935
44,937
23.96%
1,006,491
571,209
ESP+ BCC Service
16,772
16,746
29.32%
0
0
Other Service
0
0
0.00%
0
0
Grand Total
61,707
61,683
25.42%
1,006,491
571,209
ESP+ Clinical Service %
72.82%
72.85%
-
100%
100%
ESP+ BCC Service %
27.18%
27.15%
-
0%
0%
Other Service %
0.00%
0.00%
-
0%
0%

Pag
e98
P
age9
8
CoCC,PA-01 (January-March,2018)
TABLE 08.17:
PA wise Performance Summary
Contact
Service
Propoor %
Revenue
Subsidy
Reproductive Health
36,841
36,852
47.40%
1,163,587
1,122,831
Maternal Care 7,434 7,434 37.25% 1,033,921 801,584
Antenatal Care 4,551 4,551 35.95% 78,640 50,975
Delivery Care (NVD) 323 323 31.58% 220,500 102,500
Delivery Care (CS) 131 131 34.35% 710,096 599,904
Postnatal Care 1,724 1,724 46.93% 13,590 33,780
Neonatal Care 705 705 25.11% 11,095 14,425
Menstrual Regulation 150 150 43.33% 61,950 57,150
Post Abortion Care 6 6 16.67% 7,800 3,000
Family Planning 18,715 18,715 45.04% 291 5,179
Emergency Contraceptive Pill 5 5 100.00% 0 0
Maternal Nutrition 311 311 83.92% 0 12,048
Violence Against Women 148 148 61.49% 0 2,040
Adolescent Reproductive Health Care 3,779 3,790 59.51% 10,765 73,600
RTI/STI Care 3,162 3,162 60.44% 12,740 80,245
Other Reproductive Health Care 3,131 3,131 53.66% 36,120 87,985
Child Health Care
12,570
12,700
42.54%
44,145
65,206
Immunization Program - EPI 7,647 7,647 35.39% 0 0
Immunization Program - NID 0 0 0.00% 0 0
Control of Diarrhoea & Other
Childhood Diseases
1,549
1,549
58.04%
15,440
25,106
Diarrhea 1,549 1,549 58.04% 15,440 25,106
Measles 0 0 0.00% 0 0
Control of Acute Respiratory
Infections
2,379
2,379
50.82%
28,705
31,540
Control of Micronutrient Deficiency 995 1,125 53.57% 0 8,560
Child Nutrition 541 671 71.35% 0 8,560
Vitamin A Deficiency 454 454 32.38% 0 0
Iodine Deficiency 0 0 0.00% 0 0
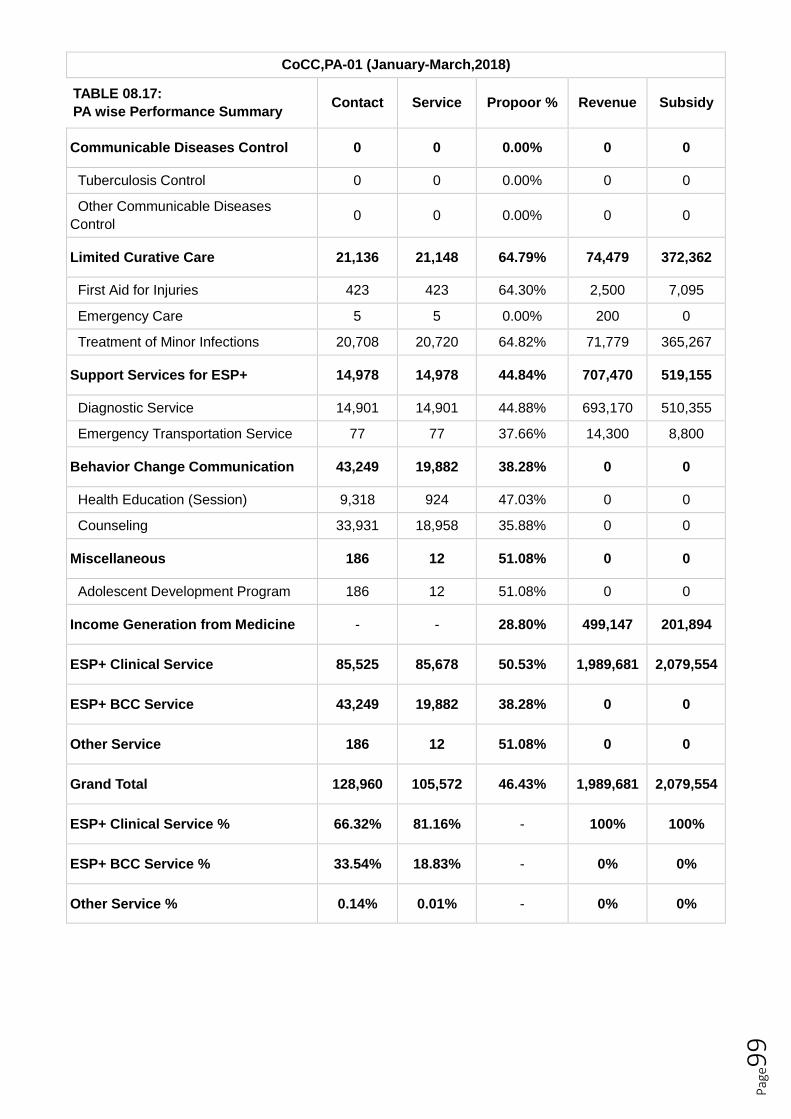
Pag
e99
CoCC,PA-01 (January-March,2018)
TABLE 08.17:
PA wise Performance Summary
Contact
Service
Propoor %
Revenue
Subsidy
Communicable Diseases Control
0
0
0.00%
0
0
Tuberculosis Control 0 0 0.00% 0 0
Other Communicable Diseases
Control
0
0
0.00%
0
0
Limited Curative Care
21,136
21,148
64.79%
74,479
372,362
First Aid for Injuries 423 423 64.30% 2,500 7,095
Emergency Care 5 5 0.00% 200 0
Treatment of Minor Infections 20,708 20,720 64.82% 71,779 365,267
Support Services for ESP+
14,978
14,978
44.84%
707,470
519,155
Diagnostic Service 14,901 14,901 44.88% 693,170 510,355
Emergency Transportation Service 77 77 37.66% 14,300 8,800
Behavior Change Communication
43,249
19,882
38.28%
0
0
Health Education (Session) 9,318 924 47.03% 0 0
Counseling 33,931 18,958 35.88% 0 0
Miscellaneous
186
12
51.08%
0
0
Adolescent Development Program 186 12 51.08% 0 0
Income Generation from Medicine
-
-
28.80%
499,147
201,894
ESP+ Clinical Service
85,525
85,678
50.53%
1,989,681
2,079,554
ESP+ BCC Service
43,249
19,882
38.28%
0
0
Other Service
186
12
51.08%
0
0
Grand Total
128,960
105,572
46.43%
1,989,681
2,079,554
ESP+ Clinical Service %
66.32%
81.16%
-
100%
100%
ESP+ BCC Service %
33.54%
18.83%
-
0%
0%
Other Service %
0.14%
0.01%
-
0%
0%

Pag
e10
0
SrjM PA-1 (January-March,2018)
TABLE 08.18:
PA wise Performance Summary
Contact
Service
Propoor %
Revenue
Subsidy
Reproductive Health
12,160
13,119
32.64%
819,795
740,483
Maternal Care 4,111 4,236 29.80% 774,410 657,780
Antenatal Care 2,817 2,942 27.76% 46,350 26,590
Delivery Care (NVD) 54 54 38.89% 25,400 17,800
Delivery Care (CS) 160 160 33.13% 687,600 598,400
Postnatal Care 791 791 37.17% 8,470 12,060
Neonatal Care 289 289 25.95% 6,590 2,930
Menstrual Regulation 45 45 48.89% 12,200 13,500
Post Abortion Care 2 2 100.00% 0 6,000
Family Planning 5,154 5,154 33.93% 0 25,400
Emergency Contraceptive Pill 21 21 38.10% 160 120
Maternal Nutrition 33 33 78.79% 0 5,418
Violence Against Women 33 21 48.48% 200 550
Adolescent Reproductive Health Care 1,034 1,810 34.33% 11,720 11,220
RTI/STI Care 1,168 1,168 32.28% 13,595 13,695
Other Reproductive Health Care 559 629 33.81% 7,510 6,800
Child Health Care
2,518
2,559
36.97%
29,335
36,003
Immunization Program - EPI 315 356 0.00% 0 1,440
Immunization Program - NID 0 0 0.00% 0 0
Control of Diarrhoea & Other
Childhood Diseases
780
780
41.54%
10,360
9,810
Diarrhea 600 600 43.17% 8,130 8,090
Measles 180 180 36.11% 2,230 1,720
Control of Acute Respiratory
Infections
1,036
1,036
44.21%
14,815
16,505
Control of Micronutrient Deficiency 387 387 38.50% 4,160 8,248
Child Nutrition 45 45 75.56% 140 5,408
Vitamin A Deficiency 335 335 32.24% 4,020 2,630
Iodine Deficiency 7 7 100.00% 0 210

Pag
e10
1
SrjM PA-1 (January-March,2018)
TABLE 08.18:
PA wise Performance Summary
Contact
Service
Propoor %
Revenue
Subsidy
Communicable Diseases Control
0
0
0.00%
0
0
Tuberculosis Control 0 0 0.00% 0 0
Other Communicable Diseases
Control
0
0
0.00%
0
0
Limited Curative Care
6,803
6,803
52.55%
60,170
189,890
First Aid for Injuries 392 392 47.96% 3,850 4,930
Emergency Care 124 124 37.10% 400 830
Treatment of Minor Infections 6,196 6,196 52.71% 55,530 181,790
Support Services for ESP+
4,420
4,420
25.50%
343,437
115,609
Diagnostic Service 4,331 4,331 25.14% 318,972 110,859
Emergency Transportation Service 89 89 42.70% 24,465 4,750
Behavior Change Communication
10,791
8,095
52.94%
0
0
Health Education (Session) 2,767 210 40.77% 0 0
Counseling 8,024 7,885 57.14% 0 0
Miscellaneous
0
0
0.00%
0
0
Adolescent Development Program 0 0 0.00% 0 0
Income Generation from Medicine
-
-
66.46%
136,040
269,528
ESP+ Clinical Service
25,810
26,810
36.91%
1,252,347
1,079,645
ESP+ BCC Service
10,791
8,095
52.94%
0
0
Other Service
0
0
0.00%
0
0
Grand Total
36,601
34,905
41.64%
1,252,347
1,079,645
ESP+ Clinical Service %
70.52%
76.81%
-
100%
100%
ESP+ BCC Service %
29.48%
23.19%
-
0%
0%
Other Service %
0.00%
0.00%
-
0%
0%
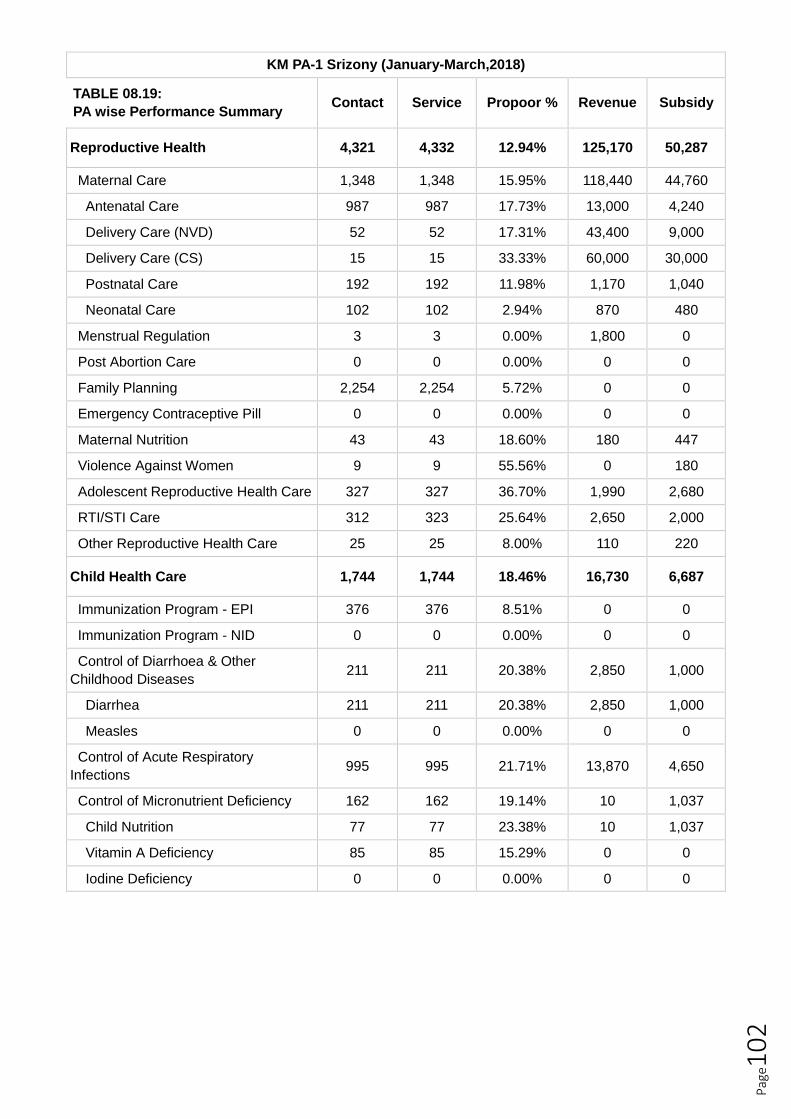
Pag
e10
2
KM PA-1 Srizony (January-March,2018)
TABLE 08.19:
PA wise Performance Summary
Contact
Service
Propoor %
Revenue
Subsidy
Reproductive Health
4,321
4,332
12.94%
125,170
50,287
Maternal Care 1,348 1,348 15.95% 118,440 44,760
Antenatal Care 987 987 17.73% 13,000 4,240
Delivery Care (NVD) 52 52 17.31% 43,400 9,000
Delivery Care (CS) 15 15 33.33% 60,000 30,000
Postnatal Care 192 192 11.98% 1,170 1,040
Neonatal Care 102 102 2.94% 870 480
Menstrual Regulation 3 3 0.00% 1,800 0
Post Abortion Care 0 0 0.00% 0 0
Family Planning 2,254 2,254 5.72% 0 0
Emergency Contraceptive Pill 0 0 0.00% 0 0
Maternal Nutrition 43 43 18.60% 180 447
Violence Against Women 9 9 55.56% 0 180
Adolescent Reproductive Health Care 327 327 36.70% 1,990 2,680
RTI/STI Care 312 323 25.64% 2,650 2,000
Other Reproductive Health Care 25 25 8.00% 110 220
Child Health Care
1,744
1,744
18.46%
16,730
6,687
Immunization Program - EPI 376 376 8.51% 0 0
Immunization Program - NID 0 0 0.00% 0 0
Control of Diarrhoea & Other
Childhood Diseases
211
211
20.38%
2,850
1,000
Diarrhea 211 211 20.38% 2,850 1,000
Measles 0 0 0.00% 0 0
Control of Acute Respiratory
Infections
995
995
21.71%
13,870
4,650
Control of Micronutrient Deficiency 162 162 19.14% 10 1,037
Child Nutrition 77 77 23.38% 10 1,037
Vitamin A Deficiency 85 85 15.29% 0 0
Iodine Deficiency 0 0 0.00% 0 0
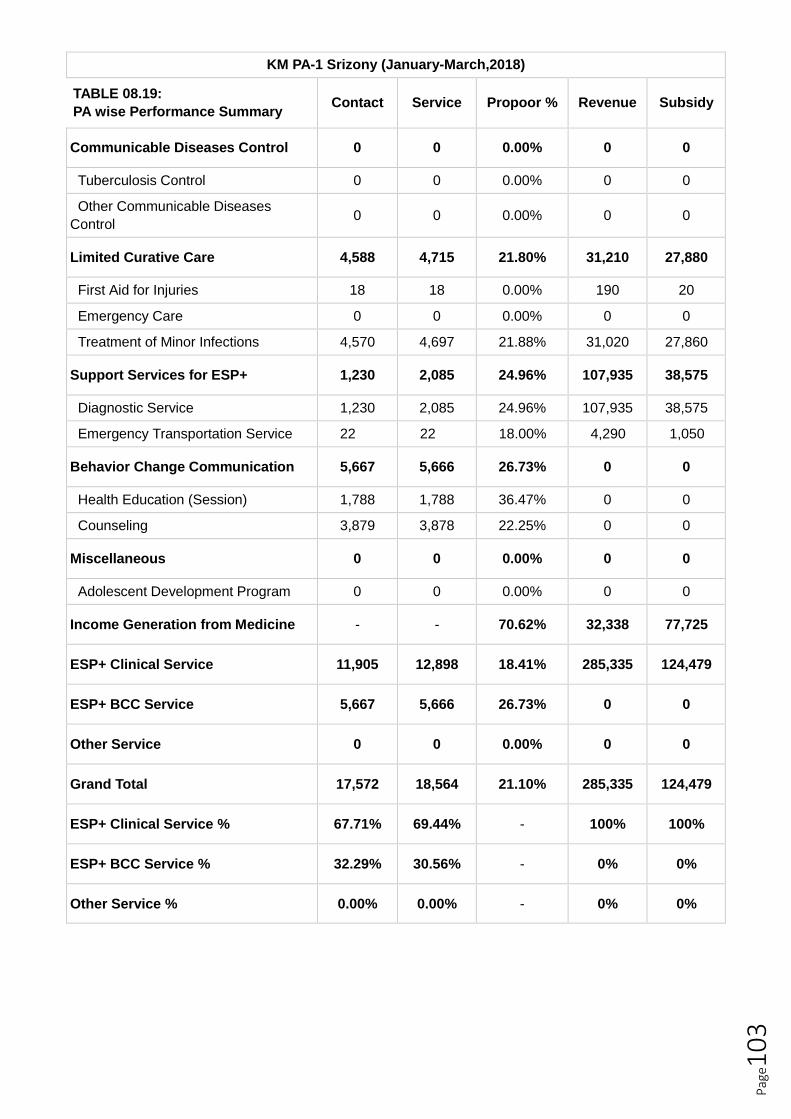
Pag
e10
3
KM PA-1 Srizony (January-March,2018)
TABLE 08.19:
PA wise Performance Summary
Contact
Service
Propoor %
Revenue
Subsidy
Communicable Diseases Control
0
0
0.00%
0
0
Tuberculosis Control 0 0 0.00% 0 0
Other Communicable Diseases
Control
0
0
0.00%
0
0
Limited Curative Care
4,588
4,715
21.80%
31,210
27,880
First Aid for Injuries 18 18 0.00% 190 20
Emergency Care 0 0 0.00% 0 0
Treatment of Minor Infections 4,570 4,697 21.88% 31,020 27,860
Support Services for ESP+
1,230
2,085
24.96%
107,935
38,575
Diagnostic Service 1,230 2,085 24.96% 107,935 38,575
Emergency Transportation Service 22 22 18.00% 4,290 1,050
Behavior Change Communication
5,667
5,666
26.73%
0
0
Health Education (Session) 1,788 1,788 36.47% 0 0
Counseling 3,879 3,878 22.25% 0 0
Miscellaneous
0
0
0.00%
0
0
Adolescent Development Program 0 0 0.00% 0 0
Income Generation from Medicine
-
-
70.62%
32,338
77,725
ESP+ Clinical Service
11,905
12,898
18.41%
285,335
124,479
ESP+ BCC Service
5,667
5,666
26.73%
0
0
Other Service
0
0
0.00%
0
0
Grand Total
17,572
18,564
21.10%
285,335
124,479
ESP+ Clinical Service %
67.71%
69.44%
-
100%
100%
ESP+ BCC Service %
32.29%
30.56%
-
0%
0%
Other Service %
0.00%
0.00%
-
0%
0%
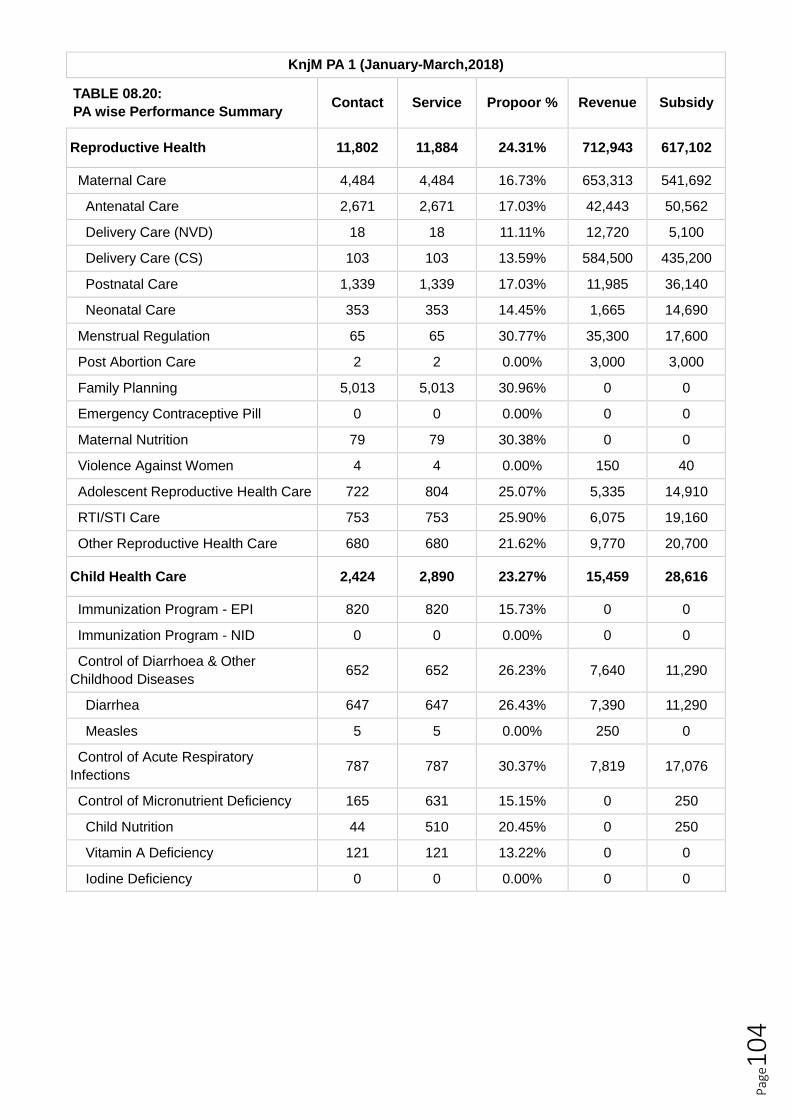
Pag
e10
4
KnjM PA 1 (January-March,2018)
TABLE 08.20:
PA wise Performance Summary
Contact
Service
Propoor %
Revenue
Subsidy
Reproductive Health
11,802
11,884
24.31%
712,943
617,102
Maternal Care 4,484 4,484 16.73% 653,313 541,692
Antenatal Care 2,671 2,671 17.03% 42,443 50,562
Delivery Care (NVD) 18 18 11.11% 12,720 5,100
Delivery Care (CS) 103 103 13.59% 584,500 435,200
Postnatal Care 1,339 1,339 17.03% 11,985 36,140
Neonatal Care 353 353 14.45% 1,665 14,690
Menstrual Regulation 65 65 30.77% 35,300 17,600
Post Abortion Care 2 2 0.00% 3,000 3,000
Family Planning 5,013 5,013 30.96% 0 0
Emergency Contraceptive Pill 0 0 0.00% 0 0
Maternal Nutrition 79 79 30.38% 0 0
Violence Against Women 4 4 0.00% 150 40
Adolescent Reproductive Health Care 722 804 25.07% 5,335 14,910
RTI/STI Care 753 753 25.90% 6,075 19,160
Other Reproductive Health Care 680 680 21.62% 9,770 20,700
Child Health Care
2,424
2,890
23.27%
15,459
28,616
Immunization Program - EPI 820 820 15.73% 0 0
Immunization Program - NID 0 0 0.00% 0 0
Control of Diarrhoea & Other
Childhood Diseases
652
652
26.23%
7,640
11,290
Diarrhea 647 647 26.43% 7,390 11,290
Measles 5 5 0.00% 250 0
Control of Acute Respiratory
Infections
787
787
30.37%
7,819
17,076
Control of Micronutrient Deficiency 165 631 15.15% 0 250
Child Nutrition 44 510 20.45% 0 250
Vitamin A Deficiency 121 121 13.22% 0 0
Iodine Deficiency 0 0 0.00% 0 0
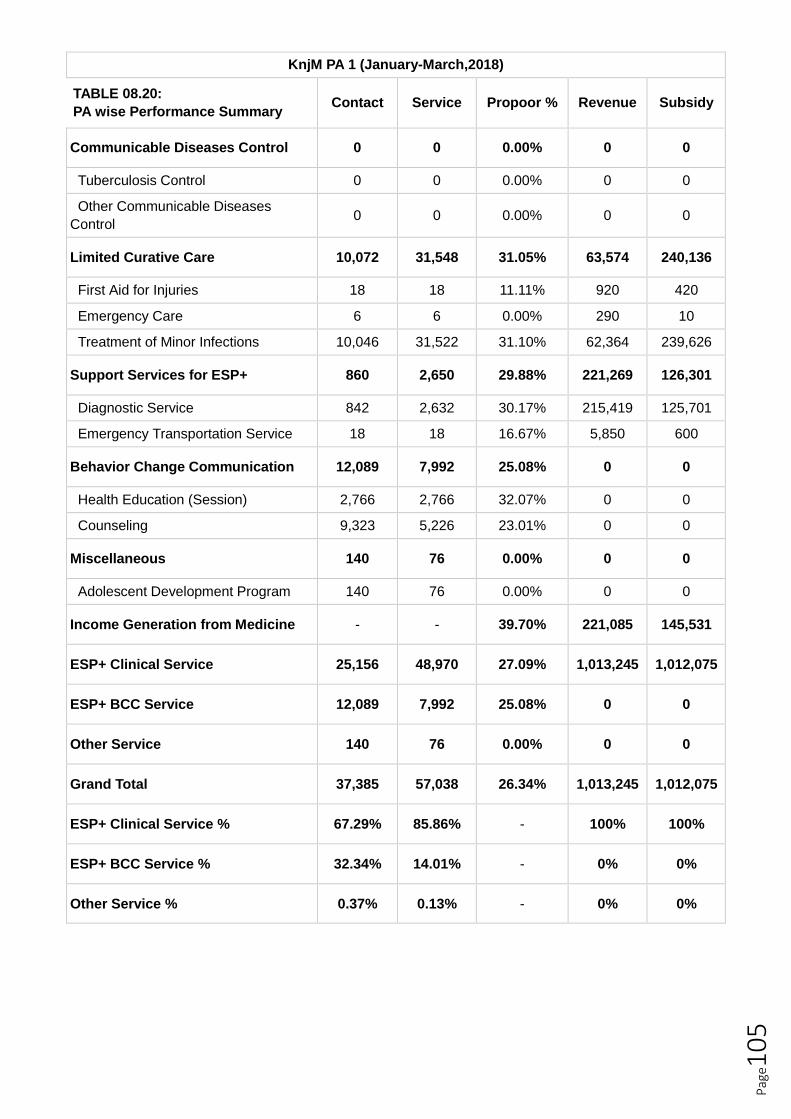
Pag
e10
5
KnjM PA 1 (January-March,2018)
TABLE 08.20:
PA wise Performance Summary
Contact
Service
Propoor %
Revenue
Subsidy
Communicable Diseases Control
0
0
0.00%
0
0
Tuberculosis Control 0 0 0.00% 0 0
Other Communicable Diseases
Control
0
0
0.00%
0
0
Limited Curative Care
10,072
31,548
31.05%
63,574
240,136
First Aid for Injuries 18 18 11.11% 920 420
Emergency Care 6 6 0.00% 290 10
Treatment of Minor Infections 10,046 31,522 31.10% 62,364 239,626
Support Services for ESP+
860
2,650
29.88%
221,269
126,301
Diagnostic Service 842 2,632 30.17% 215,419 125,701
Emergency Transportation Service 18 18 16.67% 5,850 600
Behavior Change Communication
12,089
7,992
25.08%
0
0
Health Education (Session) 2,766 2,766 32.07% 0 0
Counseling 9,323 5,226 23.01% 0 0
Miscellaneous
140
76
0.00%
0
0
Adolescent Development Program 140 76 0.00% 0 0
Income Generation from Medicine
-
-
39.70%
221,085
145,531
ESP+ Clinical Service
25,156
48,970
27.09%
1,013,245
1,012,075
ESP+ BCC Service
12,089
7,992
25.08%
0
0
Other Service
140
76
0.00%
0
0
Grand Total
37,385
57,038
26.34%
1,013,245
1,012,075
ESP+ Clinical Service %
67.29%
85.86%
-
100%
100%
ESP+ BCC Service %
32.34%
14.01%
-
0%
0%
Other Service %
0.37%
0.13%
-
0%
0%

Pag
e10
6
GopM PA 1 (January-March,2018)
TABLE 08.21:
PA wise Performance Summary
Contact
Service
Propoor %
Revenue
Subsidy
Reproductive Health
3,351
3,351
23.22%
373,114
91,445
Maternal Care 1,816 1,816 15.53% 355,060 78,680
Antenatal Care 1,081 1,081 14.62% 28,590 7,600
Delivery Care (NVD) 50 50 8.00% 36,320 3,700
Delivery Care (CS) 42 42 14.29% 277,000 59,000
Postnatal Care 354 354 18.36% 6,540 4,090
Neonatal Care 289 289 16.96% 6,610 4,290
Menstrual Regulation 10 10 40.00% 3,610 2,400
Post Abortion Care 0 0 0.00% 0 0
Family Planning 802 802 44.01% 794 725
Emergency Contraceptive Pill 0 0 0.00% 0 0
Maternal Nutrition 0 0 0.00% 0 0
Violence Against Women 5 5 20.00% 0 150
Adolescent Reproductive Health Care 303 303 15.18% 3,710 6,230
RTI/STI Care 322 322 21.12% 7,630 2,480
Other Reproductive Health Care 93 93 25.81% 2,310 780
Child Health Care
901
901
9.21%
14,695
2,530
Immunization Program - EPI 344 344 10.47% 700 1,270
Immunization Program - NID 0 0 0.00% 0 0
Control of Diarrhoea & Other
Childhood Diseases
136
136
8.09%
3,890
470
Diarrhea 136 136 8.09% 3,890 470
Measles 0 0 0.00% 0 0
Control of Acute Respiratory
Infections
322
322
7.76%
10,030
760
Control of Micronutrient Deficiency 99 99 11.11% 75 30
Child Nutrition 7 7 14.29% 75 30
Vitamin A Deficiency 92 92 10.87% 0 0
Iodine Deficiency 0 0 0.00% 0 0

Pag
e10
7
GopM PA 1 (January-March,2018)
TABLE 08.21:
PA wise Performance Summary
Contact
Service
Propoor %
Revenue
Subsidy
Communicable Diseases Control
0
0
0.00%
0
0
Tuberculosis Control 0 0 0.00% 0 0
Other Communicable Diseases
Control
0
0
0.00%
0
0
Limited Curative Care
3,702
3,703
28.55%
63,130
53,890
First Aid for Injuries 71 71 14.08% 1,760 390
Emergency Care 0 0 0.00% 0 0
Treatment of Minor Infections 3,631 3,632 28.84% 61,370 53,500
Support Services for ESP+
841
1,843
16.29%
162,985
36,885
Diagnostic Service 841 1,843 16.29% 162,985 36,885
Emergency Transportation Service 0 0 0.00% 0 0
Behavior Change Communication
2,145
2,145
16.41%
0
0
Health Education (Session) 712 712 20.65% 0 0
Counseling 1,433 1,433 14.31% 0 0
Miscellaneous
0
0
0.00%
0
0
Adolescent Development Program 0 0 0.00% 0 0
Income Generation from Medicine
-
-
12.92%
11,696
1,735
ESP+ Clinical Service
8,795
9,798
23.37%
613,924
184,750
ESP+ BCC Service
2,145
2,145
16.41%
0
0
Other Service
0
0
0.00%
0
0
Grand Total
10,940
11,943
22.00%
613,924
184,750
ESP+ Clinical Service %
80.39%
82.04%
-
100%
100%
ESP+ BCC Service %
19.61%
17.96%
-
0%
0%
Other Service %
0.00%
0.00%
-
0%
0%

Pag
e10
8
NACC PA 1 PSKP (January-March,2018)
TABLE 08.22:
PA wise Performance Summary
Contact
Service
Propoor %
Revenue
Subsidy
Reproductive Health
14,516
14,516
14.07%
855,109
303,919
Maternal Care 3,986 3,986 5.07% 670,810 208,370
Antenatal Care 2,609 2,609 3.64% 123,390 14,220
Delivery Care (NVD) 22 22 4.55% 21,000 1,000
Delivery Care (CS) 66 66 15.15% 483,500 176,500
Postnatal Care 768 768 8.20% 22,710 12,660
Neonatal Care 521 521 6.33% 20,210 3,990
Menstrual Regulation 97 97 22.68% 51,470 26,250
Post Abortion Care 57 57 7.02% 77,832 24,808
Family Planning 7,304 7,304 16.89% 7,883 1,095
Emergency Contraceptive Pill 24 24 20.83% 200 830
Maternal Nutrition 0 0 0.00% 0 0
Violence Against Women 46 46 17.39% 330 1,140
Adolescent Reproductive Health Care 1,793 1,793 20.02% 20,480 25,690
RTI/STI Care 667 667 17.24% 23,554 6,766
Other Reproductive Health Care 542 542 17.34% 2,550 8,970
Child Health Care
7,657
7,657
6.23%
48,888
19,422
Immunization Program - EPI 5,968 5,968 1.71% 0 0
Immunization Program - NID 0 0 0.00% 0 0
Control of Diarrhoea & Other
Childhood Diseases
658
658
24.16%
19,709
8,351
Diarrhea 600 600 24.50% 17,699 7,751
Measles 58 58 20.69% 2,010 600
Control of Acute Respiratory
Infections
933
933
19.83%
29,099
10,951
Control of Micronutrient Deficiency 98 98 31.63% 80 120
Child Nutrition 0 0 0.00% 0 0
Vitamin A Deficiency 94 94 31.91% 0 40
Iodine Deficiency 4 4 25.00% 80 80

Pag
e10
9
NACC PA 1 PSKP (January-March,2018)
TABLE 08.22:
PA wise Performance Summary
Contact
Service
Propoor %
Revenue
Subsidy
Communicable Diseases Control
5
5
0.00%
130
50
Tuberculosis Control 0 0 0.00% 0 0
Other Communicable Diseases
Control
5
5
0.00%
130
50
Limited Curative Care
13,138
13,138
18.03%
263,492
347,656
First Aid for Injuries 205 205 14.63% 17,610 5,320
Emergency Care 45 45 0.00% 7,070 190
Treatment of Minor Infections 12,887 12,887 18.15% 238,762 342,146
Support Services for ESP+
3,542
8,047
18.89%
700,735
190,550
Diagnostic Service 3,500 8,005 19.06% 638,335 170,650
Emergency Transportation Service 42 42 4.76% 62,400 19,900
Behavior Change Communication
9,559
8,752
16.17%
0
0
Health Education (Session) 2,431 2,421 19.29% 0 0
Counseling 7,128 6,331 15.11% 0 0
Miscellaneous
0
0
0.00%
0
0
Adolescent Development Program 0 0 0.00% 0 0
Income Generation from Medicine
-
-
7.02%
1,141,636
86,141
ESP+ Clinical Service
38,857
43,362
14.30%
1,868,304
861,597
ESP+ BCC Service
9,559
8,752
16.17%
0
0
Other Service
0
0
0.00%
0
0
Grand Total
48,416
52,114
14.67%
1,868,304
861,597
ESP+ Clinical Service %
80.26%
83.21%
-
100%
100%
ESP+ BCC Service %
19.74%
16.79%
-
0%
0%
Other Service %
0.00%
0.00%
-
0%
0%

Pag
e11
0
RaCC PA 1 (January-March,2018)
TABLE 08.23:
PA wise Performance Summary
Contact
Service
Propoor %
Revenue
Subsidy
Reproductive Health
3,392
3,392
2.27%
281,287
397,642
Maternal Care 1,293 1,293 1.78% 245,109 382,760
Antenatal Care 759 759 2.37% 21,105 11,490
Delivery Care (NVD) 60 60 0.00% 40,560 22,440
Delivery Care (CS) 51 51 0.00% 181,689 334,450
Postnatal Care 244 244 2.05% 1,330 7,990
Neonatal Care 179 179 0.00% 425 6,390
Menstrual Regulation 37 37 2.70% 21,708 7,552
Post Abortion Care 7 7 0.00% 10,300 3,700
Family Planning 1,590 1,590 2.58% 0 0
Emergency Contraceptive Pill 0 0 0.00% 0 0
Maternal Nutrition 65 65 0.00% 0 0
Violence Against Women 16 16 0.00% 0 0
Adolescent Reproductive Health Care 284 284 1.06% 960 2,830
RTI/STI Care 27 27 3.70% 750 360
Other Reproductive Health Care 73 73 10.96% 2,460 440
Child Health Care
1,161
1,161
0.95%
2,880
840
Immunization Program - EPI 1,015 1,015 0.00% 0 0
Immunization Program - NID 0 0 0.00% 0 0
Control of Diarrhoea & Other
Childhood Diseases
22
22
4.55%
900
120
Diarrhea 22 22 4.55% 900 120
Measles 0 0 0.00% 0 0
Control of Acute Respiratory
Infections
71
71
14.08%
1,980
720
Control of Micronutrient Deficiency 53 53 0.00% 0 0
Child Nutrition 53 53 0.00% 0 0
Vitamin A Deficiency 0 0 0.00% 0 0
Iodine Deficiency 0 0 0.00% 0 0

Pag
e11
1
RaCC PA 1 (January-March,2018)
TABLE 08.23:
PA wise Performance Summary
Contact
Service
Propoor %
Revenue
Subsidy
Communicable Diseases Control
0
0
0.00%
0
0
Tuberculosis Control 0 0 0.00% 0 0
Other Communicable Diseases
Control
0
0
0.00%
0
0
Limited Curative Care
3,292
3,299
14.19%
61,692
60,448
First Aid for Injuries 86 86 0.00% 4,250 50
Emergency Care 0 0 0.00% 0 0
Treatment of Minor Infections 3,206 3,213 14.57% 57,442 60,398
Support Services for ESP+
1,773
2,792
4.51%
162,210
35,385
Diagnostic Service 1,773 2,792 4.51% 162,210 35,385
Emergency Transportation Service 147 147 8.00% 9,303 7,300
Behavior Change Communication
7,892
2,676
14.85%
0
0
Health Education (Session) 2,522 298 27.64% 0 0
Counseling 5,370 2,378 8.85% 0 0
Miscellaneous
0
0
0.00%
0
0
Adolescent Development Program 0 0 0.00% 0 0
Income Generation from Medicine
-
-
13.56%
153,515
24,078
ESP+ Clinical Service
9,765
10,791
6.60%
517,369
501,615
ESP+ BCC Service
7,892
2,676
14.85%
0
0
Other Service
0
0
0.00%
0
0
Grand Total
17,657
13,467
10.32%
517,369
501,615
ESP+ Clinical Service %
54.93%
79.91%
-
100%
100%
ESP+ BCC Service %
45.07%
20.09%
-
0%
0%
Other Service %
0.00%
0.00%
-
0%
0%
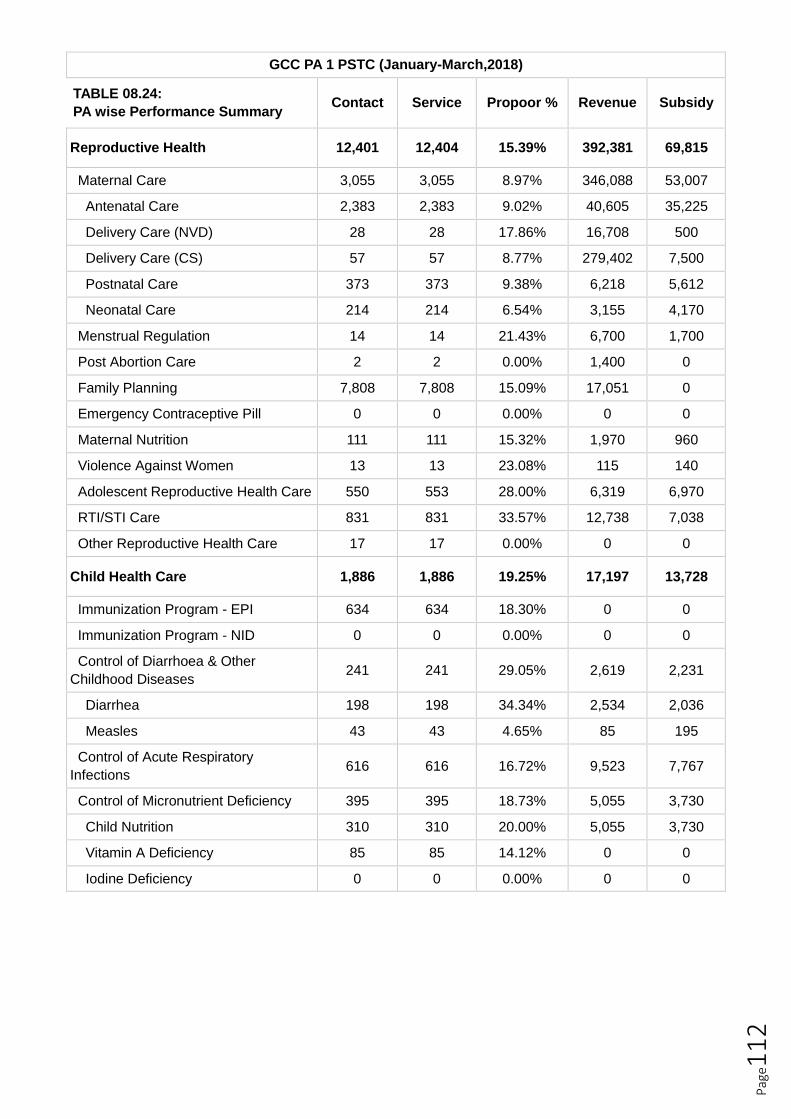
Pag
e11
2
GCC PA 1 PSTC (January-March,2018)
TABLE 08.24:
PA wise Performance Summary
Contact
Service
Propoor %
Revenue
Subsidy
Reproductive Health
12,401
12,404
15.39%
392,381
69,815
Maternal Care 3,055 3,055 8.97% 346,088 53,007
Antenatal Care 2,383 2,383 9.02% 40,605 35,225
Delivery Care (NVD) 28 28 17.86% 16,708 500
Delivery Care (CS) 57 57 8.77% 279,402 7,500
Postnatal Care 373 373 9.38% 6,218 5,612
Neonatal Care 214 214 6.54% 3,155 4,170
Menstrual Regulation 14 14 21.43% 6,700 1,700
Post Abortion Care 2 2 0.00% 1,400 0
Family Planning 7,808 7,808 15.09% 17,051 0
Emergency Contraceptive Pill 0 0 0.00% 0 0
Maternal Nutrition 111 111 15.32% 1,970 960
Violence Against Women 13 13 23.08% 115 140
Adolescent Reproductive Health Care 550 553 28.00% 6,319 6,970
RTI/STI Care 831 831 33.57% 12,738 7,038
Other Reproductive Health Care 17 17 0.00% 0 0
Child Health Care
1,886
1,886
19.25%
17,197
13,728
Immunization Program - EPI 634 634 18.30% 0 0
Immunization Program - NID 0 0 0.00% 0 0
Control of Diarrhoea & Other
Childhood Diseases
241
241
29.05%
2,619
2,231
Diarrhea 198 198 34.34% 2,534 2,036
Measles 43 43 4.65% 85 195
Control of Acute Respiratory
Infections
616
616
16.72%
9,523
7,767
Control of Micronutrient Deficiency 395 395 18.73% 5,055 3,730
Child Nutrition 310 310 20.00% 5,055 3,730
Vitamin A Deficiency 85 85 14.12% 0 0
Iodine Deficiency 0 0 0.00% 0 0

Pag
e11
3
GCC PA 1 PSTC (January-March,2018)
TABLE 08.24:
PA wise Performance Summary
Contact
Service
Propoor %
Revenue
Subsidy
Communicable Diseases Control
0
0
0.00%
0
0
Tuberculosis Control 0 0 0.00% 0 0
Other Communicable Diseases
Control
0
0
0.00%
0
0
Limited Curative Care
3,144
3,185
25.51%
46,161
37,931
First Aid for Injuries 212 212 15.09% 4,875 1,435
Emergency Care 3 3 0.00% 120 0
Treatment of Minor Infections 2,875 2,916 26.12% 40,671 35,801
Support Services for ESP+
1,455
3,464
22.47%
272,270
52,768
Diagnostic Service 1,428 3,437 22.76% 238,070 52,768
Emergency Transportation Service 27 27 7.41% 34,200 0
Behavior Change Communication
7,728
6,836
20.34%
0
0
Health Education (Session) 1,116 224 20.97% 0 0
Counseling 6,612 6,612 20.24% 0 0
Miscellaneous
82
6
20.73%
0
0
Adolescent Development Program 82 6 20.73% 0 0
Income Generation from Medicine
-
-
14.34%
532,829
89,167
ESP+ Clinical Service
18,832
20,885
17.95%
727,514
173,547
ESP+ BCC Service
7,728
6,836
20.34%
0
0
Other Service
82
6
20.73%
0
0
Grand Total
26,642
27,727
18.65%
727,514
173,547
ESP+ Clinical Service %
70.69%
75.32%
-
100%
100%
ESP+ BCC Service %
29.01%
24.65%
-
0%
0%
Other Service %
0.31%
0.02%
-
0%
0%

Pag
e11
4
GaCCPA2 (January-March,2018)
TABLE 08.25:
PA wise Performance Summary
Contact
Service
Propoor %
Revenue
Subsidy
Reproductive Health
11,720
11,757
27.02%
578,000
440,216
Maternal Care 3,189 3,189 26.78% 515,575 341,021
Antenatal Care 2,353 2,353 26.39% 58,565 33,415
Delivery Care (NVD) 71 71 30.99% 49,000 22,000
Delivery Care (CS) 76 76 23.68% 394,340 272,060
Postnatal Care 432 432 27.55% 7,990 9,006
Neonatal Care 257 257 28.79% 5,680 4,540
Menstrual Regulation 89 89 29.21% 31,740 36,260
Post Abortion Care 15 15 46.67% 12,240 14,760
Family Planning 6,574 6,574 26.89% 0 0
Emergency Contraceptive Pill 0 0 0.00% 0 0
Maternal Nutrition 0 0 0.00% 0 0
Violence Against Women 19 19 15.79% 40 80
Adolescent Reproductive Health Care 1,093 1,130 22.42% 9,310 31,480
RTI/STI Care 390 390 35.90% 6,415 9,215
Other Reproductive Health Care 351 351 35.33% 2,680 7,400
Child Health Care
4,997
4,997
21.79%
36,320
23,950
Immunization Program - EPI 3,264 3,264 19.18% 0 0
Immunization Program - NID 0 0 0.00% 0 0
Control of Diarrhoea & Other
Childhood Diseases
579
579
30.40%
12,220
10,220
Diarrhea 579 579 30.40% 12,220 10,220
Measles 0 0 0.00% 0 0
Control of Acute Respiratory
Infections
963
963
26.38%
24,100
13,730
Control of Micronutrient Deficiency 191 191 17.28% 0 0
Child Nutrition 191 191 17.28% 0 0
Vitamin A Deficiency 0 0 0.00% 0 0
Iodine Deficiency 0 0 0.00% 0 0

Pag
e11
5
GaCCPA2 (January-March,2018)
TABLE 08.25:
PA wise Performance Summary
Contact
Service
Propoor %
Revenue
Subsidy
Communicable Diseases Control
0
0
0.00%
0
0
Tuberculosis Control 0 0 0.00% 0 0
Other Communicable Diseases
Control
0
0
0.00%
0
0
Limited Curative Care
9,791
9,835
31.65%
84,962
289,275
First Aid for Injuries 916 916 32.97% 1,460 34,980
Emergency Care 0 0 0.00% 0 0
Treatment of Minor Infections 8,875 8,919 31.52% 83,502 254,295
Support Services for ESP+
1,798
4,044
30.65%
389,315
192,100
Diagnostic Service 1,782 4,028 30.92% 367,615 192,100
Emergency Transportation Service 16 16 0.00% 21,700 0
Behavior Change Communication
4,936
1,873
28.00%
0
0
Health Education (Session) 1,012 134 35.77% 0 0
Counseling 3,924 1,739 25.99% 0 0
Miscellaneous
30
3
16.67%
0
0
Adolescent Development Program 30 3 16.67% 0 0
Income Generation from Medicine
-
-
25.61%
349,588
120,365
ESP+ Clinical Service
28,306
30,633
27.93%
1,088,597
945,541
ESP+ BCC Service
4,936
1,873
28.00%
0
0
Other Service
30
3
16.67%
0
0
Grand Total
33,272
32,509
27.93%
1,088,597
945,541
ESP+ Clinical Service %
85.07%
94.23%
-
100%
100%
ESP+ BCC Service %
14.84%
5.76%
-
0%
0%
Other Service %
0.09%
0.01%
-
0%
0%
Top Related