


Languages
Pages
Legal


Future fire emissions associated with projected land usechange in SumatraMIR IAM E . MARL I ER 1 , RUTH DEFR I E S 1 , DERR IC PENN INGTON2 , ER IK NELSON3 , 4 ,
E L SA M . ORDWAY5 , J EREMY LEWI S 3 , SHANNON N . KOPL I TZ 6 and LORETTA J . MICKLEY6
1Department of Ecology, Evolution and Environmental Biology, Columbia University, New York, NY 10027, USA, 2World
Wildlife Fund, Washington, DC 20037, USA, 3Department of Economics, Bowdoin College, Brunswick, ME 04011, USA, 4Centre
for Environmental and Climate Research, Ecology Building, Lund University, Lund S-223 62, Sweden, 5Department of
Environmental Earth System Science, Stanford University, Stanford, CA 94305, USA, 6School of Engineering and Applied
Sciences, Harvard University, Cambridge, MA 02138, USA
Abstract
Indonesia has experienced rapid land use change over the last few decades as forests and peatswamps have been
cleared for more intensively managed land uses, including oil palm and timber plantations. Fires are the predominant
method of clearing and managing land for more intensive uses, and the related emissions affect public health by con-
tributing to regional particulate matter and ozone concentrations and adding to global atmospheric carbon dioxide
concentrations. Here, we examine emissions from fires associated with land use clearing and land management on
the Indonesian island of Sumatra and the sensitivity of this fire activity to interannual meteorological variability. We
find ~80% of 2005–2009 Sumatra emissions are associated with degradation or land use maintenance instead of imme-
diate land use conversion, especially in dry years. We estimate Sumatra fire emissions from land use change and
maintenance for the next two decades with five scenarios of land use change, the Global Fire Emissions Database Ver-
sion 3, detailed 1-km2 land use change maps, and MODIS fire radiative power observations. Despite comprising only
16% of the original study area, we predict that 37–48% of future Sumatra emissions from land use change will occur
in fuel-rich peatswamps unless this land cover type is protected effectively. This result means that the impact of fires
on future air quality and climate in Equatorial Asia will be decided in part by the conservation status given to the
remaining peatswamps on Sumatra. Results from this article will be implemented in an atmospheric transport model
to quantify the public health impacts from the transport of fire emissions associated with future land use scenarios in
Sumatra.
Keywords: air quality, climate variability, deforestation, fire emissions, land use
Received 25 November 2013 and accepted 12 June 2014
Introduction
Equatorial Asia lost approximately 1% of total forest
cover and 2.2% of peatswamp forest cover annually
from 2000 to 2010, with estimates as high as 5% per
year for lowland Sumatra (Miettinen et al., 2011).
Within the Sumatran provinces of Riau, North Suma-
tra, and Jambi, forest cover declined from 93 to 38% of
provincial area between 1977 and 2009. Almost half of
this deforestation was attributed to industrial planta-
tion establishment, primarily oil palm and timber plan-
tations, and a further 16% to smallholder agriculture
(Miettinen et al., 2012b). Oil palm and timber planta-
tion expansion has played an important role through-
out Indonesia over the past few decades (Fig. 1). To
the extent that fires are used to establish and maintain
these plantations, the associated emissions can impact
local and regional air quality, public health, and cli-
mate. Fire emissions from Equatorial Asia (mostly
from the islands of Sumatra and Borneo) released an
average of 128 Tg C per year between 2000 to 2006
(van der Werf et al., 2008), which is of comparable
magnitude to Indonesia’s emissions from fossil fuel
burning, cement manufacture, and gas flaring (Boden
et al., 2011). Land-clearing and maintenance fires also
release fine particulate matter (Heil & Goldammer,
2001; Marlier et al., 2013), which is dangerous to public
health.
High forest conversion rates in Indonesia are particu-
larly problematic with regard to emissions because
tropical peatswamps contain rich belowground carbon
stocks in addition to aboveground biomass. Indonesian
peatswamps alone are estimated to store at least 55 Gt
C and are susceptible to fire after drainage (Jaenicke
et al., 2008). Recent land use observations indicate that
plantations in Sumatra and Kalimantan (Indonesian
Borneo) are increasingly established on peatswampsCorrespondence: Miriam E. Marlier, tel. +1 347 871-1589,
fax +1 212 854-8188, e-mail: [email protected]
345© 2014 John Wiley & Sons Ltd
Global Change Biology (2015) 21, 345–362, doi: 10.1111/gcb.12691
Global Change Biology

instead of mineral soils (Miettinen et al., 2011; Carlson
et al., 2012). One-fifth of peatswamps in Sumatra,
Peninsular Malaysia, and Borneo (3.1 Mha) were con-
verted to industrial plantations by 2010; 62% of these
plantations were in Sumatra and mostly consisted of oil
palm and pulpwood plantations (Miettinen et al.,
2012a). Within Sumatra, Koh et al. (2011) estimated that
3.9 Mha of peatswamps were covered by mature oil
palm plantations by the early 2000s, dominated by the
Riau and South Sumatra provinces.
Logged forests, with reduced canopy cover, are vul-
nerable to burning due to drier fuels, so fire activity
tends to be concentrated in these heavily logged areas
and limited in pristine peatswamp forests (Siegert et al.,
2001; Dennis & Colfer, 2006; Miettinen et al., 2012b). A
case study in Kalimantan found that during the 1997–1998 El Ni~no, 59% of logged forests were affected by
fires vs. 6% of undisturbed forests, and most burned
area was concentrated on timber concessions, planta-
tions, agriculture, and fallow land (Siegert et al., 2001).
In general, logged forests in Equatorial Asia are not a
permanent land cover type. Governments often view
logged forests as having low conservation value and
tend to reclassify logging concessions, after all commer-
cially valuable timber has been removed, to allow con-
version to industrial-scale plantations (Giam et al.,
2011; Gaveau et al., 2013). Therefore, logged forests rep-
resent an intermediate step on the trajectory of land
conversion (with continued habitat destruction) by fire
or some other clearing method, as opposed to forest
regeneration (Miettinen et al., 2012b). In three study
sites in Sumatra, only 20% of logged forests as of the
1970s remained in forest cover by 2010 (Miettinen et al.,
2012b). Furthermore, 7.25 of the 7.54 Mha of primary
intact Sumatra forests that were deforested over 1990–2010 were logged before being cleared (Margono et al.,
2012).
In addition to deliberate land clearing and mainte-
nance fires and the fire-susceptibility of logged forests,
fire frequency and intensity have increased recently
due to escaped fires, land tenure disputes, resource
extraction, lack of fire-fighting capacity, fire use by
immigrants, (Dennis et al., 2005). See fig. 1 in Stolle
et al. (2003) for a conceptual model.
Along with anthropogenic drivers, the magnitude
and duration of fire emissions exposure in Equatorial
Asia depends on local meteorological conditions, which
are strongly influenced by the El Ni~no-Southern Oscil-
lation (ENSO) (Marlier et al., 2013). Seasonal precipita-
tion controls groundwater levels and the amount of
peat available for drying; the risk of intense fires in
southern Sumatra and Kalimantan substantially
increases when 4 month total precipitation drops below
critical 350-mm and 650-mm thresholds respectively
(Field & Shen, 2008). During drought stress, trees shed
leaves and have lower moisture content (Goldammer,
2006). The effect of the ENSO cycle has been observed
in Borneo, where fire incidence can be two to three
times higher during strong vs. weak El Ni~no events
(Wooster et al., 2012) and emissions can be up to 30
times higher (van der Werf et al., 2008). Sumatra also
experiences higher fire activity during drought condi-
tions, along with a trend of increasing fire emissions
over time (rising by ~8 Tg C per year over 2000 to
2006), which could be related to increased clearing rates
or intensified droughts (van der Werf et al., 2008).
Previously published projections of land use change
in Equatorial Asia predict continued plantation devel-
opment that could overtake current rates, depending on
future economic returns for various crops, the effective-
ness of conservation plans, and changes to El Ni~no. For
Equatorial Asia as a whole, one business-as-usual sce-
nario estimates that 6–9 Mha of the total peatswamp
area (25 Mha) will be converted to industrial planta-
tions by 2020 (Miettinen et al., 2012a), whereas an esti-
mated 3 Mha of peatswamps in Equatorial Asia were
converted by 2010 (Miettinen et al., 2012a). In Northern
Sumatra, establishing protected areas in inaccessible
upland forests is predicted to offer smaller reductions
in anticipated deforestation by 2030 than protecting a
more diverse mix of landscapes, including lowland for-
ests that have an inherently higher risk of conversion to
high-revenue plantations due to accessibility and prox-
imity to roads (1313 km2 vs. 7824 km2 in avoided defor-
estation) (Gaveau et al., 2009). Several studies have
focused on Kalimantan, where 1.1 Mha of peatswamp
forest loss in the Central Kalimantan province (roughly
half of the current area) is projected to occur by 2020
(Fuller et al., 2011). Carlson et al. (2013) found a 278%
increase in oil palm plantations in Kalimantan from
2000 to 2010 (62% of which involved deforestation),
0
5
10
15
20
25
0
1
2
3
4
5
6
7
1990 1995 2000 2005 2010 2015
Oil
palm
pro
duct
ion
(mill
ion
tonn
es)
Wood pulp production (m
illion tonnes)
Oil palm
Wood pulp
Fig. 1 Oil palm and wood pulp production (in million tonnes)
for all of Indonesia from 1990 to 2012 (accessed on 10/1/2013 at
http://faostat3.fao.org/faostat-gateway/go/to/home/E).
© 2014 John Wiley & Sons Ltd, Global Change Biology, 21, 345–362
346 M. E. MARLIER et al.

despite 79% of government leases for plantations still
remaining undeveloped. If all of these leases are devel-
oped using fire, oil palm expansion in Kalimantan will
contribute 22% of Indonesia’s total CO2 emissions in
2020 (Carlson et al., 2013). In recent oil palm projections
from 2010 to 2050 in Indonesia, Malaysia, and Papua
New Guinea, net cumulative carbon emissions from
land use conversion and peat oxidation are estimated at
15 Pg CO2 by 2050 under business-as-usual circum-
stances, with 77% of emissions from drainage of peat
on existing or new plantations (Harris et al., 2013).
Understanding the magnitude and spatial distribution
of fire emissions associated with land use change
(including oil palm expansion) are important for identi-
fying strategies to mitigate the impact of fires on both
climate and public health.
In this article, we study past drivers of fire emissions
to project future fire activity for the island of Sumatra,
which has experienced rapid deforestation due to large-
scale plantation development (Miettinen et al., 2011)
and is located near dense population centers. We build
upon prior works by combining spatially explicit eco-
nomic models of future land use change with detailed
estimates of the associated fire emissions. Specifically,
we ask: (i) How are fire emissions in Sumatra associated
with different land use management and transitions, (ii)
How does interannual meteorological variability impact
these observed relationships, and (iii) What are the
projected emissions associated with future land use
change scenarios for Sumatra? To address these ques-
tions, we synthesize information from multiple disci-
plines, including land use mapping, satellite fire
observations, and economic-based land use change
modeling. The emissions inventories created in this
study will be used in future research with a high-resolu-
tion atmospheric chemical transport model to estimate
public health impacts resulting from the transport of
these emissions.
Materials and methods
We examined patterns of fires and past land use change to
predict future fire emissions associated with several land use
change scenarios for Sumatra. Our approach relied on six
datasets: (i) 1-km2 land use classifications in 2006 and 2009, (ii)
0
N
200 400100Kilometers
Other
Forest, mineral soils Forest, peat soils Degraded, mineral soils Degraded, peat soils Plantation
Agriculture Urban
Clearing
Fig. 2 2006 baseline land use map for Sumatra from the Indone-
sian Ministry of Forestry (MoF). Classes have been aggregated
to 1-km2 resolution and grouped according to Table 1.
Table 1 Nine land use classes used in this analysis (left column) along with the original 21 land use classes (right column) from
the Indonesian Ministry of Forestry (MoF) 2006 and 2009 classification maps (MoF, 2011)
Land use/land cover Original MoF land use/land cover types
Forest, mineral soils (i) Primary dryland forest, (ii) secondary dryland forest, (iii) primary mangrove forest,
and (iv) secondary mangrove forest
Forest, peat soils (i) Primary swamp forest and (ii) secondary swamp forest
Degraded land, mineral soils (i) Savanna and (ii) bush scrub
Degraded land, peat soils (i) Swamp and (ii) scrub and bush swamp
Plantation
Established (i) Timber plantation* and (ii) other plantation†
Clearing (i) Defined as cleared land, logging for saw logs, or plantations
Agriculture (i) Nonrice agriculture with mixed bush, (ii) nonrice agriculture, and (iii) rice agriculture
Urban‡ (i) Defined as 50% mix crop and bush; 50% developed
Other§ (i) Cloud, (ii) water, (iii) beach, and (iv) other
*Mix of logging: 50% saw logs and 50% pulp.
†Weighted average mix of top five tree crops by area and can vary by location; includes oil palm.
‡Considered static in this analysis.
§Not included in this analysis.
© 2014 John Wiley & Sons Ltd, Global Change Biology, 21, 345–362
FUTURE FIRE EMISSIONS IN SUMATRA 347

biophysical and economic productivity information for each
1-km2 pixel, (iii) 0.25° 9 0.25° Global Fire Emissions Dataset
version 3 (GFED3) for 2005 to 2009, (iv) 1-km2 Moderate Reso-
lution Imaging Spectroradiometer (MODIS) fire radiative
power (FRP) observations for 2005–2009, (v) MODIS Collec-
tion 5.1 Direct Broadcast Monthly Burned Area Product (BAP)
(MCD64A1), and (vi) five scenarios of projected 1-km2 land
use at 3-year intervals until 2030. The role of each data set is
described below.
Past land use observations
30-m2 land use classification maps of Sumatra for 2006 and
2009, based on Landsat and SPOT satellite observations, were
produced by the Directorate of Forest Resources Monitoring
and Inventory of Indonesia’s Ministry of Forestry (MoF) (MoF,
2011). The 2006 classification map was based on satellite
images from 2005 and 2006 and the 2009 map included satel-
lite images from 2009. MoF land use classification and zoning
maps have been used by several previous studies (Dennis &
Colfer, 2006; Broich et al., 2011; Gaveau et al., 2012; Margono
et al., 2012; Romijn et al., 2013). Accuracy is estimated at >90%for the forest classes based on ground validation and local
knowledge (Margono et al., 2012 & citations within). We sim-
plified the MoF land use maps by re-scaling to 1-km2 resolu-
tion by assigning the most dominant land use class (Table S1)
and condensing the original 21 land use classes to 9 (Fig. 2,
Table 1). Selected examples of Landsat satellite data and cor-
responding MoF land use maps are shown in Figure S1. To
translate 2006–2009 land use change information into a fire
emissions inventory, we needed to determine which transi-
tions were likely driven by fire and in what month and year
these transitions occurred, which is described in the next step.
Past fires and emissions
Past land use and fire. We associated the 2006–2009 land use
transitions with concurrent GFED3 emissions. GFED3 is a
monthly, 0.25° 9 0.25° gridded fire emissions product that
combines satellite observations of burned area with a biogeo-
chemical model to estimate trace gas and aerosol emissions.
Global average uncertainty is estimated at 20%, but is higher
in Equatorial Asia because of uncertainties related to fuel con-
sumption in peat areas and small fires that can be missed by
the burned area detection algorithm. We addressed the latter
with a correction factor for the contribution of small fires, as
described below. GFED partitions emissions among general
fire types, including grassland, deforestation, peat, agricul-
tural waste, forest, and woodland (van der Werf et al., 2010).
However, there are many 1-km2 land use classes and transi-
tions within each 0.25° 9 0.25° grid cell, which comprises
more than 700 1-km2 pixels. This density of data necessitated
an intermediate step with finer spatial information on fire
activity before attributing GFED3 emissions to detailed land
use change.
For this intermediate step, we overlaid daily 1-km2 observa-
tions of FRP onto the land use maps. FRP is the rate of electro-
magnetic energy released by a fire, from MODIS Aqua and
Terra (MOD14A1 + MYD14A1 products). FRP is related to the
rate of fuel consumption and can substitute for estimates of
burned area, biomass density, and combustion completeness,
although there are uncertainties regarding the partitioning of
heat loss among various mechanisms and how this varies with
fuel and fire type (Wooster et al., 2005). Fires in tropical eco-
systems tend to peak in the afternoon (Giglio, 2007), but we
summed FRP detected by both Terra and Aqua to capture a
broader observational time period (local overpass times of
10:30 hours and 1:30 hours). By overlaying FRP with land use
transitions (Table 2), we could determine which transitions
were associated with coincident fire observations and the
month-to-month variability in peak fire activity within each
transition type. We could also estimate the proportion of (i)
fires observed during land use conversion, (ii) maintenance
fires observed in stable classes, and (iii) unintentional fires that
do not increase the economic returns of a given land parcel.
For each month, we summed the maximum daily FRP from
Aqua and Terra detected within each land use transition class
Table 2 Area (in 100 km2) for the 7 modeled land use classes in 2006 (rows) and 2009 (columns). Refer to Table 1 for descriptions
of land uses within each class. Urban areas in 2006 or 2009 were combined, with a total area of 8805 km2, and the ‘Other’ class has
been omitted. Italicized areas represent implausible transitions (such as forest on peat soils to forest on mineral soils)
2006 Land Use
2009 Land Use
Total
Forest,
Mineral
Forest,
Peat
Degraded,
Mineral
Degraded,
Peat
Plantation
AgricultureEstablished Clearing
Forest, Mineral 836.5 3.3 19.1 0.7 7.6 6.9 20.0 894.1
Forest, Peat 0.3 282.6 1.5 19.5 15.2 22.0 2.8 343.8
Degraded, Mineral 20.5 4.1 232.0 4.3 8.6 2.1 32.3 303.9
Degraded, Peat 1.2 14.1 2.8 283.9 8.3 5.0 10.6 326.0
Plantation
Established 3.6 2.4 13.0 4.5 551.4 11.9 28.9 615.7
Clearing 1.3 0.9 10.5 1.8 11.5 46.7 6.5 79.1
Agriculture 18.2 3.7 42.4 10.4 31.8 8.8 1326.6 1441.9
Total 881.5 311.0 321.2 325.2 634.5 103.6 1427.6
© 2014 John Wiley & Sons Ltd, Global Change Biology, 21, 345–362
348 M. E. MARLIER et al.

(such as peat forests to agriculture) and GFED grid cell. Our
observational window was January 2005 to December 2009 to
cover the entire range of satellite data used in the MoF classifi-
cation maps.
With this information on finer scale fires and land use tran-
sitions, we then incorporated 0.25° 9 0.25° GFED3 emissions.
First, we applied a correction factor to GFED3 for small fires
that may have been missed in the baseline 500-m 9 500-m
burned area datasets used in developing GFED3. In Equatorial
Asia, this correction increased 2001–2010 average fire carbon
emissions by 55% (Randerson et al., 2012), which reflects the
large proportion of small burn scars (<25 ha) that have been
mapped in Equatorial Asia (Miettinen & Liew, 2009). Each
0.25° 9 0.25° GFED3 grid cell can include fire-driven land use
transitions, fires that result in stable land use types, and/or
transitions not associated with fires. To keep the transitions
without coincident fire observations from contributing to fire
emissions (such as manual clearing), we allocated monthly
GFED fire emissions in proportion to the monthly sum of
daily 1-km2 FRP observations within the 0.25° grid cell for
each land use transition type, so that only land use pixels asso-
ciated with FRP observations could contribute to our esti-
mated GFED emissions for each land use transition. If no FRP
was observed for a specific land use transition within a GFED
grid cell, estimated emissions would be higher for other land
use transitions with fire observations within that cell. If no
FRP was observed in a grid cell with nonzero GFED emis-
sions, then this cell would have no emissions in our down-
scaled product, though this effect was small (see Results).
The downscaled estimates of GFED3 fire emissions were per
1-km2 per month, for each transition type (49 possible transi-
tions from 7 classes – not including the urban or other classes).
When we applied the downscaled estimates to future scenar-
ios, we used the Sumatra-wide average and assumed that fires
observed for each transition in the past remains constant in
the future.
Interannual variability in emissions. The strong interannual
variability in dry season precipitation was also reflected in
total fire emissions (Table 3). We quantified the difference in
emissions during a representative dry year and wet year
(2006 and 2010, respectively) to appropriately consider this
interannual variability in our future emissions estimates. We
selected 2010 for this analysis because it is the first year after
our 2009 land use map so we could assume that all of the
documented land use change had already occurred. Burned
area and active fire products have different strengths and
weaknesses: burned area is more affected by cloud cover,
but the signal can persist for longer, whereas active fire
detections are more dependent on fires coinciding with the
satellite overpass. To build on the strengths of each approach
to measuring fire extent, we created a fire-affected area mask
by combining the MCD64A1 data and FRP information, for
2006 and 2010. Likely owing to the extensive cloud cover in
this region, BAP pixels increased the fire mask extent from
the FRP data by <1% for each year. By analyzing these
results with land use types and transitions, it was possible to
obtain a more nuanced understanding of the differences in
emissions between dry and years across different land use
transitions.
Future fires and emissions
Future land cover scenarios. We created 1-km2 land use
maps for Sumatra from 2009 to 2030, with 3-year time steps,
with an estimated land use change random utility model
(RUM). A land use change RUM assumes that observed land
use change was largely driven by land users’ desire to maxi-
mize the expected net monetary returns (gross revenues less
production costs and any land use conversion costs) at each
time step (Plantinga, 1996; Lewis et al., 2011; Lawler et al.,
2014). However, this primary objective can be attenuated by
several factors, which in Sumatra include: (i) plantation or log-
ging concessions and protected land status, which make con-
versions to untargeted land uses very costly economically
(potentially also in legal and social terms) and (ii) unobserved
personal preferences and cultural norms for land use that can
outweigh economic objectives. The Sumatra land use change
RUM is estimated with 2006–2009 Sumatra maps of land use,
economic productivity, and land use regulations, and there-
fore incorporates the aforementioned mitigating factors to the
extent that they affected land use change during 2006–2009.
See Nelson et al. (2014) and the Supplementary Information
for more detailed information.
Table 3 July to November average precipitation (in mm month�1) and total emissions (in Tg DM yr�1) over the Sumatra land
area. Fire-affected area in forest (on mineral or peat soils), degraded lands (on mineral or peat soils), and nonforest (plantation,
clearing, and agriculture) for 2006 (dry year) and 2010 (wet year), based on 2006 and 2009 land use maps, and 2006 and 2010 fire-
affected mask respectively. Precipitation data are from the GEOS-5 assimilated meteorology from the NASA Global Modeling and
Assimilation Office (GMAO)
Year
Precipitation
(mm month�1)
Emissions
(Tg DM yr�1)
Fire area in
forests (km2)
Fire area in degraded
lands (km2)
Fire area in
nonforest (km2)
2005 85.6 56.0
2006 65.2 209.7 7.24E+03 1.28E+04 1.72E+042007 81.9 26.2
2008 86.7 46.9
2009 77.8 69.1
2010 94.6 14.1 2.60E+03 1.34E+03 4.47E+03
© 2014 John Wiley & Sons Ltd, Global Change Biology, 21, 345–362
FUTURE FIRE EMISSIONS IN SUMATRA 349

Because the incorporation of unobserved preferences and
norms for land use is accomplished with a random variable,
estimated RUMs give probabilistic results. For example, with
the estimated Sumatra RUM and 2006–2009 land use produc-
tivity and regulation (i.e., concession and protected status)
data for a 1-km2 peatswamp forest in 2006, we are able to cal-
culate the statistical likelihood of the parcel remaining in peat-
swamp forest or converting to other land uses by 2009. After
we had calculated these expected 2006–2009 land use change
probabilities for all 7 modeled economic land uses in each
Sumatra parcel, we calculated average transition probabilities
for parcels in the same district, with the same 2006 land use,
the same soil quality, and the same 2006 regulation category.
With these estimated parcel-level transition matrices, we pre-
dicted the 2009 map from the observed 2006 map, and then
every 3 years until 2030, where the transition probability vec-
tor assigned to each parcel at time step t + 1 was determined
by its land use, soil quality category, land use regulation cate-
gory, and district at time t. To calculate the areal mix of land
use types in each GFED grid cell at each time step t, we over-
laid the 0.25° 9 0.25° GFED grid on the 1-km2 estimated land
use maps. Finally, urban land use in either 2006 or 2009 was
considered static; parcels classified as ‘Other’ in 2006 or 2009
were dropped from further analysis. See Nelson et al. (2014)
and the Supplementary Information for more detailed infor-
mation.
The case described above creates a business-as-usual 2009–
2030 trajectory of land use, which we refer to as the ‘Stable
Prices’ scenario because we use the observed economic and
land use regulations from 2006 to 2009 to create the transition
matrices. Therefore, land use maps out to 2030 represent
expected land use change if real net returns to land use, land
use regulation, and other unobserved land use determinants
from the 2006 to 2009 era remained spatially and temporally
unchanged until 2030 (Table 4).
We also estimated the future land use scenarios for Sumatra
with alternative 2009–2030 landscape conditions. For example,
under the ‘High Oil Palm’ scenario, we increased the gross
returns for the land use categories that include oil palm plan-
tations by 30% compared to those used in the ‘Stable Prices’
scenario. This scenario reflects the upward trend in oil palm
prices observed since 2009 (FAOStat, 2013). Then, using the
previously estimated RUM (which is a function of market
prices), the 2006 land use map, the modified price data, and all
other observed 2006–2009 landscape conditions, we con-
structed new 2006–2009 transition matrices, with each set of
parcels grouped according to 2006 land use, soil quality, land
use regulation category, and district. These transition matri-
ces, along with the observed 2006 land use map, then formed
the series of 2009–2030 ‘High Oil Palm’ scenario maps
(Table 4). Under the ‘National Spatial Plan’ scenario, we mod-
ified the 2006–2009 zoning and concession map according to
government documents that detail the Indonesian govern-
ment’s plan for limited and unrestricted production forests,
cultivated areas, urban uses, and conservation areas. All other
2006–2009 landscape conditions were left unchanged. Then, as
before, we used the previously estimated RUM, the 2006 land
use map, and the modified data set of 2006–2009 conditions to
calculate land use transition probability matrices and then
projected land use out to 2030 in 3-year time steps.
Other alternative scenarios we considered when estimating
trajectories of land use for every 3 years from 2009 to 2030
include ‘Green Vision’ and ‘Green Vision with Peat Protection’
(Table 4). Under ‘Green Vision,’ 2006 to 2009 zoning maps
were modified according to a sustainable development plan
focused on ecosystem conservation endorsed by the Indone-
Table 4 Description of future scenarios and associated assumptions about future trends in land use zoning, economic returns, and
tax or subsidy policies
Scenario Description
Stable prices Assumes market, economic, political, and social conditions observed from 2006 to 2009 in Sumatra,
Indonesia, and globally continue until 2030.
National spatial plan Re-zones Stable Prices scenario using Indonesian government spatial plan, which includes conserved
forests, working forests that cannot be cleared, and unrestricted zoning classes. New urban areas are
added in 2009 since we do not have information on how these areas will be implemented over time. This
plan was established by Government Regulation Act No. 26 2007 and Act. No. 26 2008, which established
the National Spatial Plan (RTRWN) and were developed by the Ministry of Public Works (Kementerian
Pekerjaan Umum).
Green vision Implements World Wildlife Fund sustainable development plan, which changes zoning for different land
uses to conserve forested areas. Incorporates leakage effects by increasing revenues in areas where
agriculture or plantation conversion is permitted.
Green vision with
peat protection
In addition to Green Vision scenario described above, also places all forest or degraded areas on peat
soils (as of 2006) in protected area zones and blocks fire incidence in these areas.
High oil palm Sets real commodity prices for commodities produced on land classes that contain oil palm higher than
the 2006-2009 observed prices. The sub-classes that contain oil palm are other plantation and nonrice
agriculture with mixed bush. The clearing land use class also contains oil palm. We multiplied 2006-2009
real commodity prices for commodities produced by each of these subclasses and the clearing land use
by 30%. Expected prices used for RUM estimation occurred during the most recent global recession, so
this scenario mimics market prices more consistent with current conditions.
© 2014 John Wiley & Sons Ltd, Global Change Biology, 21, 345–362
350 M. E. MARLIER et al.
sian Ministry of Environment, Ministry of Public Works, Min-
istry of Forestry, and Ministry of Home Affairs, which rezones
areas in Sumatra into important conservation areas, produc-
tion areas with certification principles for sustainable develop-
ment, and unrestricted development (Roosita et al., 2010). All
other 2006 to 2009 landscape conditions were left unchanged.
The ‘Green Vision with Peat Protection’ is similar to ‘Green
Vision’ scenario, but provides protected status to all parcels
with peatswamp in 2006 and assumes that any remaining con-
version in these areas occurs without fire.
Future fire emissions. We applied the 1-km2 estimates of
observed fire emissions for each land use transition to the
future scenarios. We first normalized total GFED emissions
created by each type of land use transition by the area
observed from 2006 to 2009 (Table 2). Although some future
transitions will likely occur without fires (Table 5), we applied
the average emissions per unit area to the predicted area of all
individual land use changes within the 0.25° GFED grid cell.
We matched our more detailed fire types from land use transi-
tions to one of the six GFED fire types (van der Werf et al.,
2010). Forests or degraded land on peat soils were considered
peatland fires; degraded land on mineral soils, clearing, or
urban were considered savanna fires, plantation was consid-
ered woodland fires; and agriculture was considered agricul-
tural waste burning. Following van der Werf et al. (2010), we
considered all tropical forest fires (on mineral soils) to be
deforestation fires.
There is a highly nonlinear relationship between fire emis-
sions and dry season precipitation in this region (van der Werf
et al., 2008); Table 3 shows the interannual variability between
0.5° dry-season precipitation and observed GFED3 emissions
(including small fires) for 2005 to 2010. We used this observed
variability to understand how the contribution of different fire
types could vary interannually with future meteorology. The
influence of near-term climate change on Equatorial Asia on
this short a timescale is uncertain (Collins, 2005; Christensen
& Kanicharla, 2014), and we do not include its effects. Instead
we assume that the mean and variability of the meteorology
observed during our 2005 to 2009 training period continues
until 2030.
Results
Past land use transitions
We estimated the role of fire in specific land use transi-
tions by counting how many pixels within each transi-
tion class were associated with at least one fire
observation over the 2005 to 2009 period (Table 5). This
allowed us to observe which original 2006 land use
classes had coincident fire observations during transi-
tions to other land use classes, as well as which final
land use classes in 2009 had corresponding fire obser-
vations. The 2006 land uses associated with the highest
average proportion of fire observations were forests,
degraded land on peat soils, and clearing, all of which
had mean proportions above 30%. Compared with all
2009 classes, the clearing class had the highest mean
incidence of observed fires (50%), calculated by averag-
ing all 2006 land uses that resulted in clearing by 2009.
MODIS FRP coincident with land use transitions var-
ied among different land use classes and over time. The
monthly time series of summed FRP (from Terra and
Aqua) for all of Sumatra is shown in Fig. 3 for transi-
tions originating in each land use class. The highest
FRP observations were observed in forest or degraded
land on peat soils. Forest on peat soils had the highest
FRP activity observed in early 2005 that corresponded
with pixels transitioning to clearing over 2006 to 2009,
as well as moderate FRP activity that corresponded
with stable (nontransitioning) forest areas. Stable
degraded land on peat soils showed consistent peaks
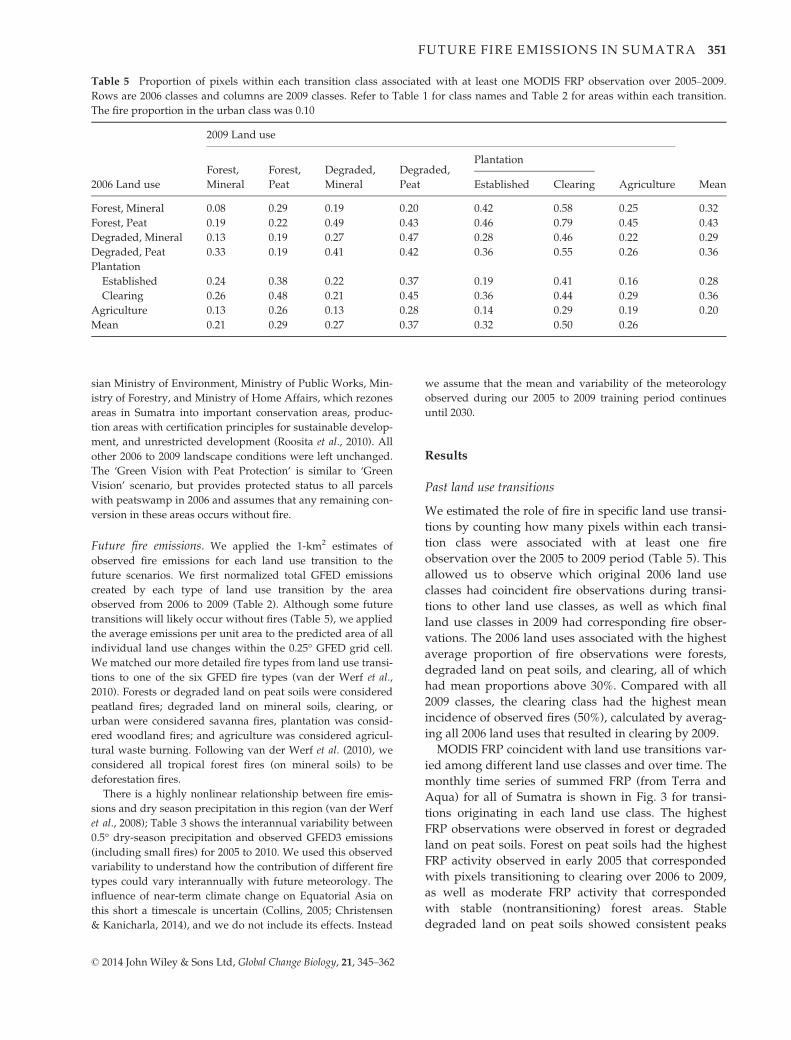
Table 5 Proportion of pixels within each transition class associated with at least one MODIS FRP observation over 2005–2009.
Rows are 2006 classes and columns are 2009 classes. Refer to Table 1 for class names and Table 2 for areas within each transition.
The fire proportion in the urban class was 0.10
2006 Land use
2009 Land use
Mean
Forest,
Mineral
Forest,
Peat
Degraded,
Mineral
Degraded,
Peat
Plantation
AgricultureEstablished Clearing
Forest, Mineral 0.08 0.29 0.19 0.20 0.42 0.58 0.25 0.32
Forest, Peat 0.19 0.22 0.49 0.43 0.46 0.79 0.45 0.43
Degraded, Mineral 0.13 0.19 0.27 0.47 0.28 0.46 0.22 0.29
Degraded, Peat 0.33 0.19 0.41 0.42 0.36 0.55 0.26 0.36
Plantation
Established 0.24 0.38 0.22 0.37 0.19 0.41 0.16 0.28
Clearing 0.26 0.48 0.21 0.45 0.36 0.44 0.29 0.36
Agriculture 0.13 0.26 0.13 0.28 0.14 0.29 0.19 0.20
Mean 0.21 0.29 0.27 0.37 0.32 0.50 0.26
© 2014 John Wiley & Sons Ltd, Global Change Biology, 21, 345–362
FUTURE FIRE EMISSIONS IN SUMATRA 351
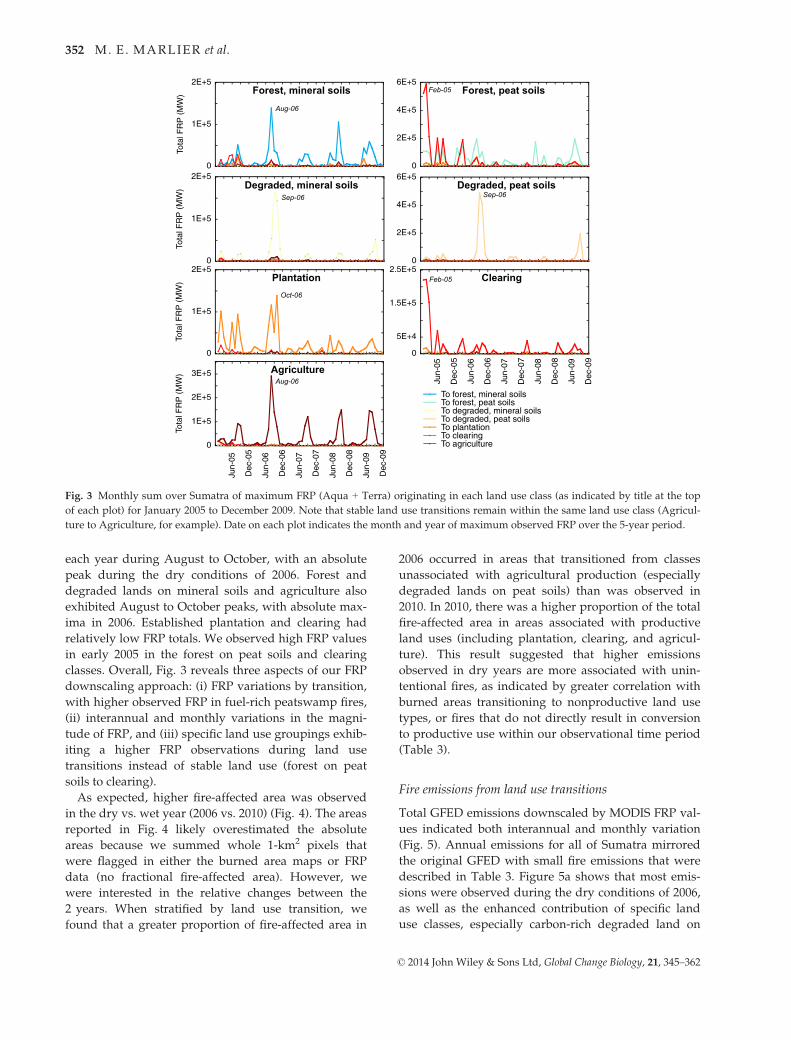
each year during August to October, with an absolute
peak during the dry conditions of 2006. Forest and
degraded lands on mineral soils and agriculture also
exhibited August to October peaks, with absolute max-
ima in 2006. Established plantation and clearing had
relatively low FRP totals. We observed high FRP values
in early 2005 in the forest on peat soils and clearing
classes. Overall, Fig. 3 reveals three aspects of our FRP
downscaling approach: (i) FRP variations by transition,
with higher observed FRP in fuel-rich peatswamp fires,
(ii) interannual and monthly variations in the magni-
tude of FRP, and (iii) specific land use groupings exhib-
iting a higher FRP observations during land use
transitions instead of stable land use (forest on peat
soils to clearing).
As expected, higher fire-affected area was observed
in the dry vs. wet year (2006 vs. 2010) (Fig. 4). The areas
reported in Fig. 4 likely overestimated the absolute
areas because we summed whole 1-km2 pixels that
were flagged in either the burned area maps or FRP
data (no fractional fire-affected area). However, we
were interested in the relative changes between the
2 years. When stratified by land use transition, we
found that a greater proportion of fire-affected area in
2006 occurred in areas that transitioned from classes
unassociated with agricultural production (especially
degraded lands on peat soils) than was observed in
2010. In 2010, there was a higher proportion of the total
fire-affected area in areas associated with productive
land uses (including plantation, clearing, and agricul-
ture). This result suggested that higher emissions
observed in dry years are more associated with unin-
tentional fires, as indicated by greater correlation with
burned areas transitioning to nonproductive land use
types, or fires that do not directly result in conversion
to productive use within our observational time period
(Table 3).
Fire emissions from land use transitions
Total GFED emissions downscaled by MODIS FRP val-
ues indicated both interannual and monthly variation
(Fig. 5). Annual emissions for all of Sumatra mirrored
the original GFED with small fire emissions that were
described in Table 3. Figure 5a shows that most emis-
sions were observed during the dry conditions of 2006,
as well as the enhanced contribution of specific land
use classes, especially carbon-rich degraded land on
0
1E+5
2E+5To
tal F
RP
(M
W)
0
1E+5
2E+5
Tota
l FR
P (
MW
)
0
2E+5
4E+5
6E+5
0
1E+5
2E+5
3E+5
Jun-
05
Dec
-05
Jun-
06
Dec
-06
Jun-
07
Dec
-07
Jun-
08
Dec
-08
Jun-
09
Dec
-09
Tota
l FR
P (
MW
)
0
2E+5
4E+5
6E+5
0
1E+5
2E+5
Tota
l FR
P (
MW
)
0
5E+4
1.5E+5
2.5E+5
Jun-
05
Dec
-05
Jun-
06
Dec
-06
Jun-
07
Dec
-07
Jun-
08
Dec
-08
Jun-
09
Dec
-09
To forest, mineral soilsTo forest, peat soilsTo degraded, mineral soilsTo degraded, peat soilsTo plantationTo clearingTo agriculture
Forest, mineral soils Forest, peat soils
Degraded, mineral soils Degraded, peat soils
Plantation Clearing
Agriculture
Aug-06
Feb-05
Sep-06 Sep-06
Feb-05
Oct-06
Aug-06
Fig. 3 Monthly sum over Sumatra of maximum FRP (Aqua + Terra) originating in each land use class (as indicated by title at the top
of each plot) for January 2005 to December 2009. Note that stable land use transitions remain within the same land use class (Agricul-
ture to Agriculture, for example). Date on each plot indicates the month and year of maximum observed FRP over the 5-year period.
© 2014 John Wiley & Sons Ltd, Global Change Biology, 21, 345–362
352 M. E. MARLIER et al.

peat soils. These totals show the emissions originating
in these seven land use classes and transitioning to any
other class. Emissions from degraded land on peat soils
contributed more than 40% of total emissions during
2006, but a smaller fraction of total emissions during
wetter years (like 2005). Emissions from plantations
showed the least interannual variability. A large pro-
portion of emissions were not associated with land use
transitions observable over our time period (Fig. 5c),
but forests on peat soils had the largest proportion of
emissions transitioning to another class (clearing). Our
estimates of future burning assume that nontransition
emissions continue at the same levels as observed dur-
ing 2005–2009.Sumatra-level emissions for all years (2005–2009)
within a given month showed the strong variability
over the course of the year in overall fire activity and
fire type (Fig. 5b). Both the bulk of emissions and the
contribution of peatswamp fires peaked during August,
September, and October. Emissions from agricultural
and established plantation areas also peaked during
these months, and burning in the clearing class
contributed the most during September and October.
Overall, these results indicated that degraded lands on
mineral or peat soils were the most vulnerable during
the summer months of dry years.
Future emissions from land use change
The trends in total area within each land use class
demonstrates the power of land use policies to influ-
ence future development, as well as the sensitivities of
the RUM model to the economic and policy assump-
tions implemented in each scenario (Fig. 6). Forests on
mineral soils showed equally large increases with the
‘Green Vision’ and ‘Green Vision with Peat Protection’
and the strongest declines in the ‘High Oil Palm’ sce-
nario (Fig. 6a). Similar trends were observed for forests
on peat soils (Fig. 6b), except that the ‘Green Vision
with Peat Protection’ scenario had much larger gains.
Degraded lands on mineral soils (Fig. 6c) declined in
all scenarios, with the steepest decline in the ‘High Oil
Palm’ scenario. The ‘Stable Prices’ and ‘National Spa-
tial Plan’ also exhibited slight recovery after 2018. All
scenarios showed declines in degraded land on peat
soil area (Fig. 6d), with the largest changes in the
‘High Oil Palm’ and ‘Green Vision with Peat Protec-
tion’ scenarios. Plantation area (Fig. 6e) increased in all
scenarios except for ‘Green Vision with Peat Protec-
tion.’ Trends in the clearing class (Fig. 6f) were similar
for all scenarios except the ‘High Oil Palm’ scenario,
with fivefold increases in area. Agricultural area
(Fig. 6g) had slight gains in the ‘Stable Prices’ and
0 4000 8000 1.2E+4
Forest,peat soils
Forest,mineral soils
Degraded land,peat soils
Degraded land,mineral soils
Plantation
Clearing
Agriculture
2006 fire-affected area (km2)
0 500 1000 1500 2000 2500
Forest,peat soils
Forest,mineral soils
Degraded land,peat soils
Degraded land,mineral soils
Plantation
Clearing
Agriculture
2010 fire-affected area (km2)
Fig. 4 Annual fire-affected mask from MODIS burned area product and active fire detections for 2006 (representative dry year) and
2010 (representative wet year). Area (km2) from the fire-affected mask is partitioned into land use classes described in Table 1. Left col-
umn represents 2006 (transitions from 2006 land use), right column represents 2010 (transitions to 2009 land use).
© 2014 John Wiley & Sons Ltd, Global Change Biology, 21, 345–362
FUTURE FIRE EMISSIONS IN SUMATRA 353

‘High Oil Palm’ scenario, with declines in the other
three scenarios.
Figure 7a shows the percentage of forest cover (on
mineral or peat soils) for each 0.25° 9 0.25° grid cell,
for the same scenarios described above. All five scenar-
ios indicated that most of the projected remaining forest
was in the western part of Sumatra (mostly forests on
mineral soils at high elevations). There were varying
degrees of remaining forest (mostly on peat soils) in the
eastern part of Sumatra; the lowest forest cover was in
the ‘High Oil Palm’ scenario and the highest in the
‘Green Vision with Peat Protection’ scenario. The
‘Green Vision’ scenario also had higher retention of for-
ests in eastern Sumatra, but since fires could still occur
in these areas, fire emissions remained high (Fig. 7b).
Cumulative total emissions (2009–2030) showed that
the eastern part of Sumatra dominated fire emissions
over the next two decades due to emissions from peat
areas, which contributed to the bulk of emissions in
all scenarios (Table 6). Our three-yearly estimates
assumed that meteorological conditions over our obser-
vational period were representative of the next two
decades. The highest total emissions (3189 Tg DM from
2009 to 2030) were projected in the ‘High Oil Palm’ sce-
nario due to the increased contribution of fires from the
clearing class (including initial stages of plantation
development), in addition to fires in peat areas. The
‘National Spatial Plan’ and ‘Stable Prices’ scenarios fol-
lowed with similar totals of 2723 and 2733 Tg DM in
cumulative emissions respectively. The ‘Green Vision’
scenario had slightly lower emissions (2580 Tg DM
from 2009 to 2030), with differing reduced contribu-
tions from degraded land and clearing. The ‘Green
Vision with Peat Protection’ scenario had the lowest
total emissions, 1320 Tg DM. Emissions time series for
the next two decades showed the stark contrast
between the ‘High Oil Palm’ and ‘Green Vision with
Peat Protection’ scenarios (Fig. 8).
0
50
100
150
200
2005 2006 2007 2008 2009
GF
ED
em
issi
ons
(Tg
DM
for
2005
-09)
0
20
40
60
80
100
120
Jan
Feb
Mar
Apr
May Jun
Jul
Aug
Sep Oct
Nov
Dec
0
20
40
60
80
100
120
For
est,
min
eral
soi
ls
For
est,
peat
soi
ls
Deg
rade
d,m
iner
al s
oils
Deg
rade
d,pe
at s
oils
Pla
ntat
ion
Cle
arin
g
Agr
icul
ture
2006 land use
GF
ED
em
issi
ons
(Tg
DM
for
2005
-09)
(a) (b)
(c)To forest, mineral soilsTo forest, peat soilsTo degraded, mineral soilsTo degraded, peat soilsTo plantationTo clearingTo agriculture
To forest, mineral soilsTo forest, peat soilsTo degraded, mineral soilsTo degraded, peat soilsTo plantationTo clearingTo agriculture
Legend (a+b)
Legend (c)
Fig. 5 Sum of total Sumatra fire emissions for 2005–2009 (in Tg DM) from FRP-downscaled GFED emissions for land use classes
described in Table 1. (a) Annual sum, (b) Sum for all years within a given month, and (c) Emissions coming from original land use
groupings in 2006 (x-axis) to land use groupings in 2009 (bars).
© 2014 John Wiley & Sons Ltd, Global Change Biology, 21, 345–362
354 M. E. MARLIER et al.

In Fig. 9, the three-yearly emissions from the ‘High
Oil Palm’ scenario were partitioned into an annual time
step, which illustrated the strong impact that applying
interannual variability in meteorology can have on peak
annual emissions totals. Here, we repeated the 2005 to
2009 meteorology for the next two decades and allowed
the contributions of each fire type to vary according to
the proportions of each fire type per year, as observed
in Fig. 5. (These relationships were also supported by
our analysis of burned area in Fig. 4.) For example, for
the 2009 to 2011 time period, we assigned meteorologi-
cal conditions for 2009, 2005, and 2006, in that order.
We then calculated the proportion of emissions that
each year would contribute if that sequence of meteo-
rology had occurred in the past, and scaled the 2009 to
2011 estimated three-yearly total accordingly. In Fig. 9a,
spikes in emissions estimates could change estimated
population exposures to fire emissions, as opposed to
the constant emissions in Fig. 9b. The sum of all types
of fire emissions is shown in Fig. 9c, for constant three-
yearly emissions and partitioning these same emissions
into an annual time step using 2005 to 2009 meteorol-
ogy. While we do not expect present-day meteorologi-
cal conditions to continue into the future, these years
offer a feasible representation of the interannual vari-
ability in meteorology and its effect on emissions.
Planned future work will include sensitivity cases to
test the effect of different meteorological conditions.
6E+4
7E+4
8E+4
9E+4
1E+5
2005 2010 2015 2020 2025 2030
Are
a (k
m2 )
1E+4
2E+4
3E+4
4E+4
5E+4
6E+4
2005 2010 2015 2020 2025 20302E+4
2.4E+4
2.8E+4
3.2E+4
2005 2010 2015 2020 2025 2030
1.1E+5
1.2E+5
1.3E+5
1.4E+5
1.5E+5
1.6E+5
2005 2010 2015 2020 2025 2030
Are
a (k
m2 )
1.5E+4
2E+4
2.5E+4
3E+4
3.5E+4
2005 2010 2015 2020 2025 2030
Are
a (k
m2 )
5.5E+4
6E+4
6.5E+4
7E+4
7.5E+4
2005 2010 2015 2020 2025 20300
1E+4
2E+4
3E+4
4E+4
5E+4
2005 2010 2015 2020 2025 2030
BaselineGovernmentGreen visionGreen vision w/peatHigh oil palm
Forest, mineral soils Forest, peat soils Degraded, mineral soils
Degraded, peat soils Plantation Clearing
Agriculture
(a) (b) (c)
(d) (e) (f)
(g)
Fig. 6 Total area (km2) for Sumatra within each land use class, for 2006 to 2030: (a) Forest on mineral soils, (b) Forest on peat soils, (c)
Degraded on mineral soils, (d) Degraded on peat soils, (e) Plantation, (f) Clearing, and (g) Agriculture. Future scenarios as defined in
Table 4. Note change in scale of y-axis and that 2030 refers to start of final three-year timestep.
© 2014 John Wiley & Sons Ltd, Global Change Biology, 21, 345–362
FUTURE FIRE EMISSIONS IN SUMATRA 355

Sensitivity analysis
Data limitations and the need to simplify a complex
coupled biophysical and social system led to several
modeling assumptions and decisions that could signifi-
cantly affect modeled results. Here, we acknowledge
potential problems and examine the impact of some of
the assumptions and simplifications on modeled
results. First, although the MoF land use maps were
crucial tools in this analysis, they did not have specific
dates associated with the satellite images used for the
classification process. We therefore extended our tem-
poral window from 2005 to 2009 to capture the full
range of potential fire emissions associated with land
use transitions. Second, the agriculture and plantation
land use classes aggregated many crop types and land
management styles. Therefore, the economic productiv-
ity and fire management practices assigned to a parcel
in these land uses represented the general productivity
and fire management for land uses of that type in that
0 200 400100Kilometers
High oil palm Green vision Green vision w/peat
Stable prices Spatial plan (a)
Forestfraction
2006
High : 1
Low : 0
0 200 4001
N
00Kilometers
Tg DM
(b)
High oil palm Green vision w/peat
Stable prices Spatial plan
Green vision
2001-09
High : 25
Low : 0
N
Fig. 7 (a) Fraction of forest cover – here defined as forest on mineral or peat soils – remaining in 2030 for five future scenarios (i) Stable
Prices, (ii) National Spatial Plan, (iii) Green Vision, (iv) Green Vision with Peat Protection, (v) High Oil Palm, and (b) Cumulative total
fire emissions for 2009–2030 (in Tg DM). Darker colors represent greater forest fraction in (a) and higher emissions in (b). Note that
2030 refers to the start of the final three-year timestep.
© 2014 John Wiley & Sons Ltd, Global Change Biology, 21, 345–362
356 M. E. MARLIER et al.

portion of Sumatra. Instead of the individual 1-km2
parcel scale, our model is better analyzed at a coarser
spatial grain (like the 0.25° 9 0.25° GFED grid), where
generalizations by land use type are much more repre-
sentative. Third, attributing fire emissions to specific
land use transitions may be impacted by errors in the
MoF classification maps; further research is needed to
understand how these errors may have changed our
estimates.
In the emissions analysis that used FRP to down-
scale GFED emissions, there were several potential
sources of error. Since it is not possible to have
monthly resolution land use maps covering all of
Sumatra due to near-constant cloud cover in this
region, we overlaid FRP and associated emissions
data on the longest possible time period of land use
change, 2005 to 2009. We tested the sensitivity of this
assumption by assuming that only January 2006 to
December 2008 fires were relevant to the land use
change maps, and found 32% lower cumulative emis-
sions estimates (Table S2). Also, satellite overpasses
may have missed fires or not coincided with the peak
burning time, leading to underestimates of the contri-
butions of the 1-km2 pixels to 0.25° GFED emissions.
We partially addressed the latter problem by combin-
ing MODIS Aqua and Terra FRP observations. Our
downscaling approach did not capture all monthly
GFED emissions (Figure S2); some emissions were
missed if there were no MODIS FRP observations
within a GFED grid cell, such as when fire emissions
were estimated in the GFED product through the
burned area algorithm. If we scale our 1-km down-
scaled emissions estimates to match the monthly 0.25°GFED totals, our cumulative emissions estimates were
5% higher (Table S2).
Peatswamp emissions were found to drive the major-
ity of emissions in our future scenarios. Peat burning
depth ranges from 0 to 50 cm in the GFED model for
Indonesia, and was scaled according to soil moisture
and fire persistence (van der Werf et al., 2010), with a
30 cm average that compared well with a recent LIDAR
study, which estimated an average peat burning depth
in Central Kalimantan of 0.33 � 0.18 m (Ballhorn et al.,
2009). We also addressed underestimates by GFED of
Equatorial Asian fire emissions with the new dataset
that quantifies the contribution of small fires (Rander-
son et al., 2012).
We created five future scenarios to show how dif-
ferent economic and policy assumptions affected our
emissions estimates. The similar totals between the
‘Stable Prices,’ ‘National Spatial Plan,’ and ‘Green
Vision’ scenarios (2580–2733 Tg DM from 2009 to
2030) indicate that zoning changes proposed under
the two spatial plans would do little to affect overall
emissions. Instead, relatively drastic changes in pro-
tection of peatswamp areas (‘Green Vision with Peat
Protection’ scenario) and market prices (‘High Oil
Palm’ scenario) were found to affect emissions much
Table 6 Cumulative total fire emissions (in Tg DM), by fire type, for five future scenarios over 2009–2030 (description of scenarios
in Table 4). Emissions from the ‘Other’ land use class were omitted from the future analysis as this included cloud cover and water
in the MoF land use maps. Note that 2030 refers to the start of the final three-year timestep
Land use class Stable prices Spatial plan Green vision
Green vision w/
peat protection High oil palm
Forest, Mineral Soils 71 73 75 75 71
Forest, Peat Soils 415 412 450 0 460
Degraded, Mineral Soils 386 379 374 362 318
Degraded, Peat Soils 865 808 776 0 712
Established Plantation 300 286 291 275 288
Clearing 291 268 238 234 925
Agriculture 381 351 353 349 391
Urban 24 146 24 24 24
Total 2733 2723 2580 1320 3189
100
200
300
400
500
600
2010 2015 2020 2025 2030
BaselineSpatial planGreen visionGreen vision w/peatHigh oil palm
3-ye
arly
em
issi
ons
(Tg
DM
)
Fig. 8 Total emissions (in Tg DM per 3 year timestep) for each
scenario from 2009 to 2030. Note that 2030 refers to the start of
the final three-year timestep.
© 2014 John Wiley & Sons Ltd, Global Change Biology, 21, 345–362
FUTURE FIRE EMISSIONS IN SUMATRA 357

more profoundly. Although the 30% increase in oil
palm and other nontimber plantation commodity
prices assumed in the ‘High Oil Palm’ scenario may
seem extreme, recall that the period 2006 to 2009 were
global recession years, and prices for many globally
traded plantation commodities were lower than nor-
mal at the time. In a postrecession global economy,
30% higher palm oil and other plantation commodity
prices, as observed since 2009, are plausible (FAOStat,
2013). All told, our five land use change scenarios
offer realistic bounds on the Sumatra’s 2009 to 2030
emission trajectory.
As described above, the land use transition matrices
for all scenarios were generated with an estimated land
use change RUM and a set of 2006 to 2009 conditions,
either the observed (‘Stable Prices’) or with modifica-
tions. When we estimated the land use change RUM,
we used only a subset of 7556 Sumatra parcels and their
related 2006 to 2009 data; the maximum-likelihood rou-
tine used to estimate the model did not converge to a
solution when we included all Sumatra parcels. The
results presented above are based on a random sample
of parcels. As part of a sensitivity analysis, we esti-
mated the alternative RUM using a sample of 4309
evenly spaced parcels separated by 10-km. This exer-
cise verified that expected emission projections were
not highly sensitive to our sampling method. For
example, cumulative 2009 to 2030 emissions for the
‘Stable Prices’ scenario were 2733 and 2767 Tg DM
when the RUM was estimated with the randomly cho-
sen and evenly spaced parcels respectively (Table S3).
This result represents a 1.2% difference in cumulative
emissions. Second, we were interested in determining
whether unexplained local spatial processes on the
landscape affected our model results. If the standard
errors of the estimated model coefficients based on the
evenly spaced sample are consistently higher than
those from the random sample then we can conclude
that the RUM estimated with the random sample is
affected by spatial autocorrelation. As expected, the
model estimate with the random set of parcels did
show some evidence of spatial autocorrelation (see Nel-
son et al., 2014). The ramification of this spatial autocor-
relation is that the p-values associated with variables
from the RUM estimated with the random subset of
parcels are higher than reported. However, given that
the sampling method does not affect the output of
interest – predicted land use maps – best statistical
practice always recommends a random sample over a
nonrandom sample when ambivalent over the selec-
tion.
For the ‘National Spatial Plan,’ ‘Green Vision,’ and
‘Green Vision with Peat Protection’ scenarios described
above, the various land use regulation plans increased
the area of protected forests (on mineral soils, peat
soils, or both). In our primary analysis above, we
assumed markets did not react to changes in the sup-
ply of unprotected forests. However, it is likely that
the Sumatran land market and its economic actors
would react to the changes wrought by a new zoning
plan. First, many forest parcels that were developed
under ‘Stable Prices’ would now be zoned for protec-
tion. This rezoning would stop most of the business-
as-usual conversion on the newly conserved parcels.
Land developers would then have to look elsewhere
for unprotected, convertible forest, which would
include unprotected forest areas left intact under the
‘Stable Prices’ scenario. (This spatial displacement of
development is known as policy leakage.) That these
sites were left alone under the ‘Stable Prices’ scenario
0
50
100
150
200
2010 2015 2020 2025 2030
DEFPETSAVWDLAGW
Fire
em
issi
ons
(Tg
DM
/yea
r)
0
20
40
60
80
100
2010 2015 2020 2025 2030
DEFPETSAVWDLAGW
0
50
100
150
200
250
300
350
2010 2015 2020 2025 2030
AnnualvariationConstant
(a) (b) (c)
Fig. 9 Emissions by fire type (Tg DM) for the High Oil Palm scenario when: (a) partitioned according to relationships between fire
emissions and meteorology observed over 2005–2009, (b) assumed to be constant over each three-year time step. Panel (c) shows the
sum of all fire types from (a) and (b). Fire type groupings are as defined in text, with DEF = deforestation, PET = peatland,
SAV = savanna, WDL = woodland, and AGW = agricultural waste.
© 2014 John Wiley & Sons Ltd, Global Change Biology, 21, 345–362
358 M. E. MARLIER et al.

indicates that they are not as productive or cost-effec-
tive as some of the newly protected forests. Further-
more, the increase in protected forest means that
developers of land would be competing over a scarcer
supply of unprotected forest, leading to higher land
rents across Sumatra. The conversion of less produc-
tive land and higher land rents means that commodity
production costs on converted land would generally
be higher under the various alternative zoning plan
scenarios than they are under the ‘Stable Prices’ sce-
nario. Producers would attempt to pass increased pro-
duction costs onto consumers by charging higher
prices for the products they create. However, produc-
ers of goods that are sold on a global market would be
less successful at passing this price change to consum-
ers than producers of goods that face less import com-
petition (local goods). Finally, as market prices
increase so would the gross revenues from managed
forest and agriculture.
Because policy leakage mitigates the environmental
improvements generated by protective land use regu-
lations, modeling leakage is essential to accurately
assessing for the impact of a land use policy. Unfortu-
nately, without a model of the Indonesian economy
and its place in the global economy we cannot predict
how much policy leakage might occur under each
alternative land use regulation scenario. Instead, we
investigated to what degree the emission benefits of a
land use regulation policy would change if leakage
were extreme enough that forest protection generated
by a policy without leakage was halved. For example,
the ‘Green Vision’ scenario increases 2030 forest area
by 30.6% relative to the ‘Stable Prices’ scenario but
‘extreme’ leakage would mean that this overall
increase in forest area was instead approximately
15%. To spatially allocate this leakage in an economi-
cally coherent manner, we increased forest and agri-
cultural product market prices, and thus gross
revenues for the various managed forest and agricul-
tural land uses, such that the increase in forest area
was only 16% compared to the ‘Stable Prices’ sce-
nario. With this modification, the forest stands that
remain unprotected under the ‘Green Vision’ scenario
and that were almost productive enough to be con-
verted to managed forest or agricultural uses under
the ‘Stable Prices’ scenario were likely converted. In
the ‘Green Vision’ scenario, a halving of forest area
by 2030 required a 17.5% increase in the real prices of
local goods and a 12% increase in the real price of
globally traded goods as of 2009.
In Table S4, we present the real price increases neces-
sary to reduce additional forest conservation by half
under each alternative zoning scenario. By add-
ing extreme leakage to both the ‘Green Vision’ and
‘National Spatial Plan’ scenarios, 2009 to 2030 fire emis-
sions were ~40 Tg DM greater than under the scenarios
without leakage. For the ‘Green Vision with Peat
Protection,’ cumulative 2009 to 2030 fire emissions with
leakage added 76 Tg DM compared to no leakage
effects. Implementation of a policy that rezoned land
use for a significant portion of Sumatra would generate
forest conversion leakage. Here, we have put bounds
on the potential leakage for the rezoning scenarios
that we have considered. [A 50% leakage rate is
extreme; see Busch et al. (2012) for a more on policy-
driven forest conversion leakage in Indonesia]. If
Indonesian policymakers were to implement one of our
scenarios, it would be critical to conduct a more thor-
ough leakage analysis given the potential emission ram-
ifications.
Discussion
An often-ignored issue in tropical land use policies is
the public health impact of emissions from fire-driven
deforestation. We examined how different market
conditions and land use policies to protect natural for-
ests and limit agriculture, forestry, and plantation
growth affect predicted trajectories of fire-based emis-
sions from Sumatra (Fig. 6). As illustrated in Fig. 7
and Table 6, the examined land development strate-
gies in Sumatra were associated with varying patterns
of forest conservation and potential associated fire
emissions from burning. Our analysis makes it clear
that cumulative emissions out to 2030 will remain
high, regardless of the amount of protection for for-
ests on mineral soils, unless strong protections for
peatswamp areas are also implemented. Across the
four scenarios that do not include broad peatswamp
conservation, we found a range of 2580 to 3189 Tg
DM of cumulative emissions from 2009 to 2030, with
peatswamp fires contributing 37–48% of total emis-
sions. When peatswamp areas were protected, 2009 to
2030 cumulative emissions decreased to 1320 Tg DM.
These ranges indicated that fire emissions associated
with our scenarios are less sensitive to the various
economic and policy assumptions than to fires in
peatswamp areas with high fuel loads. Compared
with the business-as-usual cumulative emissions esti-
mate from land use conversion and peat oxidation of
~2000 Tg DM (converted from reported CO2 units) for
Sumatra by 2050 from Harris et al. (2013), our range
of 2580–3189 Tg DM by 2030 (in our scenarios with-
out peat protection) is higher. This can be attributed
to including emissions from peat fires, considering
conversion to land uses other than oil palm planta-
tions, and incorporating emissions from fires that do
not result in immediate conversion.
© 2014 John Wiley & Sons Ltd, Global Change Biology, 21, 345–362
FUTURE FIRE EMISSIONS IN SUMATRA 359
Our results can inform policy makers in several
ways. First, our work reveals the stark contrasts in
the consequences of different possible scenarios of
future fire activity. We do not expect the economic
and cultural conditions observed from 2006 to 2009 in
Sumatra to remain constant until 2030, so it is unli-
kely that our alternative scenario projections will
exactly predict the future. For example, our model of
land use change does not consider how shifts in land
use would impact commodity prices over time and
how these changes in turn would feedback into land
use decisions (Lawler et al., 2014). However, we
believe that the value in our analysis lies in quantify-
ing the relative differences between scenarios. For
example, if Indonesian policymakers were considering
instituting the ‘Green Vision with Peat Protection’ sce-
nario in Sumatra over the next several years, a com-
parison with the ‘High Oil Palm’ scenario would give
policymakers a general sense of the range of emis-
sions reductions that could be expected over the next
two decades. We are confident in the policy relevance
of the relative results, despite an uncertain future,
because macroeconomic and cultural changes on the
landscape over time would generally affect scenario
results in a similar fashion, thereby largely preserving
the relative differences in scenarios.
Second, detailed information on how specific land
use transitions were associated with fire (Figs 3 and 5,
Table 5), along with the most vulnerable times for fire
activity, could be used to inform on-the-ground poli-
cies to restrict burning. While a zero burn policy does
not give smallholders alternative methods to clearing
land, identifying low risk conditions for burning that
help contain fires could reduce the impact (Dennis
et al., 2005). For example, the contribution of emis-
sions from peatswamp forests and degraded areas
peaked in drier years (such as 2006) and during the
driest part of the year (September and October). We
find that the majority of emissions were not from for-
est conversion directly, but from fires in highly sus-
ceptible degraded areas, which might be unintentional
or related to the initial stages of the clearing process.
This confirmed previous findings that fires in Sumatra
are concentrated in degraded land use types and
limited in intact natural ecosystems (Margono et al.,
2012; Miettinen et al., 2012b) and protecting these
areas from ignition sources is crucial for emissions
reductions.
Third, our findings can be used to investigate the
consequences of different land use scenarios on
human health. Our research is part of a larger project
that will quantify local and transboundary public
health benefits associated with ecosystem conservation
in Sumatra. To appropriately compare with the eco-
nomic benefits of plantations, the full value of ecosys-
tem services provided by forests will be undervalued
without accurate quantification of the public health
costs associated with exposure to emissions from
deforestation and degradation fires. (Other important
costs not considered here include depleted carbon
stocks, biodiversity declines, and water quality (Nai-
doo et al., 2009; Bhagabati et al., 2012)). The future fire
emissions inventories described in this study will be
used in an atmospheric transport model to simulate
future exposure to transported fire emissions and
associated public health impact. In these simulations,
it is imperative to consider the interactions between
future fire emissions and future meteorological condi-
tions (Fig. 9). Our three-yearly emissions estimates
assumed that the observed meteorological variability
from 2005 to 2009 continues until 2030; we will test
the sensitivity at the annual level by partitioning
emissions according to different combinations of
meteorological conditions. For example, a strong
drought year followed by two wetter years would be
expected to concentrate fire-driven land use change in
the first year with less change attributed to the follow-
ing 2 years. Finally, the approach taken by this paper
can be extended to other parts of Indonesia that con-
stitute the frontier of plantation development, espe-
cially Kalimantan and Papua, and to land use fires in
other parts of the world.
Acknowledgements
The authors are grateful to Samuel Myers, Daniel Jacob, JoelSchwartz, and Patrick Kim for helpful discussions on thiswork. We also thank Guido van der Werf, Jim Randerson,and Yang Chen for their assistance with using the GFED3small fires dataset, Belinda Margono for additional informa-tion about the MoF maps, Mike Anderson assistance withGIS, Barano Siswa Sulistyawan and World Wildlife Fund-Indonesia for providing base data, and David Gaveau alongwith two anonymous reviewers for suggestions on the manu-script. This work was partially supported by the NSF Gradu-ate Research Fellowship Program. We also thank the Health &Ecosystems: Analysis of Linkages (HEAL) program for help-ing to make this work possible. We are extremely grateful forsupport provided to HEAL by The Rockefeller Foundationand the Gordon and Betty Moore Foundation. Finally, authorNelson wishes to acknowledge the salary support he receivedfrom the BECC (Biodiversity and Ecosystem Services in aChanging Climate) strategic research area during the writingof this article.
References
Ballhorn U, Siegert F, Mason M, Limin S (2009) Derivation of burn scar depths and
estimation of carbon emissions with LIDAR in Indonesian peatlands. Proceedings
of the National Academy of Sciences of the United States of America, 106, 21213–
21218.
© 2014 John Wiley & Sons Ltd, Global Change Biology, 21, 345–362
360 M. E. MARLIER et al.
Bhagabati N, Barano T, Conte M et al. (2012) A Green Vision for Sumatra. The Natural
Capital Project, WWF-US, and WWF-Indonesia, Washington, D.C., USA.
Boden TA, Marland G, Andres RJ (2011) Global, Regional, and National Fossil-Fuel CO2
Emissions. Carbon Dioxide Information Analysis Center, Oak Ridge National Labo-
ratory, Department of Energy, Oak Ridge, TN, USA.
Broich M, Hansen M, Stolle F (2011) Remotely sensed forest cover loss shows high
spatial and temporal variation across Sumatera and Kalimantan, Indonesia 2000–
2008. Environmental Research Letters, 6, 014010.
Busch J, Lubowski RN, Godoy F et al. (2012) Structuring economic incentives to
reduce emissions from deforestation within Indonesia. Proceedings of the National
Academy of Sciences of the United States of America, 109, 1062–1067.
Carlson KM, Curran LM, Ratnasari D et al. (2012) Committed carbon emissions,
deforestation, and community land conversion from oil palm plantation expansion
in West Kalimantan, Indonesia. Proceedings of the National Academy of Sciences of the
United States of America, 109, 7559–7564.
Carlson KM, Curran LM, Asner GP, Pittman AM, Trigg SN, Adeney JM (2013)
Carbon emissions from forest conversion by Kalimantan oil palm plantations.
Nature Climate Change, 3, 283–287.
Christensen JH, Kanicharla KK (2014) Chapter 14: Climate Phenomena and Their
Relevance for Future Regional Climate Change. IPCC AR5, Cambridge University
Press, Cambridge, UK.
Collins M (2005) El Ni~no- or La Ni~na-like climate change? Climate Dynamics, 24,
89–104.
Dennis RA, Colfer CP (2006) Impacts of land use and fire on the loss and degradation
of lowland forest in 1983-2000 in East Kutai District, East Kalimantan, Indonesia.
Singapore Journal of Tropical Geography, 27, 30–48.
Dennis RA, Mayer J, Applegate G et al. (2005) Fire, people and pixels: linking social
science and remote sensing to understand underlying causes and impacts of fires
in Indonesia. Human Ecology, 33, 465–504.
FAOStat (2013) Food and Agriculture Organization of the United Nations database,
Available at: http://faostat3.fao.org/faostat-gateway/go/to/home/E (accessed 1
October 2013).
Field RD, Shen SSP (2008) Predictability of carbon emissions from biomass burning in
Indonesia from 1997 to 2006. Journal of Geophysical Research, 113, G04024.
Fuller DO, Hardiono M, Meijaard E (2011) Deforestation projections for carbon-rich
peat swamp forests of central Kalimantan, Indonesia. Environmental Management,
48, 436–447.
Gaveau DLA, Wich S, Epting J, Juhn D, Kanninen M, Leader-Williams N (2009)
The future of forests and orangutans (Pongo abelii) in Sumatra: predicting
impacts of oil palm plantations, road construction, and mechanisms for reduc-
ing carbon emissions from deforestation. Environmental Research Letters, 4,
034013.
Gaveau DLA, Curran LM, Paoli GD et al. (2012) Examining protected area effective-
ness in Sumatra: importance of regulations governing unprotected lands. Conserva-
tion Letters, 5, 142–148.
Gaveau DLA, Kshatriya M, Sheil D et al. (2013) Reconciling forest conservation and
logging in Indonesian Borneo (ed. Kamilar JM). PLoS ONE, 8, e69887.
Giam X, Clements GR, Aziz SA, Chong KY, Miettinen J (2011) Rethinking the ‘back to
wilderness’ concept for Sundaland’s forests. Biological Conservation, 144, 3149–
3152.
Giglio L (2007) Characterization of the tropical diurnal fire cycle using VIRS and
MODIS observations. Remote Sensing of Environment, 108, 407–421.
Goldammer JG (2006) History of equatorial vegetation fires and fire research in
Southeast Asia before the 1997–98 episode: a reconstruction of creeping environ-
mental changes. Mitigation and Adaptation Strategies for Global Change, 12, 13–32.
Harris NL, Brown K, Netzer M, Gunarso P, Killeen TJ (2013) Projections of oil palm
expansion in Indonesia, Malaysia and Papua New Guinea from 2010 to 2050. In:
Reports from the Technical Panels of the 2nd Greenhouse Gas Working Group of the
Roundtable on Sustainable Palm Oil (RSPO) (eds Killeen TJ, Goon J), pp. 89–112.
RSPO, Kuala Lumpur.
Heil A, Goldammer JG (2001) Smoke-haze pollution: a review of the 1997 episode in
Southeast Asia. Regional Environmental Change, 2, 24–37.
Jaenicke J, Rieley JO, Mott C, Kimman P, Siegert F (2008) Determination of the
amount of carbon stored in Indonesian peatlands. Geoderma, 147, 151–158.
Koh LP, Miettinen J, Liew SC, Ghazoul J (2011) Remotely sensed evidence of tropical
peatland conversion to oil palm. Proceedings of the National Academy of Sciences of
The United States of America, 108, 5127–5132.
Lawler J, Lewis D, Nelson E et al. (2014) Projected land-use change impacts on eco-
system services in the U.S. Proceedings of the National Academy of Sciences of The Uni-
ted States of America, 111, 7492–7497.
Lewis DJ, Plantinga AJ, Nelson E, Polasky S (2011) The efficiency of voluntary incen-
tive policies for preventing biodiversity loss. Resource and Energy Economics, 33,
192–211.
Margono BA, Turubanova S, Zhuravleva I et al. (2012) Mapping and monitoring
deforestation and forest degradation in Sumatra using Landsat time series data
from 1990 to 2010. Environmental Research Letters, 7, 034010.
Marlier ME, DeFries RS, Voulgarakis A et al. (2013) El Ni~no and health risks
from landscape fire emissions in southeast Asia. Nature Climate Change, 3,
131–136.
Miettinen J, Liew SC (2009) Burn-scar patterns and their effect on regional burnt-area
mapping in insular South-East Asia. International Journal of Wildland Fire, 18, 837–
847.
Miettinen J, Shi C, Liew SC (2011) Deforestation rates in insular Southeast Asia
between 2000 and 2010. Global Change Biology, 17, 2261–2270.
Miettinen J, Hooijer A, Shi C et al. (2012a) Extent of industrial plantations on South-
east Asian peatlands in 2010 with analysis of historical expansion and future pro-
jections. GCB Bioenergy, 4, 908–918.
Miettinen J, Hooijer A, Wang J, Shi C, Liew SC (2012b) Peatland degradation and con-
version sequences and interrelations in Sumatra. Regional Environmental Change,
12, 729–737.
MoF (2011) Rekalkulasi Penutupan Lahan (Land Cover Recalculation) Indonesia Tahun
2009/2010. Badan Planology Kehutanan Departemen Kehutanan Indonesia,
Jakarta.
Naidoo R, Malcolm T, Tomasek A (2009) Economic benefits of standing forests in
highland areas of Borneo: quantification and policy impacts. Conservation Letters, 2,
35–44.
Nelson E, Pennington D, Lewis J (2014) Modeling and Simulating Land-Use Change
on Sumatra, Indonesia. Technical appendix for Marlier, Miriam E., Ruth DeFries,
Derric Pennington, Erik Nelson, Elsa Ordway, Jeremy Lewis, Shannon Koplitz,
and Loretta Mickley (2014) “Future fire emissions associated with projected land
use change in Sumatra.” Available at: http://www.bowdoin.edu/faculty/e/enel-
son/pdf/EstimatingIndonesiaLUChange.pdf (accessed 26 June 2014).
Plantinga AJ (1996) The effect of agricultural policies on land use and environmental
quality. American Journal of Agricultural Economics, 78, 1082–1091.
Randerson JT, Chen Y, van der Werf GR, Rogers BM, Morton DC (2012) Global
burned area and biomass burning emissions from small fires. Journal of Geophysical
Research, 117, G04012.
Romijn E, Ainembabazi JH, Wijaya A, Herold M, Angelsen A, Verchot L, Murdiyarso
D (2013) Exploring different forest definitions and their impact on developing
REDD+ reference emission levels: a case study for Indonesia. Environmental Science
and Policy, 33, 246–259.
Roosita H, Waluyo H, Bakar S et al. (eds) (2010) Roadmap Towards Ecosystem Conserva-
tion of Sumatra: Sumatra Vision 2020. Internal Affairs Department, Public Works
Department, Forestry Department, Ministry of Environment, National Develop-
ment and Planning Board, Coordinating Ministry of Economy Sector, Forum Tata
Ruang Sumatera (ForTRUST), Jakarta, Indonesia.
Siegert F, Ruecker G, Hinrichs A, Hoffmann AA (2001) Increased damage from fires
in logged forests during droughts caused by El Ni~no. Nature, 414, 437–440.
Stolle F, Chomitz KM, Lambin EF, Tomich TP (2003) Land use and vegetation
fires in Jambi Province, Sumatra, Indonesia. Forest Ecology and Management, 179,
277–292.
van der Werf GR, Dempewolf J, Trigg S et al. (2008) Climate regulation of fire emis-
sions and deforestation in equatorial Asia. Proceedings of the National Academy of
Sciences of the United States of America, 105, 20350–20355.
van der Werf GR, Randerson JT, Giglio L et al. (2010) Global fire emissions and the
contribution of deforestation, savanna, forest, agricultural, and peat fires (1997–
2009). Atmospheric Chemistry and Physics, 10, 11707–11735.
Wooster MJ, Roberts G, Perry GLW, Kaufman YJ (2005) Retrieval of biomass combus-
tion rates and totals from fire radiative power observations: FRP derivation and
calibration relationships between biomass consumption and fire radiative energy
release. Journal of Geophysical Research, 110, D24311.
Wooster MJ, Perry GLW, Zoumas A (2012) Fire, drought and El Ni~no relationships
on Borneo (Southeast Asia) in the pre-MODIS era (1980–2000). Biogeosciences, 9,
317–340.
© 2014 John Wiley & Sons Ltd, Global Change Biology, 21, 345–362
FUTURE FIRE EMISSIONS IN SUMATRA 361
Supporting Information
Additional Supporting Information may be found in the online version of this article:
Data S1. Description of the methods used to estimate future land use change scenarios, examples of land use classifications withcorresponding satellite data, and sensitivity analyses.Figure S1. Examples of Landsat images (left) and corresponding Ministry of Forestry (MoF) land use classification maps (right) at30-m and 1-km resolution, respectively, for a range of landscapes. Each landscape is shown for 2006 (top) and 2009 (bottom). Thelegend defines the MoF land use types. The sample landscapes are dominated by (a) mixed plantation, clearing, agriculture, anddegraded land on peat soils, (b) forest on peat soils, (c) forest on mineral soils, plantation, clearing, and degraded land, (d) planta-tion, urban, and degraded lands, (e) forest on peat soils with a mix of agriculture, plantation, and degraded lands, and (f) planta-tion, clearing, and remaining forest on peat soils. The forest in (e) experienced active burning in 2006.Figure S2. Total Sumatra monthly emissions (in Tg DM) for 2005–2009 for observed 0.25° GFED data (white) and for the down-scaled 1-km emissions (gray).Table S1. Change in proportion of each land use transition in Sumatra for 1-km land use maps relative to 30-m land use maps (as% of Sumatra total land area for each transition class), after assigning the dominant land use type when rescaling. Rows represent2006 land use classes and columns represent 2009 land use classes. ‘ther’ includes MoF water, beach, clouds, and other classes.Table S2. Sensitivity for cumulative 2009 to 2030 total fire emissions (in Tg DM), by fire type, for Stable Prices scenario: (i) As pre-sented in main results, (ii) Overlaying 2006–2008 FRP only (instead of 2005–2009 in main results), (iii) Scaling monthly emissionstotals from our downscaled 1-km2 product to match observed monthly 0.25° GFED totals.Table S3. Stable Prices scenario sensitivity analysis: (i) Random: 2030 land use allocation and 2009–2030 cumulative emissions pre-sented in the main text, and (ii) Grid: 2030 land use allocation and 2009–2030 cumulative emissions if the land use change RUM hadbeen parameterized with a gridded sample of parcels instead of a random sample of parcels.Table S4. Additional forest area conserved emissions impacts (relative to ‘Stable Prices’ scenario) with no leakage and ‘extreme’leakage. Forest area is the sum of forest on peat soils and forest on mineral soils. By ‘extreme leakage’ we mean a halving in addi-tional forest cover (compared to ‘Stable Prices’) associated with a land use regulation policy due to displaced land use conversion.We assumed goods produced on nonrice agriculture with brush and nonrice agriculture fields were mostly traded in local marketswith limited import competition and all other goods were traded in more global markets.
© 2014 John Wiley & Sons Ltd, Global Change Biology, 21, 345–362
362 M. E. MARLIER et al.
Top Related