


Languages
Pages
Legal


/faculteit technologie management
Improving Forecasting with Imperfect Advance Demand Information
Tarkan Tan Technische Universiteit Eindhoven
October 23, 2007
Forecasting and Inventory Management: Bridging the Gap
EPSRC project Meeting - London
/faculteit technologie management
• Introduction• Related Literature• Advance Demand Information (ADI)• Analysis and Proposed Methodology• Incorporating ADI• Conclusions and Future Research
Outline
/faculteit technologie management
Introduction
• B2B Production Environments– High demand volatility
• Seasonality• Changing trends• Affected by individual clients
– Some clients provide information on their future orders• subject to changes in time (imperfect Advance Demand
Information - ADI)
– Demand forecasting in such a make-to-stock production environment
/faculteit technologie management
Introduction
• Motivation:– Dairy products company– 3 business lines: Food, Nutrition, and Pharma– Orders: single or call-off of a contract– Demand forecast is used in
• Packaging- and raw material acquisition• Production planning• Financial forecasting and budget allocation• Milk allocation planning• Reserving inventory space
/faculteit technologie management
Introduction• ADI collection:
– Customers have their own production plans– Some customers place their orders in advance:
• minimize the risk of unmet orders• parts of contracts• time allowance for arranging transportation
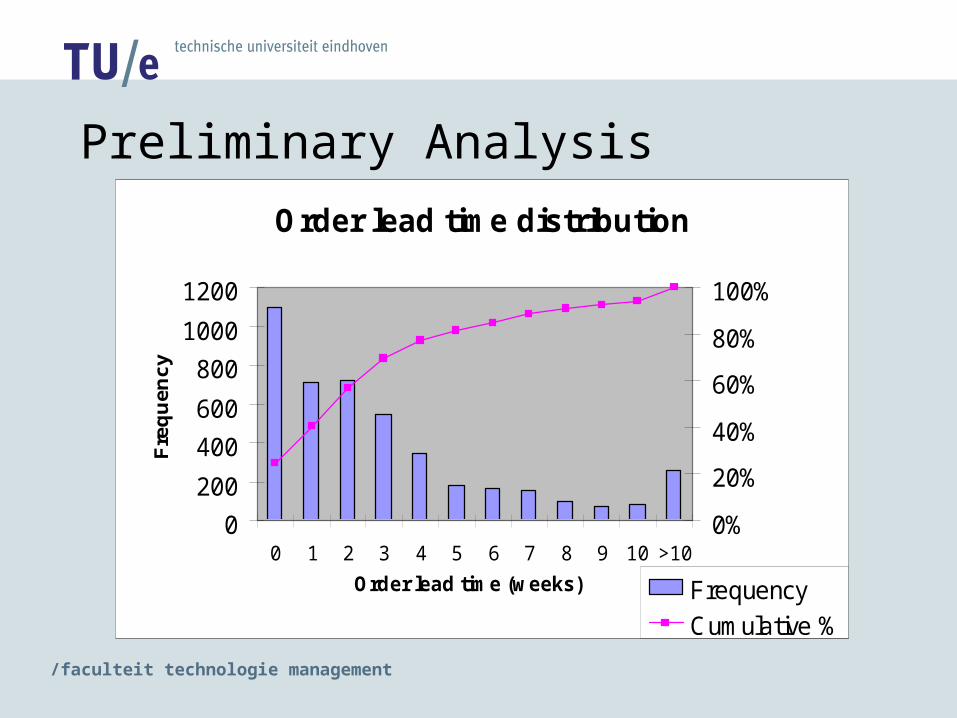
– 30% of the orders are known by the end of the previous month (57% for Pharma)
/faculteit technologie management
Preliminary AnalysisOrder lead time distribution
0
200
400
600
800
1000
1200
0 1 2 3 4 5 6 7 8 9 10 >10
Order lead time (weeks)
Fre
qu
en
cy
0%
20%
40%
60%
80%
100%
Frequency
Cumulative %
/faculteit technologie management
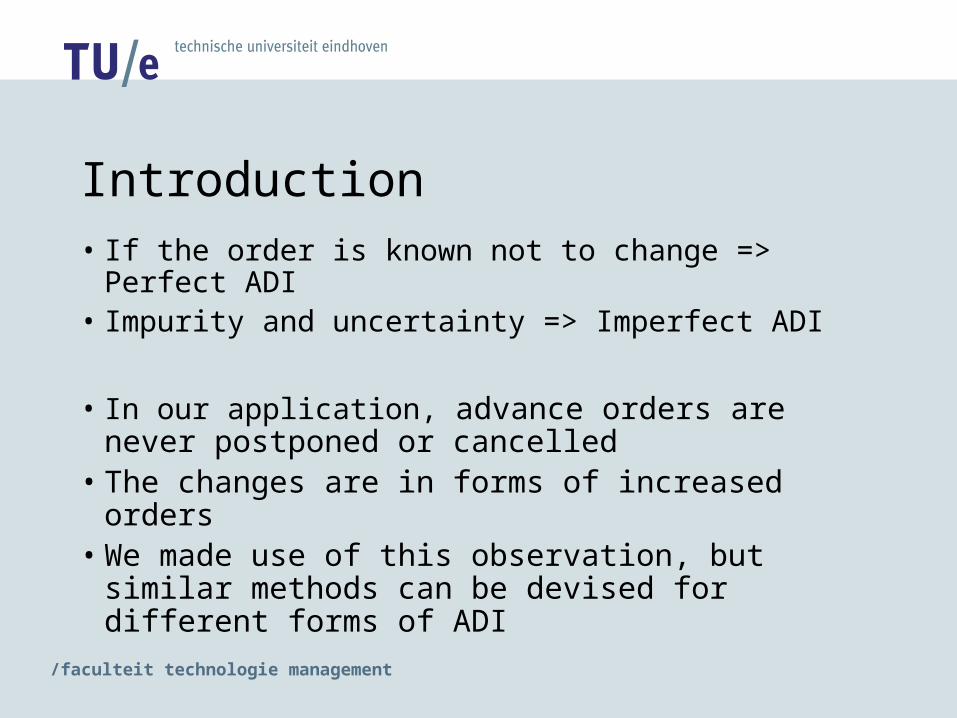
• If the order is known not to change => Perfect ADI
• Impurity and uncertainty => Imperfect ADI
• In our application, advance orders are never postponed or cancelled
• The changes are in forms of increased orders• We made use of this observation, but similar
methods can be devised for different forms of ADI
Introduction
/faculteit technologie management
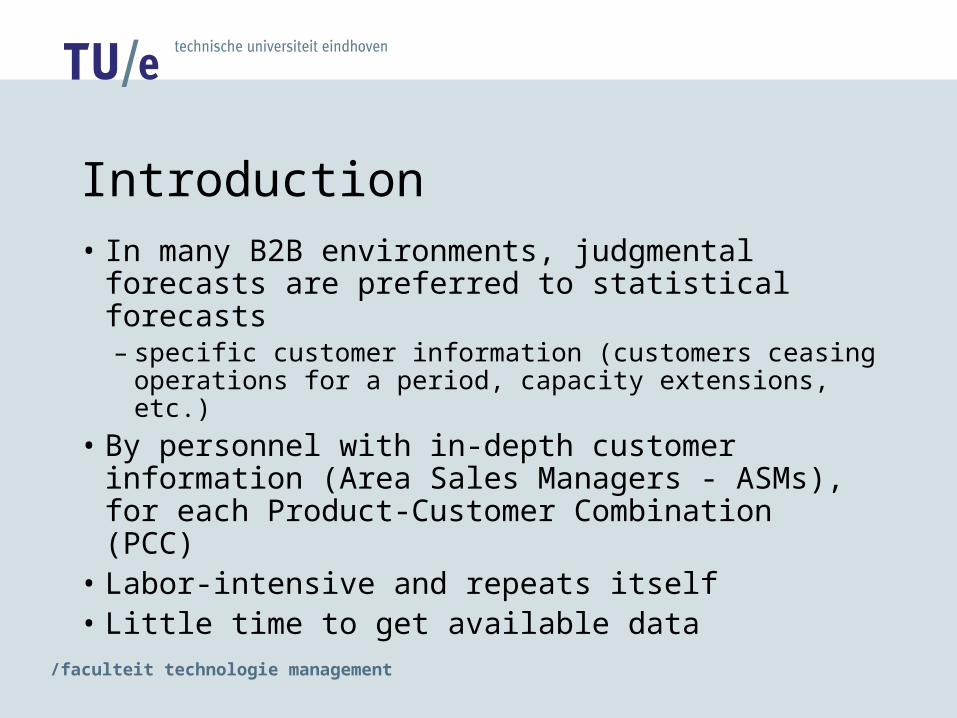
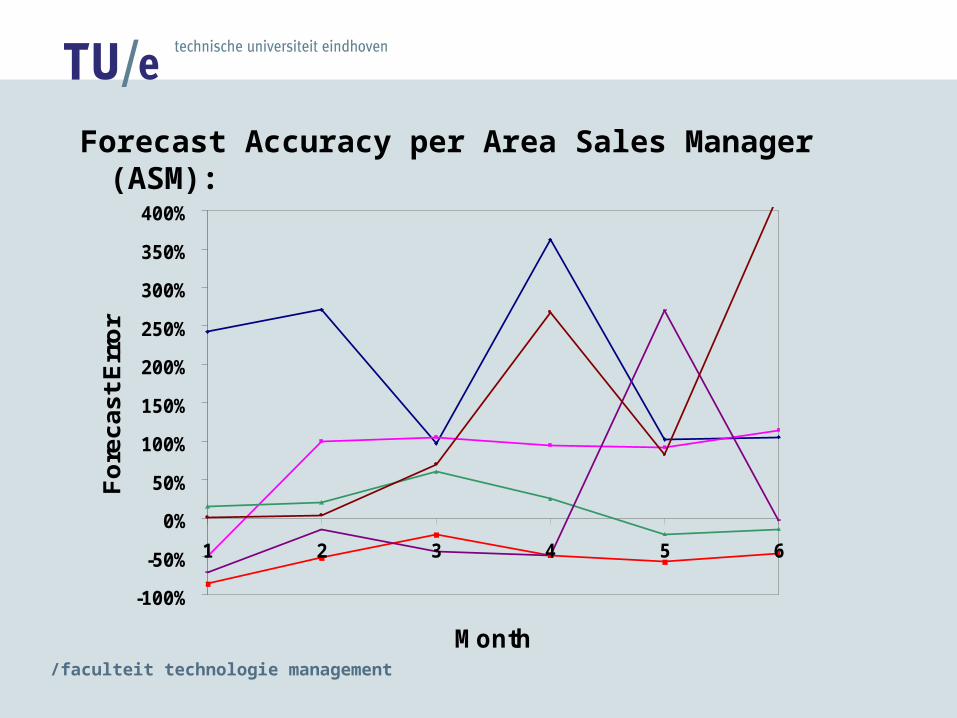
• In many B2B environments, judgmental forecasts are preferred to statistical forecasts– specific customer information (customers ceasing
operations for a period, capacity extensions, etc.)
• By personnel with in-depth customer information (Area Sales Managers - ASMs), for each Product-Customer Combination (PCC)
• Labor-intensive and repeats itself• Little time to get available data
Introduction
/faculteit technologie management
/faculteit technologie management
Forecast Accuracy per Area Sales Manager (ASM):
-100%
-50%
0%
50%
100%
150%
200%
250%
300%
350%
400%
1 2 3 4 5 6
Month
Fo
rec
as
t E
rro
r
/faculteit technologie management
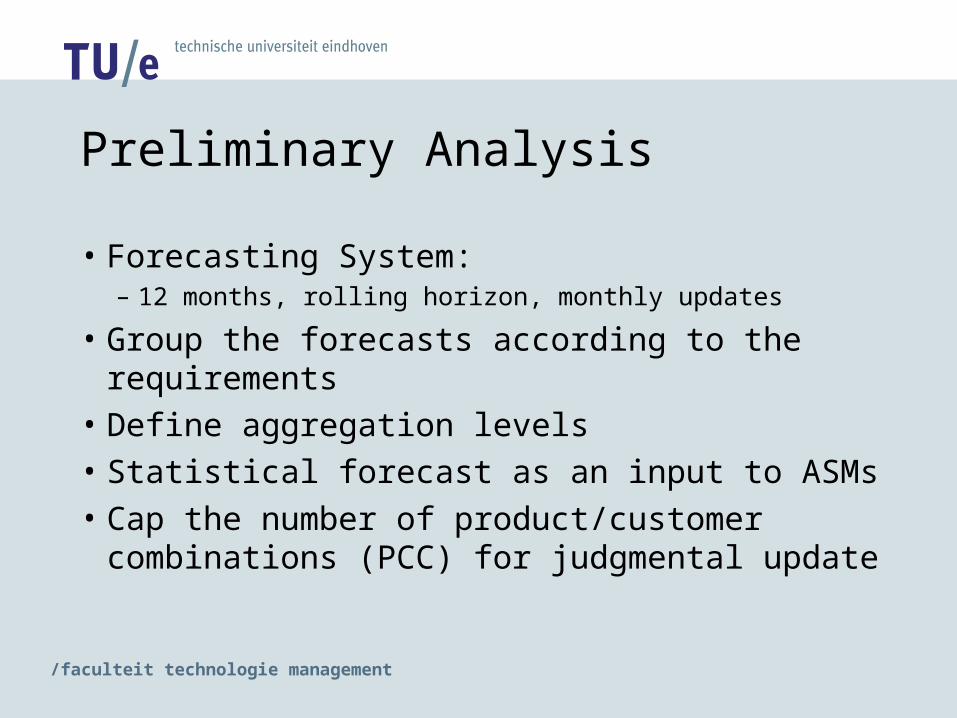
Preliminary Analysis
• Forecasting System:– 12 months, rolling horizon, monthly updates
• Group the forecasts according to the requirements
• Define aggregation levels• Statistical forecast as an input to ASMs• Cap the number of product/customer
combinations (PCC) for judgmental update
/faculteit technologie management
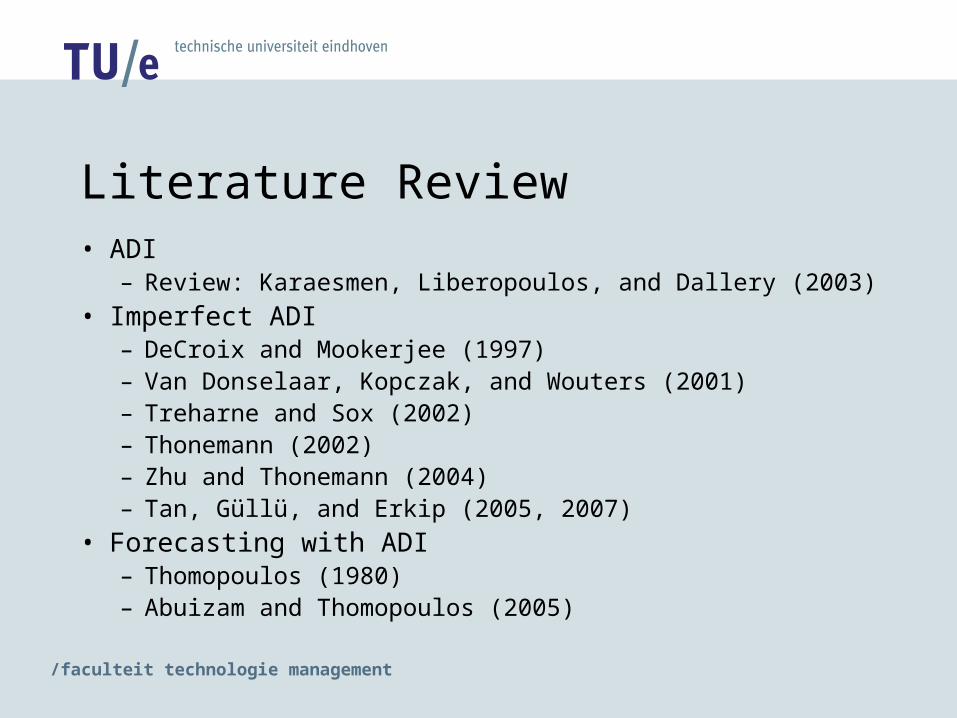
Literature Review• ADI
– Review: Karaesmen, Liberopoulos, and Dallery (2003)• Imperfect ADI
– DeCroix and Mookerjee (1997) – Van Donselaar, Kopczak, and Wouters (2001) – Treharne and Sox (2002)– Thonemann (2002) – Zhu and Thonemann (2004) – Tan, Güllü, and Erkip (2005, 2007)
• Forecasting with ADI– Thomopoulos (1980)– Abuizam and Thomopoulos (2005)
/faculteit technologie management
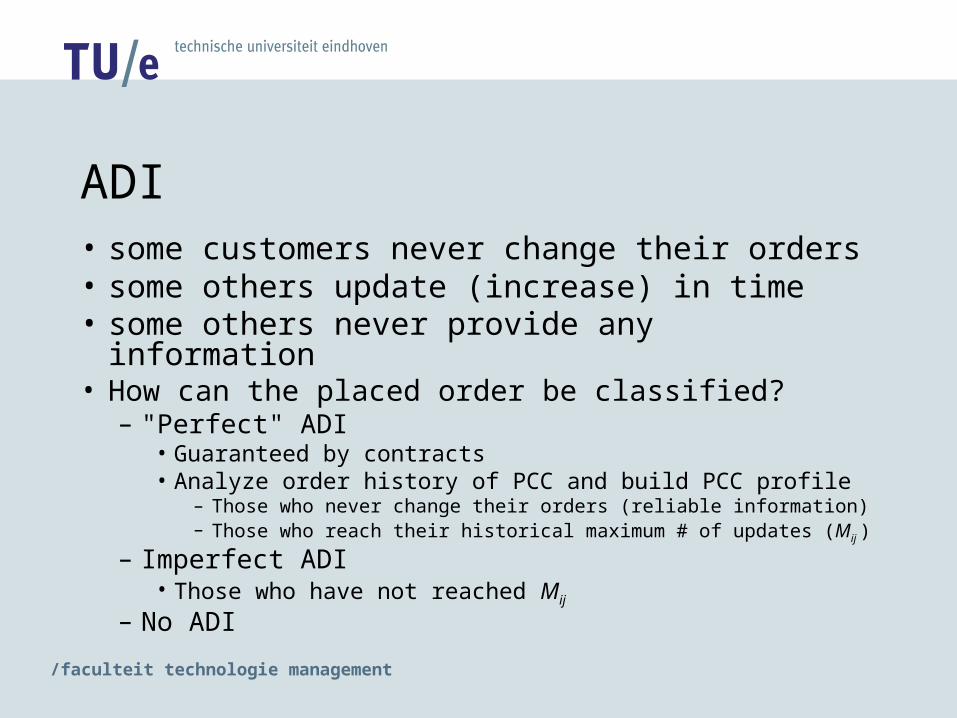
ADI• some customers never change their orders• some others update (increase) in time• some others never provide any information • How can the placed order be classified?
– "Perfect" ADI• Guaranteed by contracts• Analyze order history of PCC and build PCC profile
– Those who never change their orders (reliable information)– Those who reach their historical maximum # of updates (Mij )
– Imperfect ADI • Those who have not reached Mij
– No ADI
/faculteit technologie management
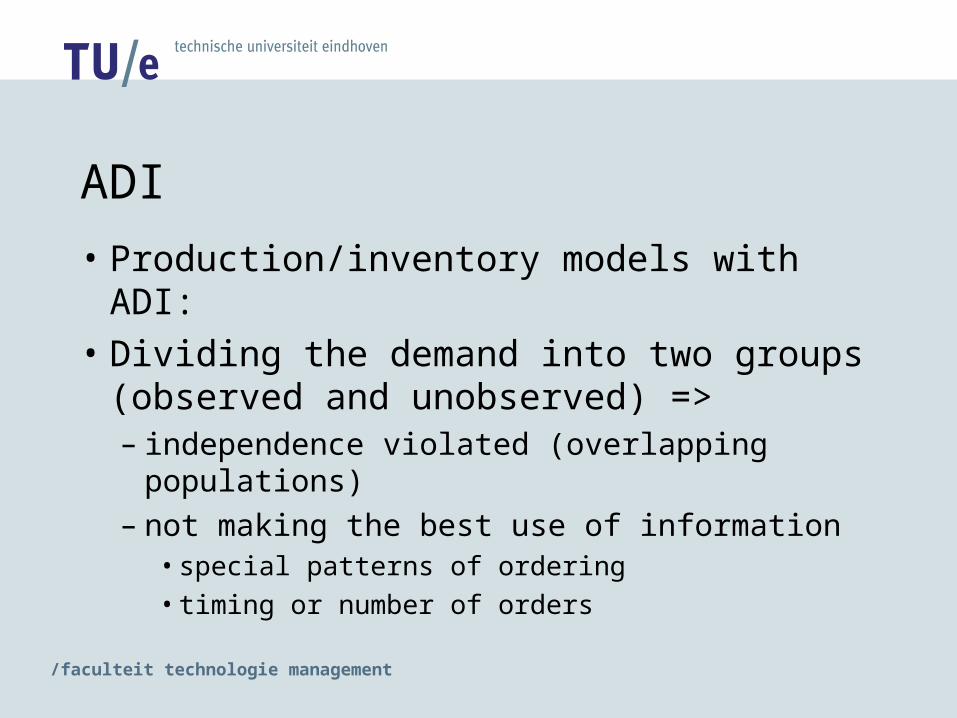
ADI
• Production/inventory models with ADI:• Dividing the demand into two groups
(observed and unobserved) => – independence violated (overlapping
populations)– not making the best use of information
•special patterns of ordering• timing or number of orders
/faculteit technologie management
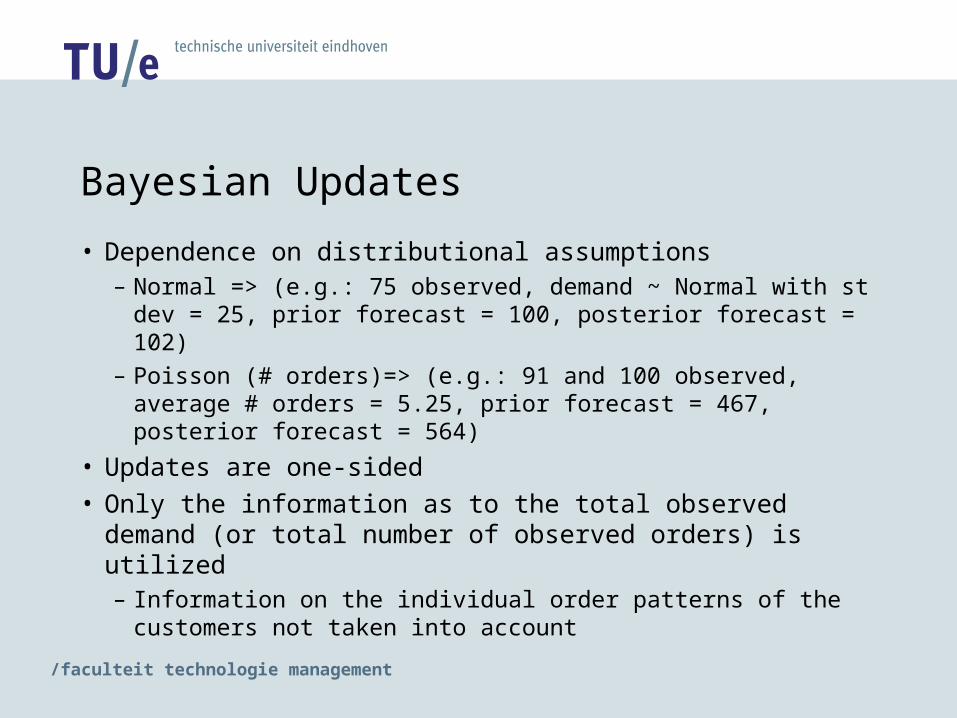
Bayesian Updates
• Dependence on distributional assumptions– Normal => (e.g.: 75 observed, demand ~ Normal with
st dev = 25, prior forecast = 100, posterior forecast = 102)
– Poisson (# orders)=> (e.g.: 91 and 100 observed, average # orders = 5.25, prior forecast = 467, posterior forecast = 564)
• Updates are one-sided• Only the information as to the total observed demand
(or total number of observed orders) is utilized– Information on the individual order patterns of the
customers not taken into account
/faculteit technologie management
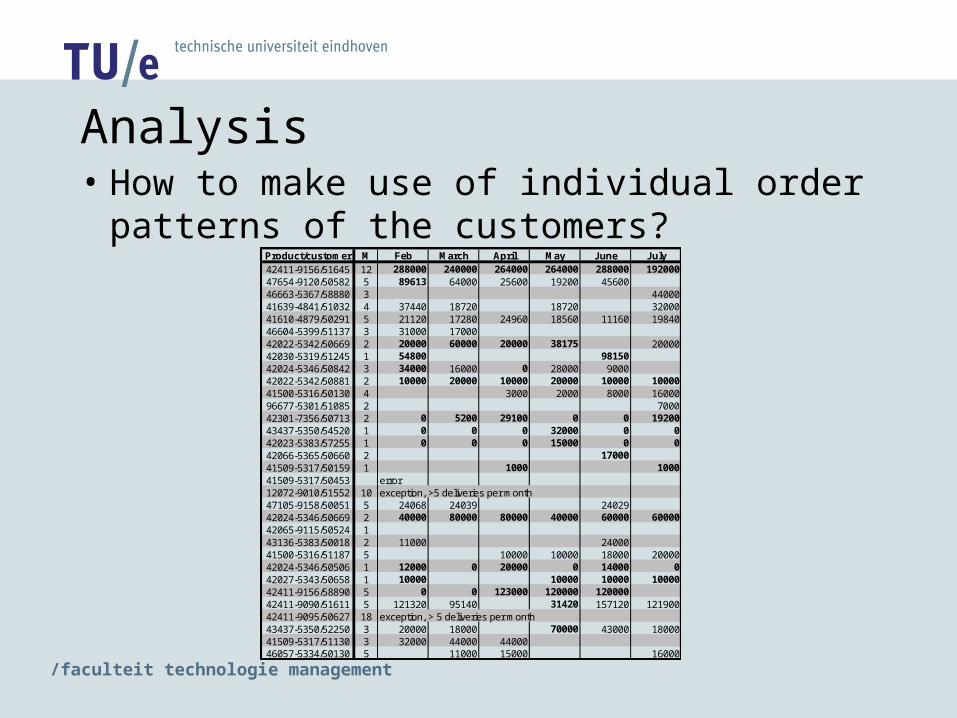
• How to make use of individual order patterns of the customers?
Analysis
Product/customer M Feb March April May June July42411-9156/51645 12 288000 240000 264000 264000 288000 19200047654-9120/50582 5 89613 64000 25600 19200 4560046663-5367/58880 3 4400041639-4841/51032 4 37440 18720 18720 3200041610-4879/50291 5 21120 17280 24960 18560 11160 1984046604-5399/51137 3 31000 1700042022-5342/50669 2 20000 60000 20000 38175 2000042030-5319/51245 1 54800 9815042024-5346/50842 3 34000 16000 0 28000 900042022-5342/50881 2 10000 20000 10000 20000 10000 1000041500-5316/50130 4 3000 2000 8000 1600096677-5301/51085 2 700042301-7356/50713 2 0 5200 29100 0 0 1920043437-5350/54520 1 0 0 0 32000 0 042023-5383/57255 1 0 0 0 15000 0 042066-5365/50660 2 1700041509-5317/50159 1 1000 100041509-5317/50453 error12072-9010/51552 10 exception, >5 deliveries per month47105-9158/50051 5 24068 24039 2402942024-5346/50669 2 40000 80000 80000 40000 60000 6000042065-9115/50524 143136-5383/50018 2 11000 2400041500-5316/51187 5 10000 10000 18000 2000042024-5346/50506 1 12000 0 20000 0 14000 042027-5343/50658 1 10000 10000 10000 1000042411-9156/58890 5 0 0 123000 120000 12000042411-9090/51611 5 121320 95140 31420 157120 12190042411-9095/50627 18 exception, > 5 deliveries per month43437-5350/52250 3 20000 18000 70000 43000 1800041509-5317/51130 3 32000 44000 4400046057-5334/50130 5 11000 15000 16000
/faculteit technologie management
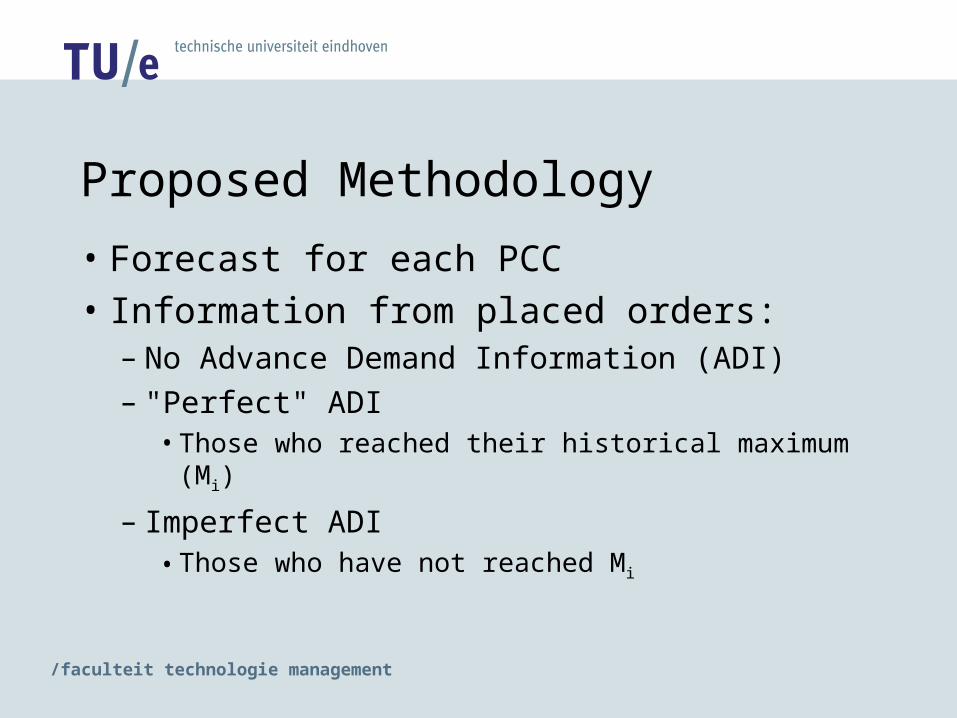
• Forecast for each PCC• Information from placed orders:
– No Advance Demand Information (ADI) – "Perfect" ADI
•Those who reached their historical maximum (Mi)
– Imperfect ADI •Those who have not reached Mi
Proposed Methodology

/faculteit technologie management
Imperfect ADI
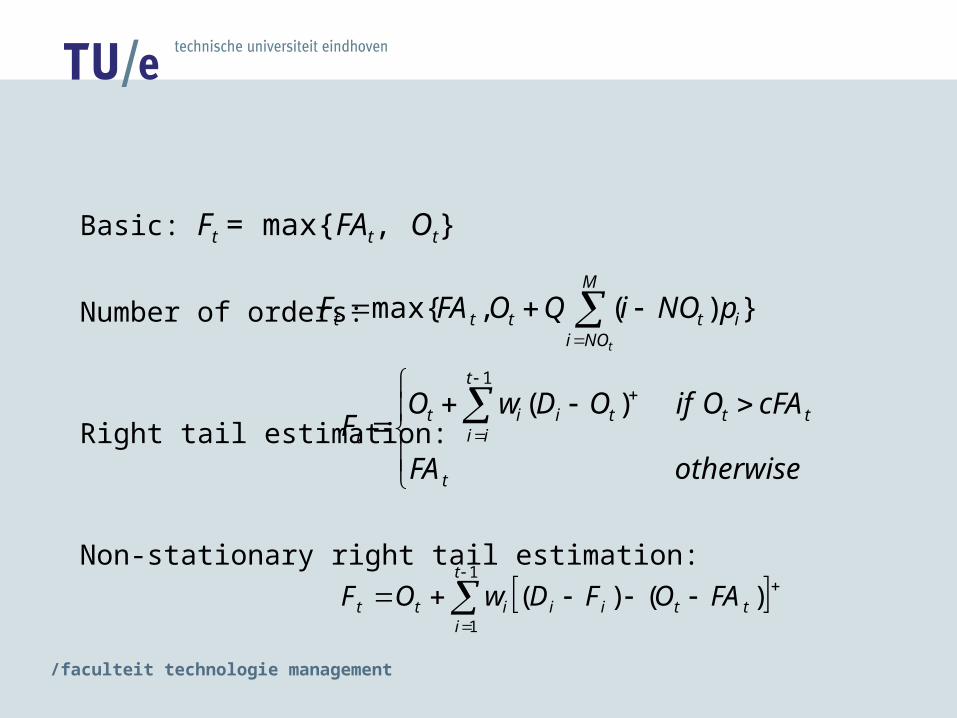
• Some Possible Methods:– Basic
– Binomial
– Number of orders
– Right tail estimation
– Non-stationary right tail estimation
/faculteit technologie management
Basic: Ft = max{FAt, Ot}
Number of orders:
Right tail estimation:
Non-stationary right tail estimation:
})(,max{
M
NOiitttt
t
pNOiQOFAF
otherwiseFA
cFAOifODwOF
t
t
iitttiit
t
1
)(
1
1
)()(t
ittiiitt FAOFDwOF
/faculteit technologie management
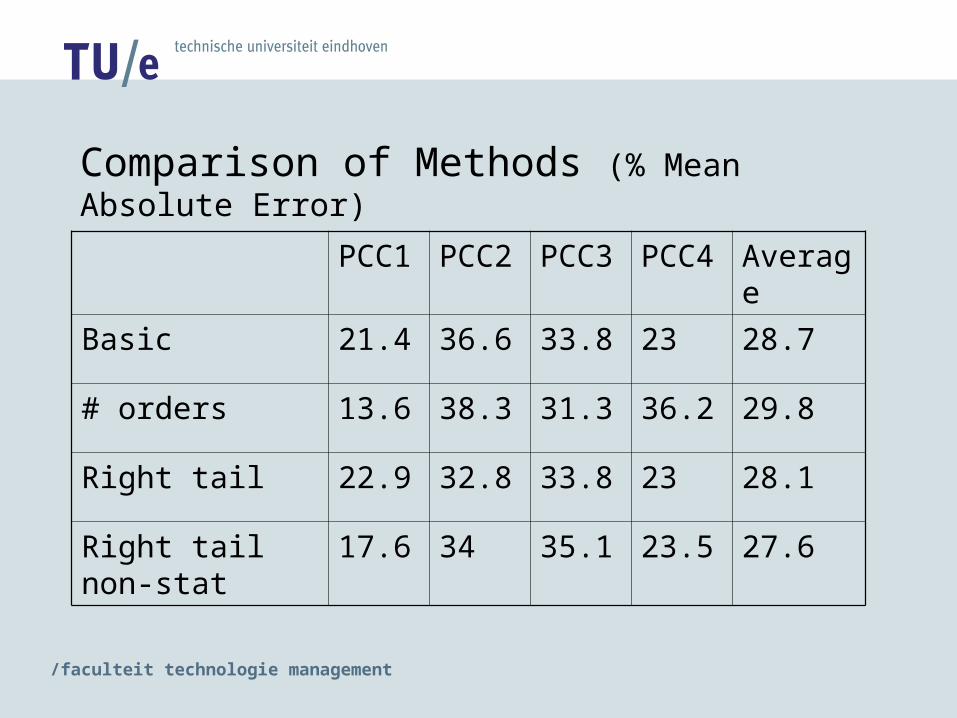
Comparison of Methods (% Mean Absolute Error)
PCC1 PCC2 PCC3 PCC4 Average
Basic 21.4 36.6 33.8 23 28.7
# orders 13.6 38.3 31.3 36.2 29.8
Right tail 22.9 32.8 33.8 23 28.1
Right tail non-stat
17.6 34 35.1 23.5 27.6
/faculteit technologie management
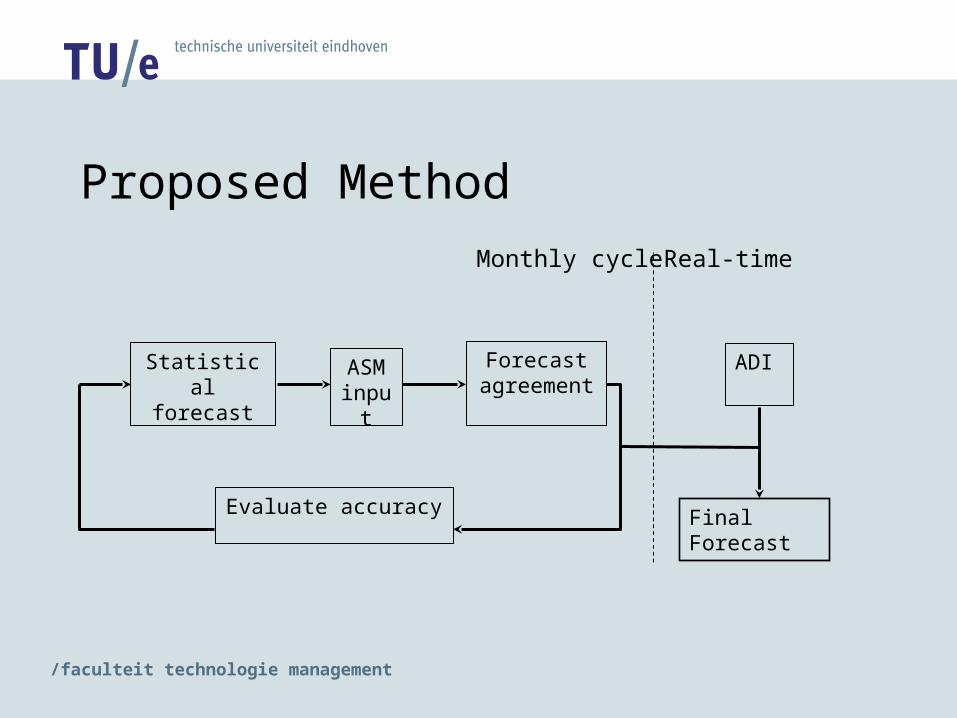
Proposed Method
Statistical forecast
ASM inpu
t
Forecast agreement
Evaluate accuracy
ADI
Final Forecast
Monthly cycle Real-time
/faculteit technologie management
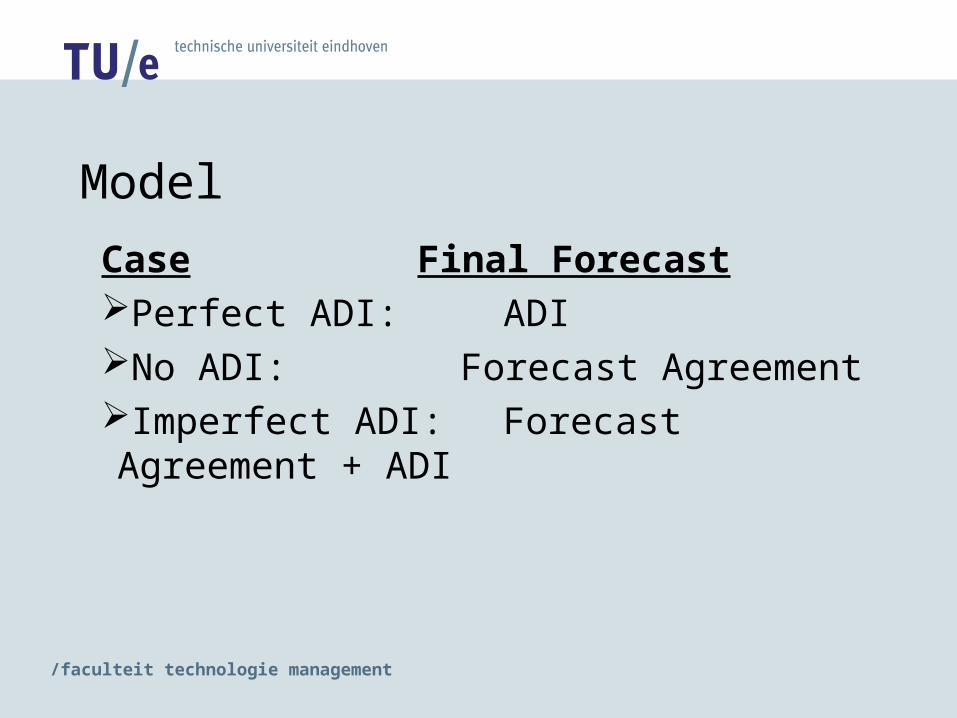
Model
Case Final ForecastPerfect ADI: ADINo ADI: Forecast AgreementImperfect ADI: Forecast Agreement + ADI
/faculteit technologie management
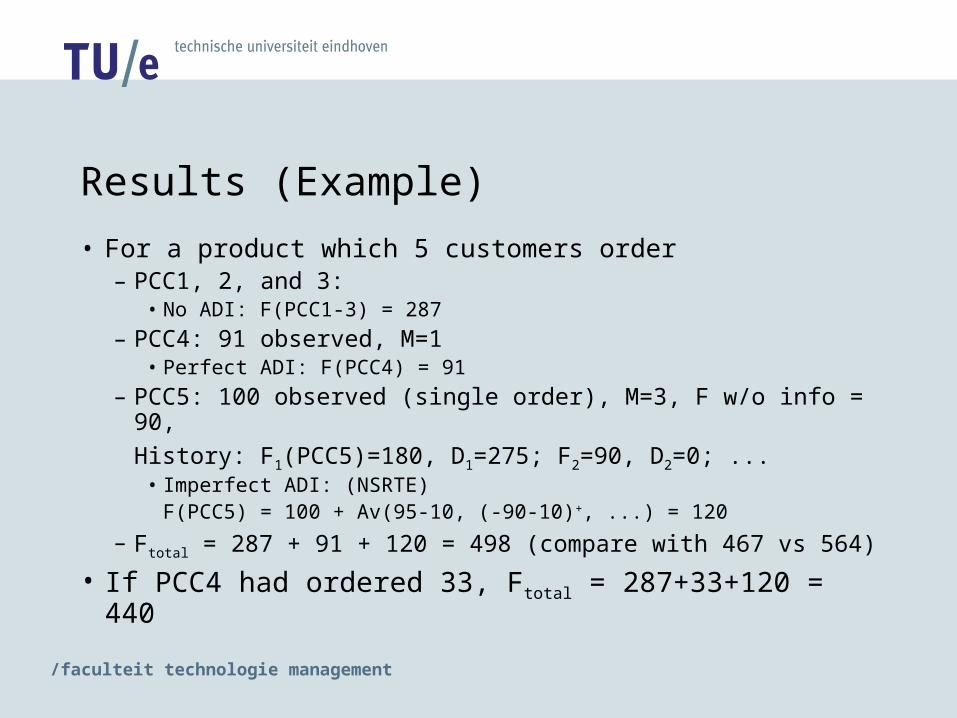
Results (Example)
• For a product which 5 customers order– PCC1, 2, and 3:
• No ADI: F(PCC1-3) = 287
– PCC4: 91 observed, M=1• Perfect ADI: F(PCC4) = 91
– PCC5: 100 observed (single order), M=3, F w/o info = 90,
History: F1(PCC5)=180, D1=275; F2=90, D2=0; ...• Imperfect ADI: (NSRTE)
F(PCC5) = 100 + Av(95-10, (-90-10)+, ...) = 120
– Ftotal = 287 + 91 + 120 = 498 (compare with 467 vs 564)
• If PCC4 had ordered 33, Ftotal = 287+33+120 = 440
/faculteit technologie management
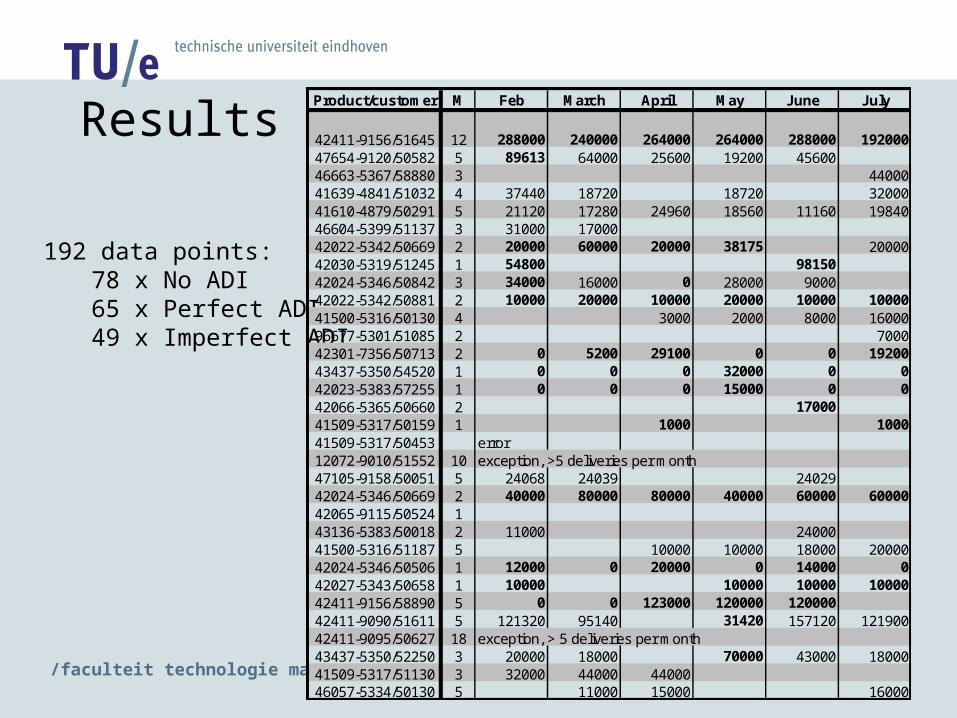
Results
192 data points:78 x No ADI65 x Perfect ADI49 x Imperfect ADI
Product/customer M Feb March April May June July
42411-9156/51645 12 288000 240000 264000 264000 288000 19200047654-9120/50582 5 89613 64000 25600 19200 4560046663-5367/58880 3 4400041639-4841/51032 4 37440 18720 18720 3200041610-4879/50291 5 21120 17280 24960 18560 11160 1984046604-5399/51137 3 31000 1700042022-5342/50669 2 20000 60000 20000 38175 2000042030-5319/51245 1 54800 9815042024-5346/50842 3 34000 16000 0 28000 900042022-5342/50881 2 10000 20000 10000 20000 10000 1000041500-5316/50130 4 3000 2000 8000 1600096677-5301/51085 2 700042301-7356/50713 2 0 5200 29100 0 0 1920043437-5350/54520 1 0 0 0 32000 0 042023-5383/57255 1 0 0 0 15000 0 042066-5365/50660 2 1700041509-5317/50159 1 1000 100041509-5317/50453 error12072-9010/51552 10 exception, >5 deliveries per month47105-9158/50051 5 24068 24039 2402942024-5346/50669 2 40000 80000 80000 40000 60000 6000042065-9115/50524 143136-5383/50018 2 11000 2400041500-5316/51187 5 10000 10000 18000 2000042024-5346/50506 1 12000 0 20000 0 14000 042027-5343/50658 1 10000 10000 10000 1000042411-9156/58890 5 0 0 123000 120000 12000042411-9090/51611 5 121320 95140 31420 157120 12190042411-9095/50627 18 exception, > 5 deliveries per month43437-5350/52250 3 20000 18000 70000 43000 1800041509-5317/51130 3 32000 44000 4400046057-5334/50130 5 11000 15000 16000

/faculteit technologie management
ResultsProduct/customer Feb March April May June July
42411-9156/51645 288000 240000 264000 264000 288000 19200047654-9120/50582 89613 94248 89309 83745 97548 8437246663-5367/58880 55836 43123 40408 39837 45240 5024541639-4841/51032 66028 55083 25742 55449 61693 5875341610-4879/50291 38055 39323 39040 42410 40480 3943246604-5399/51137 31419 24748 20000 20000 20000 2000042022-5342/50669 20000 60000 20000 38175 20000 3698642030-5319/51245 54800 0 0 0 98150 042024-5346/50842 34000 22503 0 28336 31294 2053942022-5342/50881 10000 20000 10000 20000 10000 1000041500-5316/50130 9888 11200 18300 13363 13095 4876096677-5301/51085 991 7760 6052 6833 8454 1284842301-7356/50713 0 5200 29100 0 0 1920043437-5350/54520 0 0 0 32000 0 042023-5383/57255 0 0 0 15000 0 042066-5365/50660 0 0 0 10449 17000 041509-5317/50159 0 7588 1000 8469 6601 100041509-5317/50453 101237 183506 232137 404647 348027 25518612072-9010/51552 250000 245157 376577 501245 495084 52072347105-9158/50051 37215 75482 74566 60366 60817 6275142024-5346/50669 40000 80000 80000 40000 60000 6000042065-9115/50524 0 0 32898 0 0 3277343136-5383/50018 28638 26744 33590 20263 31824 2205541500-5316/51187 22652 19724 33105 31014 37323 3835642024-5346/50506 12000 0 20000 0 14000 042027-5343/50658 10000 10000 10000 10000 10000 1000042411-9156/58890 0 0 123000 120000 120000 14965242411-9090/51611 131512 119105 0 31420 158009 12718042411-9095/50627 651690 758465 768730 882731 839678 89330043437-5350/52250 38886 33053 41539 70000 43336 3609841509-5317/51130 34309 48377 48118 51380 60428 046057-5334/50130 26113 28352 25437 19774 22602 24462
/faculteit technologie management
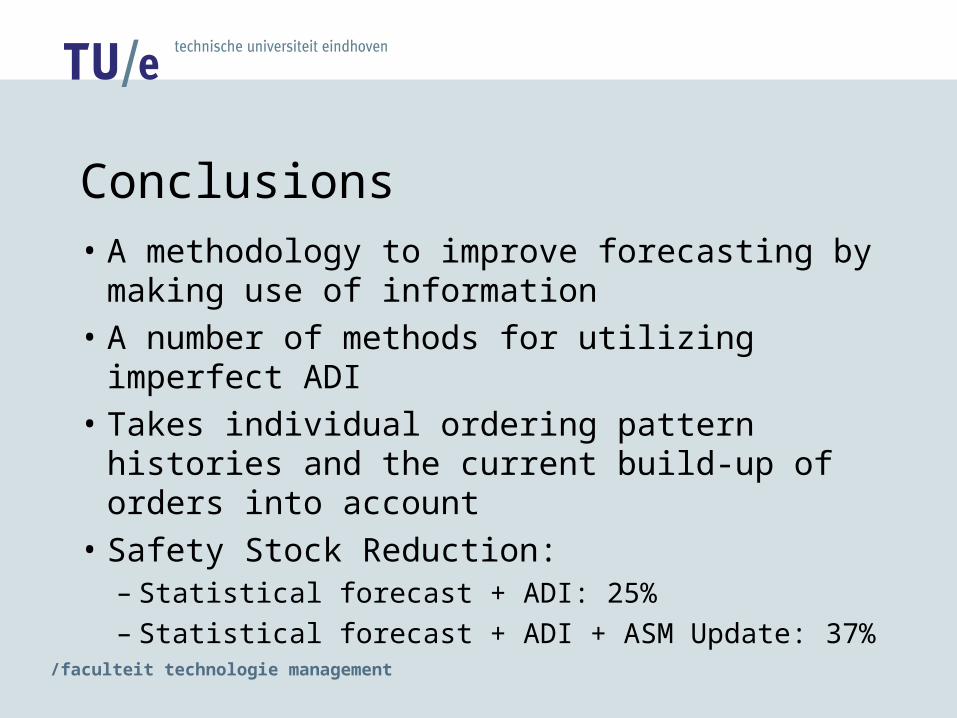
Conclusions• A methodology to improve forecasting by
making use of information
• A number of methods for utilizing imperfect ADI
• Takes individual ordering pattern histories and the current build-up of orders into account
• Safety Stock Reduction:– Statistical forecast + ADI: 25%
– Statistical forecast + ADI + ASM Update: 37%
/faculteit technologie management
Future Research
• Different methods for utilizing imperfect ADI
• Incorporating this kind of ADI directly in production/inventory planning
• Lot sizing• Inventory rationing based on ADI
Top Related