


Languages
Pages
Legal

Doing more with less using Doing more with less using Business Intelligence
Davide Hanan
QlikView
Jeremy Hurter
Durban ICC
Agenda
• Doing more with what you have
• Implementing BI with less
• Case study
2
In the past 20
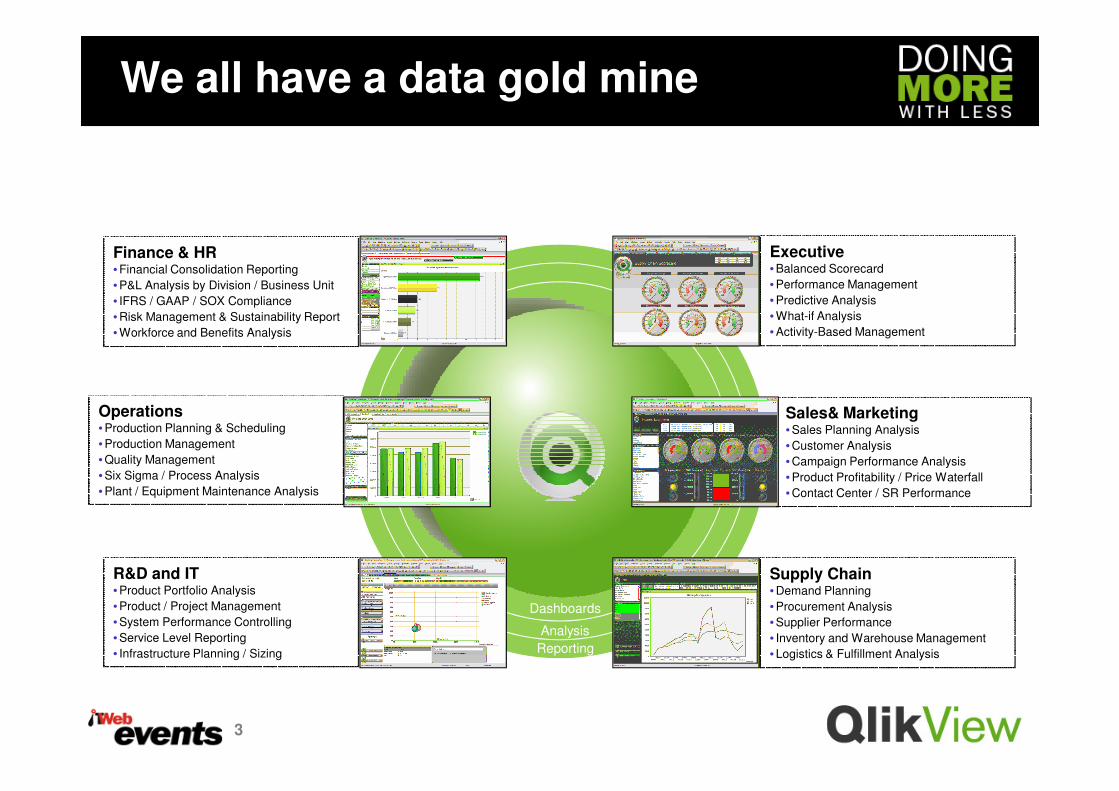
We all have a data gold mine
Executive• Balanced Scorecard
• Performance Management
• Predictive Analysis
• What-if Analysis
• Activity-Based Management
Finance & HR• Financial Consolidation Reporting
• P&L Analysis by Division / Business Unit
• IFRS / GAAP / SOX Compliance
• Risk Management & Sustainability Report
• Workforce and Benefits Analysis
In the past 20
years, we have
computerised just
about every aspect
of our businesses
3
Sales& Marketing• Sales Planning Analysis
• Customer Analysis
• Campaign Performance Analysis
• Product Profitability / Price Waterfall
• Contact Center / SR Performance
Supply Chain• Demand Planning
• Procurement Analysis
• Supplier Performance
• Inventory and Warehouse Management
• Logistics & Fulfillment Analysis
Operations • Production Planning & Scheduling
• Production Management
• Quality Management
• Six Sigma / Process Analysis
• Plant / Equipment Maintenance Analysis
R&D and IT• Product Portfolio Analysis
• Product / Project Management
• System Performance Controlling
• Service Level Reporting
• Infrastructure Planning / Sizing
Dashboards
Analysis
Reporting
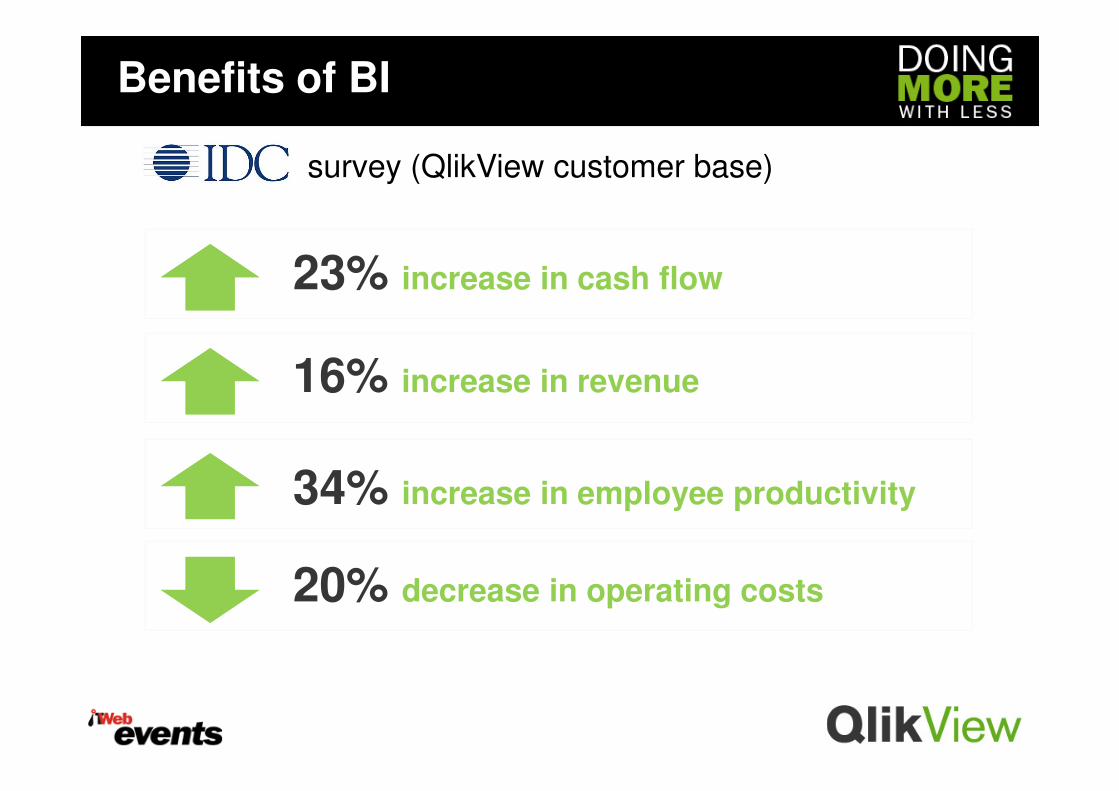
16% increase in revenue
23% increase in cash flow
Benefits of BI
survey (QlikView customer base)
20% decrease in operating costs
34% increase in employee productivity
16% increase in revenue
Poor decisions are being taken
every day, because people don’t
5
every day, because people don’t
have access to the right facts.
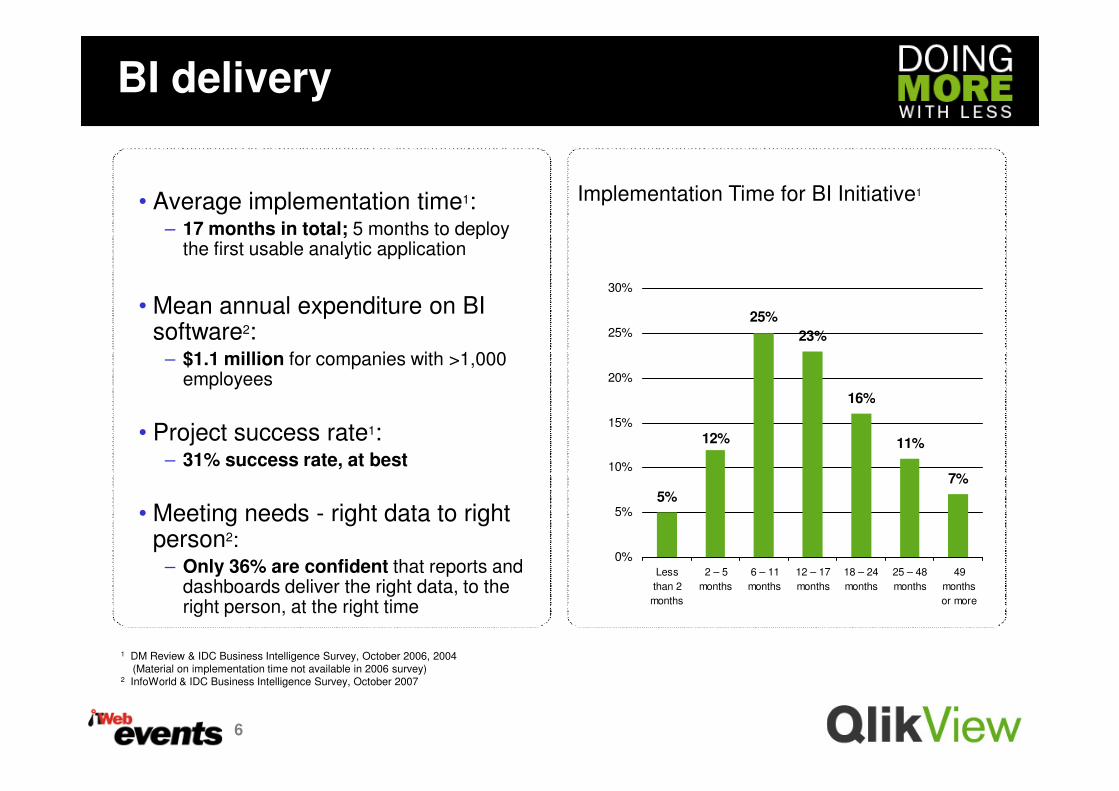
BI delivery
• Average implementation time1:– 17 months in total; 5 months to deploy
the first usable analytic application
• Mean annual expenditure on BI software2:
– $1.1 million for companies with >1,000 employees
23%
16%
25%
20%
25%
30%
Implementation Time for BI Initiative1
6
1 DM Review & IDC Business Intelligence Survey, October 2006, 2004 (Material on implementation time not available in 2006 survey)
2 InfoWorld & IDC Business Intelligence Survey, October 2007
• Project success rate1:– 31% success rate, at best
• Meeting needs - right data to right person2:
– Only 36% are confident that reports and dashboards deliver the right data, to the right person, at the right time
16%
11%
7%
5%
12%
0%
5%
10%
15%
Less
than 2
months
2 – 5
months
6 – 11
months
12 – 17
months
18 – 24
months
25 – 48
months
49
months
or more
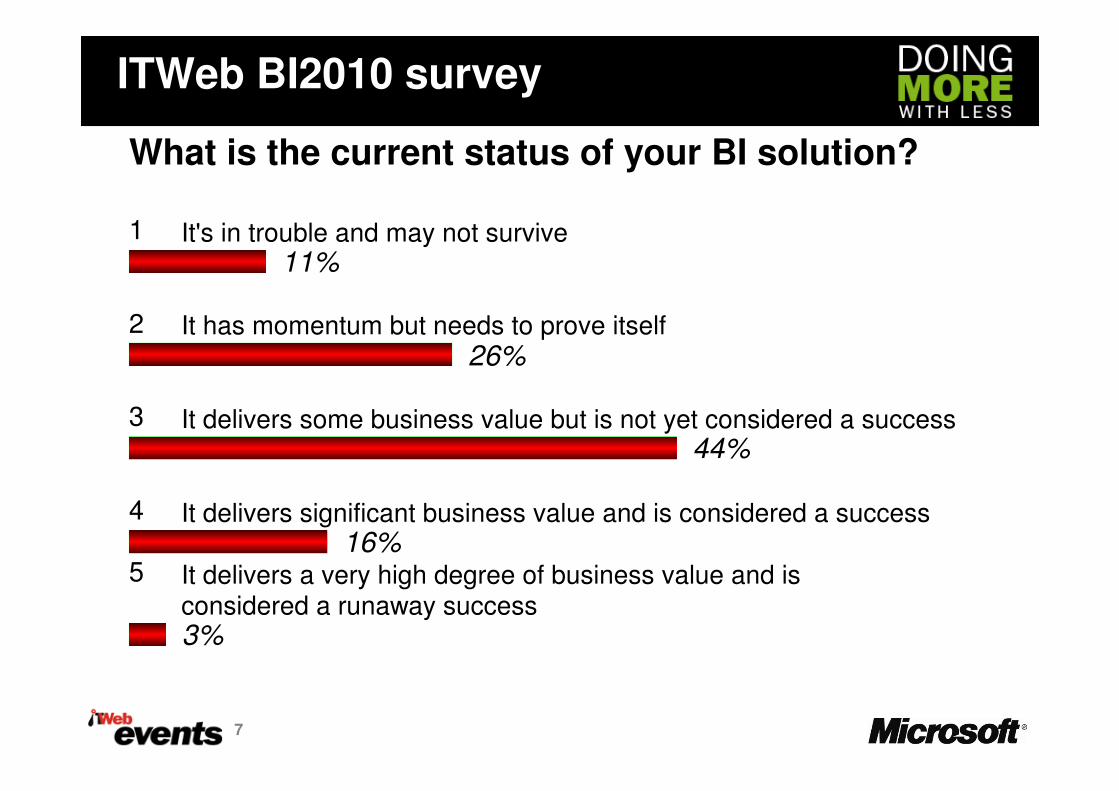
11%
26%
1 It's in trouble and may not survive
2 It has momentum but needs to prove itself
What is the current status of your BI solution?
ITWeb BI2010 survey
44%
16%
3%
3 It delivers some business value but is not yet considered a success
4 It delivers significant business value and is considered a success
5 It delivers a very high degree of business value and is considered a runaway success
7
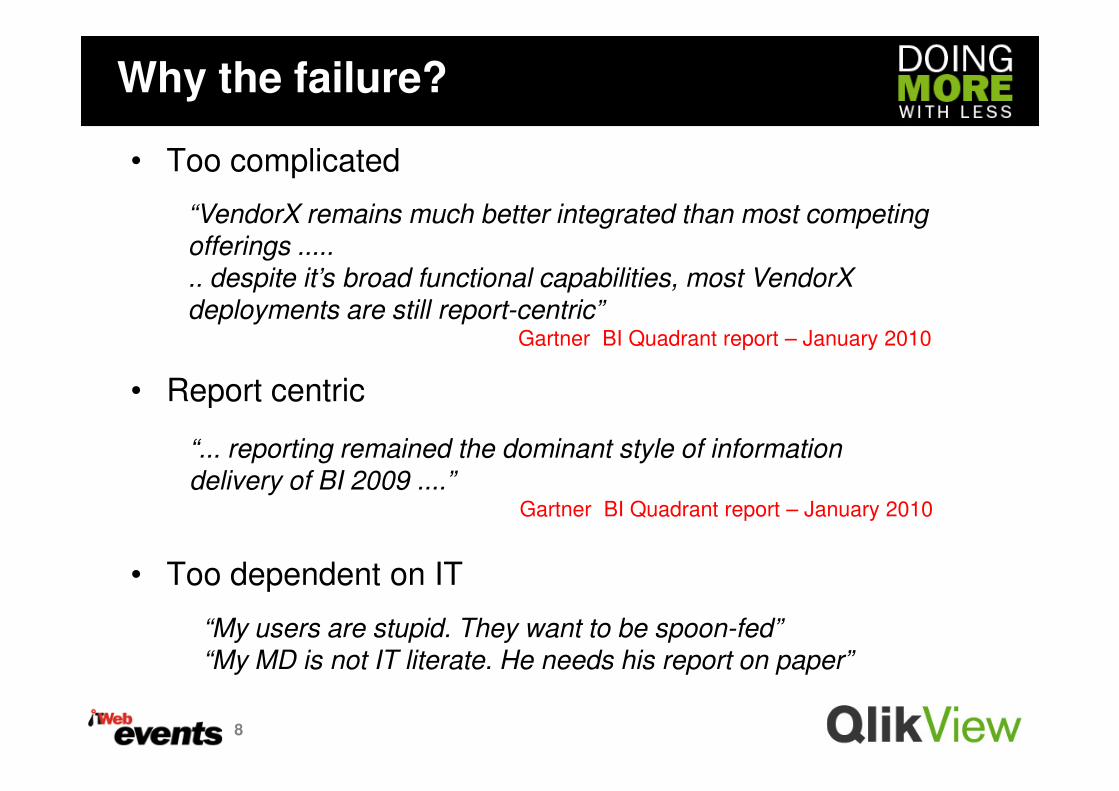
Why the failure?
• Too complicated
• Report centric
“VendorX remains much better integrated than most competing
offerings .....
.. despite it’s broad functional capabilities, most VendorX
deployments are still report-centric”Gartner BI Quadrant report – January 2010
• Report centric
• Too dependent on IT
8
“... reporting remained the dominant style of information
delivery of BI 2009 ....”Gartner BI Quadrant report – January 2010
“My users are stupid. They want to be spoon-fed”
“My MD is not IT literate. He needs his report on paper”
The tools that are developed at any point in
time are always a reflection of the technology
9
time are always a reflection of the technology
available at that time

From the solid stone wheel ....
10
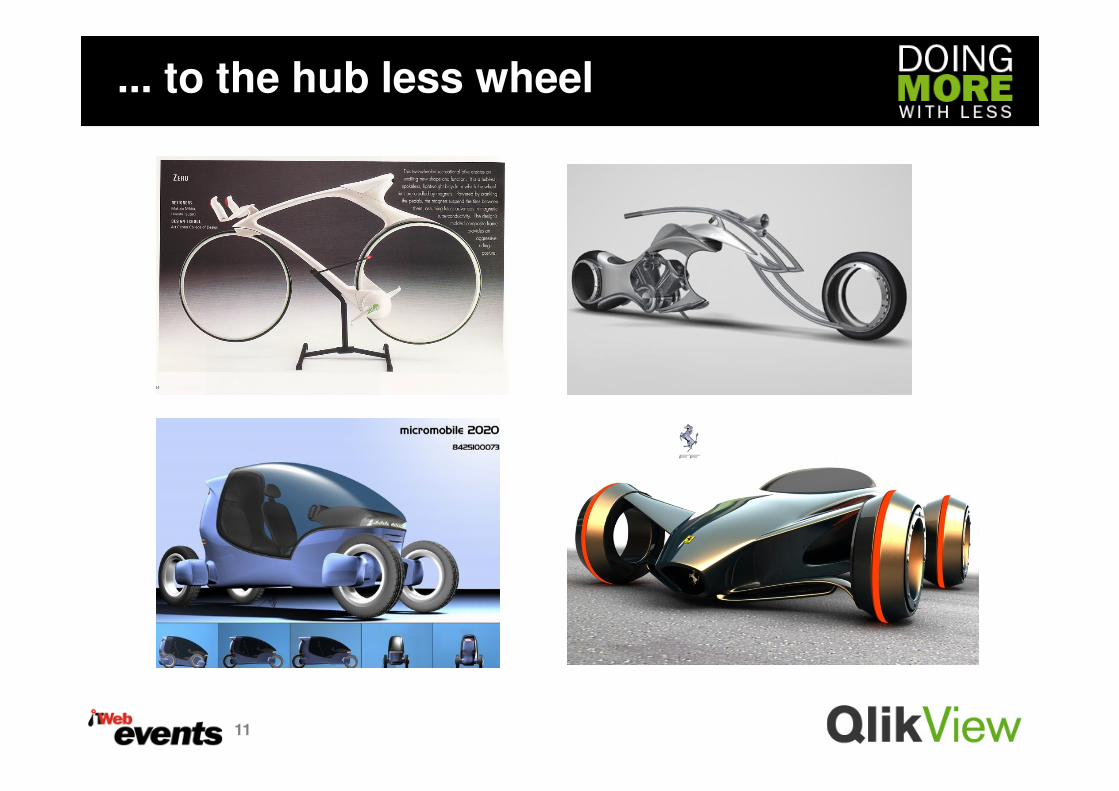
... to the hub less wheel
11
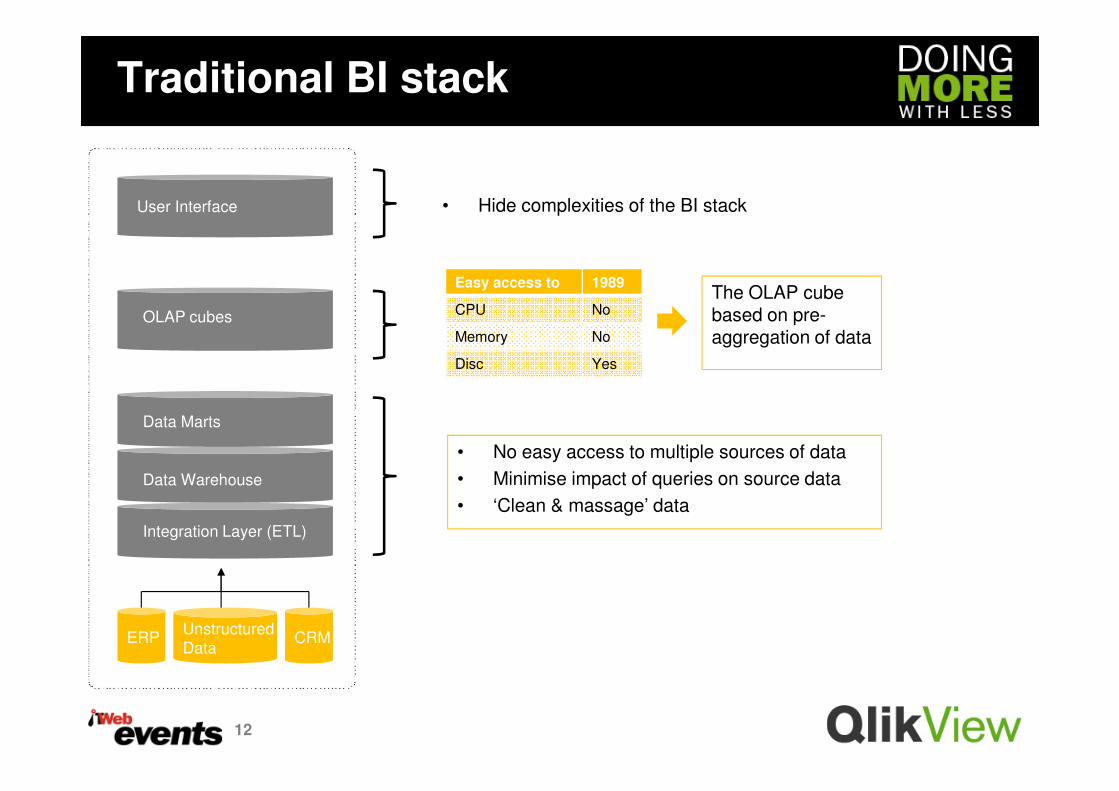
Traditional BI stack
OLAP cubes
User Interface • Hide complexities of the BI stack
Easy access to 1989
CPU No
Memory No
Disc Yes
The OLAP cube based on pre-aggregation of data
12
Data Warehouse
Data Marts
Integration Layer (ETL)
ERP CRMUnstructured
Data
• No easy access to multiple sources of data
• Minimise impact of queries on source data
• ‘Clean & massage’ data

Computer Laws
13
Moore’s law: processor performance will double every 2 years
Declining RAM prices ( /10 every 5 years)• 2000: $1000/GB• 2005: $100/GB

Processor performance
Intel labs:Intel labs:• 256 cores• 1 TB RAM

What’s a really large app in memory?
• 2000: 1 000 000 records
• 2004: 100 000 000 records
• 2008: 1 000 000 000 records
• 2010: 10 000 000 000 records
99% of all BI apps of Fortune 5000 companies
can fit in 1 TB of RAM

Simplifying the BI stack
• Large packaging
company
– Full BI implementation < Quoted cost for a Data Warehouse
Traditional BI Stack
Data Marts
OLAP, Query and
Reporting tools
User Interface,
Dashboards,
Scorecards, Reports
• User Interface
• Chart and Report Engine
• Analysis Engine
• Data Compression
Associative in-memory BI
• Large insurance
group
– Canned planned Data Mart project: saving R1,400,000
16
Data Warehouse
Data Marts
Integration Layer (ETL)
ERP CRMUnstructured
Data
• Data Compression
• Integration
ERP CRMUnstructured
Data

Achieving The Impossible:The QlikView Customer Experience
BI Initiative Success and Satisfaction• 96% of customers are satisfied with QlikView
ROI (Return On Investment)• 186% Return On Investment
• 6.5 month payback period • 6.5 month payback period
Time to Value44% deployed QlikView in 1 Month
77% deployed QlikView in 3 Months
50% reduction in information access and analysis time
-100 0 100

ICC Durban
• Catalyst for economic growth, foreign investment
• Host meetings, conventions, exhibitions, music concerts,
government meetings.
• 2.7 billion economic impact - 2009
• In operation for 12 years
• WTA - Africa’s Leading Convention Centre
18
• WTA - Africa’s Leading Convention Centre

ICC Durban
• Strong turnover growth in the past 4 years
• Host meetings, conventions, exhibitions, music concerts
• Highly competitive environment
• Cost control is extremely important
• Large volumes of data
19

My BI Experience
• Worked and designed power cubes, reports etc in Cognos,
Business Objects, MS Access and Excel…
• Things I hate:-
• Queries that take hours
• Old data (warehouses beware)
• Relying on others to deliver my info
• Regurgitating information into other reports• Regurgitating information into other reports
• Relying on others to interpret information
• Spreadsheets…with some exceptions
• Wasting time on anything that can be automated
• It’s not about how the report looks like its about whether
you can get what you need.
20

ERP Systems and Deliverables
• If you are running an ERP/integrated system, surely all
reporting must be automatic requiring no double capture of
data ?
• At the ICC we have managed to automate the bulk of
analysis resulting in one click management accounts.
These are used at monthly meetings and are submitted to
the board.the board.
• We are also able to automate the bulk of all other non
financial reporting and analysis
21

Benefits and Savings achieved
• Management accountant no longer required
• Managed to deliver with significantly fewer finance
department staff
• No delay between last journal entry and availability of
management accounts
• Staff do not have to spend time compiling reports but can
concentrate on performing their function (especially sales concentrate on performing their function (especially sales
staff).
• What gets monitored gets managed:-
– Telephony (45% saving per month)
– Point of Sales
– CRM and lead management
– Guest and customer feedback
– Major improvement in debt collection and credit control
22

Why we choose QlikView…
• Utilises multiple data sources – even spreadsheets or
whatever is available
• Applies queries and calculates consistently and uniformly
• Forms a basis for growth and development
• User access can be implemented in minutes
• Next month just update instead of re-inputting• Next month just update instead of re-inputting
• Quickly clone charts and develop report ready material.
• Complex calcs are easy to input and copy
• Fun once you are up and running (wow your friends and
colleagues)
23

Why this kicks the spreadsheets a@#$$ ….
• Many companies have great ERP however at the end of the
month they spend hours re-capturing info into spreadsheets
– WHAT A WASTE OF TIME !
• Gartner study
• Spreadsheets are far more unstructured
• Underlying queries and data still require secure access
24
• Adding more objects
• QVD files – IT
• Work without disturbing source data
• Quickly add more structure in a relational database way

What about IT department ?
• Develop and then hand over to IT for quality control and
deployment
• User access is so simple compared to any other BI tool I
have seen
• Once you have base model for an area of business you can
continue to grow and expand… nothing is lost
• Looks great and everything relates• Looks great and everything relates
25

What must change ?
• Break free of old rigid reporting formats
• Move to online analytics rather than old fashioned reports
• Ensure buy-in from departments
• Time is money, the higher the quality of information the
better and faster decisions can be made !
26

Questions?
Thank You
Questions?
Top Related