Davide Hanan
27
Doing more with less using Doing more with less using Business Intelligence Davide Hanan QlikView Jeremy Hurter Durban ICC
Transcript of Davide Hanan
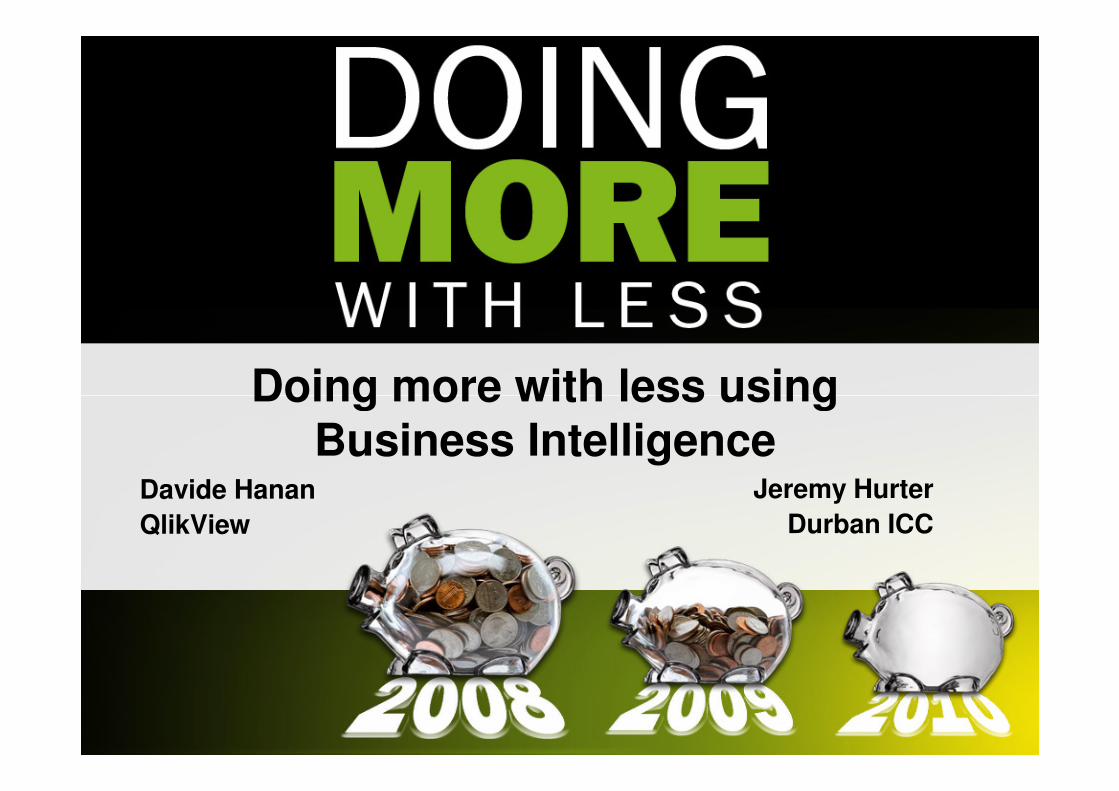
Doing more with less using Doing more with less using Business Intelligence
Davide Hanan
QlikView
Jeremy Hurter
Durban ICC
Agenda
• Doing more with what you have
• Implementing BI with less
• Case study
2
In the past 20
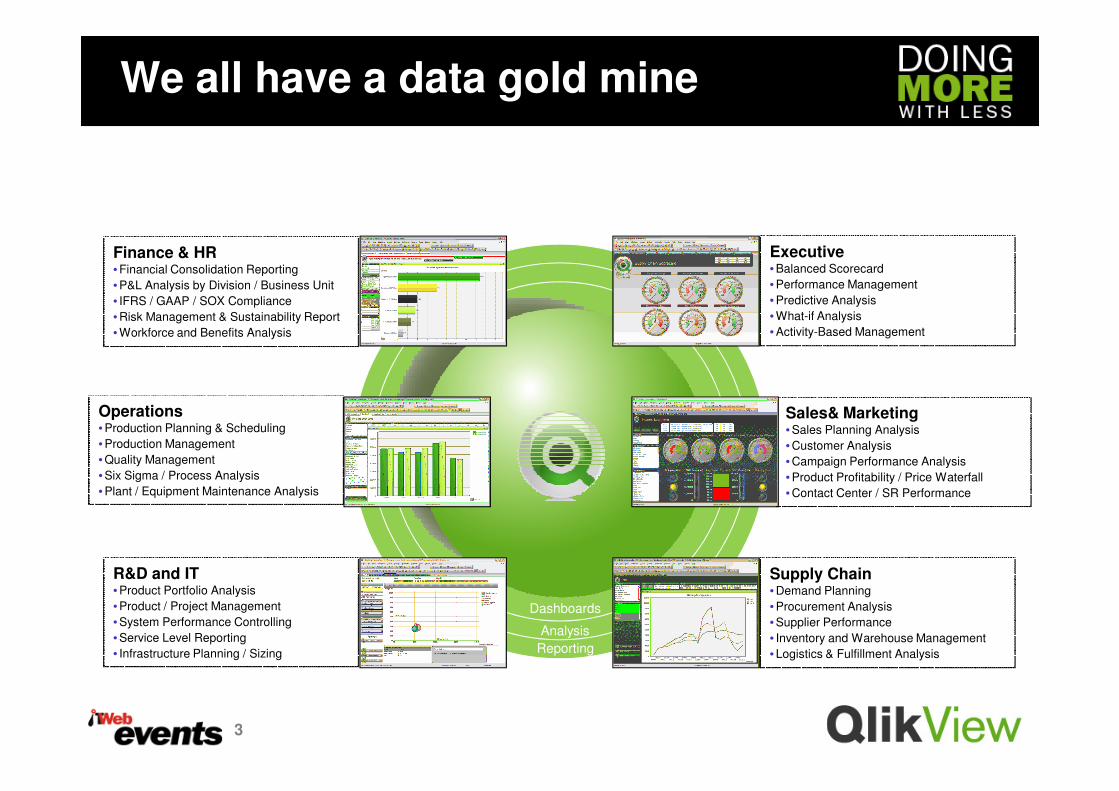
We all have a data gold mine
Executive• Balanced Scorecard
• Performance Management
• Predictive Analysis
• What-if Analysis
• Activity-Based Management
Finance & HR• Financial Consolidation Reporting
• P&L Analysis by Division / Business Unit
• IFRS / GAAP / SOX Compliance
• Risk Management & Sustainability Report
• Workforce and Benefits Analysis
In the past 20
years, we have
computerised just
about every aspect
of our businesses
3
Sales& Marketing• Sales Planning Analysis
• Customer Analysis
• Campaign Performance Analysis
• Product Profitability / Price Waterfall
• Contact Center / SR Performance
Supply Chain• Demand Planning
• Procurement Analysis
• Supplier Performance
• Inventory and Warehouse Management
• Logistics & Fulfillment Analysis
Operations • Production Planning & Scheduling
• Production Management
• Quality Management
• Six Sigma / Process Analysis
• Plant / Equipment Maintenance Analysis
R&D and IT• Product Portfolio Analysis
• Product / Project Management
• System Performance Controlling
• Service Level Reporting
• Infrastructure Planning / Sizing
Dashboards
Analysis
Reporting
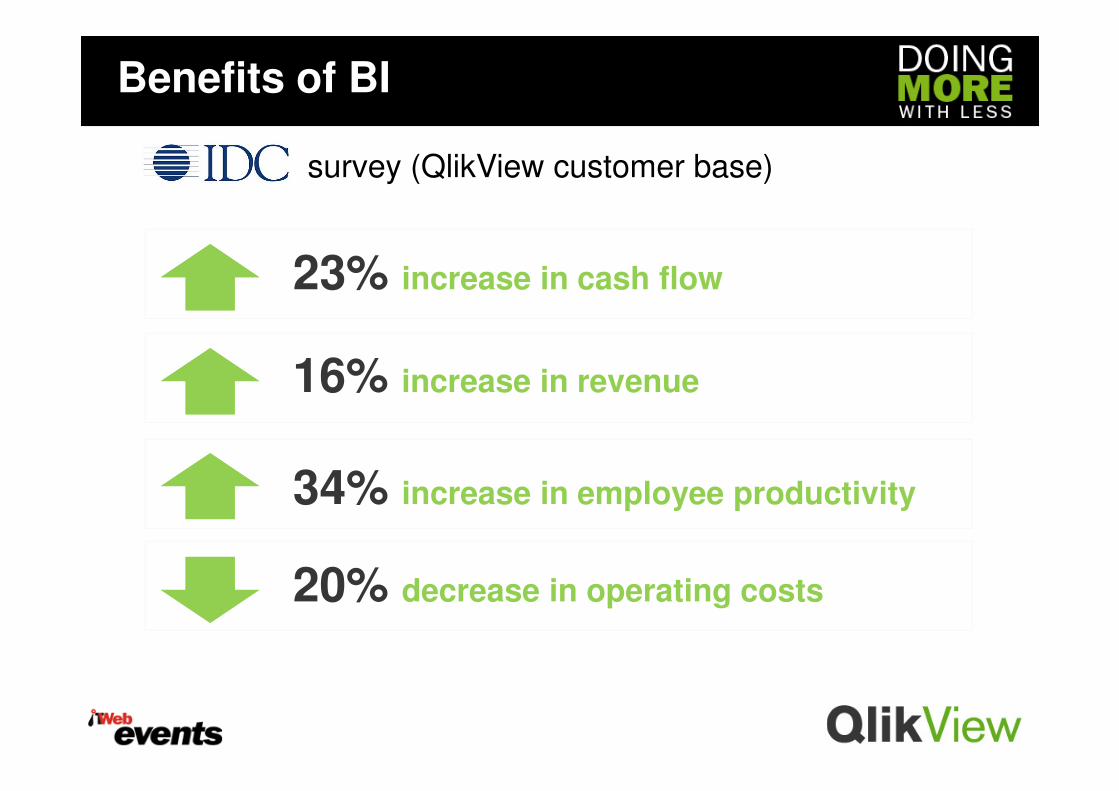
16% increase in revenue
23% increase in cash flow
Benefits of BI
survey (QlikView customer base)
20% decrease in operating costs
34% increase in employee productivity
16% increase in revenue
Poor decisions are being taken
every day, because people don’t
5
every day, because people don’t
have access to the right facts.
BI delivery
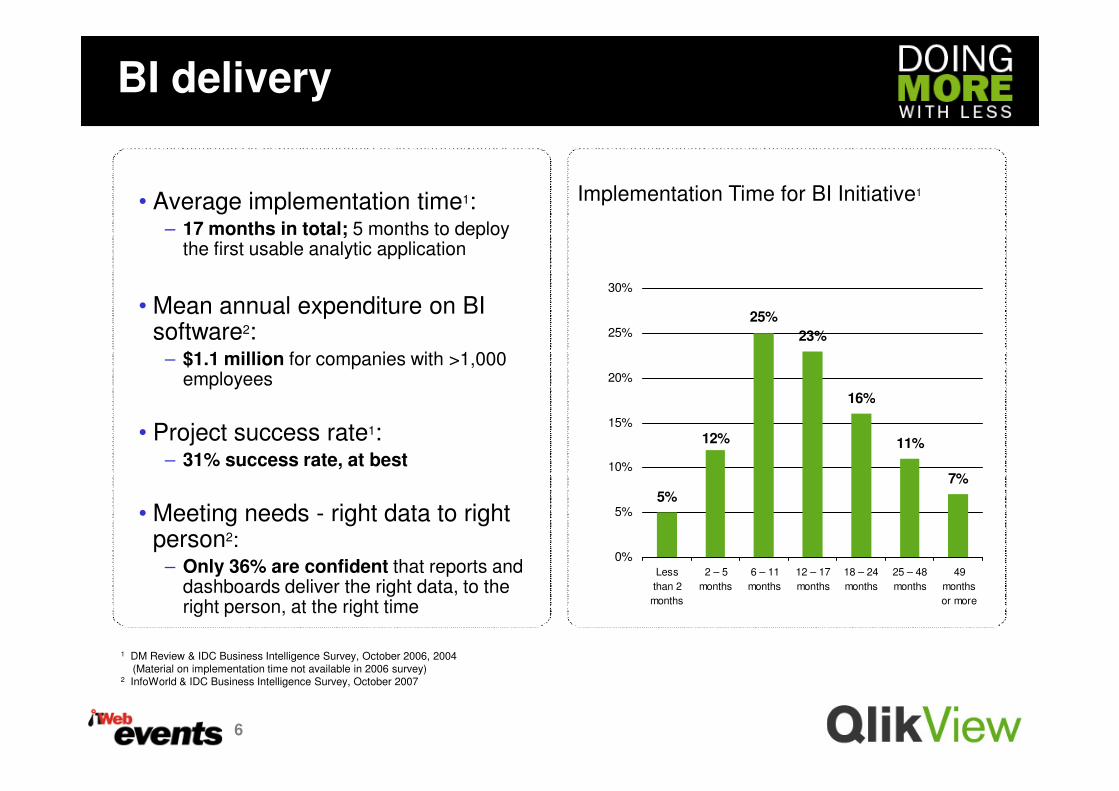
• Average implementation time1:– 17 months in total; 5 months to deploy
the first usable analytic application
• Mean annual expenditure on BI software2:
– $1.1 million for companies with >1,000 employees
23%
16%
25%
20%
25%
30%
Implementation Time for BI Initiative1
6
1 DM Review & IDC Business Intelligence Survey, October 2006, 2004 (Material on implementation time not available in 2006 survey)
2 InfoWorld & IDC Business Intelligence Survey, October 2007
• Project success rate1:– 31% success rate, at best
• Meeting needs - right data to right person2:
– Only 36% are confident that reports and dashboards deliver the right data, to the right person, at the right time
16%
11%
7%
5%
12%
0%
5%
10%
15%
Less
than 2
months
2 – 5
months
6 – 11
months
12 – 17
months
18 – 24
months
25 – 48
months
49
months
or more
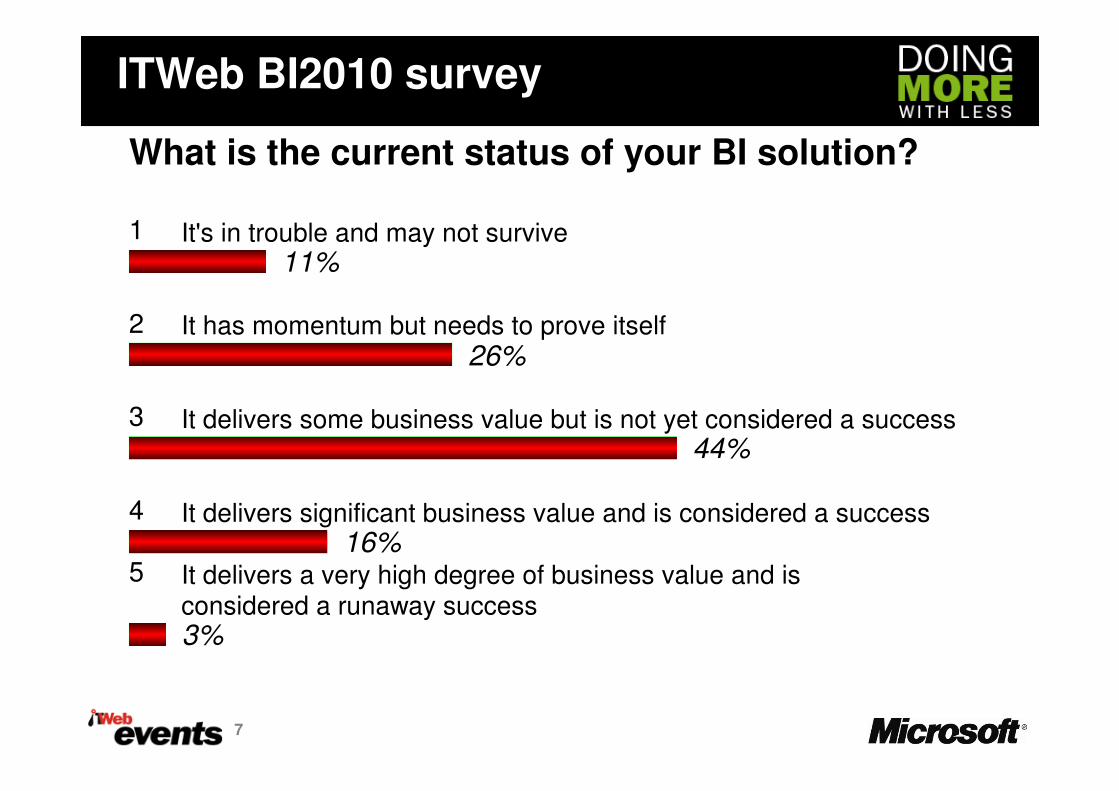
11%
26%
1 It's in trouble and may not survive
2 It has momentum but needs to prove itself
What is the current status of your BI solution?
ITWeb BI2010 survey
44%
16%
3%
3 It delivers some business value but is not yet considered a success
4 It delivers significant business value and is considered a success
5 It delivers a very high degree of business value and is considered a runaway success
7
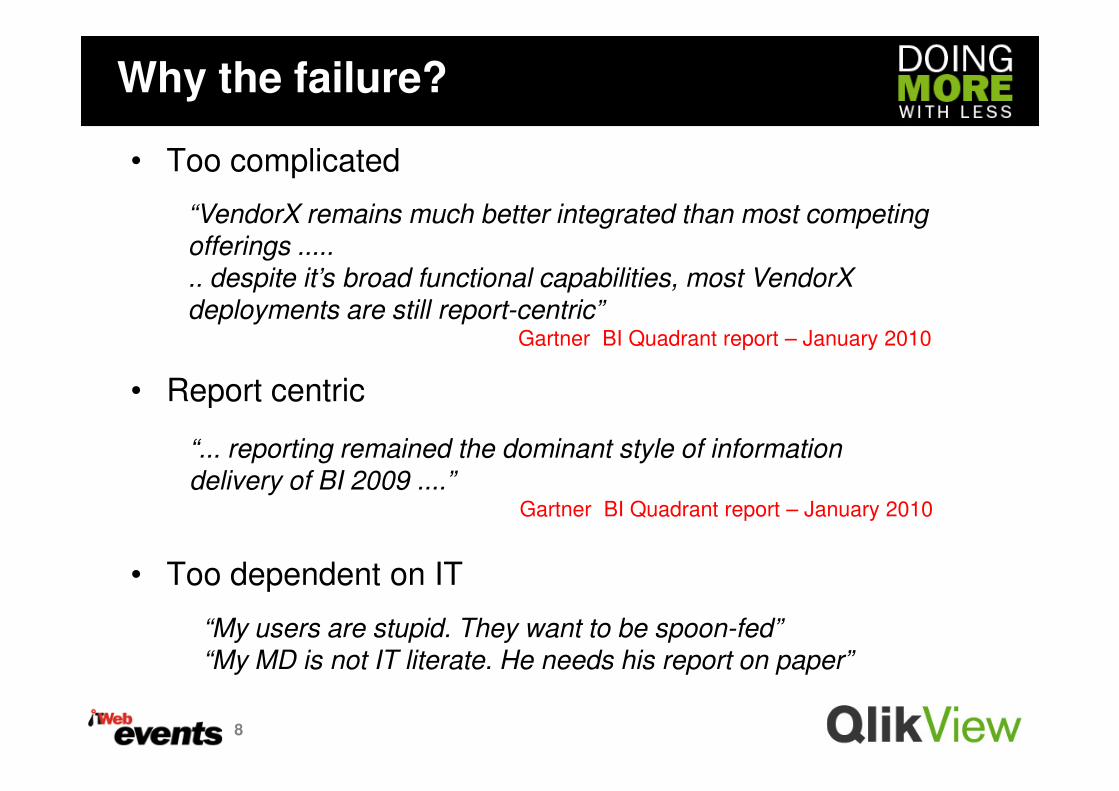
Why the failure?
• Too complicated
• Report centric
“VendorX remains much better integrated than most competing
offerings .....
.. despite it’s broad functional capabilities, most VendorX
deployments are still report-centric”Gartner BI Quadrant report – January 2010
• Report centric
• Too dependent on IT
8
“... reporting remained the dominant style of information
delivery of BI 2009 ....”Gartner BI Quadrant report – January 2010
“My users are stupid. They want to be spoon-fed”
“My MD is not IT literate. He needs his report on paper”
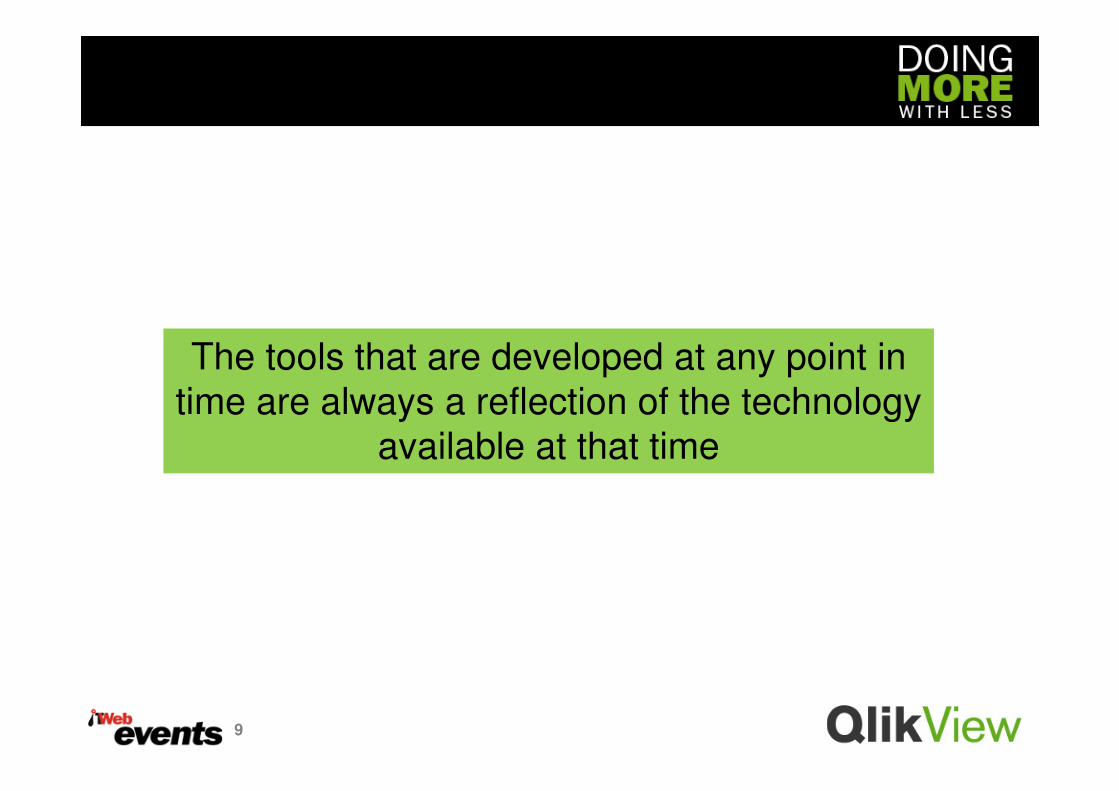
The tools that are developed at any point in
time are always a reflection of the technology
9
time are always a reflection of the technology
available at that time

From the solid stone wheel ....
10
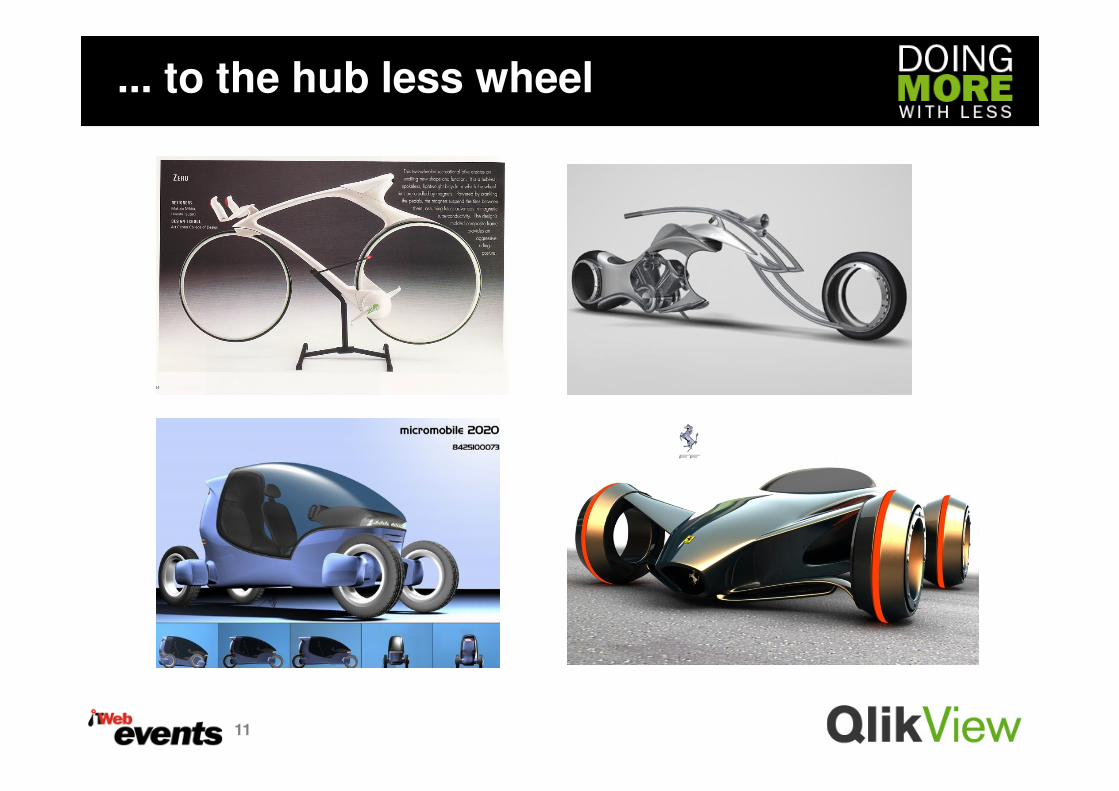
... to the hub less wheel
11
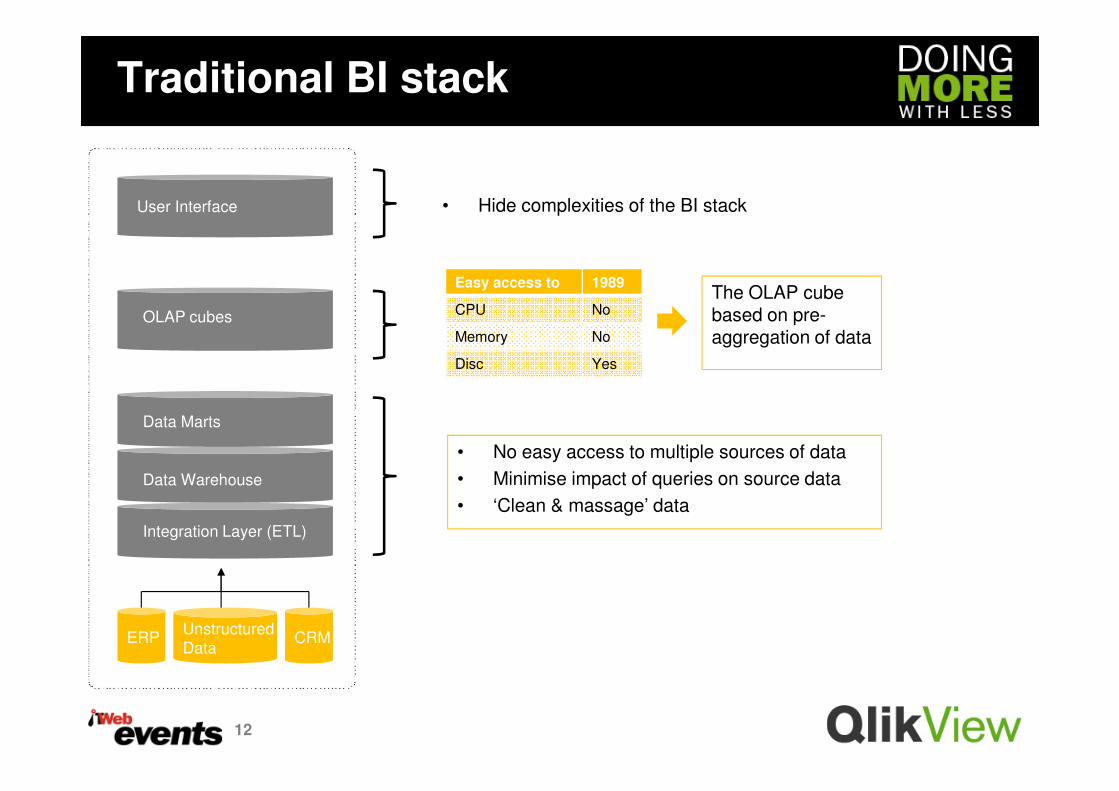
Traditional BI stack
OLAP cubes
User Interface • Hide complexities of the BI stack
Easy access to 1989
CPU No
Memory No
Disc Yes
The OLAP cube based on pre-aggregation of data
12
Data Warehouse
Data Marts
Integration Layer (ETL)
ERP CRMUnstructured
Data
• No easy access to multiple sources of data
• Minimise impact of queries on source data
• ‘Clean & massage’ data

Computer Laws
13
Moore’s law: processor performance will double every 2 years
Declining RAM prices ( /10 every 5 years)• 2000: $1000/GB• 2005: $100/GB

Processor performance
Intel labs:Intel labs:• 256 cores• 1 TB RAM

What’s a really large app in memory?
• 2000: 1 000 000 records
• 2004: 100 000 000 records
• 2008: 1 000 000 000 records
• 2010: 10 000 000 000 records
99% of all BI apps of Fortune 5000 companies
can fit in 1 TB of RAM

Simplifying the BI stack
• Large packaging
company
– Full BI implementation < Quoted cost for a Data Warehouse
Traditional BI Stack
Data Marts
OLAP, Query and
Reporting tools
User Interface,
Dashboards,
Scorecards, Reports
• User Interface
• Chart and Report Engine
• Analysis Engine
• Data Compression
Associative in-memory BI
• Large insurance
group
– Canned planned Data Mart project: saving R1,400,000
16
Data Warehouse
Data Marts
Integration Layer (ETL)
ERP CRMUnstructured
Data
• Data Compression
• Integration
ERP CRMUnstructured
Data

Achieving The Impossible:The QlikView Customer Experience
BI Initiative Success and Satisfaction• 96% of customers are satisfied with QlikView
ROI (Return On Investment)• 186% Return On Investment
• 6.5 month payback period • 6.5 month payback period
Time to Value44% deployed QlikView in 1 Month
77% deployed QlikView in 3 Months
50% reduction in information access and analysis time
-100 0 100

ICC Durban
• Catalyst for economic growth, foreign investment
• Host meetings, conventions, exhibitions, music concerts,
government meetings.
• 2.7 billion economic impact - 2009
• In operation for 12 years
• WTA - Africa’s Leading Convention Centre
18
• WTA - Africa’s Leading Convention Centre

ICC Durban
• Strong turnover growth in the past 4 years
• Host meetings, conventions, exhibitions, music concerts
• Highly competitive environment
• Cost control is extremely important
• Large volumes of data
19

My BI Experience
• Worked and designed power cubes, reports etc in Cognos,
Business Objects, MS Access and Excel…
• Things I hate:-
• Queries that take hours
• Old data (warehouses beware)
• Relying on others to deliver my info
• Regurgitating information into other reports• Regurgitating information into other reports
• Relying on others to interpret information
• Spreadsheets…with some exceptions
• Wasting time on anything that can be automated
• It’s not about how the report looks like its about whether
you can get what you need.
20

ERP Systems and Deliverables
• If you are running an ERP/integrated system, surely all
reporting must be automatic requiring no double capture of
data ?
• At the ICC we have managed to automate the bulk of
analysis resulting in one click management accounts.
These are used at monthly meetings and are submitted to
the board.the board.
• We are also able to automate the bulk of all other non
financial reporting and analysis
21

Benefits and Savings achieved
• Management accountant no longer required
• Managed to deliver with significantly fewer finance
department staff
• No delay between last journal entry and availability of
management accounts
• Staff do not have to spend time compiling reports but can
concentrate on performing their function (especially sales concentrate on performing their function (especially sales
staff).
• What gets monitored gets managed:-
– Telephony (45% saving per month)
– Point of Sales
– CRM and lead management
– Guest and customer feedback
– Major improvement in debt collection and credit control
22

Why we choose QlikView…
• Utilises multiple data sources – even spreadsheets or
whatever is available
• Applies queries and calculates consistently and uniformly
• Forms a basis for growth and development
• User access can be implemented in minutes
• Next month just update instead of re-inputting• Next month just update instead of re-inputting
• Quickly clone charts and develop report ready material.
• Complex calcs are easy to input and copy
• Fun once you are up and running (wow your friends and
colleagues)
23

Why this kicks the spreadsheets a@#$$ ….
• Many companies have great ERP however at the end of the
month they spend hours re-capturing info into spreadsheets
– WHAT A WASTE OF TIME !
• Gartner study
• Spreadsheets are far more unstructured
• Underlying queries and data still require secure access
24
• Adding more objects
• QVD files – IT
• Work without disturbing source data
• Quickly add more structure in a relational database way

What about IT department ?
• Develop and then hand over to IT for quality control and
deployment
• User access is so simple compared to any other BI tool I
have seen
• Once you have base model for an area of business you can
continue to grow and expand… nothing is lost
• Looks great and everything relates• Looks great and everything relates
25

What must change ?
• Break free of old rigid reporting formats
• Move to online analytics rather than old fashioned reports
• Ensure buy-in from departments
• Time is money, the higher the quality of information the
better and faster decisions can be made !
26

Questions?
Thank You
Questions?