


Languages
Pages
Legal

www.irena.org
RENEWABLE ENERGY COUNTRY PROFILESCARIBBEAN
September 2012 edition


IRENA Renewable Energy Country Profiles take stock of the latest developments in the field of renewables at country level around the world. Each profile combines analysis by IRENA’s specialists with the latest available country data and additional information from a wide array of sources. The resulting reports provide a brief yet comprehensive picture of the situation with regard to renewable energy, including energy supply, electrical generation and grid capacity, and access. Energy policies, targets and projects are also considered, along with each country’s investment climate and endowment with renewable energy resources.
The energy statistics presented here span the period from 2009 until 2012, reflecting varying timelines in the source material. Since data availability differs from country to country, wider regional comparisons are possible only for the latest year with figures available for every country included. Despite the time lag in some cases, the evident differences and disparities between countries and regions around the world remain striking.
The current package of country profiles is just a starting point. The geographic scope will continue to expand, and existing profiles will be enhanced with new indicators, with the whole series maintained as a live product on the IRENA website (www.irena.org). Your feedback on both the format and the content of these country profiles would be greatly appreciated. Please address any comments to [email protected].


0
3,000
6,000
9,000
12,000
15,000
0
500
1,000
1,500
2,000
2,500
3,000
2010 2009USD
per c
apita
kWh
per c
apita
13,006
Antigua and Barbuda
1,264
Antigua and Barbuda
9,230
2,728
WorldWorld
1,251
CaribbeanCaribbean
4,778
This Country Profile may contain advice, opinions and statements (“information”) of various information providers. The International Renewable Energy Agency does not represent or endorse the accuracy or reliability of any advice, opinion, statement or other information provided by any information provider or any other person or entity. Reliance upon any such information shall be at the user’s own risk. Neither the International Renewable Energy Agency, nor any of their respective agents, employees, information providers or content providers, shall be liable to any user or anyone else for any inac-curacy, error, omission, interruption, deletion, defect, alteration of or use of any content herein, or for its timeliness or completeness, nor shall they be liable for any failure of performance, regardless of cause, or for any damages resulting therefrom. The information contained herein does not necessarily represent the views of the Members of the International Renewable Energy Agency. The designations employed and the presentation of materials herein do not imply the expression of any opinion whatsoever on the part of the Secretariat of the International Renewable Energy Agency concerning the legal status of any country, territory, city or area or of its authorities, or concerning the delimitation of its frontiers or boundaries. The term “country” as used in this material also refers, as appropriate, to territories or areas.
RENEWABLE ENERGY COUNTRY PROFILE
Figure 1: gDP Per caPita For 2010 Figure 2: electricity use Per caPita For 2009
Bahamas
Cuba
Dominican Republic
St. Kitts & Nevis Antigua & Barbuda
Dominica
St.Vincent & the Grenadines
St.LuciaBarbados
Grenada
Trinidad& Tobago
HaitiJamaica
ANTIGUA & BARBUDA 89,000 Population (2010)
13,006 USD GDP per capita (2010) 1.2 billion USD GDP (2010)
ENERGY NATIONAL PROFILE 2009
The Caribbean include Antigua and Barbuda, Bahamas, Barbados, Cuba, Dominica, the Dominican Republic, Grenada, Haiti, Jamaica, Saint Kitts and Nevis, Saint Lucia, Saint Vincent and the Grenadines, and Trinidad and Tobago.
� Total Primary Energy Supply: 6.9 PJ - Of which renewables: 0.0 PJ (0.0%) � Energy self-sufficiency: 0.0% � Fuel imports: 143 million USD (25.6% of total imports) � Electricity generation: 119.0 GWh - Of which renewables: 0.0 GWh (0.0%) � Electricity use per capita: 1,264 kWh � Electrical capacity: 27 MW - Of which renewables: 0.0 MW (0.0%) � Electricity access rate: 100% � Share of population using solid fuels: < 5%
TARGETS: � No information available

antigua and barbuda
Oil100%
Oil100%
IRENA welcomes your comments and feedback at [email protected]
POLICIES IN PLACE TO PROMOTE RENEWABLE ENERGY SINCE THE RIO CONFERENCE OF 1992
RENEWABLE ENERGY PROJECTS FROM THE GOVERNMENT AND PRIVATE SECTORS (CAPACITY ADDITIONS): � No information available
WORLD BANK EASE OF DOING BUSINESS INDEX FOR 2012: Ranked 57 out of 183
NUMBER OF REGISTERED CLEAN DEVELOPMENT MECHANISM PROJECTS FOCUSING ON RENEWABLE ENERGY: 0
RENEWABLE ENERGY RESOURCES:
Wind Solar Hydro Biomass Geothermal Ocean
High Medium Low Unknown Not applicable
2009
Draft NatioNal
ENErgy Policy
submittED
2010
ratifiED thE
irENa statutE
NatioNal ENErgy
task forcE
EstablishED
Figure 3: ToTal Primary energy SuPPly* in 2000 and 2009
*excluding electricity trade 2000: 5.1 PJ 2009: 6.9 PJ
2010
Note: The information on resources should be taken as an indication only. It refers to a general trend of available resources, and does not prejudge the feasibility of individual projects. The thresholds are indicative, and do not refer to any technological choice. The analysis is based on the literature.
Sources: Population and GDP: World Bank; Energy data: IEA, IRENA analysis based on UN data; Share of fuel imports in total imports: World Trade Organisation; Electrical capacity: IEA, EIA; Electricity access rate: World Energy Outlook 2011 database (IEA); Share of population using solid fuels: World Health Organisation; Targets: REN21, IRENA; Policy/legislation: IEA, Reegle, IRENA research; Ease of doing business index: World Bank; Renewable energy projects: Bloomberg New Energy Finance, IRENA research; Clean Development Mechanism projects: UNFCCC; Renewable energy resources: IRENA analysis
Units: USD: United States dollar; kWh: kilowatt-hour; GWh: gigawatt-hour (1 GWh=106 kWh); TWh: terawatt-hour (1 TWh=103 GWh); PJ: petajoule; MW: megawatt; GW: gigawatt (1 GW=103 MW). Please also refer to the glossary for explanations on the terms used in the country profile.
0
5,000
10,000
15,000
20,000
25,000
0
1,000
2,000
3,000
4,000
5,000
6,000
2010 2009USD
per c
apita
kWh
per c
apita
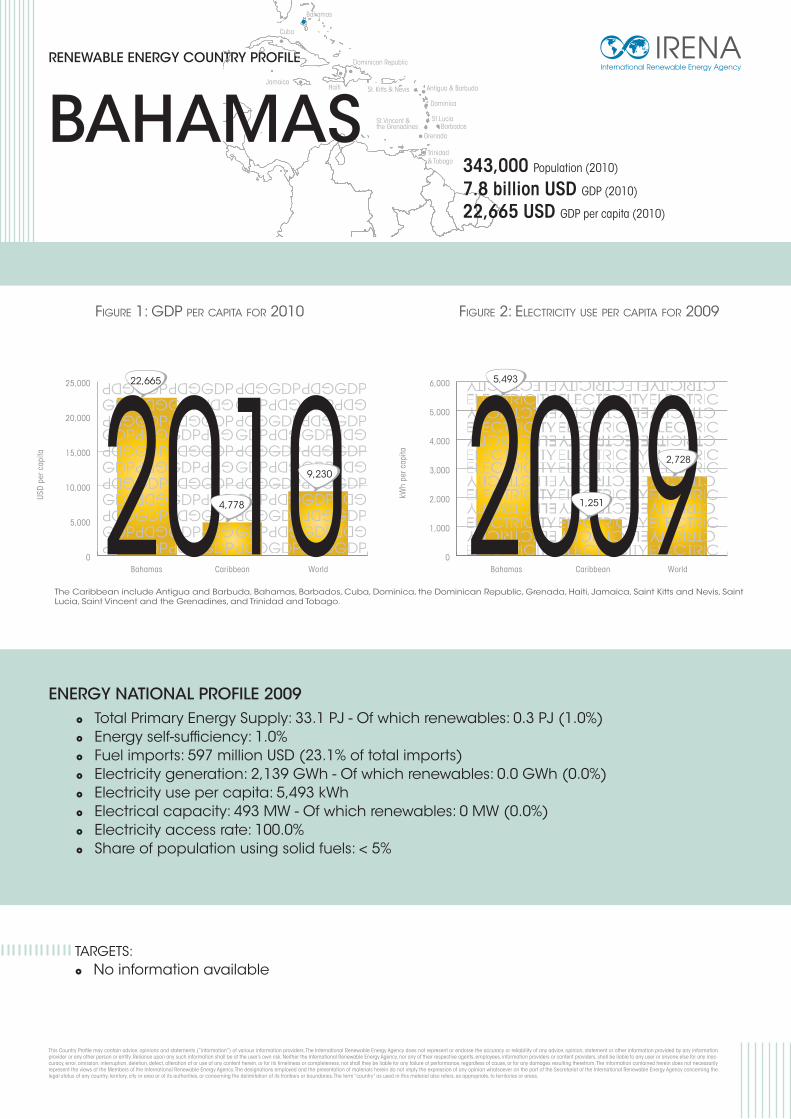
22,665
Bahamas
5,493
Bahamas
9,2302,728
WorldWorld
1,251
CaribbeanCaribbean
4,778
This Country Profile may contain advice, opinions and statements (“information”) of various information providers. The International Renewable Energy Agency does not represent or endorse the accuracy or reliability of any advice, opinion, statement or other information provided by any information provider or any other person or entity. Reliance upon any such information shall be at the user’s own risk. Neither the International Renewable Energy Agency, nor any of their respective agents, employees, information providers or content providers, shall be liable to any user or anyone else for any inac-curacy, error, omission, interruption, deletion, defect, alteration of or use of any content herein, or for its timeliness or completeness, nor shall they be liable for any failure of performance, regardless of cause, or for any damages resulting therefrom. The information contained herein does not necessarily represent the views of the Members of the International Renewable Energy Agency. The designations employed and the presentation of materials herein do not imply the expression of any opinion whatsoever on the part of the Secretariat of the International Renewable Energy Agency concerning the legal status of any country, territory, city or area or of its authorities, or concerning the delimitation of its frontiers or boundaries. The term “country” as used in this material also refers, as appropriate, to territories or areas.
RENEWABLE ENERGY COUNTRY PROFILE
Figure 1: gDP Per caPita For 2010 Figure 2: electricity use Per caPita For 2009
Bahamas
Cuba
Dominican Republic
St. Kitts & Nevis Antigua & Barbuda
Dominica
St.Vincent & the Grenadines
St.LuciaBarbados
Grenada
Trinidad& Tobago
HaitiJamaica
BAHAMAS343,000 Population (2010)
22,665 USD GDP per capita (2010) 7.8 billion USD GDP (2010)
ENERGY NATIONAL PROFILE 2009
The Caribbean include Antigua and Barbuda, Bahamas, Barbados, Cuba, Dominica, the Dominican Republic, Grenada, Haiti, Jamaica, Saint Kitts and Nevis, Saint Lucia, Saint Vincent and the Grenadines, and Trinidad and Tobago.
� Total Primary Energy Supply: 33.1 PJ - Of which renewables: 0.3 PJ (1.0%) � Energy self-sufficiency: 1.0% � Fuel imports: 597 million USD (23.1% of total imports) � Electricity generation: 2,139 GWh - Of which renewables: 0.0 GWh (0.0%) � Electricity use per capita: 5,493 kWh � Electrical capacity: 493 MW - Of which renewables: 0 MW (0.0%) � Electricity access rate: 100.0% � Share of population using solid fuels: < 5%
TARGETS: � No information available

bahamas
Oil99%
Solidbiofuels
1%
Solidbiofuels
1%
Coaland peat
0.4%
Oil99%
Coaland peat
0.2%
IRENA welcomes your comments and feedback at [email protected]
POLICIES IN PLACE TO PROMOTE RENEWABLE ENERGY SINCE THE RIO CONFERENCE OF 1992
RENEWABLE ENERGY PROJECTS FROM THE GOVERNMENT AND PRIVATE SECTORS: � 1 MW of wind capacity addition announced (1 project)
WORLD BANK EASE OF DOING BUSINESS INDEX FOR 2012: Ranked 85 out of 183
NUMBER OF REGISTERED CLEAN DEVELOPMENT MECHANISM PROJECTS FOCUSING ON RENEWABLE ENERGY: 0
RENEWABLE ENERGY RESOURCES:
Wind Solar Hydro Biomass Geothermal Ocean
High Medium Low Unknown Not applicable
2008
NatioNal
ENErgy
VisioN
2011
NatioNal
ENErgy
Policy
Note: The information on resources should be taken as an indication only. It refers to a general trend of available resources, and does not prejudge the feasibility of individual projects. The thresholds are indicative, and do not refer to any technological choice. The analysis is based on the literature.
Sources: Population and GDP: World Bank; Energy data: IEA, IRENA analysis based on UN data; Share of fuel imports in total imports: World Trade Organisation; Electrical capacity: IEA, EIA; Electricity access rate: World Energy Outlook 2011 database (IEA); Share of population using solid fuels: World Health Organisation; Targets: REN21, IRENA; Policy/legislation: IEA, Reegle, IRENA research; Ease of doing business index: World Bank; Renewable energy projects: Bloomberg New Energy Finance, IRENA research; Clean Development Mechanism projects: UNFCCC; Renewable energy resources: IRENA analysis
Units: USD: United States dollar; kWh: kilowatt-hour; GWh: gigawatt-hour (1 GWh=106 kWh); TWh: terawatt-hour (1 TWh=103 GWh); PJ: petajoule; MW: megawatt; GW: gigawatt (1 GW=103 MW). Please also refer to the glossary for explanations on the terms used in the country profile.
Figure 3: ToTal Primary energy SuPPly* in 2000 and 2009
*excluding electricity trade
2000: 28.3 PJ 2009: 33.1 PJ
0
5,000
10,000
15,000
20,000
0
500
1,000
1,500
2,000
2,500
3,000
3,500
2010 2009USD
per c
apita
kWh
per c
apita
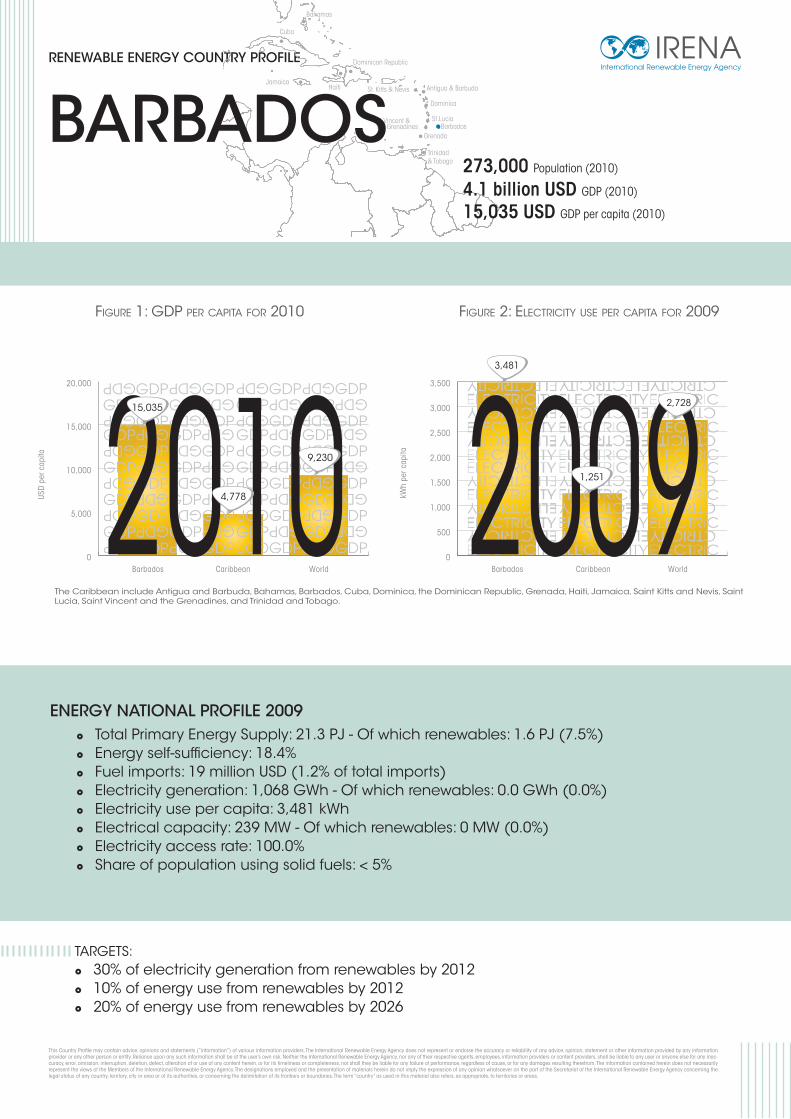
15,035
Barbados
3,481
Barbados
9,230
2,728
WorldWorld
1,251
CaribbeanCaribbean
4,778
This Country Profile may contain advice, opinions and statements (“information”) of various information providers. The International Renewable Energy Agency does not represent or endorse the accuracy or reliability of any advice, opinion, statement or other information provided by any information provider or any other person or entity. Reliance upon any such information shall be at the user’s own risk. Neither the International Renewable Energy Agency, nor any of their respective agents, employees, information providers or content providers, shall be liable to any user or anyone else for any inac-curacy, error, omission, interruption, deletion, defect, alteration of or use of any content herein, or for its timeliness or completeness, nor shall they be liable for any failure of performance, regardless of cause, or for any damages resulting therefrom. The information contained herein does not necessarily represent the views of the Members of the International Renewable Energy Agency. The designations employed and the presentation of materials herein do not imply the expression of any opinion whatsoever on the part of the Secretariat of the International Renewable Energy Agency concerning the legal status of any country, territory, city or area or of its authorities, or concerning the delimitation of its frontiers or boundaries. The term “country” as used in this material also refers, as appropriate, to territories or areas.
RENEWABLE ENERGY COUNTRY PROFILE
Figure 1: gDP Per caPita For 2010 Figure 2: electricity use Per caPita For 2009
Bahamas
Cuba
Dominican Republic
St. Kitts & Nevis Antigua & Barbuda
Dominica
St.Vincent & the Grenadines
St.LuciaBarbados
Grenada
Trinidad& Tobago
HaitiJamaica
BARBADOS273,000 Population (2010)
15,035 USD GDP per capita (2010) 4.1 billion USD GDP (2010)
� Total Primary Energy Supply: 21.3 PJ - Of which renewables: 1.6 PJ (7.5%) � Energy self-sufficiency: 18.4% � Fuel imports: 19 million USD (1.2% of total imports) � Electricity generation: 1,068 GWh - Of which renewables: 0.0 GWh (0.0%) � Electricity use per capita: 3,481 kWh � Electrical capacity: 239 MW - Of which renewables: 0 MW (0.0%) � Electricity access rate: 100.0% � Share of population using solid fuels: < 5%
ENERGY NATIONAL PROFILE 2009
TARGETS: � 30% of electricity generation from renewables by 2012 � 10% of energy use from renewables by 2012 � 20% of energy use from renewables by 2026
The Caribbean include Antigua and Barbuda, Bahamas, Barbados, Cuba, Dominica, the Dominican Republic, Grenada, Haiti, Jamaica, Saint Kitts and Nevis, Saint Lucia, Saint Vincent and the Grenadines, and Trinidad and Tobago.

Barbados
Oil 81%
Naturalgas8%
Solidbiofuels
9%
Solar2%
Solar2%
Oil89%
Naturalgas3%
Solidbiofuels
6%
IRENA welcomes your comments and feedback at [email protected]
POLICIES IN PLACE TO PROMOTE RENEWABLE ENERGY SINCE THE RIO CONFERENCE OF 1992
RENEWABLE ENERGY PROJECTS FROM THE GOVERNMENT AND PRIVATE SECTORS: � 10 MW of wind capacity addition announced (1 project)
WORLD BANK EASE OF DOING BUSINESS INDEX FOR 2012: Not ranked
NUMBER OF REGISTERED CLEAN DEVELOPMENT MECHANISM PROJECTS FOCUSING ON RENEWABLE ENERGY: 0
RENEWABLE ENERGY RESOURCES:
Wind Solar Hydro Biomass Geothermal Ocean
High Medium Low Unknown Not applicable
1996
tax DEDuctioNs for
solar watEr hEatErs
rEiNstatED
2009
sustaiNablE EN-
Ergy framEwork
for barbaDos
NatioNal
ENErgy
Policy
2007
Note: The information on resources should be taken as an indication only. It refers to a general trend of available resources, and does not pre-judge the feasibility of individual projects. The thresholds are indicative, and do not refer to any technological choice. The analysis is based on the literature.
Sources: Population and GDP: World Bank; Energy data: IEA, IRENA analysis based on UN data; Share of fuel imports in total imports: World Trade Organisation; Electrical capacity: IEA, EIA; Electricity access rate: World Energy Outlook 2011 database (IEA); Share of population using solid fuels: World Health Organisation; Targets: REN21, IRENA; Policy/legislation: IEA, Reegle, IRENA research; Ease of doing business index: World Bank; Renewable energy projects: Bloomberg New Energy Finance, IRENA research; Clean Development Mechanism projects: UNFCCC; Renewable energy resources: IRENA analysis
Units: USD: United States dollar; kWh: kilowatt-hour; GWh: gigawatt-hour (1 GWh=106 kWh); TWh: terawatt-hour (1 TWh=103 GWh); PJ: petajoule; MW: megawatt; GW: gigawatt (1 GW=103 MW). Please also refer to the glossary for explanations on the terms used in the country profile.
Figure 3: ToTal Primary energy SuPPly* in 2000 and 2009
*excluding electricity trade
2000: 16.7 PJ 2009: 21.3 PJ

0
2,000
4,000
6,000
8,000
10,000
0
500
1,000
1,500
2,000
2,500
3,000
2010 2009USD
per c
apita
kWh
per c
apita
5,704
Cuba
1,348
Cuba
9,230 2,728
WorldWorld
1,251
CaribbeanCaribbean
4,778
This Country Profile may contain advice, opinions and statements (“information”) of various information providers. The International Renewable Energy Agency does not represent or endorse the accuracy or reliability of any advice, opinion, statement or other information provided by any information provider or any other person or entity. Reliance upon any such information shall be at the user’s own risk. Neither the International Renewable Energy Agency, nor any of their respective agents, employees, information providers or content providers, shall be liable to any user or anyone else for any inac-curacy, error, omission, interruption, deletion, defect, alteration of or use of any content herein, or for its timeliness or completeness, nor shall they be liable for any failure of performance, regardless of cause, or for any damages resulting therefrom. The information contained herein does not necessarily represent the views of the Members of the International Renewable Energy Agency. The designations employed and the presentation of materials herein do not imply the expression of any opinion whatsoever on the part of the Secretariat of the International Renewable Energy Agency concerning the legal status of any country, territory, city or area or of its authorities, or concerning the delimitation of its frontiers or boundaries. The term “country” as used in this material also refers, as appropriate, to territories or areas.
RENEWABLE ENERGY COUNTRY PROFILE
Figure 1: gDP Per caPita For 2010 Figure 2: electricity use Per caPita For 2009
Bahamas
Cuba
Dominican Republic
St. Kitts & Nevis Antigua & Barbuda
Dominica
St.Vincent & the Grenadines
St.LuciaBarbados
Grenada
Trinidad& Tobago
HaitiJamaica
CUBA11.3 million Population (2010)
5,704 USD GDP per capita (2010) 64.2 billion USD GDP (2010)
ENERGY NATIONAL PROFILE 2009
The Caribbean include Antigua and Barbuda, Bahamas, Barbados, Cuba, Dominica, the Dominican Republic, Grenada, Haiti, Jamaica, Saint Kitts and Nevis, Saint Lucia, Saint Vincent and the Grenadines, and Trinidad and Tobago.
� Total Primary Energy Supply: 481.7 PJ - Of which renewables: 76.6 PJ (15.9%) � Energy self-sufficiency: 48.4% � Fuel imports: Not available � Electricity generation: 17.7 TWh - Of which renewables: 672.0 GWh (3.8%) � Electricity use per capita: 1,348 kWh � Electrical capacity: 5.5 GW - Of which renewables: 65 MW (1.2%) � Electricity access rate: 97.0% � Share of population using solid fuels: 5%
TARGETS: � No information available

Cuba
Coaland peat
0.2%Oil
62%
Naturalgas3%
Solidbiofuels
22%
Coaland peat
0.2%Oil
76%
Hydro0.1%
Hydro0.1%
Naturalgas8%
Solidbiofuels
11%
Liquidbiofuels
5%Liquid
biofuels12%
IRENA welcomes your comments and feedback at [email protected]
POLICIES IN PLACE TO PROMOTE RENEWABLE ENERGY SINCE THE RIO CONFERENCE OF 1992
RENEWABLE ENERGY PROJECTS FROM THE GOVERNMENT AND PRIVATE SECTORS: � 10 MW of biomass-fired capacity addition announced (1 project)
WORLD BANK EASE OF DOING BUSINESS INDEX FOR 2012: Not ranked
NUMBER OF REGISTERED CLEAN DEVELOPMENT MECHANISM PROJECTS FOCUSING ON RENEWABLE ENERGY: 1
RENEWABLE ENERGY RESOURCES:
Wind Solar Hydro Biomass Geothermal Ocean
High Medium Low Unknown Not applicable
Figure 3: ToTal Primary energy SuPPly* in 2000 and 2009
*excluding electricity trade 2000: 564.9 PJ 2009: 481.7 PJ
ENErgy
rEVolutioN
cENtral
grouP of
rENEwablE
ENErgiEs aND
ENErgy
EfficiENcy
crEatED
ratifiED
thE irENa
statutE
201220072006
Note: The information on resources should be taken as an indication only. It refers to a general trend of available resources, and does not prejudge the feasibility of individual projects. The thresholds are indicative, and do not refer to any technological choice. The analysis is based on the literature.
Sources: Population and GDP: World Bank; Energy data: IEA, IRENA analysis based on UN data; Share of fuel imports in total imports: World Trade Organisation; Electrical capacity: IEA, EIA; Electricity access rate: World Energy Outlook 2011 database (IEA); Share of population using solid fuels: World Health Organisation; Targets: REN21, IRENA; Policy/legislation: IEA, Reegle, IRENA research; Ease of doing business index: World Bank; Renewable energy projects: Bloomberg New Energy Finance, IRENA research; Clean Development Mechanism projects: UNFCCC; Renewable energy resources: IRENA analysis
Units: USD: United States dollar; kWh: kilowatt-hour; GWh: gigawatt-hour (1 GWh=106 kWh); TWh: terawatt-hour (1 TWh=103 GWh); PJ: petajoule; MW: megawatt; GW: gigawatt (1 GW=103 MW). Please also refer to the glossary for explanations on the terms used in the country profile.

0
2,000
4,000
6,000
8,000
10,000
0
500
1,000
1,500
2,000
2,500
3,000
2010 2009USD
per c
apita
kWh
per c
apita
6,964
Dominica
1,229
Dominica
9,230 2,728
WorldWorld
1,251
CaribbeanCaribbean
4,778
This Country Profile may contain advice, opinions and statements (“information”) of various information providers. The International Renewable Energy Agency does not represent or endorse the accuracy or reliability of any advice, opinion, statement or other information provided by any information provider or any other person or entity. Reliance upon any such information shall be at the user’s own risk. Neither the International Renewable Energy Agency, nor any of their respective agents, employees, information providers or content providers, shall be liable to any user or anyone else for any inac-curacy, error, omission, interruption, deletion, defect, alteration of or use of any content herein, or for its timeliness or completeness, nor shall they be liable for any failure of performance, regardless of cause, or for any damages resulting therefrom. The information contained herein does not necessarily represent the views of the Members of the International Renewable Energy Agency. The designations employed and the presentation of materials herein do not imply the expression of any opinion whatsoever on the part of the Secretariat of the International Renewable Energy Agency concerning the legal status of any country, territory, city or area or of its authorities, or concerning the delimitation of its frontiers or boundaries. The term “country” as used in this material also refers, as appropriate, to territories or areas.
RENEWABLE ENERGY COUNTRY PROFILE
Figure 1: gDP Per caPita For 2010 Figure 2: electricity use Per caPita For 2009
Bahamas
Cuba
Dominican Republic
St. Kitts & Nevis Antigua & Barbuda
Dominica
St.Vincent & the Grenadines
St.LuciaBarbados
Grenada
Trinidad& Tobago
HaitiJamaica
DOMINICA68,000 Population (2010)
6,964 USD GDP per capita (2010) 472 million USD GDP (2010)
ENERGY NATIONAL PROFILE 2009
The Caribbean include Antigua and Barbuda, Bahamas, Barbados, Cuba, Dominica, the Dominican Republic, Grenada, Haiti, Jamaica, Saint Kitts and Nevis, Saint Lucia, Saint Vincent and the Grenadines, and Trinidad and Tobago.
� Total Primary Energy Supply: 2.0 PJ - Of which renewables: 0.2 PJ (8.3%) � Energy self-sufficiency: 8.3% � Fuel imports: 41 million USD (17.2% of total imports) � Electricity generation: 92.7 GWh - Of which renewables: 23.2 GWh (25.0%) � Electricity use per capita: 1,229 kWh � Electrical capacity: 24.3 MW - Of which renewables: 4.8 MW (19.8%) � Electricity access rate: > 90% � Share of population using solid fuels: Not available
TARGETS: � No information available

Dominicana
Oil89%
Hydro6%
Solidbiofuels
5%Oil
92%
Hydro4%
Solidbiofuels
4%
IRENA welcomes your comments and feedback at [email protected]
POLICIES IN PLACE TO PROMOTE RENEWABLE ENERGY SINCE THE RIO CONFERENCE OF 1992
RENEWABLE ENERGY PROJECTS FROM THE GOVERNMENT AND PRIVATE SECTORS: � No information available
WORLD BANK EASE OF DOING BUSINESS INDEX FOR 2012: Ranked 65 out of 183
NUMBER OF REGISTERED CLEAN DEVELOPMENT MECHANISM PROJECTS FOCUSING ON RENEWABLE ENERGY: 0
RENEWABLE ENERGY RESOURCES:
Wind Solar Hydro Biomass Geothermal Ocean
High Medium Low Unknown Not applicable
Figure 3: ToTal Primary energy SuPPly* in 2000 and 2009
*excluding electricity trade 2000: 1.9 PJ 2009: 2.0 PJ
2003
sustaiNablE
ENErgy PlaN
PrEParED
ElEctricity suPPly
act amENDED
NatioNal ENErgy
Policy DraftED
20092006
Note: The information on resources should be taken as an indication only. It refers to a general trend of available resources, and does not prejudge the feasibility of individual projects. The thresholds are indicative, and do not refer to any technological choice. The analysis is based on the literature.
Sources: Population and GDP: World Bank; Energy data: IEA, IRENA analysis based on UN data; Share of fuel imports in total imports: World Trade Organisation; Electrical capacity: IEA, EIA; Electricity access rate: World Energy Outlook 2011 database (IEA); Share of population using solid fuels: World Health Organisation; Targets: REN21, IRENA; Policy/legislation: IEA, Reegle, IRENA research; Ease of doing business index: World Bank; Renewable energy projects: Bloomberg New Energy Finance, IRENA research; Clean Development Mechanism projects: UNFCCC; Renewable energy resources: IRENA analysis
Units: USD: United States dollar; kWh: kilowatt-hour; GWh: gigawatt-hour (1 GWh=106 kWh); TWh: terawatt-hour (1 TWh=103 GWh); PJ: petajoule; MW: megawatt; GW: gigawatt (1 GW=103 MW). Please also refer to the glossary for explanations on the terms used in the country profile.
0
2,000
4,000
6,000
8,000
10,000
0
500
1,000
1,500
2,000
2,500
3,000
2010 2009USD
per c
apita
kWh
per c
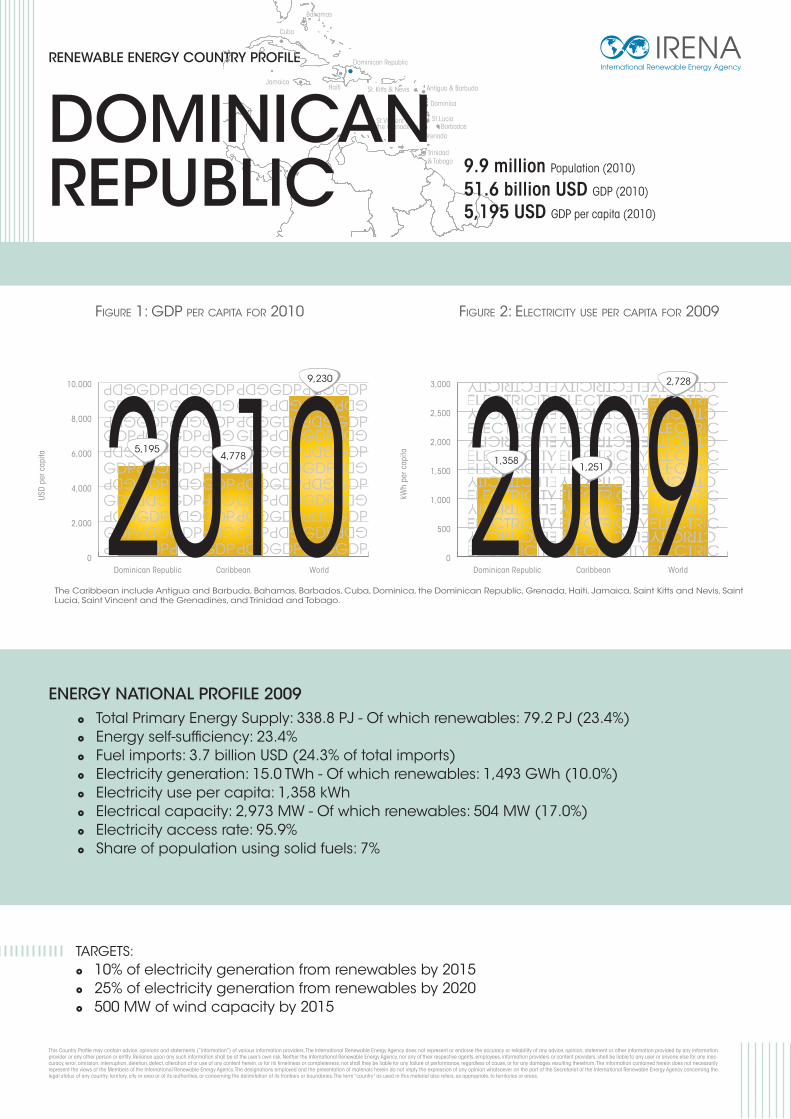
apita 5,195
Dominican Republic
1,358
Dominican Republic
9,230 2,728
WorldWorld
1,251
CaribbeanCaribbean
4,778
This Country Profile may contain advice, opinions and statements (“information”) of various information providers. The International Renewable Energy Agency does not represent or endorse the accuracy or reliability of any advice, opinion, statement or other information provided by any information provider or any other person or entity. Reliance upon any such information shall be at the user’s own risk. Neither the International Renewable Energy Agency, nor any of their respective agents, employees, information providers or content providers, shall be liable to any user or anyone else for any inac-curacy, error, omission, interruption, deletion, defect, alteration of or use of any content herein, or for its timeliness or completeness, nor shall they be liable for any failure of performance, regardless of cause, or for any damages resulting therefrom. The information contained herein does not necessarily represent the views of the Members of the International Renewable Energy Agency. The designations employed and the presentation of materials herein do not imply the expression of any opinion whatsoever on the part of the Secretariat of the International Renewable Energy Agency concerning the legal status of any country, territory, city or area or of its authorities, or concerning the delimitation of its frontiers or boundaries. The term “country” as used in this material also refers, as appropriate, to territories or areas.
RENEWABLE ENERGY COUNTRY PROFILE
Figure 1: gDP Per caPita For 2010 Figure 2: electricity use Per caPita For 2009
Bahamas
Cuba
Dominican Republic
St. Kitts & Nevis Antigua & Barbuda
Dominica
St.Vincent & the Grenadines
St.LuciaBarbados
Grenada
Trinidad& Tobago
HaitiJamaica
DOMINICANREPUBLIC 9.9 million Population (2010)
5,195 USD GDP per capita (2010) 51.6 billion USD GDP (2010)
ENERGY NATIONAL PROFILE 2009
The Caribbean include Antigua and Barbuda, Bahamas, Barbados, Cuba, Dominica, the Dominican Republic, Grenada, Haiti, Jamaica, Saint Kitts and Nevis, Saint Lucia, Saint Vincent and the Grenadines, and Trinidad and Tobago.
� Total Primary Energy Supply: 338.8 PJ - Of which renewables: 79.2 PJ (23.4%) � Energy self-sufficiency: 23.4% � Fuel imports: 3.7 billion USD (24.3% of total imports) � Electricity generation: 15.0 TWh - Of which renewables: 1,493 GWh (10.0%) � Electricity use per capita: 1,358 kWh � Electrical capacity: 2,973 MW - Of which renewables: 504 MW (17.0%) � Electricity access rate: 95.9% � Share of population using solid fuels: 7%
TARGETS: � 10% of electricity generation from renewables by 2015 � 25% of electricity generation from renewables by 2020 � 500 MW of wind capacity by 2015

dominican republic
Coaland peat
1%
Oil81%
Hydro1%
Solidbiofuels
17%
Coaland peat
7%
Oil65%
Naturalgas5%
Hydro2%
Solidbiofuels
22%
IRENA welcomes your comments and feedback at [email protected]
POLICIES IN PLACE TO PROMOTE RENEWABLE ENERGY SINCE THE RIO CONFERENCE OF 1992
RENEWABLE ENERGY PROJECTS FROM THE GOVERNMENT AND PRIVATE SECTORS: � 379 million litres of ethanol per year capacition addition by the end of 2012 (1 project) � About 170 million litres of ethanol per year capacition addition announced (2 projects) � 20 MW of solar photovoltaic capacity addition announced (1 project) � About 400 MW of wind capacity addition announced (8 projects)
WORLD BANK EASE OF DOING BUSINESS INDEX FOR 2012: Ranked 108 out of 183
NUMBER OF REGISTERED CLEAN DEVELOPMENT MECHANISM PROJECTS FOCUSING ON RENEWABLE ENERGY: 2
RENEWABLE ENERGY RESOURCES:
Wind Solar Hydro Biomass Geothermal Ocean
High Medium Low Unknown Not applicable
Figure 3: ToTal Primary energy SuPPly* in 2000 and 2009
*excluding electricity trade
2000: 326.8 PJ 2009: 338.8 PJ
NatioNal
ENErgy PlaN
2004-2015
DEcrEE 202-08
imPlEmENtiNg
law 57-07
gENEral
ElEctricity act
rENEwablE
ENErgiEs
iNcENtiVE
law 57-07
ratifiED
thE irENa
statutE
DEcrEE 566-05
oN liquiD
biofuEls
blENDiNg
20052004 2008 20102001 2007
Note: The information on resources should be taken as an indication only. It refers to a general trend of available resources, and does not pre-judge the feasibility of individual projects. The thresholds are indicative, and do not refer to any technological choice. The analysis is based on the literature.
Sources: Population and GDP: World Bank; Energy data: IEA, IRENA analysis based on UN data; Share of fuel imports in total imports: World Trade Organisation; Electrical capacity: IEA, EIA; Electricity access rate: World Energy Outlook 2011 database (IEA); Share of population using solid fuels: World Health Organisation; Targets: REN21, IRENA; Policy/legislation: IEA, Reegle, IRENA research; Ease of doing business index: World Bank; Renewable energy projects: Bloomberg New Energy Finance, IRENA research; Clean Development Mechanism projects: UNFCCC; Renewable energy resources: IRENA analysis
Units: USD: United States dollar; kWh: kilowatt-hour; GWh: gigawatt-hour (1 GWh=106 kWh); TWh: terawatt-hour (1 TWh=103 GWh); PJ: petajoule; MW: megawatt; GW: gigawatt (1 GW=103 MW). Please also refer to the glossary for explanations on the terms used in the country profile.

0
2,000
4,000
6,000
8,000
10,000
0
500
1,000
1,500
2,000
2,500
3,000
2010 2009USD
per c
apita
kWh
per c
apita
7,500
Grenada
1,777
Grenada
9,230 2,728
WorldWorld
1,251
CaribbeanCaribbean
4,778
This Country Profile may contain advice, opinions and statements (“information”) of various information providers. The International Renewable Energy Agency does not represent or endorse the accuracy or reliability of any advice, opinion, statement or other information provided by any information provider or any other person or entity. Reliance upon any such information shall be at the user’s own risk. Neither the International Renewable Energy Agency, nor any of their respective agents, employees, information providers or content providers, shall be liable to any user or anyone else for any inac-curacy, error, omission, interruption, deletion, defect, alteration of or use of any content herein, or for its timeliness or completeness, nor shall they be liable for any failure of performance, regardless of cause, or for any damages resulting therefrom. The information contained herein does not necessarily represent the views of the Members of the International Renewable Energy Agency. The designations employed and the presentation of materials herein do not imply the expression of any opinion whatsoever on the part of the Secretariat of the International Renewable Energy Agency concerning the legal status of any country, territory, city or area or of its authorities, or concerning the delimitation of its frontiers or boundaries. The term “country” as used in this material also refers, as appropriate, to territories or areas.
RENEWABLE ENERGY COUNTRY PROFILE
Figure 1: gDP Per caPita For 2010 Figure 2: electricity use Per caPita For 2009
Bahamas
Cuba
Dominican Republic
St. Kitts & Nevis Antigua & Barbuda
Dominica
St.Vincent & the Grenadines
St.LuciaBarbados
Grenada
Trinidad& Tobago
HaitiJamaica
GRENADA104,000 Population (2010)
7,500 USD GDP per capita (2010) 784 million USD GDP (2010)
The Caribbean include Antigua and Barbuda, Bahamas, Barbados, Cuba, Dominica, the Dominican Republic, Grenada, Haiti, Jamaica, Saint Kitts and Nevis, Saint Lucia, Saint Vincent and the Grenadines, and Trinidad and Tobago.
� Total Primary Energy Supply: 4.2 PJ - Of which renewables: 0.3 PJ (6.7%) � Energy self-sufficiency: 6.7% � Fuel imports: 42 million USD (14.5% of total imports) � Electricity generation: 203.0 GWh - Of which renewables: 0.0 GWh (0.0%) � Electricity use per capita: 1,777 kWh � Electrical capacity: 33.2 MW - Of which renewables: 0.0 MW (0.0%) � Electricity access rate: 99.5% � Share of population using solid fuels: Not available
ENERGY NATIONAL PROFILE 2009
TARGETS: � 20% of electricity generation and transport energy from renewables by 2020

grenada
Oil92%
Solidbiofuels
8%Oil
93%
Solidbiofuels
7%
Solar0.002%
IRENA welcomes your comments and feedback at [email protected]
POLICIES IN PLACE TO PROMOTE RENEWABLE ENERGY SINCE THE RIO CONFERENCE OF 1992
RENEWABLE ENERGY PROJECTS FROM THE GOVERNMENT AND PRIVATE SECTORS: � No information available
WORLD BANK EASE OF DOING BUSINESS INDEX FOR 2012: Ranked 73 out of 183
NUMBER OF REGISTERED CLEAN DEVELOPMENT MECHANISM PROJECTS FOCUSING ON RENEWABLE ENERGY: 0
RENEWABLE ENERGY RESOURCES:
Wind Solar Hydro Biomass Geothermal Ocean
High Medium Low Unknown Not applicable
2003
sustaiNablE ENErgy
PlaN PrEParED
ENErgy Policy
DraftED
2009
NatioNal ENErgy
Policy aPProVED by
cabiNEt
2011
ratifiED thE irENa
statutE
2011
Note: The information on resources should be taken as an indication only. It refers to a general trend of available resources, and does not pre-judge the feasibility of individual projects. The thresholds are indicative, and do not refer to any technological choice. The analysis is based on the literature.
Sources: Population and GDP: World Bank; Energy data: IEA, IRENA analysis based on UN data; Share of fuel imports in total imports: World Trade Organisation; Electrical capacity: IEA, EIA; Electricity access rate: World Energy Outlook 2011 database (IEA); Share of population using solid fuels: World Health Organisation; Targets: REN21, IRENA; Policy/legislation: IEA, Reegle, IRENA research; Ease of doing business index: World Bank; Renewable energy projects: Bloomberg New Energy Finance, IRENA research; Clean Development Mechanism projects: UNFCCC; Renewable energy resources: IRENA analysis
Units: USD: United States dollar; kWh: kilowatt-hour; GWh: gigawatt-hour (1 GWh=106 kWh); TWh: terawatt-hour (1 TWh=103 GWh); PJ: petajoule; MW: megawatt; GW: gigawatt (1 GW=103 MW). Please also refer to the glossary for explanations on the terms used in the country profile.
Figure 3: ToTal Primary energy SuPPly* in 2000 and 2009
*excluding electricity trade
2000: 3.0 PJ 2009: 4.2 PJ

0
2,000
4,000
6,000
8,000
10,000
0
500
1,000
1,500
2,000
2,500
3,000
2010 2009USD
per c
apita
kWh
per c
apita
664
Haiti
36
Haiti
9,230 2,728
WorldWorld
1,251
CaribbeanCaribbean
4,778
This Country Profile may contain advice, opinions and statements (“information”) of various information providers. The International Renewable Energy Agency does not represent or endorse the accuracy or reliability of any advice, opinion, statement or other information provided by any information provider or any other person or entity. Reliance upon any such information shall be at the user’s own risk. Neither the International Renewable Energy Agency, nor any of their respective agents, employees, information providers or content providers, shall be liable to any user or anyone else for any inac-curacy, error, omission, interruption, deletion, defect, alteration of or use of any content herein, or for its timeliness or completeness, nor shall they be liable for any failure of performance, regardless of cause, or for any damages resulting therefrom. The information contained herein does not necessarily represent the views of the Members of the International Renewable Energy Agency. The designations employed and the presentation of materials herein do not imply the expression of any opinion whatsoever on the part of the Secretariat of the International Renewable Energy Agency concerning the legal status of any country, territory, city or area or of its authorities, or concerning the delimitation of its frontiers or boundaries. The term “country” as used in this material also refers, as appropriate, to territories or areas.
RENEWABLE ENERGY COUNTRY PROFILE
Figure 1: gDP Per caPita For 2010 Figure 2: electricity use Per caPita For 2009
Bahamas
Cuba
Dominican Republic
St. Kitts & Nevis Antigua & Barbuda
Dominica
St.Vincent & the Grenadines
St.LuciaBarbados
Grenada
Trinidad& Tobago
HaitiJamaica
HAITI10.0 million Population (2010)
664 USD GDP per capita (2010) 6.6 billion USD GDP (2010)
The Caribbean include Antigua and Barbuda, Bahamas, Barbados, Cuba, Dominica, the Dominican Republic, Grenada, Haiti, Jamaica, Saint Kitts and Nevis, Saint Lucia, Saint Vincent and the Grenadines, and Trinidad and Tobago.
� Total Primary Energy Supply: 108.7 PJ - Of which renewables: 78.2 PJ (71.9%) � Energy self-sufficiency: 71.9% � Fuel imports: 450 million USD (14.3% of total imports) � Electricity generation: 721.0 GWh - Of which renewables: 207.0 GWh (28.7%) � Electricity use per capita: 36 kWh � Electrical capacity: 240 MW - Of which renewables: 62 MW (25.8%) � Electricity access rate: 38.5% � Share of population using solid fuels: 93%
ENERGY NATIONAL PROFILE 2009
TARGETS: � No information available

IRENA welcomes your comments and feedback at [email protected]
POLICIES IN PLACE TO PROMOTE RENEWABLE ENERGY SINCE THE RIO CONFERENCE OF 1992
RENEWABLE ENERGY PROJECTS FROM THE GOVERNMENT AND PRIVATE SECTORS: � 32 MW of small hydro capacity addition announced (1 project) � 20 MW of wind capacity addition announced (1 project)
WORLD BANK EASE OF DOING BUSINESS INDEX FOR 2012: Ranked 174 out of 183
NUMBER OF REGISTERED CLEAN DEVELOPMENT MECHANISM PROJECTS FOCUSING ON RENEWABLE ENERGY: 0
RENEWABLE ENERGY RESOURCES:
Wind Solar Hydro Biomass Geothermal Ocean
High Medium Low Unknown Not applicable
2008
Draft
ENErgy Policy
Note: The information on resources should be taken as an indication only. It refers to a general trend of available resources, and does not prejudge the feasibility of individual projects. The thresholds are indicative, and do not refer to any technological choice. The analysis is based on the literature.
Sources: Population and GDP: World Bank; Energy data: IEA, IRENA analysis based on UN data; Share of fuel imports in total imports: World Trade Organisation; Electrical capacity: IEA, EIA; Electricity access rate: World Energy Outlook 2011 database (IEA); Share of population using solid fuels: World Health Organisation; Targets: REN21, IRENA; Policy/legislation: IEA, Reegle, IRENA research; Ease of doing business index: World Bank; Renewable energy projects: Bloomberg New Energy Finance, IRENA research; Clean Development Mechanism projects: UNFCCC; Renewable energy resources: IRENA analysis
Units: USD: United States dollar; kWh: kilowatt-hour; GWh: gigawatt-hour (1 GWh=106 kWh); TWh: terawatt-hour (1 TWh=103 GWh); PJ: petajoule; MW: megawatt; GW: gigawatt (1 GW=103 MW). Please also refer to the glossary for explanations on the terms used in the country profile.
haiti
Oil23%
Hydro1%
Solidbiofuels
75%
Oil28%
Hydro1%
Solidbiofuels
71%
Figure 3: ToTal Primary energy SuPPly* in 2000 and 2009
*excluding electricity trade2000: 84.2 PJ 2009: 108.7 PJ
0
2,000
4,000
6,000
8,000
10,000
0
500
1,000
1,500
2,000
2,500
3,000
2010 2009USD
per c
apita
kWh
per c
apita 5,133
Jamaica
1,902
Jamaica
9,230 2,728
WorldWorld
1,251
CaribbeanCaribbean
4,778
This Country Profile may contain advice, opinions and statements (“information”) of various information providers. The International Renewable Energy Agency does not represent or endorse the accuracy or reliability of any advice, opinion, statement or other information provided by any information provider or any other person or entity. Reliance upon any such information shall be at the user’s own risk. Neither the International Renewable Energy Agency, nor any of their respective agents, employees, information providers or content providers, shall be liable to any user or anyone else for any inac-curacy, error, omission, interruption, deletion, defect, alteration of or use of any content herein, or for its timeliness or completeness, nor shall they be liable for any failure of performance, regardless of cause, or for any damages resulting therefrom. The information contained herein does not necessarily represent the views of the Members of the International Renewable Energy Agency. The designations employed and the presentation of materials herein do not imply the expression of any opinion whatsoever on the part of the Secretariat of the International Renewable Energy Agency concerning the legal status of any country, territory, city or area or of its authorities, or concerning the delimitation of its frontiers or boundaries. The term “country” as used in this material also refers, as appropriate, to territories or areas.
RENEWABLE ENERGY COUNTRY PROFILE
Figure 1: gDP Per caPita For 2010 Figure 2: electricity use Per caPita For 2009
Bahamas
Cuba
Dominican Republic
St. Kitts & Nevis Antigua & Barbuda
Dominica
St.Vincent & the Grenadines
St.LuciaBarbados
Grenada
Trinidad& Tobago
HaitiJamaica
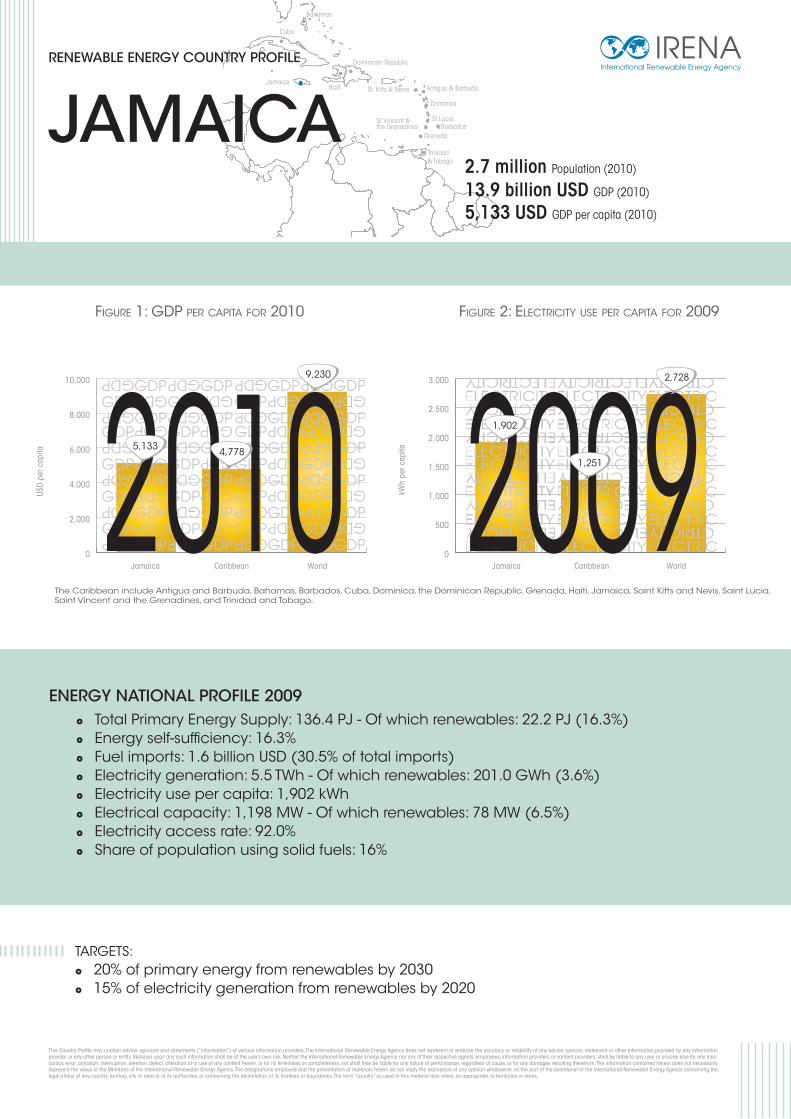
JAMAICA2.7 million Population (2010)
5,133 USD GDP per capita (2010) 13.9 billion USD GDP (2010)
The Caribbean include Antigua and Barbuda, Bahamas, Barbados, Cuba, Dominica, the Dominican Republic, Grenada, Haiti, Jamaica, Saint Kitts and Nevis, Saint Lucia, Saint Vincent and the Grenadines, and Trinidad and Tobago.
� Total Primary Energy Supply: 136.4 PJ - Of which renewables: 22.2 PJ (16.3%) � Energy self-sufficiency: 16.3% � Fuel imports: 1.6 billion USD (30.5% of total imports) � Electricity generation: 5.5 TWh - Of which renewables: 201.0 GWh (3.6%) � Electricity use per capita: 1,902 kWh � Electrical capacity: 1,198 MW - Of which renewables: 78 MW (6.5%) � Electricity access rate: 92.0% � Share of population using solid fuels: 16%
ENERGY NATIONAL PROFILE 2009
TARGETS: � 20% of primary energy from renewables by 2030 � 15% of electricity generation from renewables by 2020

jamaica
Coaland peat
1%
Oil84%Hydro
0.3%
Solidbiofuels
15%
Solidbiofuels
16%
Coaland peat
1%Oil
83%
Wind0.1%
Hydro0.3%
IRENA welcomes your comments and feedback at [email protected]
POLICIES IN PLACE TO PROMOTE RENEWABLE ENERGY SINCE THE RIO CONFERENCE OF 1992
RENEWABLE ENERGY PROJECTS FROM THE GOVERNMENT AND PRIVATE SECTORS: � 65 MW of biomass-fired capacity addition announced (2 projects) � 3 MW of wind capacity addition announced (1 project)
WORLD BANK EASE OF DOING BUSINESS INDEX FOR 2012: Ranked 88 out of 183
NUMBER OF REGISTERED CLEAN DEVELOPMENT MECHANISM PROJECTS FOCUSING ON RENEWABLE ENERGY: 1
RENEWABLE ENERGY RESOURCES:
Wind Solar Hydro Biomass Geothermal Ocean
High Medium Low Unknown Not applicable
2009
NatioNal
ENErgy Policy
2009-2030
Note: The information on resources should be taken as an indication only. It refers to a general trend of available resources, and does not prejudge the feasibility of individual projects. The thresholds are indicative, and do not refer to any technological choice. The analysis is based on the literature.
Sources: Population and GDP: World Bank; Energy data: IEA, IRENA analysis based on UN data; Share of fuel imports in total imports: World Trade Organisation; Electrical capacity: IEA, EIA; Electricity access rate: World Energy Outlook 2011 database (IEA); Share of population using solid fuels: World Health Organisation; Targets: REN21, IRENA; Policy/legislation: IEA, Reegle, IRENA research; Ease of doing business index: World Bank; Renewable energy projects: Bloomberg New Energy Finance, IRENA research; Clean Development Mechanism projects: UNFCCC; Renewable energy resources: IRENA analysis
Units: USD: United States dollar; kWh: kilowatt-hour; GWh: gigawatt-hour (1 GWh=106 kWh); TWh: terawatt-hour (1 TWh=103 GWh); PJ: petajoule; MW: megawatt; GW: gigawatt (1 GW=103 MW). Please also refer to the glossary for explanations on the terms used in the country profile.
Figure 3: ToTal Primary energy SuPPly* in 2000 and 2009
*excluding electricity trade
2000: 160.6 PJ 2009: 136.4 PJ
2005
NatioNal ENErgy
Policy grEEN PaPEr
(2006-2020)
2006
cENtrE of ExcEl-
lENcE for rENEwablE
ENErgy crEatED
2010
Draft NatioNal
rENEwablE ENErgy
Policy
2009
roll-out of
10% bioEthaNol
blEND
2010
Draft NatioNal
biofuEls Policy
Draft NatioNal
wastE-to-ENErgy
Policy

0
3,000
6,000
9,000
12,000
15,000
0
500
1,000
1,500
2,000
2,500
3,000
2010 2009USD
per c
apita
kWh
per c
apita
12,847
Saint Kitts and Nevis
2,095
Saint Kitts and Nevis
9,230
2,728
WorldWorld
1,251
CaribbeanCaribbean
4,778
This Country Profile may contain advice, opinions and statements (“information”) of various information providers. The International Renewable Energy Agency does not represent or endorse the accuracy or reliability of any advice, opinion, statement or other information provided by any information provider or any other person or entity. Reliance upon any such information shall be at the user’s own risk. Neither the International Renewable Energy Agency, nor any of their respective agents, employees, information providers or content providers, shall be liable to any user or anyone else for any inac-curacy, error, omission, interruption, deletion, defect, alteration of or use of any content herein, or for its timeliness or completeness, nor shall they be liable for any failure of performance, regardless of cause, or for any damages resulting therefrom. The information contained herein does not necessarily represent the views of the Members of the International Renewable Energy Agency. The designations employed and the presentation of materials herein do not imply the expression of any opinion whatsoever on the part of the Secretariat of the International Renewable Energy Agency concerning the legal status of any country, territory, city or area or of its authorities, or concerning the delimitation of its frontiers or boundaries. The term “country” as used in this material also refers, as appropriate, to territories or areas.
RENEWABLE ENERGY COUNTRY PROFILE
Figure 1: gDP Per caPita For 2010 Figure 2: electricity use Per caPita For 2009
Bahamas
Cuba
Dominican Republic
St. Kitts & Nevis Antigua & Barbuda
Dominica
St.Vincent & the Grenadines
St.LuciaBarbados
Grenada
Trinidad& Tobago
HaitiJamaica
SAINT KITTS AND NEVIS 52,000 Population (2010)
12,847 USD GDP per capita (2010) 673 million USD GDP (2010)
The Caribbean include Antigua and Barbuda, Bahamas, Barbados, Cuba, Dominica, the Dominican Republic, Grenada, Haiti, Jamaica, Saint Kitts and Nevis, Saint Lucia, Saint Vincent and the Grenadines, and Trinidad and Tobago.
� Total Primary Energy Supply: 4.2 PJ - Of which renewables: 0.5 PJ (11.9%) � Energy self-sufficiency: 11.9% � Fuel imports: Not available � Electricity generation: 142.0 GWh - Of which renewables: 0.0 GWh (0.0%) � Electricity use per capita: 2,095 kWh � Electrical capacity: 22 MW - Of which renewables: 0.0 MW (0.0%) � Electricity access rate: 95.0% � Share of population using solid fuels: < 5%
ENERGY NATIONAL PROFILE 2009
TARGETS: � 20% of renewable capacity by 2015

st.kitts
Oil84%
Solidbiofuels
16% Oil88%
Solidbiofuels
12%
IRENA welcomes your comments and feedback at [email protected]
POLICIES IN PLACE TO PROMOTE RENEWABLE ENERGY SINCE THE RIO CONFERENCE OF 1992
RENEWABLE ENERGY PROJECTS FROM THE GOVERNMENT AND PRIVATE SECTORS: � About 160 MW of geothermal capacity addition announced (2 projects) � 5 MW of wind capacity addition announced (1 project)
WORLD BANK EASE OF DOING BUSINESS INDEX FOR 2012: Ranked 95 out of 183
NUMBER OF REGISTERED CLEAN DEVELOPMENT MECHANISM PROJECTS FOCUSING ON RENEWABLE ENERGY: 0
RENEWABLE ENERGY RESOURCES:
Wind Solar Hydro Biomass Geothermal Ocean
High Medium Low Unknown Not applicable
2007
NatioNal actioN
ProgrammE for
combatiNg
DEsErtificatioN aND
laND DEgraDatioN
2012
tax ExEmPtioNs
for rENEwablE
ENErgy EquiPmENt
aPProVED iN
cabiNEt
NEVis gEothErmal
rEsourcEs DEVEloP-
mENt orDiNaNcE
2008
Note: The information on resources should be taken as an indication only. It refers to a general trend of available resources, and does not prejudge the feasibility of individual projects. The thresholds are indicative, and do not refer to any technological choice. The analysis is based on the literature.
Sources: Population and GDP: World Bank; Energy data: IEA, IRENA analysis based on UN data; Share of fuel imports in total imports: World Trade Organisation; Electrical capacity: IEA, EIA; Electricity access rate: World Energy Outlook 2011 database (IEA); Share of population using solid fuels: World Health Organisation; Targets: REN21, IRENA; Policy/legislation: IEA, Reegle, IRENA research; Ease of doing business index: World Bank; Renewable energy projects: Bloomberg New Energy Finance, IRENA research; Clean Development Mechanism projects: UNFCCC; Renewable energy resources: IRENA analysis
Units: USD: United States dollar; kWh: kilowatt-hour; GWh: gigawatt-hour (1 GWh=106 kWh); TWh: terawatt-hour (1 TWh=103 GWh); PJ: petajoule; MW: megawatt; GW: gigawatt (1 GW=103 MW). Please also refer to the glossary for explanations on the terms used in the country profile.
Figure 3: ToTal Primary energy SuPPly* in 2000 and 2009
*excluding electricity trade
2000: 3.1 PJ 2009: 4.2 PJ

0
2,000
4,000
6,000
8,000
10,000
0
500
1,000
1,500
2,000
2,500
3,000
2010 2009USD
per c
apita
kWh
per c
apita
6,890
Saint Lucia
2,040
Saint Lucia
9,230 2,728
WorldWorld
1,251
CaribbeanCaribbean
4,778
This Country Profile may contain advice, opinions and statements (“information”) of various information providers. The International Renewable Energy Agency does not represent or endorse the accuracy or reliability of any advice, opinion, statement or other information provided by any information provider or any other person or entity. Reliance upon any such information shall be at the user’s own risk. Neither the International Renewable Energy Agency, nor any of their respective agents, employees, information providers or content providers, shall be liable to any user or anyone else for any inac-curacy, error, omission, interruption, deletion, defect, alteration of or use of any content herein, or for its timeliness or completeness, nor shall they be liable for any failure of performance, regardless of cause, or for any damages resulting therefrom. The information contained herein does not necessarily represent the views of the Members of the International Renewable Energy Agency. The designations employed and the presentation of materials herein do not imply the expression of any opinion whatsoever on the part of the Secretariat of the International Renewable Energy Agency concerning the legal status of any country, territory, city or area or of its authorities, or concerning the delimitation of its frontiers or boundaries. The term “country” as used in this material also refers, as appropriate, to territories or areas.
RENEWABLE ENERGY COUNTRY PROFILE
Figure 1: gDP Per caPita For 2010 Figure 2: electricity use Per caPita For 2009
Bahamas
Cuba
Dominican Republic
St. Kitts & Nevis Antigua & Barbuda
Dominica
St.Vincent & the Grenadines
St.LuciaBarbados
Grenada
Trinidad& Tobago
HaitiJamaica
SAINT LUCIA 174,000 Population (2010)
6,890 USD GDP per capita (2010) 1.2 billion USD GDP (2010)
ENERGY NATIONAL PROFILE 2009 � Total Primary Energy Supply: 5.6 PJ - Of which renewables: 0.1 PJ (1.8%) � Energy self-sufficiency: 1.8% � Fuel imports: 145 million USD (25.9% of total imports) � Electricity generation: 363.0 GWh - Of which renewables: 0.0 GWh (0.0%) � Electricity use per capita: 2,040 kWh � Electrical capacity: 76 MW - Of which renewables: 0.0 MW (0.0%) � Electricity access rate: 98.0% � Share of population using solid fuels: < 5%
The Caribbean include Antigua and Barbuda, Bahamas, Barbados, Cuba, Dominica, the Dominican Republic, Grenada, Haiti, Jamaica, Saint Kitts and Nevis, Saint Lucia, Saint Vincent and the Grenadines, and Trinidad and Tobago.
TARGETS: � No information available

Sta Lucia
Oil98%
Solidbiofuels
2%Oil
98%
Solidbiofuels
2%
IRENA welcomes your comments and feedback at [email protected]
POLICIES IN PLACE TO PROMOTE RENEWABLE ENERGY SINCE THE RIO CONFERENCE OF 1992
RENEWABLE ENERGY PROJECTS FROM THE GOVERNMENT AND PRIVATE SECTORS: � 7 MW of waste-to-energy capacity addition announced (1 project) � 15 MW of geothermal capacity addition announced (1 project)
WORLD BANK EASE OF DOING BUSINESS INDEX FOR 2012: Ranked 52 out of 183
NUMBER OF REGISTERED CLEAN DEVELOPMENT MECHANISM PROJECTS FOCUSING ON RENEWABLE ENERGY: 0
RENEWABLE ENERGY RESOURCES:
Wind Solar Hydro Biomass Geothermal Ocean
High Medium Low Unknown Not applicable
2004
grEEN PaPEr oN
NatioNal ENErgy
Policy
Note: The information on resources should be taken as an indication only. It refers to a general trend of available resources, and does not prejudge the feasibility of individual projects. The thresholds are indicative, and do not refer to any technological choice. The analysis is based on the literature.
Sources: Population and GDP: World Bank; Energy data: IEA, IRENA analysis based on UN data; Share of fuel imports in total imports: World Trade Organisation; Electrical capacity: IEA, EIA; Electricity access rate: World Energy Outlook 2011 database (IEA); Share of population using solid fuels: World Health Organisation; Targets: REN21, IRENA; Policy/legislation: IEA, Reegle, IRENA research; Ease of doing business index: World Bank; Renewable energy projects: Bloomberg New Energy Finance, IRENA research; Clean Development Mechanism projects: UNFCCC; Renewable energy resources: IRENA analysis
Units: USD: United States dollar; kWh: kilowatt-hour; GWh: gigawatt-hour (1 GWh=106 kWh); TWh: terawatt-hour (1 TWh=103 GWh); PJ: petajoule; MW: megawatt; GW: gigawatt (1 GW=103 MW). Please also refer to the glossary for explanations on the terms used in the country profile.
Figure 3: ToTal Primary energy SuPPly* in 2000 and 2009
*excluding electricity trade
2000: 4.7 PJ 2009: 5.6 PJ
2001
NatioNal
sustaiNablE ENErgy
PlaN
2010
NatioNal ENErgy
Policy whitE PaPEr
aPProVED by cabiNEt
2005
sustaiNablE
ENErgy PlaN
aDoPtED by cabiNEt
Bahamas
Cuba
Dominican Republic
St. Kitts & Nevis Antigua & Barbuda
Dominica
St.Vincent & the Grenadines
St.LuciaBarbados
Grenada
Trinidad& Tobago
HaitiJamaica
0
2,000
4,000
6,000
8,000
10,000
0
500
1,000
1,500
2,000
2,500
3,000
2010 2009USD
per c
apita
kWh
per c
apita
6,172
Saint Vincent and the Grenadines
634
Saint Vincent and the Grenadines
9,230 2,728
WorldWorld
1,251
CaribbeanCaribbean
4,778
This Country Profile may contain advice, opinions and statements (“information”) of various information providers. The International Renewable Energy Agency does not represent or endorse the accuracy or reliability of any advice, opinion, statement or other information provided by any information provider or any other person or entity. Reliance upon any such information shall be at the user’s own risk. Neither the International Renewable Energy Agency, nor any of their respective agents, employees, information providers or content providers, shall be liable to any user or anyone else for any inac-curacy, error, omission, interruption, deletion, defect, alteration of or use of any content herein, or for its timeliness or completeness, nor shall they be liable for any failure of performance, regardless of cause, or for any damages resulting therefrom. The information contained herein does not necessarily represent the views of the Members of the International Renewable Energy Agency. The designations employed and the presentation of materials herein do not imply the expression of any opinion whatsoever on the part of the Secretariat of the International Renewable Energy Agency concerning the legal status of any country, territory, city or area or of its authorities, or concerning the delimitation of its frontiers or boundaries. The term “country” as used in this material also refers, as appropriate, to territories or areas.
RENEWABLE ENERGY COUNTRY PROFILE
Figure 1: gDP Per caPita For 2010 Figure 2: electricity use Per caPita For 2009
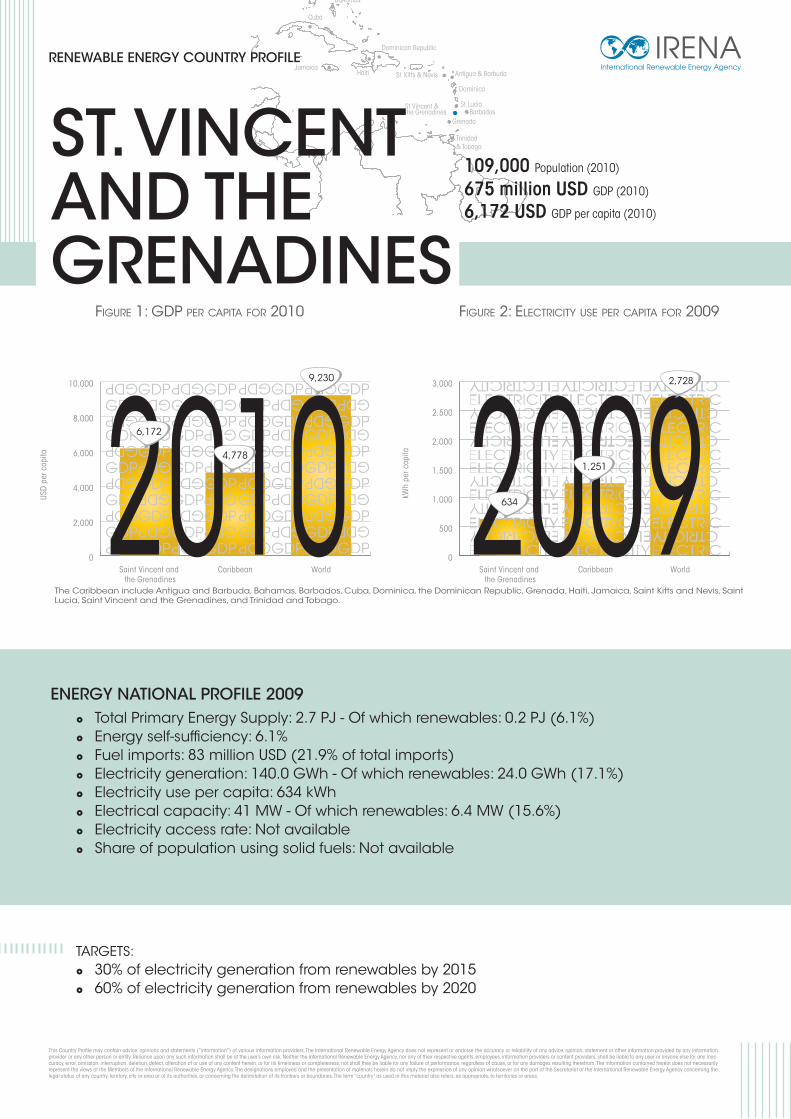
ST. VINCENT AND THE GRENADINES
109,000 Population (2010)
6,172 USD GDP per capita (2010) 675 million USD GDP (2010)
The Caribbean include Antigua and Barbuda, Bahamas, Barbados, Cuba, Dominica, the Dominican Republic, Grenada, Haiti, Jamaica, Saint Kitts and Nevis, Saint Lucia, Saint Vincent and the Grenadines, and Trinidad and Tobago.
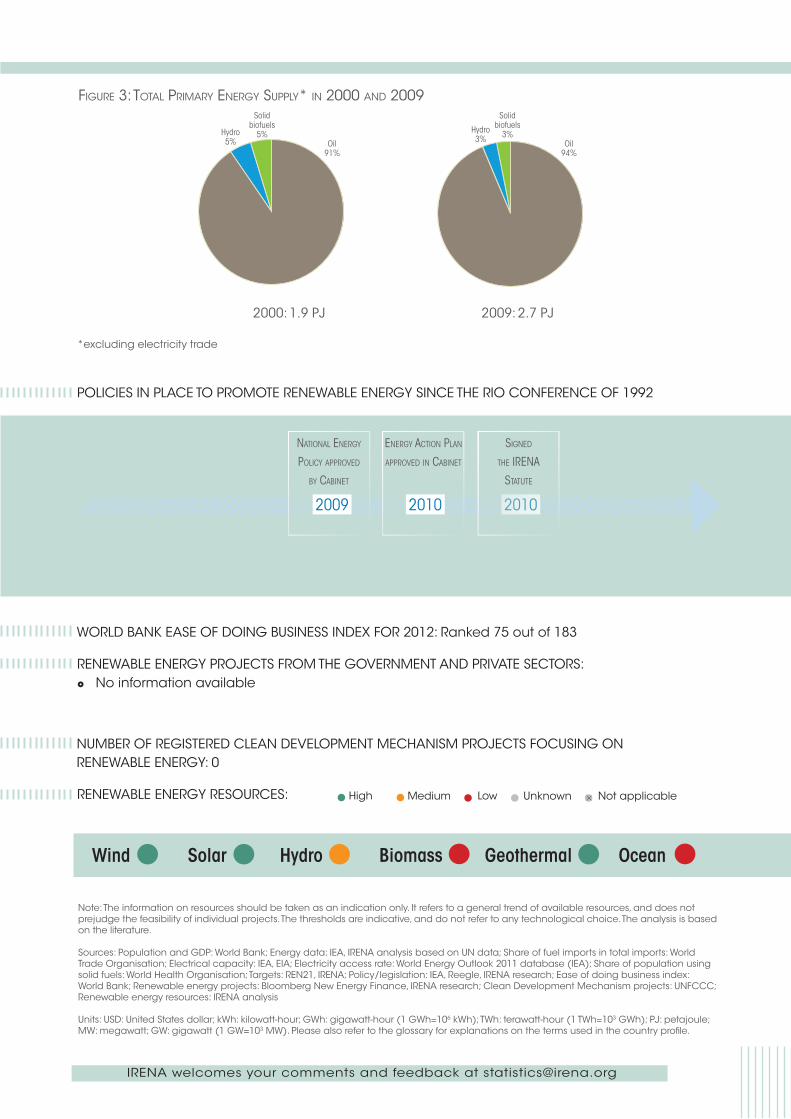
� Total Primary Energy Supply: 2.7 PJ - Of which renewables: 0.2 PJ (6.1%) � Energy self-sufficiency: 6.1% � Fuel imports: 83 million USD (21.9% of total imports) � Electricity generation: 140.0 GWh - Of which renewables: 24.0 GWh (17.1%) � Electricity use per capita: 634 kWh � Electrical capacity: 41 MW - Of which renewables: 6.4 MW (15.6%) � Electricity access rate: Not available � Share of population using solid fuels: Not available
ENERGY NATIONAL PROFILE 2009
TARGETS: � 30% of electricity generation from renewables by 2015 � 60% of electricity generation from renewables by 2020
St Vincent
Oil91%
Hydro5%
Solidbiofuels
5%Oil
94%
Hydro3%
Solidbiofuels
3%
IRENA welcomes your comments and feedback at [email protected]
POLICIES IN PLACE TO PROMOTE RENEWABLE ENERGY SINCE THE RIO CONFERENCE OF 1992
RENEWABLE ENERGY PROJECTS FROM THE GOVERNMENT AND PRIVATE SECTORS: � No information available
WORLD BANK EASE OF DOING BUSINESS INDEX FOR 2012: Ranked 75 out of 183
NUMBER OF REGISTERED CLEAN DEVELOPMENT MECHANISM PROJECTS FOCUSING ON RENEWABLE ENERGY: 0
RENEWABLE ENERGY RESOURCES:
Wind Solar Hydro Biomass Geothermal Ocean
High Medium Low Unknown Not applicable
20102010
ENErgy actioN PlaN
aPProVED iN cabiNEt
sigNED
thE irENa
statutE
2009
NatioNal ENErgy
Policy aPProVED
by cabiNEt
Note: The information on resources should be taken as an indication only. It refers to a general trend of available resources, and does not prejudge the feasibility of individual projects. The thresholds are indicative, and do not refer to any technological choice. The analysis is based on the literature.
Sources: Population and GDP: World Bank; Energy data: IEA, IRENA analysis based on UN data; Share of fuel imports in total imports: World Trade Organisation; Electrical capacity: IEA, EIA; Electricity access rate: World Energy Outlook 2011 database (IEA); Share of population using solid fuels: World Health Organisation; Targets: REN21, IRENA; Policy/legislation: IEA, Reegle, IRENA research; Ease of doing business index: World Bank; Renewable energy projects: Bloomberg New Energy Finance, IRENA research; Clean Development Mechanism projects: UNFCCC; Renewable energy resources: IRENA analysis
Units: USD: United States dollar; kWh: kilowatt-hour; GWh: gigawatt-hour (1 GWh=106 kWh); TWh: terawatt-hour (1 TWh=103 GWh); PJ: petajoule; MW: megawatt; GW: gigawatt (1 GW=103 MW). Please also refer to the glossary for explanations on the terms used in the country profile.
Figure 3: ToTal Primary energy SuPPly* in 2000 and 2009
*excluding electricity trade
2000: 1.9 PJ 2009: 2.7 PJ

0
5,000
10,000
15,000
20,000
0
1,000
2,000
3,000
4,000
5,000
6,000
2010 2009USD
per c
apita
kWh
per c
apita
15,614
Trinidad and Tobago
5,662
Trinidad and Tobago
9,230 2,728
WorldWorld
1,251
CaribbeanCaribbean
4,778
This Country Profile may contain advice, opinions and statements (“information”) of various information providers. The International Renewable Energy Agency does not represent or endorse the accuracy or reliability of any advice, opinion, statement or other information provided by any information provider or any other person or entity. Reliance upon any such information shall be at the user’s own risk. Neither the International Renewable Energy Agency, nor any of their respective agents, employees, information providers or content providers, shall be liable to any user or anyone else for any inac-curacy, error, omission, interruption, deletion, defect, alteration of or use of any content herein, or for its timeliness or completeness, nor shall they be liable for any failure of performance, regardless of cause, or for any damages resulting therefrom. The information contained herein does not necessarily represent the views of the Members of the International Renewable Energy Agency. The designations employed and the presentation of materials herein do not imply the expression of any opinion whatsoever on the part of the Secretariat of the International Renewable Energy Agency concerning the legal status of any country, territory, city or area or of its authorities, or concerning the delimitation of its frontiers or boundaries. The term “country” as used in this material also refers, as appropriate, to territories or areas.
RENEWABLE ENERGY COUNTRY PROFILE
Figure 1: gDP Per caPita For 2010 Figure 2: electricity use Per caPita For 2009
Bahamas
Cuba
Dominican Republic
St. Kitts & Nevis Antigua & Barbuda
Dominica
St.Vincent & the Grenadines
St.LuciaBarbados
Grenada
Trinidad& Tobago
HaitiJamaica
TRINIDAD & TOBAGO 1.3 million Population (2010)
15,614 USD GDP per capita (2010) 20.9 billion USD GDP (2010)
ENERGY NATIONAL PROFILE 2009
The Caribbean include Antigua and Barbuda, Bahamas, Barbados, Cuba, Dominica, the Dominican Republic, Grenada, Haiti, Jamaica, Saint Kitts and Nevis, Saint Lucia, Saint Vincent and the Grenadines, and Trinidad and Tobago.
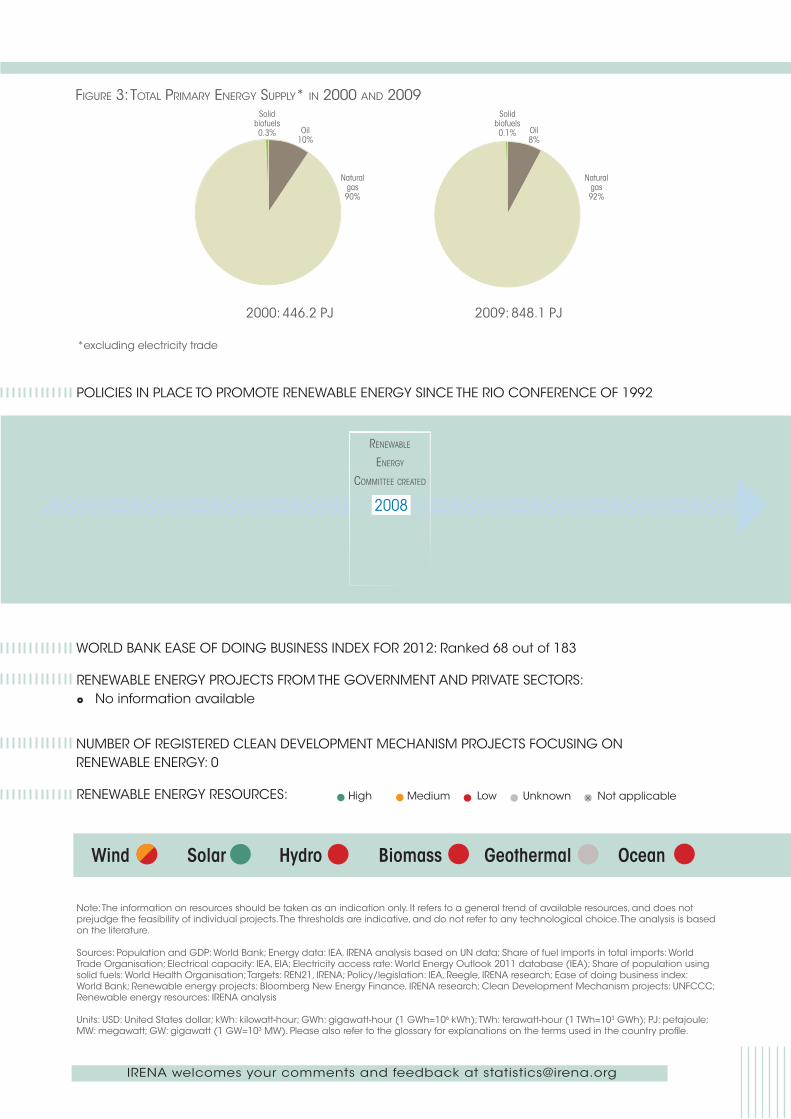
� Total Primary Energy Supply: 848.1 PJ - Of which renewables: 0.5 PJ (0.1%) � Energy self-sufficiency: 217.2% � Fuel imports: 2.2 billion USD (32.9% of total imports) � Electricity generation: 7.7 TWh - Of which renewables: 19.0 GWh (0.2%) � Electricity use per capita: 5,662 kWh � Electrical capacity: 1,429 MW - Of which renewables: 5.0 MW (0.3%) � Electricity access rate: 99.0% � Share of population using solid fuels: < 5%
TARGETS: � No information available
trinindad & tobago
Oil10%
Naturalgas90%
Naturalgas92%
Solidbiofuels0.3% Oil
8%
Solidbiofuels0.1%
IRENA welcomes your comments and feedback at [email protected]
POLICIES IN PLACE TO PROMOTE RENEWABLE ENERGY SINCE THE RIO CONFERENCE OF 1992
RENEWABLE ENERGY PROJECTS FROM THE GOVERNMENT AND PRIVATE SECTORS: � No information available
WORLD BANK EASE OF DOING BUSINESS INDEX FOR 2012: Ranked 68 out of 183
NUMBER OF REGISTERED CLEAN DEVELOPMENT MECHANISM PROJECTS FOCUSING ON RENEWABLE ENERGY: 0
RENEWABLE ENERGY RESOURCES:
Wind Solar Hydro Biomass Geothermal Ocean
High Medium Low Unknown Not applicable
Figure 3: ToTal Primary energy SuPPly* in 2000 and 2009
*excluding electricity trade
2000: 446.2 PJ 2009: 848.1 PJ
rENEwablE
ENErgy
committEE crEatED
2008
Note: The information on resources should be taken as an indication only. It refers to a general trend of available resources, and does not prejudge the feasibility of individual projects. The thresholds are indicative, and do not refer to any technological choice. The analysis is based on the literature.
Sources: Population and GDP: World Bank; Energy data: IEA, IRENA analysis based on UN data; Share of fuel imports in total imports: World Trade Organisation; Electrical capacity: IEA, EIA; Electricity access rate: World Energy Outlook 2011 database (IEA); Share of population using solid fuels: World Health Organisation; Targets: REN21, IRENA; Policy/legislation: IEA, Reegle, IRENA research; Ease of doing business index: World Bank; Renewable energy projects: Bloomberg New Energy Finance, IRENA research; Clean Development Mechanism projects: UNFCCC; Renewable energy resources: IRENA analysis
Units: USD: United States dollar; kWh: kilowatt-hour; GWh: gigawatt-hour (1 GWh=106 kWh); TWh: terawatt-hour (1 TWh=103 GWh); PJ: petajoule; MW: megawatt; GW: gigawatt (1 GW=103 MW). Please also refer to the glossary for explanations on the terms used in the country profile.

glossaryRENEWABLE ENERGY COUNTRY PROFILE
1 – Products Coal comprises the solid fossil fuels consisting of car-bonised vegetal matter (hard coal and brown coal) and the products derived from them (e.g. patent fuel, coke, blast furnace gas, coke oven gas).
Peat is a solid formed from the partial decomposition of dead vegetation under conditions of high humidity and limited air access. Peat is not considered a renewable re-source as its regeneration period is long.
Oil covers the liquid fossil hydrocarbons comprising crude oil, liquids extracted from natural gas (NGL), fully or partly processed products from the refining of crude oil (e.g. gasoline, diesel) and functionally similar liquid hy-drocarbons and organic chemicals from vegetal or ani-mal origins.
Natural gas includes natural gas but excludes natural gas liquids, which are included in oil and oil products.
Nuclear shows the primary energy equivalent of the electricity produced by a nuclear power plant assuming an average thermal efficiency of 33%.
Wastes are materials no longer required by their hold-ers and which are used as fuels. They comprise municipal waste and industrial waste.
Hydro shows the energy content of the electricity pro-duced from devices driven by fresh, flowing or falling wa-ter. Hydro output excludes output from pumped storage plants.
Biofuels are the solid, liquid or gaseous material obtained from living or recently living organisms (e.g. wood, char-coal, biogasoline, biodiesels, vegetal or animal waste).
Solar is the energy that is captured from solar radiation to produce a useful energy output (electricity from solar photovoltaic, heat or electricity from solar thermal).
Geothermal is the energy of the heat that is extracted from the earth, usually in the form of heated water or steam.
Ocean shows the energy content of the electricity pro-duced by tidal movement, wave motion, ocean current and other sources of marine energy.
Wind shows the energy content of the electricity pro-duced by wind turbines.
Renewables are sources of energy which are naturally replenished as they are used. They include hydro, biofu-els, solar, geothermal, ocean and wind. For the purposes of energy statistics, the renewable portion of municipal waste is also included.
2 – EnErgy national ProfilE box Total Primary Energy Supply is the net flow of fuel or energy into the national territory from production, exter-nal trade, international bunkers and changes in stocks. Note that this value includes electricity trade unlike the pie charts presented later, which can result in small dif-ferences in values and the share of renewables.
Self-sufficiency is the ratio of domestic production divided by Total Primary Energy Supply. A value below 100% means that the country is a net energy importer, i.e. that it has to import or draw from its stocks the energy needed to meet the part of demand that is not met by domestic production. Conversely, a value above 100% in-dicates that the country is a net energy exporter.
Fuel imports show the amount spent on importing coal and peat, oil, natural gas and electricity in the country. For most countries, this amount includes cost, insurance and freight (CIF) (source http://www.wto.org).
Electricity generation is the total amount of electricity produced in power plants (i.e. the gross electricity pro-duction).
Electricity use is the electricity available for consump-tion, defined as the sum of domestic production and ex-ternal trade minus the transmission losses.
Electrical capacity is the net maximum installed capac-ity of all power plants at the end of the year concerned, i.e. the maximum power that can be supplied, continu-ously, with all of the plant running, at the point of outlet to the network.
Electricity access rate is the share of the population with access to electricity
Share of population using solid fuels is the percent-age of the population that relies on solid biofuels, coal

and peat as the primary source of domestic energy for cooking and heating (source http://www.who.int).
3 – othEr indicators World Bank ease of doing business index ranks economies from 1 to 183 in 10 areas of business regu-lation: starting a business, dealing with construction permits, registering property, getting credit, protecting investors, paying taxes, trading across borders, enforc-ing contracts, resolving insolvency and getting electricity (source: http://www.doingbusiness.org).
Registered Clean Development Mechanism (CDM) project: the CDM allows emission-reduction projects in developing countries to earn certified emission reduc-
Wind Solar Hydro Biomass Geothermal Ocean
High Several areas with average wind speed above 7 m/s at 50 m high
Several areas with global horizon-tal irra-diation above 1800 kWh/m2 per year
One or more sites can be equipped with a large hydro-power facility (>10 MW)
Maximum identified theoretical potential above 100 PJ incl. agricul-ture, wood and residues
One or more sites can be equipped with a large scale facility (>10 MW)
Wave power above 30 kW/m
Medium Several areas with average wind speed between 5 and 7 m/s at 50 m high
Several areas with global horizontal irradiation between 1200 and 1800 kWh/m2 per year
One or more sites can be equipped with a medium scale hydro-power facility (1-10 MW)
Maximum identified theoretical potential be-tween 10 and 100 PJ incl. agriculture, wood and residues
One or more sites can be equipped with a medium scale facility (1-10 MW)
Wave power between 10 and 30 kW/m
Low No area identified with average wind speed above 5 m/s
No identified area with global hori-zontal irra-diation above 1200 kWh/m2 per year
One or more sites can be equipped with a small scale hydro-power facility (<1 MW)
Maximum identified theoretical potential below 10 PJ incl. agricul-ture, wood and residues
One or more sites can be equipped with a small scale facility (<1 MW)
Wave power below 10 kW/m
Unknown No data identified by IRENA as yet
tion credits which can be traded and sold, and used by industrialised countries to a meet a part of their emission reduction targets under the Kyoto Protocol. A project is registered when the Executive Board of the CDM gives its final approval (source: http://cdm.unfccc.int).
4 – rEsourcEs Note: Data on the assessment of the resources of tidal power and ocean current is not available. Therefore, and for the purposes of the resource assessment only, ocean energy is limited to wave energy.
For each renewable energy source, the rating is ex-plained in the table below.


I RENA Secretar iat C67 Of f ice Bui ld ing, Khal id iyah (32nd) S t reetP.O. Box 236, Abu Dhabi, Uni ted Arab Emiratesw w w.i rena.org Copyright 2012
Top Related