


Languages
Pages
Legal


Portland State UniversityPDXScholar
Dissertations and Theses Dissertations and Theses
1-1-2010
Comparison of Microshear Bond Strength and MorphologicalChanges Between Active and Passive Application of 4thGeneration Etch-and-Rinse Etchant on EnamelSophia Tuyet-Nhi TrieuPortland State University
Let us know how access to this document benefits you.Follow this and additional works at: http://pdxscholar.library.pdx.edu/open_access_etds
This Thesis is brought to you for free and open access. It has been accepted for inclusion in Dissertations and Theses by an authorized administrator ofPDXScholar. For more information, please contact [email protected].
Recommended CitationTrieu, Sophia Tuyet-Nhi, "Comparison of Microshear Bond Strength and Morphological Changes Between Active and PassiveApplication of 4th Generation Etch-and-Rinse Etchant on Enamel" (2010). Dissertations and Theses. Paper 358.
10.15760/etd.358

Comparison of Microshear Bond Strength and Morphological Changes Between Active
and Passive Application of 4th
Generation Etch-and-Rinse Etchant on Enamel
by
Sophia Tuyet-Nhi Trieu
A thesis submitted in partial fulfillment of the
requirements for the degree of
Master of Science
in
Biology
Thesis Committee:
Randy D. Zelick, Chair
Tom J. Hilton
Sean S. Kohles
Radu Popa
Portland State University
©2010

i
ABSTRACT
Over 200 million dental restorations are performed each year in America. A
dental restoration require a strong bonding of restoration to tooth structure and relies on
the dental adhesive to create this mechanical and chemical bonding. Dental adhesion or
bonding is the process of forming an adhesive joint between the composite and tooth
substrate: dentin or enamel. Clinical problems such as microleakage at the restoration
tooth interface, influx of fluids, or bacteria growth at the cavity wall can be prevented
with adhesives that obtain a more intimate bonding. Longevity of the restoration can be
enhanced by the adhesive that creates the tight bonding to reduce problems such as
postoperative sensitivity, marginal staining, and recurrent caries. The goal of this
research project is to investigate the influence of active scrubbing application as
compared to passive non-scrubbing application of the etchant component in 4th
generation etch-and-rinse adhesive systems. Shear bond stresses have been measured and
compared between application techniques. Verification of resin infiltration depth with
each etchant application has been examined with scanning electron microscopy by
mounting the etched and bonded enamel surface of the tooth in epoxy and slicing the
tooth longitudinally producing a transverse, depth-wise view. Results from this study
have clarified the role of resin tag formation as well as tooth morphology during an active
acid etchant application for dental restoration.

ii
Dedication
To my supportive and loving parents, Le Kim Xuan & Trieu Sanh, who have been better
parents than I could have ever wished for.

iii
ACKNOWLEDGMENTS
My thesis represents a couple years of research conducted in the Biomaterials and
Biomechanics laboratory at Oregon Health & Sciences University School of Dentistry,
Portland, OR, under the direction of Dr. Tom Hilton and in collaboration with the training
and instruction of the Biology and Engineering department at Portland State University,
Portland, OR under the supervision and guidance of Dr. Randy Zelick, Dr. Sean Kohles, and
Dr. Radu Popa. I am eternally grateful for my exceptional thesis committee whose support,
expertise, and willingness has helped me meet the challenges of my research project. Over
these years I have learned so much through the direction and collaboration of many
outstanding people and would like to extend my deep appreciate toward their efforts.
I am thankful for the teaching, assistance and guidance of Dr. Jack Ferracane and Dr.
Harry Davis, whom have emphasized the importance of uniting real and theoretical worlds.
Many thanks to my mentors and colleagues at the Biomaterials and Biomechanics laboratory:
to Dr. David Mahler for his many critical questions and knowledge in research; Dr. Fernanda
Pelogia for her support, friendship, and mentally preparing me for the world of research; Dr.
Beto Macedo for teaching microshear bond techniques; Dr. Flavia Gonclaves for helping me
analyze my data and extending her warm friendship; Dr. Mansen Wang for his proficient
knowledge and patient assistant in analysis of data; Dr. John Mitchell for showing me how to
use the SEM; and Sheila Barnhart for all her administrative help. I would also like to thank
the faculty and professors at Portland State University who provided a friendly environment.
Warm thanks to all of my friends, especially Nina Zhian and Dr. Lauren Nguyen, for
understanding the time commitment I devoted to academia and embracing this project with
me.
Finally, a project of this nature could not have been accomplished without the love,
support, and encouragement from my wonderful parents, Le Kim Xuan and Trieu Sanh, who
have always supported my academic pursuits; from my caring older siblings, Mai & Tai,
Hung, Tuan, Thu, Luan, Hanh, Phuc, Loc, Loan, & Tho, who have provided and taught me
so much; and lastly, from the most important members of the family, my dear nieces and
nephews: Ashley, Andrew, Ivana, Britney, Grace, Estelle, Wesley, Caden, and Blake, whose
bright faces and dependable smiles made this project bearable.
iv
TABLE OF CONTENTS
ABSTRACT…………………………………………………………………….................i
DEDICATION………………………………………………………………………........ii
ACKNOWLEDGEMENTS…………………………………………………………..…..iii
LIST OF TABLES……………………………………………………………….……….vi
LIST OF FIGURES…………………………………………………………………..….vii
GLOSSARY………………………………………………………………………….....viii
CHAPTER I: INTRODUCTION …………………………………………..……….…....1
CHAPTER II: BACKGROUND INFORMATION………...………………….………....3
DENTAL RESTORATION……………………………………………………...….....3
ENAMEL AND DENTIN STRUCTURE……………………………………………......7
DENTAL ADHESIVE SYSTEMS ………………………………………………........11
CHAPTER III: REVIEW OF LITERATURE……..………………………………..…...13
FACTORS INFLUENCING ADHESIVES…………………….…………………….…13
ADHESIVE APPLICATION METHODS: ACTIVE VS. PASSIVE ETCH………………...17
PURPOSE AND SIGNIFICANCE OF THESIS RESEARCH …………………..…….…..22
CHAPTER IV: METHODS …………………..……………………………………....…25
SAMPLE ACQUISTION…………….……………………………………………....25
PART A: TOOTH PREPARATION FOR MICROSHEAR BOND TEST………………..…26
MICRO-SHEAR BOND TESTING……………………………………………..….….28
BOND FAILURE MODE…………………….………………………………........…30
BOND FAILURE SITE EXAMINATION WITH SEM………………………………..…31
PART B: TOOTH PREPARTION FOR MORPHOLOGICAL EVALUATION………….….33

v
PART C: TOOTH PREPARATION FOR RESIN INFILTRATION……………….………36
EVALUATION OF SURFACE ROUGHNESS…………………………………........…39
DATA AND STATISTICAL ANALYSIS………………………………………….......41
CHAPTER V: RESULTS …………………...……………………………………..……42
MICROSHEAR BOND STRENGTH……………………………………………...…..42
SITE OF FAILURE…………………………………………….……………….…...49
SURFACE ROUGHNESS……………..………………………………..………..…..51
CHAPTER VI: DISCUSSION…….………………………………………………...…..53
CHAPTER VII: CONCLUSION………………………………………………….…......59
REFERENCES………………………………………………………………………..…60
APPENDIX A: STATISTICAL ANALYSIS……………………………………............66
APPENDIX B: IMAGES OF ETCHED SURFACE………………………….…...…....69
APPENDIX C: IMAGES OF RESIN INFILTRATION ………………….….......……..79

vi
LIST OF TABLES
Table 1: Standard simple statistics for full data set for active “scrubbing” treatment…...43
Table 2: Standard simple statistics for full data set for the control group: “passive”
application of etchant……………………………………………………………43
Table 3: Mixed effect model summary statistics………………………………………...47
Table 4: Correlation matrix of scrubbing application to bond strength………………….48
Table 5: Correlation matrix of passive application to bond strength……………….........48
Table 6: Frequency of site of failure ………………………………………………….....50
Table 7: T-test analysis of surface roughness……………………………………………51
Table 8: Paired t-tests comparing the differences between the repeated measurements
of surface roughness…………………………………………………….……….51

vii
LIST OF FIGURES
Figure 1: Mineral content in enamel and dentin………………………………………..…7
Figure 2: Wetting concept…………………………………………………………...…….8
Figure 3: Sample preparation of active and passive application of acid etchant..………26
Figure 4: Test jig and shear apparatus for microshear bond testing…………………..…28
Figure 5: Example of failure sites for microshear bond strength………………………..30
Figure 6: SEM images of failure site……….......………………………………………..32
Figure 7: SEM images of etched enamel surface…………………………..……….. 34-35
Figure 8: Cross-sectional view of a dental restoration……………………………….37-38
Figure 9: Measuring surface roughness…………………………………………………40
Figure 10: Illustration of sample size for scrubbing and passive treatment group for
the microshear bond strength test……………………………………...………...44
Figure 11: Histogram showing normal distribution……………………………….……..45
Figure 12: Q-Q plots of the bond strength……………………………………….…...….46
Figure 13: Boxplot of data demonstrating the distribution among individual samples
per treatment group for microshear bond strength test……………….……….....47
Figure 14: Frequency of the site of failure for scrubbing and passive application
of etchant…………………………………………………………………………50
Figure 15: Surface roughness graph of the scrubbing and passive treatment groups...….52
viii
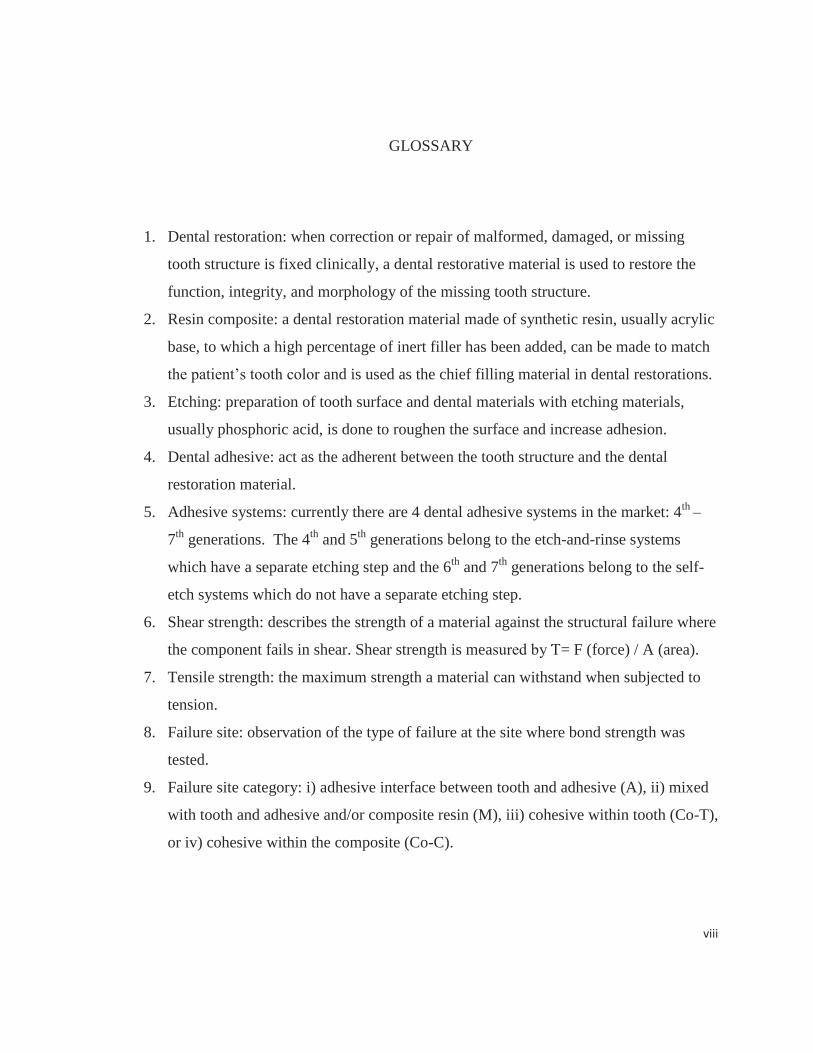
GLOSSARY
1. Dental restoration: when correction or repair of malformed, damaged, or missing
tooth structure is fixed clinically, a dental restorative material is used to restore the
function, integrity, and morphology of the missing tooth structure.
2. Resin composite: a dental restoration material made of synthetic resin, usually acrylic
base, to which a high percentage of inert filler has been added, can be made to match
the patient’s tooth color and is used as the chief filling material in dental restorations.
3. Etching: preparation of tooth surface and dental materials with etching materials,
usually phosphoric acid, is done to roughen the surface and increase adhesion.
4. Dental adhesive: act as the adherent between the tooth structure and the dental
restoration material.
5. Adhesive systems: currently there are 4 dental adhesive systems in the market: 4th
–
7th
generations. The 4th
and 5th
generations belong to the etch-and-rinse systems
which have a separate etching step and the 6th
and 7th
generations belong to the self-
etch systems which do not have a separate etching step.
6. Shear strength: describes the strength of a material against the structural failure where
the component fails in shear. Shear strength is measured by Ƭ= F (force) / A (area).
7. Tensile strength: the maximum strength a material can withstand when subjected to
tension.
8. Failure site: observation of the type of failure at the site where bond strength was
tested.
9. Failure site category: i) adhesive interface between tooth and adhesive (A), ii) mixed
with tooth and adhesive and/or composite resin (M), iii) cohesive within tooth (Co-T),
or iv) cohesive within the composite (Co-C).

1
CHAPTER I: INTRODUCTION
The National Institute of Dental Research reported that approximately 94% of
adults in the United States show evidence of past or present dental caries and estimate
that approximately 61.6 million adults could benefit from professional dental restoration
(Brown, Winn et al. 1996). Placement and replacement of composite restorations
constitute approximately 60% of all operative dentistry done (Mjor 1998). Dental
adhesion or bonding is the process of forming an adhesive joint between the composite
and tooth substrate: dentin or enamel. Clinical problems such as microleakage at the
restoration tooth interface, influx of fluids, or bacteria growth at the cavity wall can be
prevented with adhesives that obtain a more intimate bonding between the restorative
material and the tooth (Perdiago 2007). Longevity of the restoration can be enhanced by
adhesives that create the secure adhesion to reduce problems such as postoperative
sensitivity, marginal staining, and recurrent caries (Duke 1993).
Several studies have demonstrated that active application as opposed to passive
application of certain adhesive systems or adhesive components enhances adhesion
(Jacobsen and Soderholm 1998; Salz, Zimmermann et al. 2005; Dal-Biano, Pellizzaro et
al. 2006; Reis, Pellazaro et al. 2007; Higashi, Michel et al. 2009). The enhancement of
adhesion or the quality of bond strength may be determined through a variety of methods
included tensile or shear-bond strength testing, resin infiltration, microleakage
evaluation, thermocycling, and observations of changes in tooth surfaces such as the etch
pattern produced by the dental adhesive. Although enamel bonding has improved

2
substantially with the use of appropriate adhesives there are still times when bond failure
occurs (Swift, Perdigao et al. 1995). This has facilitated a strong motive to find ways of
maximizing the bond to minimize failures. Many dental adhesives have been
formulated; currently on the market are the 4-7th
generation adhesive systems. The gold
standard for dental adhesives is the 4th
generation etch-and-rinse system which gives the
strongest bond strength. On the other hand, there is no information regarding the effect
of actively vs. passively applying etchant onto enamel using 4th
generation etch-and-rinse
adhesive systems.
The goal of this research project was to investigate the influence of active
(scrubbing with a micro brush) application as compared to passive (non-scrubbing)
application of the etchant component in 4th
generation etch-and-rinse adhesive systems.
Microshear bond test was implemented for this project since this is a well-tested and
commonly utilized method for screening the effectiveness of factors on adhesion.
Restoration bond strength was tested using microshear bond testing. Evaluation of etch
pattern and resin infiltration at the micro level have been captured with SEM images for
further analysis of the etch pattern between treatment groups of active and passive
application of etchant. Verification of differences in etch pattern examining resin
infiltration depth and etch morphology patterns have been observed with SEM images.
3
CHAPTER II: BACKGROUND REVIEW
DENTAL RESTORATION
Dental restorations are important for our oral heath by allowing reconstruction of
tooth with dental materials. It is estimated that over 60 million people in the United
States could benefit from dental restorations (Brown, Winn et al. 1996). Therefore, there
is a strong appeal in the advancement of dental restorations which comprises about 60%
of treatment accomplished by operative dentists (Reinhard 2001).
The advantages of dental restorations were originally intended to restore tooth
structure, fractures, or to fill tooth erosion and abrasive defects (Kidd 1976). This
purpose still holds true today but has expanded its scope toward other avenues in
operative dentistry from preventative treatments to esthetic restorations. In traditional
operative dentistry a restoration would often require the removal of sound tooth structure
in order to gain retention and stabilization of the dental restoration material. Modern
dentistry adopted the use of adhesives, which reduce the size of tooth preparation which
was a momentous advancement in the field of operative dentistry (Buonocore 1955;
Fusayama, Nakamura et al. 1979).
Adhesives are agents that help the restoration adhere to the tooth structure. As
such, adhesives are the bonding intermediate, acting as an adherent between two
interfaces. Dental restorations can be complex with many interfaces joining together,
such as the enamel-adhesive-composite-adhesive-porcelain interface in a porcelain
4
restoration (Perdiago 2007). Adhesives play a critical role in significantly increasing
the bond strength of the restoration to tooth structure. Tooth preparation can also be
minimized with adhesives since the etch pattern increases surface area and allows better
restoration retention without the need remove sound tooth structure to provide
macromechanical retention features. The more secure bonding with adhesives decreases
microleakage where recurring caries occurring from an ingress of fluids will damage the
tooth and restoration (Duke 1993).
Today, esthetic dentistry has become very appealing for the general population
and many people demand esthetic, reliable restorations and are willing to pay for
cosmetic reconstruction work. Matching an individual’s tooth color is made possible
with the use of resin filled adhesives that can match the individual dentition. For that
reason, adhesives are useful by allowing tooth colored restorative materials to esthetically
restore or recontour teeth relatively easily and economically (Strassler 1991). Adhesives
entail relatively simple steps and provide patients with dependable restorations with a
natural appearance.
The use of phosphoric acid to improve the bonding mechanism of resin to enamel
was established by Bunocore in 1955 when he applied the idea of industrial use of
phosphoric acid to improve adhesion of paints to resin coatings (Buonocore 1955). He
revolutionized the practice of restorative dentistry and made adhesives a common step in
restorative dentistry. Bunocore discovered that 85% phosphoric acid made acrylic resin
adhere more securely to an etched enamel surface. He demonstrated that acid etching of
enamel with phosphoric acid increased the bond strength 100-fold.

5
Today, adhesives are commonly used in restorative dentistry and advancements to
improve current products are being researched. Whereas the traditional restoration
concepts contended with large tooth preparations to retain restorative materials,
contemporary restorations are able to minimize tooth preparations with the use of
adhesives (Black 1917). Adhesives allow a more intimate bond of the restoration to tooth
structure that will inevitably reduce microleakage and increase restoration longevity.
Reducing microleakage will decrease clinical problems such as recurrent caries, marginal
staining, and postoperative sensitivity (Duke 1993).
Traditional metal restorations requiring removal of sound tooth for mechanical
retention can weaken the tooth’s infrastructure by acting as a wedge between the lingual
and buccal walls and increasing the risk of cuspal fracture. On the contrary, a weakened
tooth structure can be reinforced by adhesive restoration since it can better transmit and
distribute functional stress across a bonded interface (Morin, DeLong et al. 1984; Eakle
1986). Restoring teeth with little or no tooth preparation is made possible by dental
adhesives and not only strengthens a weakened tooth but can also salvage a carious tooth.
Thus, adhesive give dentists the technology to provide a good restoration with durability,
longevity, and esthetics.
Dental adhesives work by fundamentally exchanging the inorganic tooth material
with synthetic resin where the tooth-composite interface attains a tight mechanical and
chemical interlocking (Van Meerbeek 2001). Bonding systems have an acid component
that will partially demineralize the cut dentin or enamel surface for resin monomers to
attain optimal tooth infiltration (Pashley, Ciucchi et al. 1993). The adhesive component

6
is a solution of resin monomers that provide a micromechanical interlocking retention
between the two substrates upon polymerization. The first step is to remove superficial
calcium phosphate, also known as hydroxyapatite, to expose microporosities in dentin
and enamel. The second step, hybridization phase, involves a resin infiltration and
polymerization into the microporosities created by the etchant (Perdiago 2007).
Therefore, adhesives allow a mechanical interlocking essential to a sealed restoration
with minimal invasion into sound tooth structure.
This micromechanical interlocking is the special feature that increases bond
strength by creating a larger surface area for more adherence of resin monomers.
Calcium phosphate is removed revealing an etchant pattern of an irregular surface with
microporosities and deep grooves where resin monomers can more effectively infiltrate
into etched tooth surface (Swift 1995). The last step in adhesive bonding is the
hybridization phase which allows deeper resin infiltration and more surface area contact
that inevitably increases micromechanical bonding. The prepared tooth surface will now
readily bond securely with resin monomers from the restoration material. Therefore,
adhesives are critical in the improved retention of restorative material to the tooth surface
but most importantly it helps to seal the margins which remains to a major obstacle in
clinical longevity (Gaengler, Hoyer et al. 2004).

7
ENAMEL AND DENTIN STRUCTURE
The composition of enamel and dentin are very different, but modern adhesive
systems are able to achieve acceptable bonding effectiveness when they are
simultaneously applied to both enamel and dentin (Bertolotti 1991). Nonetheless, enamel
and dentin have different bonding properties due to their physiochemical and structural
differences. Enamel is comprised of 86 % of inorganic content by volume, primarily
hydroxyapatite, and 2 vol% organic material with water comprising the last 12 vol%
(Gwinnett 1990). On the other hand, dentin is made up of 50 vol% inorganic material
Figure 1: Enamel and dentin diagram illustrating the content of water, inorganic, and organic material.
and 25 vol% organic collagen while containing approximately 25 vol% water (Figure 1)
(Heymann 1993). Dentin is intrinsically saturated with water and has a higher outward
pressure from the pulp as compared to enamel and render the two tooth tissues very
different (Kerdvongbundit, Thiradilok et al. 2004). Due to its highly hydrated nature it is
more difficult to adhere to dentin as compared to enamel which has less water, higher
surface energy, and more inorganic material which is more appropriate for efficient
bonding with bonding systems that contain hydrophobic resins (Nordenvall, Brannstrom
et al. 1980).
Dentin
Water
Inorganic
Organic
Enamel
Water
Inorganic
Organic

8
Dentists prepare a tooth using a bur or other instrument and the residual debris
forms a smear layer on the cut tooth surface (Bowen 1984). The smear layer is composed
of hydroxyapatite, altered collagen, and a gellike collagen which all stand as a physical
barrier for adhesive resin and bonding agent to directly contact tooth structure (Eick,
Cobb et al. 1991). Debris covers the surface of enamel and dentin and needs to be
dissolved or made permeable so the resin monomers in the adhesive can infiltrate to the
tooth surface. For that reason, either acid or another form of etchant is applied so that
resin bonding monomers can bypass the residual components of debris and penetrate
deep into the tooth structure. Thus,
the acid conditioning objectives are to
remove the smear layer and to make
enamel and dentin surfaces more
receptive for bonding.
For adhesives to adequately
bond to the tooth surface they need
to have intimate contact as well as sufficient wetting (Figure 2). The surface tension of
the adhesive will need to be less than that of surface energy of the tooth structure for
adequate wetting to occur (Erickson 1992). Enamel is comprised primarily of
hydroxyapatite and has a high surface energy whereas dentin has a higher organic content
causing it to have low surface energy. Thus, an intermediate resin primer is required to
unite the tooth substrate to resin bonding agent.
Figure 2: Example of surface wetting. Wetting of a surface by a liquid is characterized by the contact angle of a droplet that is placed on the surface. Sufficient wetting happens when the adhesive has less surface tension than the surface energy of the tooth surface.
9
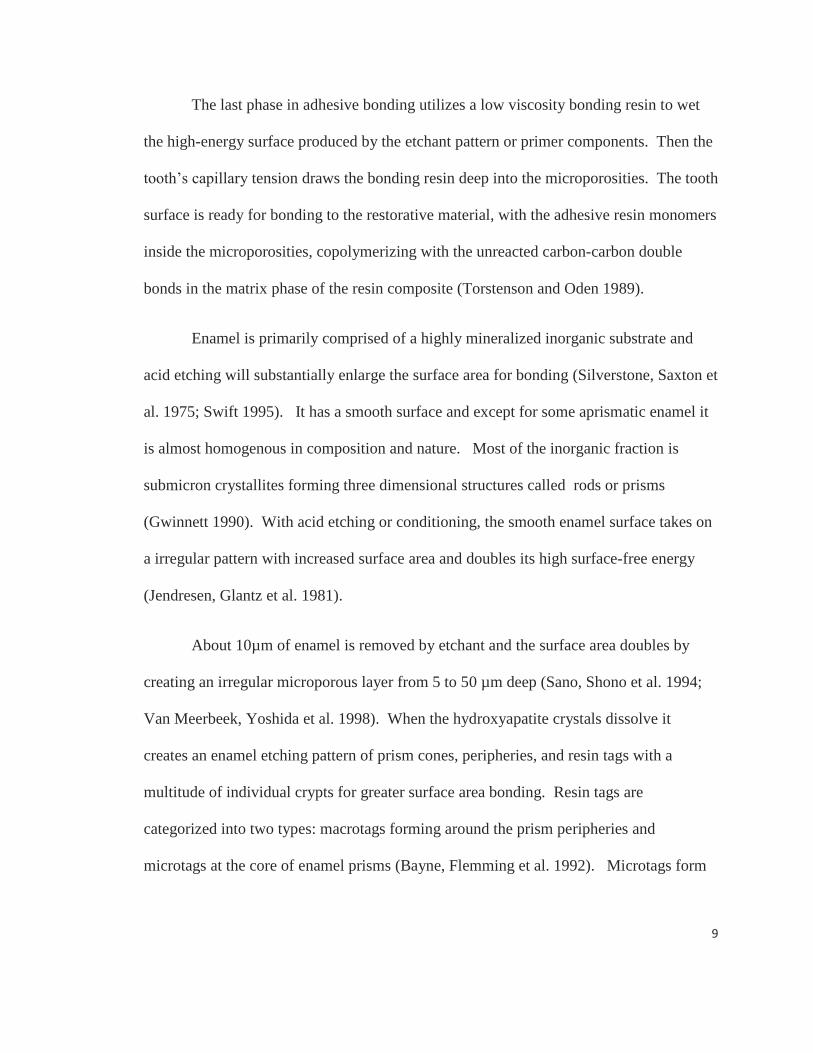
The last phase in adhesive bonding utilizes a low viscosity bonding resin to wet
the high-energy surface produced by the etchant pattern or primer components. Then the
tooth’s capillary tension draws the bonding resin deep into the microporosities. The tooth
surface is ready for bonding to the restorative material, with the adhesive resin monomers
inside the microporosities, copolymerizing with the unreacted carbon-carbon double
bonds in the matrix phase of the resin composite (Torstenson and Oden 1989).
Enamel is primarily comprised of a highly mineralized inorganic substrate and
acid etching will substantially enlarge the surface area for bonding (Silverstone, Saxton et
al. 1975; Swift 1995). It has a smooth surface and except for some aprismatic enamel it
is almost homogenous in composition and nature. Most of the inorganic fraction is
submicron crystallites forming three dimensional structures called rods or prisms
(Gwinnett 1990). With acid etching or conditioning, the smooth enamel surface takes on
a irregular pattern with increased surface area and doubles its high surface-free energy
(Jendresen, Glantz et al. 1981).
About 10µm of enamel is removed by etchant and the surface area doubles by
creating an irregular microporous layer from 5 to 50 µm deep (Sano, Shono et al. 1994;
Van Meerbeek, Yoshida et al. 1998). When the hydroxyapatite crystals dissolve it
creates an enamel etching pattern of prism cones, peripheries, and resin tags with a
multitude of individual crypts for greater surface area bonding. Resin tags are
categorized into two types: macrotags forming around the prism peripheries and
microtags at the core of enamel prisms (Bayne, Flemming et al. 1992). Microtags form
10
in multitudes of crypts where bonding resin monomers can adhere to them and are
probably the reason for increased bond strength.
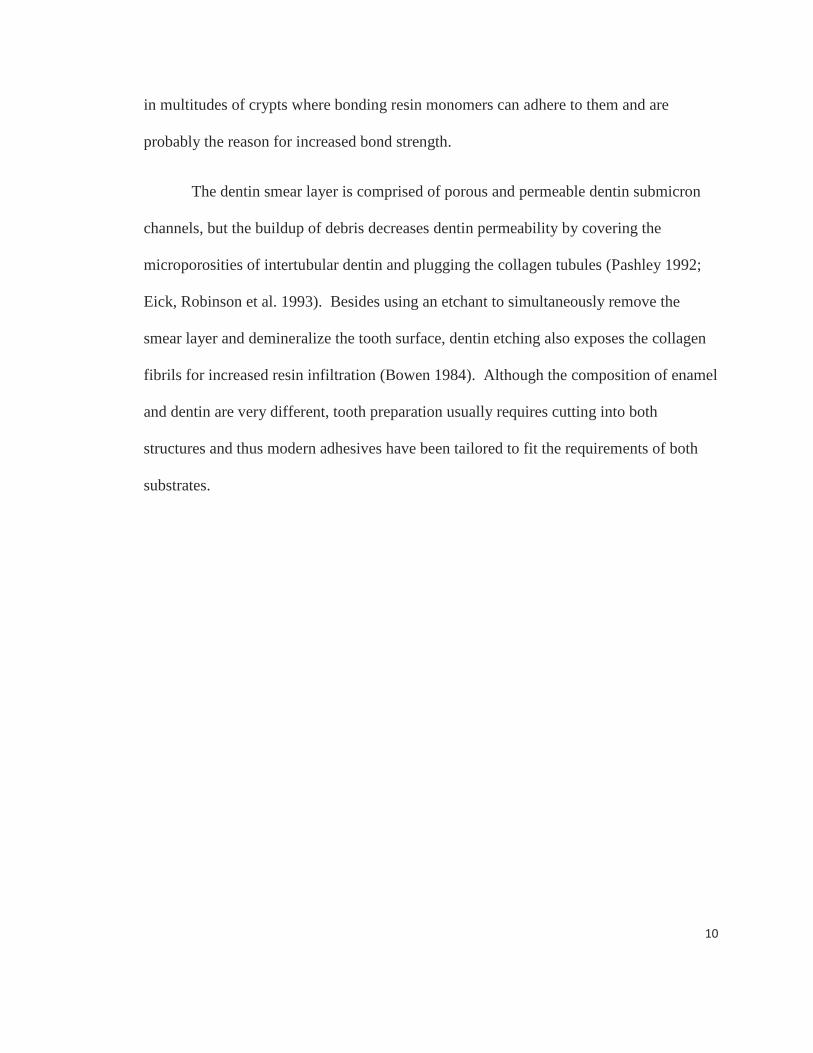
The dentin smear layer is comprised of porous and permeable dentin submicron
channels, but the buildup of debris decreases dentin permeability by covering the
microporosities of intertubular dentin and plugging the collagen tubules (Pashley 1992;
Eick, Robinson et al. 1993). Besides using an etchant to simultaneously remove the
smear layer and demineralize the tooth surface, dentin etching also exposes the collagen
fibrils for increased resin infiltration (Bowen 1984). Although the composition of enamel
and dentin are very different, tooth preparation usually requires cutting into both
structures and thus modern adhesives have been tailored to fit the requirements of both
substrates.

11
DENTAL ADHESIVE SYSTEMS
Adhesives work by exchanging inorganic tooth material for resin and the degree
of exchange differs among adhesive type (Tao and Pashley 1988; Van Meerbeek 2001).
Contemporary adhesives are carried out in one, two, or three application steps and the
different approaches are classified by: etch-and-rinse, self-etch, and glass ionomer
adhesives. Etch-and-rinse and self-etch adhesives involves the application of 1)
conditioner or acid etchant, 2) primer, and lastly, 3) adhesive resin.
The most conventional adhesive systems on the market today are the 4th
and 5th
generation etch-and-rinse systems. These adhesive systems both operate with a separate
etchant step. The 4th
generation system carries out each adhesive step separately
whereas the 5th
generation system combines the primer and adhesive steps into a single
component application. The more recent self-etch systems omit the separate etchant step
by combining the etchant with a primer followed by adhesive application (6th
generation),
or will include all adhesive steps into one application as in the 7th
generation system.
The etch-and-rinse strategy uses a separate acid or conditioning step to remove
the smear layer and to demineralize the more superficial hydroxyapatite crystals. A
mixture of resin monomers in the primer and adhesive is applied to infiltrate the etched
dental surface. The three-step etch-and-rinse adhesive systems are considered the golden
standard and have demonstrated superior performance over the two-step etch-and-rinse
and self-etch adhesive systems in clinical and in vitro studies (Inoue, Vargas et al. 2001;
Inoue, Vargas et al. 2003).

12
Self-etching adhesives do not require a separate etching step, since they condition
and prime tooth structure simultaneously. The self-etch components partially
demineralize the hydroxyapatite layer and work to penetrate beyond the smear layer
while simultaneously infiltrating the tooth structure. This resin-infiltrated layer is the
hybrid zone composed of minerals and the smear layer (Van Meerbeek, De Munck et al.
2003). Self-etching adhesives are less technique sensitive and reduce application time
but etching with phosphoric acid as a separate step surpasses self-etching adhesives in
clinical longevity (Perdiago, Gomes et al. 2005).
13
CHAPTER III: REVIEW OF LITERATURE
FACTORS INFLUENCING ADHESIVES
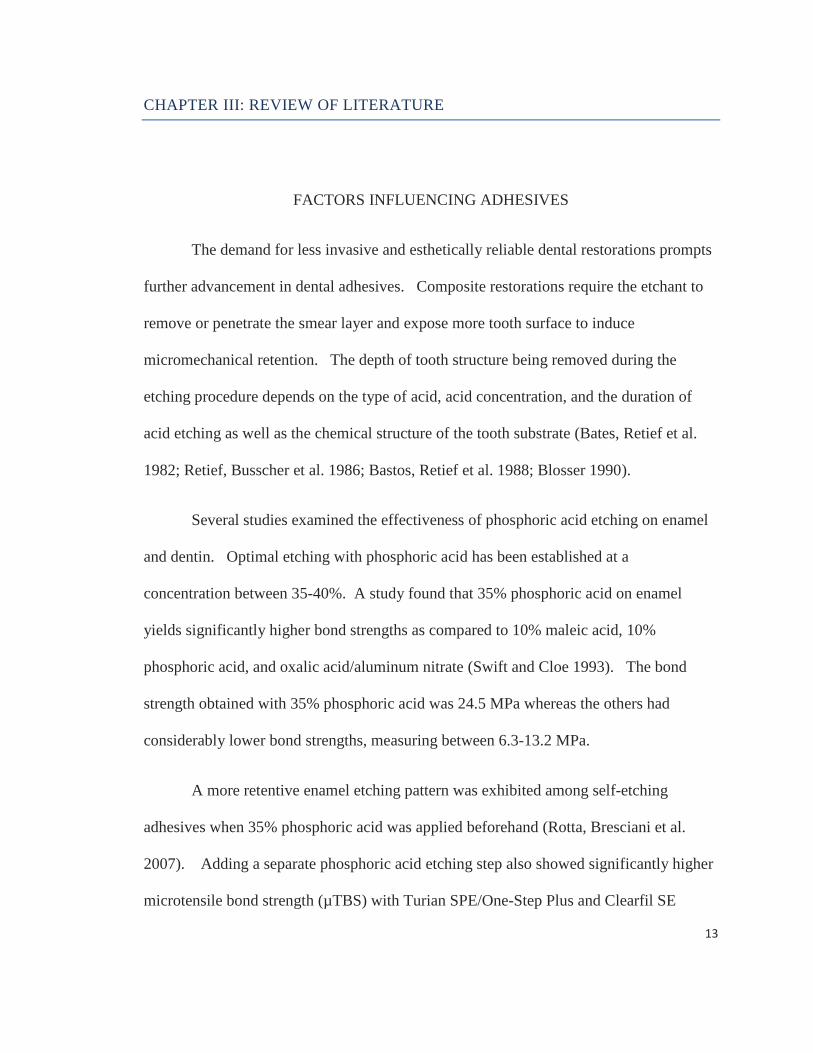
The demand for less invasive and esthetically reliable dental restorations prompts
further advancement in dental adhesives. Composite restorations require the etchant to
remove or penetrate the smear layer and expose more tooth surface to induce
micromechanical retention. The depth of tooth structure being removed during the
etching procedure depends on the type of acid, acid concentration, and the duration of
acid etching as well as the chemical structure of the tooth substrate (Bates, Retief et al.
1982; Retief, Busscher et al. 1986; Bastos, Retief et al. 1988; Blosser 1990).
Several studies examined the effectiveness of phosphoric acid etching on enamel
and dentin. Optimal etching with phosphoric acid has been established at a
concentration between 35-40%. A study found that 35% phosphoric acid on enamel
yields significantly higher bond strengths as compared to 10% maleic acid, 10%
phosphoric acid, and oxalic acid/aluminum nitrate (Swift and Cloe 1993). The bond
strength obtained with 35% phosphoric acid was 24.5 MPa whereas the others had
considerably lower bond strengths, measuring between 6.3-13.2 MPa.
A more retentive enamel etching pattern was exhibited among self-etching
adhesives when 35% phosphoric acid was applied beforehand (Rotta, Bresciani et al.
2007). Adding a separate phosphoric acid etching step also showed significantly higher
microtensile bond strength (µTBS) with Turian SPE/One-Step Plus and Clearfil SE

14
Bond, two self-etching adhesives that contain a milder acid concentration than other self-
etch adhesives in the study conducted by Rotta, et al. The same study indicated that self-
etch adhesives with stronger acids have a higher bond strength, but adding a separate etch
step did not significantly improve the bond strength. Van Meerbeek further examined the
effects of self-etch adhesives on enamel with additional phosphoric acid pre-treatment
and stated that less marginal defects at the enamel side were noticed (Van Meerbeek,
Kanumilli et al. 2005).
Further research indicates that adding a separate phosphoric acid etch prior to the
application of self-etch adhesives should be limited to enamel since dentin micro-TBS
was significantly decreased (Van Landyt, Kanumilli et al. 2005). They examined SEM
and transmission electron microscopy (TEM) images and found that separate phosphoric
acid etching on enamel results in a better micro-retentive surface. While it is important
to have sufficient demineralization of dentinal tooth surface to allow adhesive penetration
for hybrid layer formation there is a depth limit where too much etching will prevent the
adhesive resin from reaching the bottom of the demineralized network (Wang and
Spencer 2004). The reduced dentin micro-TBS with additional acid etching with self-
etch adhesives is due to a poor resin infiltration of the hybrid zone (Bolanos-Carmona,
Gonzalez-Lopez et al. 2008). While additional phosphoric acid application or stronger
self-etch approach appears more favorable for enamel bonding, mild self-etch adhesive
that leaves hydroxyapatite within a submicron hybrid layer available for additional
chemical interaction provides better bonding to dentin (Moura, Pelizzaro et al. 2006).
15
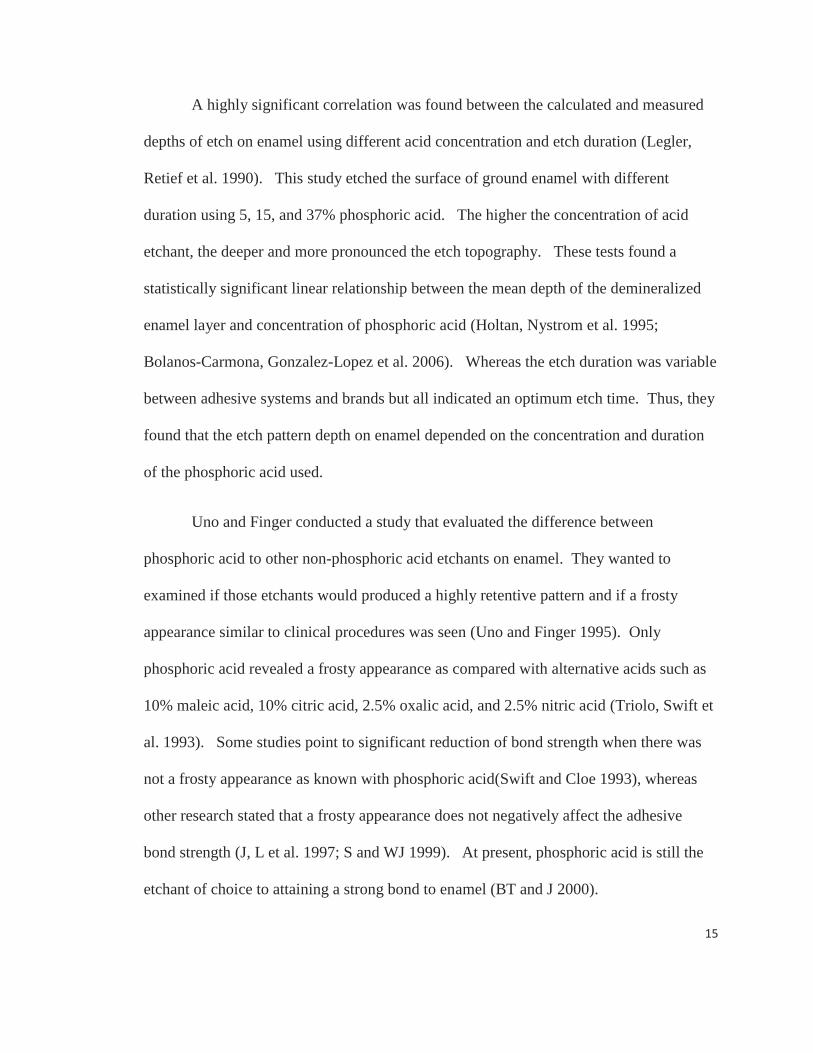
A highly significant correlation was found between the calculated and measured
depths of etch on enamel using different acid concentration and etch duration (Legler,
Retief et al. 1990). This study etched the surface of ground enamel with different
duration using 5, 15, and 37% phosphoric acid. The higher the concentration of acid
etchant, the deeper and more pronounced the etch topography. These tests found a
statistically significant linear relationship between the mean depth of the demineralized
enamel layer and concentration of phosphoric acid (Holtan, Nystrom et al. 1995;
Bolanos-Carmona, Gonzalez-Lopez et al. 2006). Whereas the etch duration was variable
between adhesive systems and brands but all indicated an optimum etch time. Thus, they
found that the etch pattern depth on enamel depended on the concentration and duration
of the phosphoric acid used.
Uno and Finger conducted a study that evaluated the difference between
phosphoric acid to other non-phosphoric acid etchants on enamel. They wanted to
examined if those etchants would produced a highly retentive pattern and if a frosty
appearance similar to clinical procedures was seen (Uno and Finger 1995). Only
phosphoric acid revealed a frosty appearance as compared with alternative acids such as
10% maleic acid, 10% citric acid, 2.5% oxalic acid, and 2.5% nitric acid (Triolo, Swift et
al. 1993). Some studies point to significant reduction of bond strength when there was
not a frosty appearance as known with phosphoric acid(Swift and Cloe 1993), whereas
other research stated that a frosty appearance does not negatively affect the adhesive
bond strength (J, L et al. 1997; S and WJ 1999). At present, phosphoric acid is still the
etchant of choice to attaining a strong bond to enamel (BT and J 2000).

16
A few studies validated manufacturer’s instruction time of 15 seconds as the ideal
etching time on enamel and dentin (Pioch, Stotz et al. 1998). Shorter etch times for
enamel and dentin may not provide enough depth for maximum resin infiltration and
result in poor bond strength. However, longer etch times for dentin produced
unnecessarily deep demineralization that required deeper resin impregnation producing
thicker hybrid layers that are not associated with higher bond strength. Research on etch-
and-rinse adhesive systems have indicated significant differences in bond strength
depending on the etch durations (Miyazaki, Platt et al. 1996). It can be concluded that
adhesives can be technique sensitive where different methods can attain optimal bonding.

17
ADHESIVE APPLICATION METHODS: ACTIVE VS. PASSIVE ETCHING
Adhesive systems aim for close micromechanical bonding, maximum bond
strength, reduced nano or microleakage, and prolonged longevity of the restoration to
tooth structure. Active application of adhesives has been shown to increase bond
strengths under certain conditions. Many studies have revealed that actively scrubbing
the component that contains the etchant will increase bond strength of the restoration. In
self-etch adhesive systems the primer contains the etchant component. Manually
scrubbing the primer component of self-etch systems can provide a consistent etch and
enhance the interaction of acid monomers by dispersing etching by-products on the
prepared enamel surface (Miyazaki, Platt et al. 1996). This active scrubbing can
disperse trapped air bubbles and mix by-products in the etchant for better removal as well
as keep fresh acidic solution in contact with tooth structure for a more aggressive
demineralization.
It has been made known that etch pattern and bond strengths are significantly
lower with one-step adhesives as compared to total-etch adhesives (De Munck, Van
Meerbeek et al. 2003). However, a study evaluating the micro-tensile bond strength
(µTBS) and nanoleakage of a 7th
generation one-step self-etch adhesive system has
recommended active application to improve bonding performance on dentin (do Amaral,
Stanislawczuk et al. 2009). Three one-step adhesives were tested (Clearfil S3 Bond,
Xeno III, and Adper Prompt L-Pop) and all showed significantly higher bond strength
within a 24 hours testing time when actively scrubbing the adhesive. From the three
adhesives tested with active application, two demonstrated higher bond strength and less

18
nanoleakage after a 6 months period in vitro. It has been suggested that agitation of the
adhesive will increase water evaporation for better chemical interactions of hydrophilic
and hydrophobic monomers (Tay and Pashley 2001). Passive application does not
promote water evaporation which causes a poor hybrid zone with a reduced amount of
resin monomers incorporated into the smear layer. This incomplete resin infiltration
into demineralized dentin is a drawback with strong self-etching adhesives since
longevity is jeopardized (Spencer, Wang et al. 2000).
The twofold study conducted by do Amaral showed that after 6 months the bond
strengths of Adper Prompt-L-Pop when applied with or without agitation were
comparable, but the treatment without agitation had significantly more nanoleakage.
The continuation of dentin demineralization as seen by nanoleakage can be explained by
the possibility of incomplete polymerization of monomers, which continued the process
of hydrolysis after curing and additional release of phosphoric acid (Oliveira, Marshall et
al. 2004). Regarding one-step self-etch adhesives, agitation by actively scrubbing onto
dentin is recommended for better bonding performance and longevity.
A study comparing active agitating vs. passive application of a one-step 7th
generation adhesive on enamel showed a deeper etching pattern for the active application
group (Ando, Watanabe et al. 2008). SEM images indicated agitation produced a more
evident etch pattern with less surface debris. It was suggested that active adhesive
treatment would enhance adhesive resin penetration and achieve greater micromechanical
interaction with the underlying enamel. Active agitation of one-step adhesives seems to

19
be encouraged for both enamel and dentin to increase bond performance and longevity as
well as less degradation.
Two conjunctive studies revealed that dentin bond strengths are dependent on the
pressure applied during active application of an acetone and ethanol/water based adhesive
systems. Dry dentin surfaces treated with vigorous agitation had significantly increased
bond strengths reaching 37.11 ± 7.3 MPa with an ethanol/water based adhesive, Single
Bond (3M ESPE) and an acetone based adhesive, One-Step (Bisco). However, wet
dentin surfaces only need slight agitation to attain high bond strengths (41.82 ± 8.4 MPa)
since vigorous agitation gave comparable bond strengths (38.89 ± 8.2 MPa) (Dal-Biano,
Pellizzaro et al. 2006; Reis, Pellazaro et al. 2007).
Acetone has been shown to be effective with wet dentin surfaces due to the
“water-displacing” ability of acetone (Kanca 1992). Water-displacing raises vapor-
pressure and explains some of the kinetics during primer application. Though it seems
as if acetone-based solvents perform better, others have reasoned other expectations in
the clinical setting. Clinically, dentin may desiccate before the primer is placed or
acetone may evaporate and not provide results seen in vitro. It is critical to keep dentin
moist since collapsed collagen will interfere with resin infiltration and water-based
primers that keep dentin moist may be more effective in clinical settings. Accordingly,
adhesive systems generate different effects with primer agitation and successful bond
strength is achieved when considering acid concentration, application duration, and
drying times.

20
Active application of the primer component on enamel with self-etching
adhesives have also demonstrated higher bond strengths (Miyazaki, Hinoura et al. 2002).
They concluded that agitation and drying time of primer can influence enamel bond
strengths by dispersing the adhesive evenly along the tooth surface. A similar study
examined ultramorphological changes after agitation of self-etching primers on enamel
and found that better etch patterns were noticed with agitation of adhesive. However,
active application only significantly improve bonding efficacy for some of the two-step
adhesives in the study (Cehreli and Eminkahyagil 2006). Therefore, increase in bond
strength on enamel with primer agitation for two-step self-etching adhesives appears to
be dependent on the material used.
Miyazaki et. al went on to conduct a similar study on dentin and although bond
strengths were higher when primer was agitated the results were not significant
(Miyazaki, Platt et al. 1996). The effect of agitating with primer was conducted
concurrently with air-drying time and there was an optimal range of drying times. It is
believed that the slight increase in bond strength with agitation is probably due to
diffusion of the amphiphilic monomer into the collagen mesh. Other studies were in line
with these findings with agitation of water-based primer on wet or dry dentin (Jacobsen
and Soderholm 1998) (Miears, Charlton et al. 1995; Finger and Uno 1996).
Velasquez et al. used a mild two-step self-etching system, Clearfil SE Bond, to
find that shear bond strength to dentin improved significantly with agitation for 20
seconds, with some improvement for 10 seconds, and no difference for 30 seconds
agitations (Velasquez and Sergent 2006). Finding the best application time is important

21
since acid monomer may not adequately etch and penetrate tooth structure, thereby
producing a poor bond.
Chan and others demonstrated significantly higher bond strengths when agitating
the primer component from 6th
and 7th
generation adhesive systems (Chan, Tay et al.
2003). SEM images indicated that actively scrubbing a thick layer of primer effectively
dissolved the smear layer and created a thicker hybrid zone. Thus, technique-sensitive
factors such as agitation, duration, and amount of adhesive can benefit the bond strength
when using self-etching systems on dentin.
Many studies have demonstrated that achieving optimal bonding is technique
sensitive and is dependent upon many factors. The presented cases have illustrated
significant improvement in bond strength with active application. However, there has
not been a study examining the effect of agitation of etchant on either enamel or dentin.
Considering literature information, this study aims to examine the bond strength and resin
infiltration when actively applying etchant on enamel.

22
PURPOSE AND SIGNIFICANCE OF THESIS RESEARCH
Clinical problems such as microleakage at the restoration tooth interface, influx of
fluids, or bacteria growth at the cavity wall can be prevented with adhesives that obtain a
more intimate bonding to the tooth structure. Longevity of the restoration can be
enhanced by adhesives that create intimate bonding and thereby minimize problems such
as postoperative sensitivity, marginal staining, and recurrent caries.
The goal of this research project is to investigate the influence of active
application as compared to passive application of the etchant component in a 4th
generation system of etch-and-rinse adhesives on enamel adhesion. Studies have shown
that enamel etching which increases surface area of the tooth allows a more intimate
bonding of the composite to the tooth (Swift 1995). Many studies have indicated that
active application versus passive application of various adhesive components to both
dentin and enamel increases bond strength (Velasquez 2006).
A hypothesized increase in adhesive bond strength by active application will be
investigated by determining various factors involved in composite to tooth bonding. The
statistical values and effect of active vs. passive application of etchant will be compared.
The results of this study will help to clarify the clinical value as well as the tooth
morphology with active acid etchant application during dental restoration preparation.
Ultimately, restoration longevity will be increased if active application of etchant is a key
component in increasing composite bonding to the enamel tooth structure. Specifically, I
will address the following points: (1) Examine whether active application of etch on
enamel will significantly increase microshear bond strength, (2) determine the mode of
23
failure when testing the bond strength, and (3) observe the etch pattern and analyze the
differences caused by the different treatments of active scrubbing and passive application
of etchant. The null hypothesis for this project states that actively applying acid etchant
on enamel will not be significantly different as compared to passive treatment of etchant.
This study will address the goals of the project by the following applications. (1)
Examine whether active application of etch on enamel will significantly increase
microshear bond strength. Microshear bond stress will be measured and compared
between enamel that was prepared with active application and with passive application of
an etchant. I will apply the acid etchant with active or passive rubbing on prepared
enamel surface. A test jig will be used to measure the micro shear bond stress (µSBT) of
the composite resin. (2) Determine the mode of failure when testing the bond strength.
Failure mode will be examined with a scanning electron microscopy, SEM at 200x
magnification and the mode of failure will be identified as the following: i) adhesive
interface between tooth and adhesive (A), ii) mixed with tooth and adhesive or composite
resin (M), iii) cohesive within tooth (Co-T), or vi) cohesive within the composite (Co-C).
Any variation or significance of failure mode between the etch groups will be assessed.
Lastly, (3) Observe etch pattern and analyze the differences caused by the different
treatments of active scrubbing and passive application of etchant. I will examine the
surface area after shear bond testing using a SEM at 200X and calculate the amount of
resin tags remaining on the tested tooth surface with a software imaging program.
Surface roughness length will be measured and compared between the two treatments.
Observation in changes in surface morphology between the two treatments will be

24
considered in combination with surface roughness analysis. Statistical analysis will be
calculated to determine the significance of active vs. passive application of etchant.

25
CHAPTER IV: METHODS
SAMPLE ACQUISITION
Human molars within six months of extraction were available through dental
clinics and maintained in 0.5% chloramine T. 30 sound, non-carious and restoration
free, human molars were used. 20 teeth for Part A: microshear bond strength testing, five
teeth for Part B: evaluating surface morphological changes, and five teeth for Part C:
resin infiltration evaluation.
The 30 teeth were randomly divided into two groups, active or passive application
of etchant. One group was treated with scrubbing of acid etchant and the other group
represented the control where acid application was done according to manufacturer’s
instructions. The buccal and lingual enamel surfaces were prepared for “cut” enamel
adhesion testing.
26
PART A: TOOTH PREPARATION FOR MICROSHEAR BOND TEST
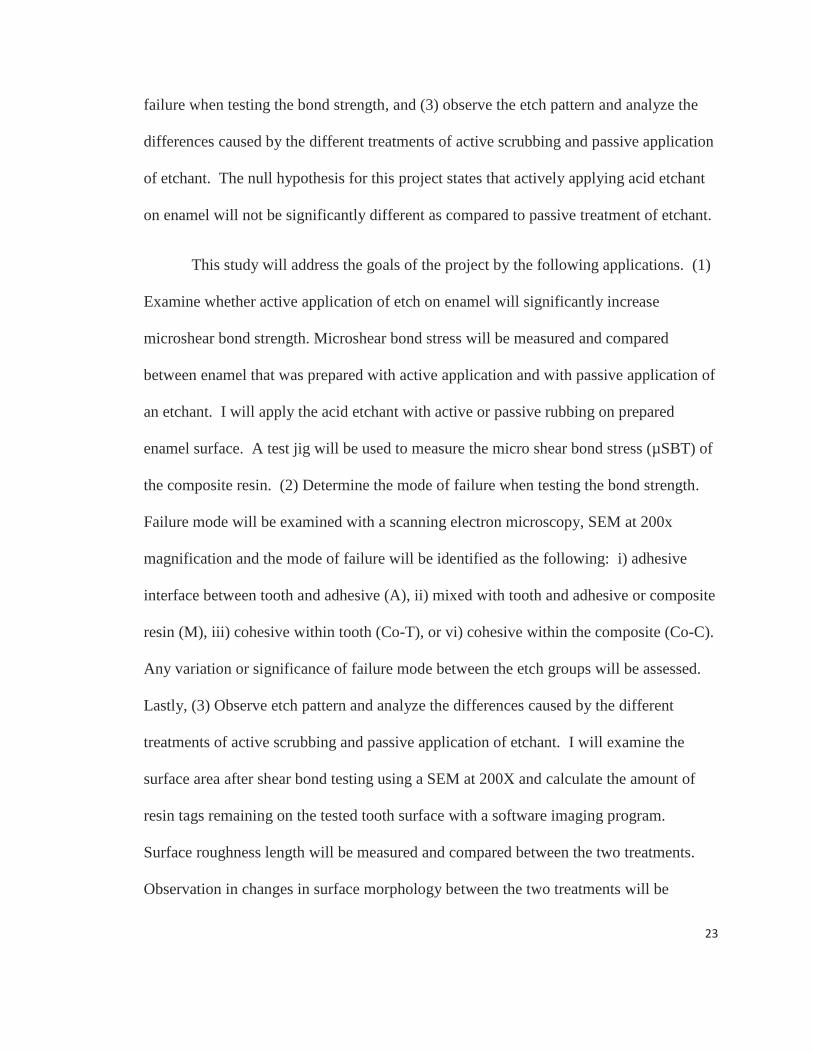
For microshear bond testing on enamel: the buccal and/or lingual enamel was
reduced to be free of dentin or exposures. The tooth was sectioned mesial/distally to
produce two pieces for testing. The tooth or tooth section was mounted with dental
stone in a fixture to produce blocks
with the tooth surface rising above
the stone and parallel to the base.
The specimens were stored in
100% humidity until testing (i.e.
within one week). “Cut” enamel surfaces were reground on 600 grit SiC paper before
bonding. Surfaces were treated with Optibond FL (Kerr, Orange, CA) etch-and-rinse
adhesive by either of the two methods: a) active scrubbing application or b) passive
stationary application of 37.5% phosphoric acid gel for 15 seconds (Figure 3). Thus,
etchant is the 37.5% phosphoric acid gel that was injected onto prepared enamel surface
and was either scrubbed (medium pressure) with a flexible disposable micro-brush
applicator (Kerr, Orange, CA) held at a 45° angle or applied passively for 15 seconds.
Rinse time was standardize at 10 seconds per sample with a stream of water directed
above the etched surface. The samples were then lightly dried for 5 seconds with an air
syringe held at a distance of 10 inches. The etched enamel surface was followed by
adhesive resin according to manufacturer’s instructions and irradiated for 20 seconds
with a Demi LED curing unit (Kerr, Middleton, WI). The Demi LED had an output >
~700 mW/cm2 and emitted from a large head allowing curing of the entire surface at one
Figure 3: Active and passive application of acid etchant onto ground enamel.
27
time. Tygon ® polyvinylchloride (PVC) tubing with 1.00 mm diameter was cut into 2
mm lengths. The tubing was filled with composite, Tetric EvoFlow (Ivoclar Vivadent,
Amherst, NY), and placed over prepared enamel surface and irradiated for 30 seconds
according to manufacturer’s instructions. Within 1 minute of curing the composite, the
specimen was then stored in 100% humidity at 37C for 24 hours and tubing was
removed and specimen was subjected for microshear bond testing.

28
MICROSHEAR BOND TESTING
Each prepared tooth was placed into an Instron universal mechanical testing
machine (Instron Corp., Boston, MA) and a max force and load data was programmed
using TestWorks ™ for Window (MTS Systems Corp by SINTECH, version 3.08). A
shear load gripping arrangement was made where a wire loop (~0.03 mm in diameter)
wraps around the specimen immediately adjacent to the composite/tooth substrate
Figure 4: Test jig and shear apparatus for microshear bond testing.
Interface (Figure 4). Thus, the pull of the Instron machine was parallel to the composite
specimen base. Cross-sectional area was determined by measuring the specimen area
(1.00mm2) and the failure mode was set at shear. Shear stress is computed by
TestWorks ™ for Window where the shear stress formula was (т = Force/Area) used to
calculate the stress in kilogram and MPa. Each specimen was tested to failure in shear

29
mode and loaded to failure at a crosshead speed of 1 mm/minute at a 100 lb. full scale.
Microshear stress was computed by dividing observed maximum load by the adhesion
area (n = 4 to 5 tests per tooth). Shear bond stress is most appropriate for my test
objective since it allows us to compare the results with other tests done in vitro and vivo.
Thus, measuring shear stress can be clinically sufficient.
30
BOND FAILURE MODE
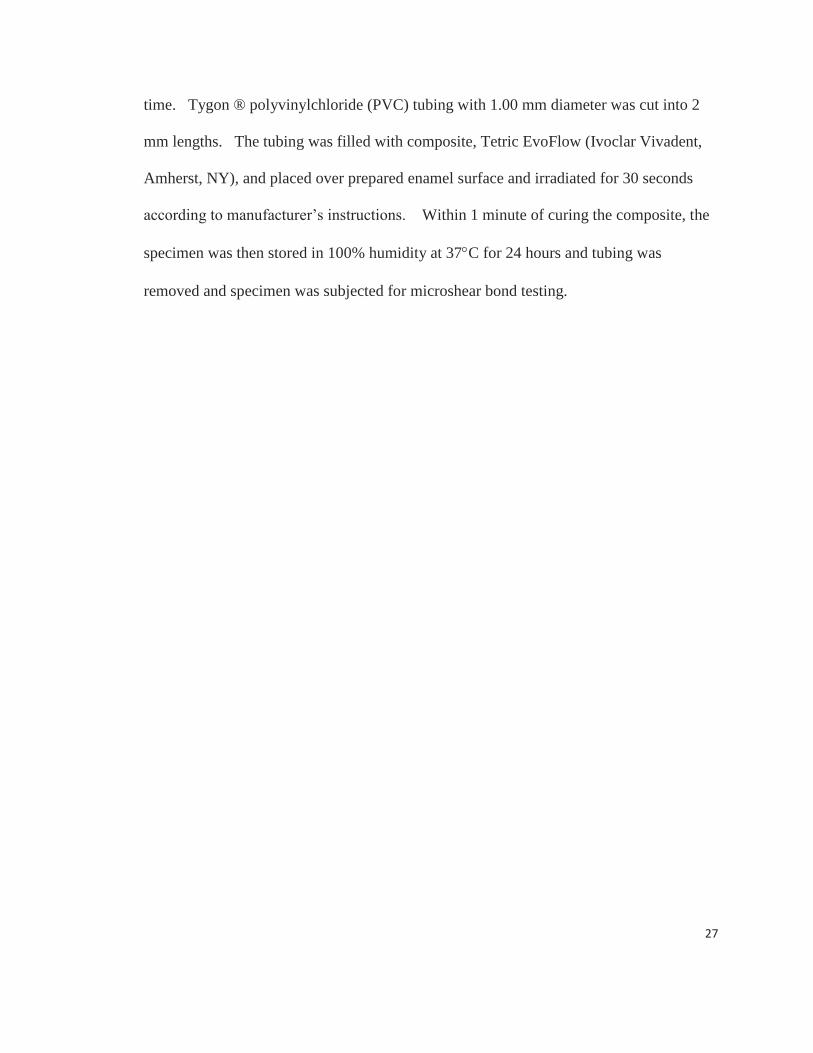
The failure site was evaluated with a scanning electron microscopy, SEM (Oxford
Instruments, Austin, TX). The failures site was viewed at 200X magnification and the
failure mode identified as: i) adhesive interface between tooth and adhesive (A), ii) mixed
with tooth and adhesive or composite resin (M), iii) cohesive within tooth (Co-T), or vi)
cohesive within the composite (Co-C).
Figure 5: Illustration of failure sites for microshear bond strength.
Adhesive
Co-Tooth
Co-Com
Mixed
31
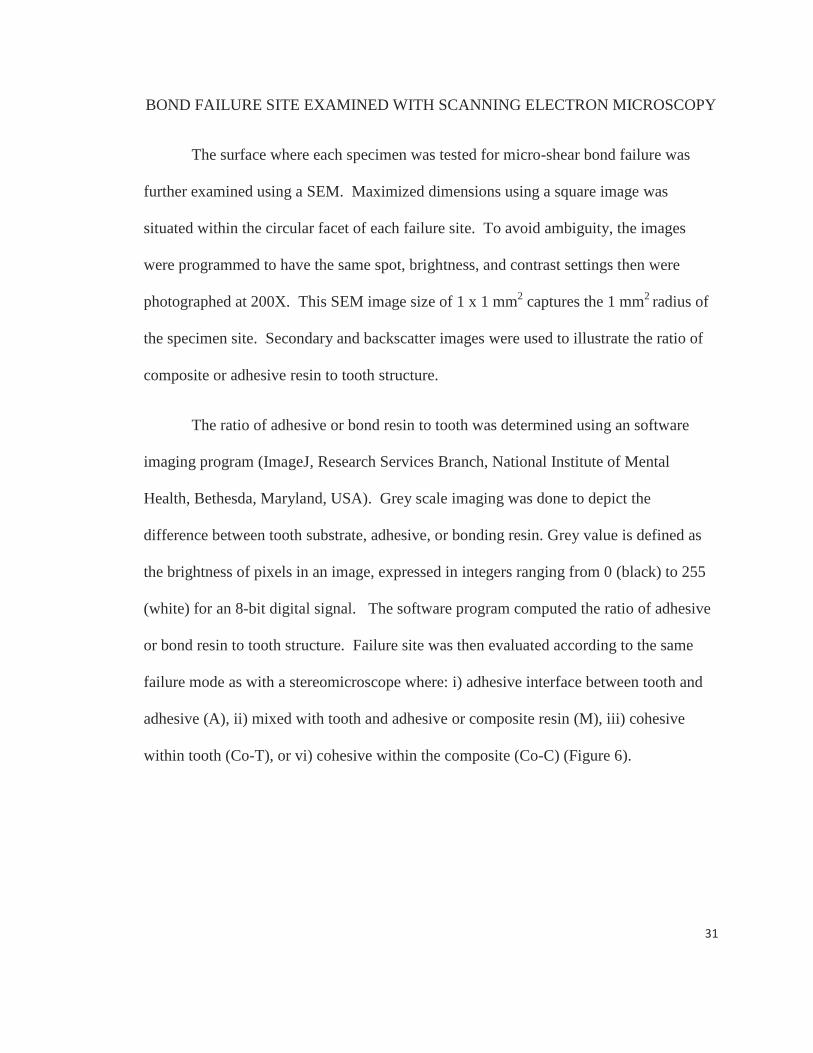
BOND FAILURE SITE EXAMINED WITH SCANNING ELECTRON MICROSCOPY
The surface where each specimen was tested for micro-shear bond failure was
further examined using a SEM. Maximized dimensions using a square image was
situated within the circular facet of each failure site. To avoid ambiguity, the images
were programmed to have the same spot, brightness, and contrast settings then were
photographed at 200X. This SEM image size of 1 x 1 mm2 captures the 1 mm
2 radius of
the specimen site. Secondary and backscatter images were used to illustrate the ratio of
composite or adhesive resin to tooth structure.
The ratio of adhesive or bond resin to tooth was determined using an software
imaging program (ImageJ, Research Services Branch, National Institute of Mental
Health, Bethesda, Maryland, USA). Grey scale imaging was done to depict the
difference between tooth substrate, adhesive, or bonding resin. Grey value is defined as
the brightness of pixels in an image, expressed in integers ranging from 0 (black) to 255
(white) for an 8-bit digital signal. The software program computed the ratio of adhesive
or bond resin to tooth structure. Failure site was then evaluated according to the same
failure mode as with a stereomicroscope where: i) adhesive interface between tooth and
adhesive (A), ii) mixed with tooth and adhesive or composite resin (M), iii) cohesive
within tooth (Co-T), or vi) cohesive within the composite (Co-C) (Figure 6).

32
Figure 6: Example of failure site with SEM. Left image shows mixed (M) failure which is a combination of adhesive(A) and cohesive failure, in this case, cohesive within composite failure (Co-C).

33
PART B: TOOTH PREPARATION FOR MORPHOLOGICAL EVALUATION
For surface morphological changes on enamel: the buccal and/or lingual enamel
was reduced to be free of dentin or exposures. “Cut” enamel surfaces were reground
on 600 grit SiC paper before treated with etchant. The teeth were bisected mesial
distally through the prepared enamel surface with a low-speed diamond saw under
coolant water spray to obtain buccal and lingual halves. Each tooth halves were
treated with Optibond FL (Kerr, Orange, CA) etch-and-rinse adhesive by either: a)
active scrubbing application or b) passive stationary application of 37.5% phosphoric
acid gel for 15 seconds. Thus, the buccal and lingual surfaces on each tooth was
treated with either active or passive application of etchant where either one of its
buccal or lingual surfaces was either scrubbed or not-scrubbed with etch. Rinse time
was standardize at 10 seconds per sample with a stream of water directed above the
etched surface and then air dried for 30 seconds. Thereafter, specimens were
mounted on aluminum stubs, sputter coated gold-palladium twice for 25 seconds
(Denton Vacuum Desk II sputter coater, Moorestown, NJ). Observations under
scanning electron microscopy were viewed at 20kV of accelerating voltage and
images were taken under 500x, 1,000x, 8,000x, and 20,000x magnification (Figure 7).

34

35
Figure 7: SEM images of enamel surface treated with scrubbing and passive application of etchant.

36
PART C: TOOTH PREPARATION FOR RESIN INFILTRATION
For resin infiltration evaluation on enamel: the buccal and/or lingual enamel was
reduced to be free of dentin or exposures. ). “Cut” enamel surfaces were reground on
600 grit SiC paper before bonding of restoration material. Each tooth was treated with
Optibond FL (Kerr, Orange, CA) etch-and-rinse adhesive by both of the two methods: a)
active scrubbing application or b) passive stationary application of 37.5% phosphoric
acid gel for 15 seconds. Thus, the buccal and lingual surfaces on each tooth was treated
with either active or passive application of etchant where either one of its buccal or
lingual surfaces was either scrubbed or not-scrubbed with etch. Rinsing time was
standardize at 10 seconds per sample with a stream of water directed above the etched
surface. The samples were then lightly dried for 5 seconds with an air syringe held at a
distance of 10 inches. The etched enamel surface was followed by adhesive resin
according to manufacturer’s instructions and irradiated for 20 seconds with an Demi LED
curing unit (Kerr, Middleton, WI). The Demi LED had an output > ~700 mW/cm2
and
emitted from a large head allowing curing of the entire surface at one time. Lastly,
composite, Tetric EvoFlow (Ivoclar Vivadent, Amherst, NY) was placed in one
application over prepared enamel surface and irradiated for 30 seconds according to
manufacturer’s instructions. The teeth were bisected buccal lingually through the
prepared enamel surface with a low-speed diamond saw under coolant water spray to
obtain mesial and distal halves. The cut surface was polished with 4,000 grit SiC paper
that was mounted on a rotating disk with running water for 4 minutes and then air dried.

37
Observations under scanning electron microscopy were viewed at 20kV of accelerating
voltage and images were taken under 500x, 3,000x, and 5,000x magnification.

38
Figure 8: SEM images of cross-sectional views of a dental restoration with scrubbing and passive application of etchant.
39
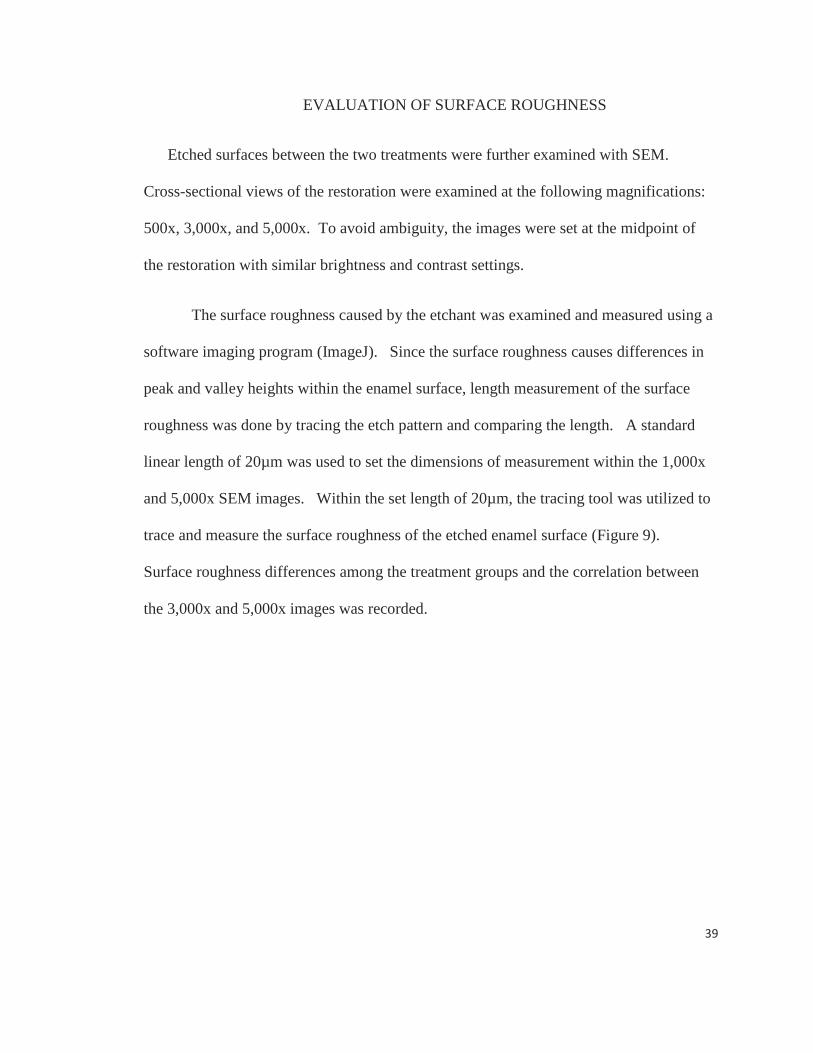
EVALUATION OF SURFACE ROUGHNESS
Etched surfaces between the two treatments were further examined with SEM.
Cross-sectional views of the restoration were examined at the following magnifications:
500x, 3,000x, and 5,000x. To avoid ambiguity, the images were set at the midpoint of
the restoration with similar brightness and contrast settings.
The surface roughness caused by the etchant was examined and measured using a
software imaging program (ImageJ). Since the surface roughness causes differences in
peak and valley heights within the enamel surface, length measurement of the surface
roughness was done by tracing the etch pattern and comparing the length. A standard
linear length of 20µm was used to set the dimensions of measurement within the 1,000x
and 5,000x SEM images. Within the set length of 20µm, the tracing tool was utilized to
trace and measure the surface roughness of the etched enamel surface (Figure 9).
Surface roughness differences among the treatment groups and the correlation between
the 3,000x and 5,000x images was recorded.

40
Figure 9: Measuring surface roughness in a cross-sectional view of dental restoration. Red arrow has a 20µm length where the surface roughness of the adhesive is traced in black.

41
DATA AND STATISTICAL ANALYSIS
Data were analyzed using statistical analysis software, SAS (version 9.1, SAS
Institute, Cary, NC). Response variables (bond strength, failure mode, and % resin) were
checked for normality and equal variance and were found to have fit the assumptions of
linear regression.
The objective was to determine the influence of treatment, scrubbing and non-
scrubbing of etchant, on bond strength. Each tooth was cut in half and since each
specimen was treated the same, the results were averaged for each tooth in a cluster
effect. This way, the variation due to the predictor variable within each tooth can be
accounted. Thus, the data is considered repeated because multiple responses were
measured from the same tooth. Given the design of the project, the most appropriate
model to use was the mixed effect model. Repeated measures and compound symmetry
matrix were used to analyze the repeated measures data. Further analysis of data was
done to thoroughly evaluate all data. Correlation between response variable and all
predictors between treatment groups as well as the amount of total resin to bond strength
were evaluated with Pearson’s correlation test. Chi square test was used to test the
frequency of failure mode in shear bond strength testing. The significance of etch pattern
surface roughness was evaluated with paired t-tests. Adjust p-values <0.05 were
considered statistically significant.

42
CHAPTER V: RESULTS
MICROSHEAR BOND STRENGTH
The simple statistics for the two treatment types, scrubbing and passive
application of etchant, is summarized in Tables 1 and 2. A complete dataset can be
located in the appendix. The two treatments, scrubbing and passive application are the
predictor variables, where response variables are observed as bond strength (Kg and
MPa), percent of resin (adhesive or bonding), and failure modes. The mean shear bond
strength for the two predictor variables, scrubbing and passive application are 23.56 +
6.06 and 23.22 +5.89 MPa, respectively. Histograms evaluating bond strength values in
MPa for each treatment group shows a normal distribution (Figure 11). Normal
probability plots also show a normal distribution among treatment groups in MPa (Figure
12). The boxplot shows similar bond strength results for both treatment groups with an
evenly distributed range of values (Figure 13). From our results we did not have any
obvious outliers and included all data.
A mixed effect model analysis was performed on the data between the two
treatment groups, scrubbing and passive application, and demonstrated no statistical
significance when taking in consideration the bond strengths or adhesive resin percentage
(p-value >0.05)(Tables 3 and 4).

43
Table 1: Standard simple statistics for full data set for active “scrubbing” treatment. Column depicting “missing” constitute to a cohesive in tooth (Co-T) failure where further bond strength testing could not be measured.
n missing min max Mean SD
Strength (Kg) 38 0 1.12 3.69 2.41 0.62
Strength (MPa) 38 0 10.85 36.12 23.56 6.06
Adh. Resin (%) 37 1 0.94 38.01 10.89 9.49
Bond Resin (%) 17 1 2.31 75.94 21.40 19.61
Total Resin (%)
Etch pattern 3,000x
Etch pattern 5,000x
37
5
5
1
0
0
2.23
27.83
28.29
82.21
35.56
33.99
19.33
30.90
30.73
17.97
2.84
2.38
Table 2: Standard simple statistics for full data set for the control group: “passive” application of etchant.
n missing min max Mean SD
Strength (Kg) 42 0 0.91 3.85 2.38 0.61
Strength (MPa) 42 0 8.86 37.64 23.22 5.89
Adh. Resin (%) 42 0 2.39 37.21 13.06 8.58
Bond Resin (%) 16 0 1.09 34.09 10.56 8.74
Total Resin (%)
Etch pattern 3,000x
Etch pattern 5,000x
42
5
5
0
0
0
2.48
20
20.93
51.04
22.29
22.22
15.43
21.42
21.61
12.55
0.73
0.92

44
Figure 10: Illustration of sample size for scrubbing and passive treatment group for the microshear bond strength test. Sample size of n=10 per treatment group where the composite sticks (blue buttons) vary between 2-3 specimens per tooth. Scrubbing group has a total of 38 specimens and passive group has 42 specimens. The bond strength of specimens on a particular tooth is average due to clustering effect of having the same tooth substrate.

45
Figure 11: Histogram showing normal distribution of scrubbing and passive application of etchant for microshear bond strength test for (MPa).
group=passive
7.5 12.5 17.5 22.5 27.5 32.5 37.5
0
10
20
30
40
50
P
e
r
c
e
n
t
strength_Mpa
group=Scrub
10 15 20 25 30 35
0
5
10
15
20
25
30
35
P
e
r
c
e
n
t
strength_Mpa
46
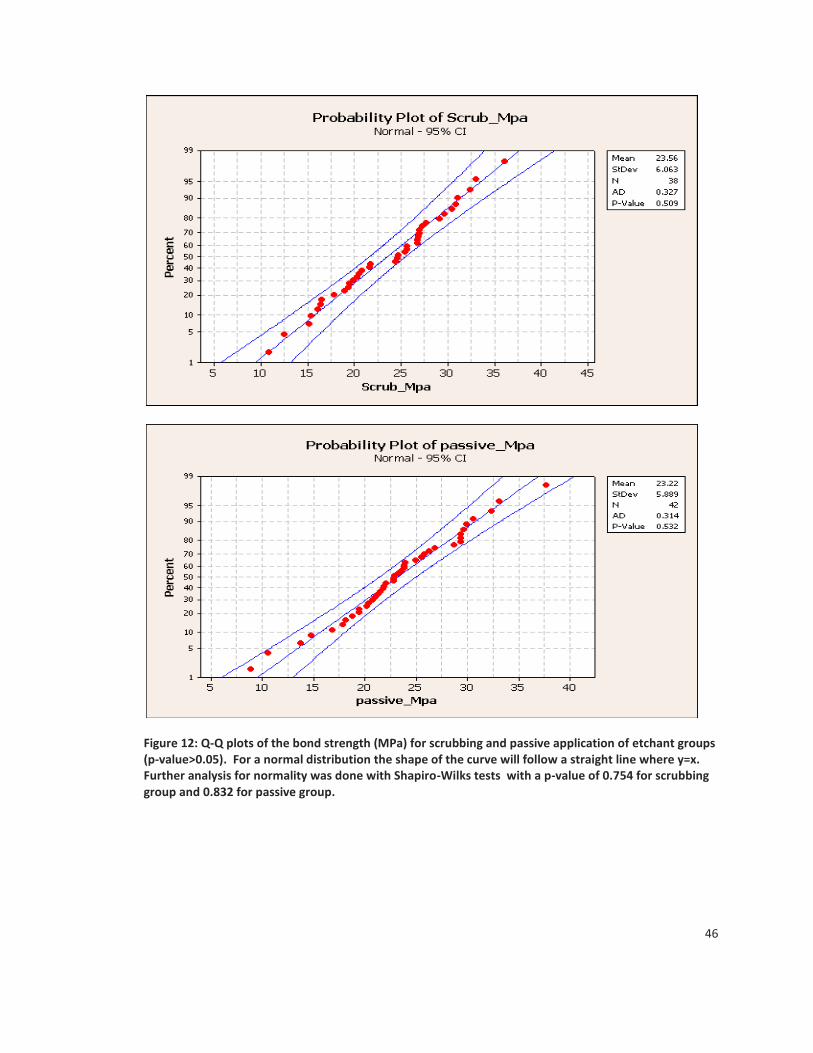
Figure 12: Q-Q plots of the bond strength (MPa) for scrubbing and passive application of etchant groups (p-value>0.05). For a normal distribution the shape of the curve will follow a straight line where y=x. Further analysis for normality was done with Shapiro-Wilks tests with a p-value of 0.754 for scrubbing group and 0.832 for passive group.

47
Figure 13: Boxplot of data demonstrating the distribution among individual samples per treatment group for microshear bond strength test. Mean is represented by red dotted lines and is essentially between the 5 and 95% confidence intervals which describe a good distribution.
Table 3: Mixed effect model summery statistics. No significant difference between the two treatments, scrubbing and passive, with regards the microshear bond strength (p-value>0.05).
Fixed Effects Estimate Std. Error t-value Pr>|t|
Strength (Kg) (Intercept) 2.380 0.095 25.05 <.0001
Scrubbing 0.029 0.138 0.22 0.829
Strength (MPa) (Intercept) 23.220 0.922 25.20 <.0001
Scrubbing 0.340 1.337 0.25 0.799
Correlation is measured to evaluate the statistical strength between two common
and continuous variables. Total resin amount of the site of failure was analyzed to the
bond strength for any correlation. Both the scrubbing group and passive groups do not
Scrubbing Passive
MP
a
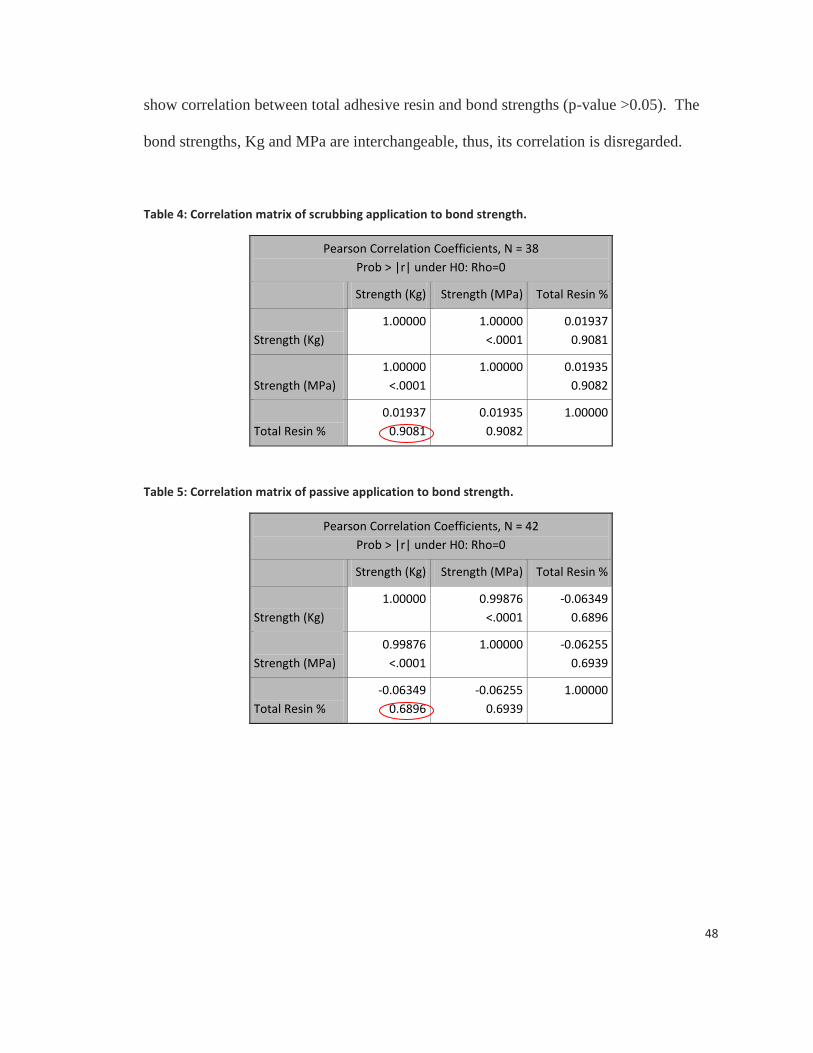
48
show correlation between total adhesive resin and bond strengths (p-value >0.05). The
bond strengths, Kg and MPa are interchangeable, thus, its correlation is disregarded.
Table 4: Correlation matrix of scrubbing application to bond strength.
Pearson Correlation Coefficients, N = 38
Prob > |r| under H0: Rho=0
Strength (Kg) Strength (MPa) Total Resin %
Strength (Kg)
1.00000
1.00000
<.0001
0.01937
0.9081
Strength (MPa)
1.00000
<.0001
1.00000
0.01935
0.9082
Total Resin %
0.01937
0.9081
0.01935
0.9082
1.00000
Table 5: Correlation matrix of passive application to bond strength.
Pearson Correlation Coefficients, N = 42
Prob > |r| under H0: Rho=0
Strength (Kg) Strength (MPa) Total Resin %
Strength (Kg)
1.00000
0.99876
<.0001
-0.06349
0.6896
Strength (MPa)
0.99876
<.0001
1.00000
-0.06255
0.6939
Total Resin %
-0.06349
0.6896
-0.06255
0.6939
1.00000

49
SITE OF FAILURE
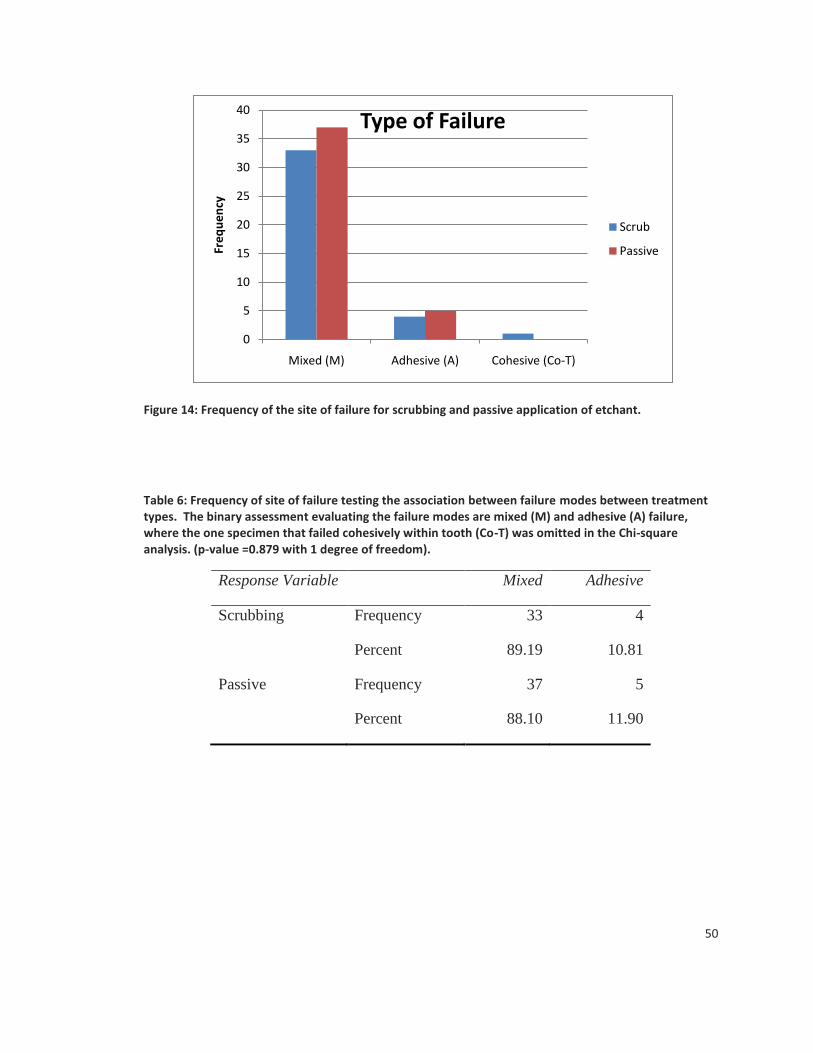
A graph describing the failure sites in figure 16 represents all specimen failure.
Failure was categorized as: i) adhesive interface between tooth and adhesive (A), ii)
mixed with tooth and adhesive or composite resin (M), iii) cohesive within tooth (Co-T),
or vi) cohesive within the composite (Co-C). Failure were observed either as mixed (M)
or adhesive (A) with the exception one which failed cohesively within tooth structure
(Co-T) and the data is omitted as an outlier for the statistical purposes when analyzing
failure modes.
For both scrubbing and passive treatments, the majority of failure was mixed (M)
at 88.61% and the remainder 11.39% were adhesive (A) failures. The type of failure
among the two treatment groups were significantly similar where scrubbing group had
10.81% adhesive and 89.19% mixed failure and passive group had 11.90% adhesive and
88.10% mixed failure.
A binary analysis organized the site of failure for the two predictor variable,
scrubbing and passive application (Table 4). Only mixed (M) and adhesive (A) failures
were considered in the binary analysis.
A chi-square test was performed on the failure site data. The p-value of 0.879
indicated that there was no statistically significant difference in the failure site between
the two treatment groups.
50
Figure 14: Frequency of the site of failure for scrubbing and passive application of etchant.
Table 6: Frequency of site of failure testing the association between failure modes between treatment types. The binary assessment evaluating the failure modes are mixed (M) and adhesive (A) failure, where the one specimen that failed cohesively within tooth (Co-T) was omitted in the Chi-square analysis. (p-value =0.879 with 1 degree of freedom).
Response Variable Mixed Adhesive
Scrubbing
Passive
Frequency
Percent
Frequency
Percent
33
89.19
37
88.10
4
10.81
5
11.90
0
5
10
15
20
25
30
35
40
Mixed (M) Adhesive (A) Cohesive (Co-T)
Fre
qu
en
cy
Type of Failure
Scrub
Passive
51
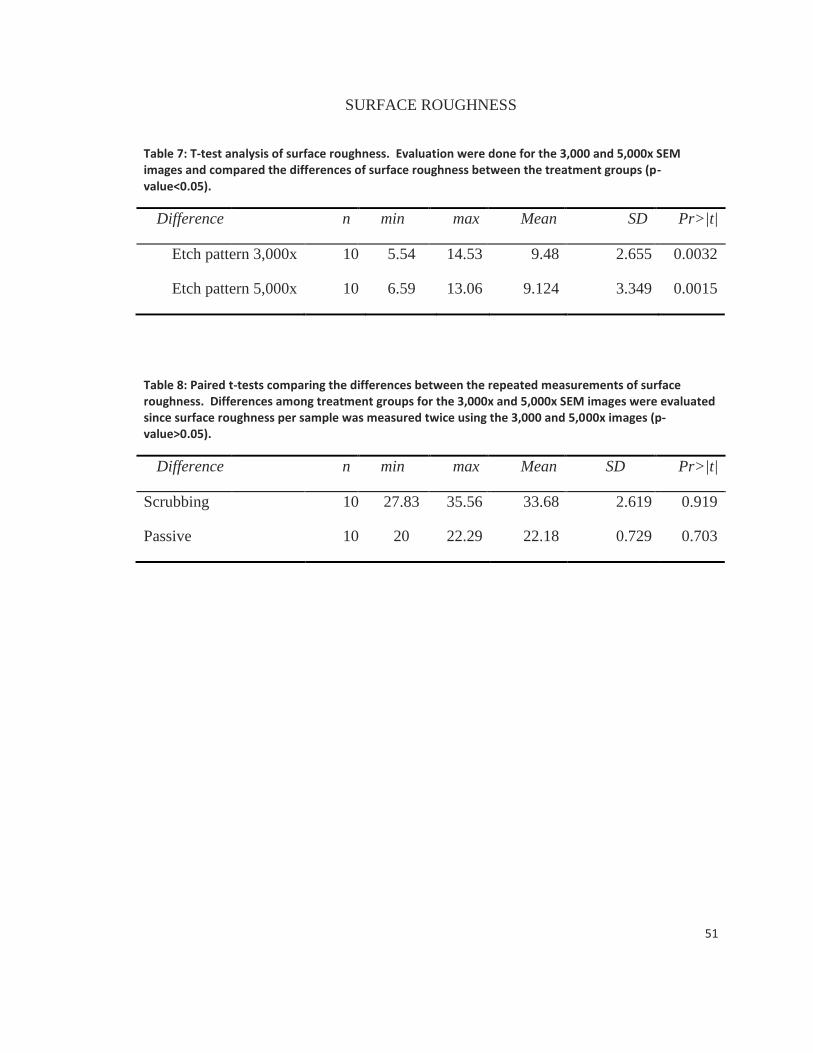
SURFACE ROUGHNESS
Table 7: T-test analysis of surface roughness. Evaluation were done for the 3,000 and 5,000x SEM images and compared the differences of surface roughness between the treatment groups (p-value<0.05).
Difference n min max Mean SD Pr>|t|
Etch pattern 3,000x
Etch pattern 5,000x
10
10
5.54
6.59
14.53
13.06
9.48
9.124
2.655
3.349
0.0032
0.0015
Table 8: Paired t-tests comparing the differences between the repeated measurements of surface roughness. Differences among treatment groups for the 3,000x and 5,000x SEM images were evaluated since surface roughness per sample was measured twice using the 3,000 and 5,000x images (p-value>0.05).
Difference n min max Mean SD Pr>|t|
Scrubbing
Passive
10
10
27.83
20
35.56
22.29
33.68
22.18
2.619
0.729
0.919
0.703

52
Figure 15: Surface roughness bar graph of the scrubbing and passive treatment groups. Mean lengths of surface roughness measured between a set 20µm for SEM images at 3,000 and 5,000x.
0
5
10
15
20
25
30
35
3,000x 5,000x
Me
an le
ngt
h in
µm
SEM Image magnification
Surface Roughness
Scrubbing
Passive

53
CHAPTER VI: DISCUSSION
The primary functions of etchants are to create a better etch pattern of
microporosities, enhanced enamel rods and prisms, greater surface area for bonding,
increased bond strength and longevity, and thereby to achieve maximum bonding of tooth
to restoration. The objectives of this study were to determine if active scrubbing
application of 4th
generation phosphoric acid etchant will achieve better and more reliable
dental restorations. Microshear bond strength test measured the bond strength between
the two methods and failure sites were evaluated. Further analysis of the active etchant
treatment was done through SEM imaging. Enamel topography was observed (Figure 7)
and etch pattern difference (Figure 8) was quantified by measuring the surface roughness.
The microshear bond strength of resin composite to etched enamel from this study is
comparable to other in vitro studies that have an average microshear bond strength of
20MPa (Eick, Robinson, Chappell, Cobb, & Spencer, 1993) (Gwinnett & Kanca, 1992)
(Gilpatrick, Ross, & Simonsen, 1991). Observed shear bond strengths in this study for
scrubbing and passive application are 23.56 + 6.06 and 23.22 +5.89 MPa, respectively.
Thus, the bond strengths in this study are comparable to the bond strengths in literature
and imply that bond strengths observed would be clinically significant.
All data measured were included except where the failure was Co-T and bond
strength values could not be recorded. The mixed effect model was the most effective
test to analyze the microshear bond strength data due to the clustering effect of the
specimens per tooth (Figure10). There is no significant difference between the

54
microshear bond strength values for active and passive application of etchant (Table 3).
Simple statistics for the microshear bond strength values show a normal distribution and
are illustrated via the histogram, boxplots, and Q-Q plots (Figures 11-13). Normality plot
describes a normal distribution with a 95% confidence interval and shows a graph that
follows a straight line where y=x. According to the Shapiro-Wilks normality test the
bond strength value data for scrubbing and passive application of etchant has a p-
value>0.05, thus, the null hypothesis, Ho, is accepted and states that there is no difference
in bond strength between the two treatment groups.
The location where the composite sticks were removed during microshear bond
strength test is considered the failure site. The mode of failure at the failure sites was
predominantly mixed (88.61%) with occasional failures observed as adhesive (11.41%).
Thus, most of the failure occurred with some mixture of composite still left on the
interface. One explanation for the majority of mixed failure is due to a strong bond
between tooth and composite where the debonding was also occurring in the composite
material. This reflects a very strong bond of adhesive to tooth for both treatment groups
where in this study the average microshear bond strength is about 23 MPa as compared to
20 MPa as in other in vitro studies.
The sample for the microshear bond strength testing followed a strict protocol where
only one operator did the procedures. All samples were treated exactly the same,
especially in regards to etch, drying, irradiation, and storage duration to avoid ambiguity
in protocol or tooth desiccation. However, enamel variation from tooth to tooth can
produce improper etching in some areas and even though this may have been accounted
55
for the slight differences in bond strength, it is not a factor in the resultant bond strength
for values in the study are statistically comparable to published results.
As for failure site analysis, examples in the Figure 6b, typical failures show mix
failure where the composite material still adhered to the tooth structure after shear bond
testing. This is probably due to the type of testing where the shear pulling comprises of
both tensile and compressive forces. A shear force from the testing machine involve both
tensile and compressive forces acting on the interface where the composite specimen
meets the tooth surface. Thus, the compression force exerting towards the direction of
the tooth during shear bond testing may be the reason as to why there is composite
residue adhering on one side of the failure site.
Another conclusion for the majority of mixed failure is that the maximum microshear
bond strength has been reached and failure in dental material was the consequence. If
most failure includes restoration material of cohesive within composite (Co-C) rather
than at the bonding interface, adhesive (A), then perhaps bond strength cannot be
measured since breakage is happening in the material rather than tooth-adhesive
interface. Therefore, mixed failure with cohesive within composite indicates that the
restorative material could not withstand the microshear bond test whereas a majority of
adhesive failures would indicate problems with the adhesive material or process of
bonding, for example the etch technique. Hence, the differences in treatment of etchant
may not be revealed by measuring the microshear bond strength. Trends between the
adhesive or composite resin on the failure site and microshear bond strength have been
analyzed with Pearson’s correlation matrix plot (Figure 14). This analysis was done to
see if increase in bond strength may correlate with an increase in resin residing on the

56
failure site since mixed or cohesive failures are usually associated with higher bond
strength. Although there are no significant trends between the two variables, total resin
on failure site to bond strength, this is probably due to having reached the optimum bond
strength where differences between treatment groups are not shown with microshear
bond strength testing.
This study tested scrubbing method of etchant because it has been proposed that
active scrubbing of etchant could create better etch patterns by having tooth structure
constantly covered with fresh etchant to amplify active chemical interaction of etchant to
tooth structure. Also, churning of fresh etchant could prevent air bubbles from forming
as well as spread etchant throughout tooth surface. Although the bond strength values for
the two groups are similar, other inferences have been made to further analyze the
treatment differences in the project. Observation of etched enamel (Figure 7) and
analysis of resin infiltration based on surface roughness (Figure 9) have been conducted.
Topographical observation of etched enamel pattern illustrate noticeable differences
in etch surface (Figure 7 and appendix B). Treatment of scrubbing and passive
application of etchant revealed different surface morphology. These differences were
apparent in all five tooth samples and had specific characteristic in etch patterns for each
treatment group. Phosphoric acid is known to cause selective dissolution around enamel
prism cores and boundaries and creates microporosities ranging from 5-50µm deep
(Cehreli, 2006). Additional scrubbing application of phosphoric acid revealed increase
roughness and more pronounced enamel rods and prisms. Deep and uniform
demineralization areas around enamel prism cores were apparent when etchant was
scrubbed. Etch patterns from passive application of etchant were subtle when compared

57
to the scrubbing group. Scrubbing of etchant produces a rougher etch pattern whereas
passive application of etchant shows ill-defined surface structures. Thus, a better etch
pattern is demonstrated by rougher surface and deeper microporosities providing a larger
surface area for increase bonding of adhesive to tooth structure.
Quantitative measurements of surface roughness was done to record the differences in
etch patterns between treatment groups (Figure 9 and Appendix C). A standard 20µm
length was implemented for both the scrubbing and passive groups at 3,000x and 5,000x
magnifications. Measurement for one specimen was done twice at 3,000x and 5,000x,
and this data was compared using paired t-tests which indicated no significant differences
between these repeated measurements. When comparing the surface morphology
between the treatment groups, obvious differences in etch pattern was seen. Scrubbing of
etchant created a rougher, more irregular surface whereas passively applying etchant did
not create deep grooves and peaks. Within a 20µm linear length, the average traced
length of etched enamel surface is 33.68 + 2.619 for the scrubbing group and 22.18 +
0.729 for passive group. Obvious differences between the two groups were analyzed
with t-test and gave p-values of 0.0032 and 0.0015 for images at 3,000x and 5,000x,
respectively. Thus, there is a significant difference in surface roughness when actively or
passively applying acid etchant.
Assessing the surface morphology and surface roughness confirms that there is a
difference when actively scrubbing on acid etchant onto enamel. The width of enamel
prism cores created with scrubbing are approximately 5µm, as seen on surface
topography images. Cross-section of dental restoration showed images of resin
infiltration, displaying a saw-tooth like etch surface where the distance between the peaks

58
are also approximately 5µm across. These two procedures verify that the etch surface
caused by scrubbing phosphoric acid creates more obvious demineralization around
enamel prism cores and boundaries since the prism cores of approximately 5µm can been
seen by two different views (Figures 7 and 9).
Scrubbing of etchant onto enamel creates surface irregularities and microporosities
that can be easily filled with adhesives creating better bonding. A more pronounced etch
pattern allows the inflow of adhesive and bonding agent into the porous zone and will
ultimately form resin tags and a more intimate micromechanical retention to etched
enamel. It has been reported that a highly secured bond could decrease micro and
nanoleakage which prevents future bacterial infection or early deterioration of
restoration. Microshear bond strength does not show significant differences between the
two treatments, indicating that maximum bond strength is achieved regardless of
scrubbing or passive application methods. However, a better etch pattern may allow
better bonding where a more secure bond could ultimately increase longevity by
withstanding leakage, thermo differences, and wear of restoration.

59
CHAPTER VII: CONCLUSION
The purpose of this study was to examine the effects of actively scrubbing on
phosphoric acid of 4th
generation etch-and-rinse adhesives systems as compared to
passive application of etchant. From the results of this investigation, it can be
concluded: (1) The microshear bond strength values between scrubbing and passive
application of acid etchant are significantly different. Microshear bond strength values
are comparable to published data and techniques are applicable to clinical settings. (2)
Failure sites were in general, mostly mixed with tooth and composite. High bond
strengths and a majority of mixed failure suggest maximum bond strength have been
reached. (3) Etched enamel surface demonstrate obvious differences in enamel
morphology between the two treatments. (4) Quantitative analysis of surface roughness
between the two treatments are significantly different. Active scrubbing of acid etchant
creates more irregular etch pattern with more pronounced enamel prisms and rods and
deeper microporosities. Thus, scrubbing of acid etchant onto enamel may increase dental
restoration longevity and durability by creating increased surface area for a more secure
and better bonding of restoration material to tooth structure.

60
REFERENCES
Ando, S., T. Watanabe, et al. (2008). "Effect of adhesive application methods on bond
strength to bovine enamel." J Oral Sci: 50(52):181-186.
Bastos, P., D. Retief, et al. (1988). "Effect of etch duration on the shear bond strength of
microfilm composite resin to enamel." Am J Dent 1: 151-157.
Bates, D., D. Retief, et al. (1982). "Effects of acid etch parameters on enamel topography
and composite resin-enamel bond strength. ." Pediar Dent 4: 106-110.
Bayne, S., J. Flemming, et al. (1992). "SEM-EDS analysis of macro and micro resin tags
of laminates." J Dent Res 61: 304.
Bertolotti, R. L. (1991). "Total etch--the rational dentin bonding protocol." J Esthet Dent
3(1): 1-6.
Black, G. V. (1917). "A Work on Operation Dentistry in Two Volumes." Chicago:
Medico-Dental Publishing 3rd edition.
Blosser, R. (1990). "Time dependence of 2.5% nitric acid solution as an etchant on
human dentin and enamel." Dent Mater 6: 83-87.
Bolanos-Carmona, V., S. Gonzalez-Lopez, et al. (2006). "Effects of etching time of
primary dentin on interface morphology and microtensile bond strength." Dent Mater:
12(12):1121-1129.
Bolanos-Carmona, V., S. Gonzalez-Lopez, et al. (2008). "Interfacial morphology and
bond strength of self-etching adhesives to primary dentin with or without acid etching." J
Biomed Mater Res B Appl Biomater: 87(82): 499-507.
Bowen, R. L., Eick, J.D., Henderson, D.A., et al (1984). "Smear layer: removal and
bonding considerations." Oper Dent Suppl 3: 30-34.
Brown, L. J., D. M. Winn, et al. (1996). "Dental caries, restoration and tooth conditions
in U.S. adults, 1988-1991. Selected findings from the Third National Health and
Nutrition Examination Survey." J Am Dent Assoc 127(9): 1315-1325.
BT, R., & J, P. (2000). Bond strengths of nonrinsing adhesives. Quintessence Int ,
31:355-358.

61
Buonocore, M. G. (1955). "A simple method of increasing the adhesion of acrylic filling
materials to enamel surfaces." J Dent Res 34(6): 849-853.
Cehreli, S. and N. Eminkahyagil (2006). "Effect of active pretreatment of self-etching
primers on the ultramorphology of intact primary and permanent tooth enamel." J Dent
for Children: 73(72):86-90.
Chan, K., F. Tay, et al. (2003). "bonding of mild self-etching primers/adhesives to dentin
with thick smear layers." Am J Dent: 12:340-346.
Dal-Biano, K., A. Pellizzaro, et al. (2006). "Effects of moisture degree and rubbing action
on the immediate resin-denin bond strength." Dent Mater: 22(12):1150-1156.
De Munck, J., B. Van Meerbeek, et al. (2003). "Microtensile bond strengths of one- and
two-step self-etch adhesives to bur-cut enamel and dentin." Am J Dent: 16: 414-420.
do Amaral, R., R. Stanislawczuk, et al. (2009). "Active application improves the bonding
performance of self-etch adhesives to dentin." J Dent: 82-90.
Duke, E. S. (1993). "Ahesion and its application with restorative materials." Dent Clin
North Am 37: 329-340.
Eakle, W. S. (1986). "Fracture resistance of teeth restored with class II bonded composite
resin." J Dent Res 65(2): 149-153.
Eick, J. D., C. M. Cobb, et al. (1991). "The dentinal surface: its influence on dentinal
adhesion. Part I." Quintessence Int 22(12): 967-977.
Eick, J., Robinson, S., Chappell, P., Cobb, C., & Spencer, P. (1993). The dentinal
surface: Its influence on dentinal adhesion. Part III. Quintessence Int , 24:571-582.
Eick, J. D., S. J. Robinson, et al. (1993). "Adhesives and nonshrinking dental resins of the
future." Quintessence Int 24(9): 632-640.
Erickson, R. (1992). "Surface interactions of dentin adhesive materials." Oper Dent suppl
5: 81-91.
Finger, W. J. and S. Uno (1996). "Bond strength of Gluma CPS using the moist dentin
bonding technique." Am J Dent 9(1): 27-30.
Fusayama, T., M. Nakamura, et al. (1979). "Non-pressure adhesion of a new adhesive
restorative resin." J Dent Res 58(4): 1364-1370.

62
Gaengler, P., I. Hoyer, et al. (2004). "Micromorphological evaluation of posterior
composite restorations - a 10-year report." J Oral Rehabil 31(10): 991-1000.
Gilpatrick, R., Ross, J., & Simonsen, R. (1991). Resin-to-enamel bond strengths with
various etching times. Quintessence Int , 22:47-49.
Gwinnett, A. J. (1990). "Interactions of dental materials with enamel." Trans Acad Dent
Mater 3: 30.
Gwinnett, A., & Kanca, J. (1992). Micromorphology of the bonded dentin interface and
its relationship to bond strength. Am J Dent, 5:73-77.
Heymann, H. O. B., S.C. (1993). "Current concepts in dentin bonding: Focusing on
dentinal adhesion factors." J Am Dent Assoc 124: 27-36.
Higashi, C., M. D. Michel, et al. (2009). "Impact of adhesive application and moisture on
the mechanical properties of the adhesive interface determined by the nano-indentation
technique." Oper Dent 34(1): 51-57.
Holtan, J., G. Nystrom, et al. (1995). "Influence of different etchants and etching times on
shear bond strength." Oper Dent: 20(23):94-29.
Inoue, I., M. Vargas, et al. (2003). "Microtensile bond strength of eleven contemporary
adhesives to enamel." Am J Dent 16: 329-334.
Inoue, S., M. Vargas, et al. (2001). "Microtensile bond strength of eleven contemporary
adhesives to dentin." J Adhes Dent 3: 237-245.
Jacobsen, T. and K. J. Soderholm (1998). "Effect of primer solvent, primer agitation, and
dentin dryness on shear bond strength to dentin." Am J Dent 11(5): 225-228.
Jendresen, M. D., P. O. Glantz, et al. (1981). "Microtopography and clinical adhesiveness
of an acid etched tooth surface. An in-vivo study." Acta Odontol Scand 39(1): 47-53.
Kanca, J., 3rd (1992). "Effect of resin primer solvents and surface wetness on resin
composite bond strength to dentin." Am J Dent 5(4): 213-215.
Kerdvongbundit, V., S. Thiradilok, et al. (2004). "The use of the replica technique to
record fluid emerging from exposed dentine." Arch Oral Biol 49(8): 613-619.
Kidd, E. A. (1976). "Microleakage: a review." J Dent 4(5): 199-206.

63
Legler, L., D. Retief, et al. (1990). "Effects of phosphoric acid concentration and etch
duration on enamel depth of etch: an in vitro study." Am J Orthod Dentofacial Orthop:
98(92):154-160.
Miears, J. R., Jr., D. G. Charlton, et al. (1995). "Effect of dentin moisture and storage
time on resin bonding." Am J Dent 8(2): 80-82.
Miyazaki, M., K. Hinoura, et al. (2002). "Effect of self-etching primer application
method on enamel bond strength." Am J Dent: 15:412-416.
Miyazaki, M., J. Platt, et al. (1996). "Influence of dentin primer application methods on
dentin bond strengths." Oper Dent: 21(24):167-172.
Mjor, I. A. (1998). "Amalgam and composite resin restorations: Longevity and reasons
for replacement in Anusavice K." Quality Evaluation of Dental Restorations.
Quintessence Publishing: 61-80.
Morin, D., R. DeLong, et al. (1984). "Cusp reinforcement by the acid-etch technique." J
Dent Res 63(8): 1075-1078.
Moura, S., A. Pelizzaro, et al. (2006). "Does the acidity of self-etching primers affect
bond strength and surface morphology of enamel?" J Adhes Dent: 8(2):75-83.
Nordenvall, K.-J., M. Brannstrom, et al. (1980). "Etching of deciduous teeth and young
and old permenant teeth. A comparison between 15 and 60 seconds of etching. ." Am J
Orthod 78: 99-108.
Oliveira, S., S. Marshall, et al. (2004). "The effect of a self-etching primer on the
continuous demineralization of dentin. ." European J Oral Surgery: 112:376-183.
Pashley, D. H. (1992). "The effects of acid etching on the pulpodentin complex." Oper
Dent 17: 229-242.
Pashley, D. H., B. Ciucchi, et al. (1993). "Permeability of dentin to adhesive agents."
Quintessence Int 24(9): 618-631.
Perdiago, J. (2007). "New Developments in Dental Adhesion." Dent Clin N Am 51: 333-
357.
Perdiago, J., G. Gomes, et al. (2005). "Enamel bond strengths of pairs of adhesives from
the same manufacturer." Oper Dent 30: 492-499.
Pioch, T., S. Stotz, et al. (1998). "Influence of different etching times on hybrid layer
formation and tensile bond strength." Am J Dent: 11:202-206.

64
Reinhard, H., and Juergen, M. (2001). "Longevity of restorations in posterior teeth and
reasons for failure." J Adhes Dent 3: 45-64.
Reis, A., A. Pellazaro, et al. (2007). "Impact of adhesive applciation to wet and dry
dentin on long-term resin-dentin bond strengths." Oper Dent: 32(34):380-387.
Retief, D., H. Busscher, et al. (1986). "A laboratory evaluation of three etching
solutions." Dent Mater 2: 202-206.
Rotta, M., P. Bresciani, et al. (2007). "Effects of phosphoric acid pretreatment and
substitution of bonding resin on bonding effectiveness" (6) 537-545.
Salz, U., J. Zimmermann, et al. (2005). "Self-curing, self-etching adhesive cement
systems." J Adhes Dent 7(1): 7-17.
Sano, H., T. Shono, et al. (1994). "Microporous dentin zone beneath resin-impregnated
layer." Oper Dent 19(2): 59-64.
Silverstone, L. M., C. A. Saxton, et al. (1975). "Variation in the pattern of acid etching of
human dental enamel examined by scanning electron microscopy." Caries Res 9(5): 373-
387.
S, U., & WJ, F. (1999). Effects of acid conditioner on dentin demineralization and
dimension of hybrid layers. J Dent , 24:211-214.
Spencer, P., Y. Wang, et al. (2000). "Interfacial chemistry of the dentin/adhesive bond." J
Dent Res: 79:1458-1463.
Strassler, H. E. (1991). "Insights and innovations." Dent Off 3: 114.
Swift, E. J. and B. Cloe (1993). "Shear bond strengths of new enamel etchants." Am J
Dent: (3) 162-164.
Swift, E. J., Jr., J. Perdigao, et al. (1995). "Bonding to enamel and dentin: a brief history
and state of the art, 1995." Quintessence Int 26(2): 95-110.
Swift, E. J., Perdiago, J., Heymann, H.O. (1995). "Bonding to enamel and dentin; a brief
story and state of the art." Quintessence Int 26: 95-110.
Tao, L. and D. H. Pashley (1988). "Shear bond strengths to dentin: effects of surface
treatments, depth and position." Dent Mater 4(6): 371-378.
Tay, F. and D. Pashley (2001). "Aggressiveness of contemporary self-etching systerms.I.
Depth of penetration beyond dentin smear layers." Dent Mater: 17:296-308.

65
Torstenson, B. and A. Oden (1989). "Effects of bonding agent types and incremental
techniques on minimizing contraction gaps around resin composites." Dent Mater 5(4):
218-223.
Triolo, P. J., E. J. Swift, et al. (1993). "Effects of etching time on enamel bond strengths."
Am J Dent: 6(6):302-304.
Uno, S. and W. Finger (1995). "Effect of acid composition and etch duration on enamel
loss and resin composite bonding." Am J Dent: 8(4):164-169.
Van Landyt, K., P. Kanumilli, et al. (2005). "Bond strength of a mild self-etch adhesive
with and without prior acid-etching." J Dent: (1) 77-85.
Van Meerbeek, B., J. De Munck, et al. (2003). "Buonocore memorial lecture. Adhesion
to enamel and dentin: current status and future challenges." Oper Dent 28: 215-235.
Van Meerbeek, B., P. Kanumilli, et al. (2005). "A randomized controlled study
evaluating the effectiveness of a two-step self-etch adhesive with and without selective
phosphoric-acid etching of enamel." Dent Mater: (21) 375-383.
Van Meerbeek, B., Vargas, M., Inoue, S., et al (2001). "Adhesives and cements to
promote preservation dentistry." Oper Dent Suppl 6: 119-124.
Van Meerbeek, B., Y. Yoshida, et al. (1998). "A TEM study of two water-based adhesive
systems bonded to dry and wet dentin." J Dent Res 77(1): 50-59.
Velasquez, L. and R. Sergent (2006). "Effect of placement agitation and place time on the
shear bond strength of 3 self-etching adhesives." Oper Dent: 31(34):426-430.
Velasquez, L. M., Sergent, R.S., Burgess, J.O., Mercante, D.E. (2006). "Effect of
placement agitation and placement time on the shear bond strength of 3 self-etching
adhesives." Oper Dent 31(4): 426-430.
Wang, Y. and P. Spencer (2004). "Effect of acid etching time and technique on interfacial
characteristics of the adhesive-dentin bond using differential staining." Eur J Oral Sci:
(112) 293-299.

66
APPENDIX A: STATISTICAL ANALYSIS
Table 7: Raw data from microshear bond strength testing.
group Tooth Strength
(kg)
Strength
(Mpa)
SEM
FAILURE
SEM
FAIL
BINARY
Adh Resin Bond
Resin
Total
Resin
Scrub 1.000 1.109 10.848 Mixed 1 2.23 2.23
Scrub 1.000 1.827 17.869 Mixed 1 10.13 3.1 13.23
Scrub 1.000 3.150 30.804 Mixed 1 12.96 4.86 17.82
Scrub 1.000 3.370 32.955 Mixed 1 15.26 2.34 17.6
Scrub 3.000 2.604 25.459 na na 0
Scrub 5.000 1.649 16.129 Adhesive 2 0 0
Scrub 5.000 1.672 16.351 Adhesive 2 0 0
Scrub 5.000 1.685 16.477 Mixed 1 13.04 2.31 15.35
Scrub 5.000 2.131 20.842 Mixed 1 7.64 43.5 51.14
Scrub 7.000 2.209 21.601 Mixed 1 6.02 6.02
Scrub 7.000 1.989 19.450 Mixed 1 3.62 35.02 38.64
Scrub 7.000 2.222 21.727 Mixed 1 10.33 22.81 33.14
Scrub 7.000 1.572 15.370 Mixed 1 6.96 6.96
Scrub 9.000 1.552 15.181 Mixed 1 1.01 29.28 30.29
Scrub 9.000 2.620 25.617 Mixed 1 5.76 17.66 23.42
Scrub 9.000 2.739 26.787 Mixed 1 32.51 9.76 42.27
Scrub 9.000 2.617 25.586 Mixed 1 23.33 4.35 27.68
Scrub 9.000 1.979 19.355 Mixed 1 0.94 36.65 37.59
Scrub 11.000 1.937 18.944 Mixed 1 3.43 24.86 28.29
Scrub 11.000 2.076 20.304 Mixed 1 3.68 3.68
Scrub 11.000 2.093 20.462 Mixed 1 6.27 75.94 82.21
Scrub 11.000 2.038 19.925 Adhesive 2 0 0
Scrub 13.000 2.516 24.605 Mixed 1 9.72 9.72
Scrub 13.000 1.281 12.524 Mixed 1 18.36 18.36
Scrub 13.000 2.746 26.851 Mixed 1 24.15 24.15
Scrub 13.000 3.027 29.602 Mixed 1 17.87 17.87
Scrub 15.000 2.756 26.946 Mixed 1 6.6 8.02 14.62
Scrub 15.000 2.523 24.669 Mixed 1 2.09 10.63 12.72
Scrub 15.000 2.791 27.293 Mixed 1 11.34 11.34
Scrub 15.000 2.494 24.384 Mixed 1 2.43 2.43
Scrub 17.000 2.756 26.946 Mixed 1 11.01 32.64 43.65
Scrub 17.000 2.733 26.724 Adhesive 2 0 0
Scrub 17.000 3.108 30.393 Mixed 1 38.01 38.01
Scrub 17.000 3.173 31.025 Mixed 1 37.65 37.65

67
Scrub 19.000 3.312 32.385 Mixed 1 6.74 6.74
Scrub 19.000 3.694 36.117 Mixed 1 6.36 6.36
Scrub 19.000 2.972 29.065 Mixed 1 3.6 3.6
Scrub 19.000 2.833 27.705 Mixed 1 9.89 9.89
passive 2 1.407 13.757 Mixed 1 4.53 12.22 16.75
passive 2 2.180 21.316 Mixed 1 37.21 12.03 49.24
passive 2 2.122 20.747 Mixed 1 4.18 1.09 5.27
passive 2 0.906 8.855 Adhesive 2 0 0
passive 2 2.335 22.834 Mixed 1 11.14 1.13 12.27
passive 4 2.222 21.727 Mixed 1 na na 0
passive 4 2.380 23.277 Mixed 1 na na 0
passive 4 2.738 26.787 Mixed 1 10.81 10.81
passive 4 2.196 21.474 Mixed 1 15.74 15.74
passive 6 1.983 19.387 Mixed 1 2.39 16.01 18.4
passive 6 2.439 23.846 Mixed 1 7.83 7.83
passive 6 2.335 22.834 Mixed 1 20.23 3.89 24.12
passive 6 1.507 14.738 Mixed 1 7.21 7.21
passive 8 2.998 29.318 Mixed 1 7.87 1.18 9.05
passive 8 2.238 21.885 Mixed 1 11.17 11.17
passive 8 1.856 18.153 Mixed 1 28.19 14.14 42.33
passive 8 2.406 23.530 Mixed 1 6.71 6.71
passive 10 2.684 26.250 Mixed 1 14.34 5.18 19.52
passive 10 1.077 10.532 Adhesive 2 0 0
passive 10 2.555 24.985 Mixed 1 20.85 20.85
passive 10 2.067 20.209 Mixed 1 27.69 27.69
passive 12 1.717 16.794 Mixed 1 24.78 4.36 29.14
passive 12 2.148 21.000 Mixed 1 4.97 7.65 12.62
passive 12 2.442 23.878 Mixed 1 11.65 11.65
passive 12 1.924 18.818 Mixed 1 10.19 6.91 17.1
passive 14 3.590 33.105 Mixed 1 12.71 12.71
passive 14 3.001 29.349 Mixed 1 22.48 22.48
passive 14 2.613 25.554 Mixed 1 16.32 16.32
passive 14 2.636 25.775 Mixed 1 19.6 19.6
passive 16 1.827 17.869 Mixed 1 13.23 13.23
passive 16 1.989 19.450 Adhesive 2 0 0
passive 16 2.432 23.783 Mixed 1 29.21 29.21
passive 16 2.338 22.866 Mixed 1 24.76 24.76
passive 18 2.083 20.367 Mixed 1 6.02 19.61 25.63
passive 18 3.060 29.918 Mixed 1 3.99 18.37 22.36
passive 18 3.305 32.322 Mixed 1 2.48 2.48

68
passive 18 2.933 28.685 Mixed 1 11.51 11.51
passive 20 3.027 29.602 Mixed 1 6.82 6.82
passive 20 3.849 37.635 Mixed 1 3.63 11.07 14.7
passive 20 2.258 22.075 Mixed 1 16.95 34.09 51.04
passive 20 3.008 29.381 Adhesive 2 0 0
passive 20 3.124 30.551 Adhesive 2 0 0
Table 8: Raw data for resin infiltration depicting the length of surface roughness over 20µm for active and passive application of etchant at 3,000 and 5,000x.
Treatment sample 3,000x Length (µm) 5,000x length (µm)
Scrub A 30.57 28.82
Scrub B 29.94 28.29
Scrub C 35.56 33.99
Scrub D 30.62 32.22
Scrub E 27.83 30.33
Passive A 20.0 21.5
Passive B 21.9 21.7
Passive C 21.03 20.93
Passive D 21.9 21.68
Passive E 22.29 22.22
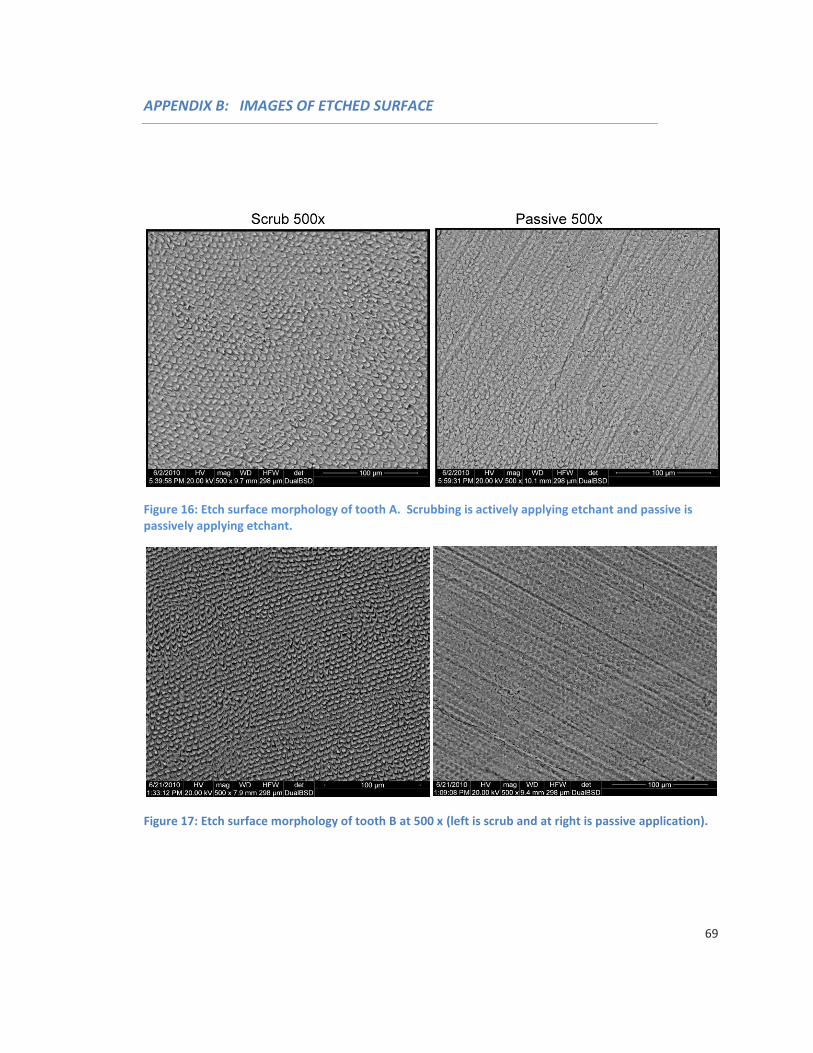
69
APPENDIX B: IMAGES OF ETCHED SURFACE
Figure 16: Etch surface morphology of tooth A. Scrubbing is actively applying etchant and passive is passively applying etchant.
Figure 17: Etch surface morphology of tooth B at 500 x (left is scrub and at right is passive application).

70
Figure 18: Etch surface morphology of tooth C at 500 x (left is scrub and at right is passive application).
Figure 19: Etch surface morphology of tooth D at 500 x (left is scrub and at right is passive application).

71
Figure 20: Etch surface morphology of tooth E at 500 x (left is scrub and at right is passive application).
Figure 21: Etch surface morphology of tooth A at 1000 x (left is scrub and at right is passive application).

72
Figure 22: Etch surface morphology of tooth B at 1000 x (left is scrub and at right is passive application).
Figure 23: Etch surface morphology of tooth C at 1000 x (left is scrub and at right is passive application).

73
Figure 24: Etch surface morphology of tooth D at 1000 x (left is scrub and at right is passive application).
Figure 25: Etch surface morphology of tooth E at 1000 x (left is scrub and at right is passive application).

74
Figure 26: Etch surface morphology of tooth A at 8000 x (left is scrub and at right is passive application).
Figure 27: Etch surface morphology of tooth B at 8000 x (left is scrub and at right is passive application).

75
Figure 28: Etch surface morphology of tooth C at 8000 x (left is scrub and at right is passive application).
Figure 29: Etch surface morphology of tooth D at 8000 x (left is scrub and at right is passive application).

76
Figure 30: Etch surface morphology of tooth E at 8000 x (left is scrub and at right is passive application).
Figure 31: Etch surface morphology of tooth A at 20,000 x (left is scrub and at right is passive application).

77
Figure 32: Etch surface morphology of tooth B at 20,000 x (left is scrub and at right is passive application).
Figure 33: Etch surface morphology of tooth C at 20,000 x (left is scrub and at right is passive application).

78
Figure 34: Etch surface morphology of tooth D at 20,000 x (left is scrub and at right is passive application).
Figure 35: Etch surface morphology of tooth E at 20,000 x (left is scrub and at right is passive application).
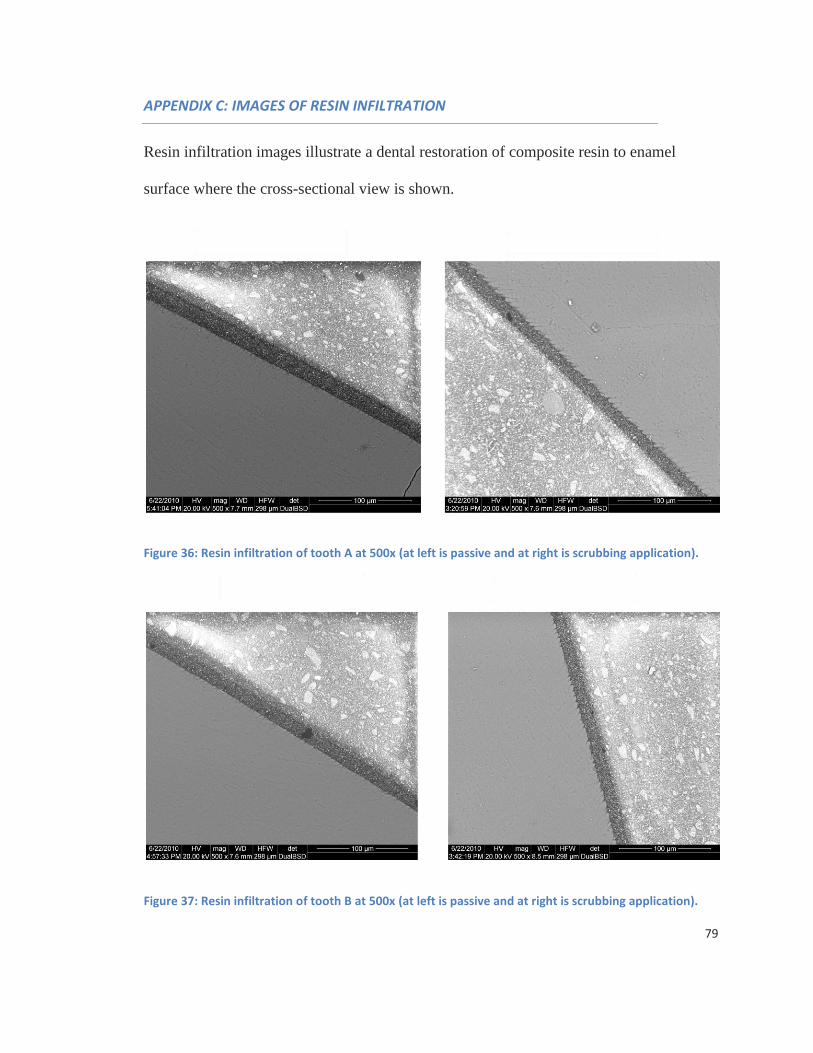
79
APPENDIX C: IMAGES OF RESIN INFILTRATION
Resin infiltration images illustrate a dental restoration of composite resin to enamel
surface where the cross-sectional view is shown.
Figure 36: Resin infiltration of tooth A at 500x (at left is passive and at right is scrubbing application).
Figure 37: Resin infiltration of tooth B at 500x (at left is passive and at right is scrubbing application).

80
Figure 38: Resin infiltration of tooth C at 500x (at left is passive and at right is scrubbing application).
Figure 39: Resin infiltration of tooth D at 500x (at left is passive and at right is scrubbing application).

81
Figure 40: Resin infiltration of tooth E at 500x (at left is passive and at right is scrubbing application).
Figure 41: Resin infiltration of tooth A at 3000x (at left is passive and at right is scrubbing application).

82
Figure 42: Resin infiltration of tooth B at 3000x (at left is passive and at right is scrubbing application).
Figure 43: Resin infiltration of tooth C at 3000x (at left is passive and at right is scrubbing application).

83
Figure 44: Resin infiltration of tooth D at 3000x (at left is passive and at right is scrubbing application).
Figure 45: Resin infiltration of tooth E at 3000x (at left is passive and at right is scrubbing application).
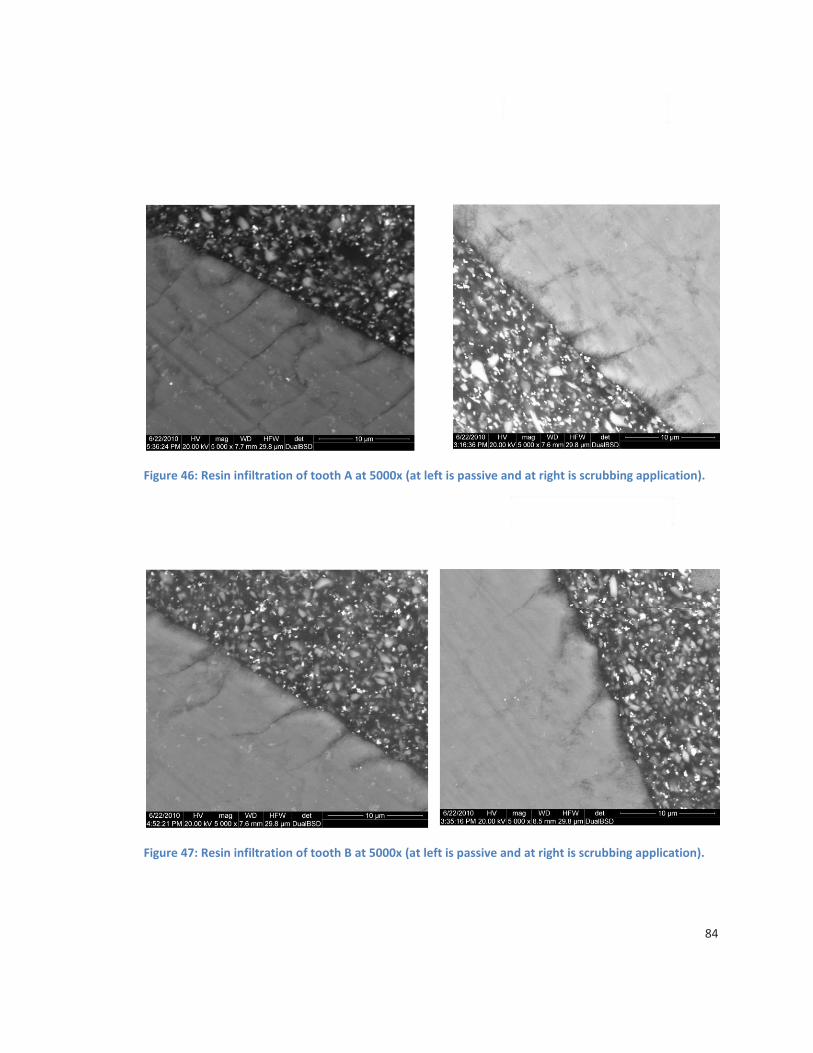
84
Figure 46: Resin infiltration of tooth A at 5000x (at left is passive and at right is scrubbing application).
Figure 47: Resin infiltration of tooth B at 5000x (at left is passive and at right is scrubbing application).

85
Figure 48: Resin infiltration of tooth C at 5000x (at left is passive and at right is scrubbing application).
Figure 49: Resin infiltration of tooth D at 5000x (at left is passive and at right is scrubbing application).

86
Figure 50: Resin infiltration of tooth E at 5000x (at left is passive and at right is scrubbing application).
Top Related