


Languages
Pages
Legal


Biofuel Enzyme KitFrom Grass to Gas:
An Inquiry based study of enzymes

Biofuel Enzyme Kit
Instructors
Stan HitomiCoordinator – Math & SciencePrincipal – Alamo SchoolSan Ramon Valley Unified School DistrictDanville, CA
Kirk BrownLead Instructor, Edward Teller Education CenterScience Chair, Tracy High School and Delta College, Tracy, CA
Bio-Rad Curriculum and Training Specialists:Sherri Andrews, Ph.D.
Damon [email protected]
Leigh Brown, M.A. [email protected]
Biofuel Enzyme KitWorkshop Timeline
• Introduction
• Review of enzymes
• Inquiry and collaboration using this kit
• Run control reaction and enzyme reaction
• Measure absorbance values

Why teach about enzymes?
• Powerful teaching tool
• Real-world connections
• Link to careers and industry
• Tangible results
• Laboratory extensions
• Interdisciplinary – connects physics, chemistry, biology and environmental science
• Standards based

Science
Technology
EngineeringMath
Inquiry
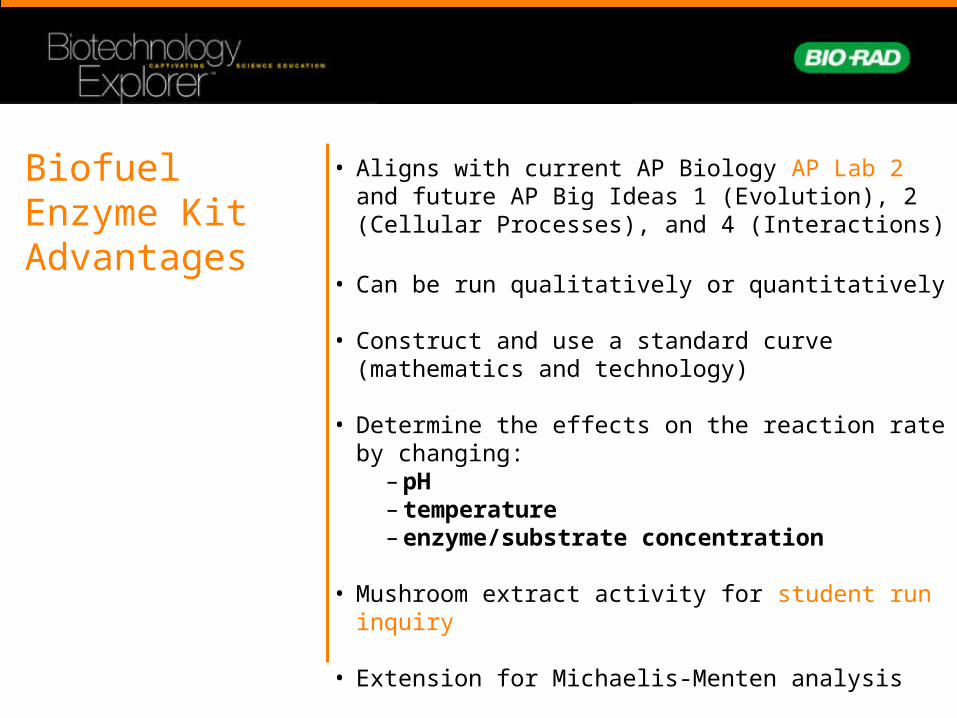
• Aligns with current AP Biology AP Lab 2 and future AP Big Ideas 1 (Evolution), 2 (Cellular Processes), and 4 (Interactions)
• Can be run qualitatively or quantitatively
• Construct and use a standard curve (mathematics and technology)
• Determine the effects on the reaction rate by changing: – pH– temperature– enzyme/substrate concentration
• Mushroom extract activity for student run inquiry
• Extension for Michaelis-Menten analysis
Biofuel Enzyme Kit Advantages
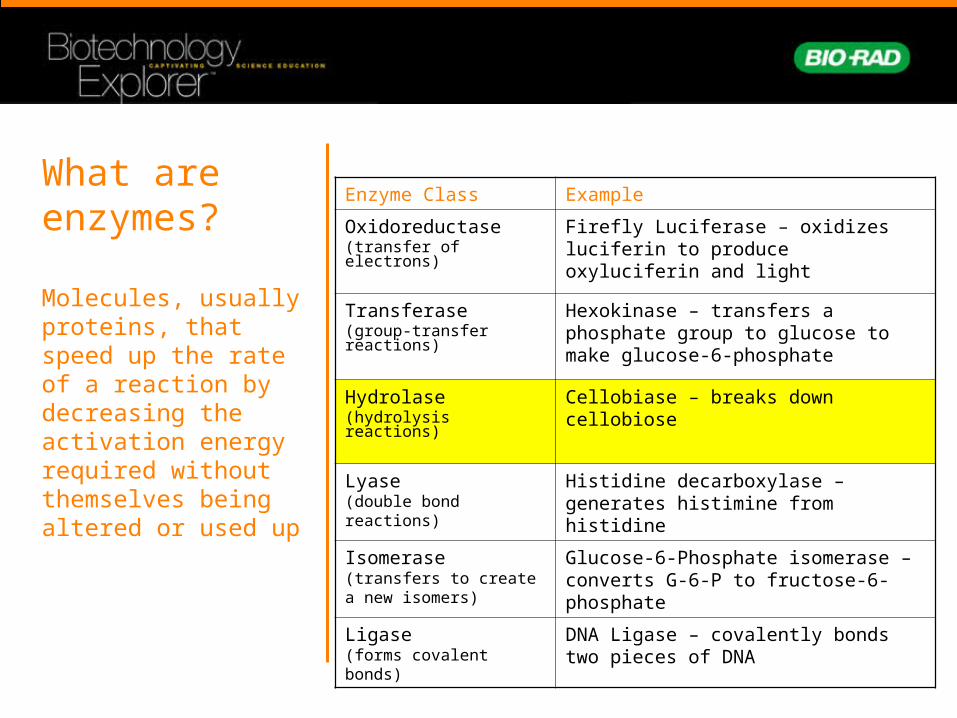
What are enzymes?
Molecules, usually proteins, that speed up the rate of a reaction by decreasing the activation energy required without themselves being altered or used up
Enzyme Class Example
Oxidoreductase(transfer of electrons)
Firefly Luciferase – oxidizes luciferin to produce oxyluciferin and light
Transferase(group-transfer reactions)
Hexokinase – transfers a phosphate group to glucose to make glucose-6-phosphate
Hydrolase(hydrolysis reactions)
Cellobiase – breaks down cellobiose
Lyase(double bond reactions)
Histidine decarboxylase – generates histimine from histidine
Isomerase(transfers to create a new isomers)
Glucose-6-Phosphate isomerase – converts G-6-P to fructose-6-phosphate
Ligase(forms covalent bonds)
DNA Ligase – covalently bonds two pieces of DNA
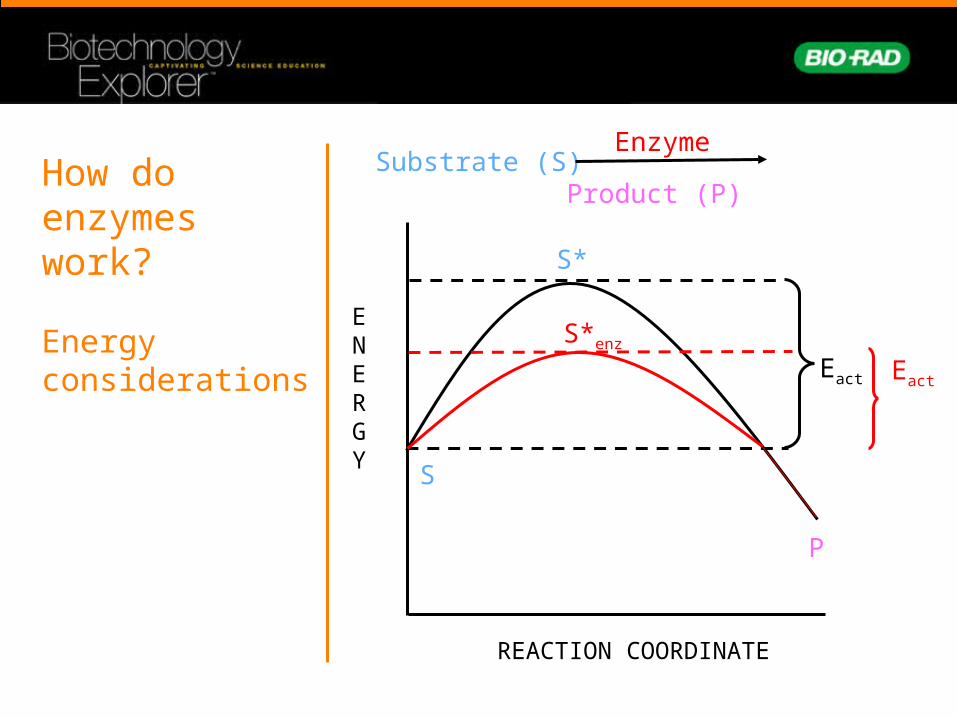
How do enzymes work?
Energy considerations
Substrate (S) Product (P)
ENERGY
REACTION COORDINATE
S
P
S*
Eact
S*enz
Eact
Enzyme
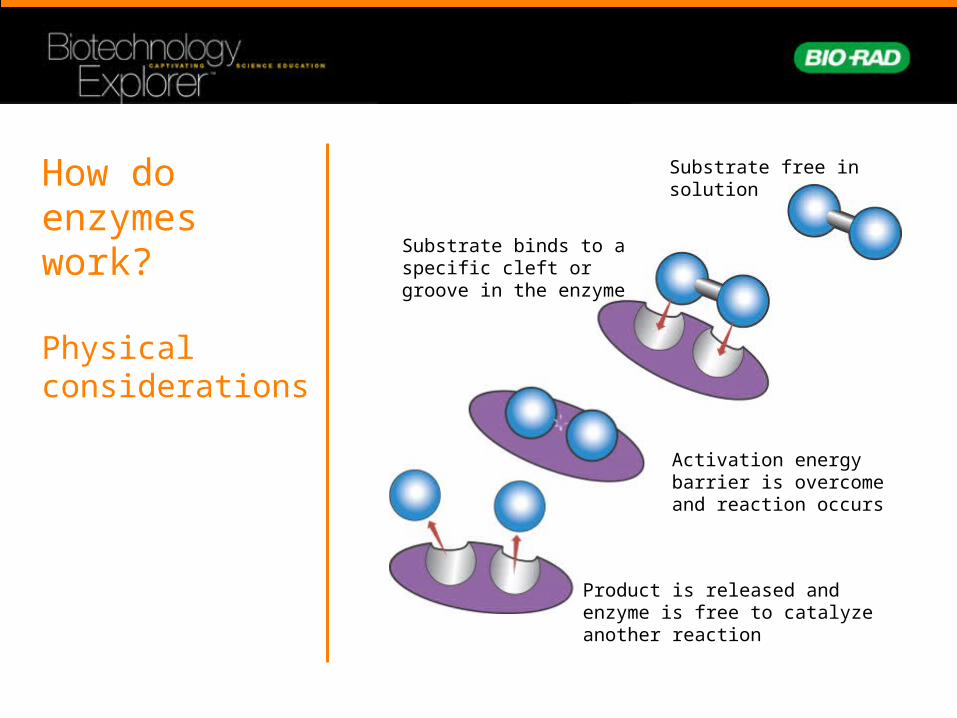
How do enzymes work?
Physical considerations
Substrate free in solution
Substrate binds to a specific cleft or groove in the enzyme
Activation energy barrier is overcome and reaction occurs
Product is released and enzyme is free to catalyze another reaction
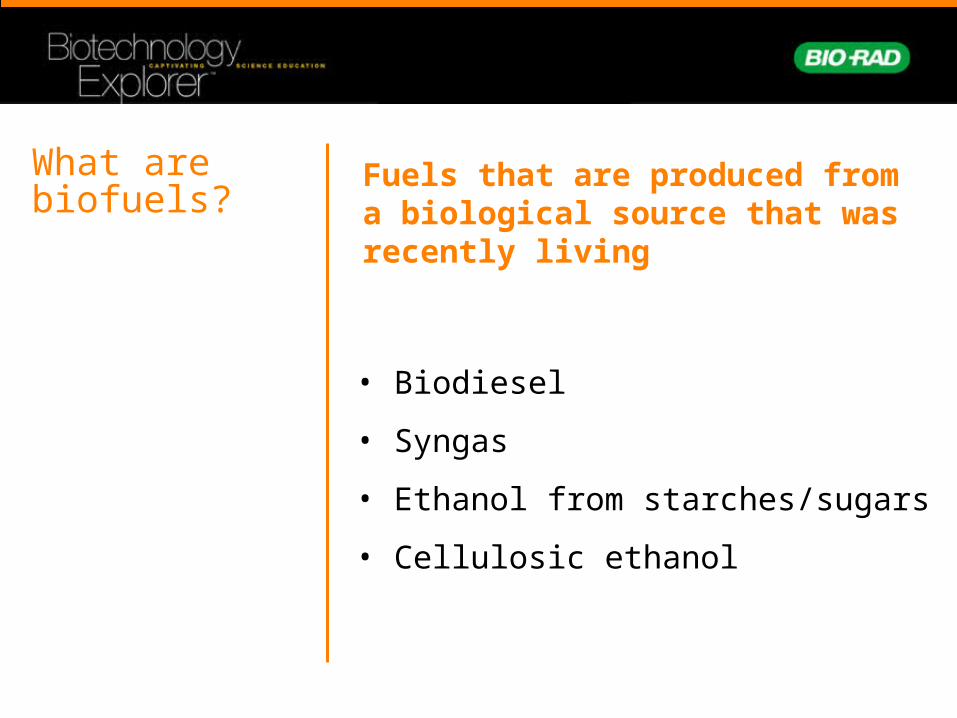
What are biofuels?
• Biodiesel
• Syngas
• Ethanol from starches/sugars
• Cellulosic ethanol
Fuels that are produced from a biological source that was recently living

Cellulosic ethanol production
A
B
C
D
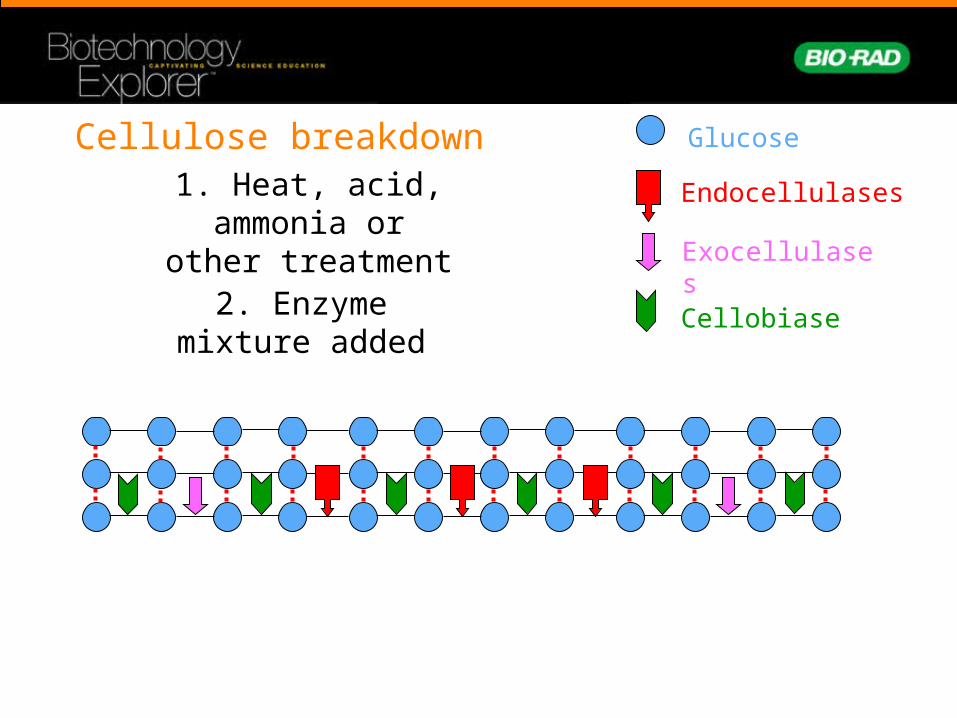
Cellobiase
Exocellulases
Endocellulases
Glucose
1. Heat, acid, ammonia or other
treatment2. Enzyme
mixture added
Cellulose breakdown

+
Cellobiose breakdown- a closer look
Cellobiose + H2O 2 Glucose
4
1
56
4 23
1
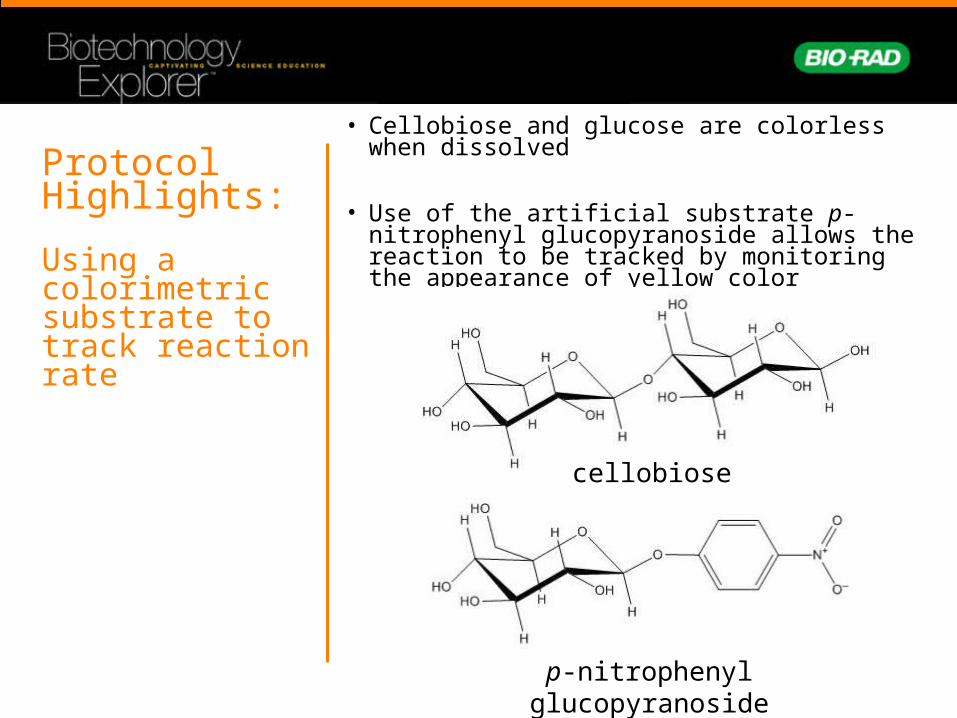
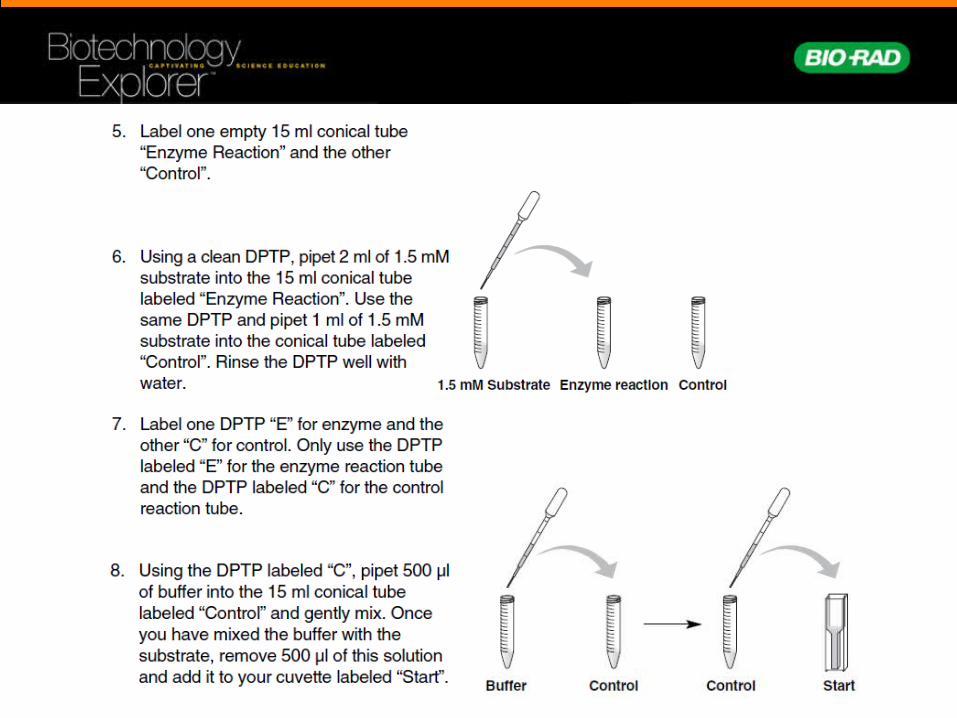
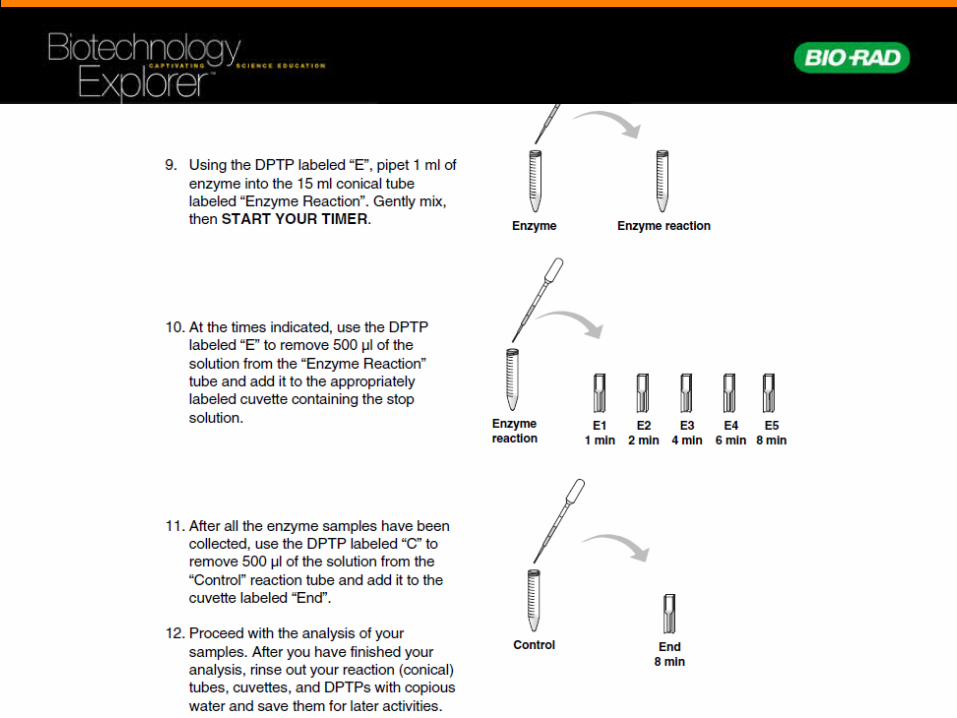
Protocol Highlights:
Using a colorimetric substrate to track reaction rate
• Cellobiose and glucose are colorless when dissolved
• Use of the artificial substrate p-nitrophenyl glucopyranoside allows the reaction to be tracked by monitoring the appearance of yellow color
cellobiose
p-nitrophenyl glucopyranoside
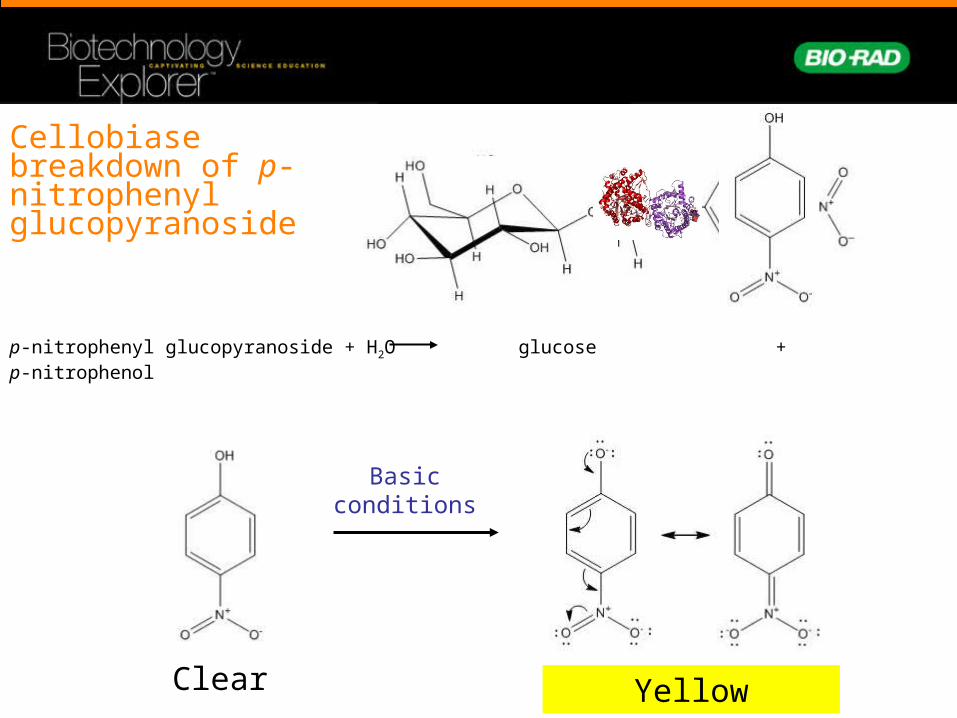
Cellobiase breakdown of p-nitrophenyl glucopyranoside
+
p-nitrophenyl glucopyranoside + H2O glucose + p-nitrophenol
Basic conditions
Clear Yellow
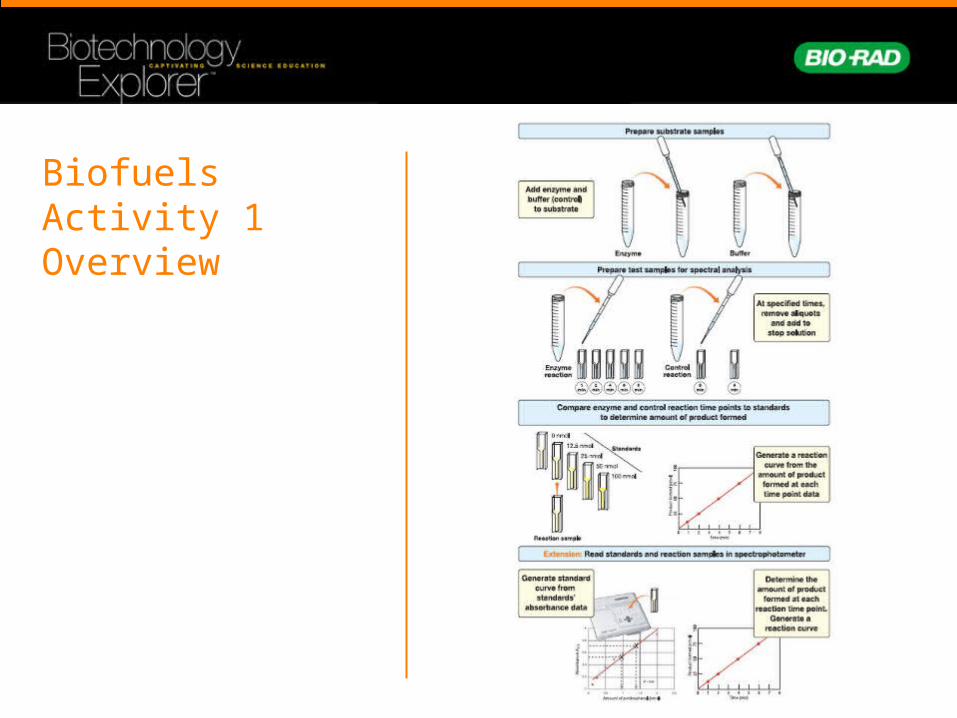
BiofuelsActivity 1Overview
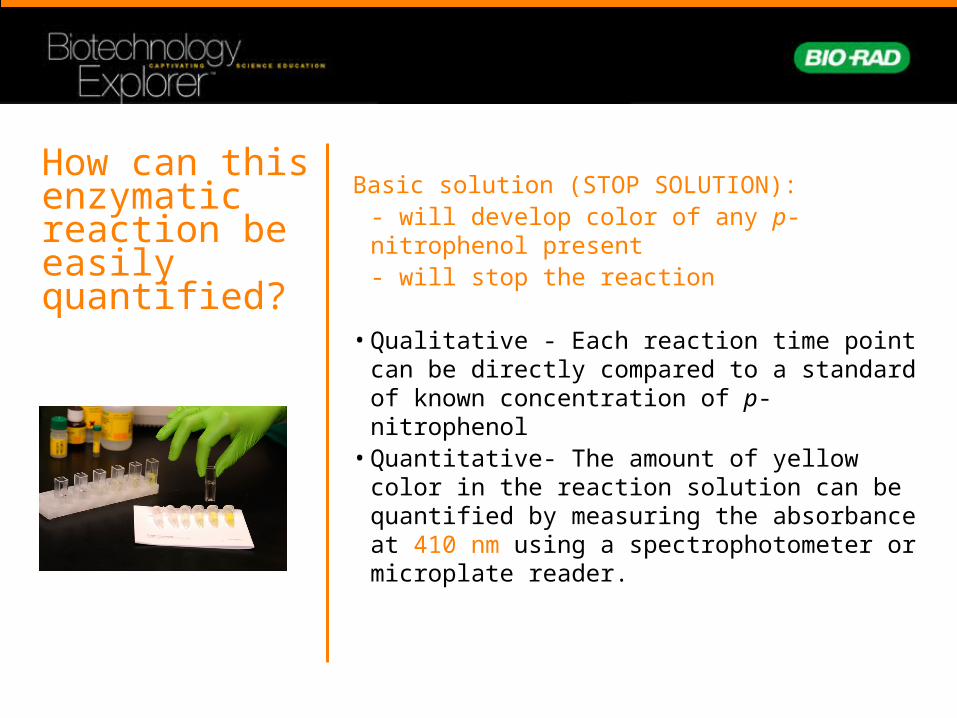
How can this enzymatic reaction be easily quantified?
Basic solution (STOP SOLUTION):- will develop color of any p-nitrophenol present- will stop the reaction
• Qualitative - Each reaction time point can be directly compared to a standard of known concentration of p-nitrophenol
• Quantitative- The amount of yellow color in the reaction solution can be quantified by measuring the absorbance at 410 nm using a spectrophotometer or microplate reader.

Measuring Absorbance Quantitatively
SmartSpecSpectrophotometer
iMARK Microplate reader

Biofuel Enzyme Kit Procedure Overview
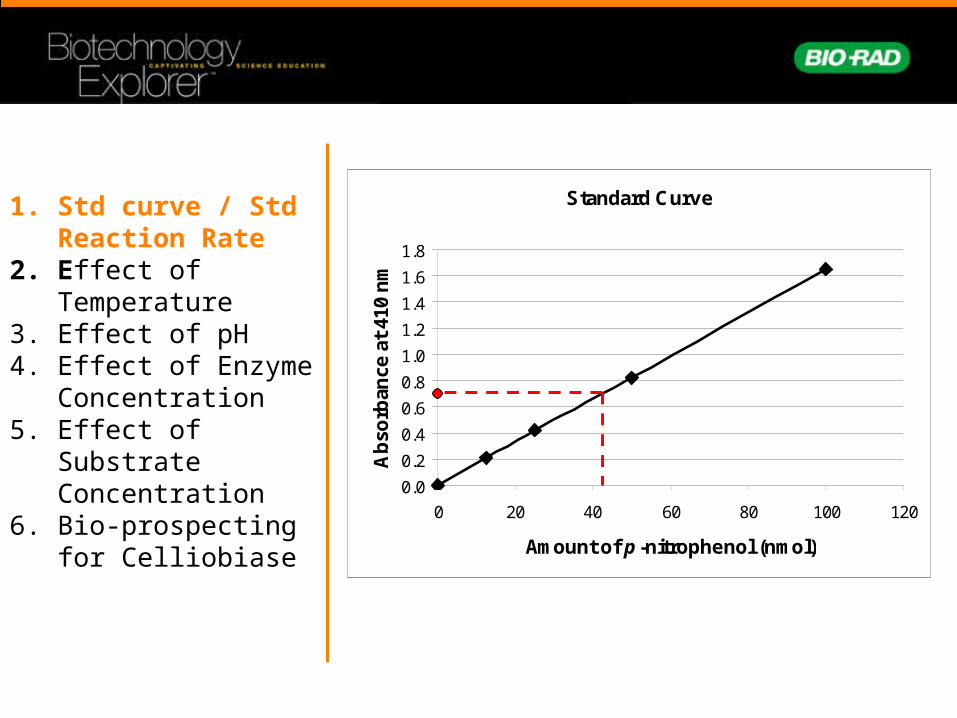
Activities:1. Reaction Rate & Std curve
2. Effect of Temperature
3. Effect of pH
4. Effect of Enzyme Concentration
5. Effect of Substrate Concentration
6. Bio-prospecting for Celliobiase
Collaborative approach:• Each student group does
activity 1• Student groups do one
activity each from 2-5• Groups share data• All groups do activity 6
and share data
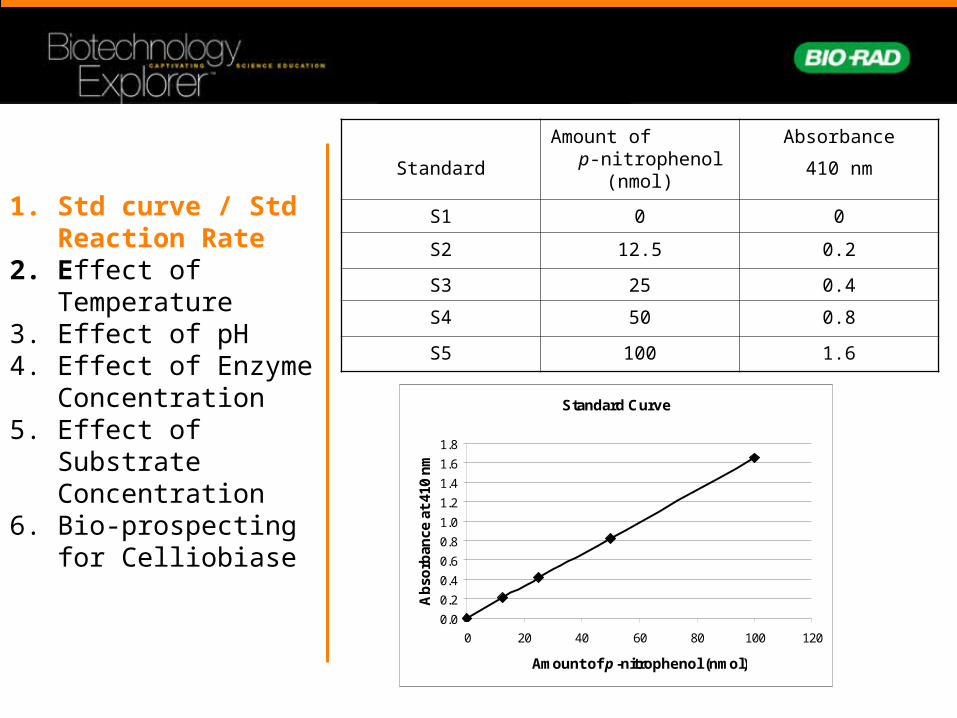
Standard
Amount of p-nitrophenol (nmol)
Absorbance
410 nm
S1 0 0
S2 12.5 0.2
S3 25 0.4
S4 50 0.8
S5 100 1.6
Standard Curve
0.0
0.2
0.4
0.6
0.8
1.0
1.2
1.4
1.6
1.8
0 20 40 60 80 100 120
Amount of p -nitrophenol (nmol)
Ab
sorb
ance
at
410
nm
1. Std curve / Std Reaction Rate
2. Effect of Temperature
3. Effect of pH4. Effect of Enzyme
Concentration5. Effect of Substrate
Concentration6. Bio-prospecting for
Celliobiase

Initial reaction rate =
Amount of p-nitrophenol produced (nmol)
Time (min)
Initial reaction rate =50 nmol - 0 nmol
4 min - 0 min = 12.5 nmol/min
Reaction Rate with Enzyme
0
20
40
60
80
100
0 2 4 6 8 10
Time (min)
Am
ou
nt
of p
-nit
rop
he
no
l (n
mo
l)
1. Std curve / Std Reaction Rate
2. Effect of Temperature
3. Effect of pH4. Effect of Enzyme
Concentration5. Effect of Substrate
Concentration6. Bio-prospecting for
Celliobiase
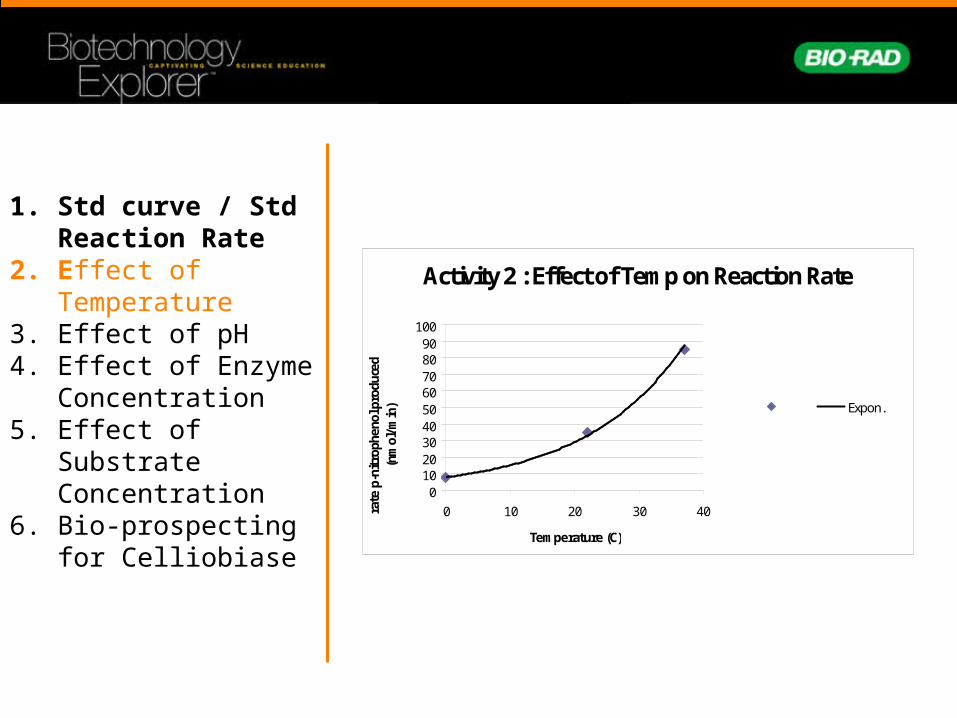
Activity 2 : Effect of Temp on Reaction Rate
0102030405060708090
100
0 10 20 30 40
Temperature (C)
rate
p-n
itro
phen
ol p
rodu
ced
(nm
ol/m
in) Expon.
1. Std curve / Std Reaction Rate
2. Effect of Temperature
3. Effect of pH4. Effect of Enzyme
Concentration5. Effect of Substrate
Concentration6. Bio-prospecting for
Celliobiase
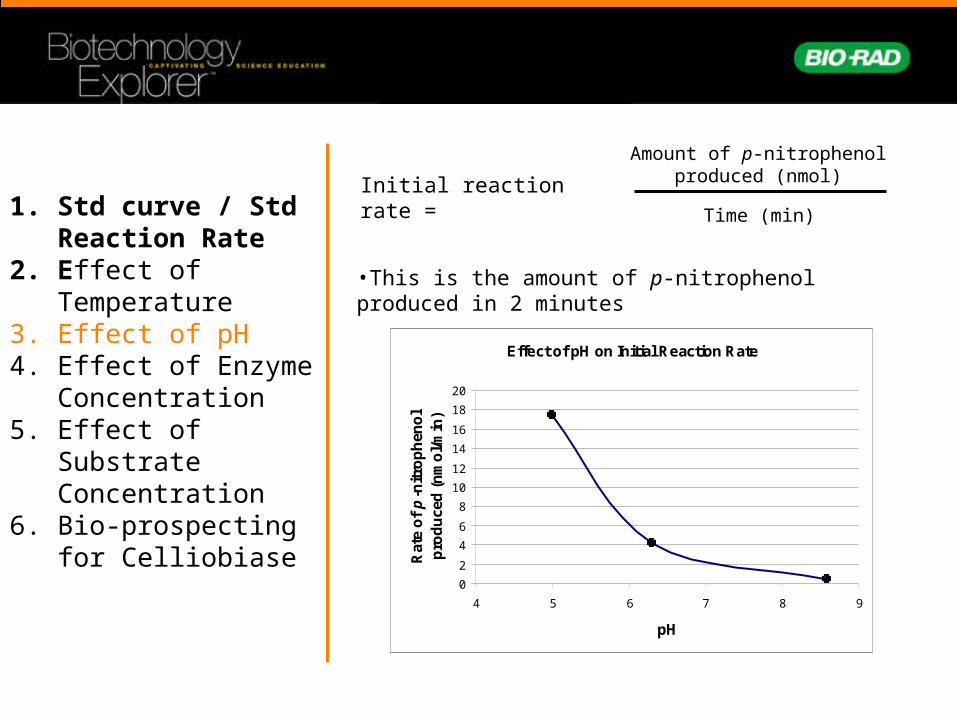
Initial reaction rate =
Amount of p-nitrophenol produced (nmol)
Time (min)
•This is the amount of p-nitrophenol produced in 2 minutes
Effect of pH on Initial Reaction Rate
0
2
4
6
8
10
12
14
16
18
20
4 5 6 7 8 9
pH
Rat
e o
f p
-nit
rop
hen
ol
pro
du
ced
(n
mo
l/min
)
1. Std curve / Std Reaction Rate
2. Effect of Temperature
3. Effect of pH4. Effect of Enzyme
Concentration5. Effect of Substrate
Concentration6. Bio-prospecting for
Celliobiase
Am
oun
t of p-
nit
rophenol fo
rmed
(n
mol)
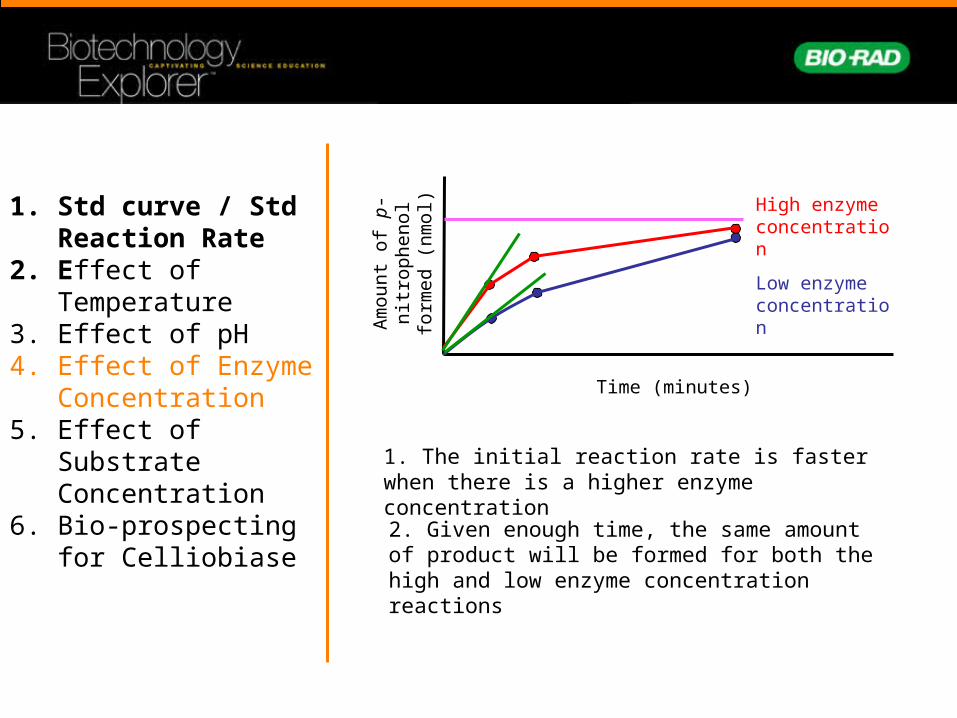
Time (minutes)
1. The initial reaction rate is faster when there is a higher enzyme concentration
High enzyme concentration
Low enzyme concentration
2. Given enough time, the same amount of product will be formed for both the high and low enzyme concentration reactions
1. Std curve / Std Reaction Rate
2. Effect of Temperature
3. Effect of pH4. Effect of Enzyme
Concentration5. Effect of Substrate
Concentration6. Bio-prospecting for
Celliobiase
Am
oun
t of p-n
itro
phenol
form
ed (
nm
ol)
Time (minutes)
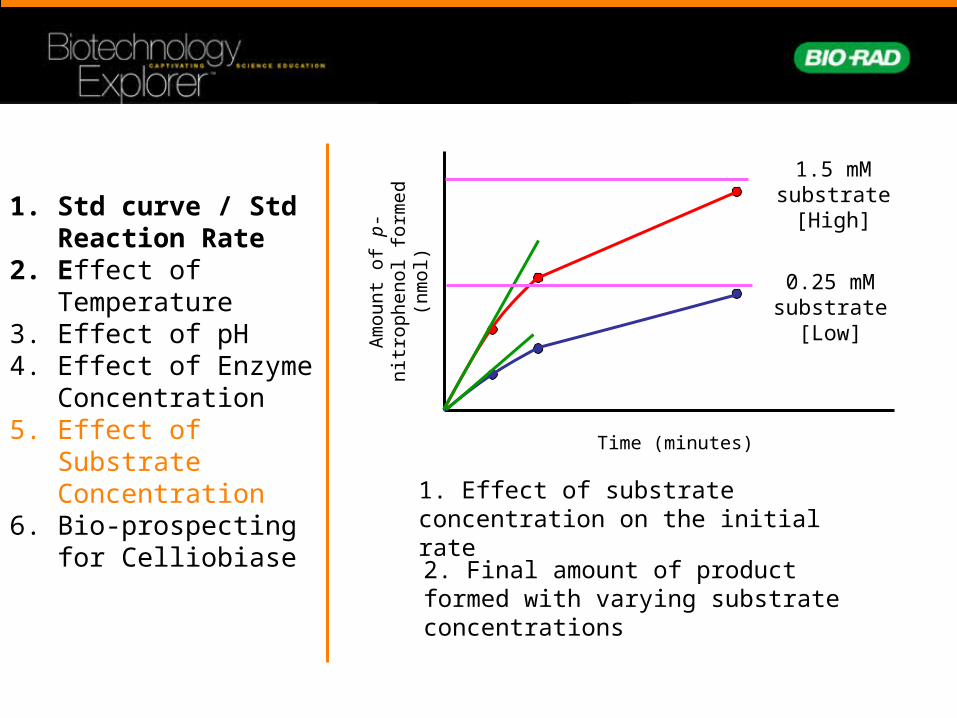
0.25 mM substrate
[Low]
1.5 mM substrate
[High]
1. Effect of substrate concentration on the initial rate
2. Final amount of product formed with varying substrate concentrations
1. Std curve / Std Reaction Rate
2. Effect of Temperature
3. Effect of pH4. Effect of Enzyme
Concentration5. Effect of Substrate
Concentration6. Bio-prospecting for
Celliobiase
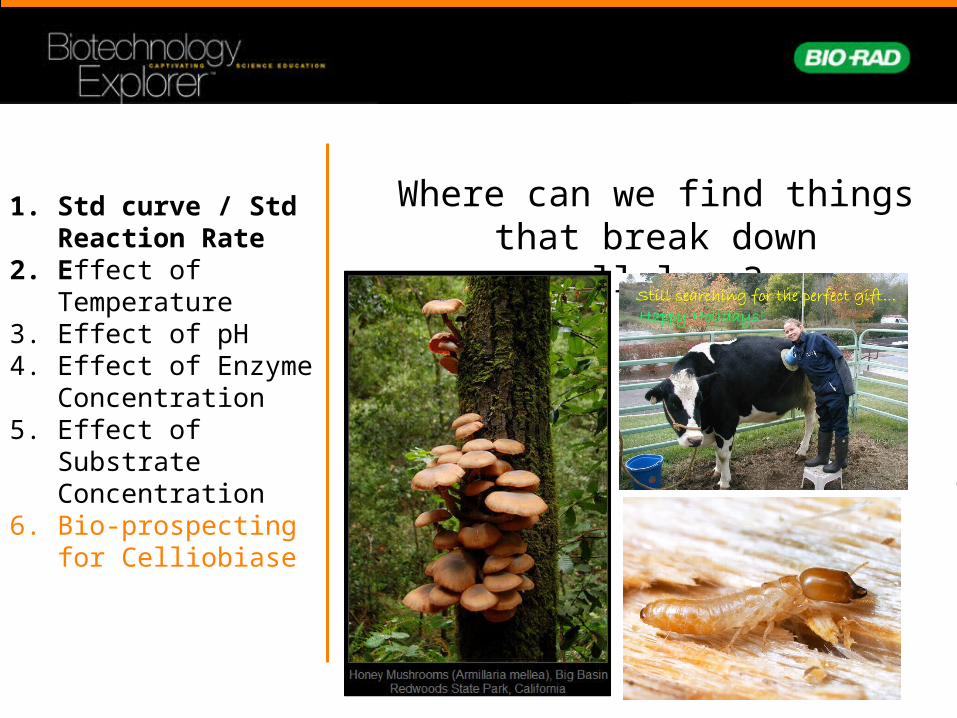
Where can we find things that break down cellulose?
Inquiry – find your own source of celliobiase.
Have students develop protocol for testing
activity
Art – document your source via photography
or drawings in a Lab Notebook
Technology – use GPS and mapping software to document
sources
1. Std curve / Std Reaction Rate
2. Effect of Temperature
3. Effect of pH4. Effect of Enzyme
Concentration5. Effect of Substrate
Concentration6. Bio-prospecting for
Celliobiase

Where can we find things that break down cellulose?
Inquiry – find your own source of celliobiase! Have students develop protocol for testing activity based upon activity 1. Mushrooms are a great source of celliobiase and where the biofuels industry gets most of its enzymes currently, but there are many other potential sources out there….test them!
Art – document your source via photography or drawings in a Lab Notebook
Technology – use GPS and mapping software to document sources. Use excel or Vernier LoggerPro to analyze data. (Excel protocol available upon request).
1. Std curve / Std Reaction Rate
2. Effect of Temperature
3. Effect of pH4. Effect of Enzyme
Concentration5. Effect of Substrate
Concentration6. Bio-prospecting for
Celliobiase
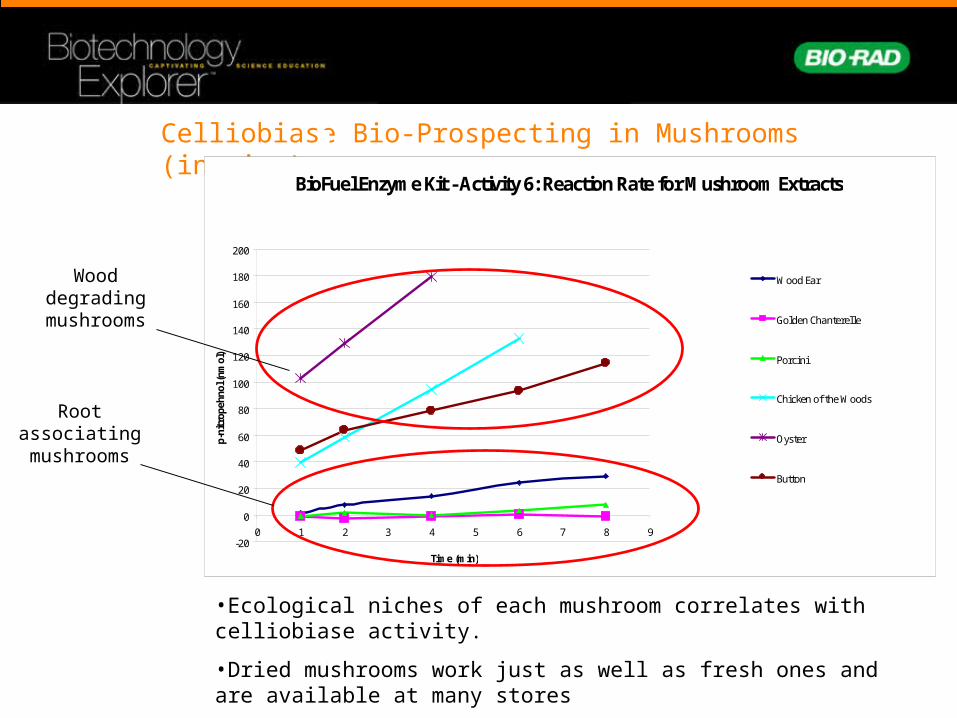
Celliobiase Bio-Prospecting in Mushrooms (inquiry)
BioFuel Enzyme Kit - Activity 6: Reaction Rate for Mushroom Extracts
-20
0
20
40
60
80
100
120
140
160
180
200
0 1 2 3 4 5 6 7 8 9
Time (min)
p-ni
trop
ehno
l (nm
ol)
Wood Ear
Golden Chanterelle
Porcini
Chicken of the Woods
Oyster
Button
•Ecological niches of each mushroom correlates with celliobiase activity.
•Dried mushrooms work just as well as fresh ones and are available at many stores
Root associating mushrooms
Wood degrading
mushrooms
StudentInquiry: A Stepwise Protocol approach
• Questions to consider:–How important is each step in the lab protocol?
–What part of the protocol can I manipulate to see a change in the results?
Possible variables: ratio of enzyme to substrate, look at more temperatures – can you get failure at a high enough temperature?, look at more pH points – at what low pH does failure occur?
–How do I insure the changes I make is what actually affected the out come? (Controls)
–Write the protocol. After approval – do it

StudentInquiry
• More Advanced Questions
–How can I estimate the concentration of my novel celliobiase from activity 6?
–Can I predict the activity of my novel celliobiase based upon the environment/organism I’m getting it from?
–How does my novel celliobiase act under different pH and temperatures?
–What is the optimal pH/temperature combination for my celliobiase? (Surface plots)
0 22 37 50 803.5
5
6.3
8.6
Temperature (°C)
pH
pH/Temperature surfaceAbsorbance values
0-1 1-2 2-3
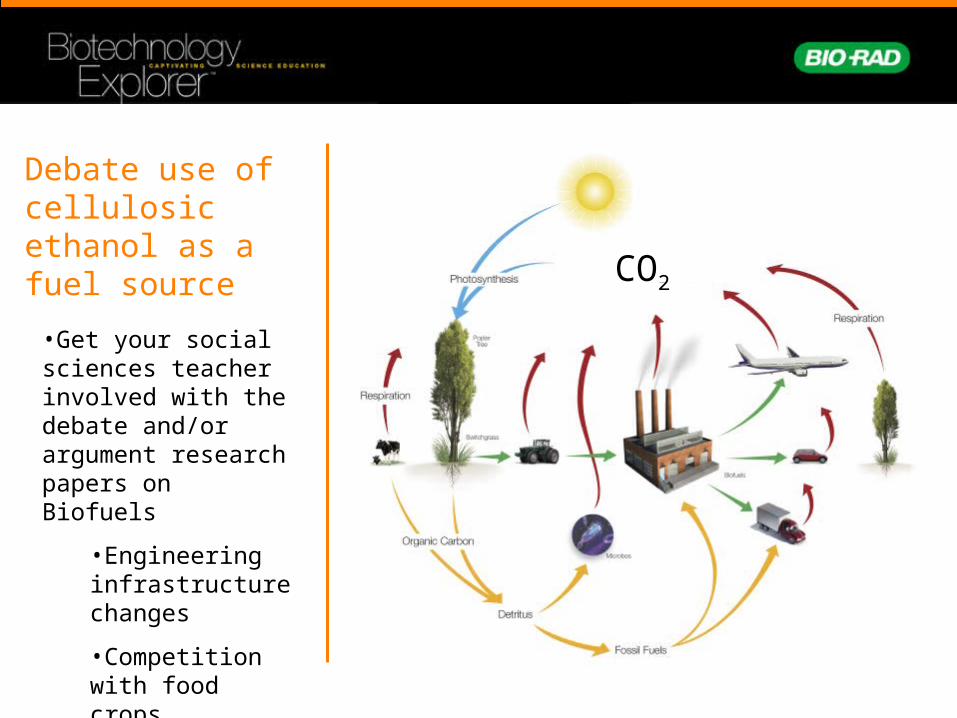
Debate use of cellulosic ethanol as a fuel source
CO2
•Get your social sciences teacher involved with the debate and/or argument research papers on Biofuels
•Engineering infrastructure changes
•Competition with food crops
Top Related