Enzyme Based Microfluidic Biofuel Cell to Generate Micropower
Upload
cillian-arveyCategory
view
33download
0description

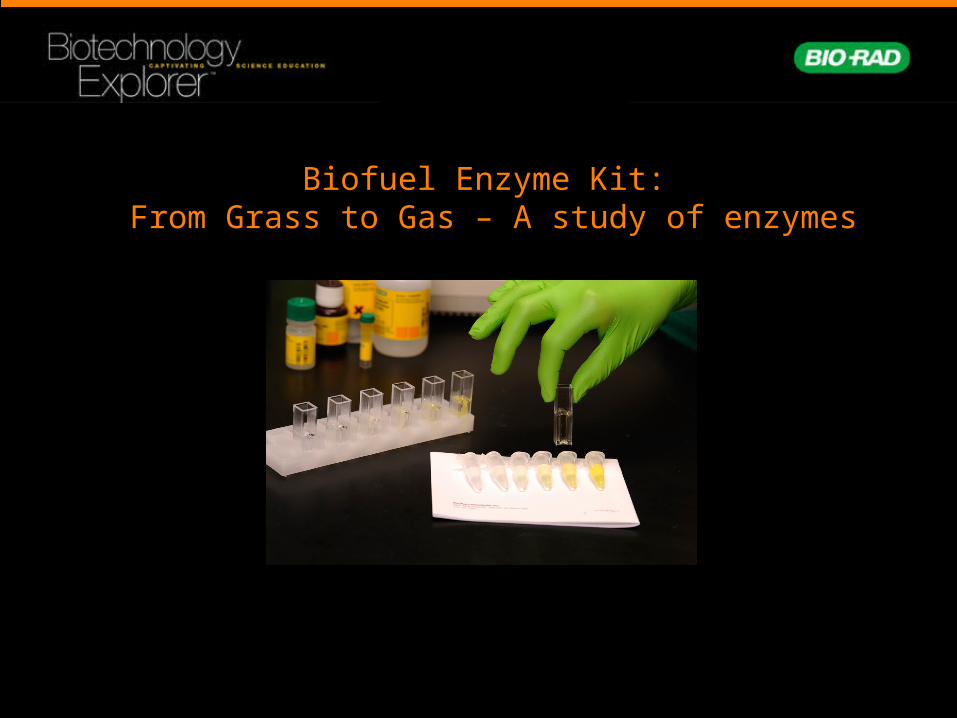
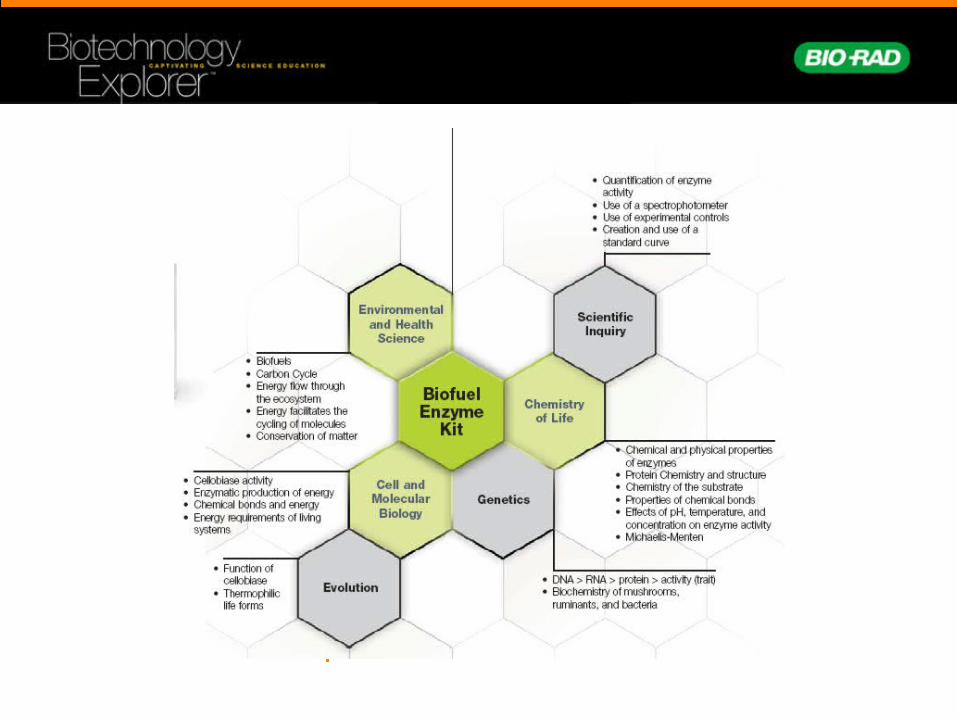
Biofuel Enzyme Kit: From Grass to Gas – A study of enzymes
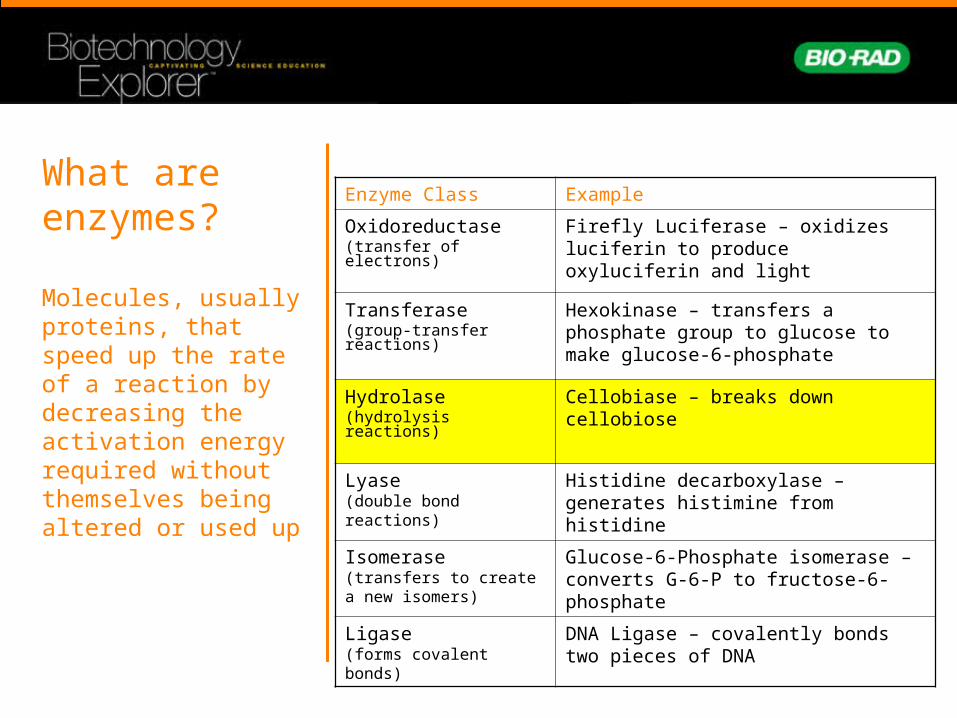
What are enzymes?
Molecules, usually proteins, that speed up the rate of a reaction by decreasing the activation energy required without themselves being altered or used up
Enzyme Class Example
Oxidoreductase(transfer of electrons)
Firefly Luciferase – oxidizes luciferin to produce oxyluciferin and light
Transferase(group-transfer reactions)
Hexokinase – transfers a phosphate group to glucose to make glucose-6-phosphate
Hydrolase(hydrolysis reactions)
Cellobiase – breaks down cellobiose
Lyase(double bond reactions)
Histidine decarboxylase – generates histimine from histidine
Isomerase(transfers to create a new isomers)
Glucose-6-Phosphate isomerase – converts G-6-P to fructose-6-phosphate
Ligase(forms covalent bonds)
DNA Ligase – covalently bonds two pieces of DNA
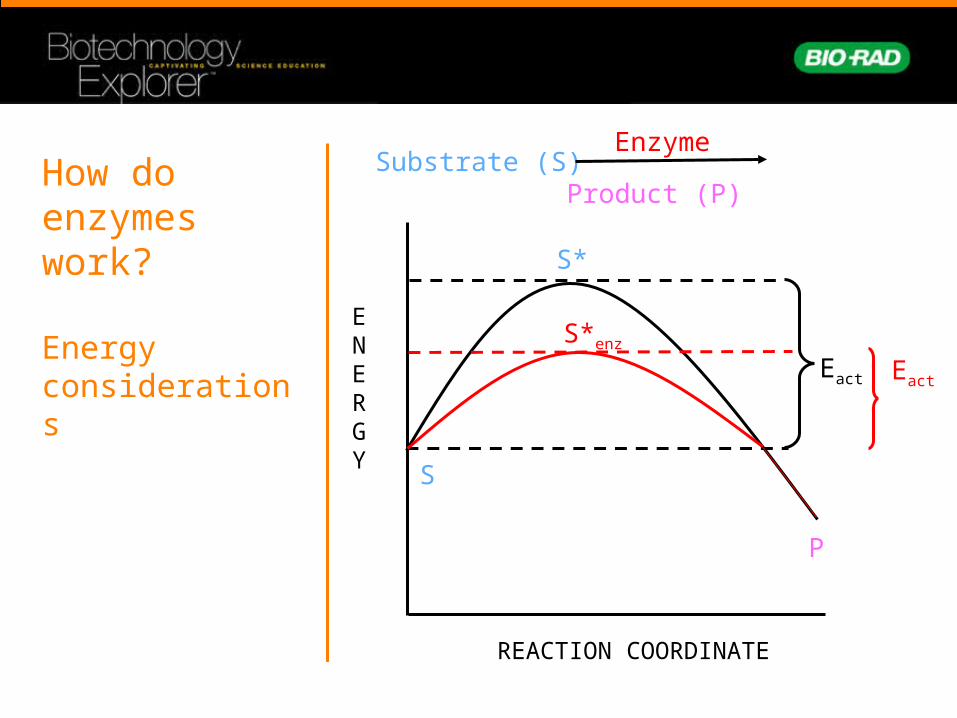
How do enzymes work?
Energy considerations
Substrate (S) Product (P)
ENERGY
REACTION COORDINATE
S
P
S*
Eact
S*enz
Eact
Enzyme
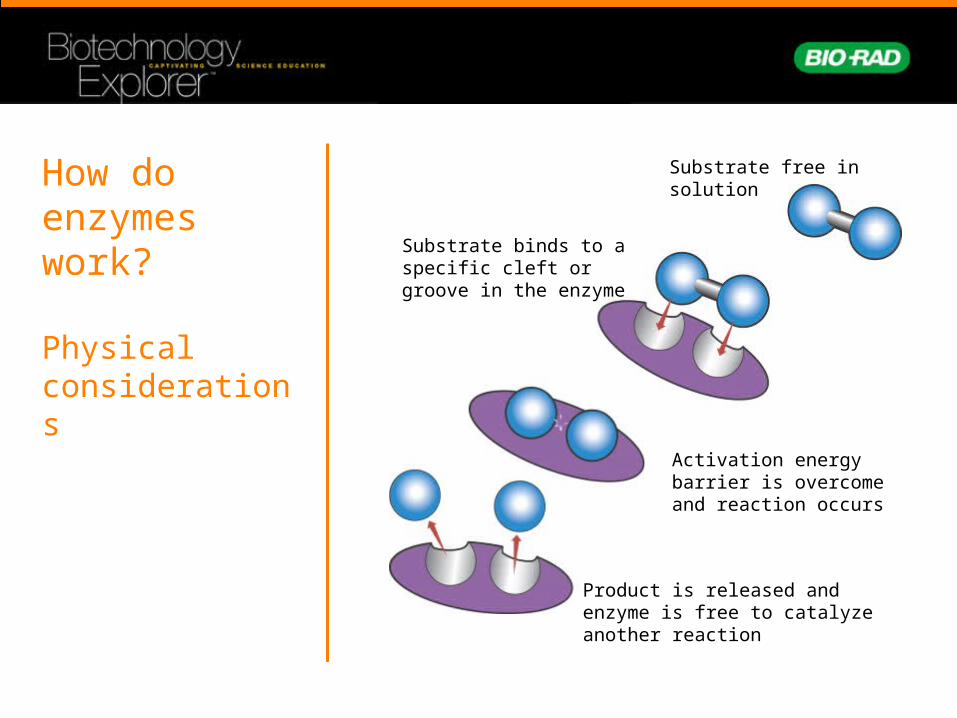
How do enzymes work?
Physical considerations
Substrate free in solution
Substrate binds to a specific cleft or groove in the enzyme
Activation energy barrier is overcome and reaction occurs
Product is released and enzyme is free to catalyze another reaction
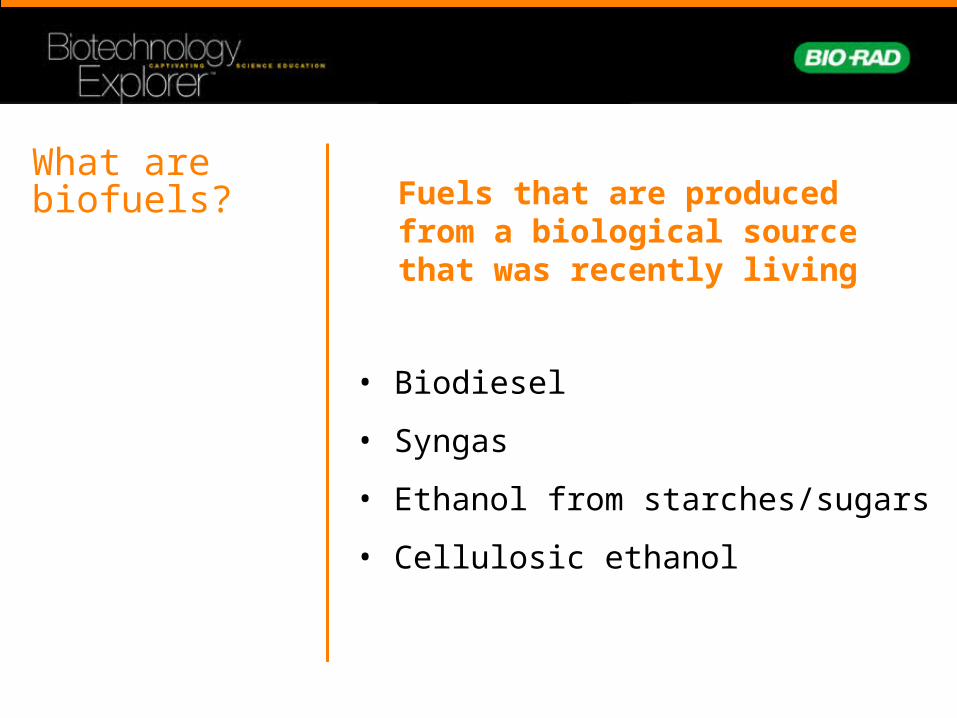
What are biofuels?
• Biodiesel
• Syngas
• Ethanol from starches/sugars
• Cellulosic ethanol
Fuels that are produced from a biological source that was recently living
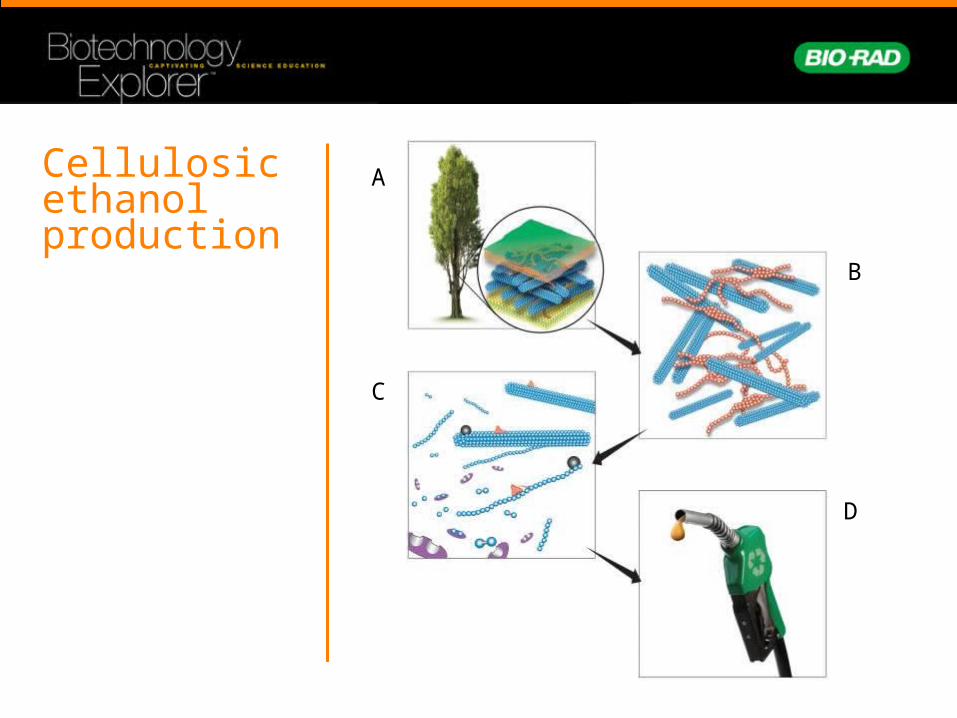
Cellulosic ethanol production
A
B
C
D
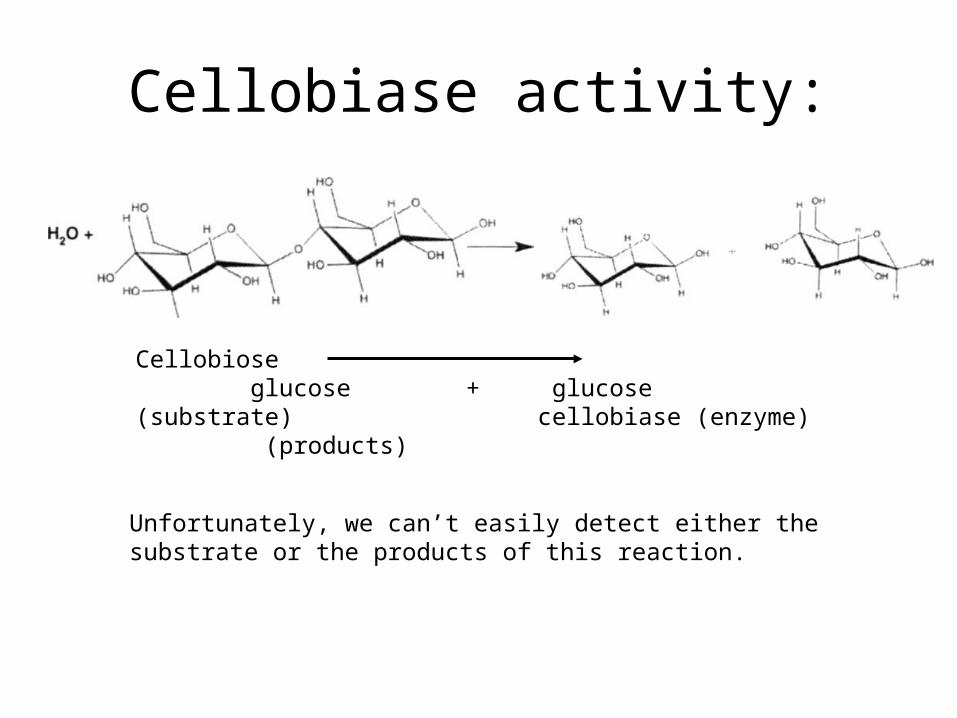
Cellobiase activity:
Cellobiose glucose + glucose(substrate) cellobiase (enzyme) (products)
Unfortunately, we can’t easily detect either the substrate or the products of this reaction.
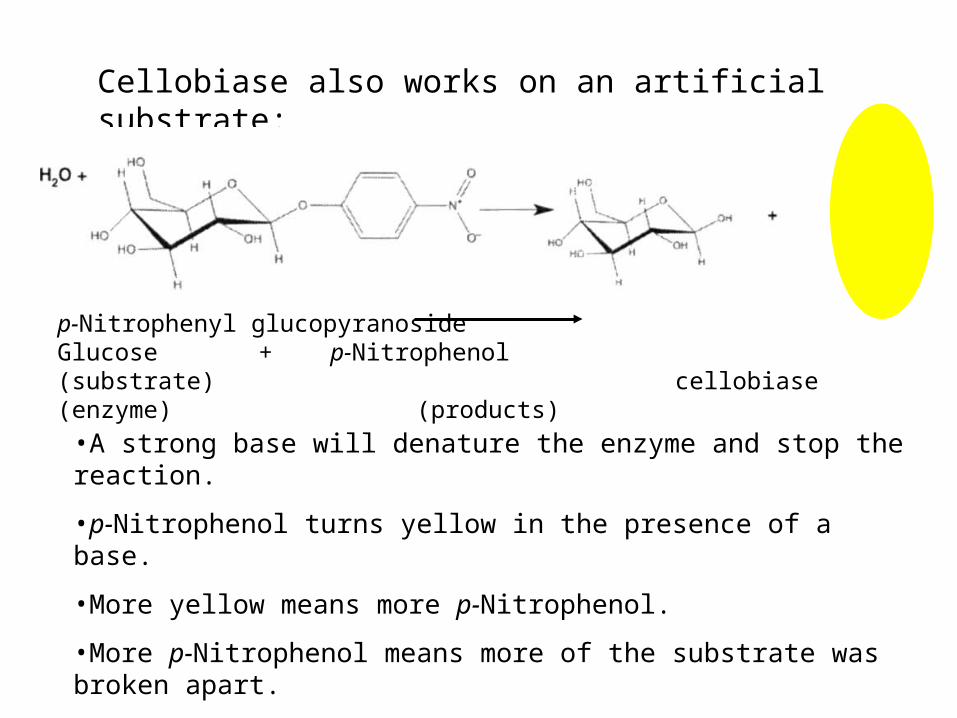
p-Nitrophenyl glucopyranoside Glucose + p-Nitrophenol(substrate) cellobiase (enzyme) (products)
Cellobiase also works on an artificial substrate:
•A strong base will denature the enzyme and stop the reaction.
•p-Nitrophenol turns yellow in the presence of a base.
•More yellow means more p-Nitrophenol.
•More p-Nitrophenol means more of the substrate was broken apart.
+
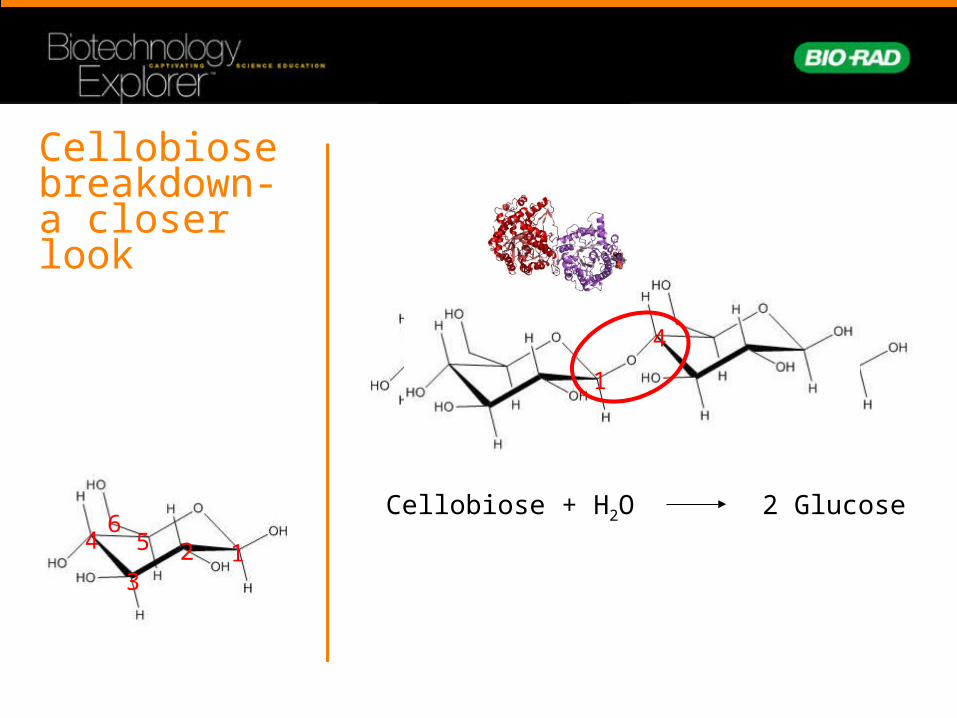
Cellobiose breakdown- a closer look
Cellobiose + H2O 2 Glucose
4
1
56
4 23
1

Cellobiase breakdown of p-nitrophenyl glucopyranoside
+
p-nitrophenyl glucopyranoside + H2O glucose + p-nitrophenol
Basic conditions
Clear Yellow
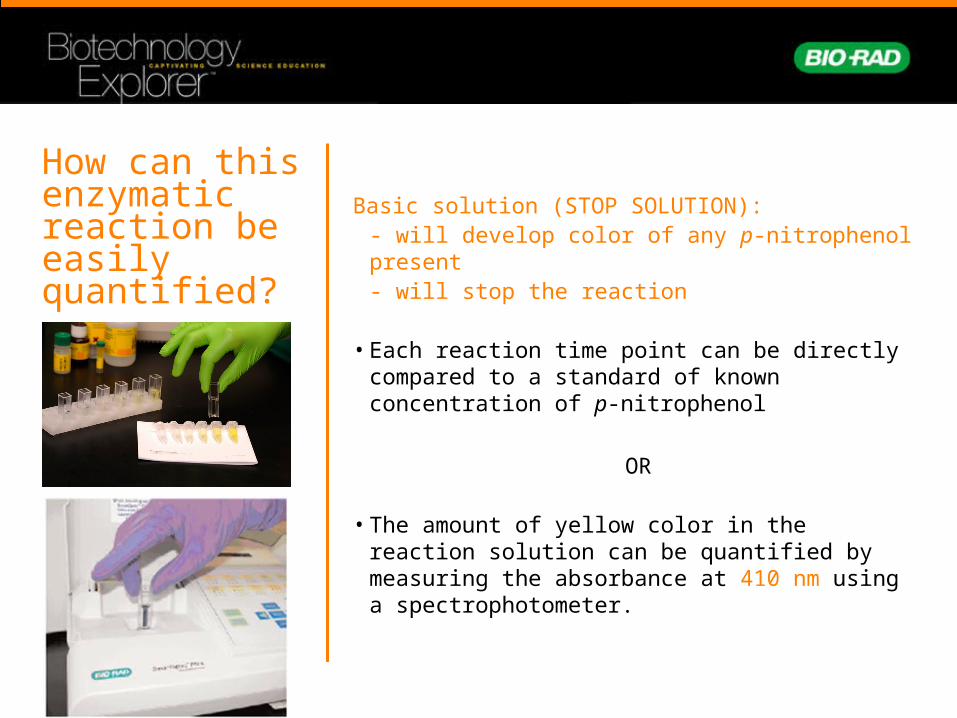
How can this enzymatic reaction be easily quantified?
Basic solution (STOP SOLUTION):- will develop color of any p-nitrophenol present- will stop the reaction
• Each reaction time point can be directly compared to a standard of known concentration of p-nitrophenol
OR
• The amount of yellow color in the reaction solution can be quantified by measuring the absorbance at 410 nm using a spectrophotometer.


Lab protocol overview
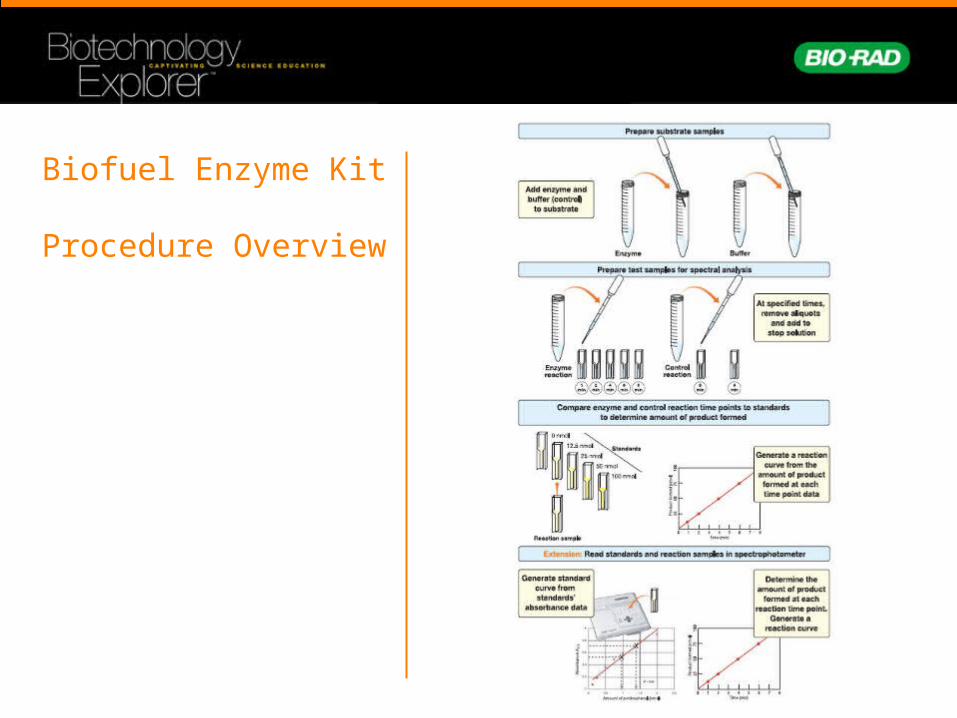
Biofuel Enzyme Kit Procedure Overview
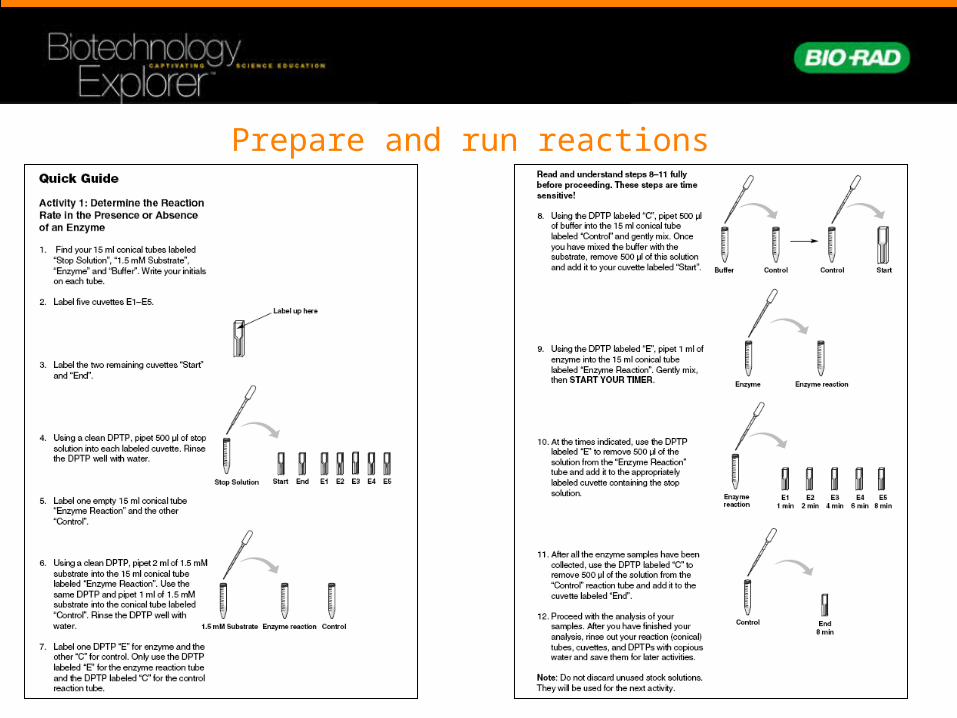
Prepare and run reactions
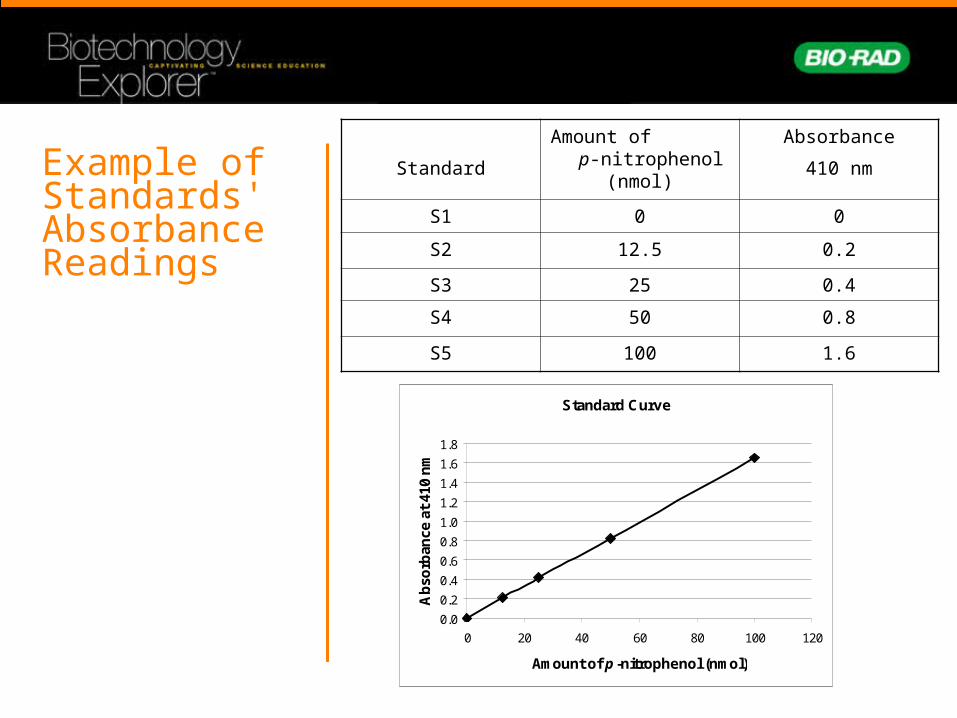
Example of Standards' Absorbance Readings
Standard
Amount of p-nitrophenol (nmol)
Absorbance
410 nm
S1 0 0
S2 12.5 0.2
S3 25 0.4
S4 50 0.8
S5 100 1.6
Standard Curve
0.0
0.2
0.4
0.6
0.8
1.0
1.2
1.4
1.6
1.8
0 20 40 60 80 100 120
Amount of p -nitrophenol (nmol)
Ab
sorb
ance
at
410
nm
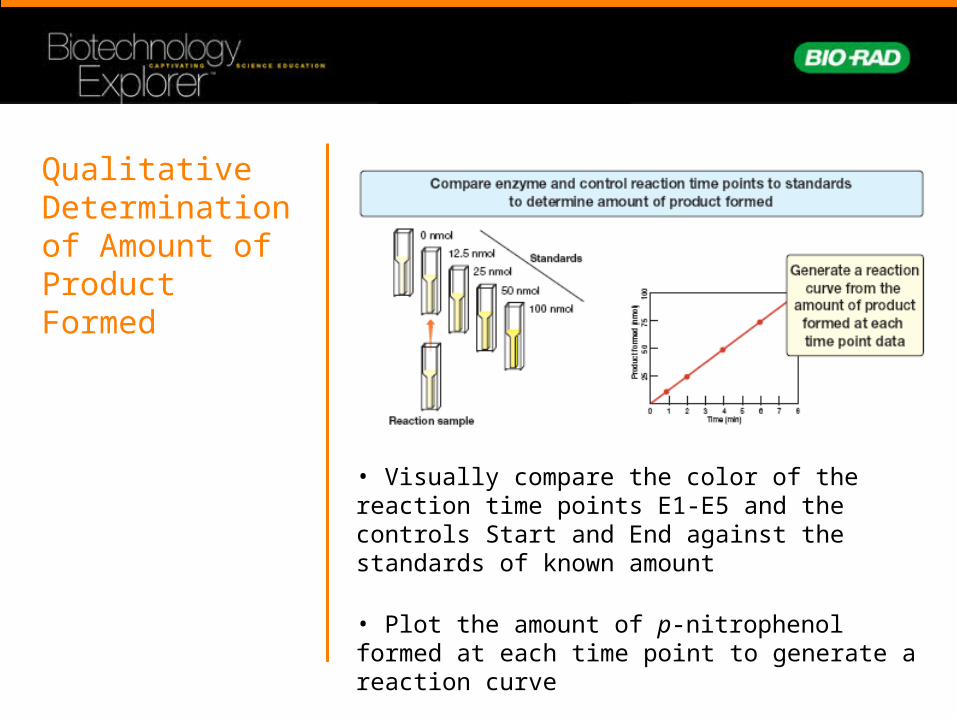
Qualitative Determination of Amount of Product Formed
• Visually compare the color of the reaction time points E1-E5 and the controls Start and End against the standards of known amount
• Plot the amount of p-nitrophenol formed at each time point to generate a reaction curve
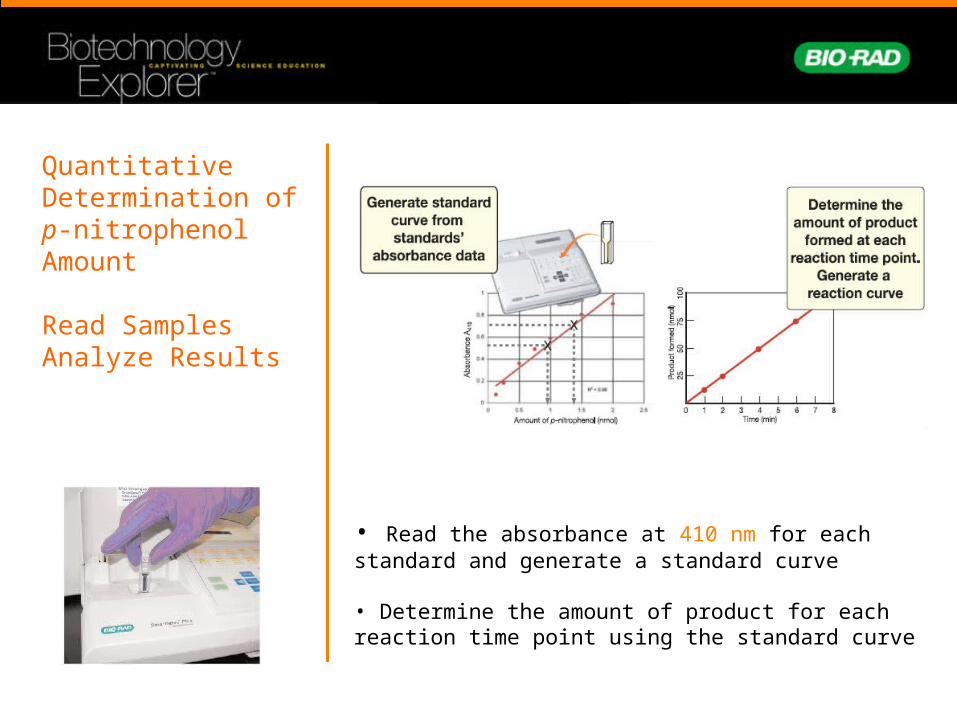
Quantitative Determination of p-nitrophenol Amount
Read SamplesAnalyze Results
• Read the absorbance at 410 nm for each standard and generate a standard curve
• Determine the amount of product for each reaction time point using the standard curve
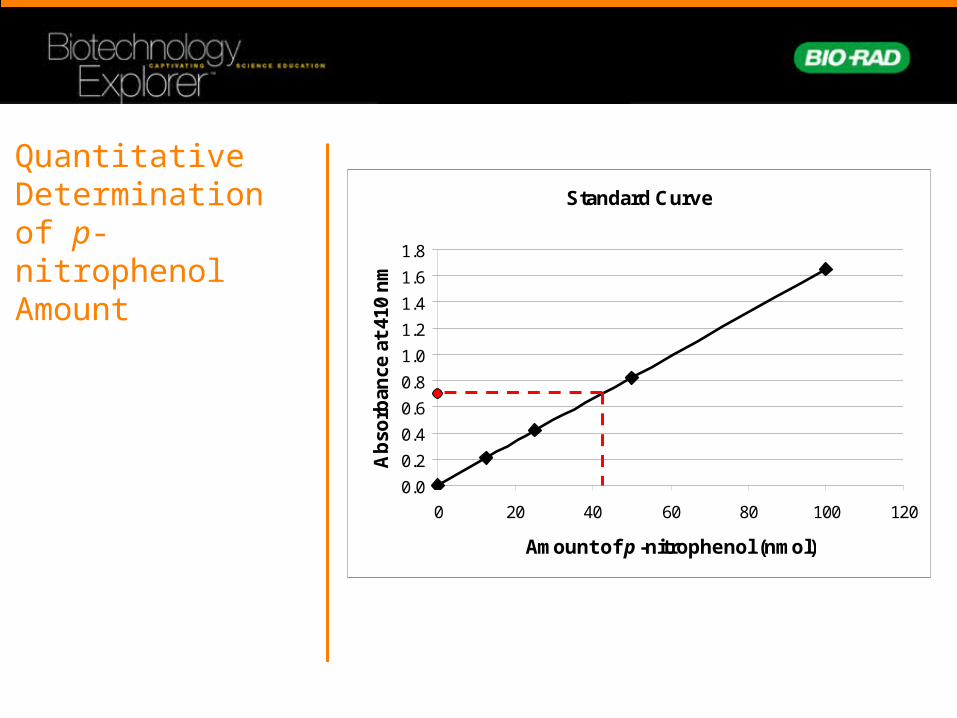
Quantitative Determination of p-nitrophenol Amount
Standard Curve
0.0
0.2
0.4
0.6
0.8
1.0
1.2
1.4
1.6
1.8
0 20 40 60 80 100 120
Amount of p -nitrophenol (nmol)
Ab
sorb
ance
at
410
nm
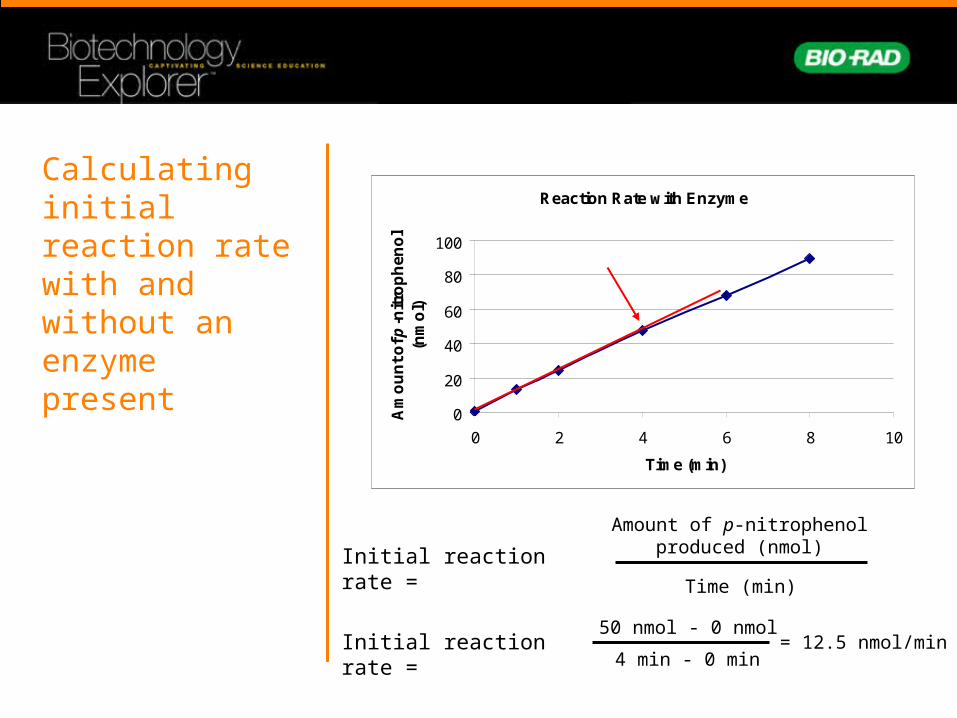
Calculating initial reaction rate with and without an enzyme present
Initial reaction rate =
Amount of p-nitrophenol produced (nmol)
Time (min)
Initial reaction rate =50 nmol - 0 nmol
4 min - 0 min = 12.5 nmol/min
Reaction Rate with Enzyme
0
20
40
60
80
100
0 2 4 6 8 10
Time (min)
Am
ou
nt
of p
-nit
rop
he
no
l (n
mo
l)
Conditions affecting reaction rate
• pH
• Temperature
• Substrate Concentration
• Enzyme Concentration

Effects of pH
Prepare and run reactions

Calculating initial reaction rate at different pH values
Initial reaction rate =
Amount of p-nitrophenol produced (nmol)
Time (min)
•This is the amount of p-nitrophenol produced in 2 minutes
Effect of pH on Initial Reaction Rate
0
2
4
6
8
10
12
14
16
18
20
4 5 6 7 8 9
pH
Rat
e o
f p
-nit
rop
hen
ol
pro
du
ced
(n
mo
l/min
)

Further activities included in the kit
• Effect of temperature on the reaction rate
• Effect of substrate concentration on the reaction rate
• Effect of enzyme concentration on the reaction rate
• Ability of a mushroom extract to catalyze the breakdown of the substrate

Extensions
• Perform a complete Michaelis-Menten analysis and determine the Vmax and Km for the cellobiase in this kit
• Determine the optimum pH and temperature for the enzyme by preparing a temperature/pH surface plot
• Debate use of crops for cellulosic ethanol production
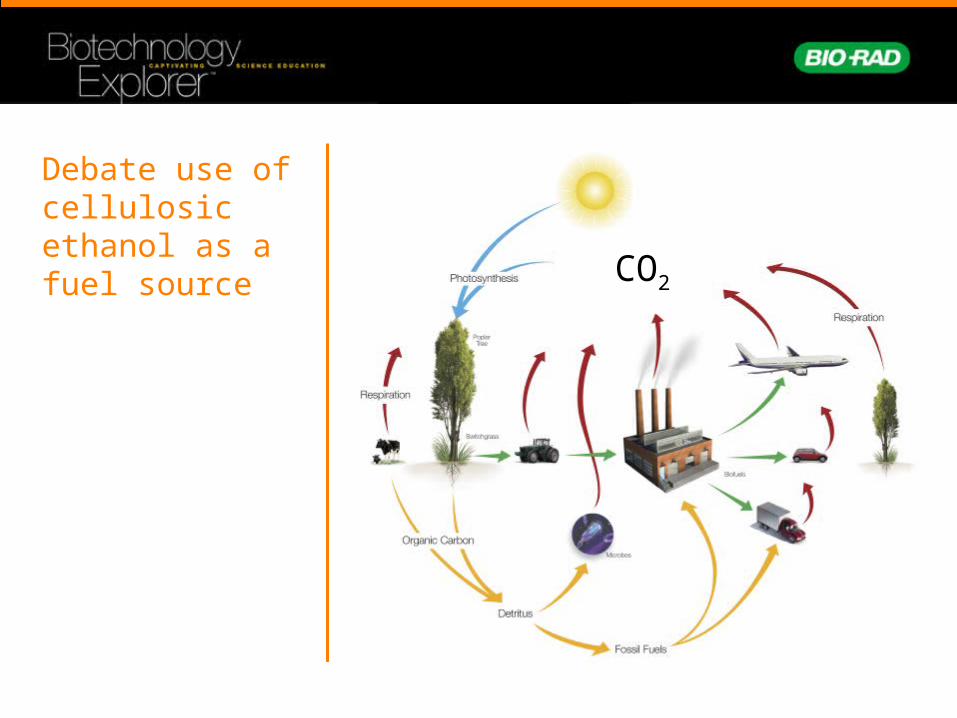
Debate use of cellulosic ethanol as a fuel source CO2
Webinars • Enzyme Kinetics — A Biofuels Case Study
• Real-Time PCR — What You Need To Know and Why You Should Teach It!
• Proteins — Where DNA Takes on Form and Function
• From plants to sequence: a six week college biology lab course
• From singleplex to multiplex: making the most out of your realtime experiments
explorer.bio-rad.comSupportWebinars