


Languages
Pages
Legal


BC Natural Gas Industry Competitiveness Study
Natural Gas Industry Competitiveness Study
September 1999

BC Natural Gas Industry Competitiveness Study
BC Gas Demand Forecast
• Domestic and Export markets are expected to grow at a rate of 1 to 2% annually. – This excludes demand created by the addition
of the following major projects.
• Additional demand will be created by Vancouver Island cogenerators, Burrard Thermal Plant, and the Alliance Pipeline by the year 2001.

BC Natural Gas Industry Competitiveness Study
BC Gas Demand Forecast
0
200
400
600
800
1000
1200
1400
1600
1980 1985 1990 1995 2000 2005 2010 2015 2020
Year
Pro
du
ctio
n in
Bcf
of
Mar
keta
ble
Gas
Low Total Demand
Base Total Demand
High Total Demand
NEB ProductionForecast
Historical Forecast
Alliance Pipeline, Burrard Thermal andVancouver Island Cogenerators

BC Natural Gas Industry Competitiveness Study
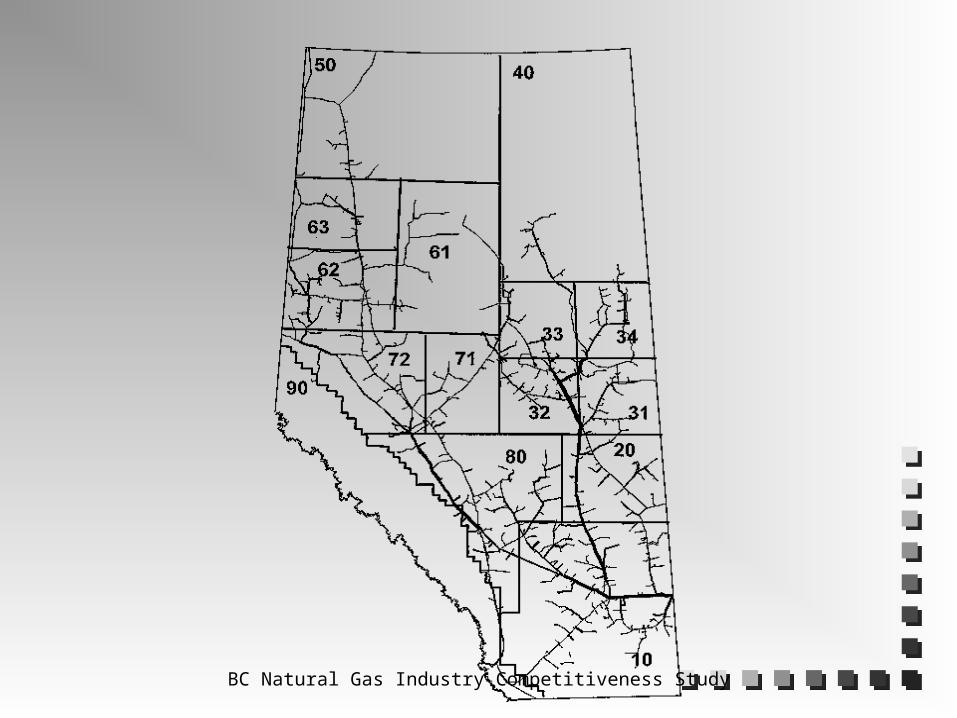
Gas Fields in Northeast BC with Established Reserves

BC Natural Gas Industry Competitiveness Study
Northeast BC Remaining Gas Potential
BC Natural Gas Industry Competitiveness Study
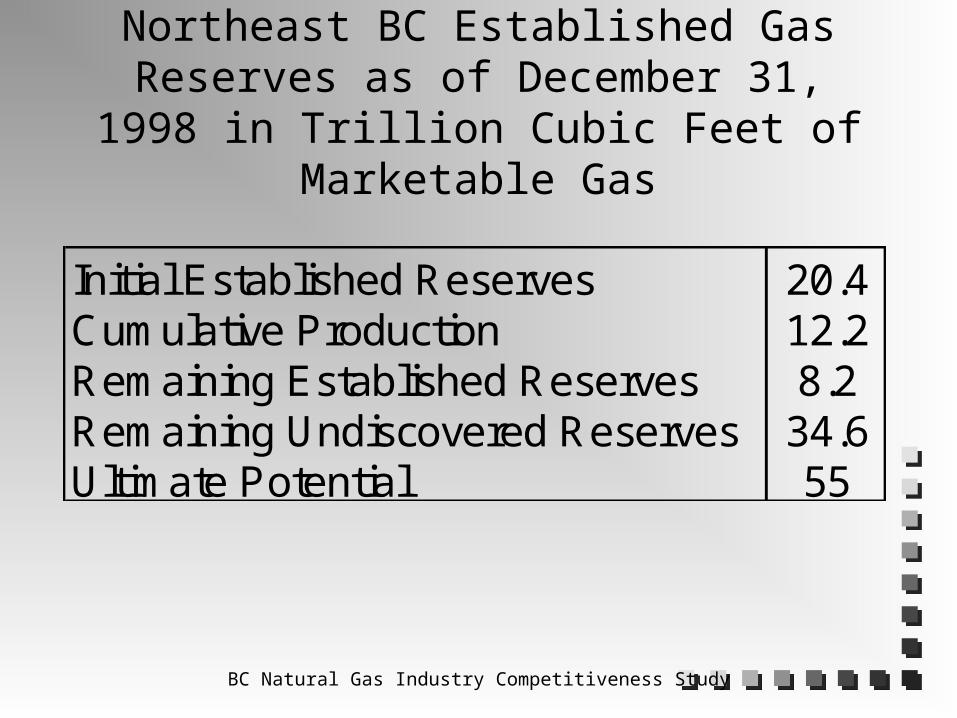
Northeast BC Established Gas Reserves as of December 31, 1998 in Trillion Cubic
Feet of Marketable Gas
Initial Established Reserves 20.4Cumulative Production 12.2Remaining Established Reserves 8.2Remaining Undiscovered Reserves 34.6Ultimate Potential 55
BC Natural Gas Industry Competitiveness Study
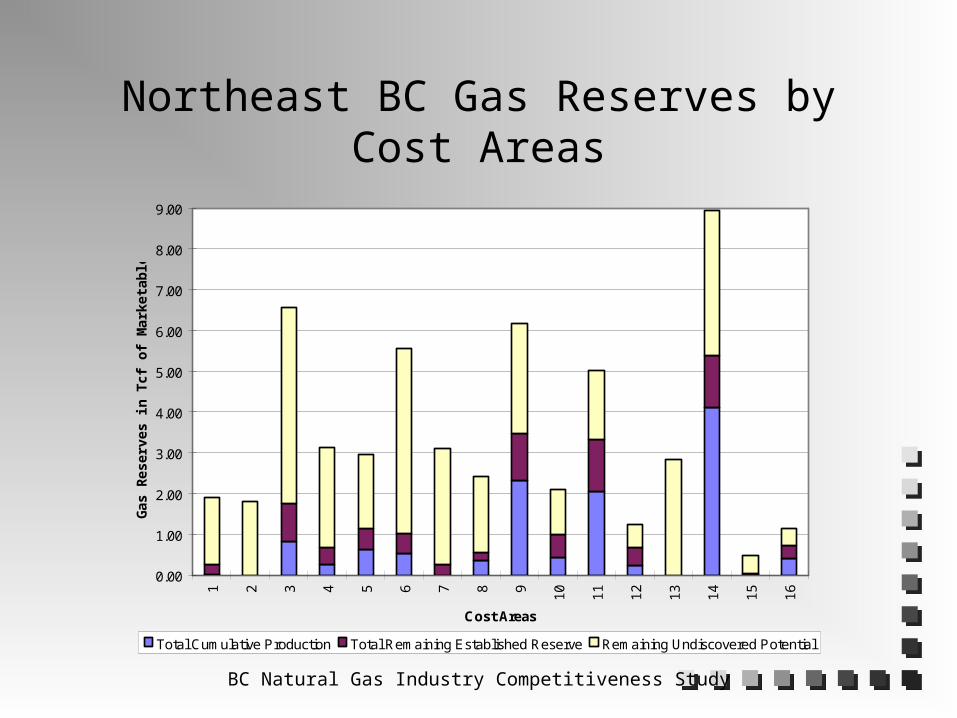
Northeast BC Gas Reserves by Cost Areas
0.00
1.00
2.00
3.00
4.00
5.00
6.00
7.00
8.00
9.001 2 3 4 5 6 7 8 9 10
11 12
13
14
15
16
Cost Areas
Ga
s R
es
erv
es
in T
cf
of
Ma
rke
tab
le G
as
Total Cumulative Production Total Remaining Established Reserve Remaining Undiscovered Potential
BC Natural Gas Industry Competitiveness Study
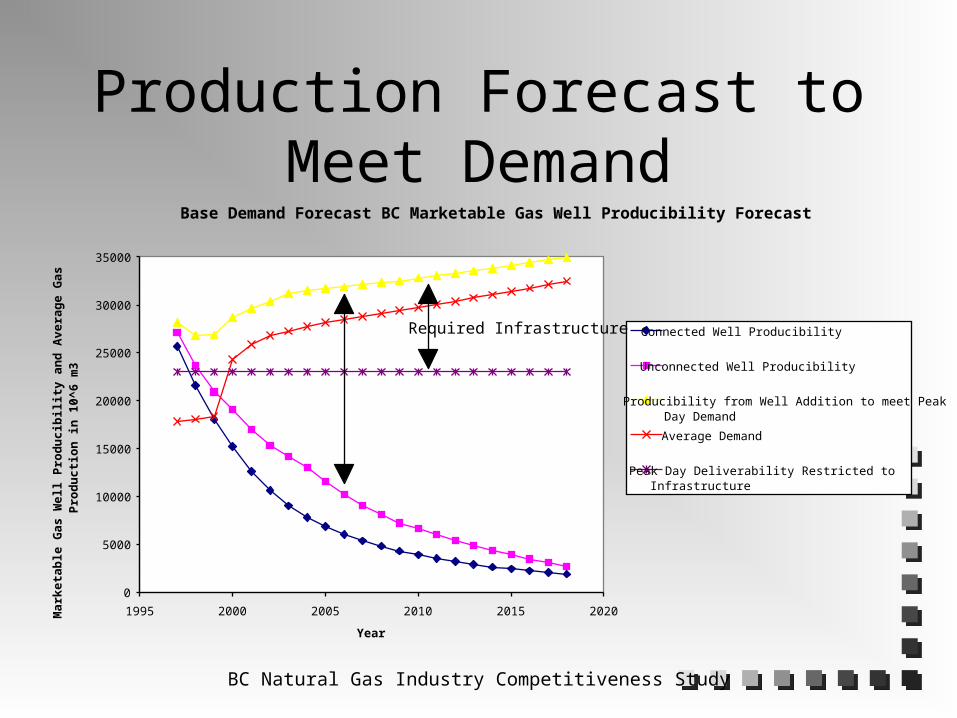
Production Forecast to Meet Demand
Base Demand Forecast BC Marketable Gas Well Producibility Forecast
0
5000
10000
15000
20000
25000
30000
35000
1995 2000 2005 2010 2015 2020
Year
Ma
rke
tab
le G
as
We
ll P
rod
uc
ibil
ity
an
d A
ver
ag
e G
as
P
rod
uct
ion
in 1
0^
6 m
3
Connected Well Producibility
Unconnected Well Producibility
Producibility from Well Addition to meet PeakDay Demand
Average Demand
Peak Day Deliverability Restricted toInfrastructure
Required Infrastructure
BC Natural Gas Industry Competitiveness Study
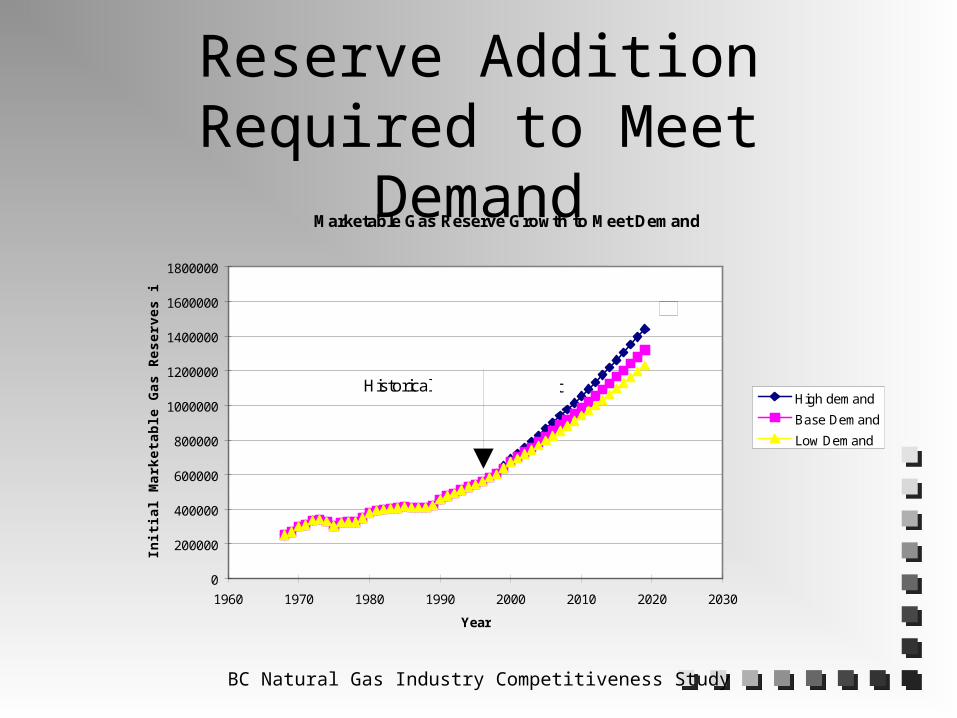
Reserve Addition Required to Meet DemandMarketable Gas Reserve Growth to Meet Demand
0
200000
400000
600000
800000
1000000
1200000
1400000
1600000
1800000
1960 1970 1980 1990 2000 2010 2020 2030
Year
Init
ial
Ma
rke
tab
le G
as
Re
se
rve
s i
n 1
0^
6 m
3
High demand
Base Demand
Low Demand
Historical Forecast
Estimate Ultimate Potential of 1560 10^9 m3
BC Natural Gas Industry Competitiveness Study
Reserve Additions per Well
• Reserve Additions per well have been declining
• Considerable amount of drilling activity is required to counteract declines in existing pools and meet future increases in demand

BC Natural Gas Industry Competitiveness Study
Reserve Addition Per Meter Drilled
Reserve Addition per Meter Gas Intent Drilling
1
10
100
1000
1000 10000
Cummulative Meter of Gas Intent Drilling in Km
(Re
se
rve
Ad
dit
ion
in 1
0^
6 m
3 o
f M
ark
eta
ble
Ga
s/C
um
m.
Me
ter
Ga
s In
ten
t D
rilli
ng
in K
m)
Actual values Calculated based on Regression

BC Natural Gas Industry Competitiveness Study
Gas Drilling Forecast Gas Intent Wells Drilled to Meet Demand
0
200
400
600
800
1000
1200
1980 1985 1990 1995 2000 2005 2010 2015 2020
Year
Nu
mb
er o
f G
as I
nte
nt
Wel
ls
Historical
Low Demand
Base Demand
High Demand
Historical Forecast

BC Natural Gas Industry Competitiveness Study
Forecast of Cumulative Gas Wells
Forecast of Gas Intent Wells Required to Meet Demand
0
5000
10000
15000
20000
25000
30000
35000
1960 1970 1980 1990 2000 2010 2020 2030 2040
Year
No
of
Ga
s I
nte
nt
We
lls
High Demand
Base Demand
Low Demand
NEB (1994 to 2010)Historical Forecast
Possible Drilling Location (Excludes PAS) 33,000

BC Natural Gas Industry Competitiveness Study
HISTORY Done with co-operation and encouragement of Industry and CAPP. Terms of Reference distributed in Fall 1996. Industry was invited
to contribute comments and data.
We actively sought data, we kept industry and CAPP informed. Data, methodology and progress presented to industry at BC
Petroleum Executive Forums June 11, 1997 and December 11, 1997.
Industry and CAPP input and consultation from 1996 to 1997. We used every piece of data provided by industry and CAPP.
Preliminary results presented to CAPP, Westcoast, BC Gas, BCUC, MoFCR Treasury Board Staff and other stakeholders in September/October 1997.
Work stopped in 1998 for about 10 months while new royalties
were finalized under OGI 1.

BC Natural Gas Industry Competitiveness Study
We are here to:
Explain the data and methodology. Show the results. Receive comments and any further data. Identify problems with BC cost
competitiveness and suggest and receive suggestions on solutions to continue the Oil and Gas Initiative process.
BC Natural Gas Industry Competitiveness Study
Study Objective:
compare the cost competitiveness of natural gas exploration, production, gathering and processing in British Columbia to the costs of the same processes in Alberta.
Costs and revenues are to the plant exit.
BC Natural Gas Industry Competitiveness Study
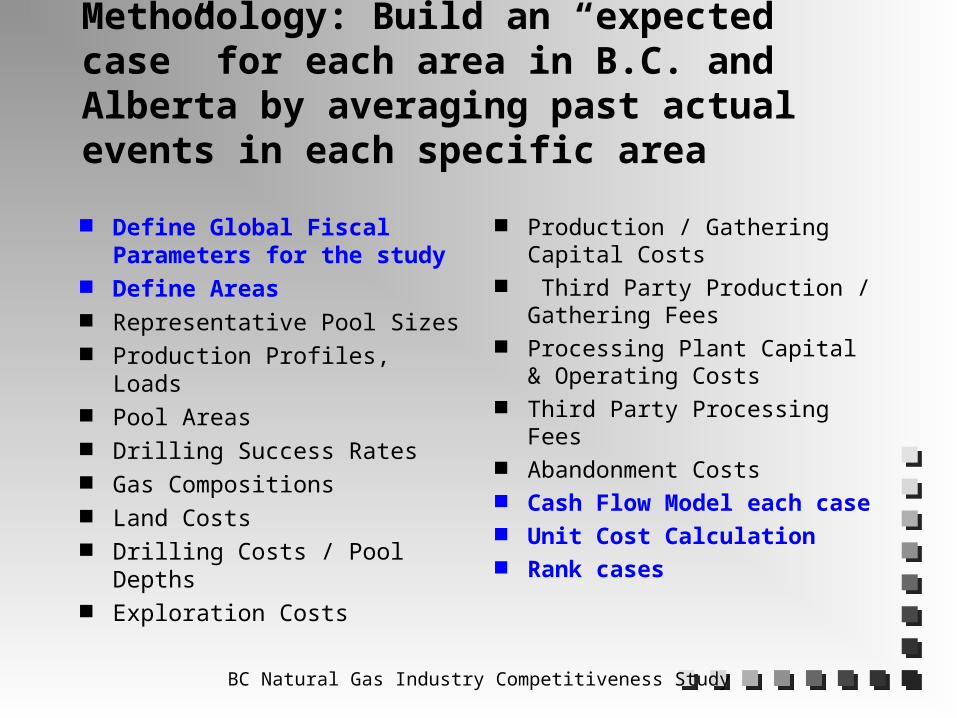
Methodology: Build an “expected case” for each area in B.C. and Alberta by averaging past actual events in each specific area
Define Global Fiscal Parameters for the study
Define Areas Representative Pool Sizes Production Profiles, Loads Pool Areas Drilling Success Rates Gas Compositions Land Costs Drilling Costs / Pool Depths Exploration Costs
Production / Gathering Capital Costs
Third Party Production / Gathering Fees
Processing Plant Capital & Operating Costs
Third Party Processing Fees Abandonment Costs Cash Flow Model each
case Unit Cost Calculation Rank cases
BC Natural Gas Industry Competitiveness Study
FISCAL PARAMETERSCERI 1996 Plant Gate Price Forecast similar to MEM forecast distinct differential between Alberta and BC plant prices consistent but conservative compared to other
forecasts developed by a respected outside agency necessary to make our cash flow model run
Discount Rate: Final Results discounted at 7% reflects long term cost of money - study is primarily
concerned with costs rather than profit.

BC Natural Gas Industry Competitiveness Study
CERI 1996 and NEB 1999 Plantgate Forecasts
$-
$0.50
$1.00
$1.50
$2.00
$2.50
$3.00
1997 1998 1999 2000 2001 2002 2003 2004 2005 2006 2007 2008 2009 2010 2011 2012
C$
/ m
cf
NEB Alberta - Case 1NEB Alberta - Case 2BC 1996 CERIAB 1996 CERI
Sources: CERI North American Natural Gas Outlook: Basin on Basin CompetitionNEB Canadian Energy Supply and Demand to 2025

BC Natural Gas Industry Competitiveness Study
BC Natural Gas Industry Competitiveness Study

BC Natural Gas Industry Competitiveness Study
Jedney BC Area 11 Actual Pool Sizes Discovered from 1988 to 1995
0
5
10
15
20
25
30
35
40
BC
F
Lognormal Mean Pool = 23 BCF

BC Natural Gas Industry Competitiveness Study
Alberta Eastern Plains Area 20 Actual Pool Sizes Discovered from 1988 to 1995
0
2
4
6
8
10
12
14
16
BC
F
Lognormal Mean Pool = 2 BCF

BC Natural Gas Industry Competitiveness Study
B.C and Alberta Pool Sizes and Pool Initial Production Rates
71
42
34
2926
23
18 17
12 11
31
26
21
10 10 9 95 4 4 3 3 2 2 0.75
48
20
3
1013
7
12
75 5
86
32
4 4 42 1 2
4
1 1 1
19
0
10
20
30
40
50
60
70
80
BC
3 P
ine
Riv
er
BC
14 F
t N
elso
n
BC
16 H
elm
et
AB
90
BC
6 S
ikan
ni
BC
5 B
orde
r
AB
63
BC
11 J
edne
y
AB
72
BC
8 P
arkl
and
BC
9 F
SJ
BC
10 B
eatt
on
BC
4 D
eep
Bas
in
AB
40
AB
80
AB
62
AB
71
AB
33
AB
10
AB
61
AB
32
AB
34
AB
20
AB
31
AB
50
BC
F
0
5
10
15
20
25
30
35
40
45
50
Po
ol
Init
ial
Rat
e m
mcf
/d
BC Pool Size BCF
Alberta Pool Size BCF
Pool Initial Rate mmcf/d
BC Natural Gas Industry Competitiveness Study
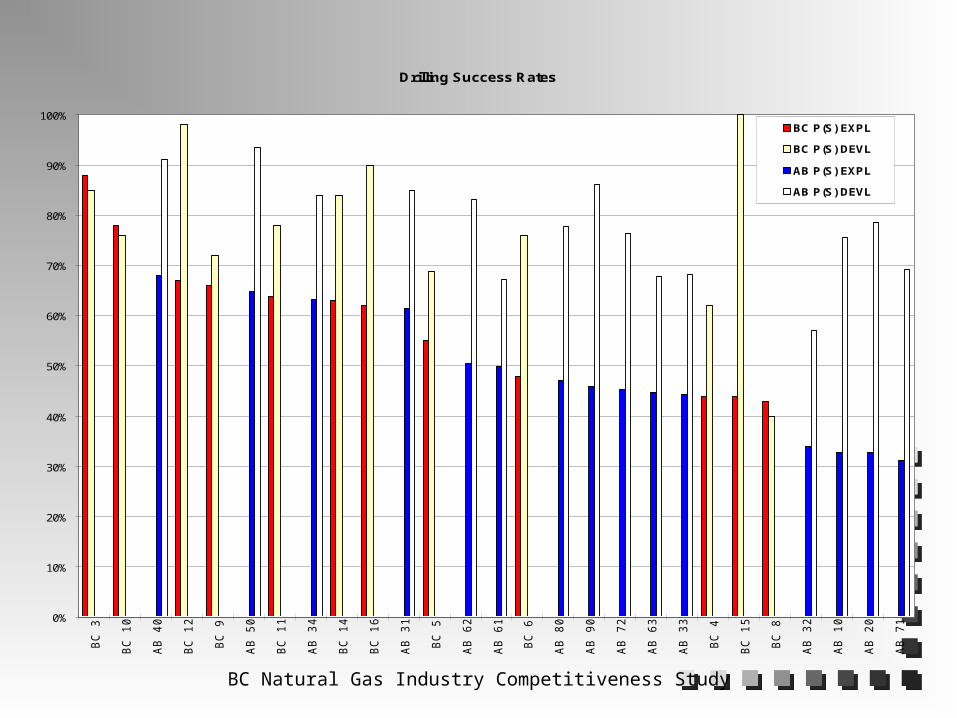
Drilling Success Rates
0%
10%
20%
30%
40%
50%
60%
70%
80%
90%
100%
BC
3
BC
10
AB
40
BC
12
BC
9
AB
50
BC
11
AB
34
BC
14
BC
16
AB
31
BC
5
AB
62
AB
61
BC
6
AB
80
AB
90
AB
72
AB
63
AB
33
BC
4
BC
15
BC
8
AB
32
AB
10
AB
20
AB
71
BC P(S) EXPL
BC P(S) DEVL
AB P(S) EXPL
AB P(S) DEVL

BC Natural Gas Industry Competitiveness Study
British Columbia and Alberta 1996 Licence Cost
$242
$275
$328
$258
$313
$335
$235
$140
$215
$107
$169
$203
$99
$196
$85
$166$167
$106
$162
$116$118$110
$64
$86$76
$97
$58
$0
$100,000
$200,000
$300,000
$400,000
$500,000
$600,000B
C 3
AB
90
BC
11
BC
5
BC
10
BC
9
BC
8
BC
16
AB
72
BC
14
AB
34
BC
4
BC
6
AB
80
AB
50
BC
12
AB
62
AB
61
AB
20
AB
40
AB
71
AB
33
BC
15
AB
63
AB
10
AB
32
AB
31
Tota
l B
on
us
per
Lic
ense
$0
$50
$100
$150
$200
$250
$300
$350
Do
llar
s p
er H
ecta
re
BC Bonus
AB Bonus
Avg/Ha

BC Natural Gas Industry Competitiveness Study
POOL AREA CALCULATION
Calculated using: database correlations of wells linked to
discovered pools database correlations of historic values
of reserves produced per well PEEP production profiles which resulted
in reasonable pool declines

BC Natural Gas Industry Competitiveness Study
PRODUCTION PROFILES AND WELL LOADS Aggregated a production profile from all
wells coming onstream in 1994 in each area using Merak Forecast.
Maximum rate used as initial rate. Initial rate combined with pool reserves
used to calculate decline.
Well load factors calculated from well onstream time. (Actual production hours divided by possible production hours)
BC Natural Gas Industry Competitiveness Study
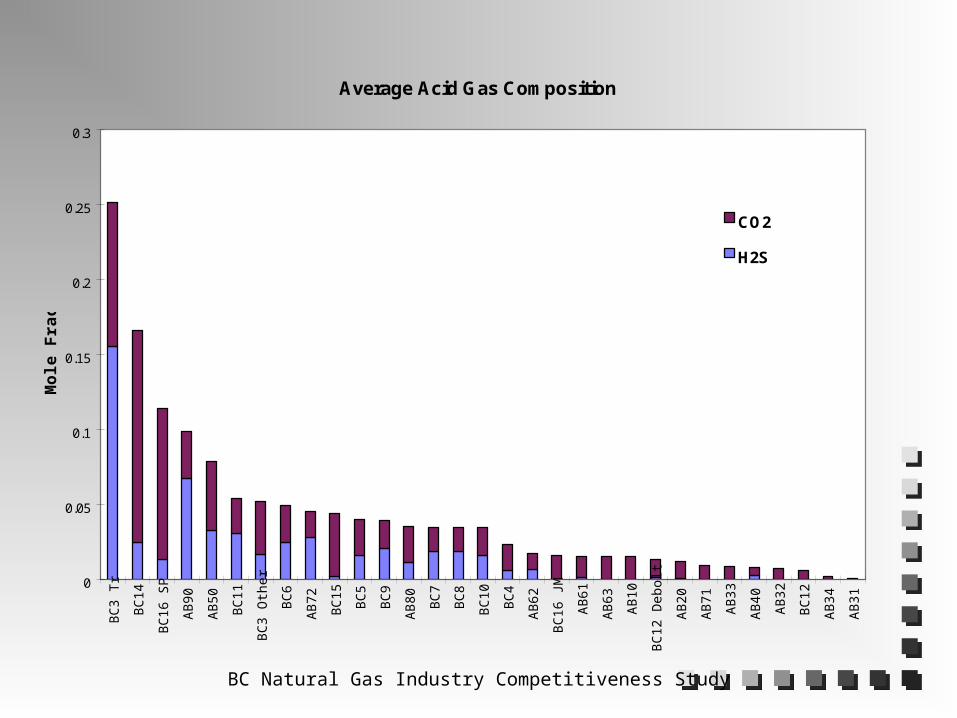
Average Acid Gas Composition
0
0.05
0.1
0.15
0.2
0.25
0.3
BC
3 T
r
BC
14
BC
16
SP
AB
90
AB
50
BC
11
BC
3 O
ther
BC
6
AB
72
BC
15
BC
5
BC
9
AB
80
BC
7
BC
8
BC
10
BC
4
AB
62
BC
16
JM
AB
61
AB
63
AB
10
BC
12
Deb
olt
AB
20
AB
71
AB
33
AB
40
AB
32
BC
12
AB
34
AB
31
Mole
Fra
cti
on
CO2
H2S

BC Natural Gas Industry Competitiveness Study
Comparison of C3+ Liquids in the Raw Gas Stream and Liquids Recovered Allocated to Producers up to 1995
0.00
10.00
20.00
30.00
40.00
50.00
60.00
AB
63
AB
80
AB
50
AB
72
BC
11
BC
9
BC
10
AB
62
AB
90
BC
12
AB
10
AB
71
BC
4
BC
5
BC
6
AB
20
BC
7
BC
8
AB
61
BC
15
AB
32
BC
16
JM
BC
14
AB
33
AB
31
BC
16
SP
AB
34
AB
40
BC
3
Area
C3
+ B
bl./
Mm
sc
f
C3+ Recoverd Allocated to ProducersBbl./Mmscf
C3+ Unrecovered or Not Allocated toProducers Bbl./Mmscf
BC Natural Gas Industry Competitiveness Study
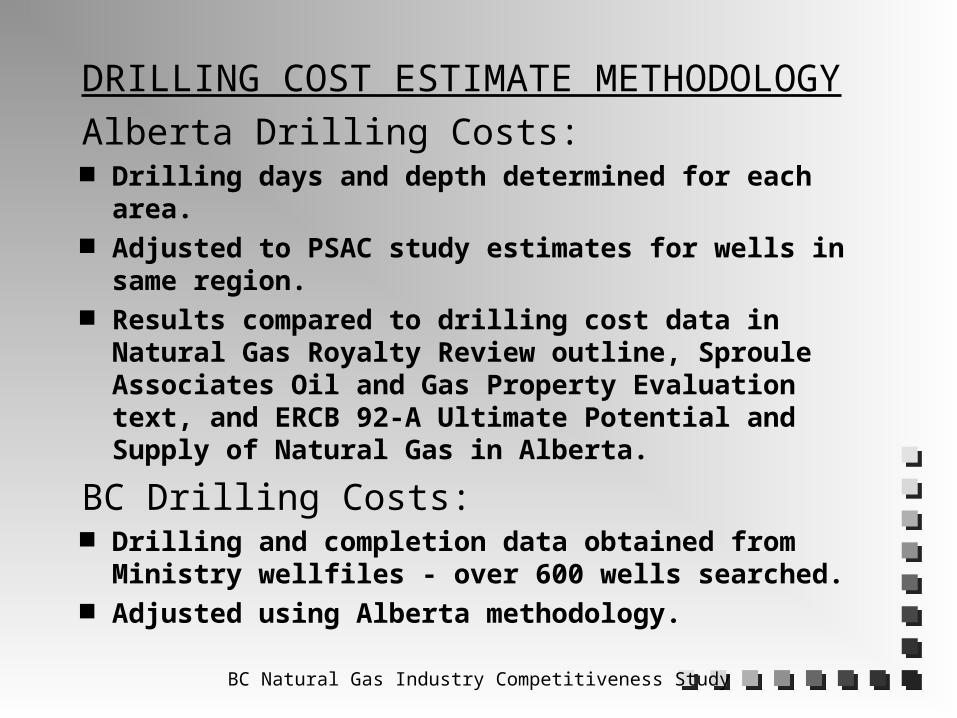
DRILLING COST ESTIMATE METHODOLOGY
Alberta Drilling Costs: Drilling days and depth determined for each area. Adjusted to PSAC study estimates for wells in same
region. Results compared to drilling cost data in Natural
Gas Royalty Review outline, Sproule Associates Oil and Gas Property Evaluation text, and ERCB 92-A Ultimate Potential and Supply of Natural Gas in Alberta.
BC Drilling Costs: Drilling and completion data obtained from Ministry
wellfiles - over 600 wells searched. Adjusted using Alberta methodology.

BC Natural Gas Industry Competitiveness Study
Alberta Area 90 (Foothills) Wells - 1988 to 1995
0
1000
2000
3000
4000
5000
6000
0 50 100 150 200 250 300
Days (RR-Spud Date)
Dep
th (M
eter
s)
Actual Depth
Calculated Depth
Average Well

BC Natural Gas Industry Competitiveness Study
Depth, Days Drilling Time and Drilling Rate
0
20
40
60
80
100
120
BC13
BC3
BC 1
AB 9
0BC
6BC
7BC
14BC
15 H
ZBC
15BC
4BC
5BC
16 H
ZBC
8AB
50
BC9
HZ
BC11
HZ
BC11
BC16
AB 6
3BC
10AB
72
BC9
AB 6
1BC
12AB
40
AB 8
0AB
62
AB 7
1AB
33
AB 3
2AB
34
AB 1
0AB
20
AB 3
1
Area
Depth*100 m/
Days
0
50
100
150
200
250
(M
/ D
ay)
Depth (100 m) Days Metres/Day

BC Natural Gas Industry Competitiveness Study
GATHERING AND PRODUCTION FACILITIES COSTSBC Gathering and Production Facilities Capital and operating costs of pipeline, dehydrators, and field
treatment plants based on 1996 Gas Production Facilities Study done for MEM for Producer Cost of Service (PCOS)
determination.Alberta Gathering and Production Facilities
Capital costs from several sources: Recent survey of vendors installed equipment costs. Studies such as Natural Gas Royalty Review Outline, Sproule
Associates Oil and Gas Property Evaluation course, ERCB 92-A Ultimate Potential and Supply of Natural Gas in Alberta and CAPP Well Operating Cost Study.
Discussions with producers, contractors and government agencies.
Operating costs estimated at 10% to 15% of capital costs.

BC Natural Gas Industry Competitiveness Study
Installed Dehydration Cost
0
50
100
150
200
250
0 10 20 30 40 50 60 70 80 90 100
Size (MMscf/d)
Un
it In
stal
led
Co
st (
$K/M
Msc
f/d
)
Alberta Sw eet Alberta Sour BC Sw eet BC Sour
BC Natural Gas Industry Competitiveness Study
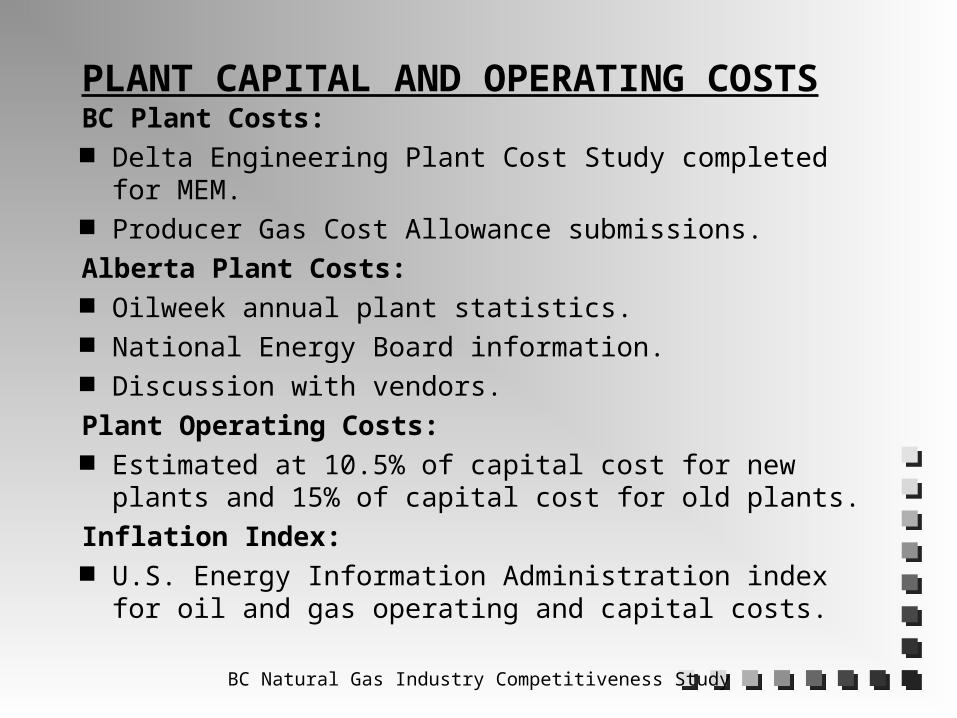
PLANT CAPITAL AND OPERATING COSTSBC Plant Costs: Delta Engineering Plant Cost Study completed for MEM. Producer Gas Cost Allowance submissions.
Alberta Plant Costs: Oilweek annual plant statistics. National Energy Board information. Discussion with vendors.
Plant Operating Costs: Estimated at 10.5% of capital cost for new plants and
15% of capital cost for old plants.
Inflation Index: U.S. Energy Information Administration index for oil and
gas operating and capital costs.
BC Natural Gas Industry Competitiveness Study
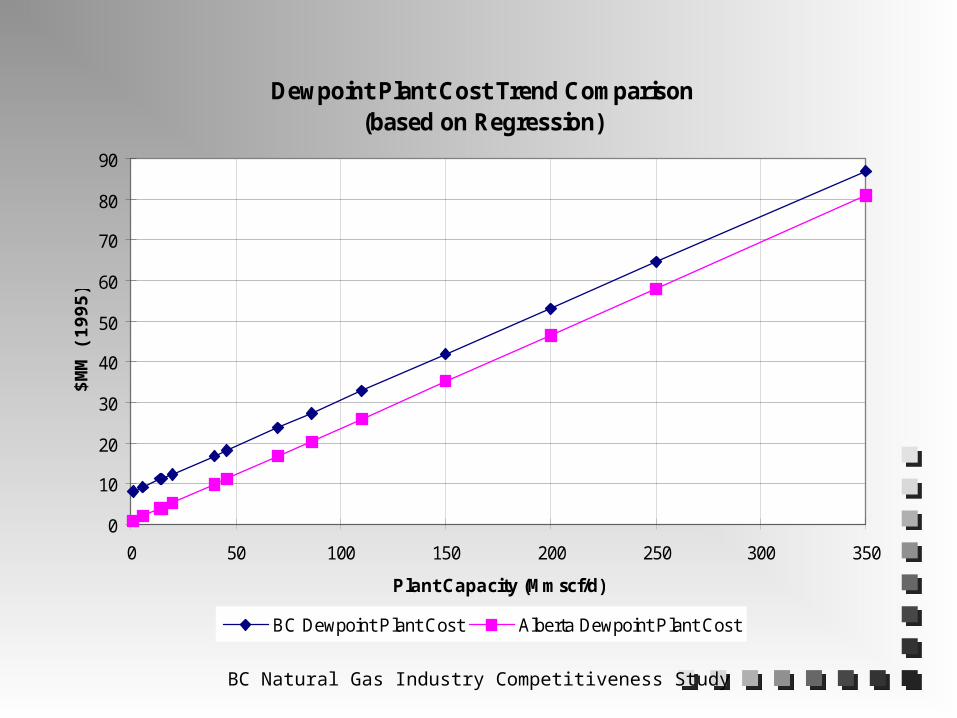
Dewpoint Plant Cost Trend Comparison(based on Regression)
0
10
20
30
40
50
60
70
80
90
0 50 100 150 200 250 300 350
Plant Capacity (Mmscf/d)
$MM
(19
95)
BC Dewpoint Plant Cost Alberta Dewpoint Plant Cost

BC Natural Gas Industry Competitiveness Study
Sour Gas Plant Cost Comparison
0
50
100
150
200
250
300
350
0 500 1000 1500 2000 2500 3000
Tonnes of Sulphur per Day
$ M
illio
ns
Inst
alle
d
($19
95)
Actual BC Cost BC Cost Based on Regression
Alberta Cost Based on Regression
BC Natural Gas Industry Competitiveness Study
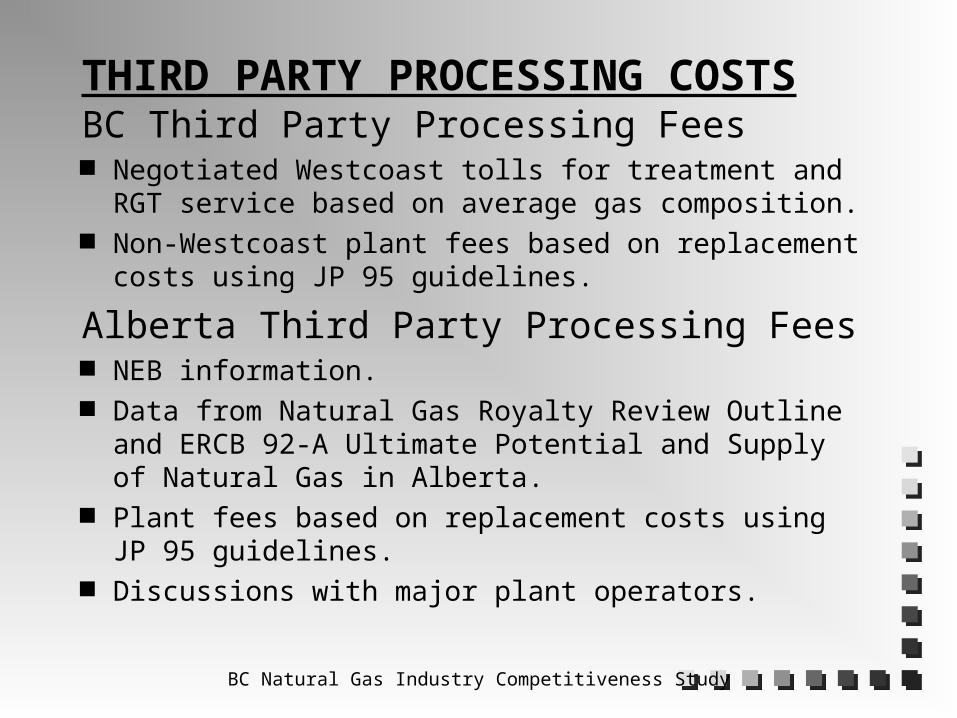
THIRD PARTY PROCESSING COSTSBC Third Party Processing Fees Negotiated Westcoast tolls for treatment and RGT
service based on average gas composition. Non-Westcoast plant fees based on replacement costs
using JP 95 guidelines.
Alberta Third Party Processing Fees NEB information. Data from Natural Gas Royalty Review Outline and
ERCB 92-A Ultimate Potential and Supply of Natural Gas in Alberta.
Plant fees based on replacement costs using JP 95 guidelines.
Discussions with major plant operators.
BC Natural Gas Industry Competitiveness Study
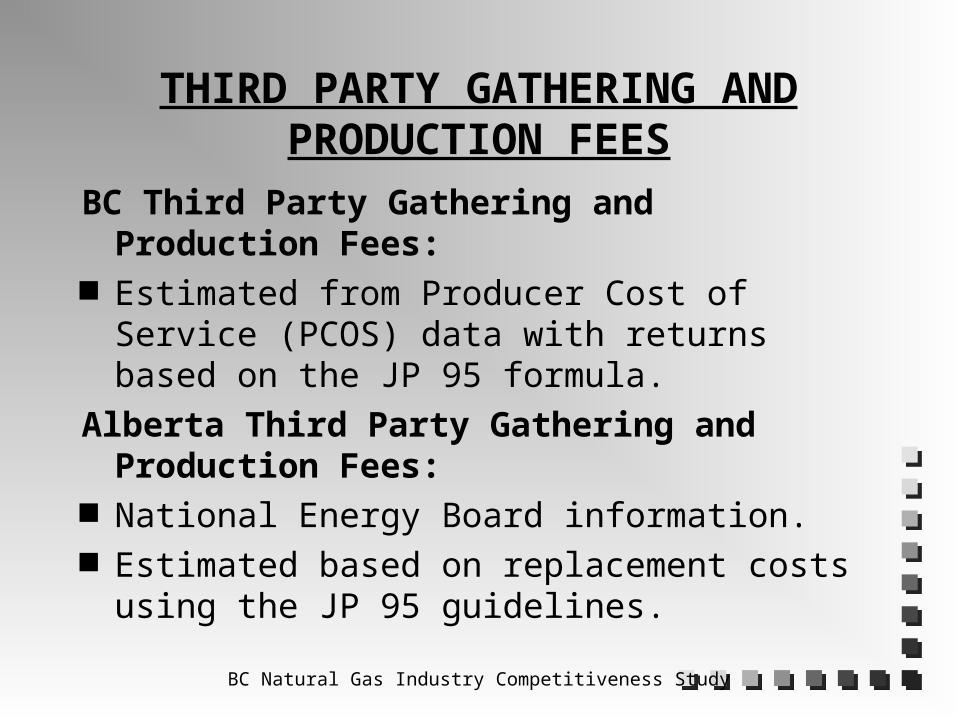
THIRD PARTY GATHERING AND PRODUCTION FEES
BC Third Party Gathering and Production Fees:
Estimated from Producer Cost of Service (PCOS) data with returns based on the JP 95 formula.
Alberta Third Party Gathering and Production Fees:
National Energy Board information. Estimated based on replacement costs using
the JP 95 guidelines.

BC Natural Gas Industry Competitiveness Study
Unit Cost Methodology
Streams of Costs, Revenue and Production were discounted at 7%.
Unit costs are calculated by dividing the discounted cost by the discounted production to get $ per mcf.
Assigns a value for cost and revenue to each unit of production in a project.
BC Natural Gas Industry Competitiveness Study
AREA COMPARISONS
Cash Flow Model each case Unit Cost Calculation Rank cases

BC Natural Gas Industry Competitiveness Study
BC 9 FORT ST. JOHNUNIT COSTS, BURDENS AND REVENUE
$ / MCF7% DISCOUNT
$0.06 $0.01
$1.86
$0.27
$0.12
$0.04
$0.07
$0.65
$0.14
$0.32
$0.07
$0.00
$0.20
$0.40
$0.60
$0.80
$1.00
$1.20
$1.40
$1.60
$1.80
$2.00
COSTS BURDENS REVENUE
Processing
Operating Gathering
Drilling
Exploration
$1.30
$0.40
$1.90
Land
Gas Royalty
Provincial Tax
Federal Tax
Fee + Levy
Gas Revenue
Liquids Revenue

BC Natural Gas Industry Competitiveness Study
AB90
BC8
BC6
BC16
AB72
BC4 ELM
AB62
BC3
AB50
BC5 AA
BC5 McM
AB34
BC14
AB10
BC10
AB32
AB61
BC9
AB20
BC11
AB33
AB80
AB71
AB40
AB63
AB31
$0.00 $0.10 $0.20 $0.30 $0.40 $0.50 $0.60 $0.70 $0.80 $0.90 $1.00
AB90
BC8
BC6
BC16
AB72
BC4 ELM
AB62
BC3
AB50
BC5 AA
BC5 McM
AB34
BC14
AB10
BC10
AB32
AB61
BC9
AB20
BC11
AB33
AB80
AB71
AB40
AB63
AB31
DRILLING COST - $ / MCF7% DISCOUNT
BC Exploration Cost
BC Drilling Cost
Alberta Exploration Cost
Alberta Drilling Cost
Mean = $0.45
Median = $0.38

BC Natural Gas Industry Competitiveness Study
BC3
AB90
BC14
BC11
AB72
BC9
BC10
AB61
AB40
BC4 ELM
AB10
AB50
BC8
AB34
AB71
AB62
AB80
BC6
AB33
AB32
AB20
BC5 AA
BC5 McM
AB31
AB63
BC16
$0.00 $0.20 $0.40 $0.60 $0.80 $1.00 $1.20 $1.40
BC3
AB90
BC14
BC11
AB72
BC9
BC10
AB61
AB40
BC4 ELM
AB10
AB50
BC8
AB34
AB71
AB62
AB80
BC6
AB33
AB32
AB20
BC5 AA
BC5 McM
AB31
AB63
BC16
OPERATING, GATHERING AND PROCESSING COSTS$ / MCF
7% DISCOUNT
BC Processing
BC Gathering
Alberta Processing
Alberta Gathering
Alberta Well OC
Median = $0.79
Mean = $0.81
BC Natural Gas Industry Competitiveness Study
AB63
AB80
AB20
AB32
AB10
BC5 AA
AB61
AB62
AB40
AB33
BC5 McM
AB72
AB34
BC4 ELM
BC10
AB50
AB31
BC9
AB71
BC11
BC16
BC8
AB90
BC14
BC6
BC3
$0.00 $0.10 $0.20 $0.30 $0.40 $0.50 $0.60 $0.70 $0.80 $0.90 $1.00
AB63
AB80
AB20
AB32
AB10
BC5 AA
AB61
AB62
AB40
AB33
BC5 McM
AB72
AB34
BC4 ELM
BC10
AB50
AB31
BC9
AB71
BC11
BC16
BC8
AB90
BC14
BC6
BC3
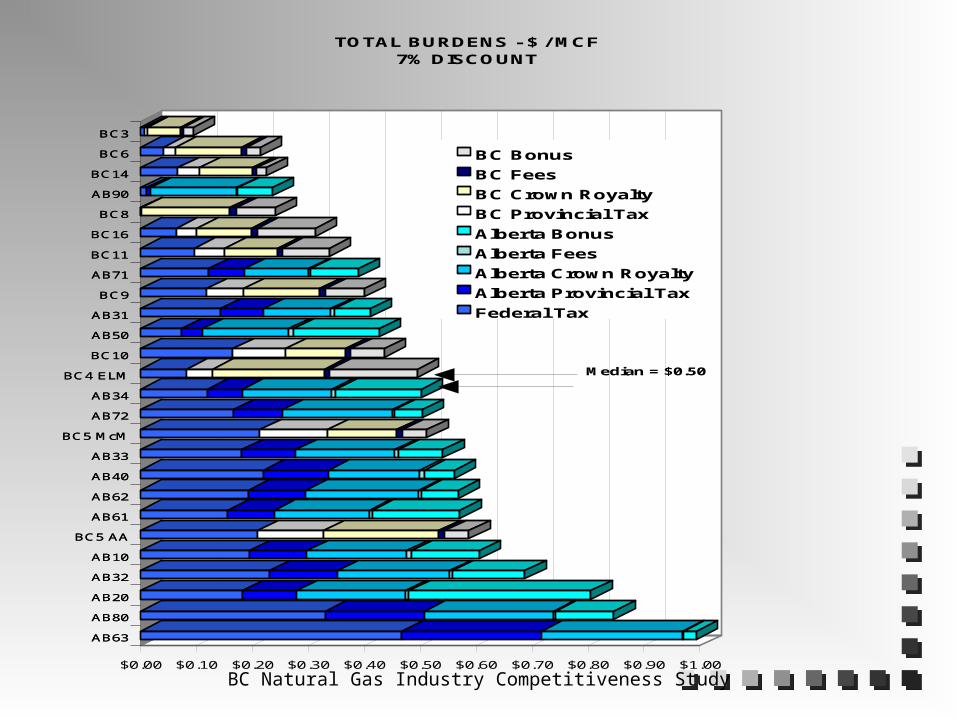
TOTAL BURDENS - $ / MCF7% DISCOUNT
BC Bonus
BC Fees
BC Crown Royalty
BC Provincial Tax
Alberta Bonus
Alberta Fees
Alberta Crown Royalty
Alberta Provincial Tax
Federal Tax
Median = $0.50
Mean = $0.48
BC Natural Gas Industry Competitiveness Study
AB63
AB80
BC5 AA
AB32
AB62
AB20
AB10
AB72
AB40
AB33
AB61
BC4 ELM
BC5 McM
AB34
BC9
BC10
AB31
AB50
AB71
BC8
AB90
BC11
BC6
BC16
BC14
BC3
$0.00 $0.10 $0.20 $0.30 $0.40 $0.50 $0.60
AB63
AB80
BC5 AA
AB32
AB62
AB20
AB10
AB72
AB40
AB33
AB61
BC4 ELM
BC5 McM
AB34
BC9
BC10
AB31
AB50
AB71
BC8
AB90
BC11
BC6
BC16
BC14
BC3
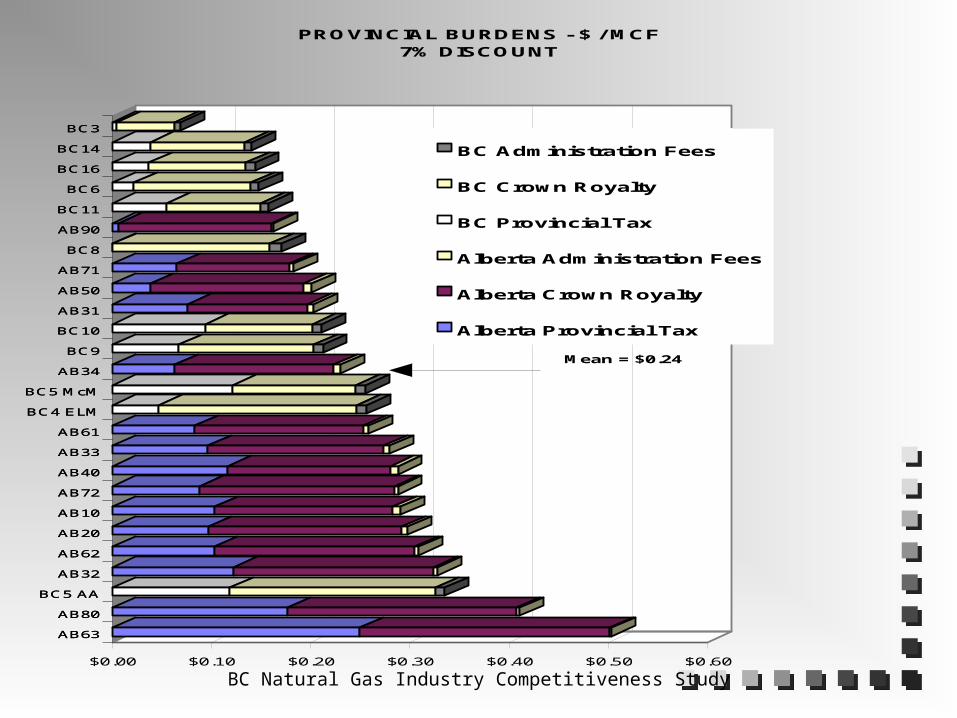
PROVINCIAL BURDENS - $ / MCF7% DISCOUNT
BC Administration Fees
BC Crown Royalty
BC Provincial Tax
Alberta Administration Fees
Alberta Crown Royalty
Alberta Provincial Tax
Mean = $0.24
Median = $0.24

BC Natural Gas Industry Competitiveness Study
AB63
AB80
BC5 AA
AB62
AB32
BC4 ELM
AB72
AB20
AB10
AB33
AB61
AB40
AB34
BC8
AB90
AB50
BC9
BC5 McM
AB31
BC6
AB71
BC10
BC16
BC11
BC14
BC3
$0.25
$0.23
$0.21
$0.20
$0.20
$0.20
$0.20
$0.20
$0.18
$0.18
$0.17
$0.16
$0.16
$0.16
$0.15
$0.15
$0.14
$0.12
$0.12
$0.12
$0.11
$0.11
$0.10
$0.10
$0.10
$0.06
$- $0.05 $0.10 $0.15 $0.20 $0.25 $0.30
AB63
AB80
BC5 AA
AB62
AB32
BC4 ELM
AB72
AB20
AB10
AB33
AB61
AB40
AB34
BC8
AB90
AB50
BC9
BC5 McM
AB31
BC6
AB71
BC10
BC16
BC11
BC14
BC3
CROWN ROYALTY - $ / MCF7% DISCOUNT
BC Crown Royalty
Alberta Crown Royalty
Mean = $0.16
Median = $0.16

BC Natural Gas Industry Competitiveness Study
BC8
BC4 ELM
BC5 AA
BC5 McM
BC9
BC16
BC10
AB50
AB10
BC6
AB40
BC11
BC14
AB34
BC3
AB20
AB31
AB61
AB33
AB32
AB71
AB62
AB72
AB80
AB63
AB90
$0.012
$0.010
$0.010
$0.010
$0.010
$0.010
$0.010
$0.008
$0.0082
$0.008
$0.008
$0.008
$0.007
$0.007
$0.007
$0.006
$0.006
$0.006
$0.005
$0.005
$0.004
$0.004
$0.004
$0.003
$0.002
$0.002
$0
.00
0
$0
.00
2
$0
.00
4
$0
.00
6
$0
.00
8
$0
.01
0
$0
.01
2BC8
BC4 ELM
BC5 AA
BC5 McM
BC9
BC16
BC10
AB50
AB10
BC6
AB40
BC11
BC14
AB34
BC3
AB20
AB31
AB61
AB33
AB32
AB71
AB62
AB72
AB80
AB63
AB90
ADMINISTRATIVE FEES AND LEVIES - $ / MCF7% DISCOUNT
BC Fee+Levy
Alberta Fee
Mean and Median = $0.007
BC Natural Gas Industry Competitiveness Study
AB20
BC4 ELM
AB61
AB50
AB34
AB32
AB10
BC16
AB80
AB71
BC11
AB33
BC8
BC9
AB62
AB31
AB90
BC10
AB40
AB72
BC5 AA
BC5 McM
BC6
AB63
BC14
BC3
$0.32
$0.16
$0.16
$0.15
$0.15
$0.13
$0.12
$0.10
$0.10
$0.09
$0.08
$0.08
$0.07
$0.07
$0.07
$0.06
$0.06
$0.06
$0.05
$0.05
$0.04
$0.04
$0.03
$0.02
$0.02
$0.02
$0.00 $0.05 $0.10 $0.15 $0.20 $0.25 $0.30 $0.35
AB20
BC4 ELM
AB61
AB50
AB34
AB32
AB10
BC16
AB80
AB71
BC11
AB33
BC8
BC9
AB62
AB31
AB90
BC10
AB40
AB72
BC5 AA
BC5 McM
BC6
AB63
BC14
BC3
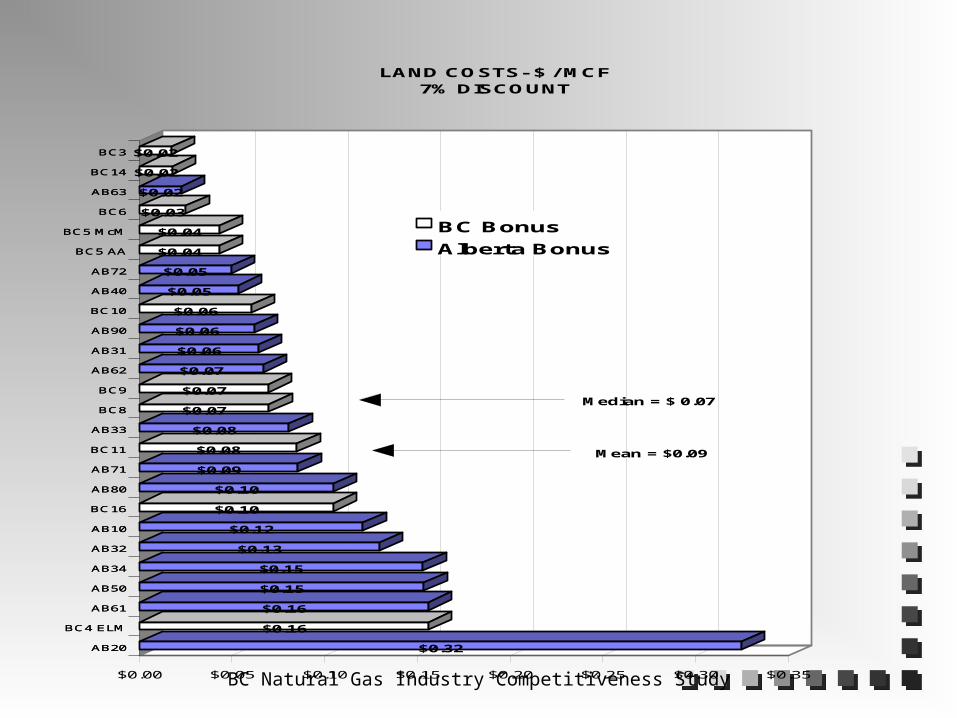
LAND COSTS- $ / MCF7% DISCOUNT
BC Bonus
Alberta Bonus
Median = $ 0.07
Mean = $0.09
BC Natural Gas Industry Competitiveness Study
BC16
BC3
AB34
BC14
BC11
AB50
AB31
AB33
BC9
BC8
BC6
BC4 ELM
BC5 AA
BC5 McM
AB40
AB20
AB61
BC10
AB32
AB10
AB71
AB62
AB90
AB72
AB80
AB63
$0.00 $0.50 $1.00 $1.50 $2.00 $2.50 $3.00
BC16
BC3
AB34
BC14
BC11
AB50
AB31
AB33
BC9
BC8
BC6
BC4 ELM
BC5 AA
BC5 McM
AB40
AB20
AB61
BC10
AB32
AB10
AB71
AB62
AB90
AB72
AB80
AB63
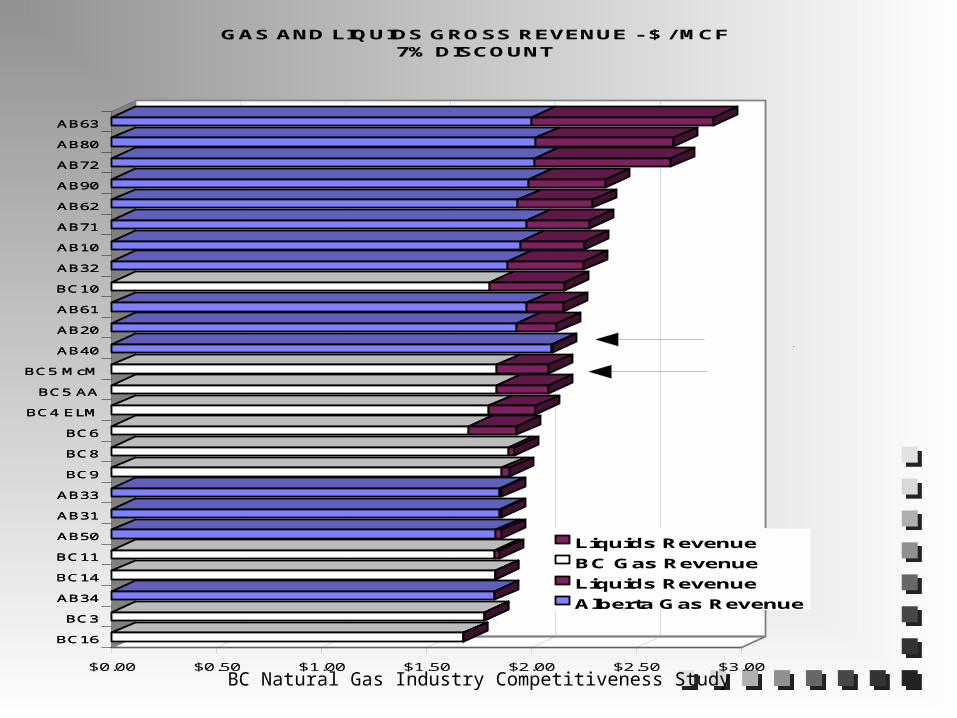
GAS AND LIQUIDS GROSS REVENUE - $ / MCF7% DISCOUNT
Liquids Revenue
BC Gas Revenue
Liquids Revenue
Alberta Gas Revenue
Mean = $2.10
Median = $2.08

BC Natural Gas Industry Competitiveness Study
BC3
BC8
AB90
BC16
BC4 ELM
BC6
AB34
BC14
AB50
BC9
BC11
AB61
AB20
AB72
AB33
BC10
AB10
BC5 AA
AB40
AB62
BC5 McM
AB32
AB31
AB80
AB71
AB63
-$0.20 $0.00 $0.20 $0.40 $0.60 $0.80 $1.00 $1.20
BC3
BC8
AB90
BC16
BC4 ELM
BC6
AB34
BC14
AB50
BC9
BC11
AB61
AB20
AB72
AB33
BC10
AB10
BC5 AA
AB40
AB62
BC5 McM
AB32
AB31
AB80
AB71
AB63
NET REVENUE AT PLANT EXITCosts and Burdens Subtracted From Gas Revenue
$ / MCF7% DISCOUNT
BC Liquid Revenue
BC Gas Revenue -(Costs + Burdens)
Alberta Liquid Revenue
Alberta Gas Revenue -(Costs + Burdens)
Costs do not include downstream costs such as pipeline transportation, storage, marketing and rate of return.

BC Natural Gas Industry Competitiveness Study
Liquid Recovery Change
0.00
5.00
10.00
15.00
20.00
25.00
30.00
BC
11 B
efo
re
BC
11 N
ew
Pla
nts
BC
9 B
efo
re
BC
9 (
So
lex,
Wst
od
)
BC
10
Be
fore
BC
10
(S
ole
x)
BC
5 B
efo
re
BC
5 (
Alb
ert
aP
lt, S
ole
x)
C3
+ b
bl/
Mm
sc
f o
f R
aw
Ga
s
C3+ Recoverd Bbl./Mmscf
C3+ Unrecovered Bbl./Mmscf

BC Natural Gas Industry Competitiveness Study
ECONOMIC INDICATORS
$10,585
$2,210$1,965
$1,739$1,656
$1,192$866 $787 $699
$379 $326 $310 $295$62
-$1,819
$7,799
$7,080
$3,167$2,893$2,771
$1,879
$1,382$1,237
$603 $458
-$114
-$2,000
$0
$2,000
$4,000
$6,000
$8,000
$10,000
$12,000A
B6
3
BC
5 M
cM
BC
5 A
A
BC
14
BC
10
BC
11
AB
80
AB
72
BC
9
AB
40
AB
62
BC
6
BC
4 E
LM
AB
33
AB
71
AB
32
AB
10
BC
16
BC
3
AB
61
AB
31
AB
20
AB
34
AB
50
BC
8
AB
90
NP
V @
10%
(M
$)
0%
10%
20%
30%
40%
50%
60%
70%
80%
90%
RO
R
Alberta NPV @ 10%
BC NPV @ 10%
ROR
BC Mean NPV @ 10% = $2,650
BC Median NPV @ 10% = $1,879
Alberta Mean NPV @ 10% = $1,417
Alberta Median NPV @ 10% = $787
Mean = $1,939 Median = $1,215
Distribution Mean NPV @ 10% = $1,939
Distribution Median NPV @ 10% = $1,215
BC Natural Gas Industry Competitiveness Study
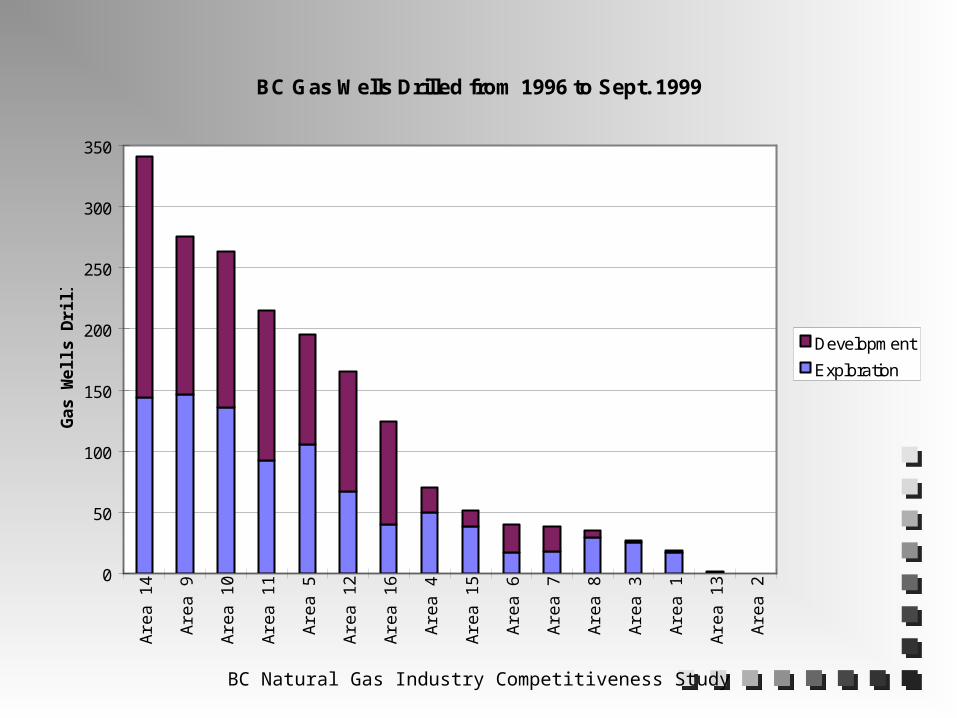
BC Gas Wells Drilled from 1996 to Sept. 1999
0
50
100
150
200
250
300
350A
rea
14
Are
a 9
Are
a 1
0
Are
a 1
1
Are
a 5
Are
a 1
2
Are
a 1
6
Are
a 4
Are
a 1
5
Are
a 6
Are
a 7
Are
a 8
Are
a 3
Are
a 1
Are
a 1
3
Are
a 2
Ga
s W
ells
Dri
lled
Development
Exploration

BC Natural Gas Industry Competitiveness Study
POSITIVES
Larger pool sizes, higher initial production rates, better drilling success rates.
Project Net Present Value and Rate of Return are competitive in many areas.
Direct burdens are very competitive. Treaty 8 MOUs ==> Costs predictable. EA Review thresholds have been raised. WCB issues are not significant problems.
BC Natural Gas Industry Competitiveness Study
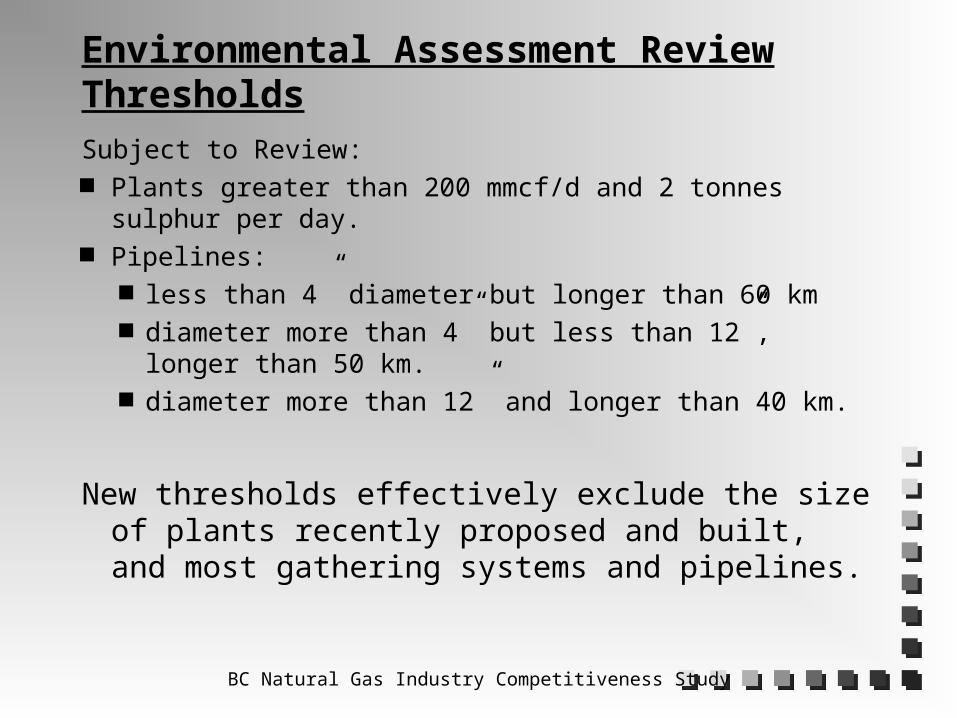
Environmental Assessment Review Thresholds
Subject to Review: Plants greater than 200 mmcf/d and 2 tonnes sulphur per
day. Pipelines:
less than 4” diameter but longer than 60 km diameter more than 4” but less than 12”, longer than
50 km. diameter more than 12” and longer than 40 km.
New thresholds effectively exclude the size of plants recently proposed and built, and most gathering systems and pipelines.
BC Natural Gas Industry Competitiveness Study
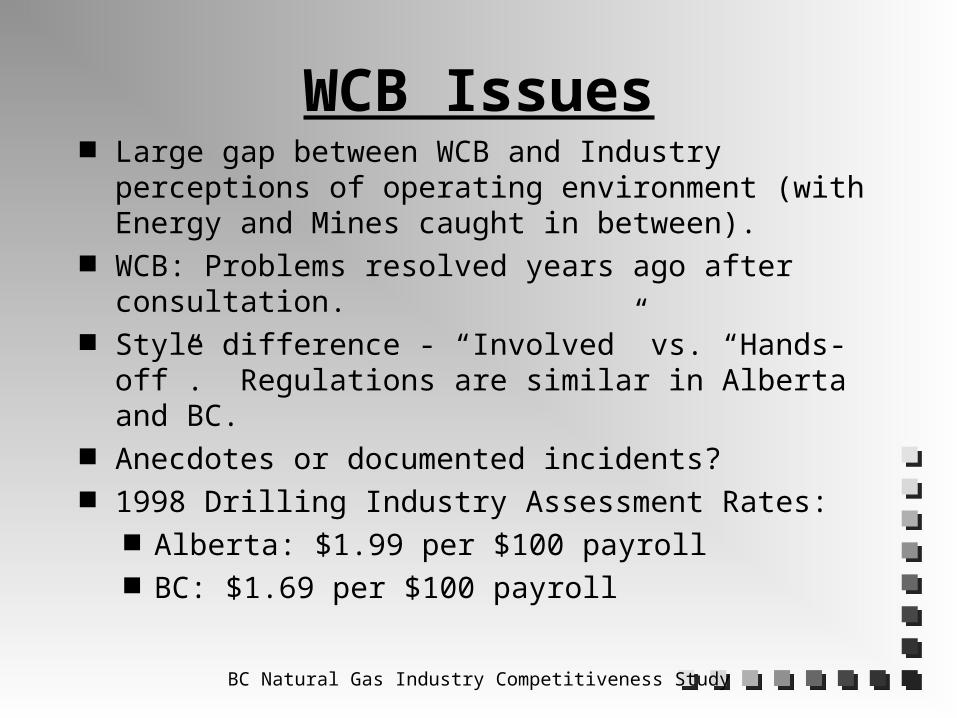
WCB Issues Large gap between WCB and Industry perceptions of
operating environment (with Energy and Mines caught in between).
WCB: Problems resolved years ago after consultation.
Style difference - “Involved” vs. “Hands-off”. Regulations are similar in Alberta and BC.
Anecdotes or documented incidents? 1998 Drilling Industry Assessment Rates:
Alberta: $1.99 per $100 payroll BC: $1.69 per $100 payroll

BC Natural Gas Industry Competitiveness Study
Labour Cost Wages are about 3% higher in BC due
to the negotiated exclusion from the Employment Standards Act. (Drilling example)
Used CAODC data for a typical rig. Same hours worked but more hours
paid as overtime.
BC Natural Gas Industry Competitiveness Study
Costs Due to Resource Characteristics Completed well costs are higher in BC
because pools are deeper, and often in remote areas. Road improvements would help reduce these costs.
Facility and processing costs are higher due to higher CO2 and H2S contents.
Revenue is less due to lower liquids content.

BC Natural Gas Industry Competitiveness Study
Well Load Factors are lower in BC.
Ratio of hours a well operates to possible operating hours (“on-time”).
Significantly affects economics and profitability.
Comparison suggests plant capacity or suitability is less optimal than in Alberta.

BC Natural Gas Industry Competitiveness Study
BC
11
BC
10
BC
4
BC
6
BC
9
BC
15
BC
5
AB
72
AB
61
AB
20
AB
71
AB
80
BC
12
BC
14
BC
3
BC
8
AB
32
AB
34
AB
50
AB
62
AB
33
BC
16
AB
31
AB
40
AB
63
AB
90
AB
10
73%74%75%
80%80%
84%85% 85%86%87%
88%88%
89%89%90%90% 90%90%90%91%92%93% 93%94%94%94%95%
0%
10%
20%
30%
40%
50%
60%
70%
80%
90%
100%B
C1
1
BC
10
BC
4
BC
6
BC
9
BC
15
BC
5
AB
72
AB
61
AB
20
AB
71
AB
80
BC
12
BC
14
BC
3
BC
8
AB
32
AB
34
AB
50
AB
62
AB
33
BC
16
AB
31
AB
40
AB
63
AB
90
AB
10
Area Well Load Factors
BC Natural Gas Industry Competitiveness Study
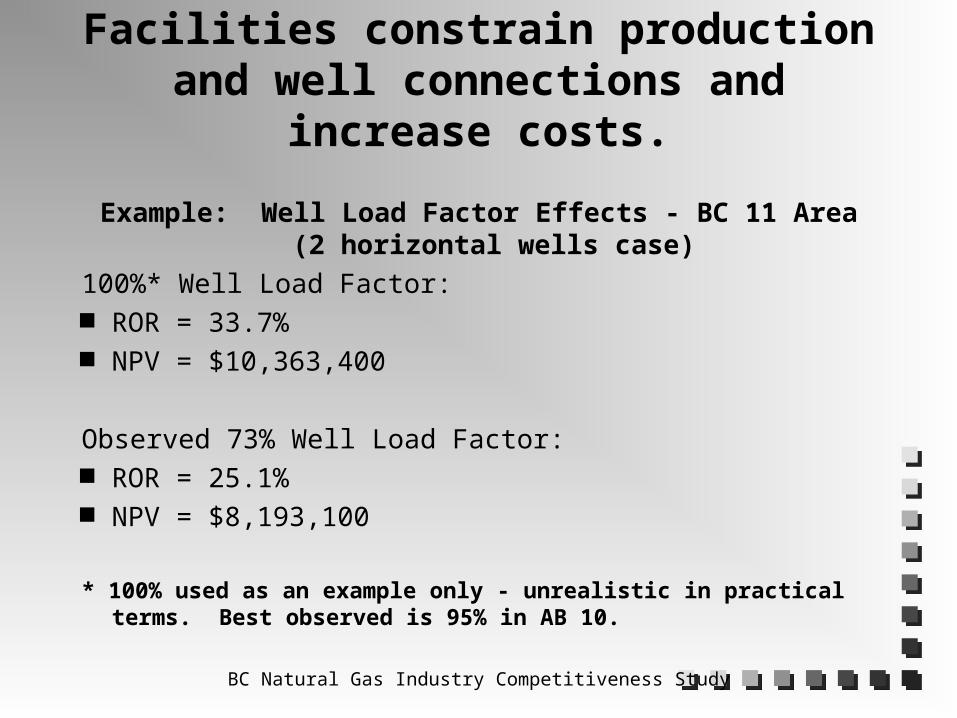
Facilities constrain production and well connections and increase costs.
Example: Well Load Factor Effects - BC 11 Area(2 horizontal wells case)
100%* Well Load Factor: ROR = 33.7% NPV = $10,363,400
Observed 73% Well Load Factor: ROR = 25.1% NPV = $8,193,100
* 100% used as an example only - unrealistic in practical terms. Best observed is 95% in AB 10.

BC Natural Gas Industry Competitiveness Study
Trends:
1. Increasing proportion of connections to smaller plants due to:
higher well loads more efficient liquids extraction flexible tolling
2. Increasing exploration target land sales in border areas and near smaller plants.
BC Natural Gas Industry Competitiveness Study
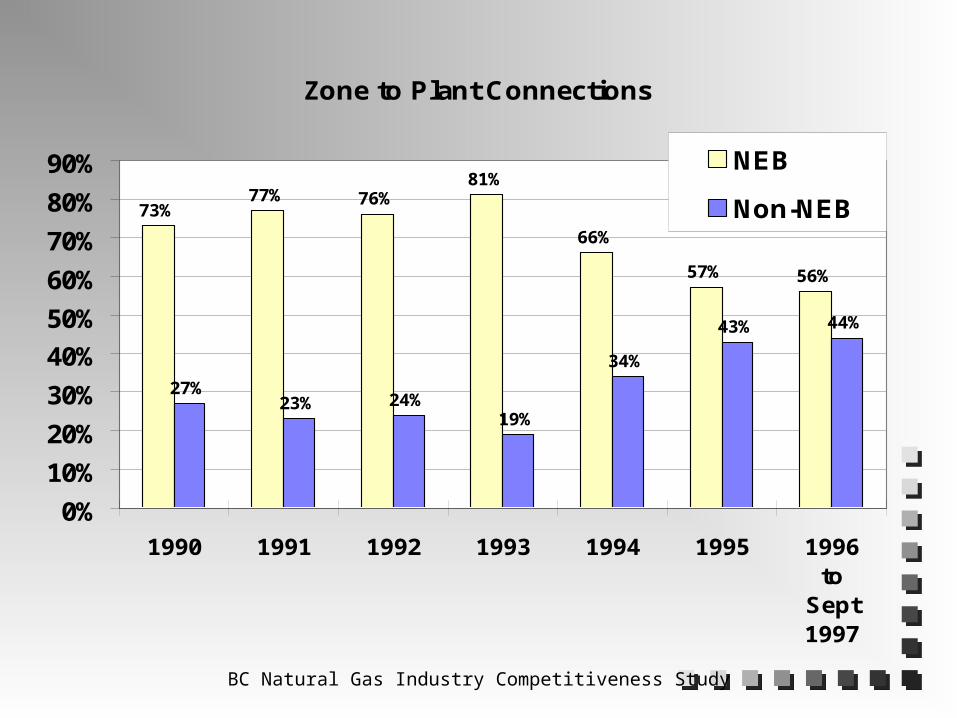
Zone to Plant Connections
73%77% 76%
81%
66%
57% 56%
27%23% 24%
19%
34%
43% 44%
0%
10%
20%
30%
40%
50%
60%
70%
80%
90%
1990 1991 1992 1993 1994 1995 1996to
Sept1997
NEB
Non-NEB

BC Natural Gas Industry Competitiveness Study
Taxes
The Compressor Fuel Tax adds two cents per mcf to costs to the plant exit.
Social Services Tax increases costs 2.4%. Property taxes appear to be slightly higher
in BC. Estimated at 2.4 cents per mcf in Alberta versus
2.8 cents per mcf in BC. Need better data - too much uncertainty.
BC Natural Gas Industry Competitiveness Study
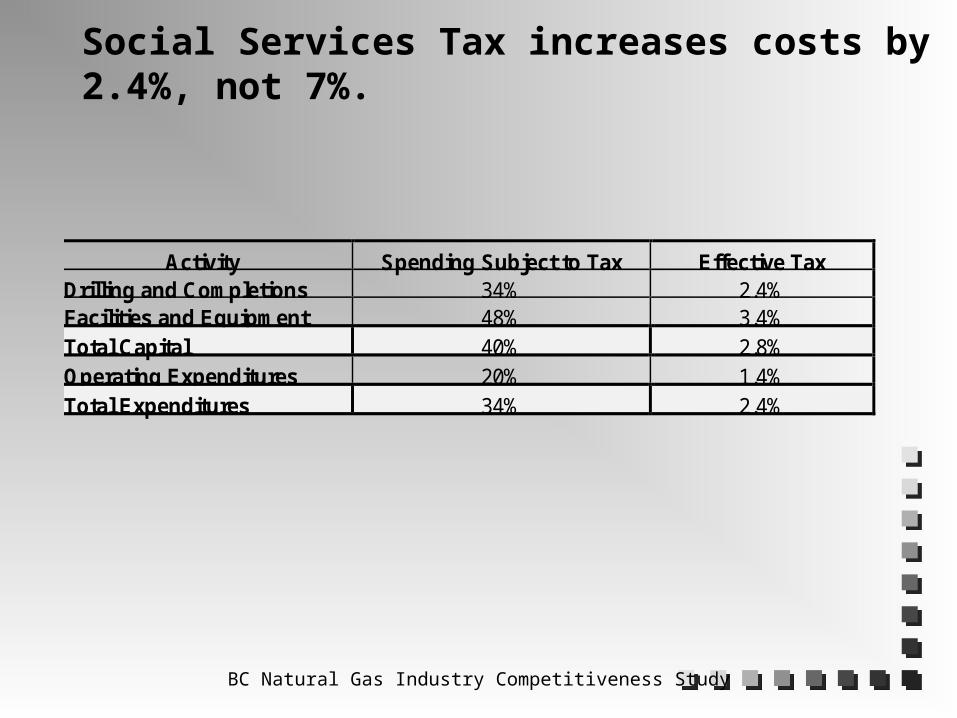
Social Services Tax increases costs by 2.4%, not 7%.
Activity Spending Subject to Tax Effective TaxDrilling and Completions 34% 2.4%Facilities and Equipment 48% 3.4%Total Capital 40% 2.8%Operating Expenditures 20% 1.4%Total Expenditures 34% 2.4%

BC Natural Gas Industry Competitiveness Study
Roads
Poor public road infrastructure increases all costs, constrains production and revenue and discourages investment.

BC Natural Gas Industry Competitiveness Study
OPPORTUNITIES FOR IMPROVEMENT
Improve road infrastructure and maintenance.
Improve plant infrastructure and promote even more competition in the processing sector.
Improve liquids infrastructure. Fort St. John as centre of competitive service
industry.
Top Related