


Languages
Pages
Legal

7/27/2019 assessment tutorial.pdf
http://slidepdf.com/reader/full/assessment-tutorialpdf 1/12
2007; 29: e122–e132
WEB PAPER
An analysis of peer, self, and tutor assessmentin problem-based learning tutorials
TRACEY PAPINCZAK, LOUISE YOUNG, MICHELE GROVES & MICHELE HAYNES
School of Medicine, University of Queensland, Herston Road, Herston, 4006, Queensland, Australia
Abstract
Objective: The purpose of this study was to explore self-, peer-, and tutor assessment of performance in tutorials among first year
medical students in a problem-based learning curriculum.
Methods: One hundred and twenty-five students enrolled in the first year of the Bachelor of Medicine and Bachelor of Surgery
Program at the University of Queensland were recruited to participate in a study of metacognition and peer- and self-assessment.
Both quantitative and qualitative data were collected from the assessment of PBL performance within the tutorial setting, which
included elements such as responsibility and respect, communication, and critical analysis through presentation of a case
summary. Self-, peer-, and tutor assessment took place concurrently.Results: Scores obtained from tutor assessment correlated poorly with self-assessment ratings (r ¼0.31 – 0.41), with students
consistently under-marking their own performance to a substantial degree. Students with greater self-efficacy, scored their PBL
performance more highly. Peer-assessment was a slightly more accurate measure, with peer-averaged scores correlating
moderately with tutor ratings initially (r ¼ 0.40) and improving over time (r ¼ 0.60). Students consistently over-marked their peers,
particularly those with sceptical attitudes to the peer-assessment process. Peer over-marking led to less divergence from the tutor
scoring than under-marking of one’s own work.
Conclusion: According to the results of this study, first-year medical students in a problem-based learning curriculum were better
able to accurately judge the performance of their peers compared to their own performance. This study has shown that
self-assessment of process is not an accurate measure, in line with the majority of research in this domain. Nevertheless, it has
an important role to play in supporting the development of skills in reflection and self-awareness.
Introduction
Education of medical students should prepare them to deal
with problems in the future, equipping them with skills
necessary to become active, self-directed learners, rather than
passive recipients of information (Dolmans & Schmidt 1996).
Acknowledgment of this need was responsible, in part, for the
development of problem-based learning (PBL) (Barrows &
Tamblyn 1980).
Within the discipline of medical education, PBL is a
curriculum innovation that involves students in learning
activities using loosely structured medical problems to drive
learning (Norman & Schmidt 1992). The pedagogical appeal of PBL is its perceived capacity to encourage, through these
learning processes, enhanced clinical reasoning skills, and the
development of both an adaptable knowledge base and skills
in self-directed learning necessary to become lifelong learners
(Kelson & Distlehorst 2000). Four crucial conditions for a deep
approach to learning are encompassed within the PBL
approach: a well-structured knowledge base, active learning,
collaborative learner interaction, and a context designed to
promote internal motivation through the provision of
pragmatic goals (Margetson 1994). Assessment of student
progress in such a student-centred curriculum, however, has
remained challenging (Eva 2001).
Assessment protocols within PBL curricula have sometimes
sought to include self-, peer-, and tutor evaluation to assess arange of skills, such as self-directed learning, group coopera-
tion, and communication (Swanson et al. 1997). Tutors and
peers have a unique opportunity to judge each others’ work in
PBL tutorials, and students should develop the ability to reflect
on their own strengths and weaknesses as these are central
elements of self-directed learning (Eva et al. 2004).
Several published quantitative studies of peer-assessment
within PBL curricula reveal correlations between staff/tutor
and peer ratings ranging from very low (Sluijman et al. 2001;
Reiter et al. 2002) to moderate (Sullivan et al. 1999; Segers &
Dochy 2001). Of limited research undertaken with medical
students in PBL, moderate correlation between peer and tutor
Practice points
. Self-assessment results in substantial under-marking
compared to tutor assessment.
. Scores obtained from peer-assessment are significantly
more generous than those scores arising from tutor
assessment.
. Self-assessment is a less accurate means of assessing
student performance than peer-assessment.

7/27/2019 assessment tutorial.pdf
http://slidepdf.com/reader/full/assessment-tutorialpdf 2/12
ratings was demonstrated by Sullivan (1999) while low
correlation was reported by Reiter et al. (2002). Findings
arising from studies of medical students in non-PBL curricula
show generally moderate correlations (Burnett & Cavaye 1980;
Van Rosendaal & Jennett 1992; Rudy et al. 2001; Minion et al.
2002). Several factors have the potential to impact negatively
on the accuracy of peer evaluations, including friendshipmarking, and decibel marking which favours dominant group
members (Pond & ul-Haq 1997). These may result in peer
over-marking often observed in quantitative studies of peer-
assessment (for instance, Rudy et al. 2001). It is also possible
that, in high stakes settings such as medical schools, inflated
estimates of peer performance would be the norm (Norcini
2003).
Another format for evaluating student performance in PBL
tutorials is self- assessment. Self- and peer-assessment are
often combined or considered together. Peer-assessment, for
instance, builds on evaluation skills that may be transferred to
self-assessment tasks and enables learners to compare their self evaluations with the assessments of others.
Despite meta-analyses of self-assessment in higher educa-
tion deeming students ‘well able to self-assess accurately’
(Sluijmans et al. 1999, p. 300), within medical PBL programs
reported correlations between self and tutor evaluations are
uniformly low (Rezler 1989; Gordon 1991; Das et al. 1998;
Sullivan et al. 1999; Reiter et al. 2002). Nor has a significant
relationship been found between self-assessment scores and
examination results (Tousignant & Des Marchais 2002; Eva
et al. 2004). This is also true of non-PBL medical curricula,
where poor association has been shown between
scores obtained from self-assessment and tutor
assessment (or examination results) (Arnold et al. 1985;
Woolliscroft et al. 1993; Rudy et al. 2001; Fitzgerald et al. 2003).
When self-assessment scores are compared with peer-
assessment scores, low correlations have been shown in all but
one study of PBL curricula or of medical courses (Sullivan et al.
1999; Reiter et al. 2002; Miller 2003). The exception, a study by
Burnett and Cavaye (1980), reported a very high correlation
between self- and peer-assessment scores among fifth year
medical students in a traditional curriculum. However, Eva
et al. (2004) reported disappointingly low correlation between
students’ self-assessment and performance on a test of medical
knowledge, with no evidence of improvement after one year
of medical education. The tendency exists for students tooverestimate their competence (Mattheos et al. 2004), espe-
cially lower-performing students (Woolliscroft et al. 1993; Lejk
& Wyvill 2001; Edwards et al. 2003). Young or highly capable
students are more likely to undermark their work (Stefani
1992; Rudy et al. 2001; Edwards et al. 2003; Fitzgerald et al.
2003). The influence of gender on both self-assessment and
peer-assessment accuracy appears to be minimal (Falchikov &
Magin 1997; Mattheos et al. 2004), although the experience of
self and peer-assessment may be more stressful for females
(Pope 2005).
Several approaches have been suggested to improve the
accuracy of scores generated from peer- or self-assessment.One well-supported idea is the use of co-assessment which
involves students with staff in the assessment process
reliability of tutor assessment in PBL tutorials for measures of
student knowledge (Neville 1998; Cunnington 2001; Whitfield
& Xie 2002), the potential exists for tutor assessment to be
combined with or compared to peer- or self-assessment to
improve the accuracy and comprehensiveness of the evalua-
tions generated (Dochy et al. 1999; Eva 2001). Tutors are in a
reasonable position to judge group processes (Dodds et al.2001).
The aim of this study was to explore peer- and self-
assessment within PBL tutorials in a medical course using
qualitative and quantitative approaches. Qualitative data were
collected to gather students’ perceptions of these alternate
forms of assessment (see Papinczak et al. 2007). Quantitative
data were analysed to assess the ‘accuracy’ of students as
assessors, with tutor scores as comparison. The impact of
specific demographic factors and students’ self-efficacy was
analysed to gain greater understanding of influences on
scoring. It was anticipated that confident (efficacious) students
would award themselves higher marks, althought this may bemediated by fears of self-aggrandisement in a public arena
(see Chaves et al. 2006).
Self-efficacy is defined as students’ perceptions of their
ability to successfully carry out a task (Bandura 1986). When
facing a difficult learning task, a student with high self-efficacy
beliefs is more likely to participate more actively, work harder,
remain more problem-focussed, and persist for a longer time
than a student with low self-efficacy, who is more likely to
view the situation as insurmountable, get frustrated and give
up (Pajares 1996; Nichols & Steffi 1999). Students with high
levels of self-efficacy are more willing to take on challenging
tasks (Zimmerman 2000), whereas students with low self-
efficacy may fail to achieve even when goals are within easy
reach (Bandura 1993). The effect of self-efficacy on scores
obtained through self-assessment has not previously been
evaluated within the PBL tutorial setting.
The PBL environment, with its emphasis on self-directed
and collaborative learning, provides a unique context in which
to explore alternative forms of assessment. As they work
together in PBL tutorials, students may develop interdepen-
dent relationships facilitating learning and motivation
(Willis et al. 2002). This study sought to incorporate
qualitative and quantitative dimensions in order to gain a
fuller understanding of peer- and self-assessment within
collaborative small group environments.
Description of the study
Quantitative and qualitative data were gathered as part of
a larger study of metacognitive processes undertaken with
first-year students enrolled in the Bachelor of Medicine and
Bachelor of Surgery (MBBS) Program at The University of
Queensland, Australia. Only the results of the self- and peer-
assessment segment of the study are reported here, including
quantitative findings and qualitative results which may be
explanatory or insightful.Ethical approval was obtained from the University of
Queensland’s Behavioural & Social Sciences Ethical Review
An analysis of peer, self, and tutor assessment
7/27/2019 assessment tutorial.pdf
http://slidepdf.com/reader/full/assessment-tutorialpdf 3/12
Setting
The MBBS Program introduced a four-year, graduate-entry
PBL curriculum in 1997. First-year students, in small groups of
nine or ten, undertake five hours of PBL tutorial time each
week for 33 weeks of the year. Working in collaboration with
group members, students analyse a problem of practice,formulate hypotheses, and undertake self-directed learning to
try to understand and explain all aspects of the patient’s
‘problem’.
Subjects
The study was conducted with 125 first-year medical students
and 20 tutors over a period of six months during 2004. Every
student in thirteen tutorial groups took part in a program of
educational activities within their PBL tutorials, including
peer- and self-assessment. Subsequent statistical analysis
showed that the self-selected study subjects (40.2% of the
student population) were representative of the entire cohort
on measures of age, gender, and primary undergraduate
degree.
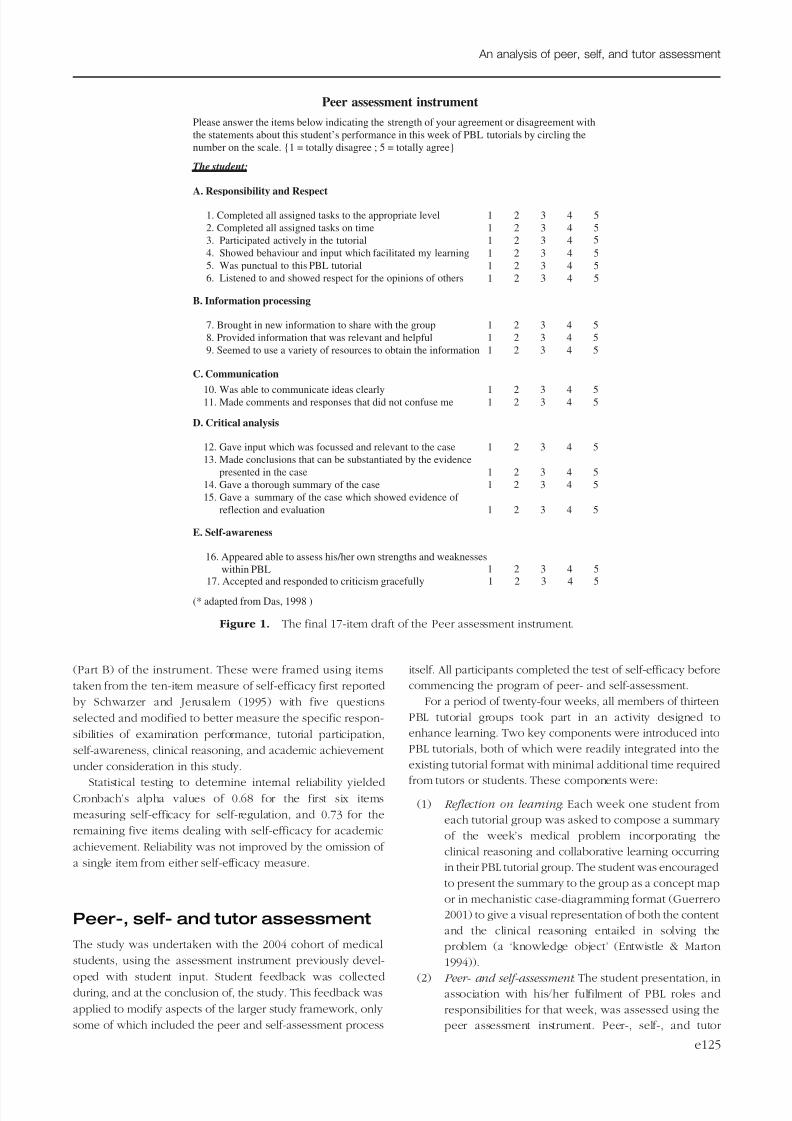
Instruments
Qualitative and quantitative data were generated using two
instruments: the peer assessment instrument (as shown in
Figure 1) and the test of self-efficacy, which all participants
completed at the commencement of the study.
The peer assessment instrument
In order to enhance student ownership of assessment criteria
(as recommended by Boud (1995) and Orsmond et al. (2000)),
members of several PBL tutorial groups in the previous cohort
were invited to participate in the development of an
instrument for peer- and self-assessment of students perfor-
mance in PBL tutorials. Students were first presented with a list
of criteria derived from relevant literature (including Das et al.
(1998) and Willis et al. (2002)) from which a set of items were
selected for inclusion in the first draft of the instrument.
The negotiated instrument with 19 items, labelled the
peer assessment instrument, was trialled with another student
group and rated as easy to use and understand by allparticipants. Student dissatisfaction with two items resulted in
their removal from the final version of the instrument. The
resulting scale measures several features of successful adult
education, such as participation, punctuality, respect for
others, effective communication, and critical analysis
(as shown in Figure 1). However, the inclusion of items
specifically targeting self-directed learning and self-awareness,
core features of PBL, allows it to be differentiated from others
which may be appropriate for open-ended, but less student-
centred, approaches—such as case-based instruction (Hay &
Katsikitis 2001).
The phrasing of items on the peer assessment instrument was varied slightly to make it more relevant to self-evaluation
where applicable, for instance, ‘I’ instead of ‘the student’.
question (inviting comments) on the final page of the
questionnaire. These were analysed and coded to themes to
provide insight into student perceptions.
In order to gain a measure of face validity, three
experienced PBL facilitators were asked to indicate whether
each of the 17 items on the instrument was relevant to PBL
performance and able to be adequately assessed using theitem in question. Unanimous face validity was obtained for all
items in the four sub-scores: responsibility and respect,
information processing, communication, and critical analysis.
Some dissent about the validity of the self-awareness sub-score
was evident. Construct validity describes the degree to which
the items used in the instrument define the constructs (Pressley
& McCormick 1995). The five constructs or domains of
performance were reported extensively in the medical and
nursing education literature. Each of the three PBL tutors and
ten PBL students were asked to categorise the 17 items into the
five specified domains. In all cases, the items were distributed
in accordance with the domains as defined on the instrument. Values for Cronbach’s alpha ranged from 0.76 to 0.84,
indicating good internal consistency among the five sub-
scores. Acceptable reliability was found, with Pearson correla-
tion coefficients for peer-averaged and tutor assessment
ranging from 0.40 to 0.60. Notably, self-awareness items
were problematic with a significant number of students
consistently entering ‘not applicable’ for those two items.
Unfortunately, time constraints prevented further renego-
tiation of the peer assessment instrument with the subsequent
cohort prior to the commencement of the study.
Test of self-efficacy
The instrument to measure students’ self-efficacy was
composed specifically for this project as existing instruments
were not designed for use in problem-based learning courses.
The test of self-efficacy comprises eleven closed questions
relating to regulation of, and confidence in, learning, with
scores rated on a Likert scale of one-to-five. The first six items
(Part A) deal with students’ perceived capability to use various
self-regulation strategies, such as organizing their studies, and
concentrating and participating in small-group tutorials. These
were loosely based on Bandura’s (1989) multidimensional
scales of perceived self-efficacy reported in Zimmerman et al.
(1992). This original scale was designed to measure highschool students’ perceived capability to use various self-
regulating strategies, such as concentrating on school subjects,
organising schoolwork, and participating in school discus-
sions. Of the eleven items on the original scale, the most
applicable six were chosen and rewritten to more appro-
priately reflect the learning and studying activities carried out
by students in this medical course in order to create a brief
instrument measuring self-efficacy to regulate learning. The
six items deal with the self-regulation strategies: completing
allocated learning objectives for the group; studying when
there are distractions; planning and organising study; course
motivation; and concentration and active participation intutorials.
A further five items measuring self-efficacy for academic
T. Papinczak et al.
7/27/2019 assessment tutorial.pdf
http://slidepdf.com/reader/full/assessment-tutorialpdf 4/12
(Part B) of the instrument. These were framed using items
taken from the ten-item measure of self-efficacy first reported
by Schwarzer and Jerusalem (1995) with five questions
selected and modified to better measure the specific respon-
sibilities of examination performance, tutorial participation,
self-awareness, clinical reasoning, and academic achievement
under consideration in this study.
Statistical testing to determine internal reliability yieldedCronbach’s alpha values of 0.68 for the first six items
measuring self-efficacy for self-regulation, and 0.73 for the
remaining five items dealing with self-efficacy for academic
achievement. Reliability was not improved by the omission of
a single item from either self-efficacy measure.
Peer-, self- and tutor assessment
The study was undertaken with the 2004 cohort of medical
students, using the assessment instrument previously devel-
oped with student input. Student feedback was collectedduring, and at the conclusion of, the study. This feedback was
applied to modify aspects of the larger study framework, only
itself. All participants completed the test of self-efficacy before
commencing the program of peer- and self-assessment.
For a period of twenty-four weeks, all members of thirteen
PBL tutorial groups took part in an activity designed to
enhance learning. Two key components were introduced into
PBL tutorials, both of which were readily integrated into the
existing tutorial format with minimal additional time required
from tutors or students. These components were:(1) Reflection on learning : Each week one student from
each tutorial group was asked to compose a summary
of the week’s medical problem incorporating the
clinical reasoning and collaborative learning occurring
in their PBL tutorial group. The student was encouraged
to present the summary to the group as a concept map
or in mechanistic case-diagramming format (Guerrero
2001) to give a visual representation of both the content
and the clinical reasoning entailed in solving the
problem (a ‘knowledge object’ (Entwistle & Marton
1994)).
(2) Peer- and self-assessment : The student presentation, inassociation with his/her fulfilment of PBL roles and
responsibilities for that week, was assessed using the
Peer assessment instrument
Please answer the items below indicating the strength of your agreement or disagreement with
the statements about this student’s performance in this week of PBL tutorials by circling the
number on the scale. {1 = totally disagree ; 5 = totally agree}
The student:
A. Responsibility and Respect
1. Completed all assigned tasks to the appropriate level
2. Completed all assigned tasks on time
3. Participated actively in the tutorial
4. Showed behaviour and input which facilitated my learning
5. Was punctual to this PBL tutorial
6. Listened to and showed respect for the opinions of others
1 2 3 4 5
1 2 3 4 5
1 2 3 4
1 2 3 4 5
1 2 3 4 5
1 2 3 4 5
B. Information processing
7. Brought in new information to share with the group
8. Provided information that was relevant and helpful
9. Seemed to use a variety of resources to obtain the information
1 2 3 4 5
1 2 3 4 5
1 2 3 4 5
C. Communication
10. Was able to communicate ideas clearly11. Made comments and responses that did not confuse me
1 2 3 4 51 2 3 4 5
D. Critical analysis
12. Gave input which was focussed and relevant to the case
13. Made conclusions that can be substantiated by the evidence
presented in the case
14. Gave a thorough summary of the case
15. Gave a summary of the case which showed evidence of
reflection and evaluation
1 2 3 4 5
1 2 3 4 5
1 2 3 4 5
1 2 3 4 5
E. Self-awareness
16. Appeared able to assess his/her own strengths and weaknesses
within PBL 1 2 3 4 5
17. Accepted and responded to criticism gracefully 1 2 3 4 5
(* adapted from Das, 1998 )
5
Figure 1. The final 17-item draft of the Peer assessment instrument.
An analysis of peer, self, and tutor assessment
7/27/2019 assessment tutorial.pdf
http://slidepdf.com/reader/full/assessment-tutorialpdf 5/12
assessment took place concurrently. Scores from these
worksheets were compared to explore statisticalrelationships. Qualitative data were analysed.
Constant monitoring of student perceptions of, and attitudes
to, these educational activities helped to monitor the effects of
the dual activities to maximize student learning. This is in
keeping with an action research process which uses over-
lapping cycles of planning, acting and observing, and
reflecting (Kemmis & Wilkinson 1998) to maintain a respon-
sive and flexible study design.
In the first week of the main study (week four of the
academic year), students in the thirteen tutorial groups were
distributed two documents: a copy of the peer assessment
instrument to enable students to become familiar with theevaluation criteria, and an exemplar outlining ‘good’ and ‘poor’
outcomes for the criteria. Tutors assigned to each group then
led their group in a practice session, with a tutor-led
presentation of a summary of the previous week’s medical
case, in order to establish familiarity with the instrument and
process. The summary itself was written by the researcher and
presented, with explanation, to each tutor in the week prior to
the trial. Tutors received written information, a short informa-
tion session, and frequent communication and feedback to
help maintain fidelity of treatment.
In the ensuing 23 weeks, tutorial groups implemented
the summarization and assessment activities at the start of each week as part of the ‘wrap-up’ of the previous week’s
PBL case. Each student was expected to be the focus of two
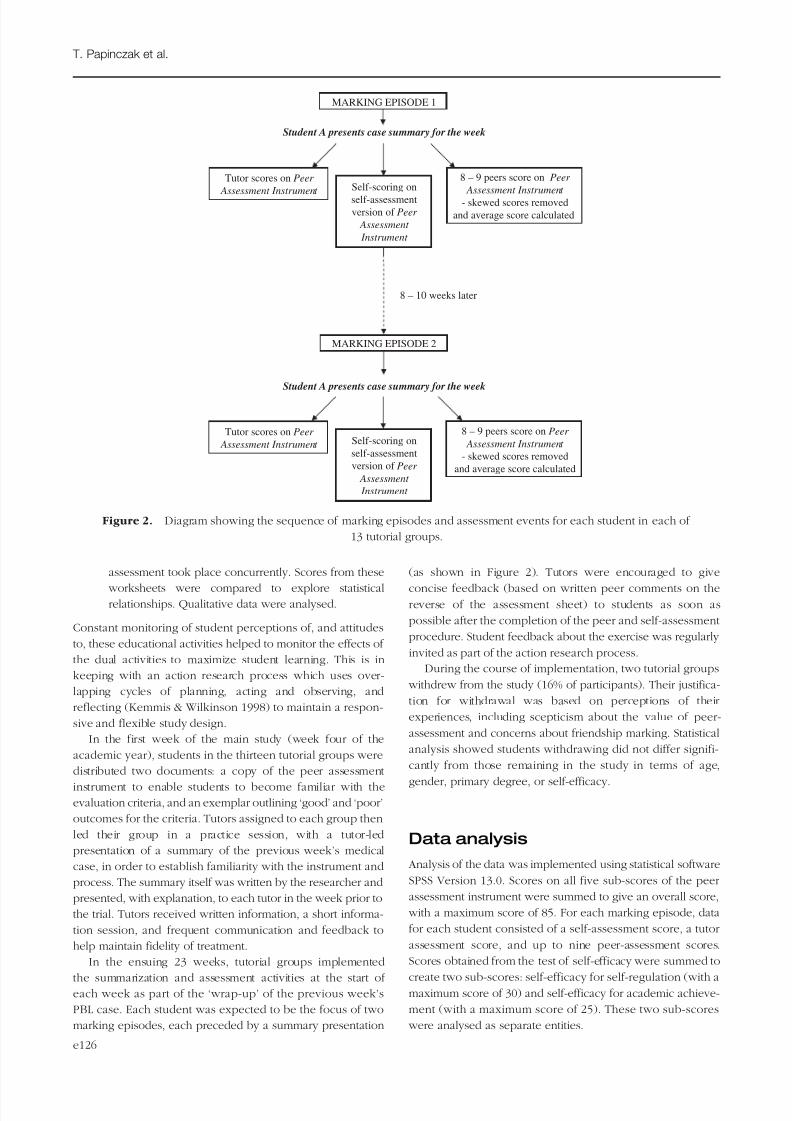
(as shown in Figure 2). Tutors were encouraged to give
concise feedback (based on written peer comments on thereverse of the assessment sheet) to students as soon as
possible after the completion of the peer and self-assessment
procedure. Student feedback about the exercise was regularly
invited as part of the action research process.
During the course of implementation, two tutorial groups
withdrew from the study (16% of participants). Their justifica-
tion for withdrawal was based on perceptions of their
experiences, including scepticism about the value of peer-
assessment and concerns about friendship marking. Statistical
analysis showed students withdrawing did not differ signifi-
cantly from those remaining in the study in terms of age,
gender, primary degree, or self-efficacy.
Data analysis
Analysis of the data was implemented using statistical software
SPSS Version 13.0. Scores on all five sub-scores of the peer
assessment instrument were summed to give an overall score,
with a maximum score of 85. For each marking episode, data
for each student consisted of a self-assessment score, a tutor
assessment score, and up to nine peer-assessment scores.
Scores obtained from the test of self-efficacy were summed to
create two sub-scores: self-efficacy for self-regulation (with amaximum score of 30) and self-efficacy for academic achieve-
ment (with a maximum score of 25). These two sub-scores
Student A presents case summary for the week
Student A presents case summary for the week
Tutor scores on
8 – 10 weeks later
Tutor scores on Peer
Assessment Instrument
8 – 9 peers score on Peer
Assessment Instrument
- skewed scores removed
and average score calculated
Self-scoring on
self-assessmentversion of Peer
Assessment
Instrument
Tutor scores on Peer
Assessment Instrument
8 – 9 peers score on Peer
Assessment Instrument
- skewed scores removed
and average score calculated
Self-scoring on
self-assessment
version of Peer
Assessment
Instrument
MARKING EPISODE 1
MARKING EPISODE 2
Figure 2. Diagram showing the sequence of marking episodes and assessment events for each student in each of
13 tutorial groups.
T. Papinczak et al.

7/27/2019 assessment tutorial.pdf
http://slidepdf.com/reader/full/assessment-tutorialpdf 6/12
Descriptive statistics for tutor, self- and peer-assessment are
presented in Table 1 for scores for each of the two marking
episodes. Data were missing for individuals failing to submit
completed assessment instruments. Frequency histograms
revealed non-normal distributions of peer scores resulting
from peer-assessment, with some groups awarding full marks
for a large proportion of assessments. As qualitative data made
it apparent that some students deliberately scored 100% for
peer performances, irrespective of quality, it was resolved to
apply an algorithm to reduce the prevalence of deliberately
skewed scores or scores resulting from friendship marking and
students’ cavalier attitudes. In instances where the tutor score
for a given group was 72 out of 85 (representing a result of 85%)
or less, all peer scores of 100% were omitted from the statistical
analysis for that tutorial group. In this way, the most highly
skewed results were excluded from the data set (representing
4.6% data loss) yet the data remained a reflection of the peer-assessment process which operates in a climate of student
generosity towards others (see, for instance, Rudy et al. 2001).
Averaged peer-assessment scores were calculated by
computing the mean for each students’ completed peer-
assessment instruments (once skewed results were removed).
The reliability among peer-averaged scores for all intervention
tutorial groups was well within acceptable limits with
Cronbach’s alpha scores ranging from 0.66 to 0.77. The results
of Kolmogorov–Smirnov testing confirmed that scores for self-,
peer-averaged, and tutor-assessment generated from two
marking episodes followed a normal distribution. The para-
metric tests chosen are fairly robust and should remainrelatively unaffected by the observed clustering of assessment
marks to the upper end of the range. Despite reservations
about its use in this capacity (see Ward et al. 2002) tutor
scoring was utilised as the most appropriate benchmark for
comparative purposes in assessing the reliability of peer- and
self-assessment.
In order to provide evidence for claims of ‘accuracy’, Bland
Altman plots (see Bland and Altman 1986) were used to
graphically represent levels of agreement between two sets of
scores. Average of scores was plotted against difference
between paired scores for (1) self- versus tutor scores at time
2 and (2) peer-averaged versus tutor scores at time 2. Threelines representing the mean difference and upper and lower
limits of agreement were drawn. The limits of agreement were
suggested by Bland and Altman (1986), which are meandifferenceÆ 2 standard deviations, were considered too wide
to give meaningful results in this study and were not used.
Table 1. Descriptive statistics – self-, peer-, and tutor assessment - for each of the two marking episodes.
Marking episode Score Number of responses Mean Standard deviation Minimum–maximum score
1 Self-assessment 108 68.80 8.32 44–85
1 Averaged peer-assessment 115 79.08 4.21 66–85
1 Tutor assessment 89 76.15 7.58 43–85
2 Self-assessment 82 67.70 10.70 38–85
2 Averaged peer-assessment 87 79.04 3.75 68–84
2 Tutor assessment 70 74.99 8.96 46–85
80706050
Average of scores
30
20
10
0
−10
−20
−30
−40
M e a n d i f f e r e n c e
Upper limit = −3.34
Lower limit = −11.84
Mean = −7.59
Scatter plot - time 2 scores for self vs tutor assessment(self scores lower)
Figure 3. Bland-Altman plot of self-assessment versus tutor
scores at time 2.
858075706560
Average of scores
40
30
20
10
0
−10
−20
M e a n d i
f f e r e n c e
Upper limit = 8.00
Mean = 3.75
Lower limit = −0.50
Scatter plot - time 2 scores for peer averaged vs tutorassessments (peer averaged scores higher)
Figure 4. Bland-Altman plot of peer-averaged versus tutor
scores at time 2.
An analysis of peer, self, and tutor assessment

7/27/2019 assessment tutorial.pdf
http://slidepdf.com/reader/full/assessment-tutorialpdf 7/12
Results
Self-assessment
Demographic variables. Multilevel regression analysis was
used to explore the relationship between demographic
variables and self-assessment scores. Of four factorsincorporated into the model (age, gender, primary
undergraduate degree, and repeat student status), only
primary degree was statistically significant in explaining the
variance in self-assessment scores. Students with an arts,
commerce, music, education or law degree on admission
to the MBBS Program were significantly more likely to
have higher initial self-assessment scores than others,
while those with pure sciences or therapies degrees marked
themselves significantly lower (t ¼ 2.89; p ¼0.05). This
distinction was less noticeable in the second marking episode.
Self-efficacy. Initial self-efficacy for self-regulation was mod-
erate to high with a mean of 23.85 (out of 30) and a standard
deviation of 3.18, while initial self-efficacy for academic
achievement also showed relatively elevated levels
(mean¼ 19.51 out of a possible 25, standard deviation¼ 2.51).
In order to explore the relationship between self-assessment
scores and self-efficacy, a multiple linear regression
analysis was undertaken. Only initial self-efficacy for
self-regulation was statistically significant in
explaining the variance in self-assessment scores (t ¼À3.85,
p ¼ 0.001).
Comparison of means. Direct comparison of the self-assess-
ment mean with the tutor score revealed consistent under-
marking of students’ own work, as shown in Table 1. Paired
t -tests were undertaken to determine whether statistically
significant directional differences existed for each marking
episode. In each marking episode, the students scored
themselves significantly lower than their tutor (t ¼À5.27 to
À8.10; p < 0.001).
Analysis of qualitative data indicated students were
concerned about lack of objectivity. One student commented
on their struggle to remain impartial: ‘I find it difficult to
undertake self assessment—mainly because I feel that my
perception of my performance may be inaccurate due to bias
or distorted perceptions’.
Inter-rater agreement. To explore levels of agreement
between scores for self-assessment and other tutorial-
based scores, two analyses were undertaken. These were:
(a) correlation to test for the strength and direction of linear
relationships between scores; and (b) Bland Altman plots to
graphically represent scores obtained from self- and tutor
assessment.(a) Pearson correlation coefficients were computed for
self and peer-averaged, and self and tutor assessment
scores derived from both marking episodes
(see Table 2). Despite reaching statistical significance,
the correlation between self and peer-averaged scores
was low-to-moderate (r ¼ 0.30 – 0.32). A slightly
stronger correlation was observed for self and tutor
scores (r ¼ 0.31 – 0.41). Tremendous variability existed
between tutorial groups. When groups were analysed
for score correlation separately, across both marking
episodes, six tutorial groups showed very high levels of
marking agreement with self and tutor score correlationcoefficients ranging from 0.74 to 0.92. Other groups
showed low correlations.
(b) Bland Altman plots charted the difference between tutor
and self-assessment scores against the average of these
scores. Plots showed poor accuracy of self- versus tutor
assessment at both times 1 and 2, with a considerable
proportion of plotted scores well outside the levels of
agreement (meanÆ5% of the maximum score). Figure 3
shows a Bland–Altman plot for self- versus tutor
assessment at time 2. The mean differences of –7.59
(time 2) highlights both the considerable under-marking
of self compared to tutor scores and lack of
accuracy. The standard deviation was quite large
(11.70 at time 2), indicating a wide spread of scores
about the mean.
Peer-assessment
Demographic variables. Analysis of variance demonstrated
no significant differences between the marks awarded to
peers based on the presenting student’s gender, age, or
primary degree. There was evidence, however, of a trend
towards higher scores being awarded to older male students in
the groups. This failed to reach statistical significance (F ¼ 3.12;
df ¼ 12; p ¼0.095).
Table 2. Correlation between pairs of scores obtained from self-, peer-, and tutor assessment. Peer averaged scores have been used.Cronbach’s alpha for all peer averaged scores across 13 tutorial groups in the first marking episode¼0.77, while Cronbach’s alpha for all peer
averaged scores across 13 tutorial groups in the second marking episode¼0.66.
Marking episode Paired scores Number of paired responses Pearson correlation coefficient p value (2 tailed)
1 Self and tutor scores 85 0.41 <0.001
1 Self and peer-averaged scores 108 0.32 <0.001
1 Tutor and peer-averaged scores 89 0.40 <0.001
2 Self and tutor scores 66 0.31 0.012
2 Self and peer-averaged scores 82 0.30 0.007
2 Tutor and peer-averaged scores 70 0.60 <0.001
T. Papinczak et al.

7/27/2019 assessment tutorial.pdf
http://slidepdf.com/reader/full/assessment-tutorialpdf 8/12
Comparison of means. Direct comparison of the peer-
averaged mean with the tutor score revealed consistent over-
marking by peers (see Table 1). Paired t -tests were undertaken
to determine whether statistically significant directional differ-
ences existed for each marking episode. In each marking
episode, the mean of the peer scores for each student
presentation was significantly higher than the score awardedby their tutor (t ¼3.71 to 4.14; p < 0.001).
Inter-rater agreement. To explore levels of agreement
between scores for peer-averaged assessment and other
tutorial-based scores, two analyses were undertaken. These
were: (a) correlation to test for the strength and direction of
linear relationships between scores; and (b) Bland Altman
plots to graphically represent scores obtained from peer-
averaged and tutor assessment.
(a) Table 2 presents Pearson correlation coefficients for
tutor and peer-averaged scores generated from both
marking episodes. At best moderate correlations weredemonstrated initially for tutor and peer-averaged
scores (r ¼0.40), with some improvement over time
(r ¼ 0.60). This data supports the acceptable reliability of
the assessment instrument subject to the limitations of
the use of tutor assessment as the benchmark.
When tutorial groups were analysed for score correlation
separately, in all seven of the thirteens groups were capable of
very high levels of marking agreement with correlation
coefficients ranging from 0.76 to 0.96. Qualitative data
indicated that the majority of these groups were very
supportive of, and committed to, the peer-assessment process.Comments such as: ‘. . .good to learn how to do this
appropriately, as I think we will need to be able to assess
our peers’ performance, as well as our own, throughout our
careers’ were given by some enthusiastic respondents.
Scores obtained from other tutorial groups were in
substantially less agreement. Most of these group members
expressed negative views about peer-assessment related
specifically to potential for bias. The effect of omission of
highly skewed results (as discussed earlier) on correlation was
briefly explored. Data editing was found to improve the peer-
tutor correlation from 0.32 to 0.40 in the first marking episode.
(b) Bland Altman plots charted the difference between tutor and peer-averaged scores against the average of these
scores. A moderate level of agreement between peer-
averaged and tutor assessment at both time 1 and 2
were shown, with a considerable proportion of plotted
scores within the levels of agreement (meanÆ5% of the
maximum score). The mean differences of 3.75 (time 2)
highlight both the over-marking of peers compared to
tutor scores and improved accuracy of peer-averaged
scores compared to scores derived from self-assessment
(see Figure 4).
Variability between tutorial groups. Differences between theaveraged peer-assessment scores of all 13 groups were
explored using multivariate analysis of variance. Statistically
(F ¼ 2.09; df ¼ 12; p ¼0.028) was evident. The effect size, as
measured by partial eta squared, was 0.26. Figure 5 illustrates
this variability, through box plots, for the 13 tutorial groups on
the 0–85 scale of the peer assessment instrument. Analysis of
variance demonstrated five tutorial groups had reliably
recorded significantly lower peer-average scores, while three
groups had consistently scored group members more favour-
ably. Comparison between the three sources of assessment
scores (self-, peer-, and tutor) revealed a small number of
groups consistently reporting high student-generated scores in
the absence of high tutor scores. Based on tutor assessment as
the benchmark, members of these tutorial groups must be
awarding peers overly generous marks. Qualitative data
suggest this may relate to friendship marking.
A strong reaction to peer-assessment was the widespread
perception that this process could be corrupted by bias due to
friendship marking, fear of ‘tit-for-tat’ scoring, or lack of
honesty. The following comments sum up the attitude among
many study participants: ‘(It is) hard to criticise friends’ and
‘Relationships between students can colour opinions’. Some
students expressed casual and/or sceptical attitudes, scoring
100% for each student in their group regardless of the quality
of the work to be judged. Frequent comments such as:
‘Not taken too seriously’, and ‘Not too much thought goes intothe marking’ reflect a cynical attitude to the peer-assessment
process.
Discussion and conclusion
Self-assessment appears to be a less accurate means of
evaluating student performance in PBL tutorials than peer-
assessment. The heterogeneity of the group was confirmed by
the presence of many outliers in the data, confirming the low
accuracy of self-assessment among this sample of students.
Subject to the variability observed between the scores
obtained from 13 tutorial groups, correlations between self-assessment scores and those generated from tutor and peer-
assessment were disappointingly low. Some groups showed
3129282724231716149764
Group number
85
80
75
70
65
P e e r - a s s e s s m e n
t a v e r a g e ( 1 )
63
44
20
22 86
76
5
Figure 5. Box plots of averaged peer-assessment scores for
thirteen tutorial groups with results obtained from the first
marking episode.
An analysis of peer, self, and tutor assessment
7/27/2019 assessment tutorial.pdf
http://slidepdf.com/reader/full/assessment-tutorialpdf 9/12
were also more accurate than others in their self-assessment.
These findings are in accord with the general consensus in
medical education that self-assessment of tutorial processes
in PBL is an inexact measure (Rezler 1989; Gordon 1991;
Das et al. 1998; Sullivan et al. 1999; Reiter et al. 2002).
Students clearly under-marked themselves, particularly
those with pure science or therapies degrees. Other authorshave shown that young or highly capable students are more
likely to undermark their work (Stefani 1992; Rudy et al. 2001;
Edwards et al. 2003; Fitzgerald et al. 2003). Analysis of
qualitative data suggests that students struggled to find a
balance between confidence in their performance, self-
awareness, and humility. Objectivity was also a major cause
of concern.
Self-efficacy was correlated with self-assessment. Students
awarding themselves higher marks were more likely to have
stronger self-efficacy for self-regulation. Self-assessment scores
would be influenced by many factors, but confidence in one’s
ability to do well would be expected to provide incentive toaward oneself higher marks on PBL performance. Positive
collaborative learning behaviour has been shown to be related
to learning self-efficacy (McLoughlin & Luca 2004).
Peer-assessment offers a greater likelihood of providing
accurate alternate forms of assessment within the PBL tutorial
environment. Correlation between tutor and peer-averaged
scores were barely moderate at first, then improved with
continued practice in peer-assessment. Some groups achieved
very high correlation (up to 0.96) between tutor scores and
peer-averaged scores. The use of peer-averaged rather than
individual scores may help to account for apparently improved
accuracy compared to self-assessment. Nevertheless, some
students, and some groups of students, were able to
judge the performance of their peers in PBL tutorials with
precision.
The removal of highly skewed results prior to the
generation of peer-averaged scores improved the correlation
between peer-averaged and tutor scores. Qualitative data
indicated that some students were treating the peer-assessment
process with casual and/or sceptical attitudes. By removing
scores known to be deliberately distorted, it was anticipated
that the peer-averaged scores would more appropriately
reflect the genuine abilities of responsible students to assess
their peers. Data analysis indicated that this was the case,
with a small improvement in the correlation of tutor andpeer-averaged scores in the first marking episode once
highly skewed scores were omitted. The implementation
of peer-assessment in any setting is likely to lead to
initial scepticism and doubt about its value and validity.
However, through repeated exposure to, and practice in,
peer-assessment, such perceptions should be moderated
(Sluijmans et al. 1999; Ballantyne et al. 2002), and highly
skewed results would be expected to decrease in frequency.
The improved correlation between peer-averaged and tutor
assessment at time 2 (compared to time 1) lends support to
this supposition.
Results from other studies of peer-assessment of processesin PBL (or small group) tutorials show variable correlations
between staff and peer scores. Correlations range from very
In keeping with the findings of Rudy et al. (2001), students
were over generous in their marking of peers. The consistent
under-marking of self combined with over-marking by peers
helps to account for the low correlation found for self and
peer-assessment. Qualitative results showed the potential for
inflated estimates of peer performance resulting from friend-
ship marking. Friendship marking has been reported by other researchers as biasing peer-assessment responses
(Pond & ul-Haq 1997).
This study has the capacity to make a contribution
to knowledge in the area of peer- and self-assessment
in PBL tutorials. The study incorporated strengths in
four main areas. These were: (1) focus on the learning
process in PBL tutorials; (2) duration of the program;
(3) congruence with PBL philosophy; and (4) triangulation in
data collection.
(1) The focus on learning process is an important strength
of the study design as it enabled insights into learning
processes undertaken by students. Bereiter and
Scardamalia (2000) call for greater research into PBL
processes using reflective action research.
(2) The moderate duration of the program (exceeding six
months) leads to greater confidence in study findings.
Loss of participants over time (16% of participants) was
not excessive given the time pressures experienced by
students.
(3) Congruence with PBL philosophy allowed the study to
complement the existing structure of PBL tutorials. By
supporting the practice of self-assessment within PBL,
the study upheld a SDL emphasis. Collaboration was
enhanced through the use of collaborative assessment formats. The reflective component of the intervention
built upon the review phase of the PBL learning cycle.
(4) Methodological triangulation was achieved by combin-
ing quantitative and qualitative approaches to study
design. While qualitative inquiry helped to confirm
theory emerging from student perspectives, quantita-
tive inquiry enabled a set of statistical relationships to
be uncovered.
Results should be interpreted within the context of potential
limitations, including non-probability sampling, a relatively
small sample size, subjective scoring of test items, and thedifferent ways students and tutors interpret and apply
assessment criteria. With regard to assessment of PBL
processes such as communication and respect, no real
benchmark exists (Ward et al. 2002). This casts some doubt
on the validity of expert assessment in this domain.
Peer- and self-assessment within the tutorial setting has an
important role to play through its reinforcement of
the educational goals and instructional principles of problem-
based learning (Nendaz & Tekian 1999; Segers & Dochy 2001).
There is evidence that tutorial-based assessment may also
reduce the overwhelming reliance on formal grading of
students which encourages competition rather thancollaboration (Eva 2001).
First-year medical students in this study demonstrated poor
T. Papinczak et al.

7/27/2019 assessment tutorial.pdf
http://slidepdf.com/reader/full/assessment-tutorialpdf 10/12
the creation and presentation of a case summary. Normally a
private process, self-assessments conducted publicly require
students to balance unrealistic goals and perceptions, assess-
ment anxiety, and ‘social norms about self-aggrandizement’
(Chaves et al. 2006, p. 30). This makes it unlikely that
self-assessment accuracy in medical education is achievable
(Eva & Regehr 2005).Nevertheless, practice in self-assessment should be
integrated into existing programs of medical education. As
Eva and Regehr (2005) emphasise, self-assessment is a means
of identifying one’s strengths and weaknesses to guide goal
setting and enhance self-efficacy. This study has shown that
self-assessment is not an accurate measure, in line with the
majority of research in this domain. Nevertheless, it has an
important role to play in supporting the development of skills
in reflection and self-awareness. Self-assessment needs to be
viewed from a ‘self-improvement perspective’ (Eva & Regehr,
2005, p. S52). Further qualitative research needs to be
conducted to better understand students’ apparent inability to self-assess accurately within collaborative small group
learning environments.
Peer-assessment provides a valuable opportunity for tutor-
ial-based assessment. The act of evaluating the performance of
professional peers has long been central to the referral process
in medicine (Norcini 2003). Skills gained through peer-
assessment activities may transfer to self-assessment tasks and
enable learners to compare their self-assessment with the
assessments of others (Searby & Ewers 1997; Dochy et al. 1999).
Feedback from peers has the potential to assist learners to
develop more accurate impressions of themselves and their
abilities (Eva & Regehr 2005).
A fundamental part of the PBL process is the capacity of
students to embrace their responsibilities as active members of
a group of learners. These may include collaborative and self-
assessment practices which have the potential to enhance
reflection and self-awareness.
Notes on contributors
TRACEY PAPINCZAK is completing her PhD in medical education within
the School of Medicine, The University of Queensland.
DR LOUISE YOUNG is a senior lecturer in the School of Medicine at The
University of Queensland and is currently Deputy Director of the
University’s Centre for Medical Education.
ASSOCIATE PROFESSOR MICHELE GROVES is Deputy Head of School and
Director of Medical Studies in the School of Medicine, Griffith University,
Queensland.
DR MICHELE HAYNES works at The University of Queensland’s Social
Research Centre as Statistical Advisor and lectures in the School of Social
Science.
References
Arnold L, Willoughby TL, Calkins EV. 1985. Self-evaluation in under-
graduate medical education: a longitudinal perspective. J Med Edu
60:21–28.
Ballantyne R, Hughes K, Mylonas A. 2002. Developing procedures for
implementing peer assessment in large classes using an action research
process. Asses Eval Higher Edu 27:427–441.
Bandura A. 1986. Social Foundations of Thought and Action (Englewood
Bandura A. 1993. Perceived self-efficacy in cognitive development and
functioning. Edu Psychologist 28:117–148.
Barrows HS, Tamblyn RM. 1980. Problem-Based Learning: an Approach to
Medical Education (New York, Springer).
Bereiter C, Scardamalia M. 2000. Process and product in problem-based
learning research. In: DH Evenson & CE Hmelo (Eds), Problem-Based
Learning: a Research Perspective on Learning Interactions (Mahwah,
NJ, Lawrence Erlbaum Associates).Bland MJ, Altman DG. 1986. Statistical methods for assessing agreement
between two methods of clinical measurement. Lancet i:307–311.
Boud D. 1995. Enhancing Learning Through Self Assessment (London,
Kogan Page).
Burnett W, Cavaye G. 1980. Peer assessment by fifth year students of
surgery. Assess Higher Edu 5:273–278.
Chaves JF, Baker CM, Chaves JA, Fisher ML. 2006. Self, peer and tutor
assessments of MSN competencies using the PBL-Evaluator. J Nurs Edu
45:25–31.
Cunnington J. 2001. Evolution of student evaluation in the McMaster MD
programme. Pedagogue 10:1–9.
Das M, Mpofu D, Dunn E, Lanphear JH. 1998. Self and tutor evaluations in
problem-based learning tutorials: is there a relationship? Med Edu
32:411–418.
Dochy F, Segers M, Sluijmans D. 1999. The use of self-, peer-, andco-assessment in higher education. Studies in Higher Edu 24:331–350.
Dodds AE, Orsmond RH, Elliott SL. 2001. Assessment in problem-based
learning: The role of the tutor. Annal Acad Med Singapore 30:366–370.
Dolmans DH, Schmidt HG. 1996. The advantages of problem-based
curricula. Postgraduate Med J 72:535–538.
Edwards RK, Kellner KR, Sistrom CL, Magyari EJ. 2003. Medical student self-
assessment of performance on an obstetrics and gynaecology clerkship.
Am J Obstetrics and Gynaecol 188:1078–1082.
Entwistle NJ, Marton F. 1994. Knowledge objects: Understandings
constituted through intensive academic study. Br J Edu Psychol
64:161–178.
Eva KW. 2001. Assessing tutorial-based assessment. Adv Health Sci Edu
6:243–257.
Eva KW, Regehr G. 2005. Self-assessment in the health professions: A
reformulation and research agenda. Acad Med 80:S46–S54.Eva KW, Cunnington JPW, Reiter HI, Keane DR, Norman GR. 2004. How
can I know what I don’t know? Poor self assessment in a well-defined
domain. Adv Health Sci Edu 9:211–224.
Falchikov N, Magin D. 1997. Detecting gender bias in peer marking of
students’ group process work. Asses Eval Higher Edu 22:385–396.
Fitzgerald JT, White CB, Gruppen LD. 2003. A longtitudinal study of self-
assessment accuracy. Med Edu 37:645–649.
Gordon MJ. 1991. A review of the validity and accuracy of self-assessments
in health professions training. Acad Med 66:762–769.
Guerrero APS. 2001. Mechanistic case diagramming: A tool for problem-
based learning. Acad Med 76:385–389.
Hay PJ, Katsikitis M. 2001. The ‘expert’ in problem-based and case-based
learning: Necessary or not? Med Edu 35:22–28.
Kelson ACM, Distlehorst LH. 2000. Groups in problem-based learning
(PBL): Essential elements in theory, & practice. In: DH Evenson &CE Hmelo (Eds), Problem-Based Learning: a Research Perspective on
Learning Interactions (Mahwah, NJ, Lawrence Erlbaum Associates).
Kemmis S, Wilkinson M. 1998. Participatory action research and the study
of practice. In: B. Atweh, S. Kemmis & P. Weeks (Eds), Action Research
in Practice: partnerships for Social Justice in Education , pp. 21–36
(London, Routledge).
Lejk M, Wyvill M. 2001. The effect of the inclusion of self-assessment with
peer-assessment of contributions to a group project: a quantitative
study of secret and agreed assessments. Assess Eval Higher Edu
26:551–561.
Magin DJ. 2001. A novel technique for comparing the reliability of multiple
peer assessments with that of a single teacher assessment of group
process work. Asses Eval Higher Edu 26:139–152.
Margetson D. 1994. Current educational reform and the significance of
problem-based learning. Stud Higher Edu 19:5–19.
Mattheos N, Nattestad A, Falk-Nilsson E, Attstrom R. 2004. The interactive
examination: assessing students’ self-assessment ability. Med Edu
An analysis of peer, self, and tutor assessment
7/27/2019 assessment tutorial.pdf
http://slidepdf.com/reader/full/assessment-tutorialpdf 11/12
McLoughlin C, Luca J. 2004. An investigation of the motivational aspects of
peer and self assessment tasks to enhance teamwork outcomes.
Paper presented at the Proceedings of the 21st ASCILITE Conference ,
Perth, 5–8 December.
Miller PJ. 2003. The effect of scoring criteria specificity on peer and self
assessment. Asses Eval Higher Edu 28:383–394.
Minion DJ, Donnelly MB, Quick RC, Pulito A, Schwartz R. 2002. Are
multiple objective measures of student performance necessary? Am JSurg 183:663–665.
Nendaz MR, Tekian A. 1999. Assessment in problem-based learning
medical schools: a literature review. Teach Learn Med 11:232–243.
Neville AJ. 1998. The tutor in small-group problem-based learning: teacher?
Facilitator? Evaluator? Pedagogue 8:1–9.
Nichols JD, Steffi BE. 1999. An evaluation of success in an alternative
learning programme: motivational impact versus completion rate. Edu
Rev 51:207–219.
Norcini JJ. 2003. The metric of medical education. Peer assessment of
competence. Med Edu 37:539–543.
Norman G, Schmidt HG. 1992. The psychological basis of problem-based
learning: a review of the evidence. Acad Med 67:557–565.
Orsmond P, Merry S, Reiling K. 2000. The use of student derived
marking criteria in peer- and self-assessment. Asses Eval Higher Edu
25:23–38.Pajares F. 1996. Role of self-efficacy beliefs in the mathematical
problem-solving of gifted students. Contemporary Edu Psychol
21:325–344.
Papinczak T, Young L, Groves M. 2007. Peer-assessment in problem-based
learning: A qualitative study. Adv Health Scie Edu 12:169–186.
Pond K, ul-Haq R. 1997. Learning to assess students using peer review. Stud
Edu Eval 23:331–348.
Pope NK. 2005. The impact of stress in self- and peer-assessment. Asses
Eval Higher Edu 30:51–63.
Pressley M, McCormick CB. 1995. Advanced Educational Psychology for
Educators, Researchers and Policymakers (New York, Harper Collins
College Publishers).
Reiter HI, Eva KW, Hatala RM, Norman GR. 2002. Self and peer assessment
in tutorials: Application of a relative-ranking model. Acad Med
77:1134–1139.Rezler AG. 1989. Self-assessment in problem-based groups. Med Teach
11:151–156.
Rudy DW, Fejfar MC, Griffith CH, Wilson JF. 2001. Self and peer assessment
in a first-year communication and interviewing course. Eval Health
Profess 24:436–445.
Schwarzer R, Jerusalem M. 1995. Generalized Self-efficacy Scale (Windsor,
UK, Nfer-Nelson).
Searby M, Ewers T. 1997. An evaluation of the use of peer assessment in
higher education: A case study in the school of music. Asses Eval
Higher Edu 22:371–383.
Segers M, Dochy F. 2001. New assessment forms in problem-based
learning: The value-added of the students’ perspective. Stud Higher Edu
26:327–343.Sluijmans D, Dochy F, Moerkerke G. 1999. Creating a learning
environment by using self-, peer-, and co-assessment. Learn Environ
Res 1:293–319.
Sluijmans DMA, Moerkerke G, van Merrienboer JJG, Dochy FJRC. 2001.
Peer assessment in problem-based learning. Stud Edu Eval 27:153–173.
Stefani LAJ. 1992. Comparison of collaborative self, peer and tutor
assessment in a biochemistry practical. Biochem Edu 20:148–151.
Sullivan ME, Hitchcock MA, Dunnington GL. 1999. Peer and self assessment
during problem-based tutorials. Am J Surg 177:266–269.
Swanson DB, Case SM, van der Vleuten CPM. 1997. Strategies for student
assessment. In: D Boud & G Feletti (Eds), The Challenge of Problem-
Based Learning , pp. 269–282 (London, Kogan Page).
Tousignant M, DesMarchais JE. 2002. Accuracy of student self-assessment
ability compared to their own performance in a problem-based learning
medical program: a correlation study. Adv Health Sci Edu 7:19–27. Van Rosendaal GMA, Jennett PA. 1992. Resistance to peer evaluation in an
internal medicine residency. Acad Med 67:63.
Ward M, Gruppen L, Regehr G. 2002. Measuring self-assessment: current
state of the art. Adv Health Sci Edu 7:63–80.
Whitfield CF, Xie SX. 2002. Correlation of problem-based learning
facilitators’ scores with student performance on written exams. Adv
Health Sci Edu Theory and Pract 7:41–51.
Willis SC, Jones A, Bundy C, Burdett K, Whitehouse CR, O’Neill PA. 2002.
Small-group work and assessment in a PBL curriculum: a qualitative
and quantitative evaluation of student perceptions of the process of
working in small groups and its assessment. Med Teacher 24:495–501.
Woolliscroft JO, Tenhaken J, Smith J, Calhoun JG. 1993. Medical students’
clinical self-assessments: comparisons with external measures of
performance and the students’ self-assessments of overall performance
and effort. Acad Med 68:285–294.Zimmerman BJ. 2000. Self-efficacy: an essential motive to learn. Contemp
Edu Psychol 25:82–91.
Zimmerman BJ, Bandura A, Martinez-Pons M. 1992. Self-motivation for
academic attainment: the role of self-efficacy beliefs and personal goal
setting. Am Edu Res J 29:663–676.
T. Papinczak et al.

7/27/2019 assessment tutorial.pdf
http://slidepdf.com/reader/full/assessment-tutorialpdf 12/12