


Languages
Pages
Legal

Shellfish Future 2014
Peter Kube (CSIRO)Mike Dove (NSW DPI)
Matthew Cunningham (ASI)Xingnian Gu(NSW DPI)
Wayne O’Connor (NSW DPI)Peter Kirkland (NSW DPI)
Nick Elliott (CSIRO)
Todays topics
POMS R&D and POMS breeding levy
What we have done so far, what you need to know and the next steps
POINT #1:
There is genetic variation for POMS resistance
in ASI population

FIELD CHALLENGE NOV 2012JUVENILES (AGE 12 MONTHS)
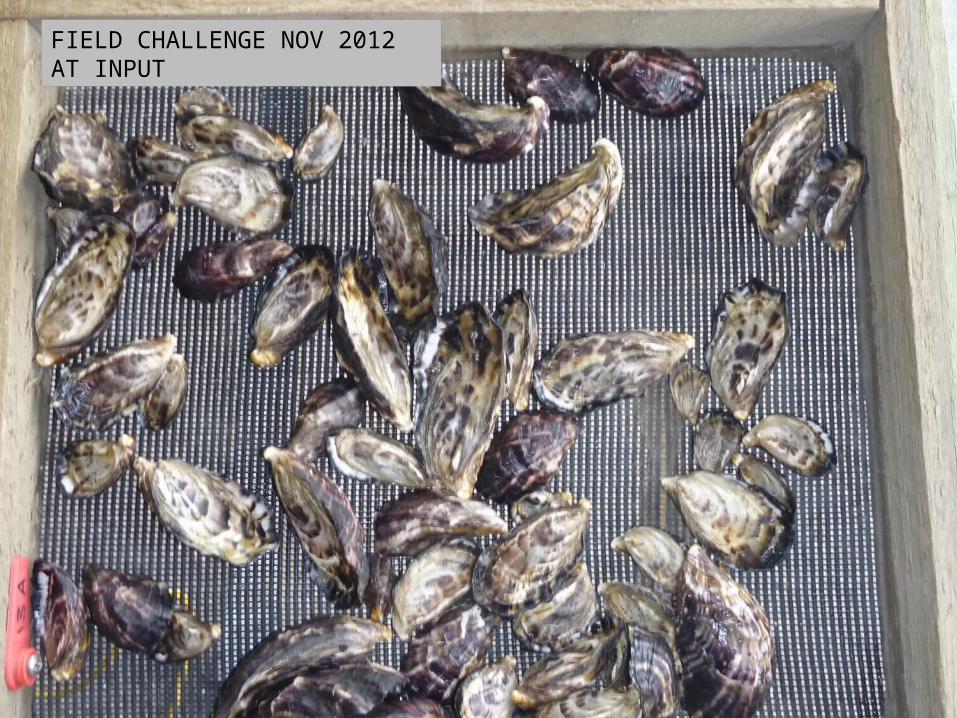
FIELD CHALLENGE NOV 2012AT INPUT
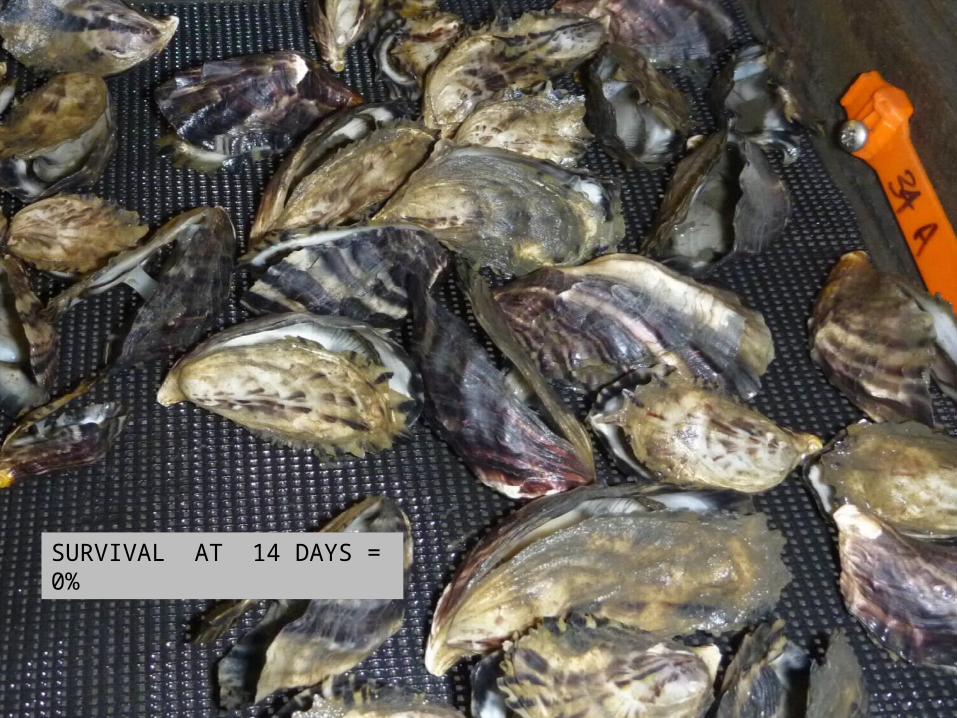
SURVIVAL AT 14 DAYS = 0%

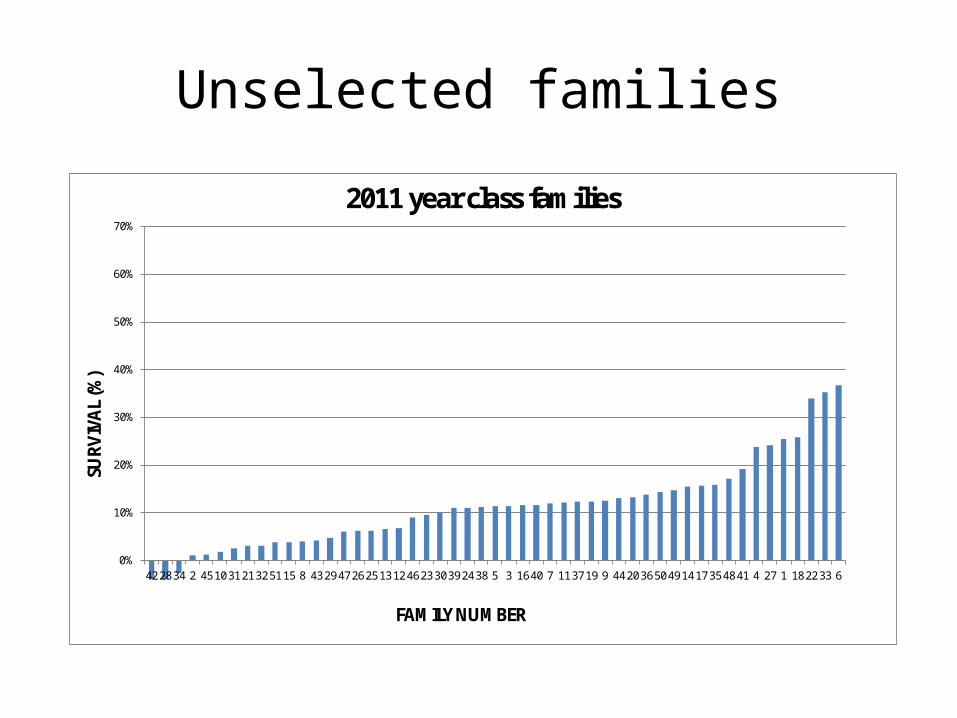
2% 2% 0%
0%
0%
3%3%
3%2%
0% 3% 25%
8%52% 5%
0%
10%
20%
30%
40%
50%
60%
70%
42 28 34 2 45 10 31 21 32 51 15 8 43 29 47 26 25 13 12 46 23 30 39 24 38 5 3 16 40 7 11 37 19 9 44 20 36 50 49 14 17 35 48 41 4 27 1 18 22 33 6
SURV
IVA
L (%
)
FAMILY NUMBER
2011 year class families
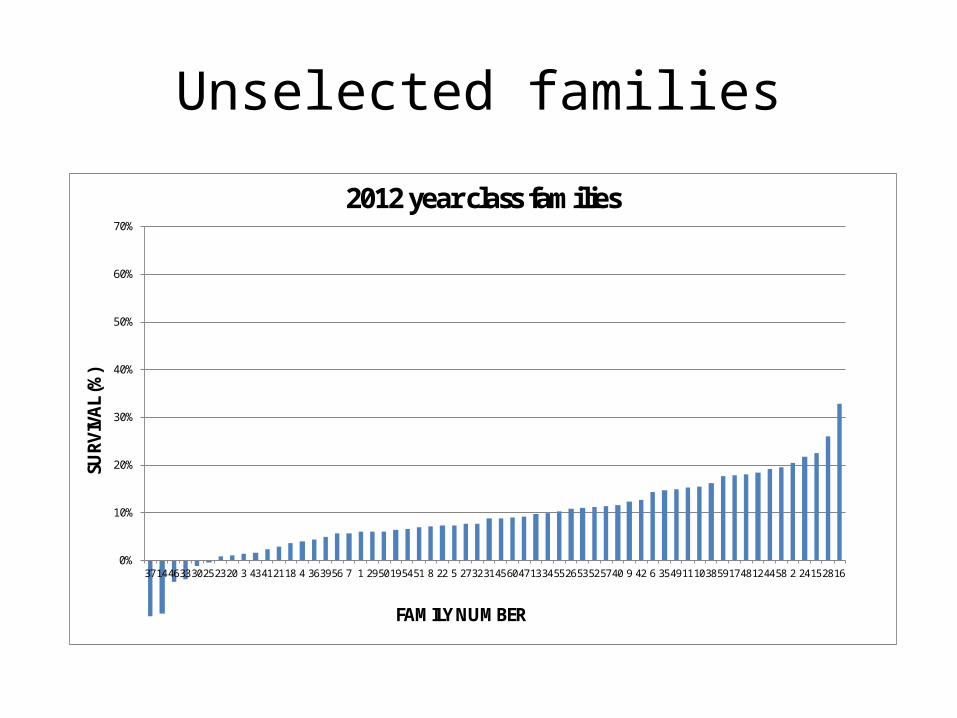
Unselected families
0%
10%
20%
30%
40%
50%
60%
70%
3714463330252320 3 43412118 4 363956 7 1 2950195451 8 22 5 2732314560471334552653525740 9 42 6 3549111038591748124458 2 24152816
SURV
IVA
L (%
)
FAMILY NUMBER
2012 year class families
Unselected families
0%
10%
20%
30%
40%
50%
60%
70%
36 78 4 8 12 67 66 51 68 80 28 6 39 37 69 77 3 71 76 32 70 16 14 7 46 59 48 44 86 43 74 58 2 64 56 61 84 60 63 40 53 13 20 52 15 83 31 9 27 45
SURV
IVA
L (%
)
FAMILY NUMBER
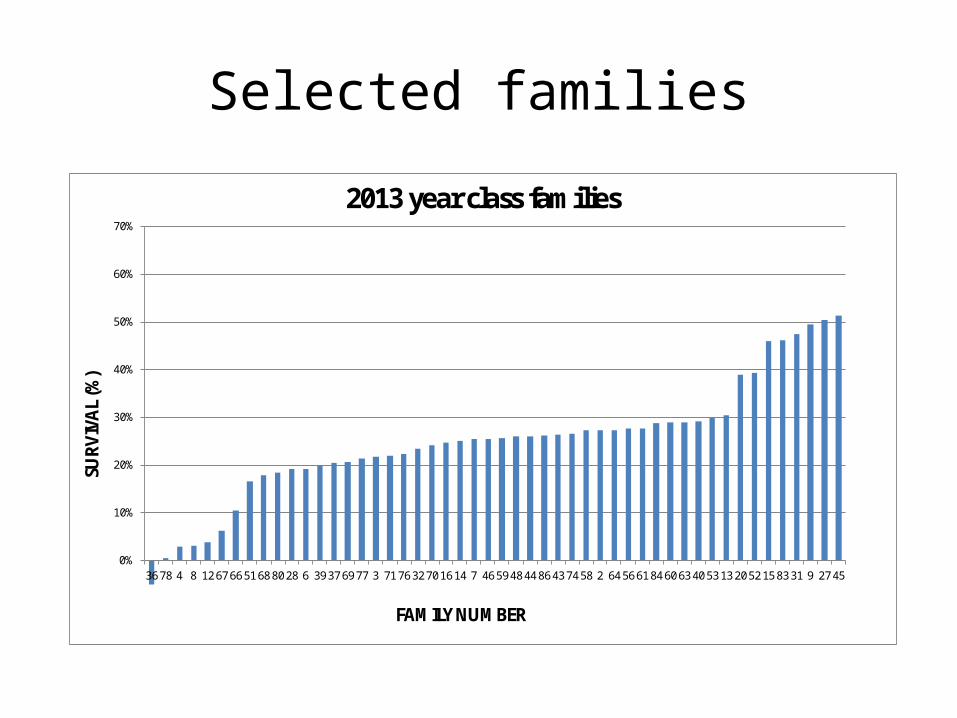
2013 year class families
Selected families
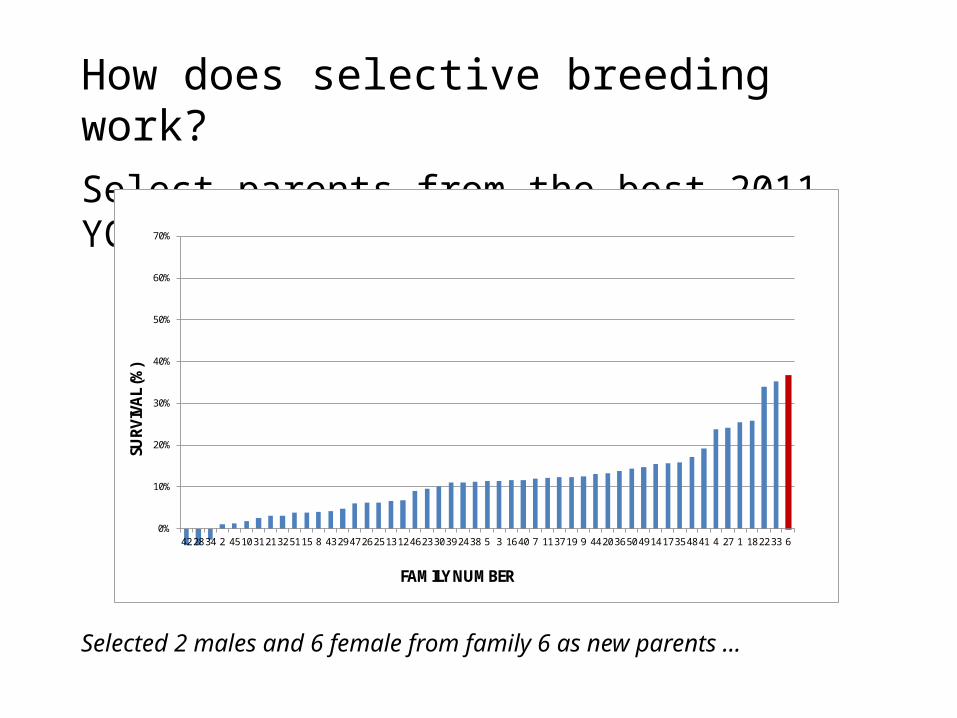
How does selective breeding work?Select parents from the best 2011 YC families …
0%
10%
20%
30%
40%
50%
60%
70%
42 28 34 2 45 10 31 21 32 51 15 8 43 29 47 26 25 13 12 46 23 30 39 24 38 5 3 16 40 7 11 37 19 9 44 20 36 50 49 14 17 35 48 41 4 27 1 18 22 33 6
SURV
IVA
L (%
)
FAMILY NUMBER
Selected 2 males and 6 female from family 6 as new parents …
0%
10%
20%
30%
40%
50%
60%
70%
36 78 4 8 12 67 66 51 68 80 28 6 39 37 69 77 3 71 76 32 70 16 14 7 46 59 48 44 86 43 74 58 2 64 56 61 84 60 63 40 53 13 20 52 15 83 31 9 27 45
SURV
IVA
L (%
)
FAMILY NUMBER
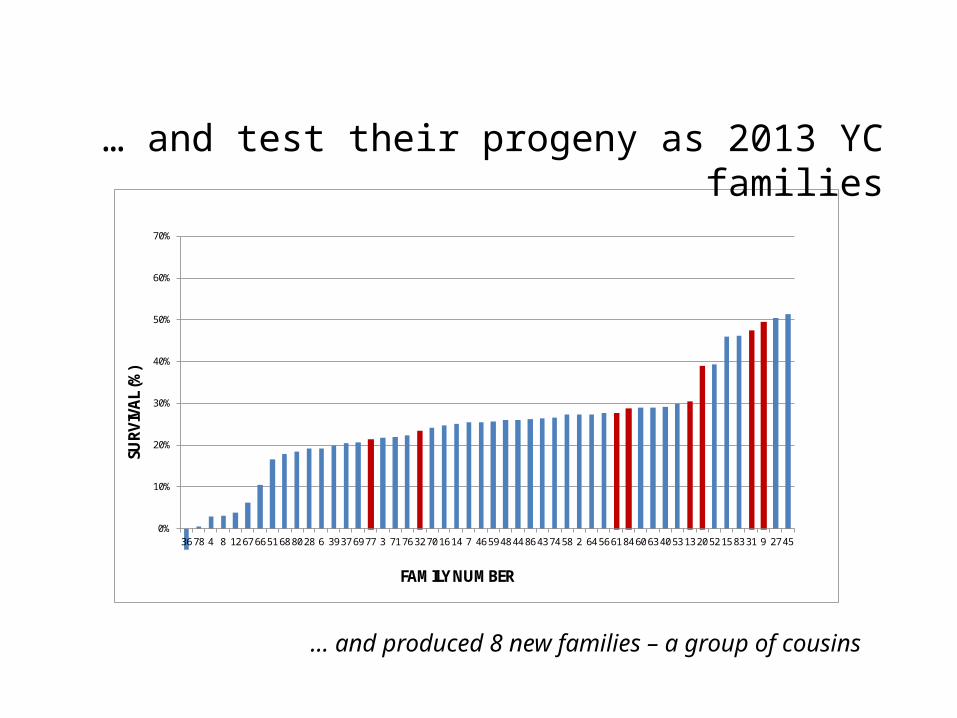
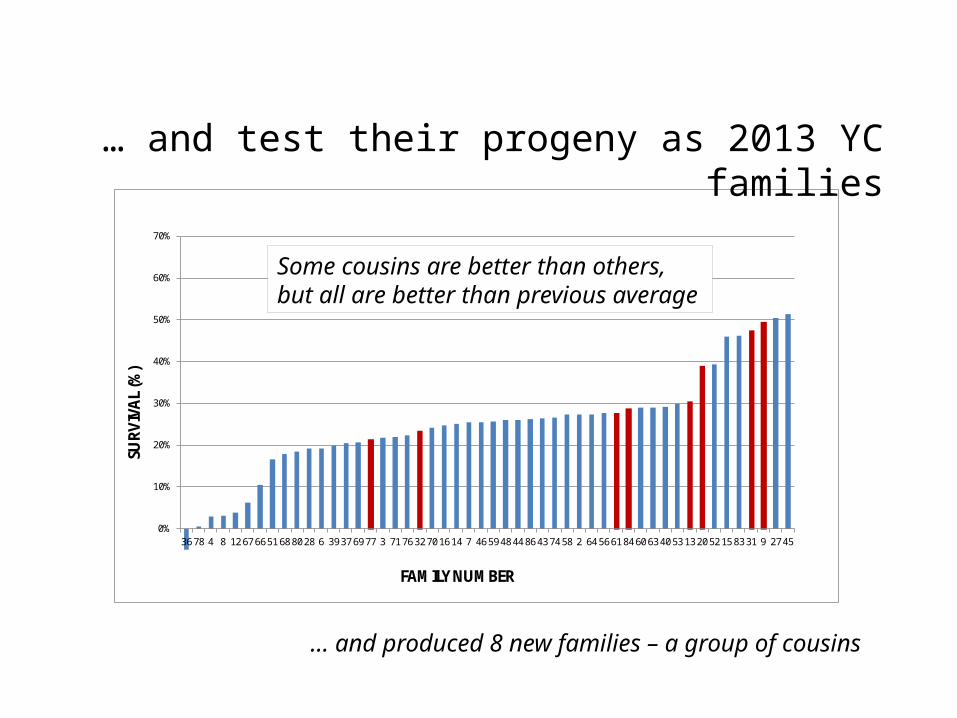
… and test their progeny as 2013 YC families
… and produced 8 new families – a group of cousins
0%
10%
20%
30%
40%
50%
60%
70%
36 78 4 8 12 67 66 51 68 80 28 6 39 37 69 77 3 71 76 32 70 16 14 7 46 59 48 44 86 43 74 58 2 64 56 61 84 60 63 40 53 13 20 52 15 83 31 9 27 45
SURV
IVA
L (%
)
FAMILY NUMBER
… and test their progeny as 2013 YC families
… and produced 8 new families – a group of cousins
Some cousins are better than others, but all are better than previous average

We are starting to understand the basis for genetic resistance to POMS
• Quantitative trait
• Moderately to highly heritable (h2 = 0.4)
• Spat and juvenile resistance correlated
• How best to measure it
POINT #2:
A laboratory challenge will be the basis for selection
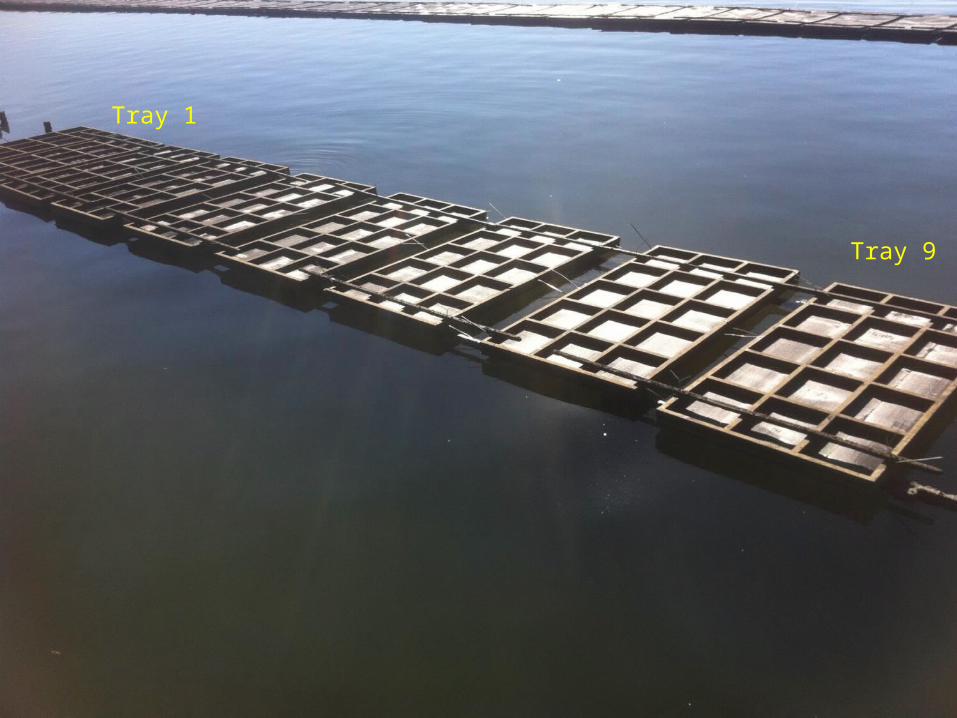
Tray 1
Tray 9
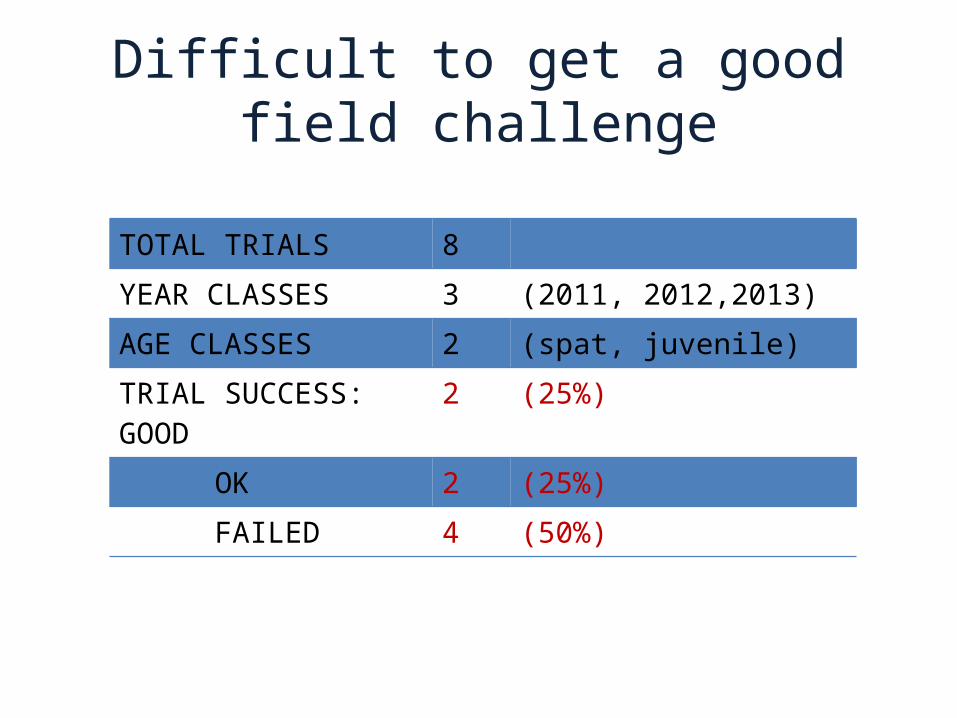
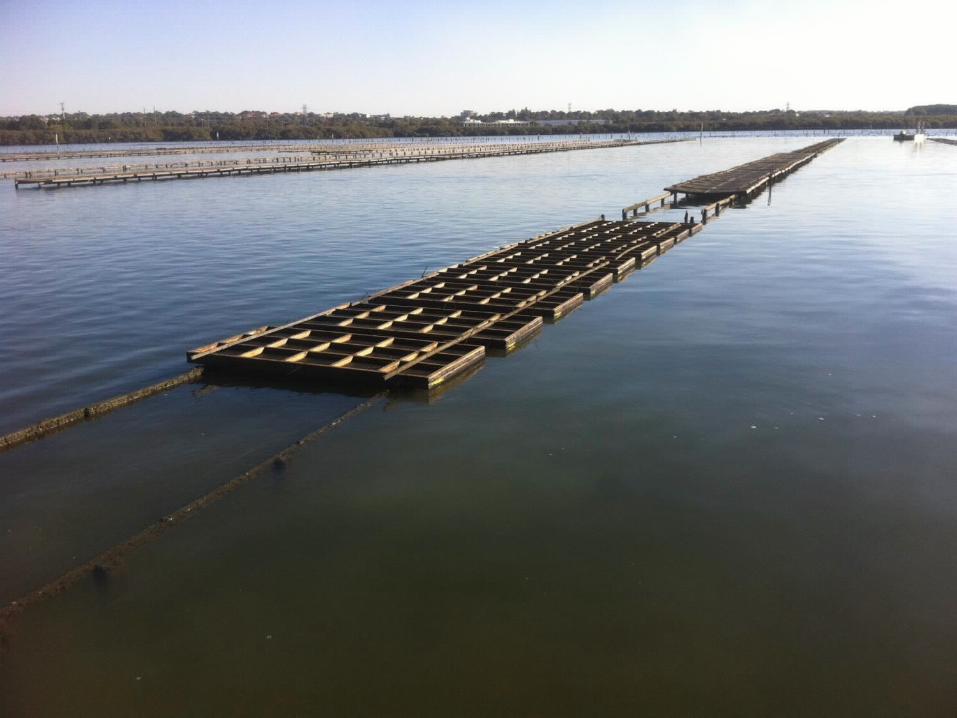
Difficult to get a good field challenge
TOTAL TRIALS 8YEAR CLASSES 3 (2011, 2012,2013)AGE CLASSES 2 (spat, juvenile)TRIAL SUCCESS: GOOD 2 (25%)
OK 2 (25%)FAILED 4 (50%)

The Problems with Field Challenges
• High risk of complete or partial failure
• No control over timing
• Expensive to run
• Inherently variable
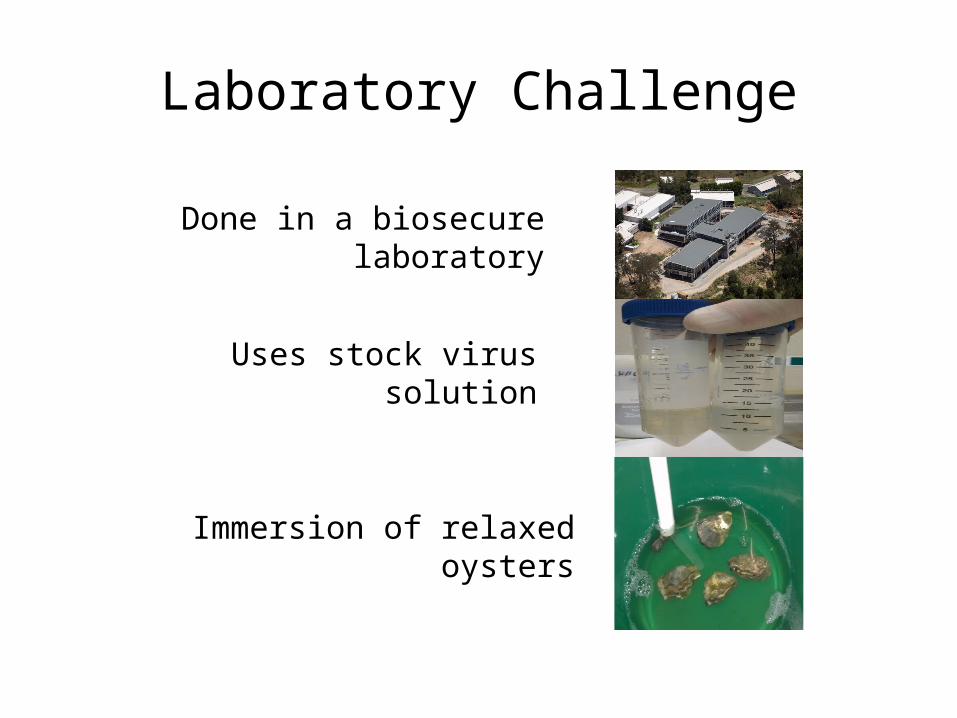
Laboratory Challenge
Done in a biosecure laboratory
Uses stock virus solution
Immersion of relaxed oysters

FAMILY_ID Low dose2013004 0%2013008 0%
… …
2013006 83%2013084 93%2013032 93%2013076 100%2013077 100%
… …
2013040 100%
… …2013074 100%2013020 100%2013052 100%2013083 100%2013031 100%
… …
2013027 100%2013045 100%
SURVIVAL IN A LAB CHALLENGE
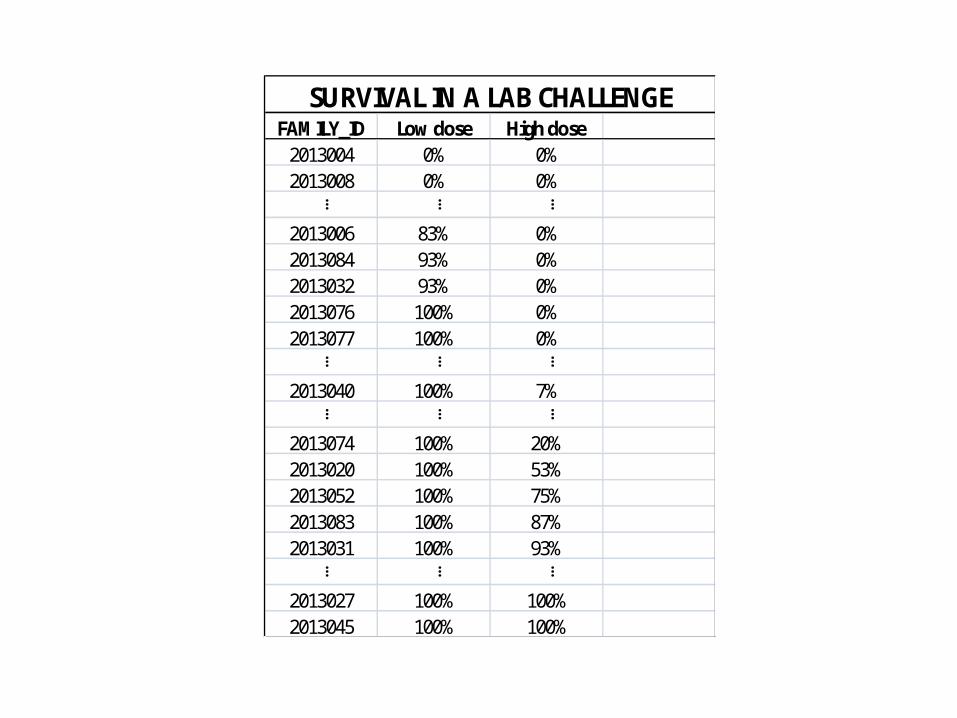
FAMILY_ID Low dose High dose2013004 0% 0%2013008 0% 0%
… … …
2013006 83% 0%2013084 93% 0%2013032 93% 0%2013076 100% 0%2013077 100% 0%
… … …
2013040 100% 7%
… … …
2013074 100% 20%2013020 100% 53%2013052 100% 75%2013083 100% 87%2013031 100% 93%
… … …
2013027 100% 100%2013045 100% 100%
SURVIVAL IN A LAB CHALLENGE
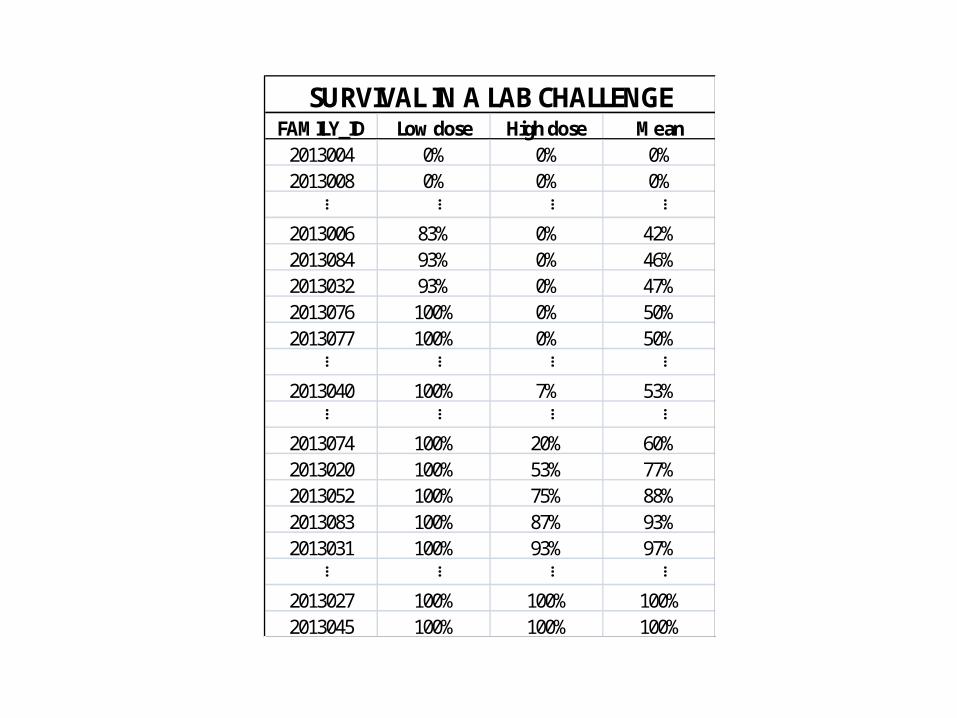
FAMILY_ID Low dose High dose Mean2013004 0% 0% 0%2013008 0% 0% 0%
… … … …
2013006 83% 0% 42%2013084 93% 0% 46%2013032 93% 0% 47%2013076 100% 0% 50%2013077 100% 0% 50%
… … … …
2013040 100% 7% 53%
… … … …
2013074 100% 20% 60%2013020 100% 53% 77%2013052 100% 75% 88%2013083 100% 87% 93%2013031 100% 93% 97%
… … … …
2013027 100% 100% 100%2013045 100% 100% 100%
SURVIVAL IN A LAB CHALLENGE
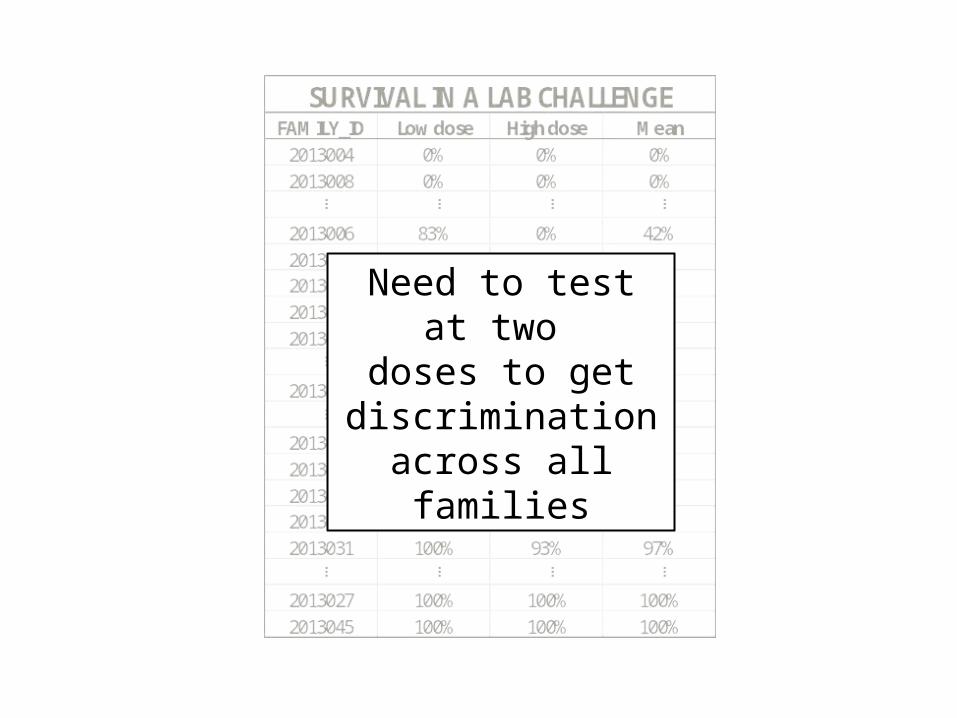
Need to test at two doses to get
discrimination across all families
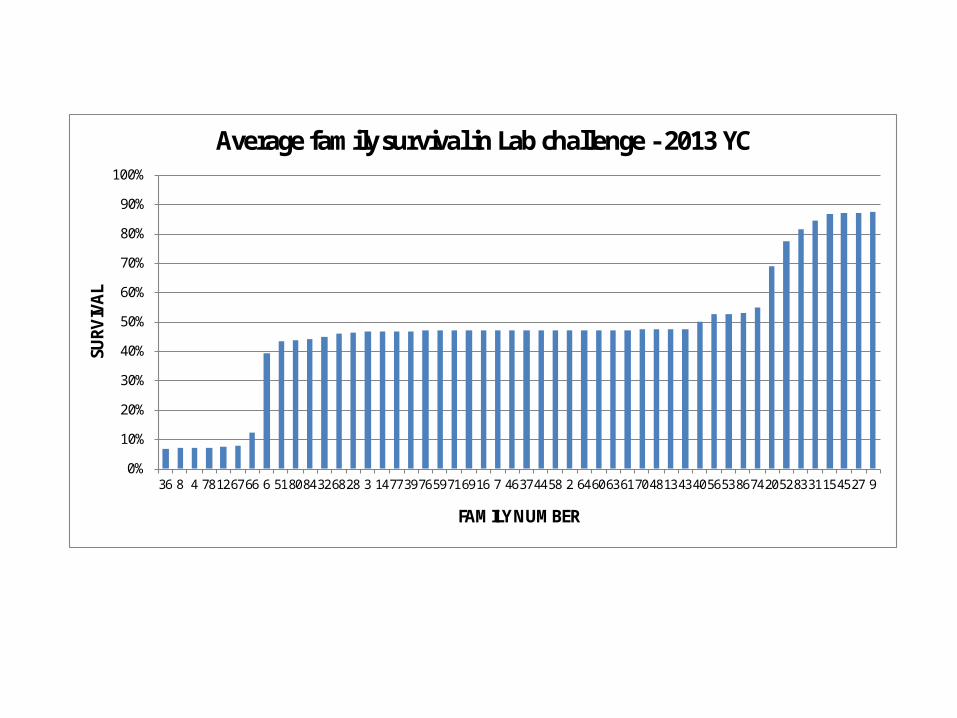
0%
10%
20%
30%
40%
50%
60%
70%
80%
90%
100%
36 8 4 78126766 6 518084326828 3 1477397659716916 7 46374458 2 6460636170481343405653867420528331154527 9
SURV
IVA
L
FAMILY NUMBER
Average family survival in Lab challenge - 2013 YC
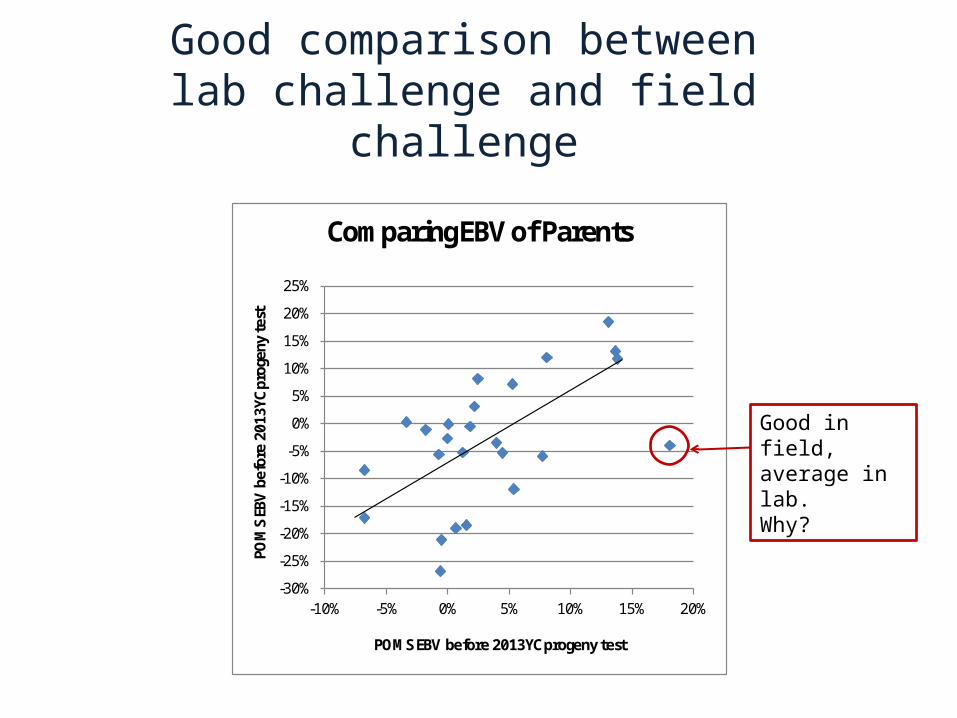
Good comparison betweenlab challenge and field challenge
-30%
-25%
-20%
-15%
-10%
-5%
0%
5%
10%
15%
20%
25%
-10% -5% 0% 5% 10% 15% 20%
POM
S EB
V b
efor
e 20
13YC
pro
geny
tes
t
POMS EBV before 2013YC progeny test
Comparing EBV of Parents
Good in field, average in lab.Why?

POINT #3:
Selective breeding can provide a fix
(but not an instant fix)
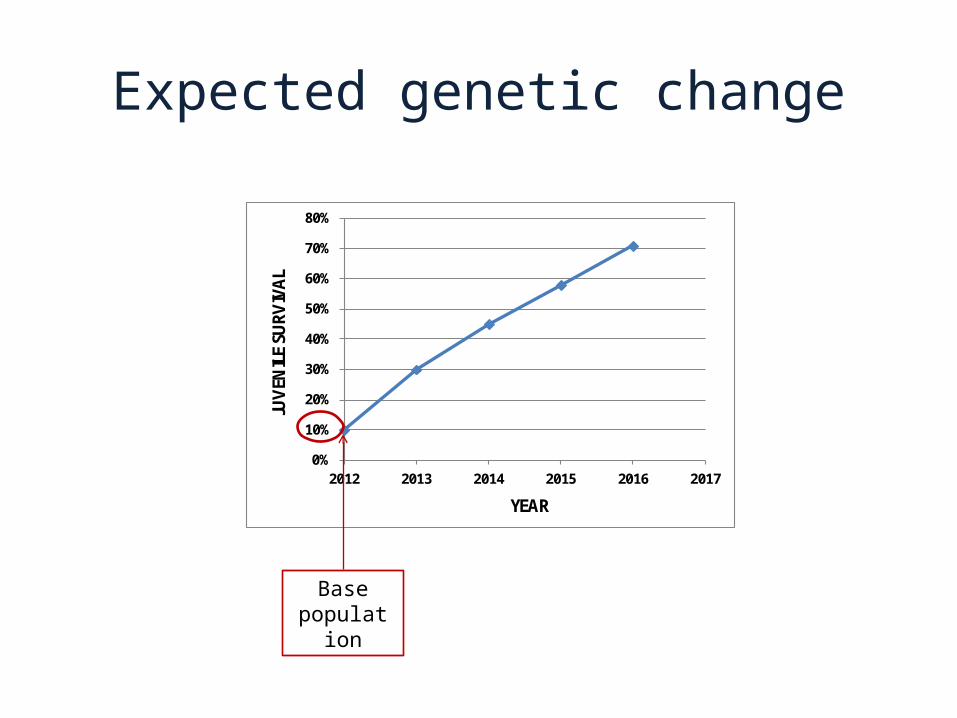
Expected genetic change
0%
10%
20%
30%
40%
50%
60%
70%
80%
2012 2013 2014 2015 2016 2017
JUV
ENIL
E SU
RVIV
AL
YEAR
Base population
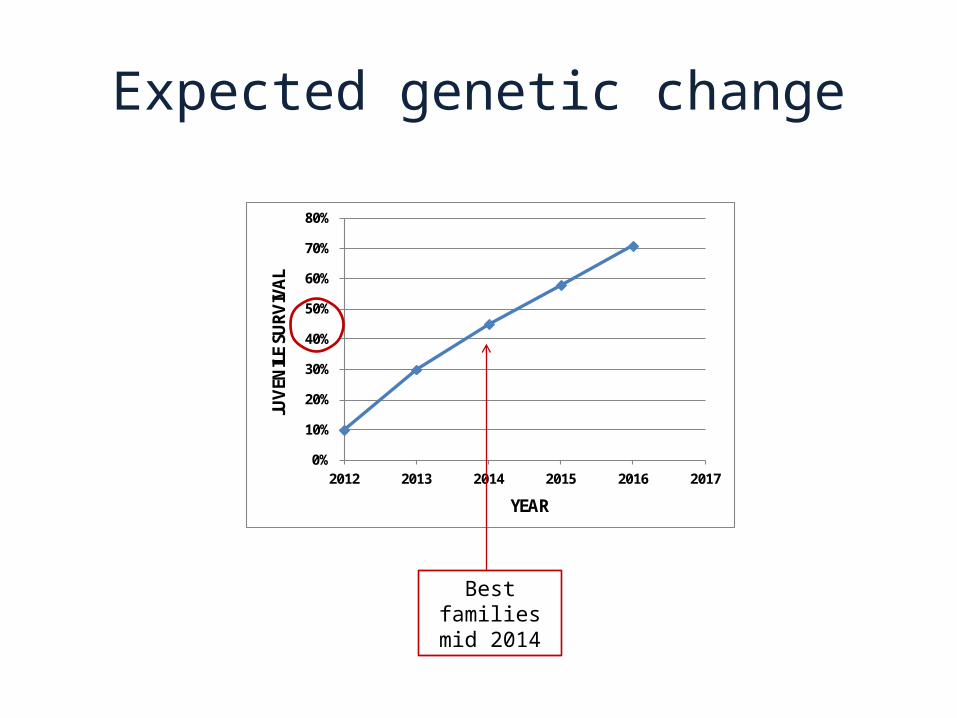
Expected genetic change
0%
10%
20%
30%
40%
50%
60%
70%
80%
2012 2013 2014 2015 2016 2017
JUV
ENIL
E SU
RVIV
AL
YEAR
Best families mid 2014

Expected genetic change
0%
10%
20%
30%
40%
50%
60%
70%
80%
2012 2013 2014 2015 2016 2017
JUV
ENIL
E SU
RVIV
AL
YEAR
Target for mid 2016
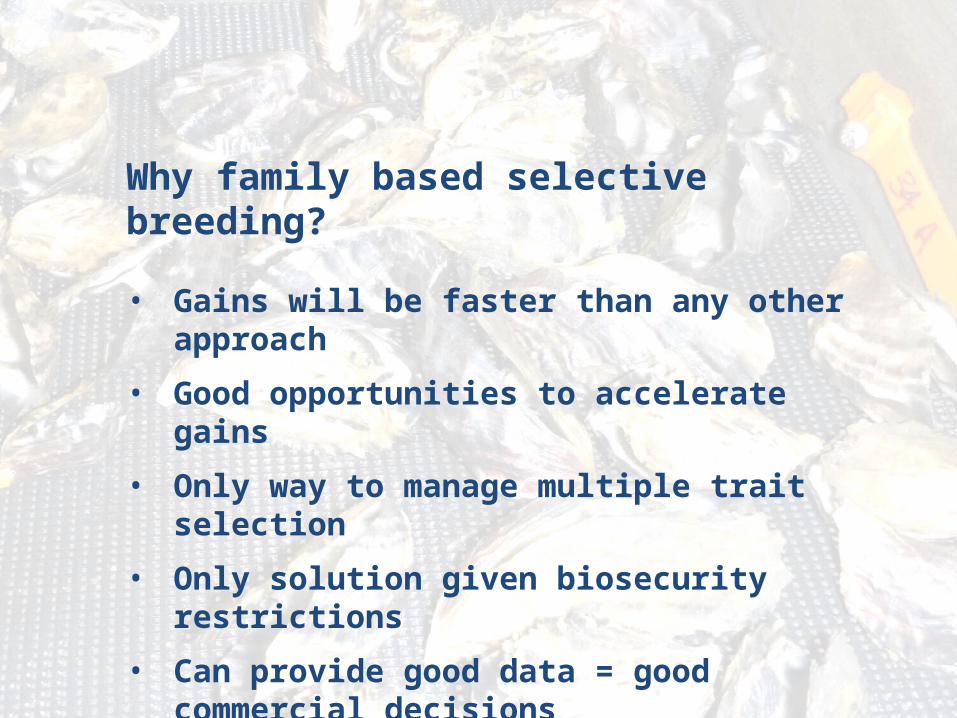
Why family based selective breeding?
• Gains will be faster than any other approach
• Good opportunities to accelerate gains
• Only way to manage multiple trait selection
• Only solution given biosecurity restrictions
• Can provide good data = good commercial decisions

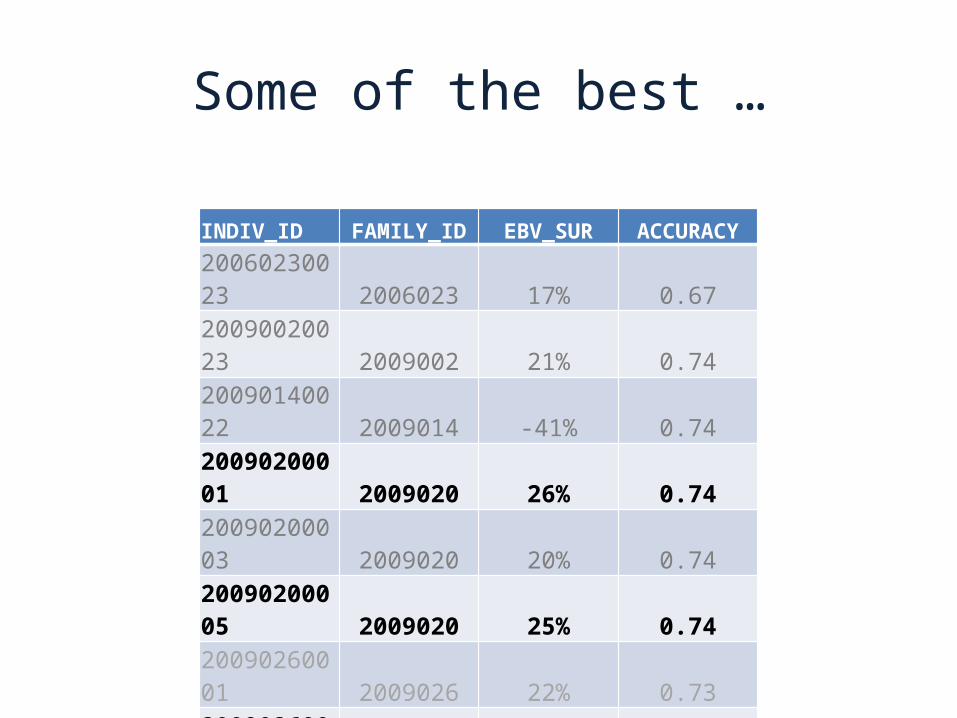
INDIV_ID FAMILY_ID EBV_SUR ACCURACY
20060230023 2006023 17% 0.67
20090020023 2009002 21% 0.74
20090140022 2009014 -41% 0.74
20090200001 2009020 26% 0.74
20090200003 2009020 20% 0.74
20090200005 2009020 25% 0.74
20090260001 2009026 22% 0.73
20090260021 2009026 30% 0.74
20090270002 2009027 30% 0.74
20090270021 2009027 30% 0.74
20100330001 2010033 -40% 0.73
Use Estimated Breeding Values for breeding decisions
INDIV_ID FAMILY_ID EBV_SUR ACCURACY
20060230023 2006023 17% 0.67
20090020023 2009002 21% 0.74
20090140022 2009014 -41% 0.74
20090200001 2009020 26% 0.74
20090200003 2009020 20% 0.74
20090200005 2009020 25% 0.74
20090260001 2009026 22% 0.73
20090260021 2009026 30% 0.74
20090270002 2009027 30% 0.74
20090270021 2009027 30% 0.74
20100330001 2010033 -40% 0.73
Some of the best …

What can selective breeding deliver in the medium term?
1. Selective breeding alone will not provide a solution to POMS
2. Useful levels of resistance are expected in juveniles by mid 2016
3. Given the time required for commercial scale-up, this stock won’t be available until 2018 at the earliest (as diploid)
4. Timelines to obtain resistant spat and resistant triploids are uncertain, but will be significantly longer
5. A medium term solution is expected from a combination of resistant stock and changed husbandry practices
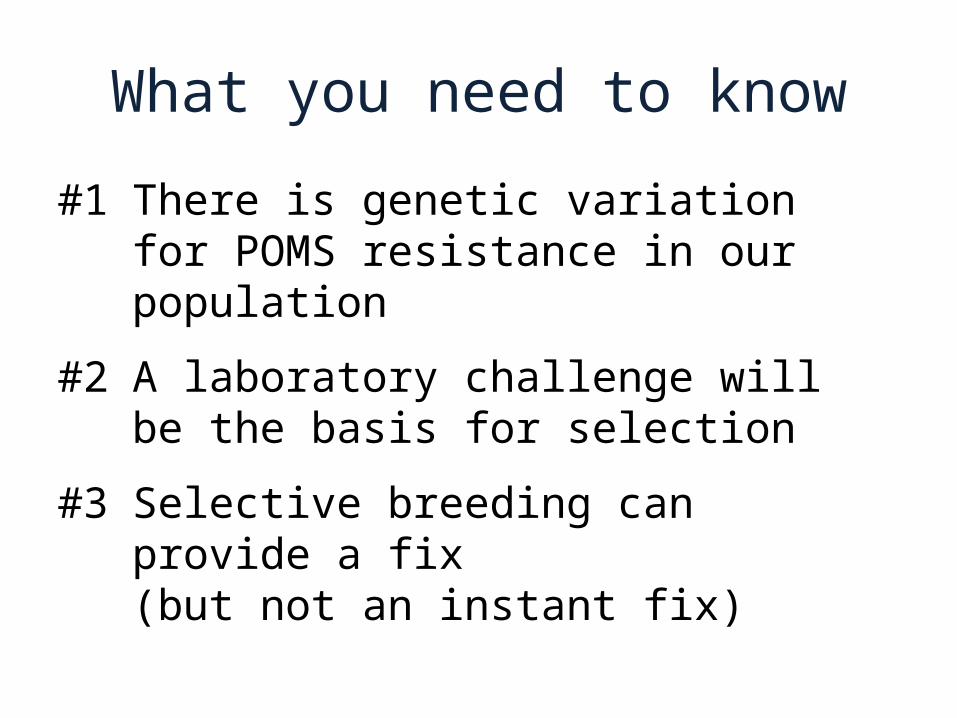
What you need to know
#1 There is genetic variation for POMS resistance in our population
#2 A laboratory challenge will be the basis for selection
#3 Selective breeding can provide a fix (but not an instant fix)
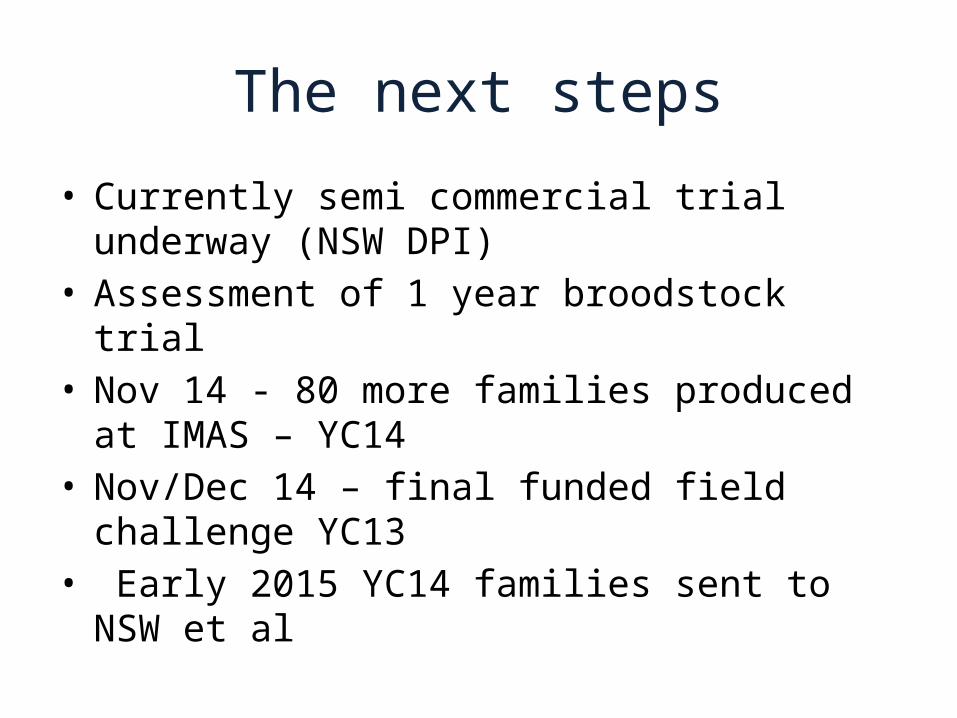
The next steps
• Currently semi commercial trial underway (NSW DPI)• Assessment of 1 year broodstock trial• Nov 14 - 80 more families produced at IMAS – YC14• Nov/Dec 14 – final funded field challenge YC13• Early 2015 YC14 families sent to NSW et al
Acknowledgements
• The POMS trial site was provided by Drakes Oysters and this work could not have been done without the assistance of Bob Drake, Ted Drake and Len Drake
• Richard Whittington and Ika Paul-Pont (University of Sydney) have shared their knowledge and experience
• This work was made possible by the support of Oysters Australia and with funding assistance by the Seafood CRC
• Calvert, Poke, Dyke, Lockwood, Zippel, Schutz, Giedra, Marine Culture and Shellfish Culture

POMS levy
• R&D mostly done• What do we want do with it and how?• Industry indicated they wanted to build on R&D• Business plan developed in consultation with
stakeholders• Application made to ACCC for $2.80/thousand levy• Tas and SA regional grower meetings• Overwhelming support
POMS levy
• ACCC have granted interim approval• Hatcheries have signed deed of agreement• Start date 13th October• Sales data provided to independent person• Removes reference to hatchery and provides to ASI• ASI sends invoice
Next steps
• Appointment of new board• Constitutional review• Establishment of industry reference group………..Breed a POMS resistant oyster!!!
Top Related