


Languages
Pages
Legal


12
Applications of Fiber Optic Coupled-Grazing Angle Probe Reflection-Absorption
FTIR Spectroscopy
Oliva M. Primera-Pedrozo, Leonardo C. Pacheco-Londoño and Samuel P. Hernandez-Rivera
ALERT DHS Center of Excellence for Explosives Center for Chemical Sensors Development
Department of Chemistry University of Puerto Rico-Mayagüez PO Box 9000, Mayagüez, PR, 00681
Puerto Rico
1. Introduction
The recent increase in attention of detection of chemical threats, explosives and narcotics has led to the development of instruments and sensors that can be effective in a variety of operating environments. Various approaches can be used for in situ analysis of explosives, including the widely used technique, Ion Mobility Spectrometry (IMS). The major advantages of IMS are its sensitivity in the picogram range, its continuous real time monitoring capability, its reasonable price due to instrumental simplicity and the ease of automation (Salleras, 1995). A main disadvantage of IMS is its limited linear range and that it cannot be used for quantitative analysis (Salleras, 1995). It is relatively easy to overload an IMS and, therefore, sample size must be controlled with care (Brambilla, 1997). Another weakness is the response variation that occurs with different background gas compositions and with different sample compositions (Salleras, 1995). However, spectroscopic techniques have the potential to afford the best selectivity for explosives. The infrared spectra of molecules can provide an information-rich fingerprint that allows for near unambiguous identification. A few years ago, direct detection by infrared absorption spectroscopy was not possible because of the limited sensitivity of this method. Fourier Transform Infrared Reflection Absorption Spectroscopy (IRRAS), operating at the grazing-angle, is the most sensitive optical absorption technique available for measuring low concentrations of chemical compounds adhered to reflective surfaces such as metals (Griffiths, 1986). The disadvantage of conventional spectroscopic techniques for applications such as explosives detection is that the test materials must be placed physically within the spectrometer’s sample compartment for measurement. FT-IRRAS combined with grazing angle probe (GAP) can now be used outside the boundaries of the sample compartment. Fiber-optic cables (FOCs) that transmit in the mid-IR (MIR) range have made it possible to develop a range of spectroscopic probes for in situ analysis (Melling, 2001; Melling, 2002; Mehta, 2003; Bacci, 2001). Thus, FTIR spectroscopy can now be effectively used outside the confinement
www.intechopen.com

Fourier Transforms - New Analytical Approaches and FTIR Strategies
228
of the sample compartment, making it available for field work (Mizaikoff, 2002). The attractive features of this technique include portability, simple design and rugged design, high sensitivity and short analysis time. These features lead to potential uses of Mid FTIR for airport screening and within the military. Sample preparation methodology constitutes a critical a step in the detection scheme pursed because a uniformly covered, thin film is needed for preparation of the standard samples on which precision relies on. Several approaches have been used in the lab for sample preparation including: standard preparation using an airbrush aerosol spray, sample smearing and direct transfer from solutions using micropipettes (Primera-Pedrozo, 2004). In
the smearing method 20 μL aliquots of standard solutions were deposited over the plate then the solution is spread using a Teflon sheet. Smearing transfer method has led to detect TATP over stainless steel surface. This transfer method let to detect and quantify TATP for first time on metallic surfaces. Despite the fact of tendency towards sublimation of TATP, a limiting value of 8 µg/cm2 could be detected. Samples ranging from micrograms/cm2 to nanograms/cm2 of 2,6-dinitrotuelene (DNT), 2,4,6-trinitrotoluene (TNT), pentaerythritol tetranitrate (PETN), nitroglycerine (NG) and triacetone triperoxide (TATP) have been detected using this new method of deposition. A smearing deposition was used for depositing the target explosives over substrates to be used as standards. The sample transfer method gave good sample distribution, reduced sample loss on transfer and was easy to manipulate giving good reproducible distributions (Primera-Pedrozo, 2004; Primera-Pedrozo, 2009; Primera-Pedrozo, 2010; Pacheco-Londoño, 2010). Although, the smearing technique has given good results for explosives detection, many samples are needed for sample preparation transfer method because it depends on human error since the sample is placed using a piece of Teflon sheet and is distributed with the hands on the surface and sometimes good distribution is not found. In this case other samples have to be prepared. Another disadvantage of this transfer method is solvent interference since various solvents are adhered to the stainless steel plated producing poor distribution of the material over the surfaces. The use of slow evaporating solvents makes the sample preparation more complicated. For these reasons the development of an automatic method for explosives transfers on the surfaces must be devised. Thermal ink jet (TIJ) was selected as transfer technique to avoid human errors during preparation of standards and to decrease the time for sample preparation. In thermal ink jet a thin film resistor superheats less that 0.5% of the fluid in the chamber to form a gas bubble. This bubble rapidly expands (less than ten microseconds) and forces a drop to be ejected through an orifice (Beeson, 1998). When comparing the inkjet based method of sample transfer to the smearing method used in previous works (Primera-Pedrozo, 2004), the former has notable advantages. The loading concentration of the sample on the surface can be controlled by varying parameters such as: number of passes, dispensing frequency, applied energy, and pen architecture. Precise delivery of the number of droplets with known volume and concentration controls the mass deposited. Also only one solution needs to be used, avoiding dilutions that can increase the analytical errors.
2. Description of methodology
FOC-GAP FTIR spectroscopy has made possible to develop new methods for detection of traces of chemical compounds on surfaces. Thermal inkjet (TIJ) technology is able to deposit very small amounts of chemical compounds, including energetic materials, in a specific
www.intechopen.com
Applications of Fiber Optic Coupled-Grazing Angle Probe Reflection-Absorption FTIR Spectroscopy
229
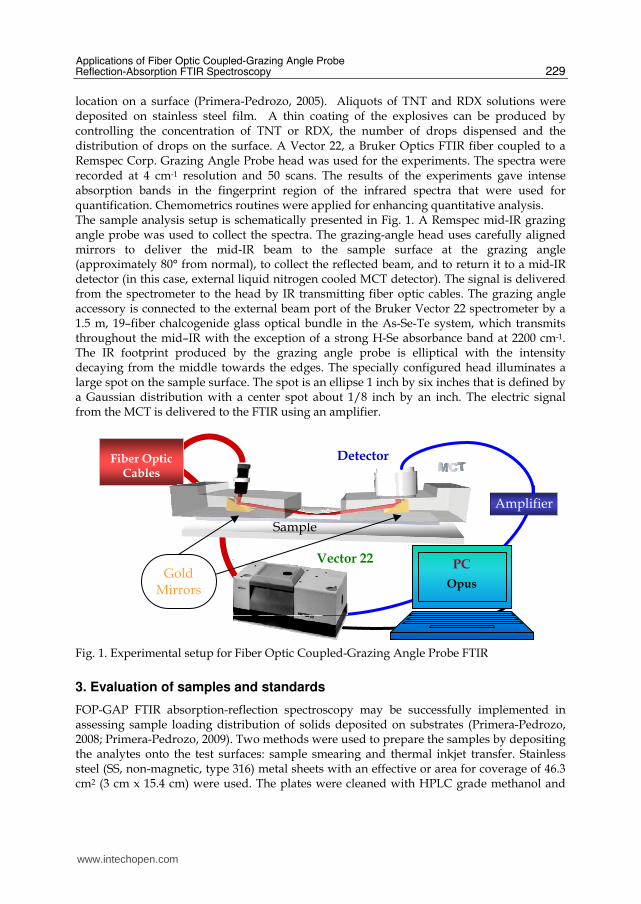
location on a surface (Primera-Pedrozo, 2005). Aliquots of TNT and RDX solutions were deposited on stainless steel film. A thin coating of the explosives can be produced by controlling the concentration of TNT or RDX, the number of drops dispensed and the distribution of drops on the surface. A Vector 22, a Bruker Optics FTIR fiber coupled to a Remspec Corp. Grazing Angle Probe head was used for the experiments. The spectra were recorded at 4 cm-1 resolution and 50 scans. The results of the experiments gave intense absorption bands in the fingerprint region of the infrared spectra that were used for quantification. Chemometrics routines were applied for enhancing quantitative analysis. The sample analysis setup is schematically presented in Fig. 1. A Remspec mid-IR grazing angle probe was used to collect the spectra. The grazing-angle head uses carefully aligned mirrors to deliver the mid-IR beam to the sample surface at the grazing angle (approximately 80° from normal), to collect the reflected beam, and to return it to a mid-IR detector (in this case, external liquid nitrogen cooled MCT detector). The signal is delivered from the spectrometer to the head by IR transmitting fiber optic cables. The grazing angle accessory is connected to the external beam port of the Bruker Vector 22 spectrometer by a 1.5 m, 19–fiber chalcogenide glass optical bundle in the As-Se-Te system, which transmits throughout the mid–IR with the exception of a strong H-Se absorbance band at 2200 cm-1. The IR footprint produced by the grazing angle probe is elliptical with the intensity decaying from the middle towards the edges. The specially configured head illuminates a large spot on the sample surface. The spot is an ellipse 1 inch by six inches that is defined by a Gaussian distribution with a center spot about 1/8 inch by an inch. The electric signal from the MCT is delivered to the FTIR using an amplifier.
Fig. 1. Experimental setup for Fiber Optic Coupled-Grazing Angle Probe FTIR
3. Evaluation of samples and standards
FOP-GAP FTIR absorption-reflection spectroscopy may be successfully implemented in assessing sample loading distribution of solids deposited on substrates (Primera-Pedrozo, 2008; Primera-Pedrozo, 2009). Two methods were used to prepare the samples by depositing the analytes onto the test surfaces: sample smearing and thermal inkjet transfer. Stainless steel (SS, non-magnetic, type 316) metal sheets with an effective or area for coverage of 46.3 cm2 (3 cm x 15.4 cm) were used. The plates were cleaned with HPLC grade methanol and
Amplifier
Fiber Optic Cables
Detector
Sample
Vector 22 PC
OpusGold
Mirrors
www.intechopen.com

Fourier Transforms - New Analytical Approaches and FTIR Strategies
230
air-dried at room temperature before the experiments. Aliquots of 20 μL of standard solutions were placed at one side of the SS plate. A Teflon sheet was inclined towards the right or left and the smearing was done quickly. Fig. 2-a illustrates how the smearing is done.
(a) (b)
Fig. 2. Methods used for transferring a solid sample onto a substrate: (a) TIJ; (b) sample smearing
This method is rapid and easily executed without specialized equipment. The amount is readily controlled and can be calculated without the need for an independent analysis. Once the solvent had evaporated, the spectrum of the sample was collected immediately. Solutions were dispensed using an ImTech Imaging System model I-Jet 312S, (ImTech, OR, USA) equipped with a HP 51645A inkjet cartridge, illustrated in Fig. 2-b. Aliquots of 10 mL were placed into the inkjet cartridge and the backpressure was set to 3 inches of water using an external backpressure controller. The solutions were dispensed over stainless plates at zero dot spacing (space between drops using HP ink) using a printing resolution of 600 dots per inch (dpi). Once the solvent had evaporated, the spectrum of the sample was collected.
4. Cleaning validation of pharmaceutical batch reactors
FOC-GAP FTIR spectroscopy can be used in cleaning validation applications for active pharmaceutical agents on metallic surfaces (Mirza, 1999); Mehta, 2002; Primera-Pedrozo, 2005-b; Fierro-Mercado, 2010). A method based on smearing a known amount of the sample in solution was used for preparing samples and standards to develop cleaning validation methodologies using IR spectroscopy. The samples were deposited on the surface using smearing transfer method. Using this method ibuprofen was detected on stainless steel plates, a common material on pharmaceuticals reactors. This new technology combining to smearing can decrease the consuming time in cleaning validation process, being advantageous in an in process laboratory. Detection limit for this compound was 0.5 μg/cm2 loading concentration. Grazing angle spectra of samples were collected for surface concentrations in the range of 0.1 – 20 μg/cm2 FT-IR spectra were collected from each plate using the grazing angle probe. The spectra are shown in Figure 3. Fingerprint signals intensities of the spectra decrease with lower ibuprofen loading concentrations. This amplified region was used for the chemometrics calculations (Beebe, 1998). The most intense band of ibuprofen in the region of 1760-1650 cm-1 was used for peak area and peak height calibration curve generation. This band is assigned to C=O stretch (Griffith, 1986; Lin-Vien, 1991).
www.intechopen.com

Applications of Fiber Optic Coupled-Grazing Angle Probe Reflection-Absorption FTIR Spectroscopy
231
1000 1150 1300 1450 1600 1750
Ab
sorb
an
ce
Wavenumbers / cm-1
Fig. 3. Grazing angle FTIR spectra of ibuprofen on stainless steel for various surface loadings
For quantification studies, two types of calibration curves were generated using two methods: measurement of the absorbance peak heights and integration of areas spectral region within the 1760 to 1650 cm-1 range. Fig. 3 shows the calibration curves of the absorbance peak heights. Results for peak areas are not shown. These plots exhibit a high degree of linear correlation. The calibration curve graph using height peaks shows better in linearity. However, the errors are higher for the calibration curve using peak areas. The calibration graphs using peak areas represents a better choice for quantitative analysis when compared to peak height analysis (Lavine, 2002; Kramer, 1998).
y = 0.0028x - 0.0025R2 = 0.9949
0 3 6 9 12 15 18
Pe
ak
he
igh
t (1
760
-16
50
cm-1
)
Loading concentration / ug/cm2
Fig. 4. Calibration curve of ibuprofen using peak height analysis
The calibration model was built using the Quant 2 package, an add-on software package to
the OPUS™ (Bruker Optics) data acquisition and analysis software. In this study, the model parameters were optimized in the spectral region 1770 – 1016 cm-1 and 3104 – 2750 cm-1. No spectral data preprocessing was done. The resulting model was cross-validated using the ‘’leave one out’’ method in which each spectrum is omitted in turn from the training set and then tested against the model built with the remaining spectra. The results are illustrated
www.intechopen.com

Fourier Transforms - New Analytical Approaches and FTIR Strategies
232
graphically in Fig. 5. The root mean square error of the cross validation was 0.401, and R2 was 0.9952. Clearly, low levels of ibuprofen can be detected and measured on a metal surface with quantitative results.
y = 0.9947x - 0.0048R2 = 0.9952
0
1
2
3
4
5
6
7
8
9
10
0 1 2 3 4 5 6 7 8 9 10
Pre
dic
ted
co
nce
ntr
ati
on
/ µ
g/c
m2
True concentration / µg/cm2
Fig. 5. Cross validation for Ibuprofen quantification on metallic surfaces
Discriminant analysis (Huberty, 1994) was also performed to classify ibuprofen loading concentration in two groups (Fig. 6). The first one corresponds to concentrations < 2 μg/cm2 and the second one to concentrations > 2 μg/cm2. Peak areas of signals in the range of 1273 – 1978 cm-1 were used for the discrimination. This model was generated using 10 PLS and submitting the data to a pre-processing of straight line subtraction. Results show that discriminant analysis can be used to classify ibuprofen samples according to their surface concentration on the metal surfaces. The minimum amount of this API on the reactor after cleaning must be considered for future works. This will allow having a real model of discrimination.
0
0.5
1
1.5
2
2.5
0.6 1.1 1.6 2.1 2.6
Discriminant function
Dis
cri
min
ation
conc < 2ug/cm2 conc > 2ug/cm2
Fig. 6. Discrimination study for ibuprofen: samples were separated according to surface loadings
www.intechopen.com

Applications of Fiber Optic Coupled-Grazing Angle Probe Reflection-Absorption FTIR Spectroscopy
233
27.12
17.71
11.31
6.524.96
6.36
0
5
10
15
20
25
30
0.5 1 2 5 10 20
Surface loading (μg/cm2)
Vari
ati
on
co
eff
icie
nt
(%)
Fig. 7. Variation coefficient with surface loadings for detection and quantification limit calculations
The variation coefficient (Fig. 7) increases at low surface loadings. For 0.5 μg/cm2 loading concentration, the variation was higher than the others. This indicates that at this surface loading, the analytical response gets its minimum value and can be confused with the noise. This value can be considered as the detection limit. In order to verify this, an ANOVA test was performed for surface concentrations of 0.5, 1 y 2 μg/cm2, and for a 95.0% confidence level there was a statistically significant difference between these values. However at 99.0% confidence level, there was no difference for samples of 0.5 and 1 μg/cm2 (Statgraphics Plus
for Windows™, 1999).
5. Detection of explosives
FOC-GAP-FTIR spectroscopy is suitable for development of methods for detection of traces of explosives on surfaces. A smearing transfer method can be used for depositing the target explosives on the substrates to be used as standards and samples. The sample transfer method is appropriate to compare with other methods of sample preparation due the fact that a mass balance is not needed in order to know the amount of the sample on the surface. Besides that, many plates were prepared, good reproducible distributions were found (the analyte was distributed almost homogeneous on the surface). Samples ranging from micrograms/cm2 to nanograms/cm2 of 2,6-dinitrotuelene (DNT), 2,4,6-trinitrotoluene (TNT), pentaerythritol tetranitrate (PETN), nitroglycerine (NG) and triacetone triperoxide (TATP) were deposited as on stainless steel surface. Methanol, acetone and acetonitrile were used as transfer solvents. The IR reflectance spectra were recorded at 4 cm-1 resolution and 50 scans. The results of the experiments gave intense absorption bands in the fingerprint region of the IR spectra that were used to calculate the detection limit for each of the target explosives. The nitro band can be used for explosives detection since it acts as a vibrational signature of several classes of explosives: nitroaromatic, nitroaliphatic, nitramines and nitrate esters. Figs. 8 and 9 show the prominent signal of nitro explosives deposited on stainless steel surfaces. Only one signal in the range 1200 – 1400 cm-1 was significant for quantitative and qualitative analysis. This band can be attributed NO2 stretching vibration. Nitro stretching vibration of PETN and NG appears in the 1250 – 1320 cm-1 region. For nitroaromatic explosives such as TNT and 2,6-DNT the band appears at 1320 – 1360 cm-1 [42, 43].
www.intechopen.com

Fourier Transforms - New Analytical Approaches and FTIR Strategies
234
This difference can be explained in terms of the fact that the group NO2 in PETN and NG is attached to an oxygen atom. However, in DNT and TNT, this nitro group is directly attached to the aromatic ring. The high electronegativity of the oxygen atom in PETN and NG attracts electron density from the nitro group leading to a lowering of the oscillator strength and causing a shift to lower frequencies. This effect is lower or not present in the aromatic ring for TNT and DNT.
1100 1175 1250 1325 1400 1475
Ab
sorb
an
ce
Wavenumbers / cm-1
8.5 µg/cm²
4.4 µg/cm²
0.3 µg/cm²
1100 1175 1250 1325 1400 1475
Ab
sorb
an
ce
Wavenumbers / cm-1
1.6 µg/cm²
0.8 µg/cm²
0.4 µg/cm²
Fig. 8. Grazing angle spectra of nitroexplosives: a. PETN; b. NG
Fig. 10 includes the calculated classical detection limits for some nitroexplosives. For surface loadings near the detection limit only the NO2 signal can be observed without aid of software. The detection limit varies according to macro properties. Properties such vapor pressure, physical adsorption, sublimation rate and surface-adsorbate thermodynamics can influence the detection limit. A close relation between vapor pressure and limit detection is shown for nitro explosives. Table 1 shows the values for the vapor pressures near room temperature of the explosives studied. The amount of explosive on surface of stainless steel
a
b
www.intechopen.com

Applications of Fiber Optic Coupled-Grazing Angle Probe Reflection-Absorption FTIR Spectroscopy
235
and the residence time depends on this property, because at this loading concentration the explosive goes to vapor phase fast. This phenomenon is remarkably observed in TATP with
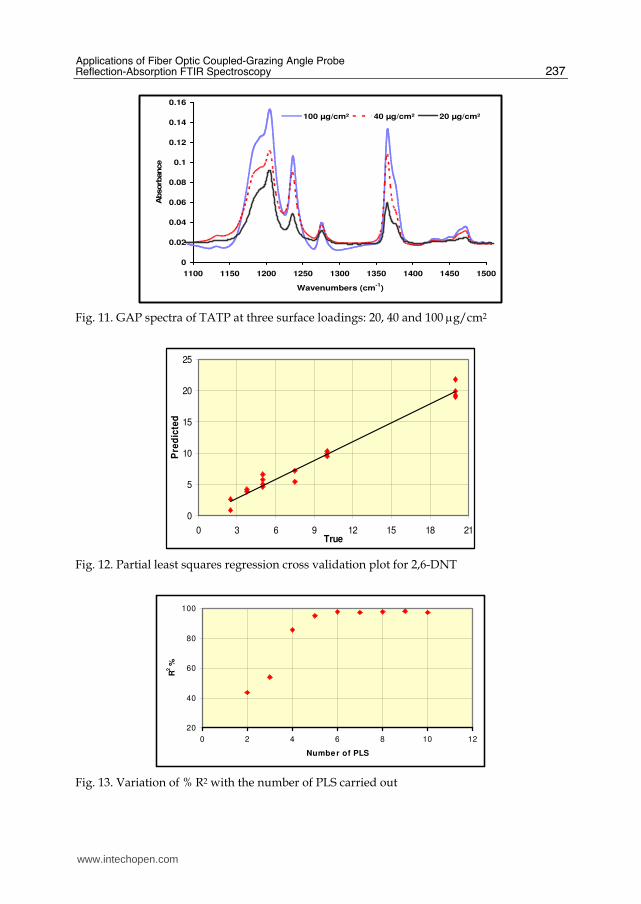
detection limit of 8 μg/cm2. Some macro properties also can affect sublimation at room temperature and TATP detection limit. Fig. 11 illustrates that several TATP bands can be used for its detection with accuracy. It shows the prominent presence of the most intense bands of TATP in the IR fingerprint region. The band at 1205 cm-1 belongs to the C-O stretch, 1365 cm-1 is a deformation of CH3 group and the band at 1471 cm-1 is an asymmetric deformation of CH3 group. The spectroscopic window used for TATP detection was spectral range of 1320-1407 cm-1. Forward selection analysis of variable significance affirms that the significant peaks were contained within the spectral range of 1330-1407 cm-1 (Beeson, 1998; Demuth, 1998). The best discriminant model was done using peak areas. It was selected based on statistical significance and the percent of cases correctly classified. The statistical significance value (p-value) was p < 0.0001 and the percent of cases correctly classified was 90.6%.
1100 1175 1250 1325 1400 1475
Ab
sorb
an
ce
Wavenumbers / cm-1
10µg/cm²
5 µg/cm²
2.5 µg/cm²
1100 1175 1250 1325 1400 1475
Ab
sorb
an
ce
Wavenumbers / cm-1
2.5 µg/cm²
1.25 µg/cm²
0.3 µg/cm²
Fig. 9. Grazing angle spectra of nitroexplosives: a. 2,6-DNT; b. TNT
b
a
www.intechopen.com

Fourier Transforms - New Analytical Approaches and FTIR Strategies
236
2.5
0.40.3 0.3
0
0.5
1
1.5
2
2.5
µg/c
m²
DNT > NG > TNT > PETN
Limit of detection and deceasing vapor presure trend
Fig. 10. Detection limits for selected nitroexplosives and correlation with decreasing vapor pressure of the energetic compound
Explosive Vapor pressure(mm Hg)
2,6-dinitrotoluene 5.67 x 10⁻⁴ at 25 °C
2,4,6-trinitrotoluene 1.99 x 10⁻⁴ at 20 °C
nitroglycerin 2.0 x 10⁻⁴ at 25 °C
pentaerythritol tetranitrate 1.035 x10⁻¹⁰ at 25°C
TATP 5.25 x 10⁻² at 25 °C
Table 1. Vapor pressure of nitroexplosives and TATP
It is important to emphasize that measuring surface concentrations using the peak area method is conceptually simple and easy to use, but it has limitations. The method is univariate (the concentration is determined with a single spectral peak) and depends on a linear correlation between the concentration and the spectral response. The results can, therefore, be undermined by perturbations such as fluctuations caused by detector noise, temperature variations, or molecular interactions. Statistically based, multivariate calibrations use spectral features over a wide range. Information from a calibration spectral set (a training set) was compared to independently determined concentration data using partial least squares (PLS) regression. This method is based on the assumption that systematic variations in the spectra are a consequence of concentration changes. A calibration model for analysis of 2,6-DNT was built using the Quant 2 package, an add-on software package to the OPUSTM data acquisition and analysis software (Bruker Optics). The best spectral region was in the range of 1702 – 1269 cm-1. This range was used for model generation. No spectral data preprocessing was applied to the spectra. The results are illustrated graphically in Fig. 12. The root mean square error of the cross validation (RMSCV) was 0.957, and % R2 was 97.75. This calibration was used in order to predict unknown loading concentrations. For a deposited loading concentration 3.78 and 7.56
μg/cm2, 3.58 and 7.35 μg/cm2 were detected, respectively. Clearly, low levels of explosives can be detected and measured on a metal surface with good results. So, chemometrics easily leads to a powerful technique for surface contamination detection and measurement. Moreover, classical detection limits do not apply any longer. Thus the reported values are on the conservative side.
www.intechopen.com
Applications of Fiber Optic Coupled-Grazing Angle Probe Reflection-Absorption FTIR Spectroscopy
237
0
0.02
0.04
0.06
0.08
0.1
0.12
0.14
0.16
1100 1150 1200 1250 1300 1350 1400 1450 1500
Wavenumbers (cm-1
)
Absorb
ance
100 µg/cm² 40 µg/cm² 20 µg/cm²
Fig. 11. GAP spectra of TATP at three surface loadings: 20, 40 and 100 μg/cm2
0
5
10
15
20
25
0 3 6 9 12 15 18 21True
Pre
dic
ted
Fig. 12. Partial least squares regression cross validation plot for 2,6-DNT
20
40
60
80
100
0 2 4 6 8 10 12
Numbe r of PLS
R2 %
Fig. 13. Variation of % R2 with the number of PLS carried out
www.intechopen.com

Fourier Transforms - New Analytical Approaches and FTIR Strategies
238
The importance of applying PLS that it is used to design and build robust calibration models for quantitative analysis. PLS regression is a quantitative spectral decomposition technique that is closely related to principal component (PC) regression. It uses the concentration information during the decomposition process. This causes spectra containing higher constituent concentrations to be weighted more heavily than those with low concentrations. The main idea of PLS is to get as much concentration information as possible into the first few loading vectors or number of PLS (Kramer, 1998; Otto, 1999). Fig. 13 shows how the calibration model improves with the addition of PLS. Five PLS executions were necessary to build a good calibration model. This indicates that the relationship that exists between the loading concentration and the spectral absorbance in this technique is multidimensional. The robustness of model calibration was evaluated using internal jackknifing validation [44]. Model with lower PLS than 6 was not capable to predict new data with good precision. Fig. 14 shows the appearance of TNT deposits under high magnification of a white light microscope. At these loading concentrations almost all the stainless steel surface was covered by crystals. Using this transfer method, positive and inverted bands were observed (Fig. 15). For loading concentrations > 8 μg/cm2, only positive bands were observed. This fact can be attributed some changes in the refraction index of TNT.
a. 20 μg/cm2 50 x
b. 40 μg/cm2 100 x
Fig. 14. Optical images for TNT deposited on stainless steel using smearing method
Substance Sample
Preparation Method Solvent
Detection Limit (μg/cm2)
TNT Smearing dichloromethane 0.3
2,6-DNT Smearing acetone 0.3
PETN Smearing methanol 0.3
NG Smearing acetonitrile 0.4
TATP Smearing dichloromethane 8.0
Table 2. Detection limits of Explosives using FT-RAIRS on stainless steel
The calibration model was built using the Quant 2 package, an add-on software package to the OPUSTM (Bruker Optics) data acquisition and analysis software. In this study, the model parameters were optimized in the spectral region 1668-1045 cm-1. No spectral data preprocessing was done. The resulting model was cross-validated using the ‘’leave one out’’
www.intechopen.com

Applications of Fiber Optic Coupled-Grazing Angle Probe Reflection-Absorption FTIR Spectroscopy
239
method in which each spectrum is omitted in turn from the training set and then tested against the model built with the remaining spectra. The results are illustrated graphically in Fig. 16. The root mean square error of the cross validation was 0.918, and R2 was 0.9858. TNT can be detected and quantified on metallic surfaces and low concentrations as 500 ng/cm2. Table 2 shows a summary of the detection limits of the explosives using smearing transfer method. The detection limit depends on the vapor pressure.
1000 1100 1200 1300 1400 1500 1600 1700 1800 1900
Wavenumbers (cm-1
)
Ab
sorb
an
ce
0.5 ug/cm2 1 ug/cm2 8 ug/cm2 20 ug/cm2 40 ug/cm2
Fig. 15. FT absorption-reflection IR spectra of TNT on stainless steel using smearing transfer method
y = 1.005x - 0.0019R² = 0.9858
-0.2
0.3
0.8
1.3
1.8
0 0.25 0.5 0.75 1 1.25 1.5 1.75
Pre
dic
ted
su
rfac
e co
nce
ntr
ati
on
μg/c
m2
True surface concentration / μg/cm2
Fig. 16. Leave one out cross validation for TNT surface concentration deposited on stainless steel
6. Sublimation studies of TATP deposited on metal surfaces
The rapid sublimation of the TATP under normal atmospheric conditions presents a significant challenge in applying the fiber-optic grazing-angle method to surface detection
www.intechopen.com

Fourier Transforms - New Analytical Approaches and FTIR Strategies
240
of the compound. Even under controlled laboratory conditions, where spectroscopy was carried out on freshly prepared samples, it proved impossible to develop PLS1 calibrations that met a high standard of robustness or usability. The rapid change in the surface concentration of TATP made it impractical to collect more than one spectrum from each sample and this further limited the possibilities of building a statistically useful data set. The samples were deposited on the surface using a smearing method. To carry out the experiments, TATP was synthesized in the laboratory. For the calibration curves TATP was dissolved in dichloromethane. A solution with an initial concentration of 0.23 g/mL was prepared and then dilutions were made until obtain 0.23 g/mL. The resulting average surface concentrations of TATP ranged from 8 to 200 μg/cm2. Since dichloromethane
evaporates very fast (Boiling point = 39.8 °C), a thin sample film was observed after smearing. Once the solvent had evaporated, the spectrum of the sample was collected immediately to minimize the impact on the calibration of rapid TATP sublimation. The data was analyzed using chemometrics routines; in particular multivariate PLS was used. In
other experiments done with stainless steel plates coated with 25-100 μg/cm2 TATP, spectra were recorded every 27 seconds at 20-30 °C and the sublimation behavior at the studied temperatures was observed. The readiness with which TATP sublimates (vapor pressure at room temperature = 7 Pa) under normal atmospheric conditions complicates the task of calibrating the detection of the compound on surfaces, as the surface concentration of TATP decreases over the timescale of the experiment. To explore this effect, experiments were performed with stainless steel plates initially given a nominal loading of 100, 80, 50, 20, and 10 μg/cm2 TATP. Immediately after deposition of the TATP, the probe head was positioned on the surface, and spectra were collected every 27 seconds. Fig. 17 shows successive spectra taken at 27 s intervals from an initial loading of 100 μg/cm2 TATP.
0 2 4 6 8 10 120
2
4
6
8
10
12
14
16
Fig. 17. Peak areas for the grazing-angle mid-IR spectra in the range from 100-1300 cm-1, for initial loadings of 100, 80, 50, 20, and 10 μg/cm2
A peak-fitting model of the spectral region from approximately 1300-1100 cm-1 was fitted
against each of the spectra in turn to give the total peak area for the selected region. Fig. 18
www.intechopen.com

Applications of Fiber Optic Coupled-Grazing Angle Probe Reflection-Absorption FTIR Spectroscopy
241
shows the result for samples of stainless steel substrates initially loaded with 10-100 μg/cm2,
represented as a graph of peak areas versus time. The amount of TATP detected on the
surface drops below the apparent detection limit of the technique within about 9 min.
Standard were prepared as described in the Experimental Section. Grazing angle FT-IR
spectra of freshly prepared samples were collected for a series of different surface
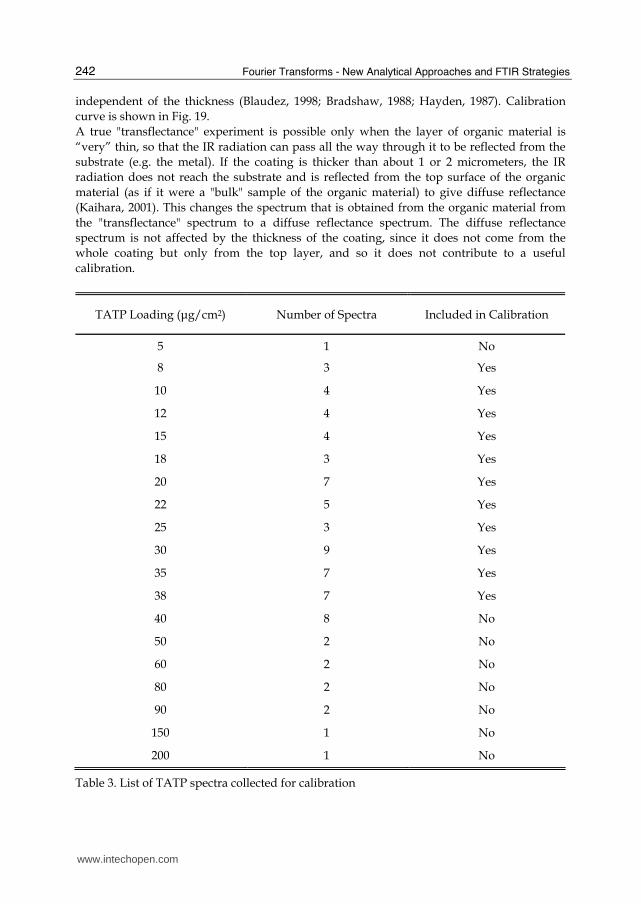
concentrations, as shown in Table 1. When a PLS1 model was built from all of the 79 spectra
listed, using the spectral region from 1066-1506 cm-1 and no spectral preprocessing, it
proved impossible to develop a model that met a reasonable standard (the maximum
obtainable value for R2 was about 0.75). In this study, the model parameters were optimized
in the spectral region 1498 – 1113 cm-1. No spectral data preprocessing was done. When data
used for the model was limited to loadings below 40 μg/cm2, it was possible to build a
calibration with R2 = 0.869, and root mean square error of cross validation (RMSECV) = 3.69
(obtained from a leave-one-out cross validation); the results are shown graphically in Fig.
18. The graph shows the degree of scattering in the data. While some of this scattering may
be attributable to variations in the amount of TATP deposited on each coupon, sublimation
of the TATP during the experiment is another likely contributing factor. Given these
limitations, the quality of the calibration that has been developed is surprisingly good and it
is clearly quite possible to detect microgram quantities of TATP on metal surfaces using
grazing angle FTIR methods. This is in agreement with previous results for a range of
organic compounds on metal and glass surfaces (White, 1992; Lin-Vien, 1991).
y = 0.8788 x + 2.8874R2 = 0.8686
0
5
10
15
20
25
30
35
40
4 9 14 19 24 29 34 39
Tru
e c
on
cen
tra
tio
n /
µg
cm
-2
Predicted concentration / µg cm-2
Fig. 18. “Leave-one-out cross” validation of predicted values vs. true values for TATP on stainless steel substrates. All data are shown illustrating point scattering at each value measured
TATP quantification was done using the calibration generated by chemometrics. These
results are shown in Table 3. Clearly, low levels of TATP can be detected and measured on a
metal surface with quantitative results (Table 4). Attempts to build a separate calibration for
the loadings of 40 μg/cm2 and above were unsuccessful may be attributable to the change in
the nature of the surface coating at high loadings, from a thin film capable of generating a
double-pass transmission spectrum to a bulk material generating diffuse surface reflectance
www.intechopen.com
Fourier Transforms - New Analytical Approaches and FTIR Strategies
242
independent of the thickness (Blaudez, 1998; Bradshaw, 1988; Hayden, 1987). Calibration
curve is shown in Fig. 19.
A true "transflectance" experiment is possible only when the layer of organic material is
“very” thin, so that the IR radiation can pass all the way through it to be reflected from the
substrate (e.g. the metal). If the coating is thicker than about 1 or 2 micrometers, the IR
radiation does not reach the substrate and is reflected from the top surface of the organic
material (as if it were a "bulk" sample of the organic material) to give diffuse reflectance
(Kaihara, 2001). This changes the spectrum that is obtained from the organic material from
the "transflectance" spectrum to a diffuse reflectance spectrum. The diffuse reflectance
spectrum is not affected by the thickness of the coating, since it does not come from the
whole coating but only from the top layer, and so it does not contribute to a useful
calibration.
TATP Loading (μg/cm2) Number of Spectra Included in Calibration
5 1 No
8 3 Yes
10 4 Yes
12 4 Yes
15 4 Yes
18 3 Yes
20 7 Yes
22 5 Yes
25 3 Yes
30 9 Yes
35 7 Yes
38 7 Yes
40 8 No
50 2 No
60 2 No
80 2 No
90 2 No
150 1 No
200 1 No
Table 3. List of TATP spectra collected for calibration
www.intechopen.com

Applications of Fiber Optic Coupled-Grazing Angle Probe Reflection-Absorption FTIR Spectroscopy
243
Deposited (μg/cm2)
Detected by grazing angle (μg/cm2)
Difference
14.96 13.8 1.16
17.96 16.5 1.46
24.94 25.3 -0.36
34.91 32.6 2.36
Table 4. Quantification of TATP on metal plates by grazing angle Fiber optic FT-IR
Discriminant analysis was also performed to classify the TATP loading concentration in two groups (Fig. 20). The first one corresponds to concentrations lower than 25 μg/cm2 and the second one to concentrations higher than 25 μg/cm2. Peak areas of signals in the range of 1330-1407 cm-1 and 1407-1503 cm-1 were used for the discrimination. Forward selection analysis of variable significance affirms that the significant peaks were contained within the spectral range of 1330-1407 cm-1. The best discriminant model was selected based on statistical significance and the percentage of cases correctly classified. The percentage of cases correctly classified was 90.6% and the significance statistical p-value was < 0.0001.
y = 0.0369x + 0.0287R² = 0.9376
0
0.5
1
1.5
2
0 25 50 75 100 125 150 175 200
Pe
ak
Are
as
/ a
.u.
Loading / µg cm-2
Fig. 19. Calibration curve for TATP on SS surface using peak areas (1330-1407 cm-1)
TATP sublimation behavior depends of the temperature as is expected. This is shown in Fig.
21. For temperatures lower than 20 °C TATP sublimation rate is significantly low. Beyond this point the sublimation rate starts to increase very fast. The rate of sublimation for TATP was calculated in units of peak-area/second for the slope of the curve, taking into account the linear range of the graphs (Fig. 21-a and -b). Since the surface concentration is well approximated by the measured peak area in this range because these are proportional (Fig. , the mass transferred to the vapor phase is reasonably well estimated by the decrease in peak
www.intechopen.com

Fourier Transforms - New Analytical Approaches and FTIR Strategies
244
areas in the MIR. This range was selected because here the rate decays more rapidly. These results can be confirmed in Fig. 19. The estimated value of the rate sublimation with
temperature in the range of 20-30 °C is -0.0013 peak area-s-1 °C-1. This is equivalent to ~ -0.81 μg cm-2 s-1 °C-1 in the range of 20-30 °C. These experiments confirm the fact that TATP sublimates very fast in the absence of vapor pressure reducing and stabilizing agents.
0
1
2
0 0.5 1 1.5 2 2.5
Dis
crim
ina
tio
n
Peak areas
Leave in < 25 μg/cm²
Leave in > 25 μg/cm²
Leave out < 25 μg/cm²
Leave out > 25 μg/cm²
Fig. 20. Plot of peak area selected to construct the discrimination for grouping 67 concentrations
0
0.2
0.4
0.6
0.8
1
1.2
1.4
1.6
1.8
0 100 200 300 400 500 600 700 800 900
Pe
ak
are
as /
a.u
.
Time / s
20 C 25ug/cm2
20 C 50ug/cm2
20 C 100 ug/cm2
0
0.4
0.8
1.2
1.6
2
0 100 200 300 400 500 600
Pe
ak
are
as
/ a
.u.
Time / s
26 C 25ug/cm2
26 C 50 ug/cm2
26 C 100ug/cm2
Fig. 21. Plots of peak areas versus time (second) for 25, 50 and 100 μg/cm2 at: a: 20 ºC; b: 26 ºC
a b
www.intechopen.com

Applications of Fiber Optic Coupled-Grazing Angle Probe Reflection-Absorption FTIR Spectroscopy
245
0 100 200 300 400 500 600
Pe
ak
are
as /
a.u
.
Time / s
30 C 100ug/cm2
30 C 25ug/cm2
30 C 50ug/cm2
y = -0.0013x + 0.0263R² = 0.9998
-0.0165
-0.0125
-0.0085
-0.0045
-0.0005
20 21 22 23 24 25 26 27 28 29 30
Slo
pe
/ P
ea
k A
rea
s/s
Temperature / °C
Fig. 22. a: Plot of peak areas versus time (s) for 25, 50 and 100 μg/cm2 at 30 ºC; b: sublimation rate for different temperatures
7. Characterization studies of TNT deposited on metal surfaces by TIJ technology
Although smearing transfer method gave almost a homogenous distribution of the
explosives on surfaces, the method of mass transfer required the preparation of many
samples. This was due to the fact that the sample transfer method is prone to uncontrolled
operator errors. To circumvent the problem, Thermal inkjet technology (TIJ) was used for
the experiments. TNT was selected as an explosive for dispensing on TIJ.
Thermal Inkjet Technology is able to deposit very small amounts of chemical compounds,
including energetic materials, in a specific location on a surface. Aliquots of TNT solutions
were deposited on stainless steel film. A coating of TNT can be produced by controlling the
concentration of TNT, the number of drops dispensed and the distribution of drops over the
surface. The loading concentration of the sample on the surface can be controlled by varying
parameters such as: number of passes, dispensing frequency, applied energy and pen
architecture. Precise delivery of known number of droplets with known mass and
concentration are known. Also only one solution can be used, avoiding dilutions that can
increase the analytical errors.
The precise amount of TNT on the surface can be known in different ways: one can be
known if the drop weight of the solutions is known and the other using an alternative
method for quantification (GC, UV or HPLC). In our study, the stainless steel sheets loaded
with TNT samples were rinsed with 25-100 mL of acetonitrile to remove the entire TNT that
was delivered on the surface. Then solutions were transferred a volumetric flask and filled
to mark with solvent. Gas chromatography was used in our experiments as an alternative
method in order to determine the surface loading concentration. The analysis was carried
out using an Agilent Technologies 6890N, Network GC System with A micro cell 63Ni
Electron Capture Detector (µECD). For GC separation, a capillary column was used: RTX-5
(cross bonded 5% diphenil-95% diethyl polysiloxane) 15 m x 0.25 mm ID x 0.25 μm df,
Restek Corp, Bellefonte, PA. The GC oven was held at 80 °C for 1 min and then programmed
at 10 °C/min to 180 °C, followed by a 30 °C/min ramp to 300 °C. The temperature at the
injection port was 250 °C.
a b
www.intechopen.com

Fourier Transforms - New Analytical Approaches and FTIR Strategies
246
Calibration curves for GC-µECD were prepared with 1000 ppm standard solutions of TNT
obtained from Restek Corp. Stock solutions of concentrations: 1, 0.5, 0.1, 0.05, 0.01 ppm
diluted in HPLC grade acetonitrile (Sigma-Aldrich Chemical Co., Milwaukee) were
prepared. All solutions were injected directly using glass syringes (Hamilton Series 7101)
into the injection port, this analysis were carried out with three replicates for each
concentration. Using TIJ method it was possible to generate standards samples with more
uniform coverage, and one advantage is the fact that the surface loading concentration could
be varied by changing the numbers of passes delivered to the sample without the need for
serial dilutions. Fig. 23 shows the linear correlation of the variation of the number of passes
for a 5292 ppm solution. A direct relationship is observed.
y = 0.765x - 0.281R² = 0.9893
0
1
2
3
4
1 2 3 4 5
Lo
ad
ing
co
nce
ntr
ati
on
(u
g/c
m2)
Number of TIJ passes
Fig. 23. Variation of the number of passes delivered to the surface for a TNT 5292 ppm solution
For visualization of substrates after sample deposition, optical microscopy images were
captured using Leica microscope (model LS). These images can be seen in Fig. 24. The
images clearly reveal that TNT is collecting on the stainless steel surface as droplets and
crystals. As the number of passes increases on the surface, the size of the droplets
increases. At 1.25 μg/cm2 loading concentration, the surface is practically covered by
crystals.
The way how the sample is distributed on the surface plays an important role in the task of
calibrating the detection of the TNT or other compound on surfaces. To explore this effect,
experiments were performed by positioning the probe head on different parts on the
surface, and spectra were collected. Fig. 25 shows how the analytical response varies with
the loading concentration. A peak-fitting model of the spectral region from approximately
1583-1396 and 1418-1220 cm-1 was fitted against each of the spectra in turn to give the total
peak area for the selected region. This confirmed that although the coating is not
homogenous a pattern with TIJ is generated, giving a few errors.
www.intechopen.com

Applications of Fiber Optic Coupled-Grazing Angle Probe Reflection-Absorption FTIR Spectroscopy
247
a. TNT 0.39 μg/cm2 50 μm
b. TNT 0.39 μg/cm2 50 μm
c. TNT 1.25 μg/cm2 50 μm
d. TNT 1.25 μg/cm2 50 μm
Fig. 24. White light images of TNT deposits on stainless steel substrates using TIJ for deposition
The asymmetric and asymmetric vibrational stretches of the nitro (NO2) group can be used
for explosives detection since they act as vibrational signatures of several classes of
explosives: nitroaromatic (TNT, DTNT), nitroaliphatic (CH3NO2), nitramines (RDX, HMX)
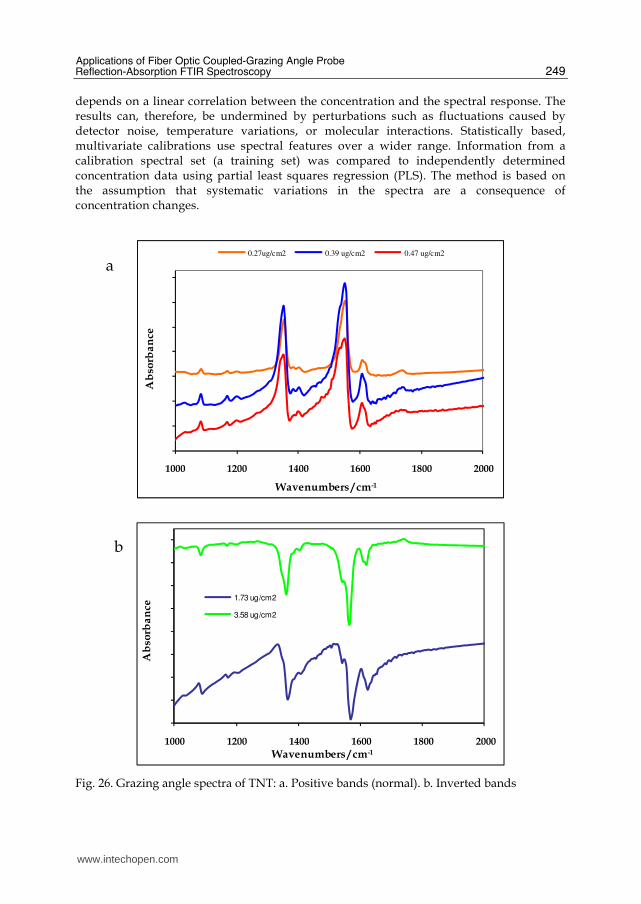
and nitrate esters (nitroglycerine, PETN). Fig. 26 shows the prominent signals of TNT
deposited on stainless steel surfaces. All nitro signals were significant for quantitative and
qualitative analysis. Nitro symmetric stretching vibration of TNT band appears at 1320 –
1360 cm-1 and nitro asymmetric stretching vibration is typically located in the wavenumber
range: 1477 – 1600 cm-1. A completely inverted spectrum with all bands pointing
downwards is finally obtained for 1.73 μg/cm2 and 3.58 μg/cm2 loading concentration (Fig.
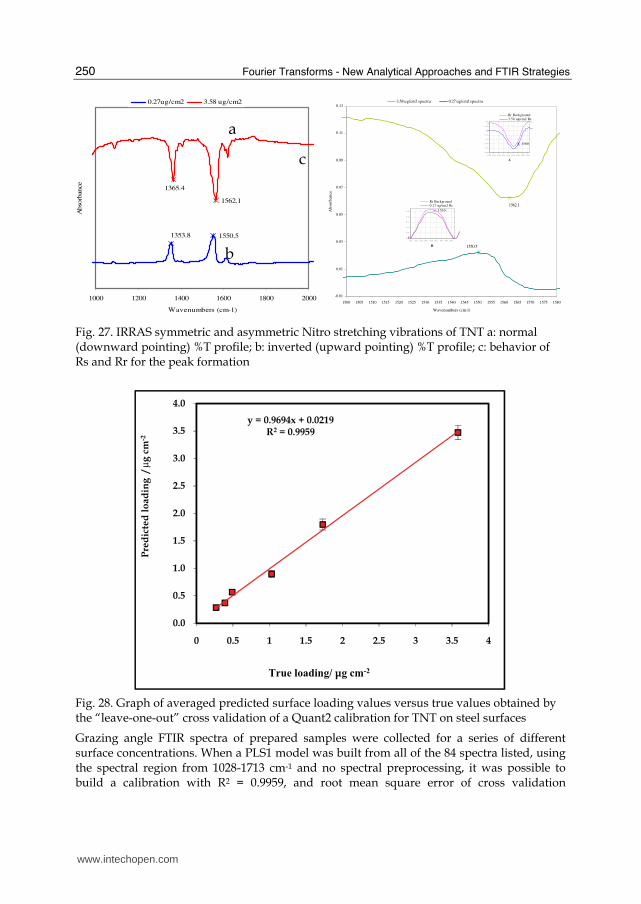
26). Fig. 27 shows TNT IRRAS spectra of two types of deposits. For very low surface
loadings and for high surface concentrations (3.58 μg/cm2 shown in trace of Fig. 27-A), the
typical downward looking percent transmission profiles are observed. However, IRRAS
spectroscopic features of thins films on surfaces frequently show strongly variations of the
relative intensities and wavelength shifts as the surface loadings changes. These effects were
observed when the loading concentration of TNT was bellow 1.73 μg/cm2 (Fig. 27-B).
Significant wavenumber shifts (> 10 cm-1) were found for the nitro vibrations bands. An
inverted upward looking profile similar to an absorption spectrum of the bands is clearly
seen in lower trace in Fig.
www.intechopen.com

Fourier Transforms - New Analytical Approaches and FTIR Strategies
248
0.00
0.50
1.00
1.50
2.00
2.50
c0.27 c0.39 c0.49
Loading concentration (ug/cm2)
Pea
k a
rea
s 1583.1-1396.4 cm-1 1417.7-1220.3 cm-1
Fig. 25. Variation of the distribution of the TNT deposited on stainless steel using TIJ with the analytical response
The reflected radiation depends of the nature of the film as well as the incident angle of
the IR beam reaching the surface. The properties of the reflected IR light depend critically
on localized optical characteristics of the film such as the local index of refraction. Sample
heterogeneities give rise to local changes in the refractive index across the sample and
affect the reflectance spectra. Typical Infrared Reflection Absorption Spectroscopy
(IRRAS) spectra are reported in terms the measured absorbance defined as (Bradshaw,
1988; Hayden, 1987):
A = Log (Rr/Rs) (1)
where: Rr is the reflectance of the of the plate (substrate) and Rs is the reflectance of the
sample-substrate [22]. Fig. 26-A shows “normal” (vertical up) for low surface loadings
(0.27- 0.47 μg/cm2). Fig. 26-B shows corresponding RAIS spectra for 1.73 and 3.58 μg/cm2
illustrating downward pointing peaks. Figs. 27-A and B contains expanded views in the
wavenumber range for Rr and Rs of 0.27 μg/cm2 and 3.58 μg/cm2. The metallic substrate
reflects more than the sample (TNT), it means that Rr > Rs and a normal peak is found.
This can be observed in Fig. 27-B. The inverted peak is found in 1561 because the
difference between Rr and Rs in this frequency value is lower than in other values around
this one in the frequency range 1548-1565 cm-1. This means that the sample is reflecting
almost at the same level as the metal substrate. This fact can be explained based on
changes in the refractive at the film-metallic surface interphase or by the way that TNT
layers are packed on the surface. Another reason can be argued is the fact that these
inverted bands are found when most of the coverage of the surface is TNT crystals and
not amorphous TNT droplets.
It is very important to emphasize that measuring surface concentrations using the peak area method is conceptually simple and easy to use, but it has some limitations. The method is univariate: the concentration is determined with a single spectral peak and it
www.intechopen.com
Applications of Fiber Optic Coupled-Grazing Angle Probe Reflection-Absorption FTIR Spectroscopy
249
depends on a linear correlation between the concentration and the spectral response. The results can, therefore, be undermined by perturbations such as fluctuations caused by detector noise, temperature variations, or molecular interactions. Statistically based, multivariate calibrations use spectral features over a wider range. Information from a calibration spectral set (a training set) was compared to independently determined concentration data using partial least squares regression (PLS). The method is based on the assumption that systematic variations in the spectra are a consequence of concentration changes.
1000 1200 1400 1600 1800 2000
Ab
sorb
an
ce
Wavenumbers / cm-1
0.27ug/cm2 0.39 ug/cm2 0.47 ug/cm2
1000 1200 1400 1600 1800 2000
Ab
sorb
an
ce
Wavenumbers / cm-1
1.73 ug/cm2
3.58 ug/cm2
Fig. 26. Grazing angle spectra of TNT: a. Positive bands (normal). b. Inverted bands
a
b
www.intechopen.com
Fourier Transforms - New Analytical Approaches and FTIR Strategies
250
1353.8 1550.5
1562.1
1365.4
1000 1200 1400 1600 1800 2000
Wavenumbers (cm-1)
Abso
rbance
0.27ug/cm2 3.58 ug/cm2
1562.1
1550.5
-0.01
0.01
0.03
0.05
0.07
0.09
0.11
0.13
1500 1505 1510 1515 1520 1525 1530 1535 1540 1545 1550 1555 1560 1565 1570 1575 1580
Wavenumbers (cm-1)
Ab
sorb
ance
3.58 ug/cm2 spectra 0.27 ug/cm2 spectra
1550
0 . 2 2
0 . 2 7
0 . 3 2
0 . 3 7
0 . 4 2
0 . 4 7
15 4 1 15 4 3 15 4 5 15 4 7 15 4 9 15 5 1 15 5 3 15 5 5 15 5 7
B
Rr Background0.27 ug/cm2 Rs
1560
0 . 15
0 . 2
0 . 2 5
0 . 3
0 . 3 5
0 . 4
0 . 4 5
0 . 5
15 4 8 15 5 0 15 5 2 15 5 4 15 5 6 15 5 8 15 6 0 15 6 2 15 6 4
A
Rr Background3.58 ug/cm2 Rs
Fig. 27. IRRAS symmetric and asymmetric Nitro stretching vibrations of TNT a: normal (downward pointing) %T profile; b: inverted (upward pointing) %T profile; c: behavior of Rs and Rr for the peak formation
y = 0.9694x + 0.0219R2 = 0.9959
0.0
0.5
1.0
1.5
2.0
2.5
3.0
3.5
4.0
0 0.5 1 1.5 2 2.5 3 3.5 4
Pre
dic
ted
lo
ad
ing
/
µg
cm
-2
True loading/ μg cm-2
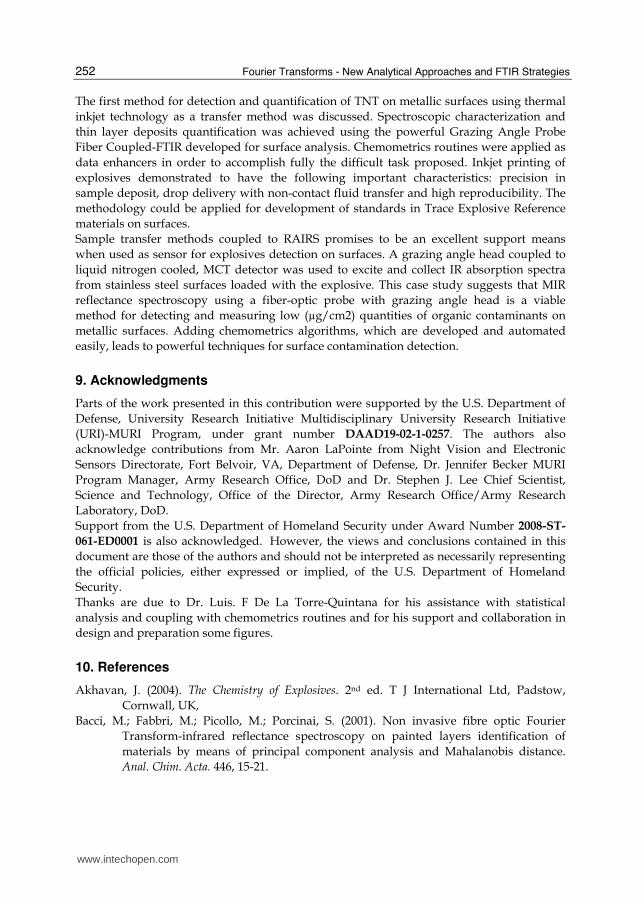
Fig. 28. Graph of averaged predicted surface loading values versus true values obtained by the “leave-one-out” cross validation of a Quant2 calibration for TNT on steel surfaces
Grazing angle FTIR spectra of prepared samples were collected for a series of different surface concentrations. When a PLS1 model was built from all of the 84 spectra listed, using the spectral region from 1028-1713 cm-1 and no spectral preprocessing, it was possible to build a calibration with R2 = 0.9959, and root mean square error of cross validation
a
b
c
www.intechopen.com

Applications of Fiber Optic Coupled-Grazing Angle Probe Reflection-Absorption FTIR Spectroscopy
251
(RMSECV) = 0.258 (obtained from a “leave-one-out” cross validation); the results are shown graphically in Fig. 28. According to these results TIJ-IRRAS combined with PLS can be used for TNT detection and quantification on metallic surfaces.
8. Conclusion
Fiber optic coupled FTIR spectroscopy has been shown to provide a useful technique for
methods development for in situ detection explosives and active pharmaceutical
ingredients and excipients on metallic surfaces. Very low detection limits (∼ 0.3 μg/cm2)
were found for nitroexplosives and for organic peroxides. The present study was limited
to highly reflective metallic surfaces such as stainless steel. However, since it is based on a
grazing angle probe that is sensitive to adsorbates deposited on substrates regardless of
the nature of the surface, and at least to first order, the methodology should be applicable
for trace detection of explosives on other types of surfaces. The coupling of data
acquisition to powerful non linear, multivariate analysis based on chemometrics routines
such as partial least squares resulted in an even more robust analytical methodology.
Explosives detection for this technique as applied to the target molecules used was found
to be limited by the residence time of the substance on the surface. At low loading
concentrations, high vapor pressure explosives escape to the vapor phase by sublimation
even faster, limiting the low limit of detection achievable. The detection limit for TATP,
high vapor pressure organic peroxide, was 8 μg/cm2. For nitroexplosives such as 2,6-
DNT, NG TNT, and PETN LODs found were 2.5, 0.4, 0.3, and 0.3 μg/cm2 respectively. The
results are in good agreement with a decreasing low limit of detection when arranged in
the order of decreasing vapor pressure.
In this work we present the first method for detection and quantification of TATP on metallic surfaces. The method entails the coupling of optical fibers operating in the mid infrared (MIR) to a high performance interferometer. A grazing angle head coupled to liquid nitrogen cooled, MCT detector was used to excite and collect IR absorption spectra from stainless steel surfaces loaded with the organic peroxide. A smearing technique was used to prepare standards for surface loading of the explosive. The novel aspects of the methodology involve in situ, remote sensed, fiber optic coupling of
a grazing angle probe to a high sensitivity FTIR interferometer. It must be noted that the
sample must to be measured immediately after the smearing to avoid sublimation of TATP
from the metal surface. The robustness of the new methodology relies on utilizing powerful
Chemometrics routines and Discriminant Analysis for statistical enhancement of data.
Discriminant Analysis can be used to quantify TATP by classifying loading concentration in
two groups: the first one corresponds to concentrations lower than 25 μg/cm2 and the
second one to concentrations higher than 25 μg/cm2.
This work describes the first demonstration of a method for direct, in-situ detection and
quantification of TATP on metallic surfaces. The rapid sublimation of TATP from the test
surface has been demonstrated by tracking the decreasing intensities of the IR spectrum of
TATP; the signal falls below the detection limit after about 9 minutes, from an initial value
of 100 μg/cm2. This phenomenon limits the extent to which the surface concentration of
TATP can be calibrated. However, it has been possible to show that TATP on metallic
surfaces can be quantitatively detected in a matter of seconds using the grazing-angle FTIR
approach.
www.intechopen.com
Fourier Transforms - New Analytical Approaches and FTIR Strategies
252
The first method for detection and quantification of TNT on metallic surfaces using thermal
inkjet technology as a transfer method was discussed. Spectroscopic characterization and
thin layer deposits quantification was achieved using the powerful Grazing Angle Probe
Fiber Coupled-FTIR developed for surface analysis. Chemometrics routines were applied as
data enhancers in order to accomplish fully the difficult task proposed. Inkjet printing of
explosives demonstrated to have the following important characteristics: precision in
sample deposit, drop delivery with non-contact fluid transfer and high reproducibility. The
methodology could be applied for development of standards in Trace Explosive Reference
materials on surfaces.
Sample transfer methods coupled to RAIRS promises to be an excellent support means
when used as sensor for explosives detection on surfaces. A grazing angle head coupled to
liquid nitrogen cooled, MCT detector was used to excite and collect IR absorption spectra
from stainless steel surfaces loaded with the explosive. This case study suggests that MIR
reflectance spectroscopy using a fiber-optic probe with grazing angle head is a viable
method for detecting and measuring low (µg/cm2) quantities of organic contaminants on
metallic surfaces. Adding chemometrics algorithms, which are developed and automated
easily, leads to powerful techniques for surface contamination detection.
9. Acknowledgments
Parts of the work presented in this contribution were supported by the U.S. Department of
Defense, University Research Initiative Multidisciplinary University Research Initiative
(URI)-MURI Program, under grant number DAAD19-02-1-0257. The authors also
acknowledge contributions from Mr. Aaron LaPointe from Night Vision and Electronic
Sensors Directorate, Fort Belvoir, VA, Department of Defense, Dr. Jennifer Becker MURI
Program Manager, Army Research Office, DoD and Dr. Stephen J. Lee Chief Scientist,
Science and Technology, Office of the Director, Army Research Office/Army Research
Laboratory, DoD.
Support from the U.S. Department of Homeland Security under Award Number 2008-ST-
061-ED0001 is also acknowledged. However, the views and conclusions contained in this
document are those of the authors and should not be interpreted as necessarily representing
the official policies, either expressed or implied, of the U.S. Department of Homeland
Security.
Thanks are due to Dr. Luis. F De La Torre-Quintana for his assistance with statistical
analysis and coupling with chemometrics routines and for his support and collaboration in
design and preparation some figures.
10. References
Akhavan, J. (2004). The Chemistry of Explosives. 2nd ed. T J International Ltd, Padstow,
Cornwall, UK,
Bacci, M.; Fabbri, M.; Picollo, M.; Porcinai, S. (2001). Non invasive fibre optic Fourier
Transform-infrared reflectance spectroscopy on painted layers identification of
materials by means of principal component analysis and Mahalanobis distance.
Anal. Chim. Acta. 446, 15-21.
www.intechopen.com

Applications of Fiber Optic Coupled-Grazing Angle Probe Reflection-Absorption FTIR Spectroscopy
253
Beebe, K.R.; Pell, R.J.; Seasholtz, M.B. (1998). Chemometrics: A Practical Guide; John Wiley &
Sons, Inc. New York, NY.
Beeson, R. and Skip, R.D., (1998). Thermal ink jet technology –review and outlook, Rung
Research Laboratory, Inkjet Business Unit, Hewlett-Packard Company, Corvallis
Oregon, US 3rd International Conference on Imaging Science. Chongqing, China.
Bellamy, A.J. (1999). Triacetone triperoxide: its chemical destruction. J. Forensic Sci. 44, 603-
608.
Blaudez, D.; Buffeteau, T.; Desbat, B.; Fournier, P.; Ritcey, A.; Pezolet, M. (1998). Infrared
refection – absorption spectroscopy of thin organics films on nonmetallic
substrates: optimal angle of incidence. J. Phys. Chem. B. 102, 99-105.
Bradshaw, A.M.; Schweitzer, E.; R.J.H. Clark.; Hester, R.E. (1988). Infrared reflection absorption
spectroscopy of adsorbed molecules, in spectroscopy of surfaces. John Wiley & Sons, New
York, NY.
Brambilla, G., Loizzo, A., Fontana, L., Strozzi, M., Guarino, A. and Soprano, V. (1997). J Am
Med Assoc., 278, 635.
Demuth, H.; Beale, M. (1998). Neural Network Toolbox for use with MATLAB User’s Guide
Version 3.0; 5th ed.; The MathWorks, Inc., Natick, MA.
Diem, M. (1993). Introduction to Modern Vibrational Spectroscopy, John Wiley, New York, NY.
Evans, H.K.; Tulleners, F.A.J.; Sanchez, B.L.; Rasmussen, C.A. An Unusual Explosive,
Triacetonetriperoxide (TATP). J. Forensic Sci. 1986, 31, 1119-1125 .
Fierro-Mercado, P.M., Primera-Pedrozo, O.M., Hornedo, A., Hernández-Rivera, S.P., An In
situ FTIR Fiber Optic Method for the Detection of Active Pharmaceutical
Ingredients and Excipients on Metallic Substrates, in “Fourier Transform Infrared
Spectroscopy: Developments, Techniques and Applications”, Rees, O.J., ed.,
Chemical Engineering Methods and Technology Series, Nova Science Publishers,
Inc. Hauppauge, NY, third quarter 2010, ISBN: 978-1-61668-835-6.
Griffiths, P.R. and De Haseth, J.A. (1986). Fourier- Transform Infrared Spectrometry. John
Wiley, New York, NY.
Hamilton, M.L.; Perston, B.B.; Harland, P.W.; Williamson, B.E.; Thomson, M.A.; Melling, P.J.
(2005). Org. Process Res. Devel. 9, 337−343.
Helmut, G.; Hans-Ulrich, G. (2002). IR Spectroscopy: An introduction. Wiley-VCH Federal
Republic of Germany.
Hollins, P. (1992). The influence of surface defects on the infrared spectra of adsorbed
species. Surf. Sci. Rep. 16, 51-94
Huberty, C. J. (1994). Applied Discriminant Analysis. Wiley-Interscience, NJ.
Hayden, B.E.; Yates, J.T.; Madey, T.E. (1987). Reflection Absorption infrared spectroscopy, in
Vibrational Spectroscopy of molecules on surfaces. Vol. I. John Wiley & Sons, New York,
N.Y.
http://chesapeake.towson.edu/data/all_electro.asp
http://toxnet.nlm.nih.gov/cgi-bin/sis/htmlgen?HSDB.htm
http://www.wcer.wisc.edu/step/ep301/Spr2000/esselman/IBUb.html
Kaihara, M.; Sato, Y.; Sato, T.; Takahashi, T.; Takahashi, N. (2001). Chemometrics for FT-IR
reflectance spectroscopy. The distinction between the specular and diffuse
reflection. Analytical Sciences. 17, 1701-1704.
www.intechopen.com

Fourier Transforms - New Analytical Approaches and FTIR Strategies
254
Katona, Z.; Vincze, L.; Vegh, Z.; Trompler, A.; Ferenczi-Fodor, K. (2000). Cleaning validation
procedure eased by using over pressured layer chromatographic. J. Pharmaceutical
and Biomedical Analysis. 22, 349-353.
Kevin, J, Kochlowski.; Arbuckle-Keil, G. (2000). Infrared spectroscopy. Anal Chem. 72, 71-
79R.
Kramer, R., (1998). Chemometric Techniques for Quantitative Analysis, Marcel Dekker, New
York, NY.
Kurth, D. (1998). Analysis of artifacts in infrared spectroscopy of thin organic films on
metallic substrates. Langmuir. 14, 6987-6991.
Lavine, B., and Workman, J. Jr. (2002). Chemometrics. Anal Chem. 74, 2763-2770.
Lin-Vien, D.; Colthup, N. B.; Fateley, W. G. and Grasselli, J. G. (1991).The Handbook of Infrared
and Raman Characteristic Frequencies of Organic Molecules; Academic Press, San
Diego, CA.
Mehta, N.K., Goenaga-Polo, J.E., Hernández-Rivera, S.P., and Hernández, D., Thomson,
M.A. and Melling, P.J. (2002). Development of an In-Situ Spectroscopic Method for
Cleaning Validation Using Mid-IR Fiber Optics. Bio Pharm. 15, 36-42.
Mehta, N.; Goenaga, J.; Hernandez-Rivera, S.P.; Hernandez, D.; Thomson, M.; Melling, P.
(2002). Development of an in situ spectroscopic method for cleaning validation
using mid-IR fiber optics. Spectroscopy. 18 (4),14-19.
Melling, P.J. and Shelley, P., (2001). Spectroscopic Accessory for Examining Films and
Coatings on Solid Surfaces. U.S Patent 6,3,10,348, US Patent and Trademark Office,
Washington, DC.
Melling, P, and Thomson, M. (2002). Fiber optic probes for mid-infrared spectrometry. John
Wiley & Sons Ltd., UK.
Mirza, T.; Lunn, M.; Keeley, F.; George, R.; Bodenmiller, J. (1999).Cleaning level acceptance
criteria and high pressure liquid chromatography procedure for the assay of
Meclizine Hydrochloride residue in swabs collected from pharmaceutical
manufacturing equipment surfaces. Journal of Pharmaceutical and Biomedical Analysis.
19, 747-756.
Mizaikoff, B. (2002). Sensory Systems Based on Mid-infrared Transparent Fibers. In
Handbook of Vibrational Spectroscopy, Vol. 2, Eds. Chalmers, J.M. and Griffiths, P.R.
John Wiley & Sons, Chichester, UK.
Nozal, M.; Bernal, J.; Toribio, L.; Martin, M.; Diez, F. (2001). Validation of a liquid
chromatographic method for the determination of ranitidine hydrocloridine
residues on surfaces in the manufacture of pharmaceuticals. J. Chromatogr. A. 919,
87-93.
Otto, M. (1999). Chemometrics. Statistics and Computer Application in Analytical Chemistry.
Wiley-VCH. Federal Republic of Germany.
Pacheco-Londono, L., Santiago, A., Pujols, J., Primera-Pedrozo, O.M., Mattei, A., Ortiz, W.,
Ruiz, O., Ramirez, M., Hernandez-Rivera, S.P., (2007). Characterization of layers of
Tetryl, TNB and HMX on metal surfaces using fiber optics coupled grazing angle-
FTIR. Proc. SPIE Int. Soc. Opt. Eng. 6542, 65423-65410.
Pacheco-Londoño, L.C., Primera-Pedrozo, O.M., Hernández-Rivera, S.P., (2010). Evaluation
of Samples and Standards of Energetic Materials on Surfaces by Grazing Angle-
FTIR Spectroscopy in “Fourier Transform Infrared Spectroscopy: Developments,
www.intechopen.com

Applications of Fiber Optic Coupled-Grazing Angle Probe Reflection-Absorption FTIR Spectroscopy
255
Techniques and Applications”, Rees, O.J., ed., Chemical Engineering Methods and
Technology Series, Nova Science Publishers, Inc. Hauppauge, NY, ISBN: 978-1-
61668-835-6.
Primera-Pedrozo, O.M., Pacheco-Londono, L.C., De la Torre-Quintana, L.F., Hernandez-
Rivera, S.P., Chamberlain, R.T., Lareau, R.T. (2004). Use of fiber optic coupled FT-IR
in detection of explosives on surfaces. Proc. SPIE Int. Soc. Opt. Eng. 5403, 237-245.
Primera-Pedrozo, O.M., Pacheco-Londoño, L., Ruiz, O., Ramirez, M., Soto-Feliciano, Y.M.,
De La Torre-Quintana, L.F., Hernandez-Rivera, S.P., (2005-a). Characterization of
thermal Inkjet technology TNT deposits by fiber optic-grazing angle probe FTIR
spectroscopy. Proc. SPIE Int. Soc. Opt. Eng. 543-552.
Primera-Pedrozo, O.M. (2005-b). MS Thesis, University of Puerto Rico, Mayaguez Campus,
Mayaguez, PR.
Primera-Pedrozo, O.M., Rodriguez, N., Pacheco-Londono, L., Hernandez-Rivera, S.P.,
(2007). Detection of 2,4,6-trinitrotoluene on non-traditional surfaces using fiber
optic coupled grazing angle probe-FTIR. Proc. SPIE Int. Soc. Opt. Eng. 6542, 65423-
65410.
Primera-Pedrozo, O., Soto-Feliciano, Y., Pacheco-Londoño, L., Hernández-Rivera, S. (2008).
High Explosives Mixtures Detection Using Fiber Optics Coupled: Grazing Angle
Probe/Fourier Transform Reflection Absorption Infrared Spectroscopy. Sens
Imaging: Int. J. 9 (3), 27-40.
Primera-Pedrozo, O., Soto-Feliciano, Y., Pacheco-Londoño, L., Hernández-Rivera, S. (2009).
Detection of High Explosives Using Reflection Absorption Infrared Spectroscopy
with Fiber Coupled Grazing Angle Probe/FTIR. Sens Imaging: Int. J. 10 (1), 1-13.
Primera-Pedrozo, O.M., Soto-Feliciano, Y.M., Pacheco-Londoño, L.C., Hernández-Rivera,
S.P., (2010). Fiber Optic-Coupled Grazing Angle Probe-Fourier Transform
Reflection Absorption Infrared Spectroscopy for Analysis of Energetic Materials on
Surfaces, in “Fourier Transform Infrared Spectroscopy: Developments, Techniques
and Applications”, Rees, O.J., ed., Chemical Engineering Methods and Technology
Series, Nova Science Publishers, Inc. Hauppauge, NY, ISBN: 978-1-61668-835-6.
Salleras, L., Donguez, A., Mata, E., Taberrer, J.L., Moro, I. and Salva, P. (1995). Public Health
Rep., Vol 110 pp338-342.
Schrader, B. (1995). Infrared and Raman spectroscopy: Methods and applications, Schrader, B., Ed.
VCH, New York, NY, pp. 215.
Schulte-Ladbeck, R.; Kolla, P.; Karst U. (2003). Trace Analysis of Peroxide-Based Explosives.
Anal. Chem. 75,731-735.
Schulte-Ladbeck, U, Karst. A field test for the detection of peroxide-based explosives. (2002).
Analyst. 127, 1152-1154.
Statgraphics Plus for Windows (1999). Statistical graphics System, User’s Guide version 3.0.
Statistical Graphics Corporation.
Smith, B. Fundamentals of Fourier Transform Infrared Spectroscopy, CRC Press. Boca
Raton, Florida, 2000.
Soto-Feliciano, Y., Primera-Pedrozo, O.M., Pacheco-Londono, L., Hernandez-Rivera, S.P.,
(2006). Temperature dependence of detection limits of TNT on metallic surfaces
using fiber optic coupled FTIR. Proc. SPIE Int. Soc. Opt. Eng. 6201, 62012-62019.
www.intechopen.com

Fourier Transforms - New Analytical Approaches and FTIR Strategies
256
Urbanski, T. (1964). Chemistry and Technology of Explosives. Vol. 1, Macmillan Co.: New York,
NY.
Zitrin, S.; Kraus, S.; Glasttstein, B. (1984). in: Proceedings of the International Symposium,
US Government Printing Office, Washington, DC. pp 137-141.
White, G.M. (1992). An Explosive Drug Case. J. Forensic Sci. 37, 652-656.
www.intechopen.com

Fourier Transforms - New Analytical Approaches and FTIRStrategiesEdited by Prof. Goran Nikolic
ISBN 978-953-307-232-6Hard cover, 520 pagesPublisher InTechPublished online 01, April, 2011Published in print edition April, 2011
InTech EuropeUniversity Campus STeP Ri Slavka Krautzeka 83/A 51000 Rijeka, Croatia Phone: +385 (51) 770 447 Fax: +385 (51) 686 166www.intechopen.com
InTech ChinaUnit 405, Office Block, Hotel Equatorial Shanghai No.65, Yan An Road (West), Shanghai, 200040, China
Phone: +86-21-62489820 Fax: +86-21-62489821
New analytical strategies and techniques are necessary to meet requirements of modern technologies andnew materials. In this sense, this book provides a thorough review of current analytical approaches, industrialpractices, and strategies in Fourier transform application.
How to referenceIn order to correctly reference this scholarly work, feel free to copy and paste the following:
Oliva M. Primera-Pedrozo, Leonardo C. Pacheco-London ̃o and Samuel P. Hernandez-Rivera (2011).Applications of Fiber Optic Coupled-Grazing Angle Probe Reflection-Absorption FTIR Spectroscopy, FourierTransforms - New Analytical Approaches and FTIR Strategies, Prof. Goran Nikolic (Ed.), ISBN: 978-953-307-232-6, InTech, Available from: http://www.intechopen.com/books/fourier-transforms-new-analytical-approaches-and-ftir-strategies/applications-of-fiber-optic-coupled-grazing-angle-probe-reflection-absorption-ftir-spectroscopy

© 2011 The Author(s). Licensee IntechOpen. This chapter is distributedunder the terms of the Creative Commons Attribution-NonCommercial-ShareAlike-3.0 License, which permits use, distribution and reproduction fornon-commercial purposes, provided the original is properly cited andderivative works building on this content are distributed under the samelicense.
Top Related