


Languages
Pages
Legal

AM
DO
CS
LIM
ITE
D A
NN
UA
L R
EP
OR
T 2006
Copyright © Amdocs 2006. All Rights Reserved. Reproduction or distribution other than for intended purposes is prohibited, without the prior written consent of Amdocs. Amdocs reserves the right to revise this document and to make changes in the content from time to time without notice. Amdocs may make improvements and/or changes to the product(s) and/or programs described in this document any time. The trademarks and service marks of Amdocs, including the Amdocs mark and logo, Ensemble, Enabler, Clarify, Return on Relationship, Intelecable, Collabrent, Intentional Customer Experience, Cramer and Qpass are the exclusive property of Amdocs, and may not be used without permission. All other marks are the property of their respective owners.
ANNUAL REPORT 2006WWW.AMDOCS.COM


WITH SUPPORT ACROSS ANY CHANNEL FOR
ANY SERVICE, ANYWHERE, ON ANY DEVICE,
ACROSS ANY NETWORK, WE HELP TO ENSURE
AN EXPERIENCE THAT IS CONSISTENTLY
SIMPLE, UNIQUELY PERSONAL AND IMMEDIATELY
VALUABLE. AS SERVICE PROVIDERS EVOLVE
TO HARNESS CONVERGENCE AND DELIVER
NEXT-GENERATION SERVICES, WE SEE OUR
OFFERINGS HELPING TO TRANSFORM OUR
INDUSTRY, ONE INTERACTION AT A TIME.
2006 Annual Report 1

Perhaps the best testament to our growth and industry leadership was our landmark win with Sprint Nextel at the beginning of the calendar year.
The newly merged US communications giant chose Amdocs to provide a single billing and customer care platform for its more than 51.9 million
wireless subscribers. Our eight-year agreement continues the combined company’s integration efforts, providing its customers with a comprehensive,
consolidated wireless experience. Dick LeFave, chief information officer for Sprint Nextel, explained, “We selected Amdocs to support Sprint Nextel
because of its extensive experience in the industry and its ability to adapt to our customers’ changing needs and [our] growing portfolio of products
and services.”
We consider the Sprint Nextel win a clear signal that, by enabling our customers’ ICM strategies and the intentional customer experience™ that
sets them apart, Amdocs is the trusted advisor for service providers as they evolve and deliver next-generation services in a complex, converging,
consolidating and highly competitive market. As fiscal 2006 unfolded, our results, sales wins and accolades continued, in our view, to validate
our position.
IN FISCAL YEAR 2006, AMDOCS GREW BY EVERY MEASURE. WE ENDED A RECORD YEAR
WITH REVENUE OF $2.48 BILLION, A 22% IMPROVEMENT OVER 2005. WE GREW OUR
WORKFORCE TO MORE THAN 16,000 PEOPLE, DOUBLING IN SIX YEARS THE NUMBER
OF PEOPLE WHO DELIVER THE INTEGRATED CUSTOMER MANAGEMENT (ICM) VISION
TO THE WORLD’S LARGEST SERVICE PROVIDERS. AND WE SCALED OUR BUSINESS TO
SPAN THE COMMUNICATIONS, MEDIA AND ENTERTAINMENT INDUSTRIES: GAINING
COMPETENCE IN DIGITAL COMMERCE AND OPERATIONS SUPPORT SYSTEMS (OSS)
AND SOLIDIFYING OUR POSITION IN BROADBAND MEDIA, WHILE ANTICIPATING AND
GROWING WITH THE CHANGES IN OUR CUSTOMERS’ LANDSCAPE.
FELLOW AMDOCS SHAREHOLDER:
2 Amdocs Limited

Bruce K. Anderson Chairman of the Board
BY ENABLING OUR CUSTOMERS’ ICM
STRATEGIES AND THE INTENTIONAL
CUSTOMER EXPERIENCE THAT SETS
THEM APART, AMDOCS IS THE TRUSTED
ADVISOR FOR SERVICE PROVIDERS AS
THEY EVOLVE AND DELIVER NEXT-
GENERATION SERVICES IN A COMPLEX,
CONVERGING, CONSOLIDATING AND
HIGHLY COMPETITIVE MARKET.
Dov Baharav President and Chief Executive Officer
2006 Annual Report 3

Eli Gelman Executive Vice President and Chief Operating Officer
Ron Moskovitz Senior Vice President and Chief Financial Officer
In fiscal year 2006, Amdocs grew
by every measure. We ended a record
year with revenue of $2.48 billion,
a 22% improvement over 2005.
4 Amdocs Limited
WITH EACH ACQUISITION, WE SOUGHT
TO EXPAND OUR COMPETENCIES,
ENRICH OUR OFFERINGS TO SPAN
THE MULTIPLAY OF VOICE, DATA AND
CONTENT SERVICES, AND SPREAD OUR
GLOBAL REACH TO GET CLOSER TO AND
BETTER SERVE OUR CUSTOMERS. WE
BELIEVE EACH OF THEM ACHIEVED
THESE GOALS AND MORE: THEY
STRENGTHENED OUR REPUTATION
FOR ACQUISITION EXCELLENCE, BOTH
IN SELECTION AND ASSIMILATION.

ADDRESSING CONVERGENCE
Acquisitions remain a valuable tool to execute our growth strategy.
On the news of our acquisition of Cramer—one of three acquisitions
we made in fiscal 2006—Stratecast, a division of industry research
and analysis firm Frost & Sullivan, reported: “Amdocs is strategically
positioning to better address the process and solution needs of its
customers brought on by technology convergence. In turn, this strategy
is increasing its leadership in the OSS/BSS space.” The firm’s praise was
consistent with other industry watchers’ opinions not just of our Cramer
buy, but of our acquisitions of Stibo Graphic Software and Qpass in 2006
and of DST Innovis and Longshine Information Technology Company
in 2005. With each acquisition, we sought to expand our competencies,
enrich our offerings to span the multiplay of voice, data and content
services, and spread our global reach to get closer to and better serve our
customers. We believe each of them achieved these goals, and more: they
strengthened our reputation for acquisition excellence, both in selection
and assimilation.
When we acquired DST Innovis, we quickly integrated its leading
capabilities to directly address broadband media issues in all Amdocs
offerings. In fiscal 2006, our broadband communications and media
business, led by Brian Shepherd, formerly of DST Innovis, secured and
enriched our customer base and garnered acceptance of our roadmap
with many wins, including:
> DIRECTV, the world’s largest satellite TV service provider and
our customer since 1994, expanded and extended its relationship with
Amdocs until 2012. Under the terms of the expanded agreement
Amdocs will continue to provide DIRECTV with customer-facing
business support systems, such as billing and customer management, to
its more than 15.5 million subscribers, and will provide additional
consulting services.
> Jupiter Telecommunications Co. (J:COM), Japan’s largest cable
provider, extended its existing contract with Amdocs through 2009.
“We recently completed a rigorous market analysis and found that
Amdocs is the best company to address the complexities of service
convergence,” said Masakazu Kawabata, director of IT at J:COM. We
will continue to help unify J:COM’s customer service across markets
and launch new technologies, services and multiplay bundles quickly
and cost-efficiently.
> US-based Cable One extended its relationship with Amdocs for
another three years. Amdocs’ solutions—including order entry,
service provisioning, billing and bill statement design—have been
supporting Cable One’s customer management operations since
1978. The contract extension will assist Cable One in offering bundled
services and support its goal of providing low-cost basic cable, digital
cable and high-speed Internet services.
With our 2005 acquisition of China’s foremost customer care and billing
provider, Longshine, we believe we made a definitive entrance in the
important Chinese market with a strong local presence and trusted
leadership. In fiscal 2006, Amdocs Longshine counted among its wins an
important new contract with Jilin Unicom, a division of China Unicom.
Amdocs already supported the company’s GSM billing and mediation
capabilities. Under the new contract, we will consolidate and upgrade its
current rating and billing systems to create an integrated platform that
allows its customers to personalize product bundles and choose flexible
pricing plans, and supports its launch of long-distance, SMS and future
value-added services.
In May, we acquired Qpass, a company highly regarded for its digital
commerce software and solutions. We quickly integrated Qpass’
products, its 320 employees and leaders such as Chase Franklin and
Sterling Wilson, who now serve as chief strategist and president of
the Qpass, Amdocs Digital Commerce Division. Four months after
we completed the acquisition, we launched the innovative Qpass 6
portfolio, which is currently the only solution available that allows
consumers to find and buy any kind of digital content over any network,
on any interactive device.
Our Qpass acquisition affords us a leading role in the rapidly expanding
digital commerce market. From 2003 to October 2006, the Qpass
platform processed more than $1.5 billion in premium content in more
than 590 million transactions. And in the first six months of 2006 alone,
Qpass processed nearly half a billion dollars in premium content services,
averaging growth of 12% in that time. The average price per transaction
at the end of June 2006 was $3.17, up from $2.54 a year ago, primarily
driven by an increase in the sale of mobile games and addition of new
video content.
2006 Annual Report 5

In August, we completed our acquisition of Cramer. A preeminent
name in OSS, Cramer brings the talent of more than 500 employees,
and industry-leading products and capabilities like network resource
management, activation and auto discovery that complement Amdocs’
existing assets. We believe the acquisition enables us to expand our
service management and OSS offerings to support large-scale OSS
transformation projects.
Under the continued leadership of Guy Dubois, who now serves as
president of the Cramer, Amdocs OSS Division, we came together
quickly to offer the Amdocs Cramer6 OSS Suite, making Amdocs the
only company to deliver an end-to-end solution spanning OSS and BSS.
As a result, service providers using Amdocs’ products and services can
now manage and optimize their entire services supply chain, from the
demand side (customers) to the supply side (network), while enabling
the business processes in between, such as introduction, fulfillment and
assurance of services.
Patrick Kelly, co-founder of industry analyst firm OSS Observer,
noted our comprehensive, front- and back-office competence.
“As communication service providers push toward greater OSS/BSS
convergence, Amdocs’ portfolio is the most comprehensive offering in
the market,” Patrick said. And in markets around the world, on the
strength of our offering, we won new business, including a new multi-
year contract with Telstra Corporation, Australia’s leading media-
communications company. Telstra selected Amdocs (and prior to the
acquisition had selected Cramer) as a key software and services provider
to support its IT transformation program. Under the agreement,
Amdocs’ solutions, including the Amdocs Service Management Suite
and Amdocs Cramer6 OSS Suite, will reduce complexity and costs
associated with bringing new Internet Protocol (IP)-based services to
its wireline, wireless and broadband customers.
A LEADER IN OUR VERTICAL
Even as we build our profile in adjacent markets, we remain committed
to our core market. In its October 1 edition, CRM Magazine reported:
“No player…has a tighter grip on a particular vertical than Amdocs has
on telecommunications.”
Amdocs’ leadership in the communications and media space is
underscored by wins with key players in the industry—companies
shaping the landscape with innovative projects and products, and
cutting-edge Amdocs-powered front- and back-office environments to
support them. In addition to those described above, fiscal 2006 included
these major wins:
> Rogers Communications, a diversified Canadian communications
and media company, chose Amdocs CRM to support its cable,
wireless and telecom lines of business. The implementation is part of
Rogers’ ICM strategy rollout, which is designed to provide a consistent
customer experience to its more than 10 million subscribers.
It extends our longstanding relationship with Rogers, which uses
Amdocs’ billing software to support its various lines of business.
> Vimpel-Communications (VimpelCom), a leading provider of
telecommunications to Russia and the Commonwealth of
Independent States (CIS), and its affiliates across the CIS will
standardize on Amdocs technology to manage their customers’
experience. In Russia, VimpelCom has successfully implemented
Amdocs Billing, Amdocs CRM and Amdocs Self Service to support its
more than 40 million corporate and individual subscribers.
6 Amdocs Limited

Harel Kodesh Chief Products Officer
Michael Matthews Chief Marketing Officer
Amdocs 7 is designed to help our customers
profit from the evolution to next-generation
services as it lowers their total cost of
ownership, and helps them deliver an innovative,
integrated and intentional customer experience.
THE WORK WE DO WITH TIER 1 AND
TIER 2 SERVICES PROVIDERS CARRIES
WITH IT AN IMPORTANT RESPONSIBILITY:
THE DAY-TO DAY CUSTOMER EXPERIENCE
OF MORE THAN A BILLION PEOPLE—OUR
CUSTOMERS’ CUSTOMERS—EVERY DAY.
2006 Annual Report 7

8 Amdocs Limited
Sterling WilsonDivision PresidentQpass, Amdocs Digital Commerce Division(Former President of Qpass)
Chase Franklin Chief Strategist Qpass, Amdocs Digital Commerce Division(Former CEO of Qpass)
Four months after we completed our
acquisition, we launched the innovative
Qpass 6 portfolio, which is currently
the only solution available that allows
consumers to find and buy any kind of
digital content over any network on any
interactive device.

The work we do with these and other tier 1 and tier 2 services
providers carries with it an important responsibility: the day-to-day
customer experience of more than a billion people—our customers’
customers —every day. With support across any channel for any service,
anywhere, on any device, across any network, we help to ensure an
experience that is consistently simple, uniquely personal and
immediately valuable. As service providers evolve to harness convergence
and deliver next-generation services, we see our offerings helping to
transform our industry, one interaction at a time.
Throughout 2006, our talented software developers worked to complete
Amdocs 7, the only industry-specific application suite for convergence.
Backed by our consulting, managed and systems integration services,
Amdocs 7 is designed to help our customers profit from the evolution
to next-generation services as it lowers their total cost of ownership
(TCO), and helps them deliver an innovative, integrated and
intentional customer experience. In October 2006, we made available two
cornerstone products of our Amdocs 7 portfolio: Amdocs Billing 7
and Amdocs Mediation 7. We will launch all other components in early
calendar year 2007.
It should also be noted that in fiscal 2006, we significantly enhanced our
ability to reliably deliver solutions no matter the challenge. We aligned
our business to harvest best-practices and share core competencies more
efficiently, seeking not only to work smarter but improve our customers’
TCO over the life of our relationship.
Our services—consulting, systems implementation and integration,
managed services and process optimization—are a critical component
of our ability to enable customers’ journey toward the next generation.
Services are integral to everything we do. We believe our unique
combination of innovative software products, comprehensive services
and deep business knowledge is fundamental to our success. In fiscal
2006, the Amdocs Consulting Division gained scale in Europe and North
America and enjoyed positive results, contributing to our own financial
success and adding significantly to the strategic value we bring to our
customers. Key services wins included:
> Vodafone Netherlands, one of The Netherlands’ largest mobile
providers, signed a five-year agreement for Amdocs to manage
its wholesale and retail billing, provisioning and partner settlement
operations. The agreement follows successful implementations of
Amdocs Billing, Amdocs Partner Manager and Amdocs Document
Designer at Vodafone Netherlands and will call for an even closer
business collaboration between our two companies. According to
Guy Laurence, chief executive officer of Vodafone Netherlands,
“Amdocs has been driving some of the largest and most complex
business transformations in the communications industry for nearly
a quarter of a century. This current managed services contract allows
us to leverage that experience.”
> Amdocs provided implementation services to help T-Mobile UK
launch Flext, the country’s first flexible postpaid price plan. Flext is
a strategic initiative for T-Mobile UK to reduce tariff confusion and
bill shock, introduce new standards of value and flexibility, and
attract and retain customers. Flext’s launch was T-Mobile UK’s biggest
ever, and it has become its fastest selling postpaid product. Amdocs
has a longstanding relationship with T-Mobile UK, which already
operates Amdocs billing systems for its postpaid business.
2006 Annual Report 9

We believe our acquisition of Cramer
enables us to expand our service
management and OSS offerings to
support large-scale OSS
transformation projects.
Guy DuboisDivision PresidentCramer, Amdocs OSS Division(Former President and CEO of Cramer)
Brian ShepherdDivision President(Former Senior Vice Presidentof DST Innovis)
In fiscal 2006, our broadband
communications and media business
secured and enriched our customer
base and garnered acceptance of our
roadmap with many wins.
10 Amdocs Limited

INTENTIONAL, INTEGRATED, INNOVATIVE
Looking ahead to fiscal year 2007, we see an industry largely driven
by the “four C’s”—consolidation, convergence, competition and the
customer—and we believe our strategy has positioned us to lead in
this environment. We believe Amdocs is uniquely able to help service
providers of all kinds to build a customer experience that is integrated,
innovative and intentional. These three core attributes will help them
(and us) execute their integrated customer management strategies and
achieve service, operational and financial excellence in a next-generation,
converged world.
In fiscal 2007, we aim to maintain our direction by growing our core
business and accelerating growth in our newly acquired competencies
in broadband media, content and OSS. We expect to expand our
addressable market, continue to build success in financial services and
explore formative opportunities in adjacent areas like interactive
advertising, and in emerging markets where average revenue per user
may be low but the ceiling for growth is high. We also expect to broaden
our managed services offerings, ever mindful of customers’ need to
lower their TCO.
With a successful strategy, the industry’s most comprehensive product
and service offerings, a most experienced management team, and
a global workforce committed to excellence, we look forward to fiscal
2007 as we continue our strong heritage of delivering superior value to
our customers and shareholders, even as—or perhaps, especially as—
the next generation unfolds.
2006 Annual Report 11
Bruce K. AndersonChairman of the BoardAmdocs Limited
November 30, 2006
Dov BaharavPresident and Chief Executive Officer,Amdocs Management Limited;Director, Amdocs Limited

12 Amdocs Limited
AMDOCSFINANCIAL HIGHLIGHTS
2006 2005 2004
Total Revenue 2,480,050 2,038,621 1,773,732
Operating Income (1) 332,132 338,492 296,200
Net Income (1)(2) 318,636 288,636 234,860
Net Cash from Operating Activities 429,220 381,751 344,404
Diluted Earnings Per Share (1)(2) 1.48 1.35 1.08
SELECTED FINANCIAL DATA ( a l l d a t a i n t h o u s a n d s , e x c e p t p e r s h a r e d a t a )
$
$
$
$
$
$
$
$
$
$
(1) Includes amortization of purchased intangible assets, in 2006 equity-based compensation expense, in 2006 and 2005 write-off of purchased in-process research and
development and in 2005 restructuring charges and other acquisition related costs.
(2) Includes related tax effect.
$
$
$
$
$

(2) Includes related tax effect.
(3) Includes amortization of purchased intangible assets, in 2006 equity-based compensation expense, in 2002 amortization of goodwill, in 2005 other acquisition related costs,
in 2003 the cumulative effect for the Company’s 10% share in Certen Inc.’s pre-acquisition results, in 2006, 2005 and 2002 write-off of purchased in-process research and
development, and in 2005, 2003 and 2002 restructuring charges.
(4) Includes short-term interest-bearing investments.
2006 2005 2004
Total Revenue 2,480,050 2,038,621 1,773,732
Operating Income (1) 332,132 338,492 296,200
Net Income (1)(2) 318,636 288,636 234,860
Net Cash from Operating Activities 429,220 381,751 344,404
Diluted Earnings Per Share (1)(2) 1.48 1.35 1.08
SELECTED FINANCIAL DATA ( a l l d a t a i n t h o u s a n d s , e x c e p t p e r s h a r e d a t a )
$
$
$
$
$
$
$
$
$
$
$
$
$
$
$
QUARTERLY REVENUE ($ millions)
Q4/
05
Q1/
06
Q2/
06
Q3/
06
Q4/
06
720
0
648
576
504
432
360
288
216
144
72
2006 Annual Report 13
REVENUE ($ millions)
CASH BALANCES ($ millions)(4) R&D INVESTMENT ($ millions)
2,500
0
2002
2003
2004
2005
2006
2,225
2,000
1,750
1,500
1,225
1,000
750
500
250
2002
2003
2004
2005
2006
1.53
-0.17)
1.36
1.19
1.02
0.85
0.68
0.51
0.34
0.17
0
2002
2003
2004
2005
2006
1,400
0
1,260
1,120
980
840
700
560
420
280
140
2002
2003
2004
2005
2006
200
0
180
160
140
120
100
80
60
40
20
DILUTED EPS ($)(2)(3)
2002
2003
2004
2005
2006
288
324
252
216
180
144
108
72
36
0
-32
NET INCOME ($ millions)(2)(3)
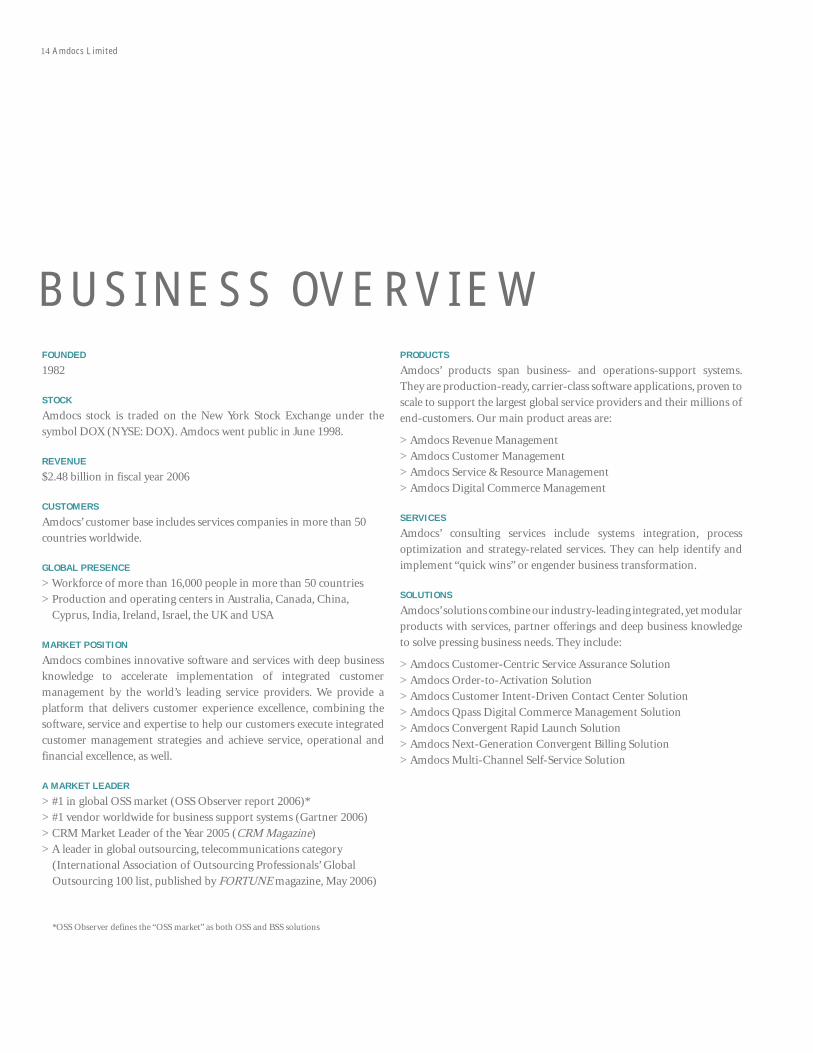
FOUNDED
1982
STOCK
Amdocs stock is traded on the New York Stock Exchange under the
symbol DOX (NYSE: DOX). Amdocs went public in June 1998.
REVENUE
$2.48 billion in fiscal year 2006
CUSTOMERS
Amdocs’ customer base includes services companies in more than 50
countries worldwide.
GLOBAL PRESENCE
> Workforce of more than 16,000 people in more than 50 countries
> Production and operating centers in Australia, Canada, China,
Cyprus, India, Ireland, Israel, the UK and USA
MARKET POSITION
Amdocs combines innovative software and services with deep business
knowledge to accelerate implementation of integrated customer
management by the world’s leading service providers. We provide a
platform that delivers customer experience excellence, combining the
software, service and expertise to help our customers execute integrated
customer management strategies and achieve service, operational and
financial excellence, as well.
A MARKET LEADER
> #1 in global OSS market (OSS Observer report 2006)*
> #1 vendor worldwide for business support systems (Gartner 2006)
> CRM Market Leader of the Year 2005 (CRM Magazine)
> A leader in global outsourcing, telecommunications category
(International Association of Outsourcing Professionals’ Global
Outsourcing 100 list, published by FORTUNE magazine, May 2006)
*OSS Observer defines the “OSS market” as both OSS and BSS solutions
PRODUCTS
Amdocs’ products span business- and operations-support systems.
They are production-ready, carrier-class software applications, proven to
scale to support the largest global service providers and their millions of
end-customers. Our main product areas are:
> Amdocs Revenue Management
> Amdocs Customer Management
> Amdocs Service & Resource Management
> Amdocs Digital Commerce Management
SERVICES
Amdocs’ consulting services include systems integration, process
optimization and strategy-related services. They can help identify and
implement “quick wins” or engender business transformation.
SOLUTIONS
Amdocs’ solutions combine our industry-leading integrated, yet modular
products with services, partner offerings and deep business knowledge
to solve pressing business needs. They include:
> Amdocs Customer-Centric Service Assurance Solution
> Amdocs Order-to-Activation Solution
> Amdocs Customer Intent-Driven Contact Center Solution
> Amdocs Qpass Digital Commerce Management Solution
> Amdocs Convergent Rapid Launch Solution
> Amdocs Next-Generation Convergent Billing Solution
> Amdocs Multi-Channel Self-Service Solution
BUSINESS OVERVIEW
14 Amdocs Limited

ABN AMRO
ALLTEL
ANUNCIOS EN DIRECTORIOS S.A. DE C.V
AT&T
AT&T YELLOW PAGES
BEIJING MOBILE COMMUNICATIONS
CORPORATION
BELGACOM
BELL CANADA
BELLSOUTH ADVERTISING AND
PUBLISHING CORPORATION
BEZEQ
BRASIL TELECOM
BT
CABLECOM
CELL C
CELLCOM ISRAEL
CENTURYTEL
CHINA MOBILE
CHINA NETCOM
CHINA TELECOM
CHINA UNICOM
CINGULAR WIRELESS
CLARO
COMCAST
CORTAL CONSORS SA
COSMOTE
DEUTSCHE TELEKOM
DIRECTV
ELISA
EUROPEAN DIRECTORIES
EXCELCOM
FAR EASTONE TELECOMMUNICATIONS
IDEARC MEDIA CORPORATION
J:COM
JILIN UNICOM
KAR-TEL
KPN MOBILE
KT FREETEL
MAXIS
MEGAFON MOSCOW
MOBILKOM AUSTRIA
O2 IRELAND
ONO CABLEUROPA
OPTUS
ORANGE BUSINESS SERVICE
PAGES JAUNES
PANNON GSM
QWEST
RH DONNELLEY
ROGERS
ROMTELECOM
SEAT PAGINE GIALLE S.P.A.
SFR GROUP
SLOVAK TELECOM
SONOFON
SPRINT NEXTEL
SUNRISE
SVYAZINVEST
TDC
TELE2UTA
TELEFONICA DE ESPAÑA
TELEFONICA PUBLICIDAD E INFORMATION
TELEKOM AUSTRIA
TELEWEST
TELIA MOBILE DENMARK
TELIASONERA
TELINDUS
TELKOM SOUTH AFRICA
TELSTRA
TELUS
TERACOM
T-MOBILE AUSTRIA
T-MOBILE CZECH REPUBLIC
T-MOBILE DEUTSCHLAND
T-MOBILE HUNGARY
T-MOBILE NETHERLANDS
T-MOBILE UK
T-MOBILE USA
TV CABO
US CELLULAR
VERIZON COMMUNICATIONS
VERIZON COMMUNICATIONS
INTERNATIONAL
VIMPELCOM
VODAFONE AUSTRALIA
VODAFONE D2
VODAFONE HUNGARY
VODAFONE IRELAND
VODAFONE ITALY
VODAFONE NETHERLANDS
VODAFONE ROMANIA
VODAFONE SPAIN
VODAFONE UK
YELLOW PAGES GROUP
SELECT CUSTOMERS
2006 Annual Report 15


AMDOCS FINANCIAL REVIEW18 OPERATING AND FINANCIAL REVIEW AND PROSPECTS
39 MANAGEMENT’S REPORT ON INTERNAL CONTROL OVER FINANCIAL REPORTING
40 REPORTS OF INDEPENDENT REGISTERED PUBLIC ACCOUNTING FIRM
42 CONSOLIDATED BALANCE SHEETS AS OF SEPTEMBER 30, 2006 AND 2005
43 CONSOLIDATED STATEMENTS OF INCOME FOR THE YEARS ENDED SEPTEMBER 30, 2006, 2005 AND 2004
44 CONSOLIDATED STATEMENTS OF CHANGES IN SHAREHOLDERS’ EQUITYFOR THE YEARS ENDED SEPTEMBER 30, 2006, 2005 AND 2004
46 CONSOLIDATED STATEMENTS OF CASH FLOWS FOR THE YEARS ENDED SEPTEMBER 30, 2006, 2005 AND 2004
48 NOTES TO CONSOLIDATED FINANCIAL STATEMENTS
78 CORPORATE INFORMATION
2006 Annual Report 17

18 Amdocs Limited
OPERATING AND FINANCIALREVIEW AND PROSPECTSFORWARD-LOOKING STATEMENTS
This document contains forward-looking statements (within the meaning of the United States federal securities laws) that involve
substantial risks and uncertainties. You can identify these forward-looking statements by words such as “expect,” “anticipate,” “believe,”
“seek,”“estimate,”“project,”“forecast,”“continue,”“potential,”“should,” “would,” “could”,“intend” and “may,” and other words that convey
uncertainty of future events or outcome. Statements that we make in this document that are not statements of historical fact also may be
forward-looking statements. Forward-looking statements are not guarantees of future performance, and involve risks, uncertainties and
assumptions that may cause our actual results to differ materially from the expectations that we describe in our forward-looking
statements. There may be events in the future that we are not accurately able to predict, or over which we have no control. You should not
place undue reliance on forward-looking statements. We do not promise to notify you if we learn that our assumptions or projections are
wrong for any reason. We disclaim any obligation to update our forward-looking statements, except where applicable law may otherwise
require us to do so.
Important factors that may affect these projections or expectations include, but are not limited to: changes in the overall economy;
changes in competition in markets in which we operate; changes in the demand for our products and services; consolidation within the
industries in which our customers operate; the loss of a significant customer; changes in the telecommunications regulatory environment;
changes in technology that impact both the markets we serve and the types of products and services we offer; financial difficulties of our
customers; losses of key personnel; difficulties in completing or integrating acquisitions; litigation and regulatory proceedings; and acts
of war or terrorism. For a discussion of these important factors and other risks, please read the information set forth under the caption
“Risk Factors” in our Annual Report on Form 20-F filed with the United States Securities and Exchange Commission (“SEC”).
INTRODUCTION
In this section, we discuss the general financial condition and the results of operations for Amdocs Limited and its subsidiaries, including:
> the factors that affect our business,
> our revenue and costs for the fiscal years ended September 30, 2006, 2005 and 2004,
> the reasons why such revenue and costs were different from year to year,
> the sources of our revenue,
> how all of this affects our overall financial condition,
> our capital expenditures for the fiscal years ended September 30, 2006, 2005 and 2004,
> the changes in our business, including those resulting from acquisitions of other businesses, and
> the sources of our cash to pay for future capital expenditures and possible acquisitions.
Operating and Financial Review and Prospects (continued) 2006 Annual Report 19
In this section, we also analyze and explain the annual changes in the specific line items in our consolidated statements of income. You
should read this section in conjunction with our consolidated financial statements and the notes thereto, which follow.
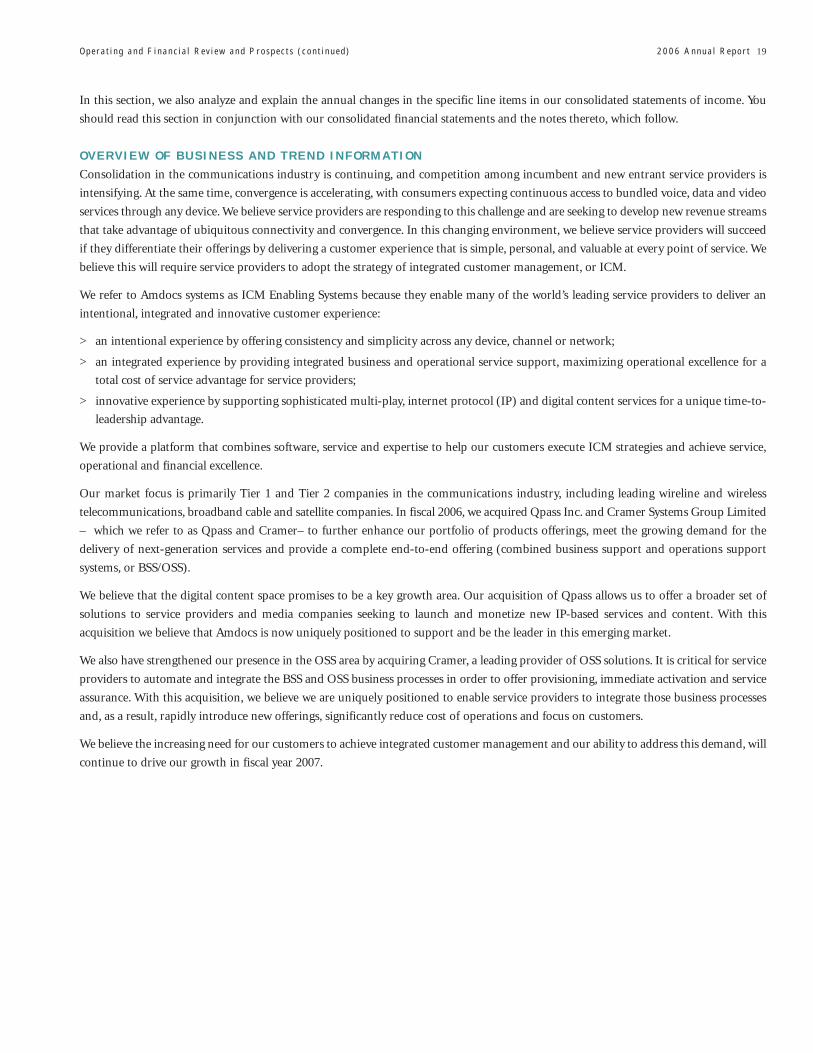
OVERVIEW OF BUSINESS AND TREND INFORMATION
Consolidation in the communications industry is continuing, and competition among incumbent and new entrant service providers is
intensifying. At the same time, convergence is accelerating, with consumers expecting continuous access to bundled voice, data and video
services through any device. We believe service providers are responding to this challenge and are seeking to develop new revenue streams
that take advantage of ubiquitous connectivity and convergence. In this changing environment, we believe service providers will succeed
if they differentiate their offerings by delivering a customer experience that is simple, personal, and valuable at every point of service. We
believe this will require service providers to adopt the strategy of integrated customer management, or ICM.
We refer to Amdocs systems as ICM Enabling Systems because they enable many of the world’s leading service providers to deliver an
intentional, integrated and innovative customer experience:
> an intentional experience by offering consistency and simplicity across any device, channel or network;
> an integrated experience by providing integrated business and operational service support, maximizing operational excellence for a
total cost of service advantage for service providers;
> innovative experience by supporting sophisticated multi-play, internet protocol (IP) and digital content services for a unique time-to-
leadership advantage.
We provide a platform that combines software, service and expertise to help our customers execute ICM strategies and achieve service,
operational and financial excellence.
Our market focus is primarily Tier 1 and Tier 2 companies in the communications industry, including leading wireline and wireless
telecommunications, broadband cable and satellite companies. In fiscal 2006, we acquired Qpass Inc. and Cramer Systems Group Limited
– which we refer to as Qpass and Cramer– to further enhance our portfolio of products offerings, meet the growing demand for the
delivery of next-generation services and provide a complete end-to-end offering (combined business support and operations support
systems, or BSS/OSS).
We believe that the digital content space promises to be a key growth area. Our acquisition of Qpass allows us to offer a broader set of
solutions to service providers and media companies seeking to launch and monetize new IP-based services and content. With this
acquisition we believe that Amdocs is now uniquely positioned to support and be the leader in this emerging market.
We also have strengthened our presence in the OSS area by acquiring Cramer, a leading provider of OSS solutions. It is critical for service
providers to automate and integrate the BSS and OSS business processes in order to offer provisioning, immediate activation and service
assurance. With this acquisition, we believe we are uniquely positioned to enable service providers to integrate those business processes
and, as a result, rapidly introduce new offerings, significantly reduce cost of operations and focus on customers.
We believe the increasing need for our customers to achieve integrated customer management and our ability to address this demand, will
continue to drive our growth in fiscal year 2007.

20 Amdocs Limited Operating and Financial Review and Prospects (continued)
OFFERINGS
Amdocs provides a broad portfolio of integrated, modular software products, with proven functionality and scalability, accompanied by
a comprehensive range of business consulting, system implementation and integration services. Our portfolio of product offerings
includes revenue management (including billing, mediation and partner settlement), customer management (including ordering,
customer relationship management, or CRM and self-service), service and resource management (including fulfillment, activation,
inventory management, network planning and customer assurance) and digital commerce management (including content revenue
management). We refer to these offerings collectively as ICM Enabling Systems. In fiscal 2006, our total revenue was $2,480.0 million, of
which $2,201.2 million, or 88.8%, was attributable to the sale of ICM Enabling Systems.
Our portfolio also includes a full range of directory sales and publishing systems, which we refer to as Directory Systems, for publishers
of both traditional printed yellow page and white page directories and electronic Internet directories.
We have designed the Amdocs ICM Enabling Systems to meet the mission-critical needs of leading communications service providers
throughout the entire customer lifecycle. We support different lines of business, including wireline, wireless, cable and satellite, and a wide
range of communications services, including voice, video, data, IP, broadband, content, electronic and mobile commerce. We also support
companies that offer multiple service packages, commonly referred to as bundled or convergent service packages. Due to the complexity
of our customers’ projects and the expertise required for systems support, we also provide information technology, or IT, services,
including extensive consulting, business strategy, system implementation, training, integration, modification, ongoing support,
enhancement and maintenance services. In addition, we offer Managed Services, which include services such as system modernization and
consolidation, the operation of data centers, ongoing support, maintenance services, system modification, the provision of rating and
billing services and communications facility management services. All IT and Managed Services are provided to our customers on a fixed
or unit charge basis or a combination of the two.
Revenue from Managed Services arrangements (from the sale of ICM Enabling Systems and Directory Systems) is included in both license
and service revenue. Managed Services projects are a significant part of our business, accounting for approximately 35% and 40% of our
fiscal 2006 and 2005 revenues, respectively, and generating substantial, long-term revenue streams, cash flow and operating income. In the
initial period of our Managed Services projects, we generally invest in modernization and consolidation of the customer’s systems.
Invoices are usually structured on a periodic fixed or unit charge basis. As a result, Managed Services projects can be less profitable in the
initial period. Margins tend to improve over time as we benefit from the operational efficiencies provided by system modernization and
consolidation.
We are also leveraging our experience by working with service providers in the financial services sector, because some of the challenges
faced by companies in this sector are similar to those encountered by communications service providers.
We conduct our business globally, and, as a result we are subject to the effects of global economic conditions and, in particular, market
conditions in the communications industry. In fiscal 2006, customers in North America accounted for 69.9% of our revenue, while
customers in Europe and the rest of the world accounted for 21.8% and 8.3%, respectively. We maintain development facilities in Canada,
China, Cyprus, India, Ireland, Israel and the United States.

Operating and Financial Review and Prospects (continued) 2006 Annual Report 21
We believe that demand for our ICM Enabling Systems is primarily driven by the following key factors:
Industry transformation, including:
> global use of communications and content services,
> increase in digital and mobile commerce,
> ongoing consolidation within the communications industry, and
> continued convergence of communications, broadband cable and satellite industries.
Technology advances, such as:
> emergence of new communications products and services, especially video, broadband, data and content services, including IP-based
services, such as Internet Protocol Television (IPTV) and Voice over IP (VoIP),
> evolution to next generation networks such as IP Multimedia Subsystem (IMS), that enable truly converged services offerings like
fixed-mobile convergence, and
> technological changes, such as the introduction of 3G wireless technology, next-generation content systems and WiFi- and WiMax-
based access technologies.
Customer focus, such as:
> the desire of service providers to focus on their customers in order to build profitable customer relationships,
> the “authority shift” toward the consumer, with customers demanding new, innovative services that can be accessed anytime and
anywhere, as well as higher levels of customer service, and
> the need for service providers to differentiate themselves by creating a unique and mutually valuable customer experience.
The need for operational efficiency including:
> the shift from in-house management to vendor solutions,
> business needs of service providers to reduce costs and lower total cost of ownership while retaining high value customers in a highly
competitive environment,
> automating and integrating business processes that span across business support systems (BSS) and operations support systems
(OSS), and
> OSS transformation projects, designed to transform fragmented legacy OSS systems that can make it difficult to introduce new services
in a timely and cost-effective manner.
ACQUISITIONS
As part of our strategy, we have pursued and may continue to pursue acquisitions and other initiatives in order to offer new products or
services or otherwise enhance our market position or strategic strengths.
On August 14, 2006, we acquired all of the capital stock of Cramer, a privately-held leading provider of OSS solutions. The aggregate
purchase price for Cramer was $417.2 million, which consisted of $410.6 million in cash (including cash on hand), $2.2 million related
to the assumption of stock options and restricted shares held by Cramer employees and $4.4 million of transaction costs. The purchase
price is subject to post closing adjustments which we expect will not be material. We expect that our acquisition of Cramer will enable us
to leverage and greatly enhance our current assets in the BSS and OSS market.
On May 31, 2006, we acquired all of the capital stock of Qpass, a leading provider of digital commerce software and solutions. The
aggregate purchase price for Qpass was $281.8 million, which consisted of $274.0 million in cash, $2.4 million related to the assumption
of stock options held by Qpass employees and $5.4 million of transaction costs. We expect that this acquisition will allow us to support
service providers and media companies seeking to launch and monetize digital content, and we believe that this acquisition positions us
as the leader in the emerging digital content market.

22 Amdocs Limited Operating and Financial Review and Prospects (continued)
In August 2005, we acquired Longshine, a privately-held leading vendor of customer care and billing software in China, which counts
three of China’s four largest communications service providers among its customers. This acquisition enabled us to offer our products
and services to Chinese service providers, and we believe it will help us expand our presence in this large and expanding market. The
purchase price for Longshine was approximately $41.7 million, which included $8.9 million of additional purchase price as a result of the
achievement of specified performance targets at the end of the first year from acquisition, and $1.3 million of transaction costs. We may
also be obligated to pay up to approximately $8.0 million in additional purchase price over the next year based on the achievement of
specified performance targets.
In July 2005, we acquired from DST Systems, Inc., which we refer to as DST, all of the capital stock of DST’s wholly owned subsidiaries,
DST Innovis, Inc. and DST Interactive, Inc. We refer to these acquired subsidiaries together as DST Innovis, a leading provider of customer
care and billing solutions to broadband media cable and satellite companies. The purchase price for DST Innovis was approximately
$237.5 million, which included $3.2 million of transaction costs. We believe that this acquisition has positioned us to offer a
comprehensive set of solutions to companies in the broadband industry as they transition to ICM.
In connection with the DST Innovis acquisition, we signed a long-term agreement with DST, pursuant to which DST will continue to
support the printing and mailing of bills for the DST Innovis customer base. Under the terms of that agreement, DST will be a preferred
vendor of billing, printing, and mailing for projects that combine those services with billing support for additional Amdocs customers in
the United States.
Please see Note 3 to the consolidated financial statements included in this Annual Report.
RESEARCH AND DEVELOPMENT, PATENTS AND LICENSES
Our research and development activities involve the development of new software architecture, modules and product offerings in
response to an identified market demand, either as part of our internal product development programs or in conjunction with a customer
project. We also expend additional amounts on applied research and software development activities to keep abreast of new technologies
in the communications markets and to provide new and enhanced functionality to our existing product offerings. Research and
development expenditures were $186.8 million, $144.5 million and $126.4 million in the fiscal years ended September 30, 2006, 2005 and
2004, respectively, representing 7.5%, 7.1% and 7.1%, respectively, of our revenue in these fiscal years.
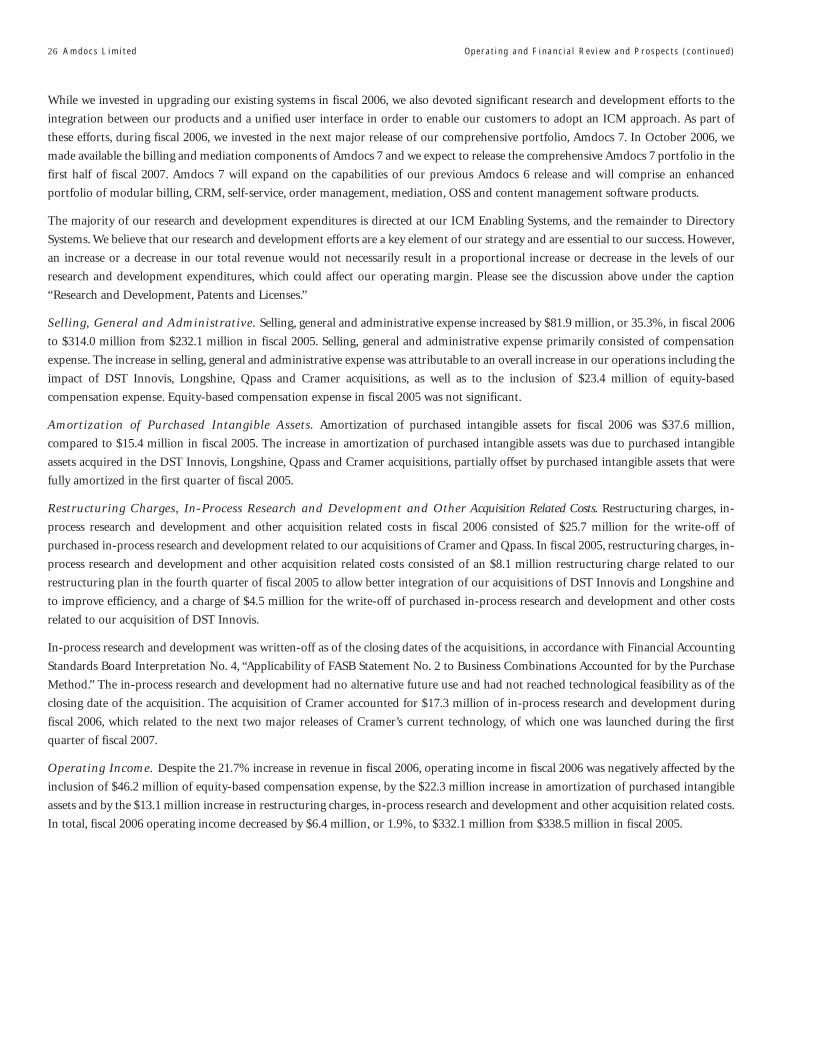
While we continued to upgrade our existing systems in fiscal 2006, we also devoted significant research and development efforts to the
integration between our products and a unified user interface in order to enable our customers to adopt an ICM approach. As part of
these efforts, during fiscal 2006 we invested in the next major release of our comprehensive portfolio, which we refer to as Amdocs 7. In
October 2006, we made available the billing and mediation components of Amdocs 7, and we expect to release the comprehensive Amdocs
7 portfolio in the first half of fiscal 2007. Amdocs 7 will expand on the capabilities of our previous Amdocs 6 release by integrating new
products for the cable broadband and satellite industry, by incorporating products recently acquired as a result of the Cramer and Qpass
acquisitions and through operational and functional enhancements. Amdocs 7 will comprise an enhanced portfolio of modular billing,
CRM, self-service, order management, mediation, OSS and content management software products.
The majority of our research and development expenditures is directed at our ICM Enabling Systems, and the remainder to directory
solutions. We believe that our research and development efforts are a key element of our strategy and are essential to our success. However,
an increase or a decrease in our total revenue would not necessarily result in a proportional increase or decrease in the levels of our
research and development expenditures, which could affect our operating margin. In the near-term, we intend to continue to make
substantial investments in our research and development activities. We believe that this ongoing investment will position us to capitalize
on future potential opportunities in the communications industry.

Operating and Financial Review and Prospects (continued) 2006 Annual Report 23
Our software and software systems are largely comprised of software and systems that we have developed or acquired and that we regard
as proprietary. Our software and software systems are the results of long and complex development processes, and although our
technology is not significantly dependent on patents or licenses from third parties, certain aspects of our products make use of readily
available software components licensed from third parties. As a developer of complex software systems, third parties may claim that
portions of our systems infringe their intellectual property rights. The ability to develop and use our software and software systems
requires knowledge and professional experience that we believe is unique to us and would be very difficult for others to independently
obtain, however, our competitors may independently develop technologies that are substantially equivalent or superior to ours. We have
taken and intend to continue to take, several measures to establish and protect our proprietary rights in our products and technologies
from third-party infringement. We rely upon a combination of trademarks, patents, contractual rights, trade secret law, copyrights,
nondisclosure agreements, we enter into non-disclosure and confidentiality agreements with our customers, employees and marketing
representatives and with certain contractors with access to sensitive information, and we also limit customer access to the source code of
our software and software systems.
OPERATING RESULTS
The following table sets forth for the fiscal years ended September 30, 2006, 2005 and 2004, certain items in our consolidated statements
of operations reflected as a percentage of total revenue:
Year ended September 30,
2 0 0 6 2005 2004
r e ve n u e :
License 4.7% 4.9% 4.3%
Service 95.3 95.1 95.7
100.0 100.0 100.0
o p e r a t i n g e x p e n s e s :
Cost of license 0.2 0.2 0.3
Cost of service 63.7 63.4 63.0
Research and development 7.5 7.1 7.1
Selling, general and administrative 12.7 11.3 11.9
Amortization of purchased intangible assets 1.5 0.8 1.0
Restructuring charges, in-process research and development, and other
acquisition related costs 1.0 0.6 —
86.6 83.4 83.3
o p e r a t i n g i n co m e 13.4 16.6 16.7
Interest income and other, net 1.7 1.1 0.3
Income before income taxes 15.1 17.7 17.0
Income taxes 2.2 3.5 3.7
n e t i n co m e 12.9% 14.2% 13.3%

24 Amdocs Limited Operating and Financial Review and Prospects (continued)
FISCAL YEARS ENDED SEPTEMBER 30, 2006 AND 2005
The following is a tabular presentation of our results of operations for the fiscal year ended September 30, 2006, compared to the fiscal
year ended September 30, 2005. Following the table is a discussion and analysis of our business and results of operations for these years.
Year ended September 30, Increase (Decrease)
2 0 0 6 2005 Amount %
(in thousands)
r e ve n u e :
License $ 116,285 $ 100,044 $ 16,241 16.2
Service 2,363,765 1,938,577 425,188 21.9
2,480,050 2,038,621 441,429 21.7
o p e r a t i n g e x p e n s e s :
Cost of license 4,003 4,083 (80) (2.0)
Cost of service 1,579,823 1,291,572 288,251 22.3
Research and development 186,760 144,457 42,303 29.3
Selling, general and administrative 313,997 232,066 81,931 35.3
Amortization of purchased intangible assets 37,610 15,356 22,254 144.9
Restructuring charges, in-process research and
development and other acquisition related costs 25,725 12,595 13,130 104.2
2,147,918 1,700,129 447,789 26.3
o p e r a t i n g i n co m e 332,132 338,492 (6,360) (1.9)
Interest income and other, net 41,741 22,303 19,438 87.2
Income before income taxes 373,873 360,795 13,078 3.6
Income taxes 55,237 72,159 (16,922) (23.5)
n e t i n co m e $ 318,636 $ 288,636 $ 30,000 10.4

Operating and Financial Review and Prospects (continued) 2006 Annual Report 25
Revenue. Total revenue increased by $441.4 million, or 21.7%, in fiscal 2006 to $2,480.0 million from $2,038.6 million in fiscal 2005.
Approximately 58% of the increase in total revenue in fiscal 2006 was attributable to revenue contributed by acquisitions made during
fiscal 2006 and during the fourth quarter of fiscal 2005, of which $187.6 was attributable to DST Innovis. The remainder of the increase
in total revenue was primarily attributable to additional revenue from consolidation projects for existing Tier 1 customers.
License and service revenue from the sale of ICM Enabling Systems was $2,201.2 million for fiscal 2006, an increase of $424.7 million, or
23.9%, from fiscal 2005. Approximately 60% of the increase was attributable to revenue contributed by acquisitions made during fiscal
2006 and during the fourth quarter of fiscal 2005, of which $187.6 was attributable to DST Innovis. The remainder of the increase in total
revenue was attributable to additional revenue from consolidation projects for existing Tier 1 customers. License and service revenue from
the sale of ICM Enabling Systems represented 88.8% and 87.1% of our total revenue in fiscal 2006 and 2005, respectively. The demand
for our ICM Enabling Systems is primarily driven by the need for communications service providers to rapidly introduce new offerings
and focus on their customers.
License and service revenue from the sale of Directory Systems was $278.8 million for fiscal 2006, an increase of $16.7 million, or 6.4%,
from fiscal 2005. Approximately 69% of the increase in Directory Systems revenue in fiscal 2006 was attributable to an increase in business
related to Managed Services customers. License and service revenue from the sale of Directory Systems represented 11.2% and 12.9% of
our total revenue in fiscal 2006 and 2005, respectively. We believe that we are a leading provider of Directory Systems in most of the
markets we serve. We expect that our revenue from Directory Systems in absolute amount will increase slightly in fiscal 2007.
In fiscal 2006, revenue from customers in North America, Europe and the rest of the world accounted for 69.9%, 21.8% and 8.3%,
respectively, of total revenue compared to 68.3%, 24.0% and 7.7%, respectively, for fiscal 2005. Approximately 54% of the increase in
revenue from customers in North America was attributable to revenue contributed by DST Innovis, and the remainder was primarily
attributable to projects for existing customers in North America. Revenue from customers in Europe increased in absolute amounts, but
the increase was less than the 21.7% increase in our total revenue which resulted in a decrease in revenue from customers in Europe as a
percentage of total revenue. The increase in revenue from customers in the rest of the world as a percentage of our total revenue in fiscal
2006 was attributable primarily to revenue contributed in China.
Cost of License. Cost of license consists primarily of amortization of purchased computer software and intellectual property rights. Such
amortization is relatively stable from period to period and, absent items that were fully amortized or impaired, is generally fixed in
amount. Therefore, an increase or decrease in license revenue could cause a significant fluctuation in cost of license as a percentage of
license revenue. In fiscal 2006, cost of license, as a percentage of license revenue, was 3.4% compared to 4.1% in fiscal 2005.
Cost of Service. Cost of service consists primarily of costs associated with providing services to customers, including compensation
expense, warranty expense and costs of third-party products. The increase in cost of service in fiscal 2006 was 22.3%, which is greater than
the increase in our total revenue in fiscal 2006. As a percentage of revenue, cost of service was 63.7%, compared to 63.4% in fiscal 2005.
Cost of service in fiscal 2006 includes the effect of $18.0 million of equity-based compensation expense. Equity-based compensation
expense in fiscal 2005 was insignificant. Our gross margin may vary depending on the types and geographic locations of projects that we
undertake.
Research and Development. As a percentage of revenue, research and development expense was 7.5% and 7.1% in fiscal 2006 and 2005,
respectively. Research and development expense increased by $42.3 million, or 29.3%, in fiscal 2006 to $186.8 million from $144.5 million
in fiscal 2005. The increase in research and development expense was attributable primarily to research and development activities in our
efforts to develop new products for the cable broadband and satellite industry and integrate products into our ICM Enabling Systems as
well as research and development activities related to the Qpass and Cramer acquisitions. Research and development expense in fiscal 2006
includes the effect of $4.7 million of equity-based compensation expense. Equity-based compensation expense in fiscal 2005 was
insignificant.
26 Amdocs Limited Operating and Financial Review and Prospects (continued)
While we invested in upgrading our existing systems in fiscal 2006, we also devoted significant research and development efforts to the
integration between our products and a unified user interface in order to enable our customers to adopt an ICM approach. As part of
these efforts, during fiscal 2006, we invested in the next major release of our comprehensive portfolio, Amdocs 7. In October 2006, we
made available the billing and mediation components of Amdocs 7 and we expect to release the comprehensive Amdocs 7 portfolio in the
first half of fiscal 2007. Amdocs 7 will expand on the capabilities of our previous Amdocs 6 release and will comprise an enhanced
portfolio of modular billing, CRM, self-service, order management, mediation, OSS and content management software products.
The majority of our research and development expenditures is directed at our ICM Enabling Systems, and the remainder to Directory
Systems. We believe that our research and development efforts are a key element of our strategy and are essential to our success. However,
an increase or a decrease in our total revenue would not necessarily result in a proportional increase or decrease in the levels of our
research and development expenditures, which could affect our operating margin. Please see the discussion above under the caption
“Research and Development, Patents and Licenses.”
Selling, General and Administrative. Selling, general and administrative expense increased by $81.9 million, or 35.3%, in fiscal 2006
to $314.0 million from $232.1 million in fiscal 2005. Selling, general and administrative expense primarily consisted of compensation
expense. The increase in selling, general and administrative expense was attributable to an overall increase in our operations including the
impact of DST Innovis, Longshine, Qpass and Cramer acquisitions, as well as to the inclusion of $23.4 million of equity-based
compensation expense. Equity-based compensation expense in fiscal 2005 was not significant.
Amortization of Purchased Intangible Assets. Amortization of purchased intangible assets for fiscal 2006 was $37.6 million,
compared to $15.4 million in fiscal 2005. The increase in amortization of purchased intangible assets was due to purchased intangible
assets acquired in the DST Innovis, Longshine, Qpass and Cramer acquisitions, partially offset by purchased intangible assets that were
fully amortized in the first quarter of fiscal 2005.
Restructuring Charges, In-Process Research and Development and Other Acquisition Related Costs. Restructuring charges, in-
process research and development and other acquisition related costs in fiscal 2006 consisted of $25.7 million for the write-off of
purchased in-process research and development related to our acquisitions of Cramer and Qpass. In fiscal 2005, restructuring charges, in-
process research and development and other acquisition related costs consisted of an $8.1 million restructuring charge related to our
restructuring plan in the fourth quarter of fiscal 2005 to allow better integration of our acquisitions of DST Innovis and Longshine and
to improve efficiency, and a charge of $4.5 million for the write-off of purchased in-process research and development and other costs
related to our acquisition of DST Innovis.
In-process research and development was written-off as of the closing dates of the acquisitions, in accordance with Financial Accounting
Standards Board Interpretation No. 4, “Applicability of FASB Statement No. 2 to Business Combinations Accounted for by the Purchase
Method.” The in-process research and development had no alternative future use and had not reached technological feasibility as of the
closing date of the acquisition. The acquisition of Cramer accounted for $17.3 million of in-process research and development during
fiscal 2006, which related to the next two major releases of Cramer’s current technology, of which one was launched during the first
quarter of fiscal 2007.
Operating Income. Despite the 21.7% increase in revenue in fiscal 2006, operating income in fiscal 2006 was negatively affected by the
inclusion of $46.2 million of equity-based compensation expense, by the $22.3 million increase in amortization of purchased intangible
assets and by the $13.1 million increase in restructuring charges, in-process research and development and other acquisition related costs.
In total, fiscal 2006 operating income decreased by $6.4 million, or 1.9%, to $332.1 million from $338.5 million in fiscal 2005.

Operating and Financial Review and Prospects (continued) 2006 Annual Report 27
Interest Income and Other, Net. Interest income and other, net increased by $19.4 million, or 87.2%, in fiscal 2006 to $41.7 million
from $22.3 million in fiscal 2005. The increase in interest income and other, net, was primarily attributable to the increase in market
interest rates on our short-term interest-bearing investments.
Income Taxes. Income taxes for fiscal 2006 were $55.2 million on pretax income of $373.9 million, which resulted in an effective tax rate
of 14.8% compared to 20% in fiscal 2005. Of the reduction in our effective tax rate, 3.0% was attributable to an increase in lower taxed
earnings from global operations and approximately 2.2% was attributable to the net effect of acquisition-related costs and equity-based
compensation expense. Our effective tax rate may fluctuate between quarters as a result of discrete items that may affect a specific quarter.
See the discussion below under the caption “Effective Tax Rate.”
Net Income. Net income was $318.6 million in fiscal 2006, compared to net income of $288.6 million in fiscal 2005. The increase in net
income was attributable to the overall increase in our operations, the increase in interest income and other, net, and the decrease in our
effective tax rate partially offset by the increase in restructuring charges, in-process research and development and other, the increase in
amortization of purchased intangible assets, and by the inclusion of equity-based compensation expense during fiscal 2006.
Diluted Earnings Per Share. Diluted earnings per share was $1.48 for fiscal 2006, compared to $1.35 in fiscal 2005. The increase in
diluted earnings per share resulted primarily from the increase in net income. Please see Note 18 to the consolidated financial statements
included in this Annual Report.
FISCAL YEARS ENDED SEPTEMBER 30, 2005 AND 2004
The following is a tabular presentation of our results of operations for the fiscal year ended September 30, 2005, compared to the fiscal
year ended September 30, 2004. Following the table is a discussion and analysis of our business and results of operations for these years.
Year ended September 30, Increase (Decrease)
2005 2004 Amount %
(in thousands)
r e ve n u e :
License $ 100,044 $ 76,586 $ 23,458 30.6
Service 1,938,577 1,697,146 241,431 14.2
2,038,621 1,773,732 264,889 14.9
o p e r a t i n g e x p e n s e s :
Cost of license 4,083 5,022 (939) (18.7)
Cost of service 1,291,572 1,117,810 173,762 15.5
Research and development 144,457 126,407 18,050 14.3
Selling, general and administrative 232,066 210,384 21,682 10.3
Amortization of purchased intangible assets 15,356 17,909 (2,553) (14.3)
Restructuring charges and other 12,595 — 12,595 —
1,700,129 1,477,532 222,597 15.1
o p e r a t i n g i n co m e 338,492 296,200 42,292 14.3
Interest income and other, net 22,303 4,903 17,400 354.9
Income before income taxes 360,795 301,103 59,692 19.8
Income taxes 72,159 66,243 5,916 8.9
n e t i n co m e $ 288,636 $ 234,860 $ 53,776 22.9

28 Amdocs Limited Operating and Financial Review and Prospects (continued)
Revenue. Total revenue increased by $264.9 million, or 14.9%, in fiscal 2005 to $2,038.6 million from $1,773.7 million in fiscal 2004.
Approximately 32.0% of the increase in total revenue in fiscal 2005 was due to an increase in business related to Managed Services
customers, approximately 19.4% was attributable to revenue contributed by DST Innovis and the remainder was attributable to additional
revenue from existing and new customers.
License and service revenue from the sale of ICM Enabling Systems was $1,776.5 million for fiscal 2005, an increase of $239.5 million, or
15.6%, from fiscal 2004. Approximately 23.2% of the increase was attributable to revenues from Managed Services customers.
Approximately 21.5% of the increase was attributable to revenue contributed by DST Innovis, and the remainder was attributable to
additional revenue from existing and new customers. License and service revenue from the sale of ICM Enabling Systems represented
87.1% and 86.7% of our total revenue in fiscal 2005 and 2004, respectively. The demand for our ICM Enabling Systems is primarily driven
by the need for communications service providers to continue to integrate their billing, CRM and order management systems into
Integrated Customer Management products and services.
License and service revenue from the sale of Directory Systems was $262.1 million for fiscal 2005, an increase of $25.4 million, or 10.7%,
from fiscal 2004. Approximately 88.2% of the increase in Directory Systems revenue in fiscal 2005 was attributable to an increase in
business related to Managed Services customers and the remainder was attributable to additional revenue from existing and new
customers. License and service revenue from the sale of Directory Systems represented 12.9% and 13.3% of our total revenue in fiscal 2005
and 2004, respectively. We believe that we are a leading provider of Directory Systems in most of the markets we serve.
In fiscal 2005, revenue from customers in North America, Europe and the rest of the world accounted for 68.3%, 24.0% and 7.7%,
respectively, of total revenue compared to 65.9%, 27.1% and 7.0%, respectively, for fiscal 2004. Approximately 35.9% of the increase in
revenue from customers in North America was attributable to Managed Services agreements, approximately 21.9% of the increase was
attributable to revenue contributed by DST Innovis, and the remainder was attributable to additional revenue from existing and new
customers in North America. Revenue from customers in Europe, in absolute amounts, was relatively stable compared to fiscal 2004, and
this resulted in a decrease as a percentage of total revenue. The increase in revenue from customers outside of North America and Europe
was attributable to additional revenue from existing and new customers.
Cost of License. Cost of license consists primarily of amortization of purchased computer software and intellectual property rights. Such
amortization is relatively stable from period to period and, absent items that were fully amortized or impaired, is generally fixed in
amount. Therefore, an increase or decrease in license revenue could cause a significant fluctuation in cost of license as a percentage of
license revenue. In fiscal 2005, cost of license, as a percentage of license revenue, was 4.1% compared to 6.6% in fiscal 2004.
Cost of Service. Cost of service consists primarily of costs associated with providing services to customers, including compensation
expense, warranty expense and costs of third-party products. Cost of service increased by 15.5% in fiscal 2005 as compared to fiscal 2004.
This increase in cost of service was slightly higher than the 14.9% increase in our total revenue in fiscal 2005. As a percentage of revenue,
cost of service was 63.4% compared to 63.0% in fiscal 2004. Our gross margin may vary depending on the types and geographic locations
of projects that we undertake.
Research and Development. As a percentage of revenue, research and development expense was 7.1% in fiscal 2005 and 2004. Research
and development expense increased by $18.1 million, or 14.3%, in fiscal 2005 to $144.5 million from $126.4 million in fiscal 2004.
Approximately 85.4% of the increase, in absolute amounts, was attributable to the acquisition of DST Innovis. While we continued to
upgrade our existing systems in fiscal 2005, we also devoted significant research and development efforts in fiscal 2005 to the integration
between our products and a unified user interface in order to enable our customers to adopt an ICM approach. As part of these efforts,
in February 2005, we launched a comprehensive portfolio of products, which we refer to as Amdocs 6. Amdocs 6 is our pre-integrated
portfolio of modular, billing, CRM, self-service, order management, mediation and content revenue management software products. The
majority of our research and development expenditures is directed at our ICM Enabling Systems, and the remainder to Directory Systems.
We believe that our research and development efforts are a key element of our strategy and are essential to our success. However, an
increase or a decrease in our total revenue, would not necessarily result in a proportional increase or decrease in the levels of our research
and development expenditures, which could affect our operating margin. Please see the discussion above under the caption “Research and
Development, Patents and Licenses.”
Operating and Financial Review and Prospects (continued) 2006 Annual Report 29
Selling, General and Administrative. Selling, general and administrative expense increased by $21.7 million, or 10.3%, in fiscal 2005
to $232.1 million from $210.4 million in fiscal 2004. Selling, general and administrative expense primarily consisted of compensation
expense. The increase in selling, general and administrative expense was attributable to an overall increase in our operations, as well as to
the increase in our selling and marketing efforts, although the 10.3% increase was less than the 14.9% increase in our total revenue.
Amortization of Purchased Intangible Assets. Amortization of purchased intangible assets for fiscal 2005 was $15.4 million,
compared to $17.9 million in fiscal 2004. The decrease in amortization of purchased intangible assets was due to purchased intangible
assets that were fully amortized in fiscal 2004 and in the first three months of fiscal 2005 offset by $5.4 million in amortization of
purchased intangible assets acquired in the DST Innovis and Longshine acquisitions.
Restructuring Charges, In-Process Research and Development and Other Acquisition Related Costs. Restructuring charges,
in-process research and development and other acquisition related costs in fiscal 2005 consisted of an $8.1 million restructuring charge
related to our restructuring plan in the fourth quarter of fiscal 2005, and a charge of $4.5 million for the write-off of purchased in-process
research and development and other costs related to our acquisition of DST Innovis.
Operating Income. Operating income increased by $42.3 million, or 14.3%, in fiscal 2005, to $338.5 million, from $296.2 million in
fiscal 2004. Operating income in fiscal 2005 was negatively affected by $12.6 million in restructuring charges, in-process research and
development and other and by the slight increase of cost of service as a percentage of revenue. These negative effects were partially offset
by the decrease, as a percentage of revenue, in selling, general and administrative expense.
Interest Income and Other, Net. Interest income and other, net increased by $17.4 million, or 354.9%, in fiscal 2005 to $22.3 million
from $4.9 million in fiscal 2004. The increase in interest income and other, net, was primarily attributable to the increase in market interest
rates on our short-term interest-bearing investments, and to the decrease in our interest expense due to our June 2004 redemption of our
2% Convertible Notes, due 2008, which we refer to as our 2% Notes, partially offset by interest expense on our 0.50% Convertible Senior
Notes due 2024, or our 0.50% Notes, which we issued in March 2004.
Income Taxes. Income taxes for fiscal 2005 were $72.2 million on pretax income of $360.8 million, which resulted in an effective tax rate
of 20% compared to 22% in fiscal 2004. Our effective tax rate is dependent on the corporate income tax rates in the various countries in
which we operate and the relative magnitude of our business in those countries. The reduction in our effective tax rate in fiscal 2005 was
due to our continued expansion into countries with lower income tax rates. See the discussion below under the caption “Effective Tax
Rate.”
Net Income. Net income was $288.6 million in fiscal 2005, compared to net income of $234.9 million in fiscal 2004. The increase in net
income was attributable to the 14.3% increase in our operating income, the increase in interest income and other, net and the decrease in
our effective tax rate during fiscal 2005.
Diluted Earnings Per Share. Diluted earnings per share was $1.35 for fiscal 2005, compared to $1.08 in fiscal 2004. The increase in
diluted earnings per share resulted from the increase in net income and from the reduction in diluted weighted average number of shares
outstanding due to our share repurchases during fiscal 2004 and 2005, partially offset by the dilutive effect of our convertible notes.
Please see Note 18 to the consolidated financial statements included in this Annual Report.
LIQUIDITY AND CAPITAL RESOURCES
Cash, cash equivalents and short-term interest-bearing investments totaled $979.4 million as of September 30, 2006, compared to $1,145.6
million as of September 30, 2005. The decrease during fiscal 2006 is attributable to the use of approximately $624.8 million in net cash
paid in connection with our Cramer and Qpass acquisitions and approximately $80.7 million for capital expenditures, partially offset by
$429.2 million in positive cash flows from operations and $106.9 million in proceeds from the exercise of employee stock options. Net
cash provided by operating activities amounted to $429.2 million for fiscal 2006 and $381.8 million for fiscal 2005. We currently intend
to retain our future operating cash flows to support the further expansion of our business, including by acquisitions.

30 Amdocs Limited Operating and Financial Review and Prospects (continued)
Our policy is to retain substantial cash balances in order to support the growth of the Company. We believe that our current cash balances,
cash generated from operations and our current lines of credit will provide sufficient resources to meet our operational needs for at least
the next fiscal year.
In March 2004, we issued $450.0 million aggregate principal amount of our 0.50% Notes through a private placement to qualified
institutional buyers pursuant to Rule 144A under the Securities Act. We used the net proceeds and additional cash resources to retire
$400.2 million of outstanding debt. We also used approximately $170.1 million of the net proceeds from the sale of the 0.50% Notes to
repurchase approximately 6.1 million ordinary shares sold short by purchasers of the 0.50% Notes in negotiated transactions concurrently
with the offering. As of September 30, 2006, $450.0 million aggregate principal amount of our 0.50% Notes were outstanding.
As of September 30, 2006, we had available short-term general revolving lines of credit totaling $30.9 million, none of which was
outstanding. In addition, as of September 30, 2006, we had outstanding letters of credit and bank guarantees from various banks totaling
$8.7 million.
As of September 30, 2006, we had outstanding short-term loans of $1.7 million, which are secured by specified pledges and guaranties.
The following table summarizes our contractual obligations as of September 30, 2006, and the effect such obligations are expected to have
on our liquidity and cash flows in future periods (in millions):
Cash Payments Due by Period
T o t a l Less than 1 year 1-3 years 4-5 years Over 5 years
C o n t r a c t u a l O b l i g a t i o n s
Convertible notes $ 455.8 $ 2.4 $ 453.4 $ — $ —
Financing arrangements 1.7 1.7 — — —
Pension funding 19.9 1.9 5.4 3.9 8.7
Non-cancelable operating leases 293.9 72.8 147.7 48.7 24.7
$ 771.3 $ 78.8 $ 606.5 $ 52.6 $ 33.4
Our capital expenditures were approximately $80.7 million in fiscal 2006. Approximately 80% of these expenditures consisted of
purchases of computer equipment with the remainder attributable mainly to leasehold improvements. Our policy is to fund our capital
expenditures principally from operating cash flows and we do not anticipate any changes to this policy in the foreseeable future.
From time to time, we have engaged in share repurchase programs in which we repurchase our shares in the open market or privately
negotiated transactions and at times and prices we deem appropriate. During fiscal 2004, we purchased approximately 9.9 million of our
ordinary shares at a weighted average price of $22.64 per share. In December 2004, we extended our share repurchase program for the
additional repurchase of up to $100.0 million of our ordinary shares. In accordance with this extension, we repurchased in fiscal 2005
approximately 3.5 million ordinary shares, at an average price of $28.33 per share and an aggregate purchase price of approximately
$100.0 million.
NET DEFERRED TAX ASSETS
As of September 30, 2006, deferred tax assets of $29.3 million, derived from net capital and operating loss carry forwards related to some
of our subsidiaries, were offset by valuation allowances due to the uncertainty of the realizing any tax benefit for such losses. When
realization of the tax benefits associated with such net capital and operating losses is deemed more likely than not, the valuation allowance
will be released through income taxes or through goodwill.
Operating and Financial Review and Prospects (continued) 2006 Annual Report 31
EFFECTIVE TAX RATE
Our effective tax rate for fiscal year 2006 was 14.8%, compared to 20% in fiscal 2005. Our effective tax rate depends on the corporate
income tax rates in the various countries in which we operate and the relative magnitude of our business in those countries. We expect
our effective tax rate in fiscal 2007 to be between 14% and 16%.
CRITICAL ACCOUNTING POLICIES
Our discussion and analysis of our consolidated financial condition and results of operations are based upon our consolidated financial
statements, which have been prepared in accordance with U.S. generally accepted accounting principles. The preparation of these financial
statements requires us to make estimates, assumptions and judgments that affect the reported amounts of assets, liabilities, revenue and
expenses, and related disclosure of contingent liabilities. On a regular basis, we evaluate and may revise our estimates. We base our
estimates on historical experience and various other assumptions that we believe to be reasonable under the circumstances, the results of
which form the basis for making judgments about the carrying values of assets and liabilities that are not readily apparent. Actual results
could differ materially from the estimates under different assumptions or conditions.
We believe that the estimates, assumptions and judgments involved in the accounting policies described below have the greatest potential
impact on our financial statements, so we consider these to be our critical accounting policies. These policies require that we make
estimates in the preparation of our financial statements as of a given date.
Our critical accounting policies are as follows:
> Revenue recognition and contract accounting
> Tax accounting
> Business combinations
> Equity-based compensation expense
> Goodwill and intangible assets
> Derivative and hedge accounting
> Realizability of long-lived assets
> Accounts receivable reserves
Below, we discuss these policies further, as well as the estimates and judgments involved. We also have other key accounting policies. We
believe that, compared to the critical accounting policies listed above, the other policies either do not generally require us to make
estimates and judgments that are as difficult or as subjective, or it is less likely that they would have a material impact on our reported
consolidated results of operations for a given period.
Revenue Recognition and Contract Accounting
We derive our revenue principally from:
> the initial sales of licenses to use our products and related services, including modification, implementation and integration services,
> providing Managed Services and other related services for our solutions, and
> recurring revenue from ongoing support and maintenance provided to our customers, and from incremental license fees resulting
from increases in a customer’s business volume.

32 Amdocs Limited Operating and Financial Review and Prospects (continued)
Revenue is recognized only when all of the following conditions have been met: (i) there is persuasive evidence of an arrangement; (ii)
delivery has occurred; (iii) the fee is fixed and determinable; and (iv) collectability of the fee is reasonably assured. We usually sell our
software licenses as part of an overall solution offered to a customer that combines the sale of software licenses with a broad range of
services, which normally include significant customization, modification, implementation and integration. As a result, we generally
recognize combined license and service revenue over the course of these long-term projects, using the percentage of completion method
of accounting. Initial license fee revenue is recognized as work is performed, using the percentage of completion method of accounting.
Subsequent license fee revenue is recognized upon completion of specified conditions in each contract, based on a customer’s subscriber
or transaction volume or other measurements when greater than the level specified in the contract for the initial license fee. Service
revenue that involves significant ongoing obligations, including fees for software customization, implementation and modification, also
is recognized as work is performed, under the percentage of completion method of accounting. Revenue from software solutions that do
not require significant customization and modification is recognized upon delivery or as services are provided. In Managed Services
contracts, we typically recognize revenue from the operation of a customer’s system as services are performed based on time elapsed,
output produced or volume of data processed, depending on the specific contract terms of the Managed Services arrangement. Typically,
Managed Services contracts are long-term in duration and are not subject to seasonality. Revenue from ongoing support services is
recognized as work is performed. Revenue from third-party hardware sales is recognized upon delivery and installation, and revenue from
third-party software sales is recognized upon delivery. Maintenance revenue is recognized ratably over the term of the maintenance
agreement. A significant portion of our revenue is recognized over the course of long-term projects under the percentage of completion
method of accounting. The percentage of completion method requires the exercise of judgment, such as with respect to estimations of
progress-to-completion, contract revenue, loss contracts and contract costs. Progress in completing such projects may significantly affect
our annual and quarterly operating results.
We follow very specific and detailed guidelines, several of which are discussed above, in measuring revenue; however, certain judgments
affect the application of our revenue recognition policy.
Our revenue recognition policy takes into consideration the creditworthiness and past transaction history of each customer in
determining the probability of collection as a criterion of revenue recognition. This determination requires the exercise of judgment,
which affects our revenue recognition. If we determine that collection of a fee is not reasonably assured, we defer the revenue recognition
until the time collection becomes reasonably assured, which is generally upon receipt of cash.
For arrangements with multiple deliverables, we allocate revenue to each component based upon its relative fair value, which is
determined in reliance on the specific objective evidence for that element. Such determination is judgmental and for most contracts is
based on normal pricing and discounting practices for those elements in similar arrangements.
Revenue from third-party hardware and software sales is recorded at a gross or net amount according to certain indicators. The
application of these indicators for gross and net reporting of revenue depends on the relative facts and circumstances of each sale and
requires significant judgment.
See Note 2 to the consolidated financial statements included in this document for further information.
Tax Accounting
As part of the process of preparing our consolidated financial statements, we are required to estimate our income tax expense in each of
the jurisdictions in which we operate. In the ordinary course of a global business, there are many transactions and calculations where the
ultimate tax outcome is uncertain. Some of these uncertainties arise as a consequence of revenue sharing and reimbursement
arrangements among related entities, the process of identifying items of revenue and expenses that qualify for preferential tax treatment
and segregation of foreign and domestic income and expense to avoid double taxation. This process involves us estimating our current
tax exposure, which is accrued as taxes payable, together with assessing temporary differences resulting from differing treatment of items,
such as deferred revenue, for tax and accounting differences. These differences result in deferred tax assets and liabilities, which are
included within our consolidated balance sheet. We may record a valuation allowance to reduce our deferred tax assets to the amount of
future tax benefit that is more likely than not to be realized.

Operating and Financial Review and Prospects (continued) 2006 Annual Report 33
Although we believe that our estimates are reasonable and that we have considered future taxable income and ongoing prudent and
feasible tax strategies in estimating our tax outcome and in assessing the need for the valuation allowance, there is no assurance that the
final tax outcome and the valuation allowance will not be different than those that are reflected in our historical income tax provisions
and accruals. Such differences could have a material effect on our income tax provision, net income and cash balances in the period in
which such determination is made.
We have filed or are in the process of filing federal, state and foreign tax returns that are subject to audit by the respective tax authorities.
Although the ultimate outcome is unknown, we believe that adequate amounts have been provided for and any adjustments that may
result from tax return audits are not likely to have a material, adverse effect on our consolidated results of operations, financial condition
or cash flows.
Business combinations
In accordance with business combination accounting, we allocate the purchase price of acquired companies to the tangible and intangible
assets acquired and liabilities assumed, as well as to in-process research and development based on their estimated fair values. We engage
third-party appraisal firms to assist management in determining the fair values of certain assets acquired and liabilities assumed. Such
valuations require management to make significant estimates and assumptions, especially with respect to intangible assets.
Management makes estimates of fair value based upon assumptions believed to be reasonable. These estimates are based on historical
experience and information obtained from the management of the acquired companies and are inherently uncertain. Critical estimates
in valuing certain assets acquired and liabilities assumed include but are not limited to: future expected cash flows from license and service
sales, maintenance and hosting agreements, customer contracts and acquired developed technologies, expected costs to develop the in-
process research and development into commercially viable products and estimated cash flows from the projects when completed, the
acquired company’s brand awareness and discount rate. Unanticipated events and circumstances may occur that may affect the accuracy
or validity of such assumptions, estimates or actual results.
Equity-Based Compensation Expense
We account for equity-based compensation in accordance with SFAS No. 123(R), Share-Based Payment. Under the fair value recognition
provisions of this statement, share-based compensation cost is measured at the grant date based on the value of the award and is
recognized as expense over the requisite service periods. Determining the fair value of share-based awards at the grant date requires the
exercise of judgment. In addition, the exercise of judgment is also required in estimating the amount of share-based awards that are
expected to be forfeited. If actual results differ significantly from these estimates, equity-based compensation expense and our results of
operations could be materially impacted. Please see further discussion below under the caption “Adoption of New Accounting Standard.”
Goodwill and Intangible Assets
We follow SFAS No. 142, “Goodwill and Other Intangible Assets.” Under SFAS No. 142, goodwill and intangible assets deemed to have
indefinite lives are no longer amortized but are subject to periodic impairment tests in accordance with the Statement. Goodwill
impairment is deemed to exist if the net book value of a reporting unit exceeds its estimated fair value. The total purchase price of business
acquisitions accounted for using the purchase method is allocated first to identifiable assets and liabilities based on estimated fair values.
The excess of the purchase price over the fair value of net assets of purchased businesses is recorded as goodwill.
We perform an annual impairment test during the fourth quarter of each fiscal year, or more frequently if impairment indicators are
present. We operate in one operating segment, and this segment comprises our only reporting unit. In calculating the fair value of the
reporting unit, we used a discounted cash flow methodology. There was no impairment of goodwill upon adoption of SFAS No. 142 and
there was no impairment at the annual impairment test date.

34 Amdocs Limited Operating and Financial Review and Prospects (continued)
Derivative and Hedge Accounting
Approximately 70% to 80% of our revenue and 50% to 60% of our operating expenses are denominated in U.S. dollar or linked to the
U.S. dollar. We enter into foreign exchange forward contracts and options to hedge a significant portion of our foreign currency exposure
to lower fluctuations in revenue and expenses. The majority of our hedging arrangements are classified as cash flow hedges. Accordingly,
changes in the fair value of these forward exchange contracts and options are recorded in other comprehensive income (loss). We estimate
the fair value of such derivative contracts by reference to forward and spot rates quoted in active markets.
Establishing and accounting for foreign exchange contracts involve judgments, such as determining the nature of the exposure, assessing
its amount and timing, and evaluating the effectiveness of the hedging arrangement.
Although we believe that our estimates are accurate and meet the requirement of hedge accounting, actual results differ from these
estimates, and such difference could cause fluctuation of our recorded revenue and expenses.
Realizability of Long-Lived Assets
We are required to assess the impairment of long-lived assets, other than goodwill, tangible and intangible under SFAS No. 144,
“Accounting for the Impairment or Disposal of Long-Lived Assets,” on a periodic basis, and if events or changes in circumstances indicate
that the carrying value may not be recoverable. Impairment indicators include any significant changes in the manner of our use of the
assets or the strategy of our overall business, significant negative industry or economic trends and significant decline in our share price
for a sustained period.
Upon determination that the carrying value of a long-lived asset may not be recoverable based upon a comparison of fair value to the
carrying amount of the asset, an impairment charge is recorded. We measure fair value using an undiscounted projected future cash flow.
Accounts Receivable Reserves
The allowance for doubtful accounts is for estimated losses resulting from the inability of our customers to make required payments.
We evaluate accounts receivable to determine if they will ultimately be collected. In performing this evaluation, significant judgments and
estimates are involved, such as past experience, credit quality of the customer, age of the receivable balance and current economic
conditions that may affect a customer’s ability to pay. If collection is not reasonably assured at the time the transaction is consummated,
we do not recognize revenue until collection becomes reasonably assured. If the financial condition of our customers were to deteriorate,
resulting in an impairment of their ability to make payments, additional allowances may be required. The allowance for doubtful accounts
is established either through a charge to selling, general and administrative expenses or as a reduction to revenue.
Within the context of these critical accounting policies, we are not currently aware of any reasonably likely events or circumstances that
would result in materially different amounts being reported.
ADOPTION OF NEW ACCOUNTING STANDARD
Accounting for Equity-Based Compensation
Effective October 1, 2005, we adopted FASB Statement No. 123 (revised 2004), “Share-Based Payment,” a revision of SFAS No. 123 (“SFAS
123(R)”). SFAS 123(R) supersedes Accounting Principles Board (“APB”) Opinion No. 25, “Accounting for Stock Issued to Employees”
(“APB No. 25”) and related interpretations, and amends FASB Statement No. 95, “Statement of Cash Flows.” Generally, the approach in
SFAS 123(R) is similar to the approach described in SFAS 123. However, SFAS 123(R) requires all equity-based payments to employees,
including grants of employee stock options, to be recognized in the income statement based on their fair values. Pro forma disclosure is
no longer an alternative. In March 2005, the U.S. Securities and Exchange Commission, or the SEC, issued Staff Accounting Bulletin No.
107 (“SAB 107”), which provides supplemental implementation guidance on SFAS 123(R). We have applied the provisions of SAB 107 in
our adoption of SFAS 123(R). Prior to October 1, 2005, we accounted for equity-based payments to employees under the recognition and
measurement provisions of APB No. 25. Equity-based compensation expense recognized under SFAS 123(R) for fiscal 2006 was $46.2
million.

Operating and Financial Review and Prospects (continued) 2006 Annual Report 35
As of September 30, 2006, there was $63.5 million of unrecognized compensation expense related to nonvested stock options and
nonvested restricted stock awards. We recognize compensation costs using the graded vesting attribution method which results in a
weighted average period of approximately one year over which the unrecognized compensation expense is expected to be recognized.
We adopted SFAS 123(R) using the modified prospective method. Under this transition method, compensation costs recognized in fiscal
2006 include (a) compensation costs for all stock-based payments granted prior to, but that had not yet vested as of, October 1, 2005,
based on the grant date fair value estimated in accordance with the pro forma provisions of SFAS 123, and (b) compensation costs for the
equity-based payments granted subsequent to October 1, 2005, based on the grant date fair value estimated in accordance with SFAS
123(R). Our consolidated financial statements for prior periods have not been restated to reflect, and do not include, the impact of SFAS
123(R). We selected the Black-Scholes option pricing model as the most appropriate fair value method for our stock-options awards and
value restricted stock based on the market value of the underlying shares at the date of grant. We recognize compensation costs using the
graded vesting attribution method that results in an accelerated recognition of compensation costs in comparison to the straight line
method.
As a result of adopting SFAS 123(R) on October 1, 2005, our income before income taxes for fiscal 2006 (not including restricted stock
expense) was $40.4 million lower than if we had continued to account for equity-based compensation under APB No. 25. Net income for
fiscal 2006 (not including restricted stock expense) was $35.7 million lower than if we had continued to account for equity-based
compensation under APB No. 25. Basic earnings per share for fiscal 2006 was $0.17 lower than if we had continued to account for equity-
based compensation under APB No. 25. Diluted earnings per share for fiscal 2006 was $0.15 lower than if we had continued to account
for equity-based compensation under APB No. 25.
Prior to the adoption of SFAS 123(R), we presented all tax benefits of deductions resulting from the exercise of stock options as operating
cash flows in the statement of cash flows. SFAS 123(R) requires the cash flows resulting from the tax deductions in excess of the
compensation costs recognized for those stock options to be classified as financing cash flows. The $0.7 million excess tax benefit classified
as financing cash inflows would have been classified as an operating cash inflow if we had not adopted SFAS 123(R).
We use a combination of implied volatility of the Company’s traded options and historical stock price volatility ("blended volatility") as
the expected volatility assumption required in the Black-Scholes option valuation model. Prior to October 1, 2005, we had used our
historical stock price volatility in accordance with SFAS 123 for purpose of presenting pro forma information. The selection of the
blended volatility approach was based upon the availability of traded options on our shares and our assessment that blended volatility is
more representative of future share price trends than historical volatility. As equity-based compensation expense recognized in the
Consolidated Statement of Operations for fiscal 2006 is based on awards ultimately expected to vest, it has been reduced for estimated
forfeitures. SFAS 123(R) requires forfeitures to be estimated at the time of grant and revised, if necessary, in subsequent periods if actual
forfeitures differ from those estimates. In our pro forma information required under SFAS 123 for the periods prior to fiscal 2006, we
accounted for forfeitures as they occurred.
RECENT ACCOUNTING PRONOUNCEMENTS
In September 2006, the Financial Accounting Standards Board (FASB) issued Statement No. 158, “Employers’ Accounting for Defined
Benefit Pension and Other Postretirement Plans,” an amendment of FASB Statements No. 87, 88, 106 and 132(R) (“SFAS 158”). SFAS 158
requires an entity to recognize in its statement of financial position an asset for a defined benefit postretirement plan’s overfunded status
or a liability for a plan’s underfunded status, measure a defined benefit postretirement plan’s assets and obligations that determine its
funded status as of the end of the employer’s fiscal year, and recognize changes in the funded status of a defined benefit postretirement
plan in comprehensive income (loss) in the year in which the changes occur.

36 Amdocs Limited Operating and Financial Review and Prospects (continued)
SFAS 158 does not change the amount of net periodic benefit cost included in net income or address the various measurement issues
associated with postretirement benefit plan accounting. The requirement to recognize the funded status of a defined benefit
postretirement plan and the disclosure requirements are effective for fiscal years ending after December 15, 2006. The requirement to
measure plan assets and benefit obligations as of the date of the employer’s fiscal year-end statement of financial position is effective for
fiscal years ending after December 15, 2008. We are currently evaluating the effect that the application of SFAS 158 will have on our
consolidated results of operations and financial condition.
In September 2006, the FASB issued SFAS No. 157, “Fair Value Measurements” (“SFAS 157”). SFAS No. 157 defines fair value, establishes
a framework for measuring fair value in generally accepted accounting principles (GAAP), and expands disclosures about fair value
measurements. SFAS No. 157 applies under other accounting pronouncements that require or permit fair value measurements. SFAS 157
will be effective for fiscal years beginning after November 15, 2007, and interim periods within those fiscal years. We are currently
evaluating the effect that the application of SFAS 157 will have on our consolidated results of operations and financial condition.
In September 2006, the SEC issued Staff Accounting Bulletin No. 108, “Financial Statements - Considering the Effects of Prior Year
Misstatements when Quantifying Misstatements in Current Year Financial Statements” (“SAB 108”). SAB 108 requires companies to
quantify the impact of all correcting misstatements, including both the carryover and reversing effects of prior year misstatements, on the
current year financial statements. SAB 108 is effective for fiscal years ending after November 15, 2006. We do not believe SAB 108 will have
a material effect on our financial statements and related disclosures.
In June 2006, the FASB issued Interpretation No. 48, “Accounting for Uncertainty in Income Taxes,” An Interpretation of SFAS No. 109,
(“FIN 48”). FIN 48 clarifies the accounting for uncertainty in income taxes recognized in an enterprise’s financial statements in
accordance with SFAS No. 109, Accounting for Income Taxes. FIN 48 also prescribes a recognition threshold and measurement attribute
for the financial statement recognition and measurement of a tax position taken or expected to be taken in a tax return that results in a
tax benefit. Additionally, FIN 48 provides guidance on de-recognition, income statement classification of interest and penalties,
accounting in interim periods, disclosure, and transition. This interpretation is effective for fiscal years beginning after December 15,
2006. We are currently evaluating the effect that the application of FIN 48 will have on our consolidated results of operations and financial
condition.
In February 2006, the FASB issued SFAS No. 155, “Accounting for Certain Hybrid Financial Instruments,” an amendment of FASB
Statement No. 133 and 140 (“SFAS 155”), which permits fair value measurement for any hybrid financial instrument that contains an
embedded derivative that otherwise would require bifurcation, with changes in fair value recognized in earnings. The fair-value election
will eliminate the need to separately recognize certain derivatives embedded in hybrid financial instruments under FASB Statement No.
133, “Accounting for Derivative Instruments and Hedging Activities”. We are currently evaluating the effect of SFAS 155, which is effective
for all financial instruments acquired or issued after the beginning of the first fiscal year that begins after September 15, 2006.

Operating and Financial Review and Prospects (continued) 2006 Annual Report 37
CURRENCY FLUCTUATIONS
We manage our foreign subsidiaries as integral direct components of our operations. The U.S. dollar is our functional currency. According
to the salient economic factors indicated in SFAS No. 52, “Foreign Currency Translation,” our cash flow, sales price, sales market, expense,
financing and intercompany transactions and arrangement indicators are predominantly denominated in the U.S. dollar. The operations
of our foreign subsidiaries provide the same type of services with the same type of expenditures throughout the Amdocs group.
During fiscal 2006, our revenue and operating expenses in the U.S. dollar or linked to the U.S. dollar were approximately 70% to 80% and
50% to 60%, respectively. As a result of long-term contracts in currencies other than the U.S. dollar and more customers seeking contracts
that are denominated in currencies such as the Euro, the percentage of our revenue and operating expenses in the U.S. dollar or linked to
the U.S. dollar may decrease slightly over time. Historically, the effect of fluctuations in currency exchange rates on our consolidated
operations was not material. As more of our customers seek contracts that are denominated in currencies other than the U.S. dollar, our
exposure to fluctuations in currency exchange rates could increase. In managing our foreign exchange risk, we enter from time to time
into various foreign exchange hedging contracts and options. We do not hedge all of our exposure in currencies other than the U.S. dollar,
but rather our policy is to hedge significant net exposures in the major foreign currencies in which we operate. We periodically assess the
applicability of the U.S. dollar as our functional currency by reviewing the salient indicators.
FOREIGN CURRENCY RISK
We enter into foreign exchange forward contracts and options to hedge most of our foreign currency exposure. We use such contracts to
hedge exposure to changes in foreign currency exchange rates associated with revenue denominated in a foreign currency, primarily
British pounds, Canadian dollars and the Euro, and anticipated costs to be incurred in a foreign currency, primarily Israeli shekels. We
also use forward contracts to hedge the impact of the variability in exchange rates on certain accounts receivable, denominated primarily
in British pounds and the Euro, and on certain accounts payable, primarily Israeli shekels. We seek to minimize the risk that the
anticipated cash flow from sales of our products and services and cash flow required for our expenses denominated in a currency other
than our functional currency will be affected by changes in exchange rates. See Note 21 to our consolidated financial statements included
in this document. The following table summarizes our foreign currency forward exchange agreements and options as of September 30,
2006. A significant portion of the forward contracts are expected to mature during fiscal 2007 and the rest during fiscal 2008. The table
below (all dollar amounts in millions) presents the notional amounts and fair value of the total derivative instruments as of September
30, 2006. Notional values are calculated based on forward rates as of September 30, 2006, U.S. dollar translated.
As of September 30, 2006
Notional AmountTranslated to
U.S. Dollar (*)
Derivatives Maturing FairDuring Fiscal Value of
2007 2008 Derivatives
Revenue $ 54.0 $ — $ (3.9)
Costs (182.6) (0.9) 7.3
Balance sheet items 18.0 — 0.2
$ (110.6) $ (0.9) $ 3.6
(*) Positive notional amounts represent forward contracts to sell foreign currency. Negative notional amounts represent forwardcontracts and options to buy foreign currency.

38 Amdocs Limited Operating and Financial Review and Prospects (continued)
INTEREST RATE RISK
Our interest expenses and income are sensitive to changes in interest rates, as all of our cash reserves and some of our borrowings, other
than the 0.50% Notes, are subject to interest rate changes. Excess liquidity is invested in short-term interest-bearing investments. Such
short-term interest-bearing investments consist primarily of commercial paper, U.S. treasury notes, U.S. federal agency securities,
corporate bonds, corporate backed obligations and mortgages. As of September 30, 2006, there were no outstanding borrowings under
our revolving lines of credit or our short-term credit facilities and $1.7 million outstanding short term loans, and accordingly, we believe
we are subject to insignificant interest rate risk.
LEGAL PROCEEDINGS
The Company is involved in various legal proceedings arising in the normal course of its business. Based upon the advice of counsel, the
Company does not believe that the ultimate resolution of these matters will have a material adverse effect on the Company’s consolidated
financial position, results of operations or cash flows.
CORPORATE GOVERNANCE
We believe there are no significant ways that our corporate governance practices differ from those followed by U.S. domestic companies
under the NYSE listing standards. For further information regarding our corporate governance practices, please refer to our Notice and
Proxy Statement to be mailed to our shareholders along with this Annual Report, and to our website at www.amdocs.com.
2006 Annual Report 39
MANAGEMENT’S REPORT ON INTERNAL CONTROL OVER FINANCIAL REPORTING
The management of the Company is responsible for establishing and maintaining adequate internal control over financial reporting for
the Company. Internal control over financial reporting is a process designed to provide reasonable assurance regarding the reliability of
financial reporting and the preparation of financial statements for external purposes in accordance with generally accepted accounting
principles and includes those policies and procedures that:
> Pertain to the maintenance of records that in reasonable detail accurately and fairly reflect the transactions and dispositions of the
assets of the Company;
> Provide reasonable assurance that transactions are recorded as necessary to permit preparation of financial statements in accordance
with generally accepted accounting principles, and that receipts and expenditures of the Company are being made only in accordance
with authorizations of management and directors of the Company; and
> Provide reasonable assurance regarding prevention or timely detection of unauthorized acquisition, use or disposition of the
Company’s assets that could have a material effect on the financial statements.
Because of its inherent limitations, internal control over financial reporting may not prevent or detect misstatements. Projections of any
evaluation of effectiveness to future periods are subject to the risk that controls may become inadequate because of changes in conditions,
or that the degree of compliance with the policies or procedures may deteriorate.
The Company’s management assessed the effectiveness of the Company’s internal control over financial reporting as of September 30,
2006. In making this assessment, the Company’s management used the criteria set forth by the Committee of Sponsoring Organizations
of the Treadway Commission (COSO) in Internal Control-Integrated Framework.
Based on its assessment, management concluded that, as of September 30, 2006, the Company’s internal control over financial reporting
is effective based on those criteria.
The financial statements and internal control over financial reporting have been audited by Ernst & Young LLP, an independent registered
public accounting firm. Ernst & Young’s report with respect to the management’s assessment of the Company’s internal control over
financial reporting is included herein.

40 Amdocs Limited
REPORT OF INDEPENDENT REGISTERED PUBLIC ACCOUNTING FIRM
To the Board of Directors and Shareholders
Amdocs Limited
We have audited the accompanying consolidated balance sheets of Amdocs Limited as of September 30, 2006 and 2005, and the related
consolidated statements of income, changes in shareholders’ equity, and cash flows for each of the three years in the period ended
September 30, 2006. These financial statements are the responsibility of the Company’s management. Our responsibility is to express an
opinion on these financial statements based on our audits.
We conducted our audits in accordance with the standards of the Public Company Accounting Oversight Board (United States).
Those standards require that we plan and perform the audit to obtain reasonable assurance about whether the financial statements are
free of material misstatement. An audit includes examining, on a test basis, evidence supporting the amounts and disclosures in the
financial statements, assessing the accounting principles used and significant estimates made by management, and evaluating the overall
financial statement presentation. We believe that our audits provide a reasonable basis for our opinion.
In our opinion, the financial statements referred to above present fairly, in all material respects, the consolidated financial position of
Amdocs Limited at September 30, 2006 and 2005, and the consolidated results of its operations and its cash flows for each of the three
years in the period ended September 30, 2006, in conformity with U.S. generally accepted accounting principles.
We also have audited, in accordance with the standards of the Public Company Accounting Oversight Board (United States), the
effectiveness of Amdocs Limited’s internal control over financial reporting as of September 30, 2006, based on criteria established in
Internal Control-Integrated Framework issued by the Committee of Sponsoring Organizations of the Treadway Commission and our
report dated November 30, 2006 expressed an unqualified opinion thereon.
Ernst & Young LLP
New York, New York
November 30, 2006

2006 Annual Report 41
REPORT OF INDEPENDENT REGISTERED PUBLIC ACCOUNTING FIRM ON MANAGEMENT’S ASSESSMENT
OF INTERNAL CONTROL OVER FINANCIAL REPORTING
To the Board of Directors and Shareholders
Amdocs Limited
We have audited management’s assessment, included in the accompanying Management’s Report on Internal Control Over Financial
Reporting, that Amdocs Limited maintained effective internal control over financial reporting as of September 30, 2006, based on criteria
established in Internal Control—Integrated Framework issued by the Committee of Sponsoring Organizations of the Treadway
Commission (the COSO criteria). Amdocs Limited’s management is responsible for maintaining effective internal control over financial
reporting and for its assessment of the effectiveness of internal control over financial reporting. Our responsibility is to express an opinion
on management’s assessment and an opinion on the effectiveness of the company’s internal control over financial reporting based on our
audit.
We conducted our audit in accordance with the standards of the Public Company Accounting Oversight Board (United States). Those
standards require that we plan and perform the audit to obtain reasonable assurance about whether effective internal control over
financial reporting was maintained in all material respects. Our audit included obtaining an understanding of internal control over
financial reporting, evaluating management’s assessment, testing and evaluating the design and operating effectiveness of internal control,
and performing such other procedures as we considered necessary in the circumstances. We believe that our audit provides a reasonable
basis for our opinion.
A company’s internal control over financial reporting is a process designed to provide reasonable assurance regarding the reliability of
financial reporting and the preparation of financial statements for external purposes in accordance with generally accepted accounting
principles. A company’s internal control over financial reporting includes those policies and procedures that (1) pertain to the
maintenance of records that, in reasonable detail, accurately and fairly reflect the transactions and dispositions of the assets of the
company; (2) provide reasonable assurance that transactions are recorded as necessary to permit preparation of financial statements in
accordance with generally accepted accounting principles, and that receipts and expenditures of the company are being made only in
accordance with authorizations of management and directors of the company; and (3) provide reasonable assurance regarding prevention
or timely detection of unauthorized acquisition, use, or disposition of the company’s assets that could have a material effect on the
financial statements.
Because of its inherent limitations, internal control over financial reporting may not prevent or detect misstatements. Also, projections of
any evaluation of effectiveness to future periods are subject to the risk that controls may become inadequate because of changes in
conditions, or that the degree of compliance with the policies or procedures may deteriorate.
In our opinion, management’s assessment that Amdocs Limited maintained effective internal control over financial reporting as of
September 30, 2006, is fairly stated, in all material respects, based on the COSO criteria. Also, in our opinion, Amdocs Limited maintained,
in all material respects, effective internal control over financial reporting as of September 30, 2006, based on the COSO criteria.
We also have audited, in accordance with the standards of the Public Company Accounting Oversight Board (United States), the
consolidated balance sheets of Amdocs Limited as of September 30, 2006 and 2005, and the related consolidated statements of income,
changes in shareholders’ equity, and cash flows for each of the three years in the period ended September 30, 2006 and our report dated
November 30, 2006 expressed an unqualified opinion thereon.
Ernst & Young LLP
New York, New York
November 30, 2006

42 Amdocs Limited
CONSOLIDATED BALANCE SHEETS ( i n t h o u s a n d s , exce p t p e r s h a re d a t a )
As of September 30,
2 0 0 6 2005
a s s e t s
Current assets:
Cash and cash equivalents $ 607,187 $ 707,552
Short-term interest-bearing investments 372,194 438,011
Accounts receivable, net 425,805 304,237
Deferred income taxes and taxes receivable 136,044 101,162
Prepaid expenses and other current assets 97,476 76,780
Total current assets 1,638,706 1,627,742
Equipment, vehicles and leasehold improvements, net 220,290 181,812
Deferred income taxes 133,690 120,217
Goodwill 1,461,606 969,639
Intangible assets, net 347,716 159,619
Other noncurrent assets 160,820 143,439
Total assets $3,962,828 $3,202,468
l i a b i l i t i e s a n d s h a r e h o l d e r ,s e q u i t y
Current liabilities:
Accounts payable $ 148,398 $ 114,392
Accrued expenses and other current liabilities 270,268 199,458
Accrued personnel costs 178,441 148,426
Short-term portion of financing arrangements and capital lease obligations 1,963 8,480
Deferred revenue 253,376 216,770
Deferred income taxes and taxes payable 179,241 171,377
Total current liabilities 1,031,687 858,903
Convertible notes 450,000 450,272
Deferred income taxes 129,339 50,571
Noncurrent liabilities and other 197,637 186,270
Total liabilities 1,808,663 1,546,016
Shareholders’ equity:
Preferred Shares – Authorized 25,000 shares; £0.01 par value; 0 shares issued and outstanding — —
Ordinary Shares – Authorized 550,000 shares; £0.01 par value; 233,932 and 227,321 issued
and 206,793 and 200,182 outstanding, in 2006 and 2005, respectively 3,763 3,644
Additional paid-in capital 2,035,309 1,870,922
Treasury stock, at cost – 27,139 Ordinary Shares in 2006 and 2005 (602,392) (602,392)
Accumulated other comprehensive income (loss) 2,723 (10,886)
Unearned compensation — (962)
Retained earnings 714,762 396,126
Total shareholders’ equity 2,154,165 1,656,452
Total liabilities and shareholders’ equity $3,962,828 $3,202,468
The accompanying notes are an integral part of these consolidated financial statements.

2006 Annual Report 43
CONSOLIDATED STATEMENTS OF INCOME ( i n t h o u s a n d s , exce p t p e r s h a re d a t a )
Year ended September 30,
2 0 0 6 2005 2004
r e v e n u e :
License $ 116,285 $ 100,044 $ 76,586
Service 2,363,765 1,938,577 1,697,146
2,480,050 2,038,621 1,773,732
o p e r at i n g e x p e n s e s :
Cost of license 4,003 4,083 5,022
Cost of service 1,579,823 1,291,572 1,117,810
Research and development 186,760 144,457 126,407
Selling, general and administrative 313,997 232,066 210,384
Amortization of purchased intangible assets 37,610 15,356 17,909
Restructuring charges, in-process research and development and other
acquisition-related costs 25,725 12,595 —
2,147,918 1,700,129 1,477,532
o p e r at i n g i n c o m e 332,132 338,492 296,200
Interest income and other, net 41,741 22,303 4,903
Income before income taxes 373,873 360,795 301,103
Income taxes 55,237 72,159 66,243
n e t i n c o m e $ 318,636 $ 288,636 $ 234,860
b a s i c e a r n i n g s p e r s h a r e $ 1.57 $ 1.44 $ 1.13
d i lu t e d e a r n i n g s p e r s h a r e $ 1.48 $ 1.35 $ 1.08
b a s i c w e i g h t e d av e r ag e n u m b e r
o f s h a r e s o u t s ta n d i n g 203,194 201,023 208,726
d i lu t e d w e i g h t e d av e r ag e n u m b e r
o f s h a r e s o u t s ta n d i n g 218,534 217,162 220,285
(1) The twelve months ended September 30, 2006 include equity-based compensation pre-tax expense of $46,178, which wasclassified as follows: $18,042 to cost of service, $4,711 to research and development and $23,425 to selling, general andadministrative.
The accompanying notes are an integral part of these consolidated financial statements.
( 1 )

44 Amdocs Limited
The accompanying notes are an integral part of these consolidated financial statements.
CONSOLIDATED STATEMENTS OF CHANGES IN SHAREHOLDERS’ EQUITY ( i n t h o u s a n d s )
Ordinary SharesShares Amount
b a l a n c e a s o f o c t o b e r 1 , 2 0 0 3 216,058 $ 3,580
Comprehensive income:
Net income — —
Unrealized loss on foreign currency hedging contracts, net of $(1,575) tax — —
Unrealized loss on short-term interest-bearing investments, net of $(204) tax — —
Comprehensive income
Employee stock options exercised 1,157 21
Tax benefit of stock options exercised — —
Repurchase of shares (16,442) —
Issuance of Ordinary Shares related to acquisition, net 561 —
Stock options granted, net of forfeitures — —
Amortization of unearned compensation — —
Expense related to vesting of stock options — —
b a l a n c e a s o f s e p t e m b e r 3 0 , 2 0 0 4 201,334 3,601
Comprehensive income:
Net income — —
Unrealized loss on foreign currency hedging contracts, net of $(1,927) tax — —
Unrealized loss on short-term interest-bearing investments, net of $(253) tax — —
Comprehensive income
Employee stock options exercised 2,229 41
Tax benefit of stock options exercised — —
Repurchase of shares (3,525) —
Issuance of restricted stock and stock options related to acquisitions, net 144 2
Amortization of unearned compensation — —
Expense related to vesting of stock options — —
b a l a n c e a s o f s e p t e m b e r 3 0 , 2 0 0 5 200,182 3,644
Comprehensive income:
Net income — —
Unrealized gain on foreign currency hedging contracts, net of $1,847 tax — —
Unrealized gain on short-term interest-bearing investments, net of $485 tax — —
Comprehensive income
Employee stock options exercised 5,869 106
Tax benefit of stock options exercised — —
Issuance of restricted stock, net of cancellations 742 13
Issuance of restricted stock and stock options related to acquisitions, net — —
Equity-based compensation expense related to employees — —
Reclassification of unearned compensation to additional paid-in capital — —
Equity-based compensation expense related to non employee stock options — —
b a l a n c e a s o f s e p t e m b e r 3 0 , 2 0 0 6 206,793 $ 3,763
As of September 30, 2006, 2005 and 2004, accumulated other comprehensive income (loss) is comprised of unrealized (loss) gainon derivatives, net of tax, of $2,841, $(9,097) and $(1,232) and unrealized loss on cash equivalents and short-term interest-bearinginvestments, net of tax, of $(118), $(1,789) and $(687).

2006 Annual Report 45
Accumulated RetainedAdditional Other Earnings Total
Paid-in Treasury Comprehensive Unearned (Accumulated Shareholders’Capital Stock Income (Loss) Compensation Deficit) Equity
$ 1,820,956 $ (109,281) $ 3,715 — $ (127,370) $ 1,591,600
— — — — 234,860 234,860
— — (4,915) — — (4,915)
— — (719) — — (719)
229,226
12,056 — — — — 12,077
3,094 — — — — 3,094
— (407,527) — — — (407,527)
747 14,392 — — — 15,139
749 — — (749) — —
— — — 575 — 575
6 — — — — 6
1,837,608 (502,416) (1,919) (174) 107,490 1,444,190
— — — — 288,636 288,636
— — (7,865) — — (7,865)
— — (1,102) — — (1,102)
279,669
23,983 — — — — 24,024
3,147 — — — — 3,147
— (99,976) — — — (99,976)
6,034 — — (1,428) — 4,608
— — — 640 — 640
150 — — — — 150
1,870,922 (602,392) (10,886) (962) 396,126 1,656,452
— — — — 318,636 318,636
— — 11,938 — — 11,938
— — 1,671 — — 1,671
332,245
106,853 — — — — 106,959
7,619 — — — — 7,619
— — — — — 13
4,634 — — — — 4,634
46,178 — — — — 46,178
(962) — — 962 — —
65 — — — — 65
$ 2,035,309 $ (602,392) $ 2,723 $ — $ 714,762 $ 2,154,165

46 Amdocs Limited
CONSOLIDATED STATEMENTS OF CASH FLOWS ( i n t h o u s a n d s )
Year ended September 30,
2 0 0 6 2005 2004
c a s h f l o w f r o m o p e r at i n g ac t i v i t i e s :
Net income $ 318,636 $ 288,636 $ 234,860
Reconciliation of net income to net cash provided by operating activities:
Depreciation and amortization 117,900 93,828 100,877
In-process research and development expenses 25,725 2,760 —
Equity-based compensation expense 46,178 — —
Loss (gain) on sale of equipment 789 (786) (1,436)
Deferred income taxes 22,811 8,062 (11,272)
Excess tax benefit from equity-based compensation (722) — —
Tax benefit of stock options exercised — 3,147 3,094
Realized (gain) loss from short-term interest-bearing investments and other (4,030) (657) 1,850
Net changes in operating assets and liabilities, net of amounts acquired:
Accounts receivable (79,363) (15,106) (53,723)
Prepaid expenses and other current assets (10,536) 3,667 1,856
Other noncurrent assets (18,313) (17,593) (44,401)
Accounts payable and accrued expenses 54,569 26,542 31,697
Deferred revenue (52,050) (5,702) 46,713
Income taxes payable (10,796) (6,643) 33,773
Noncurrent liabilities and other 18,422 1,596 516
Net cash provided by operating activities 429,220 381,751 344,404
c a s h f l o w f r o m i n v e s t i n g ac t i v i t i e s :
Proceeds from sale of equipment, vehicles and leasehold improvements 4,274 5,829 4,431
Payments for purchase of equipment, vehicles and leasehold improvements (80,717) (71,374) (54,148)
Purchase of short-term interest-bearing investments (1,216,259) (747,073) (1,325,383)
Proceeds from sale of short-term interest-bearing investments 1,288,261 948,711 1,125,538
Net cash paid for acquisitions (624,801) (262,253) (10,651)
Net cash used in investing activities (629,242) (126,160) (260,213)
c a s h f l o w f r o m f i na n c i n g ac t i v i t i e s :
Proceeds from employee stock options exercised 106,853 24,024 12,077
Excess tax benefit from equity-based compensation 722 — —
Repurchase of shares — (99,976) (407,527)
Repurchase of 2% convertible notes (97) — (400,169)
Net proceeds from issue of long-term 0.50% convertible notes — — 441,610
Borrowings under financing arrangements — — 987
Principal payments under financing arrangements (4,677) (667) (2,213)
Principal payments on capital lease obligations (3,144) (21,772) (26,204)
Net cash provided by (used in) financing activities 99,657 (98,391) (381,439)
Net (decrease) increase in cash and cash equivalents (100,365) 157,200 (297,248)
Cash and cash equivalents at beginning of year 707,552 550,352 847,600
Cash and cash equivalents at end of year $ 607,187 $ 707,552 $ 550,352
The accompanying notes are an integral part of these consolidated financial statements.

2006 Annual Report 47
CONSOLIDATED STATEMENTS OF CASH FLOWS ( i n t h o u s a n d s ) ( co n t i nu e d )
Year ended September 30,
2 0 0 6 2005 2004
s u p p l e m e n ta ry c a s h f l o w i n f o r m at i o n
Interest and Income Taxes Paid
Cash paid for:
Income taxes, net of refunds $ 40,861 $ 62,668 $ 35,677
Interest 2,630 5,233 11,940
The accompanying notes are an integral part of these consolidated financial statements.

48 Amdocs Limited
NOTES TO THE CONSOLIDATEDFINANCIAL STATEMENTSSEPTEMBER 30, 2006( dollar and share amounts in thousands, except per share data)
NOTE 1 – NATURE OF ENTITY
Amdocs Limited (the “Company”) is a leading provider of software products and services to the communications industry. The Company
and its subsidiaries operate in one segment, providing integrated offering products and services that enable its customers to move toward
an integrated approach to customer management. The Company designs, develops, markets, supports, operates and provides information
system solutions, including Managed Services, primarily to leading communications companies throughout the world.
The Company is a Guernsey corporation, which directly or indirectly holds several wholly owned subsidiaries around the world. The
majority of the Company’s customers are in North America, Europe, Latin America and the Asia-Pacific region. The Company’s main
production and operating facilities are located in Israel, the United States, United Kingdom, Cyprus, Australia, Canada, China, Ireland and
India.
NOTE 2 – SUMMARY OF SIGNIFICANT ACCOUNTING POLICIES
BASIS OF PRESENTATION
The consolidated financial statements are prepared in accordance with U.S. generally accepted accounting principles.
CONSOLIDATION
The financial statements include the accounts of the Company and its wholly owned subsidiaries. All intercompany transactions and
balances have been eliminated in consolidation.

2006 Annual Report 49Notes to the Consolidated Financial Statements (continued)(dol lar and share amounts in thousands, except per share data)
FUNCTIONAL CURRENCY
The Company manages its foreign subsidiaries as integral direct components of its operations. According to the salient economic factors
indicated in Statement of Financial Accounting Standards (“SFAS”) No. 52, “Foreign Currency Translation,” the Company’s cash flow,
sales price, sales market, expense, financing and intercompany transactions and arrangement indicators are predominantly denominated
in the U.S. dollar. The operations of the Company’s foreign subsidiaries provide the same type of services with the same type of
expenditures throughout the Amdocs group. Accordingly, the Company has determined that its functional currency is the U.S. dollar. The
Company periodically assesses the applicability of the U.S. dollar as the Company’s functional currency by reviewing the salient indicators.
CASH AND CASH EQUIVALENTS
Cash and cash equivalents consist of cash and interest-bearing investments with insignificant interest rate risk and original maturities of
90 days or less.
INVESTMENTS
The Company classifies all of its short-term interest-bearing investments as available-for-sale securities. Such short-term interest-bearing
investments consist primarily of commercial paper, U.S. treasury notes, U.S. federal agency securities, corporate bonds, corporate backed
obligations and mortgages, which are stated at market value. Unrealized gains and losses are comprised of the difference between market
value and amortized costs of such securities and are reflected, net of tax, as “accumulated other comprehensive income (loss)” in
shareholders’ equity. Realized gains and losses on short-term interest-bearing investments are included in earnings and are derived using
the specific identification method for determining the cost of securities.
EQUIPMENT, VEHICLES AND LEASEHOLD IMPROVEMENTS
Equipment, vehicles and leasehold improvements are stated at cost. Assets under capital leases are recorded at the present value of the
future minimum lease payments at the date of acquisition. Depreciation is computed using the straight-line method over the estimated
useful life of the asset, which primarily ranges from 3 to 10 years and includes the amortization of assets under capitalized leases.
Leasehold improvements are amortized over the shorter of the estimated useful lives or the term of the related lease. Management reviews
property and equipment and other long-lived assets on a periodic basis to determine whether events or changes in circumstances indicate
that the carrying amount of such assets may not be recoverable.
GOODWILL AND OTHER INTANGIBLE ASSETS
SFAS No. 141, “Business Combinations” (“SFAS No. 141”) requires that the purchase method of accounting be used for all business
combinations. Under SFAS No. 142,“Goodwill and Other Intangible Assets,” goodwill and intangible assets deemed to have indefinite lives
are subject to an annual impairment test in accordance with the Statement. Goodwill impairment is deemed to exist if the net book value
of a reporting unit exceeds its estimated fair value. Other intangible assets are amortized over their useful lives.
The total purchase price of business acquisitions accounted for using the purchase method is allocated first to identifiable assets and
liabilities based on estimated fair values. The excess of the purchase price over the fair value of net assets of purchased businesses is
recorded as goodwill.
Other intangible assets consist primarily of purchased computer software, intellectual property rights, core technology and customer
arrangements. Intellectual property rights, purchased computer software and core technology acquired by the Company are amortized
over their estimated useful lives on a straight-line basis.
Some of the acquired customer arrangements are amortized over their estimated useful lives in proportion to the economic benefits
realized. This accounting policy results in accelerated amortization of such customer arrangements as compared to the straight-line
method. All other acquired customer arrangements are amortized over their estimated useful lives on a straight-line basis.

50 Amdocs Limited
LONG-LIVED ASSETS
The Company considers whether there are indicators of impairment that would require the comparison of the estimated net realizable
value of intangible assets with finite lives, equipment, leasehold improvements and vehicles and other long-lived assets, using an
undiscounted cash flow analysis, to their carrying value under SFAS No. 144, “Accounting for the Impairment or Disposal of Long-Lived
Assets.” Any impairment would be recognized when the fair market value of such long-lived assets is less than their carrying value. During
the year ended September 30, 2004, the Company identified and recognized an impairment charge (included in cost of service) of $2,785
related to software technology that the Company had no future use for, and therefore was abandoned.
COMPREHENSIVE INCOME (LOSS)
The Company accounts for comprehensive income (loss) under the provisions of SFAS No. 130, “Reporting Comprehensive Income,”
which established standards for the reporting and display of comprehensive income (loss) and its components. Comprehensive income
(loss) represents the change in shareholders’ equity during a period from transactions and other events and circumstances from nonowner
sources. It includes all changes in equity except those resulting from investments by owners and distributions to owners.
CONVERTIBLE NOTES
Accrued interest on the Company’s convertible notes is included in “accrued expenses and other current liabilities.” The Company
amortizes the issuance costs related to the convertible notes on a straight-line basis over the term of the convertible notes. The amortized
issuance cost calculated on a pro-rata basis, related to the repurchased 0.5% convertible notes, is included in “interest income and other, net.”
TREASURY STOCK
The Company repurchases its Ordinary Shares from time to time on the open market or in other transactions and holds such shares as
treasury stock. The Company presents the cost to repurchase treasury stock as a reduction of shareholders’ equity.
INCOME TAXES
The Company records deferred income taxes to reflect the net tax effects of temporary differences between the carrying amounts of assets
and liabilities for financial reporting and tax purposes. Deferred taxes are computed based on tax rates anticipated to be in effect when
the deferred taxes are expected to be paid or realized. A valuation allowance is provided for deferred tax assets if it is more likely than not
these items will either expire before the Company is able to realize their benefit, or where future deductibility is uncertain. In the event
that a valuation allowance relating to a business acquisition is subsequently reduced, the adjustment will reduce the original amount
allocated to goodwill.
Deferred tax liabilities and assets are classified as current or noncurrent based on the classification of the related asset or liability for
financial reporting, or according to the expected reversal dates of the specific temporary differences if not related to an asset or liability
for financial reporting, and also include anticipated withholding taxes due on subsidiaries’ earnings when paid as dividends to the
Company.
It is the Company’s policy to establish accruals for taxes that may become payable in future years as a result of examinations by tax
authorities. The Company establishes the accruals based upon management’s assessment of probable contingencies. The Company
believes it has appropriately accrued for probable contingencies.
REVENUE RECOGNITION
Revenue is recognized only when all of the following conditions have been met: (i) there is persuasive evidence of an arrangement; (ii)
delivery has occurred; (iii) the fee is fixed and determinable; and (iv) collectibility of the fee is reasonably assured. The Company usually sells
its software licenses as part of an overall solution offered to a customer that combines the sale of software licenses with a broad range of
services, which normally include significant customization, modification, implementation and integration. As a result, combined license and
service revenue generally is recognized over the course of these long-term projects, using the percentage of completion method of accounting
in conformity with Accounting Research Bulletin (“ARB”) No. 45, “Long Term Construction-Type Contracts,” Statement of Position
(“SOP”) 81-1, “Accounting for Performance of Construction-Type and Certain Production-Type Contracts” and SOP 97-2, “Software
Revenue Recognition.” Losses are recognized on contracts in the period in which the loss is identified in accordance with SOP 81-1.
Notes to the Consolidated Financial Statements (continued)(dol lar and share amounts in thousands, except per share data)

2006 Annual Report 51Notes to the Consolidated Financial Statements (continued)(dol lar and share amounts in thousands, except per share data)
Initial license fee for software revenue is recognized as work is performed, under the percentage of completion method of accounting.
Subsequent license fee revenue is recognized upon completion of specified conditions in each contract, based on a customer’s subscriber
level or transaction volume or other measurements when greater than the level specified in the contract for the initial license fee.
Service revenue that involves significant ongoing obligations, including fees for software customization, implementation and modification
as part of a long-term contract is recognized as work is performed, under the percentage of completion method of accounting. In cases where
extended payment terms exist, license and related customization fees are recognized when payments are due, in accordance with SOP 97-2.
Revenue from software solutions that do not require significant customization and modification is recognized upon delivery or as services
are provided, in accordance with SAB 104, “Revenue Recognition” and SOP 97-2. The Company complies with Emerging Issues Task Force
(“EITF”) 03-05, “Applicability of AICPA SOP 97-2 to Non-Software Deliverables in an Arrangement Containing More Than Incidental
Software.”
In Managed Services contracts as well as in other long term contracts, revenue from the operation of a customer’s system is recognized either
as services are performed based on time elapsed, output produced or volume of data processed. Revenue from ongoing support services is
recognized as work is performed.
Revenue from third-party hardware sales is recognized upon delivery and installation, and revenue from third-party software sales is
recognized upon delivery. Revenue from third-party hardware and software sales is recorded according to the criteria established in EITF
99-19, “Recording Revenue Gross as a Principal versus Net as an Agent” and SAB 104. Revenue is recorded at gross amount for transactions
in which the Company is the primary obligor under the arrangement and/or possesses other attributes such as pricing and supplier selection
latitude. In specific circumstances where the Company does not meet the above criteria, particularly when the contract stipulates that the
Company is not the primary obligor, the Company recognizes revenue on a net basis.
Included in service revenue are sales of third-party products. Revenue from sales of such products includes third-party computer hardware
and computer software products and was less than 10% of total revenue in each of fiscal 2006, 2005 and 2004.
Maintenance revenue is recognized ratably over the term of the maintenance agreement, which in most cases is one year or less.
As a result of a significant portion of the Company’s revenue being subject to the percentage of completion accounting method, the
Company’s annual and quarterly operating results may be significantly affected by the size and timing of customer projects and the
Company’s progress in completing such projects.
Many of the Company’s agreements include multiple deliverables. For these multiple element arrangements, the fair value of each
component is determined based on specific objective evidence for that element and revenue is allocated to each component based upon its
fair value. The revenue associated with each element is recognized using the respective methodology discussed above. The Company uses
the residual method in accordance with SOP 97-2 and EITF 00-21,“Revenue Arrangements with Multiple Deliverables,” in multiple element
arrangements that include license for the sale of software solutions that do not require significant customization and modification and first
year maintenance to determine the appropriate value for the license component.
In circumstances where the Company enters into a contract with a customer for the provision of Managed Services for a defined period of
time, the Company defers, in accordance with SAB 104, certain incremental costs incurred at the inception of the contract. These costs
include time and expense incurred in association with the origination of a contract. The deferred costs are amortized on a straight-line basis
over the life of the respective customer contract. Revenue associated with these capitalized costs is deferred and is recognized over the same
period.
In cases where extended payment terms exist and revenue is deferred until payments are due, related costs are capitalized as contract costs
and recognized as revenue is recognized.
Deferred revenue represents billings to customers for licenses, services and third-party products for which revenue has not been recognized.
Unbilled accounts receivable include all revenue amounts that had not been billed as of the balance sheet date due to contractual or other
arrangements with customers. Allowances that are netted against accounts receivable represent amounts provided for accounts for which
their collectibility is not reasonably assured.
52 Amdocs Limited Notes to the Consolidated Financial Statements (continued)(dol lar and share amounts in thousands, except per share data)
COST OF LICENSE AND COST OF SERVICE
Cost of license and cost of service consist of all costs associated with providing services to customers, including identified losses on
contracts and warranty expense. Estimated losses on contracts are recognized in the period in which the loss is identified in accordance
with SOP 81-1. Estimated costs related to warranty obligations are initially provided at the time the product is delivered and are revised
to reflect subsequent changes in circumstances and estimates. Cost of license includes royalty payments to software suppliers,
amortization of purchased computer software and intellectual property rights.
Cost of service also includes costs of third-party products associated with reselling third-party computer hardware and software products
to customers, when revenue from third-party products is recorded at the gross amount. Customers purchasing third-party products from
the Company generally do so in conjunction with the purchase of services.
RESEARCH AND DEVELOPMENT
Research and development expenditures consist of costs incurred in the development of new software modules and product offerings,
either as part of the Company’s internal product development programs or in conjunction with customer projects. Research and
development costs, which are incurred in conjunction with a customer project, are expensed as incurred.
Based on the Company’s product development process, technological feasibility, as defined in SFAS No. 86, “Accounting for the Costs of
Computer Software to be Sold, Leased or Otherwise Marketed,” is established upon completion of a detailed program design or, in the
absence thereof, completion of a working model. Costs incurred by the Company after achieving technological feasibility and before the
product is ready for customer release have been insignificant.
EMPLOYEE BENEFIT PLANS
The Company maintains a non-contributory defined benefit plan for one of its Canadian subsidiaries that provides for pensions for
substantially all of that subsidiary’s employees based on length of service and rate of pay. Additionally, the Company provides to these
employees other retirement benefits such as certain health care and life insurance benefits on retirement and various disability plans,
workers’ compensation and medical benefits to former or inactive employees, their beneficiaries and covered dependants, after
employment but before retirement, under specified circumstances.
The Company accrues its obligations to these employees under employee benefit plans and the related costs net of returns on plan assets.
Pension expense and other retirement benefits earned by employees are actuarially determined using the projected benefit method pro-
rated on service and based on management’s best estimates of expected plan investments performance, salary escalation, retirement ages
of employees and expected health care costs.
The fair value of the employee benefit plans’ assets is based on market values. The plan assets are valued at market value for the purpose
of calculating the expected return on plan assets and the amortization of experience gains and losses. Past service costs, which may arise
from plan amendments, are amortized on a straight-line basis over the average remaining service period of the employees who were active
at the date of amendment. The excess of the net actuarial gain (loss) over 10% of the greater of the benefit obligation and the market-
related value of plan assets is amortized over the average remaining service period of active employees.
EQUITY-BASED COMPENSATION
Effective October 1, 2005, the Company adopted FASB Statement No. 123 (revised 2004), “Share-Based Payment,” a revision of SFAS No.
123 (“SFAS 123(R)”). SFAS 123(R) supersedes Accounting Principles Board (“APB”) Opinion No. 25, “Accounting for Stock Issued to
Employees” (“APB No. 25”) and related interpretations, and amends FASB Statement No. 95, “Statement of Cash Flows.” Generally, the
approach in SFAS 123(R) is similar to the approach described in SFAS 123. However, SFAS 123(R) requires all equity-based payments to
employees, including grants of employee stock options, to be recognized in the income statement based on their fair values. Pro forma
disclosure is no longer an alternative. In March 2005, the SEC issued Staff Accounting Bulletin No. 107 (“SAB 107”), which provides
supplemental implementation guidance on SFAS 123(R). The Company has applied the provisions of SAB 107 in its adoption of SFAS
123(R).

2006 Annual Report 53Notes to the Consolidated Financial Statements (continued)(dol lar and share amounts in thousands, except per share data)
Prior to October 1, 2005, the Company accounted for equity-based payments to employees under the recognition and measurement
provisions of APB No. 25. Pursuant to these accounting standards, the Company recorded deferred compensation for stock options
granted to employees at the date of grant based on the difference between the exercise price of the options and the market value of the
underlying shares at that date, and for restricted stock based on the market value of the underlying shares at the date of grant. No
compensation expense was recorded for stock options that were granted to employees and directors at an exercise price equal to or greater
than the fair market value of the Ordinary Shares at the time of the grant.
The Company adopted SFAS 123(R) using the modified prospective method. Under this transition method, compensation costs
recognized in fiscal 2006 include (a) compensation costs for all equity-based payments granted prior to, but that had not yet vested as of,
October 1, 2005, based on the grant date fair value estimated in accordance with the pro forma provisions of SFAS 123, and (b)
compensation costs for the equity-based payments granted subsequent to October 1, 2005, based on the grant date fair value estimated
in accordance with SFAS 123(R). The Company’s consolidated financial statements for prior periods have not been restated to reflect, and
do not include, the impact of SFAS 123(R). The Company selected the Black-Scholes option pricing model as the most appropriate fair
value method for its stock-options awards and values restricted stock based on the market value of the underlying shares at the date of
grant. The Company recognizes compensation costs using the graded vesting attribution method that results in an accelerated recognition
of compensation costs in comparison to the straight line method.
As a result of adopting SFAS 123(R) on October 1, 2005, the Company’s income before income taxes and net income for fiscal 2006 (not
including restricted stock expense) were $40,432 and $35,725, respectively, lower, than if the Company had continued to account for
equity-based compensation under APB No. 25. Basic and diluted earnings per share for fiscal 2006 were $0.17 and $0.15 lower,
respectively, than if the Company had continued to account for share based compensation under APB No. 25. The total income tax benefit
recognized in the income statement for equity-based compensation (including restricted stock) for fiscal 2006 was $5,575, and $0 for fiscal
2005.
Prior to the adoption of SFAS 123(R), the Company presented all tax benefits of deductions resulting from the exercise of stock options
as operating cash flows in the statement of cash flows. SFAS 123(R) requires the cash flows resulting from the tax deductions in excess of
the compensation costs recognized for those stock options to be classified as financing cash flows. The $722 excess tax benefit classified
as financing cash inflows would have been classified as an operating cash inflow if the Company had not adopted SFAS 123(R).
The Company uses a combination of implied volatility of the Company’s traded options and historical stock price volatility ("blended
volatility") as the expected volatility assumption required in the Black-Scholes option valuation model. Prior to October 1, 2005, the
Company had used its historical stock price volatility in accordance with SFAS 123 for purposes of presenting its pro forma information.
The selection of the blended volatility approach was based upon the availability of traded options on the Company’s shares and the
Company’s assessment that blended volatility is more representative of future share price trends than historical volatility. As equity-based
compensation expense recognized in the Company’s consolidated statement of income for fiscal 2006 is based on awards ultimately
expected to vest, such expense has been reduced for estimated forfeitures. SFAS 123(R) requires forfeitures to be estimated at the time of
grant and revised, if necessary, in subsequent periods if actual forfeitures differ from those estimates. In the Company’s pro forma
information required under SFAS 123 for the periods prior to fiscal 2006, the Company accounted for forfeitures as they occurred.
FAIR VALUE OF FINANCIAL INSTRUMENTS
The financial instruments of the Company consist mainly of cash and cash equivalents, short-term interest-bearing investments, accounts
receivable, accounts payable, short-term financing arrangements, forward exchange contracts and options, lease obligations and
convertible notes. The fair value of the financial instruments, excluding the convertible notes (for which the fair value as of September 30,
2006 is approximately $481,000), included in the accounts of the Company does not significantly vary from their carrying amount. The
fair values of the Company’s foreign currency exchange contracts are estimated based on quoted market prices of comparable contracts.
See Note 21.

54 Amdocs Limited Notes to the Consolidated Financial Statements (continued)(dol lar and share amounts in thousands, except per share data)
CONCENTRATIONS OF CREDIT RISK
Financial instruments that potentially subject the Company to concentration of credit risk consist principally of cash and cash
equivalents, short-term interest-bearing investments and trade receivables. The Company invests its excess cash primarily in highly liquid
U.S. dollar-denominated securities primarily with major U.S. institutions. The Company does not expect any credit losses with respect to
these items.
The Company’s revenue is generated primarily in North America and Europe. To a lesser extent, revenue is generated in the Asia-Pacific
region and Latin America. Most of the Company’s customers are among the largest communications and directory publishing companies
in the world (or are owned by them). The Company’s business is subject to the effects of general global economic conditions and, in
particular, market conditions in the communications industry. The Company performs ongoing credit analyses of its customer base and
generally does not require collateral. The allowance for doubtful accounts is for estimated losses resulting from the inability of the
Company’s customers to make required payments. The Company evaluates accounts receivable to determine if they will ultimately be
collected. In performing this evaluation, significant judgments and estimates are involved, such as past experience, credit quality of the
customer, age of the receivable balance and current economic conditions that may affect a customer’s ability to pay. As of September 30,
2006, the Company had two customers that had accounts receivable balances of more than 10% of total accounts receivable, aggregating
23.4% (12.1% and 11.3%). As of September 30, 2005, the Company had two customers that had accounts receivable balances of more
than 10% of total accounts receivable, aggregating 21.7% (11.0% and 10.7%).
EARNINGS PER SHARE
The Company accounts for earnings per share based on SFAS No. 128, “Earnings per Share.” SFAS No. 128 requires companies to compute
earnings per share under two different methods, basic and diluted earnings per share, and to disclose the methodology used for the
calculations. Basic earnings per share are calculated using the weighted average number of shares outstanding during the period. Diluted
earnings per share is computed on the basis of the weighted average number of shares outstanding and the effect of dilutive outstanding
equity-based awards using the treasury stock method and the effect of dilutive outstanding convertible notes using the if-converted
method.
DERIVATIVES AND HEDGING
The Company accounts for derivatives and hedging based on SFAS No. 133, “Accounting for Derivative Instruments and Hedging
Activities,” as amended and related Interpretations. SFAS No. 133 requires the Company to recognize all derivatives on the balance sheet
at fair value. If a derivative meets the definition of a hedge and is so designated, depending on the nature of the hedge, changes in the fair
value of the derivative will either be offset against the change in fair value of the hedged assets, liabilities, or firm commitments through
earnings or recognized in other comprehensive income until the hedged item is recognized in earnings. The ineffective portion of a
derivative’s change in fair value is recognized in earnings.
GUARANTOR’S ACCOUNTING AND DISCLOSURE REQUIREMENTS FOR GUARANTEES
The Company follows FASB Interpretation No. 45, “Guarantor’s Accounting and Disclosure Requirements for Guarantees, Including
Indirect Guarantees of Indebtedness of Others” (“FIN No. 45”). FIN No. 45 requires that, at the inception of certain types of guarantees,
the guarantor must disclose and recognize a liability for the fair value of the obligation it assumes under the guarantee.
RECLASSIFICATIONS
Certain immaterial amounts in prior years’ financial statements have been reclassified to conform to the current year’s presentation.
RECENT ACCOUNTING PRONOUNCEMENTS
In September 2006, the Financial Accounting Standards Board (FASB) issued Statement No. 158, “Employers’ Accounting for Defined
Benefit Pension and Other Postretirement Plans,” an amendment of FASB Statements No. 87, 88, 106 and 132(R) (“SFAS 158”). SFAS 158
requires an entity to recognize in its statement of financial position an asset for a defined benefit postretirement plan’s over funded status
or a liability for a plan’s under funded status, measure a defined benefit postretirement plan’s assets and obligations that determine its
funded status as of the end of the employer’s fiscal year, and recognize changes in the funded status of a defined benefit postretirement
plan in comprehensive income in the year in which the changes occur.
2006 Annual Report 55Notes to the Consolidated Financial Statements (continued)(dol lar and share amounts in thousands, except per share data)
SFAS 158 does not change the amount of net periodic benefit cost included in net income or address the various measurement issues
associated with postretirement benefit plan accounting. The requirement to recognize the funded status of a defined benefit
postretirement plan and the disclosure requirements are effective for fiscal years ending after December 15, 2006. The requirement to
measure plan assets and benefit obligations as of the date of the employer’s fiscal year-end statement of financial position is effective for
fiscal years ending after December 15, 2008. The Company is currently evaluating the effect that the application of SFAS 158 will have on
its consolidated results of operations and financial condition.
In September 2006, the FASB issued Statement No. 157, “Fair Value Measurements” (“SFAS 157”). SFAS No. 157 defines fair value,
establishes a framework for measuring fair value in generally accepted accounting principles, and expands disclosures about fair value
measurements. SFAS 157 applies under other accounting pronouncements that require or permit fair value measurements. SFAS 157 will
be effective for fiscal years beginning after November 15, 2007, and interim periods within those fiscal years. The Company is currently
evaluating the effect that the application of SFAS 157 will have on our consolidated results of operations and financial condition.
In September 2006, the SEC issued Staff Accounting Bulletin No. 108, “Financial Statements - Considering the Effects of Prior Year
Misstatements when Quantifying Misstatements in Current Year Financial Statements” (“SAB 108”). SAB 108 requires companies to
quantify the impact of all correcting misstatements, including both the carryover and reversing effects of prior year misstatements, on the
current year financial statements. SAB 108 is effective for fiscal years ending after November 15, 2006. The Company does not believe SAB
108 will have a material effect on its financial statements and related disclosures.
In June 2006, the FASB issued Interpretation No. 48, “Accounting for Uncertainty in Income Taxes,” An Interpretation of SFAS No. 109,
(“FIN 48”). FIN 48 clarifies the accounting for uncertainty in income taxes recognized in an enterprise’s financial statements in
accordance with SFAS No. 109, “Accounting for Income Taxes.” FIN 48 also prescribes a recognition threshold and measurement attribute
for the financial statement recognition and measurement of a tax position taken or expected to be taken in a tax return that results in a
tax benefit. Additionally, FIN 48 provides guidance on de-recognition, income statement classification of interest and penalties,
accounting in interim periods, disclosure, and transition. This interpretation is effective for fiscal years beginning after December 15,
2006. The Company is currently evaluating the effect that the application of FIN 48 will have on our consolidated results of operations
and financial condition.
In February 2006, the FASB issued Statement No. 155, “Accounting for Certain Hybrid Financial Instruments,” an amendment of FASB
Statement No. 133 and 140 (“SFAS 155”), which permits fair value measurement for any hybrid financial instrument that contains an
embedded derivative that otherwise would require bifurcation, with changes in fair value recognized in earnings. The fair-value election
will eliminate the need to separately recognize certain derivatives embedded in hybrid financial instruments under FASB Statement No.
133, “Accounting for Derivative Instruments and Hedging Activities.” The Company is currently evaluating the effect of SFAS 155, which
is effective for all financial instruments acquired or issued after the beginning of the first fiscal year that begins after September 15, 2006.
USE OF ESTIMATESS
The preparation of financial statements in conformity with U.S. generally accepted accounting principles requires management to make
estimates and assumptions that affect the reported amounts of assets and liabilities and disclosure of contingent assets and liabilities at
the dates of the financial statements, and the reported amounts of revenue and expenses during the reporting period. Actual results could
differ from those estimates.
NOTE 3 – ACQUISITIONS
CRAMER
On August 14, 2006, the Company acquired all of the capital stock of Cramer Systems Group Limited, or Cramer, a privately-held leading
provider of operations support systems (OSS) solutions. The Company expects that this acquisition will enable it to leverage and greatly
enhance its current assets in the BSS (business support systems) and OSS market.
The aggregate purchase price for Cramer was $417,228, which consisted of $410,551 in cash (including cash on hand), $2,228 related to
the assumption of stock options and restricted shares held by Cramer employees and $4,449 of transaction costs. The purchase price is

56 Amdocs Limited Notes to the Consolidated Financial Statements (continued)(dol lar and share amounts in thousands, except per share data)
subject to post closing adjustments which the Company expects will not be material. The fair value of the stock options was estimated
using the Black-Scholes option pricing model and the fair value of the restricted shares was valued based on the market value of the
underlying shares at the date of grant (see note 17). The acquisition was accounted for as a business combination using the purchase
method of accounting, as required by SFAS No. 141. The fair market value of Cramer assets and liabilities has been included in the
Company’s consolidated balance sheet and the results of Cramer’s operations have been included in the Company’s consolidated
statements of income, commencing on August 15, 2006. The Company obtained a preliminary independent valuation of the intangible
assets acquired in the Cramer transaction. The total purchase price was allocated to Cramer’s assets and liabilities, including identifiable
intangibles, based on their respective estimated fair values, on the date the transaction was consummated. The value of acquired
technology included both existing technology and in-process research and development. The valuation of these items was determined by
applying the income forecast method, which considered the present value of cash flows by product lines. Of the $177,203 of acquired
identifiable intangible assets, $17,310 was assigned to in-process research and development related to the next two major releases of
Cramer’s current technology, of which one was launched during the first quarter of fiscal 2007. The in-process research and development
was written-off as of the closing date of the acquisition, in accordance with Financial Accounting Standards Board Interpretation No. 4,
“Applicability of FASB Statement No. 2 to Business Combinations Accounted for by the Purchase Method.” The in-process research and
development had no alternative future use and had not reached technological feasibility as of the closing date of the acquisition. The fair
value assigned to core technology was $88,690 and is being amortized over five years commencing on August 15, 2006. The fair value
assigned to customer arrangements was $69,043 and is being amortized over seven years commencing on August 15, 2006 based on pro-
rata amounts of the future discounted cash flows. The fair value assigned to trademark was $2,160 and is being amortized over two years
commencing on August 15, 2006. The excess of the purchase price over the fair value of the net assets and identifiable intangibles acquired,
or goodwill, was $249,464 of which none is tax deductible.
The following is the allocation of the purchase price:
Assets acquired $ 93,050
Liabilities assumed (70,673)
Net assets acquired 22,377
Core technology 88,690
Customer arrangements 69,043
Trademark 2,160
In-process research and development 17,310
Deferred taxes resulting from the difference between the assigned value of certain assets
and their respective tax bases and loss carry forward, net (31,816)
Goodwill 249,464
$ 417,228
QPASS
On May 31, 2006, the Company acquired all of the capital stock of Qpass Inc., or Qpass, a leading provider of digital commerce software
and solutions. The Company expects that this acquisition will allow it to support service providers and media companies seeking to
launch and monetize digital content, and believes that this acquisition positions it as the leader in the emerging digital content market.
The aggregate purchase price for Qpass was $281,829, which consisted of $274,024 in cash, $2,405 related to the assumption of stock
options held by Qpass employees and $5,400 of transaction costs. The fair value of the stock options was estimated using the Black-Scholes
option pricing model (see note 17). The acquisition was accounted for as a business combination using the purchase method of
accounting, as required by SFAS No. 141. The fair market value of Qpass assets and liabilities has been included in the Company’s
consolidated balance sheet and the results of Qpass’s operations have been included in the Company’s consolidated statements of income,
commencing on June 1, 2006. The Company obtained a preliminary independent valuation of the intangible assets acquired in the Qpass
transaction. The total purchase price was allocated to Qpass’s assets and liabilities, including identifiable intangibles, based on their
respective estimated fair values, on the date the transaction was consummated. The value of acquired technology included both existing
technology and in-process research and development. The valuation of these items was determined by applying the income forecast

2006 Annual Report 57Notes to the Consolidated Financial Statements (continued)(dol lar and share amounts in thousands, except per share data)
method, which considered the present value of cash flows by product lines. Of the $72,981 of acquired identifiable intangible assets, $8,340
was assigned to in-process research and development and was written-off as of the closing date of the acquisition, in accordance with
Financial Accounting Standards Board Interpretation No. 4. The in-process research and development had no alternative future use and
had not reached technological feasibility as of the closing date of the acquisition. The fair value assigned to core technology was $28,060
and is being amortized over three to 4.5 years commencing on June 1, 2006. The fair value assigned to customer arrangements was $36,581
and is being amortized over seven years commencing on June 1, 2006. The excess of the purchase price over the fair value of the net
liabilities and identifiable intangibles acquired, or goodwill, was $238,455, of which none is tax deductible.
The following is the allocation of the purchase price:
Assets acquired $ 25,801
Liabilities assumed (54,824)
Net liabilities assumed (29,023)
Core technology 28,060
Customer arrangements 36,581
In-process research and development 8,340
Deferred taxes resulting from the difference between the assigned value of certain assets
and liabilities and their respective tax bases and loss carry forward, net (584)
Goodwill 238,455
$ 281,829
LONGSHINE
On August 3, 2005, the Company acquired Longshine Information Technology Company Ltd., or Longshine, a privately-held leading
vendor of customer care and billing software in China. This acquisition enables the Company to offer its products and services to Chinese
service providers and the Company believes it will allow the Company to expand its presence in this fast growing market. The purchase
price for Longshine was approximately $41,696, which included $8,851 of additional purchase price as a result of the achievements of
specified performance targets at the end of the first year from acquisition, and $1,312 of transaction costs. The Company may also be
obligated to pay up to approximately $8,000, in additional purchase price, over the next year based on the achievement of specified
performance targets. The fair market value of Longshine assets and liabilities has been included in the Company’s consolidated balance
sheet and the results of Longshine operations have been included in the Company’s consolidated statement of income, commencing on
August 3, 2005. The Company obtained an independent valuation of the intangible assets acquired in the Longshine transaction. The total
purchase price was allocated to Longshine’s assets and liabilities, including identifiable intangibles, based on their respective estimated fair
values, on the date the transaction was consummated. The excess of the purchase price over the fair value of the net liabilities and
identifiable intangibles acquired, or goodwill, was $45,305. During fiscal 2006, within the one year allocation period the Company revised
the allocation of the purchase price as it obtained more information required to measure the fair value of the assets and liabilities acquired
and as a result of the additional purchase price of $8,851, as mentioned above. The revised purchase price allocation resulted in an increase
of $4,033 in goodwill.
The following is the final allocation of the purchase price:
Net liabilities assumed $ (11,109)
Core technology 1,000
Customer arrangements 6,500
Goodwill 45,305
$ 41,696

58 Amdocs Limited Notes to the Consolidated Financial Statements (continued)(dol lar and share amounts in thousands, except per share data)
DST INNOVIS
On July 1, 2005, the Company acquired from DST Systems, Inc., or DST, all of the common stock of DST’s wholly owned subsidiaries,
DST Innovis, Inc. and DST Interactive, Inc. The Company refers to these acquired subsidiaries together as DST Innovis, a leading provider
of customer care and billing solutions to broadband media cable and satellite companies, which the Company refers to as the Broadband
Industry. The Company believes that this acquisition has positioned the Company to offer a comprehensive set of solutions to companies
in the Broadband Industry as they transition to ICM.
The purchase price for DST Innovis was approximately $237,461, which included $3,150 of transaction costs. The acquisition was
accounted for as a business combination using the purchase method of accounting, as required by SFAS No. 141. The fair market value
of DST Innovis’s assets and liabilities has been included in the Company’s consolidated balance sheet and the results of DST Innovis’s
operations are included in the Company’s consolidated statements of income, commencing on July 1, 2005. The Company obtained an
independent valuation of the intangible assets acquired in the DST Innovis transaction. The total purchase price was allocated to DST
Innovis’s assets and liabilities, including identifiable intangibles, based on their respective estimated fair values, on the date the transaction
was consummated. The value of acquired technology included both existing technology and in-process research and development. The
valuation of these items was made by applying the income forecast method, which considered the present value of cash flows by product
lines. Of the $125,642 of acquired identifiable intangible assets, $2,760 was assigned to in-process research and development and was
written-off as of the closing date of the acquisition, in accordance with FASB Interpretation No. 4, “Applicability of FASB Statement No.
2 to Business Combinations Accounted for by the Purchase Method.” The fair value assigned to core technology was $63,180 and is
amortized over three to 4.5 years commencing on July 1, 2005. The fair value assigned to customer arrangements was $59,702 and is
amortized over 15 years commencing on July 1, 2005. The excess of the purchase price over the fair value of the net assets and identifiable
intangibles acquired, or goodwill, was $130,120, of which $101,312 is tax deductible. During fiscal 2006, within the one year allocation
period the Company revised the allocation of the purchase price as it obtained more information and changed its estimations relating to
the printing and mailing obligation and to other assets and liabilities acquired. The revised purchase price allocation resulted in a decrease
of $1,266 in goodwill.
In connection with the DST acquisition, the Company signed a long-term agreement with DST, pursuant to which DST will continue to
support the printing and mailing of bills for the DST Innovis customer base. Under the terms of that agreement, DST will be a preferred
vendor of billing, printing, and mailing for projects that combine those services with billing support for additional Amdocs customers in
the United States. The Company recorded a liability of $25,777 resulting from this agreement. This liability will be amortized over the life
of the agreement.
In addition, the Company commenced integration activities based on a plan to exit specific research and development activities and to
terminate employees associated with these activities. In accordance with EITF 95-3, “Recognition of Liabilities in connection with a
Purchase Business Combination,” The liability associated with this plan, which was recorded as part of the purchase accounting, is
presented in the following table:
EmployeeSeparation Contractual
Costs obligations Other Total
Balance as of October 1, 2005 $ 4,940 $ 7,103 $ 673 $ 12,716
Cash payments (4,681) (219) (418) (5,318)
Adjustments (1) (247) (9) (155) (411)
Balance as of September 30, 2006 $ 12 $ 6,875 $ 100 $ 6,987
(1) Reflects adjustments due to changes in original estimates within the one year allocation period. The adjustments were recordedas part of the purchase accounting which resulted in reduction of goodwill.

2006 Annual Report 59Notes to the Consolidated Financial Statements (continued)(dol lar and share amounts in thousands, except per share data)
The following is the final allocation of the purchase price and deferred tax assets:
Net assets acquired $ 7,388
Core technology 63,180
Customer arrangements 59,702
In-process research and development 2,760
EITF 95-3 and other liabilities (17,059)
Printing and mailing obligation (25,777)
Deferred taxes resulting from the difference between the assigned
value of certain assets and liabilities and their respective tax bases 17,147
Goodwill 130,120
$ 237,461
Pro forma financial information
Set forth below are the unaudited pro forma revenue, operating income, net income and per share figures for the years ended September
30, 2006, 2005 and 2004, as if DST Innovis had been acquired as of October 1, 2003, and as if Cramer had been acquired as of October 1,
2004, excluding the capitalization of research and development expense, write-off of purchased in-process research and development and
other acquisition related costs:
Year ended September 30,
2 0 0 6 2005 2004
Revenue $2,575,703 $2,290,361 $2,013,612
Operating income 321,333 314,173 292,137
Net income 297,746 259,412 229,179
Basic earnings per share 1.47 1.29 1.10
Diluted earnings per share 1.38 1.21 1.05
Pro forma information regarding the Company’s consolidated statements of income for the years ended September 30, 2006, 2005 and
2004 to reflect the Longshine and Qpass acquisitions is not presented, as these acquisitions are not considered material business
combinations.
NOTE 4 – SHORT-TERM INTEREST-BEARING INVESTMENTS
Short-term interest-bearing investments consist of the following:
Amortized Cost Market ValueAs of September 30, As of September 30,
2 0 0 6 2005 2 0 0 6 2005
Federal agencies $ 45,928 $ 87,116 $ 46,202 $ 86,591
U.S. government treasuries 11,815 70,644 11,940 70,187
Corporate backed obligations 131,129 157,834 130,921 157,059
Corporate bonds 47,892 50,401 47,776 50,218
Mortgages (including government and corporate) 81,656 47,852 81,559 47,622
Commercial paper/CD 39,458 4,056 39,458 4,056
Private placement 14,397 22,344 14,338 22,278
372,275 440,247 372,194 438,011
Allowance for unrealized loss (81) (2,236) — —
Total $ 372,194 $ 438,011 $ 372,194 $ 438,011

60 Amdocs Limited Notes to the Consolidated Financial Statements (continued)(dol lar and share amounts in thousands, except per share data)
As of September 30, 2006, short-term interest-bearing investments had the following maturity dates:
Market Value
2007 $ 57,713
2008 36,022
2009 92,904
2010 30,227
Thereafter 155,328
rec net $ 372,194
NOTE 5 – ACCOUNTS RECEIVABLE, NET
Accounts receivable, net consists of the following:
As of September 30,
2006 2005
Accounts receivable – billed $ 383,763 $ 282,151
Accounts receivable – unbilled 54,117 28,994
Less – allowances (12,075) (6,908)
Accounts receivable, net $ 425,805 $ 304,237
NOTE 6 – EQUIPMENT, VEHICLES AND LEASEHOLD IMPROVEMENTS, NET
Components of equipment, vehicles and leasehold improvements, net are:
As of September 30,
2 0 0 6 2005
Computer equipment $ 474,794 $ 406,705
Vehicles furnished to employees 11,642 24,493
Leasehold improvements 93,397 68,882
Furniture and fixtures 45,281 43,076
625,114 543,156
Less accumulated depreciation 404,824 361,344
$ 220,290 $ 181,812
Total depreciation expense on equipment, vehicles and leasehold improvements for fiscal years 2006, 2005 and 2004, was $75,964, $74,193
and $73,619, respectively.

NOTE 7 – GOODWILL AND INTANGIBLE ASSETS, NET
The following table presents details of the Company’s total goodwill:
As of October 1, 2004 $ 806,874
Decrease in goodwill as a result of a purchase price allocation adjustment (related to fiscal 2003 acquisition) (9,893)
Goodwill resulted from DST Innovis acquisition (see Note 3) 131,386
Goodwill resulted from Longshine acquisition (see Note 3) 41,272
As of September 30, 2005 969,639
Goodwill resulted from Cramer aquisition (see Note 3) 249,464
Goodwill resulted from Qpass acquisition (see Note 3) 238,455
Decrease in DST goodwill as a result of a purchase price allocation adjustment (see Note 3) (1,266)
Increase in Longshine goodwill as a result of a purchase price allocation adjustment (see Note 3) 4,033
Other (1) 1,281
As of September 30, 2006 $1,461,606
(1) Represent goodwill related to immaterial acquisition.
The following table presents details of amortization expense of purchased intangible assets as reported in the consolidated statements of
income.
Year ended September 30,
2 0 0 6 2005 2004
Cost of license $ 2,620 $ 2,620 $ 3,878
Cost of service — — 2,785
Amortization of purchased intangible assets 37,610 15,356 17,909
Total $ 40,230 $ 17,976 $ 24,572
The Company performs an annual impairment test during the fourth quarter of each fiscal year, or more frequently if impairment
indicators are present. The Company operates in one operating segment, and this segment comprises its only reporting unit. In calculating
the fair value of the reporting unit, the Company used a discounted cash flow methodology. There was no impairment of goodwill upon
adoption of SFAS No. 142 and there was no impairment at the annual impairment test dates.
The following table presents details of the Company’s total purchased intangible assets:
Estimateduseful life Accumulated
(in years) Gross Amortization Net
s e p t e m b e r 3 0 , 2 0 0 6
Core technology 3-5 $ 235,946 $ (78,560) $ 157,386
Customer arrangements 7-15 248,155 (62,251) 185,904
Intellectual property rights and purchased computer software 3-10 51,996 (49,595) 2,401
Trademark 2 2,160 (135) 2,025
Total $ 538,257 $ (190,541) $ 347,716
s e p t e m b e r 3 0 , 2 0 0 5
Core technology 2-4.5 $ 117,925 $ (53,699) $ 64,226
Customer arrangements 2-15 140,009 (49,637) 90,372
Intellectual property rights and purchased computer software 3-10 51,996 (46,975) 5,021
Total $ 309,930 $ (150,311) $ 159,619
2006 Annual Report 61Notes to the Consolidated Financial Statements (continued)(dol lar and share amounts in thousands, except per share data)

62 Amdocs Limited Notes to the Consolidated Financial Statements (continued)(dol lar and share amounts in thousands, except per share data)
The estimated future amortization expense of purchased intangible assets as of September 30, 2006 is as follows:
Fiscal year: Amount
2007 $ 70,813
2008 73,221
2009 63,628
2010 52,549
2011 34,545
Thereafter 52,960
Total $ 347,716
NOTE 8 – OTHER NONCURRENT ASSETS
Other noncurrent assets consist of the following:
As of September 30,
2 0 0 6 2005
Funded employee benefit costs (1) $ 70,669 $ 59,086
Managed services deferred costs (2) 63,352 54,314
Prepaid maintenance and other 8,262 10,900
Rent and other deposits 10,599 8,908
Other 7,938 10,231
$ 160,820 $ 143,439
(1) See Note 15.
(2) See Note 2.
NOTE 9 – INCOME TAXES
The provision for income taxes consists of the following:
Year ended September 30,
2 0 0 6 2005 2004
Current $ 42,290 $ 64,038 $ 72,588
Deferred 12,947 8,121 (6,345)
$ 55,237 $ 72,159 $ 66,243
All income taxes are from continuing operations reported by the Company in the applicable taxing jurisdiction. Income taxes also include
anticipated withholding taxes due on subsidiaries’ earnings when paid as dividends to the Company.

2006 Annual Report 63Notes to the Consolidated Financial Statements (continued)(dol lar and share amounts in thousands, except per share data)
Deferred income taxes are comprised of the following components:
As of September 30,
2 0 0 6 2005
Deferred tax assets:
Deferred revenue $ 29,369 $ 38,041
Accrued employee costs 53,851 42,343
Equipment, vehicles and leasehold improvements, net 18,842 45,752
Intangible assets, computer software and intellectual property 17,221 14,257
Net operating loss carry forwards 97,813 35,924
Other 58,102 43,324
Valuation allowances (29,335) (14,302)
Total deferred tax assets 245,863 205,339
Deferred tax liabilities:
Anticipated withholdings on subsidiaries’ earnings (47,004) (43,909)
Equipment, vehicles and leasehold improvements, net (3,992) (7,262)
Intangible assets, computer software and intellectual property (108,171) (32,683)
Managed services costs (14,580) (10,110)
Other (12,025) (5,514)
Total deferred tax liabilities (185,772) (99,478)
Net deferred tax assets $ 60,091 $ 105,861
The effective income tax rate varied from the statutory Guernsey tax rate as follows:
Year ended September 30,
2 0 0 6 2005 2004
Statutory Guernsey tax rate 20% 20% 20%
Guernsey tax-exempt status (20) (20) (20)
Foreign taxes 16 19 20
Valuation allowance 1 1 2
Income tax rate before effect of acquisition-related costs,
and equity-based compensation expense 17 20 22
Effect of acquisition-related costs and equity-based
compensation expense (2) — —
15% 20% 22%
As a Guernsey company with tax-exempt status, the Company’s overall effective tax rate is attributable solely to foreign taxes.
During fiscal 2006, the Company recognized deferred tax assets of $15,033 derived from net capital and operating loss carry forwards
related to certain of its subsidiaries. The expiration period of $7,451 of these losses carry forwards is up to 20 years, the rest of the losses
expiration is unlimited. Given the uncertainty of the realization of these assets through future taxable earnings, an additional valuation
allowance of $15,033 was recorded during fiscal 2006, out of which $11,393 was recorded in connection with the Cramer and Qpass
acquisitions.
During fiscal 2005, the Company recognized deferred tax assets of $2,878 derived from operating loss carry forwards related to one of its
subsidiaries. During fiscal 2004, the Company recognized deferred tax assets of $11,424 derived from net capital and operating loss carry
forwards related to certain of its subsidiaries. The expiration of these losses carry forwards is unlimited. Given the uncertainty of the
realization of these assets through future taxable earnings, additional valuation allowances of $2,878 and $11,424 was recorded during
fiscal 2005 and 2004, respectively.

64 Amdocs Limited Notes to the Consolidated Financial Statements (continued)(dol lar and share amounts in thousands, except per share data)
NOTE 10 – FINANCING ARRANGEMENTS
The Company’s financing transactions are described below:
As of September 30, 2006, the Company had available short-term general revolving lines of credit totaling $30,936. As of September 30,
2006, no amounts were outstanding under these credit lines. The cost of maintaining these revolving lines of credit was insignificant.
As of September 30, 2006, the Company had outstanding letters of credit and bank guarantees of $8,671. These were mostly supported by
a combination of the credit facilities and restricted cash balances that the Company maintains with various banks.
In addition, as of September 30, 2006, the Company had outstanding short term loans of $1,733, which is secured by certain pledges and
guarantees and $175 related to another debt instrument.
NOTE 11 – CONVERTIBLE NOTES
In March 2004, the Company issued $450,000 aggregate principal amount of 0.50% Convertible Senior Notes due 2024 (the “0.50%
Notes”) through a private placement to qualified institutional buyers pursuant to Rule 144A under the Securities Act. The Company is
obligated to pay interest on the 0.50% Notes semi-annually on March 15 and September 15 of each year. The 0.50% Notes are senior
unsecured obligations of the Company and rank equal in right of payment with all existing and future senior unsecured indebtedness of
the Company. The 0.50% Notes are convertible, at the option of the holders at any time before the maturity date, into Ordinary Shares of
the Company at a conversion rate of 23.1911 shares per one thousand dollars principal amount, representing a conversion price of
approximately $43.12 per share, as follows: (i) during any fiscal quarter commencing after March 31, 2004, and only during that quarter
if the closing sale price of the Company’s Ordinary Shares exceeds 130% of the conversion price for at least 20 trading days in the 30
consecutive trading days ending on the last trading day of the proceeding fiscal quarter (initially 130% of $43.12, or $56.06); (ii) upon the
occurrence of specified credit rating events with respect to the notes; (iii) subject to certain exceptions, during the five business day period
after any five consecutive trading day period in which the trading price per note for each day of that measurement period was less than
98% of the product of the closing sale price of the Company’s Ordinary Shares and the conversion rate; provided, however, holders may
not convert their notes (in reliance on this subsection) if on any trading day during such measurement period the closing sale price of the
Company’s Ordinary Shares was between 100% and 130% of the then current conversion price of the notes (initially, between $43.12 and
$56.06); (iv) if the notes have been called for redemption, or (v) upon the occurrence of specified corporate events.
The 0.50% Notes are subject to redemption at any time on or after March 20, 2009, in whole or in part, at the option of the Company, at
a redemption price of 100% of the principal amount plus accrued and unpaid interest, if any, on such redemption date. The 0.50% Notes
are subject to repurchase, at the holders’ option, on March 15, 2009, 2014 and 2019, at a repurchase price equal to 100% of the principal
amount plus accrued and unpaid interest, if any, on such repurchase date (“Put Rights”). The Company may choose to pay the repurchase
price in cash, Ordinary Shares or a combination of cash and Ordinary Shares.
The FASB issued an exposure draft that would amend SFAS No. 128 to require that if a convertible financial instrument has an option to
settle a required redemption in cash or shares, the assumption is the option would be settled in shares and therefore the “if converted”
method should be applied based on the current share price and not according to the conversion price (the current accounting guidelines)
when computing diluted earnings per share. The Board of Directors has authorized the Company to amend the 0.50% Notes by waiving
its right to a share settlement upon exercise of Put Rights and committing to a cash settlement. If the Company amends the 0.50% Notes
as authorized by its Board of Directors, then the expected new accounting rule would have no impact on the Company’s consolidated
financial results.

2006 Annual Report 65Notes to the Consolidated Financial Statements (continued)(dol lar and share amounts in thousands, except per share data)
NOTE 12 – NONCURRENT LIABILITIES AND OTHER
Noncurrent liabilities and other consist of the following:
As of September 30,
2 0 0 6 2005
Accrued employees costs (1) $ 111,909 $ 88,353
Noncurrent customer advances 28,936 34,994
Accrued pension liability 24,476 23,193
Accrued print and mail obligation 14,424 17,806
Accrued lease obligations 8,514 12,475
Other 9,378 9,449
$ 197,637 $ 186,270
(1) Primarily severance pay liability in accordance with Israeli law (see note 15)
NOTE 13 – INTEREST INCOME AND OTHER, NET
Interest income and other, net consists of the following:
Year ended September 30,
2 0 0 6 2005 2004
Interest income $ 50,962 $ 32,341 $ 17,941
Interest expense (5,433) (5,734) (12,867)
Other, net (3,788) (4,304) (171)
$ 41,741 $ 22,303 $ 4,903
NOTE 14 – CONTINGENCIES
COMMITMENTS
The Company leases office space under non-cancelable operating leases in various countries in which it does business. Future minimum
non-cancelable lease payments required after October 1, 2006 are as follows:
For the years ended September 30,
2007 $ 60,832
2008 52,967
2009 42,505
2010 37,972
2011 34,298
Thereafter 39,064
$ 267,638
Future minimum non-cancelable lease payments, as stated above, do not reflect committed future sublease income of $8,122, $4,919,
$3,497, $3,278, $4,022 and $5,907 for the years ended September 30, 2007, 2008, 2009, 2010, 2011 and thereafter, respectively. Of the
$237,893 net operating leases, net of $29,745 of sublease income, $5,837 has been included in accrued restructuring charges as of
September 30, 2006.
Rent expense net of sublease income, including accruals for future lease losses, was approximately $41,088, $38,982 and $43,505 for fiscal
2006, 2005 and 2004, respectively.
66 Amdocs Limited Notes to the Consolidated Financial Statements (continued)(dol lar and share amounts in thousands, except per share data)
The Company leases vehicles under operating leases. Future minimum non-cancelable lease payments required after October 1, 2006 are
as follows:
For the years ended September 30,
2007 $ 11,896
2008 8,928
2009 4,657
2010 655
$ 26,136
LEGAL PROCEEDINGS
The Company is involved in various legal proceedings arising in the normal course of its business. Based upon the advice of counsel, the
Company does not believe that the ultimate resolution of these matters will have a material adverse effect on the Company’s consolidated
financial position, results of operations or cash flows.
GUARANTOR’S ACCOUNTING AND DISCLOSURE REQUIREMENTS FOR GUARANTEES
The Company generally sells its products with a limited warranty for a period of 90 days. The Company’s policy is to accrue for warranty
costs, if needed, based on historical trends in product failure. Based on the Company’s experience, only minimal warranty services have
been required and, as a result, the Company did not accrue any amounts for product warranty liability during fiscal years 2006 and 2005.
The Company generally indemnifies its customers against claims of intellectual property infringement made by third parties arising from
the use of the Company’s software. To date, the Company has incurred only minimal costs as a result of such obligations and has not
accrued any liabilities related to such indemnification in its consolidated financial statements
NOTE 15 – EMPLOYEE BENEFITS
The Company accrues severance pay for the employees of its Israeli operations in accordance with Israeli law and certain employment
procedures on the basis of the latest monthly salary paid to these employees and the length of time that they have worked for the Israeli
operations. The severance pay liability, which is included as accrued employee costs in noncurrent liabilities and other, is partially funded
by amounts on deposit with insurance companies, which are included in other noncurrent assets. These severance expenses were
approximately $26,403, $16,720 and $15,363 for fiscal 2006, 2005 and 2004, respectively.
The Company sponsors defined contribution plans covering certain of its employees around the world. The plans provide for Company
matching contributions based upon a percentage of the employees’ voluntary contributions. The Company’s contributions in fiscal 2006,
2005 and 2004 under such plans were not significant compared to total operating expenses.
The Company maintains non-contributory defined benefit plans that provide for pension, other retirement and post employment
benefits for employees of a Canadian subsidiary based on length of service and rate of pay. The measurement date for the pension plan
and for the other benefits was September 30, 2006.

2006 Annual Report 67Notes to the Consolidated Financial Statements (continued)(dol lar and share amounts in thousands, except per share data)
Components of Net Benefit Plans Cost
The net periodic benefit costs for the years ended September 30, related to pension and other benefits were as follows:
Pension Benefits
2 0 0 6 2005 2004
Service costs $ 1,886 $ 2,185 $ 1,967
Interest on benefit obligations 3,345 3,340 2,676
Expected return on plan assets (3,182) (2,739) (2,200)
Settlements 313 — —
$ 2,362 $ 2,786 $ 2,443
Other Benefits
2 0 0 6 2005 2004
Service costs $ 324 $ 265 $ 373
Interest on benefit obligations 507 482 386
$ 831 $ 747 $ 759
Components of Accrued Benefit Liability
The following table sets forth changes in the fair value of plan assets, benefit obligations and the funded status of the plans as of September
30, 2006:
Pension OtherBenefits Benefits
Change in plan assets:
Fair value of plan assets as of October 1, 2005 $ 41,824 $ —
Actual return on plan assets 3,458 —
Foreign exchange gain 1,973 —
Employer contribution 2,889 156
Benefits paid (9,857) (156)
Fair value of plan assets as of September 30, 2006 40,287 —
Change in benefit obligations:
Benefit obligations as of October 1, 2005 (67,305) (11,731)
Service costs (1,886) (324)
Interest on benefit obligations (3,345) (507)
Actuarial gains (losses) 2,289 (774)
Curtailment gains 2,785 2,726
Foreign exchange loss (3,068) (547)
Benefits paid 9,857 156
Benefit obligations as of September 30, 2006 (60,673) (11,001)
Funded status-plan deficit as of September 30, 2006 (20,386) (11,001)
Unrecognized actuarial net losses (5,122) (1,789)
Accrued benefit costs as of September 30, 2006,
included in noncurrent liabilities and other $ (15,264) $ (9,212)
As of September 30, 2006, the accumulated benefit obligation for the pension plan was $54,292, and $10,611 for other benefits.
68 Amdocs Limited Notes to the Consolidated Financial Statements (continued)(dol lar and share amounts in thousands, except per share data)
The following table sets forth the funded status of the plans as of September 30, 2005:
Pension OtherBenefits Benefits
Change in plan assets:
Fair value of plan assets as of October 1, 2004 $ 34,042 $ —
Actual return on plan assets 4,360 —
Foreign exchange gain 2,674 —
Employer contribution 3,300 164
Benefits paid (2,552) (164)
Fair value of plan assets as of September 30, 2005 41,824 —
Change in benefit obligations:
Benefit obligations as of October 1, 2004 (49,751) (7,234)
Service costs (2,185) (265)
Interest on benefit obligations (3,340) (483)
Actuarial losses (10,237) (3,210)
Foreign exchange loss (4,344) (703)
Benefits paid 2,552 164
Benefit obligations as of September 30, 2005 (67,305) (11,731)
Funded status-plan deficit as of September 30, 2005 (25,481) (11,731)
Unrecognized actuarial net losses (10,409) (3,610)
Accrued benefit costs as of September 30, 2005
included in noncurrent liabilities and other $ (15,072) $ (8,121)
As of September 30, 2005, the accumulated benefit obligation for the pension plan was $54,775, and $11,278 for other benefits.
Significant Assumptions
The significant assumptions adopted in measuring the Canadian subsidiary’s accrued benefit obligations and the net periodic benefit cost
were as follows:
2 0 0 6 2005
a s o f s e p t e m b e r 3 0 :
Accrued benefit obligations
Weighted average discount rate, end of year 5.25% 5.50%
Weighted average rate of compensation increase, end of year 3.50 3.50
f o r t h e y e a r e n d e d s e p t e m b e r 3 0 :
Net periodic benefit cost
Weighted average discount rate, end of preceding year 5.50% 6.25%
Weighted average expected long-term rate of return on plan assets, end of preceding year 7.50 7.50
Weighted average rate of compensation increase, end of preceding year 3.50 3.50
The expected future rate of return assumption is based on the target asset allocation policy and the expected future rates of return on
these assets.

2006 Annual Report 69Notes to the Consolidated Financial Statements (continued)(dol lar and share amounts in thousands, except per share data)
For measurement purposes, a 4.5% annual rate of increase in the per capita cost of covered health care benefits (the health care cost trend
rate) was assumed for the year ended September 30, 2006, except for the cost of medication, which was assumed to increase at an annual
rate of 10% for 2006. This rate was assumed to gradually decline to 5% by 2014 and remain stable thereafter.
A 1% change in the assumed health care cost trend rates would have the following effect as of September 30, 2006:
1% increase 1% decrease
Effect on other benefits – total service and interest cost $ 164 $ (135)
Effect on other benefits – accrued benefit obligations 2,189 (1,695)
Pension Plan Assets
The following table sets forth the allocation of the pension plan assets as of September 30, 2006 and 2005, the target allocation for 2007
and the expected long-term rate of return by asset class. The fair value of the plan assets was $40,287 as of September 30, 2006 and $41,824
as of September 30, 2005.
Weighted-Percentage of average
Target plan assets as long-termAllocation of September 30, rate of return
Asset category 2007 2 0 0 6 2005 2006
Equity securities 45%-65% 55% 57% 9.7%
Debt securities 35-55 45 43 4.9
Total 100% 100% 100% 7.5%
Plan assets consist primarily of Canadian and other equities, government and corporate bonds, debentures and secured mortgages, which
are held in units of the BCE Master Trust Fund, a Trust established by Bell Canada. The investment strategy is to maintain an asset
allocation that is diversified between multiple different asset classes, and between multiple managers within each asset class, in order to
minimize the risk of large losses and to maximize the long-term risk-adjusted rate of return.
Projected Cash Flows
The Company is responsible for adequately funding the pension plan. Contributions by the Company are based on various generally
accepted actuarial methods and reflect actuarial assumptions concerning future investment returns, salary projections and future service
benefits. The Company contributed $2,889 to the pension plan in 2006 which was the minimum contribution required by law. Because
the Company does not fund the other employee future benefit plan, the total payments of $156 paid in 2006 represents benefit payments
made to beneficiaries. The following table sets forth the Company’s estimates for future minimum contributions to the pension plan and
for other benefit payments.
Pension OtherFor the years ended September 30, Benefits Benefits
2007 $ 1,700 $ 200
2008 1,400 300
2009 1,500 300
2010 1,500 400
2011 1,500 400
2012 – 2016 8,400 2,300
Total $ 16,000 $ 3,900

70 Amdocs Limited Notes to the Consolidated Financial Statements (continued)(dol lar and share amounts in thousands, except per share data)
NOTE 16 – CAPITAL TRANSACTIONS
On November 5, 2003, the Company announced that its Board of Directors had authorized a share repurchase program of up to 5,000
Ordinary Shares over the next twelve months. The authorization permitted the Company to purchase Ordinary Shares in open market or
privately negotiated transactions and at prices the Company deems appropriate. The Company stated that one of the main purposes of
the repurchase program was to offset the dilutive effect of any future share issuances, including issuances pursuant to employee equity
plans or in connection with acquisitions. During the first quarter of fiscal 2004, the Company repurchased 4,990 Ordinary Shares under
this repurchase program, for an aggregate purchase price of $123,993. In connection with an acquisition by the Company in fiscal 2004,
the Company’s Board of Directors approved the repurchase of additional Ordinary Shares to offset the dilutive effect of share issuances
in the acquisition. The closing of the acquisition occurred in February 2004, and the Company repurchased 484 Ordinary Shares in
February 2004 for an aggregate purchase price of $13,417.
In connection with the Company’s issuance of the 0.50% Notes (see Note 11), the Board of Directors approved the repurchase of Ordinary
Shares sold short by purchasers of the 0.50% Notes in negotiated transactions, concurrently with the sale of the notes, to offset the dilutive
effect of the Ordinary Shares issuable upon conversion of the 0.50% Notes. The closing of the sale of the 0.50% Notes occurred in March
2004, and the Company repurchased 6,074 Ordinary Shares, for an aggregate purchase price of $170,061, out of the 10,436 Ordinary
Shares issuable upon conversion of the 0.50% Notes, based on a conversion rate of 23.1911 shares per $1,000 principal amount.
On July 28, 2004, the Company announced that its Board of Directors extended the share repurchase program for the additional
repurchase of up to $100,000 of its Ordinary Shares in open market or privately negotiated transactions and at times and prices the
Company deems appropriate. In accordance with this extension, the Company repurchased 4,894 Ordinary Shares, at an average price of
$20.40 per share.
On December 20, 2004, the Company announced that its Board of Directors had extended the Company’s share repurchase program for
the additional repurchase of up to $100,000 of its Ordinary Shares in the open market or privately negotiated transactions and at times
and prices the Company deems appropriate. In accordance with this extension, the Company repurchased in the third quarter of fiscal
2005, 3,525 Ordinary Shares, at an average price of $28.33 per share.
The Company funded these repurchases, and intends to fund any future repurchases, with available funds.
NOTE 17 – STOCK OPTION AND INCENTIVE PLAN
In January 1998, the Company adopted the 1998 Stock Option and Incentive Plan (the “Plan”), which provides for the grant of restricted
stock awards, stock options and other equity-based awards to employees, officers, directors, and consultants. The purpose of the Plan is
to enable the Company to attract and retain qualified personnel and to motivate such persons by providing them with an equity
participation in the Company. Since its adoption, the Plan has been amended on several occasions to, among other things, increase the
number of Ordinary Shares issuable under the Plan. In January 2006, the maximum number of Ordinary Shares authorized to be granted
under the Plan was increased from 38,300 to 46,300. Awards granted under the Plan generally vest over a period of four years and stock
options have a term of ten years. In the fourth quarter of fiscal 2005, the Company commenced routinely granting restricted shares and
the Company’s equity-based grant package may be comprised of restricted stock awards and a fewer number of stock options. As of
September 30, 2006, 11,247.8 Ordinary Shares remained available for grant pursuant to the Plan.

2006 Annual Report 71Notes to the Consolidated Financial Statements (continued)(dol lar and share amounts in thousands, except per share data)
The following table summarizes information about stock options to purchase the Company’s Ordinary Shares, as well as changes during
the years ended September 30, 2006, 2005 and 2004:
WeightedNumber Averageof Share Exercise Options Price
Outstanding as of October 1, 2003 25,565.7 $ 27.04
Granted 4,177.2 22.07
Exercised (1,156.5) 10.44
Forfeited (2,539.9) 30.89
Outstanding as of September 30, 2004 26,046.5 26.61
Granted 4,892.0 24.36
Exercised (2,228.7) 10.78
Forfeited (2,902.4) 32.32
Outstanding as of September 30, 2005 25,807.4 26.91
Granted (1) 4,812.1 29.41
Exercised (5,869.5) 18.24
Forfeited (1,956.0) 34.42
Outstanding as of September 30, 2006 22,794.0 $ 29.02
Exercisable on September 30, 2006 12,609.7 $ 32.14
(1) Includes options to purchase 297.6 Ordinary Shares assumed in connection with the Company’s acquisition of Qpass at weighted average exercise price of $8.01, and options to purchase 161.0 Ordinary Shares assumed in connection with the Company’s acquisition of Cramer at weighted average exercise price of $6.50.
The following table summarizes information relating to awards of restricted shares, as well as changes to such awards during fiscal 2006:
WeightedAverage
Number Grant Date of Shares Fair Value
Outstanding as of October 1, 2005 133.8 $ 26.43
Granted (1) 747.4 31.96
Vested (94.9) 26.43
Forfeited (6.0) 32.12
Outstanding as of September 30, 2006 780.3 31.68
(1) Includes 156.8 restricted shares assumed in connection with the Company’s acquisition of Cramer at weighted average grantdate fair value of $40.7.
The total intrinsic value of options exercised and the value of restricted shares vested during fiscal 2006 was $92,583 and $2,777,
respectively. The aggregate intrinsic value of outstanding and exercisable stock options as of September 30, 2006 was $290,758 and
$143,677, respectively.
As of September 30, 2006, there was $63,545 of unrecognized compensation expense related to nonvested stock options and nonvested
restricted stock awards. The Company recognizes compensation costs using the graded vesting attribution method which results in a
weighted average period of approximately one year over which the unrecognized compensation expense is expected to be recognized.
$

72 Amdocs Limited Notes to the Consolidated Financial Statements (continued)(dol lar and share amounts in thousands, except per share data)
The following table summarizes information about stock options outstanding as of September 30, 2006:
Outstanding Exercisable
Weighted average Weighted Weighted
remaining average averageExercise Number contractual exercise Number exercise
price outstanding life (in years) price exercisable price
0.38 – 4.76 334.6 5.25 $ 2.51 166.7 $ 1.99
6.40 – 18.60 3,431.1 5.94 10.99 2,090.8 10.74
19.78 – 22.75 3,630.1 7.68 22.02 946.7 21.99
23.43 – 26.68 3,013.7 6.41 25.21 1,453.6 24.31
27.30 – 29.91 2,577.3 8.29 27.95 623.3 28.45
31.01 – 32.15 4,001.4 6.29 31.30 2,961.9 31.01
32.95 – 40.80 2,543.8 7.27 35.79 1,104.7 34.43
43.05 – 65.01 2,899.9 4.19 52.87 2,899.9 52.87
66.50 – 78.31 362.1 3.81 70.15 362.1 70.15
The fair value of options granted was estimated on the date of grant using the Black-Scholes pricing model with the assumptions noted
in the following table (all in weighted averages for options granted during the year):
Year ended September 30,
2 0 0 6 2005 2004
Risk-free interest rate (1) 4.56% 3.42% 3.12%
Expected life of stock options (2) 4.37 4.47 4.49
Expected volatility (3) 34.9% 63.0% 68.7%
Expected dividend yield (4) None None None
Fair value per option (5) $13.36 $12.75 $12.62
(1) Risk-free interest rate is based upon U.S. Treasury yield curve appropriate for the term of the Company’s employee stock options.
(2) Expected life of stock options is based upon historical experience.
(3) Expected volatility for fiscal 2006 is based on blended volatility. For fiscal years 2005 and 2004, expected volatility is basedon the Company’s historical stock price.
(4) Expected dividend yield is based on the Company’s history and future expectation of dividend payouts.
(5) Fiscal 2006 includes fair value of options assumed in connection with the Company’s acquisitions of Qpass and Cramer (seenote 3). Fiscal 2006 fair value excluding Qpass and Cramer assumed options is $11.34.
The following table sets forth the pro forma effect of applying SFAS No. 123 on net income and earnings per share for the presented periods:
Year ended September 30,
2 0 0 5 2004
Net income as reported $ 288,636 $ 234,860
Add: Equity-based compensation expense included in net income, net of related tax effects 632 453
Less: Total equity-based compensation expenses determined under fair value method
for all awards, net of related tax effects (35,666) (35,989)
Pro forma net income $ 253,602 $ 199,324
Basic earnings per share:
As reported $ 1.44 $ 1.13
Pro forma $ 1.26 $ 0.95
Dilluted earnings per share:
As reported $ 1.35 $ 1.08
Pro forma $ 1.19 $ 0.92
$

2006 Annual Report 73Notes to the Consolidated Financial Statements (continued)(dol lar and share amounts in thousands, except per share data)
NOTE 18 – EARNINGS PER SHARE
The following table sets forth the computation of basic and diluted earnings per share:
Year ended September 30,
2 0 0 6 2005 2004
Numerator:
Numerator for basic earnings per share $ 318,636 $ 288,636 $ 234,860
Effect of assumed conversion of 0.50% convertible notes 3,948 3,939 2,296
Numerator for diluted earnings per share $ 322,584 $ 292,575 $ 237,156
Denominator:
Denominator for basic earnings per share –
weighted average number of shares outstanding 203,194 201,023 208,726
Restricted stock 141 25 —
Effect of assumed conversion of 0.50% convertible notes 10,436 10,436 6,088
Effect of dilutive stock options granted 4,763 5,678 5,471
Denominator for dilutive earnings per share –
adjusted weighted average shares and assumed conversions 218,534 217,162 220,285
Basic earnings per share $ 1.57 $ 1.44 $ 1.13
Diluted earnings per share $ 1.48 $ 1.35 $ 1.08
The effect of the 0.50% Notes issued by the Company in March 2004 on diluted earnings per share was included in the above calculation
See Note 2.
The weighted average effect of the repurchase of Ordinary Shares by the Company has been included in the calculation of basic earnings
per share.
NOTE 19 – SEGMENT INFORMATION AND SALES TO SIGNIFICANT CUSTOMERS
The Company and its subsidiaries operate in one operating segment, providing business and operations support systems and related
services primarily for the communications industry.
GEOGRAPHIC INFORMATION
The following is a summary of revenue and long-lived assets by geographic area. Revenue is attributed to geographic region based on the
location of the customers.
Year ended September 30,
2 0 0 6 2005 2004
r e v e n u e
United States $1,319,261 $ 985,811 $ 824,931
Canada 406,941 404,212 333,898
Europe 539,784 488,193 480,177
Rest of the world 214,064 160,405 134,726
Total $2,480,050 $2,038,621 $1,773,732

74 Amdocs Limited Notes to the Consolidated Financial Statements (continued)(dol lar and share amounts in thousands, except per share data)
As of September 30,
2 0 0 6 2005 2004
l o n g - l i v e d a s s e t s
United States (1) $ 889,879 $ 588,448 $ 340,090
Canada (2) 637,328 655,014 668,806
Europe (3) 447,106 18,187 18,979
Rest of the world 145,450 133,774 79,838
Total $2,119,763 $1,395,423 $1,107,713
(1) Primarily goodwill, intangible assets and computer software and hardware.
(2) Primarily goodwill.
(3) Primarily goodwill and intangible assets as of September 30, 2006.
REVENUE AND CUSTOMER INFORMATION
Integrated Customer Management Enabling Systems, or ICM Enabling Systems includes the following offerings: revenue management
(including billing, mediation and partner settlement), customer management (including ordering, customer relationship management,
or CRM and self-service), service and resource management (including fulfillment, activation, inventory management, network planning
and customer assurance) and digital commerce management (including content revenue management). Directory includes directory
sales and publishing systems for publishers of both traditional printed yellow pages and white pages directories and electronic Internet
directories.
Year ended September 30,
2 0 0 6 2005 2004
ICM Enabling Systems $2,201,245 $1,776,536 $1,536,993
Directory 278,805 262,085 236,739
Total $2,480,050 $2,038,621 $1,773,732
SALES TO SIGNIFICANT CUSTOMERS
The following table summarizes the percentage of sales to significant customers groups (when they exceed 10 percent of total revenue for
the year).
Year ended September 30,
2 0 0 6 2005 (1) 2004 (1)
Customer 1 14% 17% 18%
Customer 2 13 15 17
Customer 3 11 10 (*)
Customer 4 10 (*) (*)
(*) Less than 10 percent of total revenue
(1) The percentage of sales to significant customers groups for fiscal years 2005 and 2004 were restated to reflect customerconsolidation.

2006 Annual Report 75Notes to the Consolidated Financial Statements (continued)(dol lar and share amounts in thousands, except per share data)
NOTE 20 – OPERATIONAL EFFICIENCY AND COST REDUCTION PROGRAMS
In accordance with SFAS No. 112 “Employers’ Accounting for Post Employment Benefits” (SFAS 112) and SFAS No. 146, “Accounting for
Costs Associated with Exit or Disposal Activities” (SFAS 146), the Company recognized a total of $0, $8,135 and $0 in restructuring
charges in fiscal 2006, 2005 and 2004, respectively.
The following describes restructuring actions the Company has initiated in fiscal 2005:
In the fourth quarter of fiscal 2005, the Company commenced a series of measures designed to align its operational structure to its
expected future growth, to allow better integration following the acquisitions of DST Innovis and Longshine, and to improve efficiency.
As part of this plan, the Company recorded a charge of $8,135 in connection with the termination of employment of software and
information technology specialists and administrative professionals. Approximately $7,238 of the total charge had been paid in cash as of
September 30, 2006. The remaining separation costs are expected to be paid out during fiscal 2007.
EmployeeSeparation
Costs
Balance as of October 1, 2004 $ —
Charges 8,135
Cash payments (1,133)
Balance as of September 30, 2005 7,002
Cash payments (6,105)
Adjustments (1) (651)
Balance as of September 30, 2006 $ 246
(1) Reflects adjustments due to changes in previous estimates, which were recorded in cost of service expenses, and differences inforeign exchange rates from balances paid in currencies other than the U.S. dollar, which were recorded in interest income andother, net.
NOTE 21 – FINANCIAL INSTRUMENTS
The Company enters into forward contracts and options to purchase and sell foreign currencies to reduce the exposure associated with
revenue denominated in a foreign currency and exposure associated with anticipated expenses (primarily personnel costs), in non-U.S.
dollar-based currencies and designates these for accounting purposes as cash flow hedges. The Company also may enter into forward
contracts to sell foreign currency in order to hedge its exposure associated with some firm commitments from customers in non-U.S.
dollar-based currencies and designates these for accounting purposes as fair value hedges. As of September 30, 2006 and 2005, the
Company had no outstanding fair value hedges. The derivative financial instruments are afforded hedge accounting because they are
effective in managing foreign exchange risks and are appropriately assigned to the underlying exposures. The Company does not engage
in currency speculation. The Company currently enters into forward exchange contracts exclusively with major financial institutions.
Forward contracts, which are not designated as hedging instruments under SFAS No. 133, are used to offset the effect of exchange rates
on certain assets and liabilities. The Company currently hedges its exposure to the variability in future cash flows for a maximum period
of two years.
76 Amdocs Limited Notes to the Consolidated Financial Statements (continued)(dol lar and share amounts in thousands, except per share data)
The hedges are evaluated for effectiveness at least quarterly. As the critical terms of the forward contract or options and the hedged
transaction are matched at inception, the hedge effectiveness is assessed generally based on changes in the fair value for cash flow hedges
as compared to the changes in the fair value of the cash flows associated with the underlying hedged transactions. The effective portion
of the change in the fair value of forward exchange contracts or options, which are classified as cash flow hedges, is recorded as
comprehensive income until the underlying transaction is recognized in earnings. Any residual change in fair value of the forward
contracts, such as time value, excluded from effectiveness testing for hedges of estimated receipts from customers, is recognized
immediately in “interest income and other, net.” Hedge ineffectiveness, if any, is also included in current period in earnings in “interest
income and other, net.”
The Company discontinues hedge accounting for a forward contract or options when (1) it is determined that the derivative is no longer
effective in offsetting changes in the fair value of cash flows of hedged item; (2) the derivative matures or is terminated; (3) it is determined
that the forecasted hedged transaction will no longer occur; (4) a hedged firm commitment no longer meets the definition of a firm
commitment; or (5) management decides to remove the designation of the derivative as a hedging instrument.
When hedge accounting is discontinued, and if the derivative remains outstanding, the Company will record the derivative at its fair value
on the consolidated balance sheet, recognizing changes in the fair value in current period earnings in “interest income and other, net.”
When the Company discontinues hedge accounting because it is no longer probable that the forecasted transaction will occur, the gains
and losses that were accumulated in other comprehensive income will be recognized immediately in earnings in “interest income and
other, net.”
The fair value of the open contracts recorded by the Company in its consolidated balance sheets as an asset or a liability is as follows:
As of September 30,
2 0 0 6 2005
Prepaid expenses and other current assets $ 7,792 $ 369
Other noncurrent assets 9 46
Accrued expenses and other current liabilities (4,165) (10,755)
Noncurrent liabilities and other — (2,361)
Net fair value $ 3,636 $ (12,701)
A significant portion of the forward contracts and options outstanding as of September 30, 2006 are expected to mature within the next
year.
During fiscal years 2006, 2005 and 2004, the gains or losses recognized in earnings for hedge ineffectiveness, excluding the time value
portion excluded from effectiveness testing, were not material. During fiscal years 2006, 2005 and 2004, the Company did not recognize
any losses for a hedged firm commitment that no longer qualified as a fair value hedge. During fiscal years 2006, 2005 and 2004, the
Company recognized losses of $0, $265 and $1,189, respectively, resulting from hedged forecasted cash flows that no longer qualified as
cash flow hedges. All of the above gains or losses are included in “interest income and other, net”.
Derivatives gains and losses, that are included in other comprehensive income, are reclassified into earnings at the time the forecasted
revenue or expenses are recognized. The Company estimates that a $2,834 net gain related to forward contracts and options that are
included in other comprehensive income as of September 30, 2006 will be reclassified into earnings within the next twelve months. The
amount ultimately realized in earnings will likely differ due to future changes in foreign exchange rates.
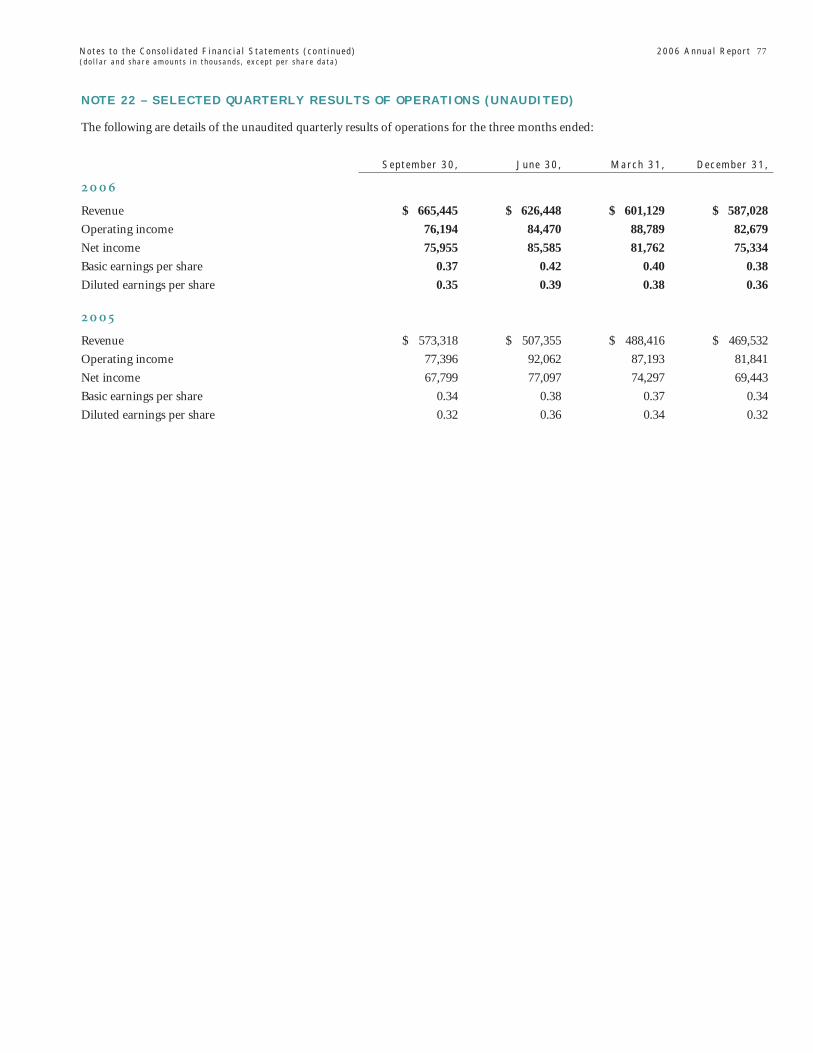
2006 Annual Report 77Notes to the Consolidated Financial Statements (continued)(dol lar and share amounts in thousands, except per share data)
NOTE 22 – SELECTED QUARTERLY RESULTS OF OPERATIONS (UNAUDITED)
The following are details of the unaudited quarterly results of operations for the three months ended:
September 30, June 30, March 31, December 31,
2 0 0 6
Revenue $ 665,445 $ 626,448 $ 601,129 $ 587,028
Operating income 76,194 84,470 88,789 82,679
Net income 75,955 85,585 81,762 75,334
Basic earnings per share 0.37 0.42 0.40 0.38
Diluted earnings per share 0.35 0.39 0.38 0.36
2 0 0 5
Revenue $ 573,318 $ 507,355 $ 488,416 $ 469,532
Operating income 77,396 92,062 87,193 81,841
Net income 67,799 77,097 74,297 69,443
Basic earnings per share 0.34 0.38 0.37 0.34
Diluted earnings per share 0.32 0.36 0.34 0.32

CORPORATE INFORMATIONDIRECTORS
BRUCE K. ANDERSONChairman of the Board of Directors
ADRIAN GARDNERChairman of the Audit Committee
CHARLES E. FOSTERChairman of the Nominating andCorporate Governance Committee
JAMES S. KAHANChairman of the CompensationCommittee
DOV BAHARAV
JULIAN A. BRODSKY
ELI GELMAN
NEHEMIA LEMELBAUM
JOHN T. MCLENNAN
ROBERT A. MINICUCCI
SIMON OLSWANG
MARIO SEGAL
JOSEPH VARDI
OFFICERS
DOV BAHARAVPresident and Chief Executive OfficerAmdocs Management Limited
ELI GELMANExecutive Vice PresidentChief Operating OfficerAmdocs Management Limited
RON MOSKOVITZSenior Vice PresidentChief Financial OfficerAmdocs Management Limited
MICHAEL MATTHEWSChief Marketing OfficerAmdocs Management Limited
HAREL KODESHChief Products OfficerAmdocs Management Limited
THOMAS G. O’BRIENTreasurer and SecretaryAmdocs Limited
SPYROS CHRISTODOULIDESManaging Director Amdocs Development Limited
78 Amdocs Limited

2006 Annual Report 79
PRINCIPAL AMDOCS OFFICES
NORTH AMERICA
USA1390 Timberlake Manor ParkwayChesterfield, MO 63017-6041Tel: +1 314 212 7000
Harborside Financial CenterPlaza 5, Suite 2700Jersey City, NJ 07311Tel: +1 201-631-3200
2545 North 1st StreetSan Jose, CA 95131Tel: +1 408 965 7000
2211 Elliott Avenue, Suite 400Seattle, WA 98121Tel: +1 206 447 6000
CANADA2 Bloor Street East, Suite 3100Toronto, Ontario M4W 3Y7Tel: +1 416 355 4000
2351 Alfred Nobel Montreal, Quebec H4S 2A9Tel: +1 514 338 3100
LATIN AMERICA
BRAZILRua Bandeira Paulista702 8 AndarSao Paulo – SP 04532-002Tel: +55 11 3040 4700
ASIA PACIFIC
CHINA9th Floor, Building A Technology Fortune Center8 Xueqing Road, Haidian DistrictBeijing 100085Tel: +86 105 177 3688
HONG KONGFred Kan & Co Solicitors & Notaries 3104-7, 31/F Central Plaza18 Harbour Road, Hong KongTel: +852 2598 1318
AUSTRALIA268 Canterbury RoadSurrey Hills Victoria 3127, MelbourneTel: +613 9835 0000
THAILAND22nd Floor, Fortune Town Building1 Ratchadapisek RoadDin Daeng District, Bangkok 10400Tel: +66 2 640 8545
JAPANTanbaya Building, 3rd Floor2-4 Kojimachi 3-chomeChiyoda-ku, Tokyo 1020083Tel: +81 3 3514 1836
INDIACyber City – Tower 2, 6th FloorMagarpatta City, HadpsarPune 411 028Tel: +91 20 2670 3000
EUROPE
UNITED KINGDOMFleetway House25 Farringdon StreetLondon EC4A 4EPTel: +44 207 343 2500
3 Sheldon SquarePaddington, London W2 6HYTel: +44 207 266 8400
ISRAEL8 Hapnina StreetRa’anana 43000Tel: +972 9 776 2222
CYPRUSThe Maritime Center141 Omonia AvenuePO Box 50483CY, 3045, LimassolTel: +357 25 886 000
IRELAND1st Floor, East Point Business ParkBlock S, Dublin 3Tel: +353 1 439 3600
80 Amdocs Limited
GERMANYForumstrasse 2641468 NeussTel: +49 2131 3480
FRANCE1 Place Victor Hugo92400 Courbevoie Tel: +33 (0) 1 4667 5000
HUNGARY1045 BudapestKalman Imre u. 1Tel: +361 475 1132
RUSSIAAmber Plaza Bld., 3rd Floor36 Krasnoproletarskaya StreetMoscow 127473Tel: +7 495 641 1911
OUTSIDE COUNSEL
Wilmer Cutler Pickering Hale and Dorr LLP399 Park AvenueNew York, NY 10022-4614Tel: +1 212 230 8800Fax: +1 212 230 8888
INDEPENDENT REGISTERED
PUBLIC ACCOUNTING FIRM
Ernst & Young LLP5 Times SquareNew York, NY 10036-6530Tel: +1 212 773 3000Fax: +1 212 773 5124
TRANSFER AGENT AND REGISTRAR
American StockTransfer & Trust Company59 Maiden Lane, Plaza LevelNew York, NY 10038-4502Tel: +1 718 921 8200Fax: +1 718 236 2641
SHARES
The Company’s shares are listed onthe New York Stock Exchange underthe symbol DOX.
ANNUAL MEETING
The Annual Meeting of Shareholderswill be held on January 18, 2007,at 10:00 am, at the offices of Wilmer Cutler Pickering Hale and Dorr LLP399 Park Avenue, New York,NY 10022-4614.
All shareholders are invited to attend.
INVESTOR INFORMATION
A copy of the Company’s Annual Report on Form 20-F, filed with theSecurities and Exchange Commission,is available. Requests should be made to Thomas G. O’Brien.
Timberlake Corporate Center1390 Timberlake Manor ParkwayChesterfield, MO [email protected]: +1 314 212 7000Fax: +1 314 212 7572
AMDOCS ON THE INTERNET
Corporate, product, financial andshareholder information, including newsreleases, financial filings and stockquotes are available at the Amdocswebsite: www.amdocs.com


AM
DO
CS
LIM
ITE
D A
NN
UA
L R
EP
OR
T 2006
Copyright © Amdocs 2006. All Rights Reserved. Reproduction or distribution other than for intended purposes is prohibited, without the prior written consent of Amdocs. Amdocs reserves the right to revise this document and to make changes in the content from time to time without notice. Amdocs may make improvements and/or changes to the product(s) and/or programs described in this document any time. The trademarks and service marks of Amdocs, including the Amdocs mark and logo, Ensemble, Enabler, Clarify, Return on Relationship, Intelecable, Collabrent, Intentional Customer Experience, Cramer and Qpass are the exclusive property of Amdocs, and may not be used without permission. All other marks are the property of their respective owners.
ANNUAL REPORT 2006WWW.AMDOCS.COM
Top Related