


Languages
Pages
Legal


14.3.1 GIS
GEOGRAPHICAL INFORMATION SYSTEMS (GIS)
UPA Package 4, Module 3

24.3.1 GIS
Geographical Information Systems
• Urban GIS• Rural and Urban Poverty Mapping• ArcView and ACCESS• Introduction exercises 4.3.1a and 4.3.1b
34.3.1 GIS
Geographical Information Systems

44.3.1 GIS
Urban GIS
Urban:
Spatial resolution; scale
Data content
Data intensity and overlays
Institutional
Economy, land use and planning

54.3.1 GIS
Urban GIS Layers
4.3.1 GIS
Planning map layers
Building layer, Land use layersNetwork and admin. boundaries layersNatural resource layersSatellite image, Ortho-rectifiedTopographical base maps

64.3.1 GIS

74.3.1 GIS

84.3.1 GIS
Urban GIS

94.3.1 GIS
Spatial Data Types: Points, Lines and Polygons

104.3.1 GIS
Mapping Census Variables

114.3.1 GIS
Location of Sample Survey Households Bangalore 100 wards
Source:SDS-World Bank Policy Research Program

124.3.1 GIS
Parcel-based Mapping
134.3.1 GIS
Rural Poverty Mapping
• Spatial Units and level of aggregation
www.povertymap.net • Measurement of Poverty
Income/expenditure, environment and health, services• Rural-Urban divide
Continuum not a rigid dichotomy

144.3.1 GIS

154.3.1 GIS
Spatial Dimension of Urban Poverty
Assumptions:• Spatial concentration of social exclusion; the divided city• Poverty mapping will support poverty alleviation through
increased efficiency of spatial targeting of public investments
Identify problem, define variables (land and housing) and poverty context (employment, fiscal-social policies)
Analyze causes, understanding spatial dimension of poverty
Addressing poverty, develop poverty alleviation policies and programs

164.3.1 GIS
Spatial Dimension of Urban Poverty
• Intra-urban differentials, urban poverty is site specific• Constructing poverty profiles• Pockets of poverty, pockets of greatest deprivation• Correlation between poverty and environmental indicators• Correlation between poverty and accessibility (roads,
services
174.3.1 GIS
Urban Poverty Mapping
Application of Poverty Mapping• Understanding, awareness and transparency, facilitate public
and institutional participation
• Intervention, support state and local decision making, targeting of public expenditures, tool for implementation of poverty reduction programs
• Linkage to other (GIS) applications and development of (inter)institutional spatial databases

184.3.1 GIS
Urban Poverty Mapping
Why• A city is a place for the rich AND the poor• Intra-city differentials (gated communities)• Good and bad (‘slums’) living environmentAim/Vision• Better spatial information – better citiesHow• Statistical tools and GIS for data processingRelevance• Geo-visualization of urban poverty and sub-standard living
conditions for targeting public investment

194.3.1 GIS
Poverty Mapping, Generic Stepshttp://population.wri.org
1. Define purpose and expected use of mapping
2. Select measure(s) of poverty and human well-being
3. Select input data
4. Select method of estimating or calculating poverty indicator
5. Select a method to calculate, estimate, or display poverty indicator for a geographic area
6. Decide on number of units for final map (resolution)
7. Produce and distribute maps
8. Monitor usage and feedback

204.3.1 GIS
Spatial Micro Simulation of Informal Households in Metro Manila

214.3.1 GIS
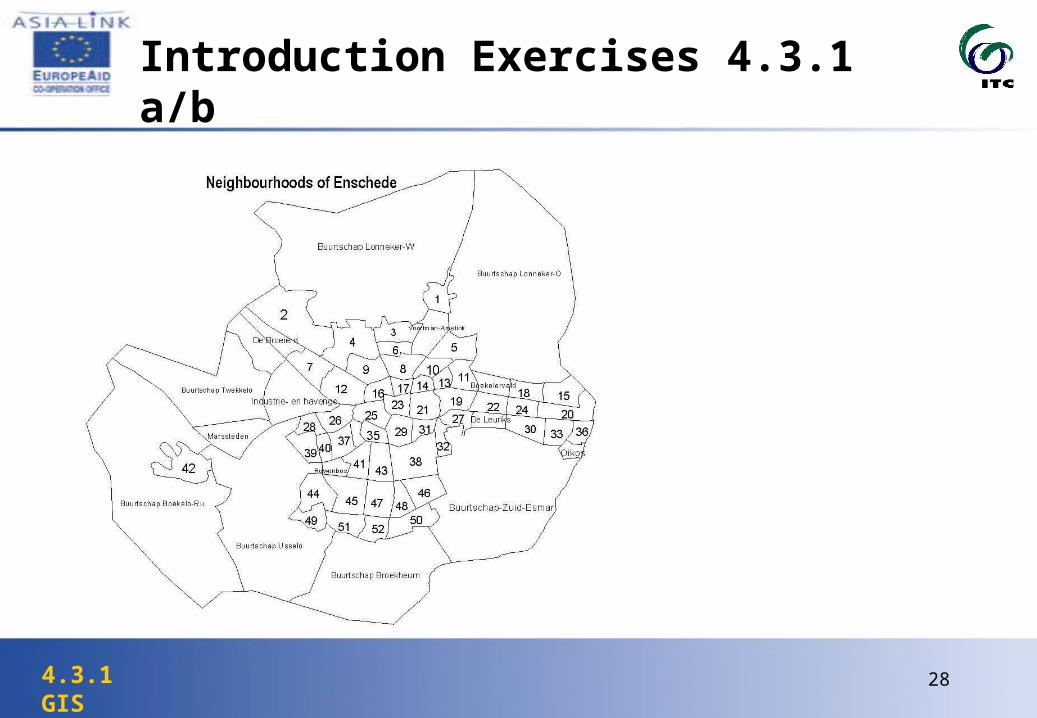
Enschede

224.3.1 GIS

234.3.1 GIS
ArcView and ACCESS

244.3.1 GIS
Introduction Exercises 4.3.1a/b
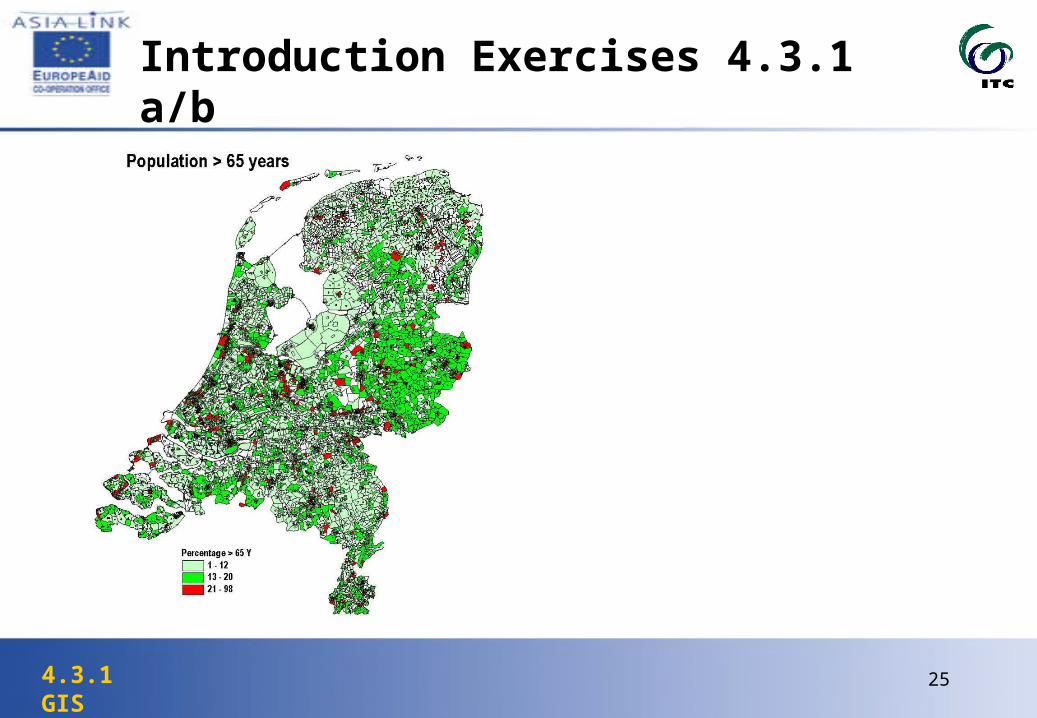
• Classify Age (interval data) into young and old categories• Add database to ArcView files• Join database to a map• Query database and visualize data• Repeat exercise for income and number of foreigners
254.3.1 GIS
Introduction Exercises 4.3.1 a/b
264.3.1 GIS
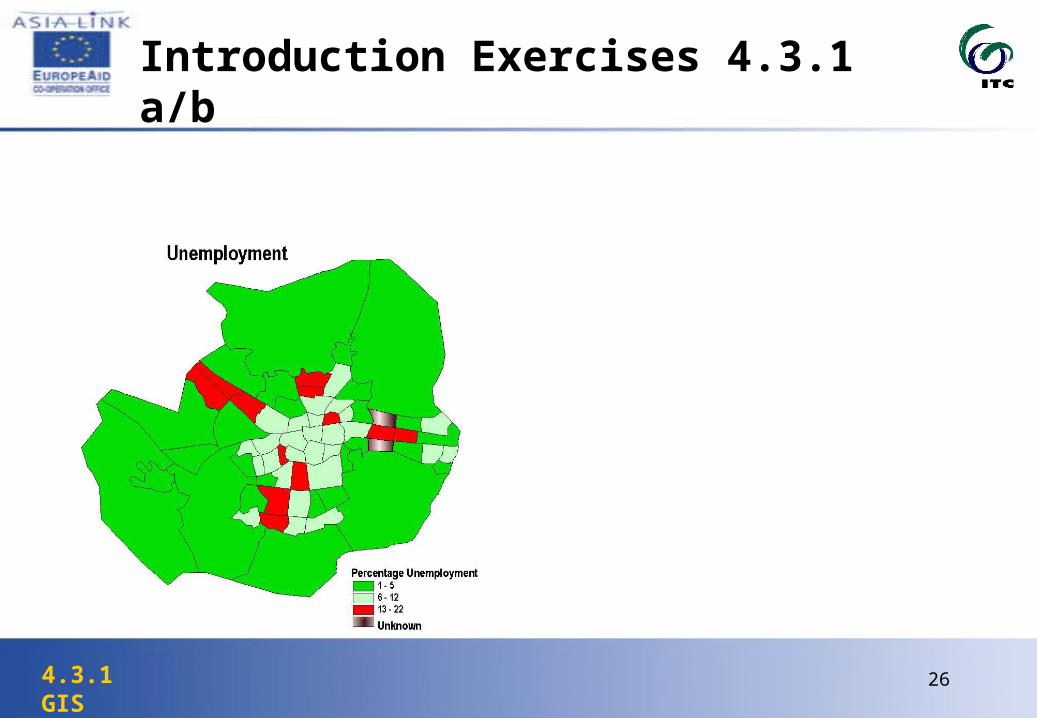
Introduction Exercises 4.3.1 a/b

274.3.1 GIS
Introduction Exercises 4.3.1 a/b
284.3.1 GIS
Introduction Exercises 4.3.1 a/b
Top Related