Zur Rose Group · Sources: Euromonitor, Market sizes for 2016, includes CH, DE, ES, ... Notes: 1...
43
Transcript of Zur Rose Group · Sources: Euromonitor, Market sizes for 2016, includes CH, DE, ES, ... Notes: 1...


Zur Rose Group The game changer — E-commerce pharmacy
May 2017

Zur Rose Group 3
Ma
rket
siz
e a
nd
e-c
om
mer
ce
sha
re
Large addressable market ripe for digital disruption
Medications CHF
146bn(1)
Apparel CHF 193bn
Furniture CHF 94bn
Key online players
Key offline players
Media products(3)
CHF 54bn
Pet Care CHF 9bn
>125,000 independent pharmacies
(2)
Sources: Euromonitor, Market sizes for 2016, includes CH, DE, ES, FR, IT, UK Notes: 1 medications include Rx and OTC & BPC, 2015, excl. VAT, 2015 CHF/EUR = 0.92346 | 2 Online penetration for Rx in Germany | 3 Media products include music, films and books
20%
10%
0%
30%
40%
50%
The game changer – E-commerce pharmacy

Zur Rose Group 4
Highly fragmented European market with more than 125,000 independent pharmacies, ripe for digital disruption
Pharmaceutical Retail has not changed for over 500 years
There is no leading offline nor online brand in Continental Europe, except for DocMorris in Germany
1500s
Today
Fragmented market

Zur Rose Group 5
Addressable Rx and OTC & BPC e-commerce market
Addressable Rx and BPC e-commerce market
Addressable OTC & BPC e-commerce market
— Rx e-commerce subject to different national
regulation
— Bonus on cross-border Rx e-commerce (e.g. NL
into DE) possible in EU due to ECJ ruling 2016
— Cross-border OTC e-commerce in EU not limited
by national regulations due to ECJ ruling 2003
— Ban of external ownership for pharmacies in
various countries (e.g. Germany) preventing
pharmacy chains and limiting access to
financing (more than 125,000 independent
pharmacies in Europe)
High entry barriers due to strict national regulations making pan-European presence only achievable via e-commerce
Source: Sempora market study, 2017
Strict regulatory framework

Zur Rose Group 6
Generating savings and allocating these to different stakeholders
— Bypassing intermediaries
— Scale effects
— Distribution structure
Patients
Insurance companies
Comprehensive two brand approach
Flexibility to react based on regulatory environment
Focus on B2C
Focus on B2B and B2B2C
€
€
Allocation of savings to Savings generated by
Dual approach

Zur Rose Group
One of the leading pharmacy products suppliers for self-dispensing physicians
Leading German e-commerce pharmacy for patients with established Rx segment and fast growing OTC & BPC segment
B2B B2C Focus on B2C (Rx / OTC & BPC(7))
Leading Swiss e-commerce pharmacy for patients
Core profit base Growth engine Growth engine
7
53% 47%
(2)
FY16 sales
CHF880m
Rx Sales (CHFm) 237(8)
OTC & BPC Sales (CHFm) 102(8)
Other (CHFm) 70(9)
Active customers 1,640,000(3,11)
Market share 20%(10)
Rx share of sales 70%(8)
Products(5) 66,000
Sales (CHFm) 346
% of Swiss sales 74%
Active customers 4,000(3)
Market share 23%(4)
Rx share of sales 89%
Products(5) 28,000
Sales (CHFm) 124
% of Swiss sales 26%
Active customers 128,000(3)
Market share 39%(6)
Rx share of sales 90%
Products(5) 17,000
Leading pure play e-commerce pharmacy in Europe(1)
CHF470m CHF409m
Notes: 1 According to James Dudley Management: Mail Order and Internet Pharmacy in Europe published in 2017, based on 2015 data, p. 13 | 2 Includes Austria exposure | 3 Active are customers defined as individual customers who have placed at least one order in the preceding 12 months| 4 Of the physician supply market; source: IMS Health | 5 Number of different products sold in 2016| 6 Of the e-commerce pharmacy market; source: IMS Health | 7 Beauty and Personal care| 8 DocMorris N.V. only| 9 Referring to Zur Rose EU and wholesale sales|10 Based on Sempora estimates of German e-commerce Rx and non-Rx market in 2016; sales exclude wholesale sales | 11 Includes end customers of Zur Rose Germany of 240,000 (end customers are defined as beneficiaries of Zur Rose services)| All numbers relate to 2016
Zur Rose Group at a glance

Zur Rose Group 8
Innovation leadership supporting pharmaceutical and operational excellence
Credible growth strategy delivering substantial upside
Comprehensive business model adding value to all stakeholders
Europe's leading pure play e-commerce pharmacy with renowned brands Zur Rose and DocMorris
Large addressable market with favorable growth drivers
Entrepreneurial and highly experienced management team
3
1
2
4
5
6
Perfectly positioned to capitalise on rapidly growing e-commerce pharmacy market
Highlights

Zur Rose Group 9
OTC & BPC Rx
# 1 player(3)
Attractive pharmaceutical market... ... driven by underlying structural growth trends
— Increasing health awareness
through changing lifestyles
— Trend towards self-
medication
— Polypharmacy
— Medical progress
Illustrative / not true to scale
Source: IMS Health 2016, Sempora market study, 2017 | 1 2015, core European market consists of CH, DE, ES, FR, IT, UK, excl. VAT, 2015 CHF/EUR = 0.92346 | 2 2016 | 3 According to James Dudley Management: Mail Order and Internet Pharmacy in Europe 2017, p. 13
Core European market: CHF 146bn(1)
Total DE & CH: CHF 49.8bn(2)
E-commerce DE & CH: CHF 1.9bn(2)
B2C sales: CHF 507m(2)
Large addressable market Highly attractive and fragmented CHF 146bn market with favourable long-term fundamentals
Market
1

Zur Rose Group
9%
1.3%
15%
0%
39%
25%
Accelerating online penetration
10
1
— Highly attractive customer lifetime value with 11%(3) conversion rate
— Works well for e-commerce due to small size and weight
— Return rate of 0.5%(4) very low compared to other verticals
0.3
3.2 1.0 4.3
CH
e-c…
CH
tot…
0.5
38.2
1.1
7.3
1.6
45.5
DE
e-c…
DE
tot…
Pharmaceutical market well suited for e-commerce consumerisation
Relatively low online penetration compared to other verticals leaves ample room for growth(1)...
…in Zur Rose Group’s core e-commerce markets (in CHFbn)(2)
Market driven by multiple growth trends
Rx OTC & BPC Music, films
& books
Total pharmaceutical market
E-commerce pharmaceutical market
— Digitalisation
— Pressure to reduce costs in healthcare
— Liberalisation, e.g. proposal of electronic prescription
Rx Rx OTC OTC & BPC Rx/ OTC & BPC
Other European markets
Source: 1 IMS PharmaScope, 2017, Sempora market study, 2017, Euromonitor (as of 03-Apr-2017), online penetration calculated by dividing the internet retailing market size across Europe by the total market size for each vertical, DE and US 2015, CH 2016, other European markets including France, Germany, Italy, Spain, United Kingdom, Switzerland, 2016 | 2 IMS Health 2017, Sempora market study, 2017, CHF/EUR = 0.94 | 3 OTC & BPC DocMorris 2017YTD, conversion rate equals % of webshop visitors placing an order | 4 DocMorris 2016
European pharmaceutical market on the brink of digital disruption
Market

Zur Rose Group
Excellence for growth
11
Largest e-commerce pharmacy in Germany (Sales multiplier vs. Shop Apotheke, 2016)(3)
0%
10%
20%
30%
40%
50%
60%
Jan 17Apr 16Apr 15Apr 14Jan 13Dec 11Dec 10
Most established e-commerce pharmacy brand in Germany(4)
Vitalsana mycare
Shop-Apotheke
Europa Apotheek Apotal
1
2.4x
39% 1
Largest e-commerce pharmacy in Switzerland (Market share in %, 2016)(1)
23% 2
2nd largest physicians supplier in Switzerland (Market share in %, 2016)(2)
5%
12%
15%
52%
58%
64%
0% 10% 20% 30% 40% 50% 60% 70%
Amavita
Sunstore
MediService
nu3
Adlershop
Most established pharmacy brand in Switzerland(4)
Germany
Source: 1 IMS Health, market share by sales | 2 IMS Health, 2016; Galenica Santé recognized as largest physicians supplier in CH following acquisition of Pharmapool AG in January 2017, market share by sales | 3 Sales based on FY2016 financials | 4 Aided brand awareness based on GFK
Ideally positioned to gain further market share with most established brands
Leadership
2

Zur Rose Group
Focus on Rx, OTC & BPC
О О О
О
Direct External Funding
Licensed pharmacy and Know-how
Number of Products
О
О
E-commerce Capabilities
О
Brand Awareness
О О
Assessment
- #1 in German market - Focused on Rx & OTC &
BPC - Strong OTC & BPC
growth - High brand awareness
- No online expertise - Direct external funding
restrictions limit expansion potential
- Limited access to direct external funding limits expansion potential
- Low brand awareness
- Focused on either OTC & BPC or Rx capabilities
- Conflict of interest with existing distribution businesses
- No pharmacy license - Lack of pharma
expertise - Cannibalisation of
marketplace business
12
General e-commerce players(2)
NL-based e-commerce pharmacies
Multi-channel pharmacy chains and wholesalers(1)
Traditional pharmacies
Other German e-commerce pharmacies
Limited space No e-commerce focus
Certain OTC & BPC products sold
Sustainable competitive advantage for Zur Rose and DocMorris
О Medium High/ permitted Low/ not permitted
Source: Company information Notes: 1 Prohibition of external ownership of pharmacies (e.g. in Germany) has prevented the formation of multi channel pharmacy chains in these countries | 2 OTC & BPC sales not by Amazon directly but through licensed pharmacies via Amazon website
12
Leadership
2 Competitive overview
OTC & BPC focus
OTC & BPC focus
OTC & BPC focus
Rx focus

Zur Rose Group 13
Overview of the competitive positioning
OTC & BPC focus Rx and OTC & BPC focus
CHF 507m(2)
CHF 190m(1)
n.a.
Country leadership
No
co
un
try
lead
ersh
ip
(Mu
ltip
le)
cou
ntr
y le
ader
ship
s
Rx focus
CHF 120m(3) n.a.
E-commerce competitors in Zur Rose Group’s focus markets
Source: Company information, Sempora Market Study, 2017 Notes: 1 | 2016 CHF/EUR = 0.93115 | 2 B2C e-commerce sales, 2016 | 3 Sempora Market Study, 2017, Only Rx sales, 2016 CHF/EUR = 0.93115
2
Leadership

Zur Rose Group
Unique value proposition
14
— Reduction of admin / logistics costs as per regulation
— Data analysis / reports on patients
— Improve patient convenience
— Lower cost from increased compliance
Pharmaceuticals manufacturers — Big Data pool
— Adherence support
— Feedback loops
— Specialty Care (ensuring correct usage, storage, continuous check-up)
Insurance companies
— Convenience 24/7
— Affordability
— Confidentiality
— Omni-channel strategy
— Personalised services
Patients
Physicians — Adherence support (patient reports)
— Process optimisation e.g. inventory management
— Trusted partner
— Technical expertise
Value-add for all stakeholders in healthcare industry
Proposition
3

Zur Rose Group
SD allowed(1)
NSD(3)
Mixed cantons(2)
— Physicians not allowed to dispense medication to patients
— Zur Rose supplies c. 95,000 patients directly
Ability to shift between business models and delivery channels means:
— Partial protection against regulatory changes
— Full coverage of:
— regional regulatory systems
— physicians’ needs
— Competitive advantage
— Physicians operate small pharmacies within their practices
— Dispensing licence required
— Zur Rose supplies c. 4,000 physicians with pharmaceuticals
Self-dispensing cantons (red) Non-self-dispensing cantons (grey)
Distinct business models cover all regulatory systems and requirements
Patients Physicians Physicians Patients
Retail business model Wholesale business model
15
Source: IMS Health Notes: 1 SD: Self dispensing by physicians allowed; City of Schaffhausen will switch to SD as of January 1st, 2018 | 2 Mixed cantons: cantons with areas of self dispensing and areas of non-self dispensing (Canton of Berne NSD: self dispensing of primary submission (first medication in the smallest unit only) by physicians allowed) | 3 NSD: Non-self dispensing/Self dispensing by physicians not allowed | 4 Key statistics, 2016
A leading Swiss pharmaceutical supplier 3
Segment CH
Retail (B2C)(4) Physicians wholesale (B2B)(4)
4,000 active customers
28,000 SKUs sold
12.5m Pces/year
89% Rx share
128,000 active customers
17,000 SKUs sold
1.8m Pces/year
90% Rx share

Zur Rose Group 16
Physicians wholesale business unit Highly loyal physicians generate stable revenue and profit
— Wholesale of pharmaceutical products to self-dispensing physicians:
— Primary and specialty care medication
— Original and generic drugs
— Self-dispensing is restricted to their patients
— Value-added services (quality assurance, inventory management, smart order tool)
Strong business fundamentals (2016A)
Source: IMS Health, 2016 Note: 1 IMS Health, 2016, market share by sales | 2 2016 | 3 Cohort until 2010
Segment CH
3
One of the leading pharmaceutical wholesalers in Switzerland
4,000 B2B physician
customers
315,000 deliveries with
Polyrose(2)
23% market share
in B2B(1)
Physician cohorts development
— Steady growth of physician wholesale business on the back of high customer loyalty
— While early cohorts (2010(3)-2011) already show repeat sales rates that are constantly well above 90%, repeat sales rates of more recent customer cohorts (2012-2015) are consistently above 100%
— Despite the price reductions on all Rx-products from November 2012 to October 2015, which was imposed by the Swiss regulator, total physician sales increased by +2.4% (CAGR 2010-2016)
— Current growth figures show a sales increase of +3.4% (CAGR 2013-2016) following the imposed price reductions on reimbursable medications

Zur Rose Group 17
— Supply of high value specialty care pharmaceuticals
— Assistance and education of the patients by certified nurses
— Patient programs developed in cooperation with opinion leaders
— Supplementary portfolio of pharmacy-exclusive and -non-exclusive products
— Direct & indirect access to the Zur Rose webshop
— Cross-selling of Rx medication
— Supply of full range of Rx pharmaceuticals
— Estimated 70% of patients with chronical diseases and polypharmacy
— Customized medication supply DailyMed as high margin service for polypharmacy patients
— Zur Rose retail pharmacies are extensions to the e-commerce pharmacy (Omni-channel strategy) via flagship and shop-in-shop concept
— Supply of chronic and acute patients
— First Migros shop-in-shop expected to open in Bern in 2017 (pilot phase)
Vertically covered value chain B2C business units cover all customers
Primary Care Specialty Care
Consumer Healthcare Retail Pharmacy
3
Segment CH
Strong e-commerce platform in
combination with omni-channel strategy
to significantly accelerate B2C growth
1,500 active
customers(1)
c. CHF 5,000 average
basket size
38,000 active
customers(1)
c. CHF 85 average
basket size 150-200 sqm
First flagship store in Bern
30-50 sqm
Migros shop-in- shop pharmacies
93,000 active
customers(1)
c. CHF 200 average
basket size
Note: 1 Number of customers in B2C segment not cumulative, customers may be included in multiple business units

Zur Rose Group
Heerlen, Netherlands
German market leader
Competitive positioning
Source: 1 DocMorris, as of 2016 | 2 Mail-order including VAT | 3 Market size based on Sempora estimates of total Rx and non-Rx market in Germany in 2016; sales based on FY2016 financials | 4 Sales exclude wholesale sales
1.4m active customers
Key statistics(1)
4.4m orders
85% repeat order rate
3.1 orders per active
customer p.a.
EUR85 Ø basket size(2)
18
Recent awards
Advantageous location to serve the German market(1)
c.530 FTEs
Marketing award (2017)
Category "e-mailing“
2nd best e-mailing campaign
Brand award (2016)
Germany's best e-commerce distributors
1st in the mail-order pharmacy category
Brand award (2016)
Germany's best e-commerce shops
1st in the pharmacy category
Brand award (2016)
Best mail-order pharmacies
1st
Marketing award (2015)
Mail-order pharmacy with best end-user marketing
2nd
~50% OTC & BPC sales growth
2016
9,500 sqm warehouse
German e-commerce pharmacy leader in scale and quality
Customer award (2017)
Most customer-friendly app
1st in the pharmacy category
Market shares in Germany as of 2016(3)
20%(4)
8%
2.4x
Germany
Segment DE
3

Zur Rose Group
Lock-in model as a growth driver
19
Service innovation
Convenience/ ease of use
More repeat orders
Advanced/ personalised
services
More satisfied customer
Lock-in model
with 360 data
Monetary incentive (Rx: Bonuses / OTC:
attractive pricing)
New customers 360° data and broad spectrum of services
Individ. medication
plan
Script reminder
Pharmaceutical counselling Information
materials
Lifestyle coaching
Video live chat
Timed delivery
App
Holistic and broad data-enabled services drives customer lock-in
Segment DE
3

Zur Rose Group
489 579
969
2014A 2015A 2016A
Active OTC & BPC customers (in thousands)
50 46 42
2014A 2015A 2016A
Financial track record
20
Strongly growing customer base with highly stable ordering habits(3)
Basket size (in EUR)
German business demonstrating significant customer and topline growth
91
105
Q1 16 Q1 17
Accelerated fundamentals
154
216
Q1 16 Q1 17
+15%
+40%
Sales(1)(2) (in EURm) New OTC & BPC customers(3) (in thousands)
Number of orders (in million) (bubbles: % repeat orders)
1.1 1.4
2.2
2014A 2015A 2016A
74% 76% 72%
Segment Germany OTC & BPC
Segment DE
3
Notes: 1 Based on unaudited Q1 financials | 2 Includes Austria exposure | 3 DocMorris OTC & BPC only
Indicative Rx KPIs development
— In Q1 17, Rx new customers multiplied vs. Q1 16 after lifting the Rx bonus ban in Q4 16 and the beginning of the marketing campaign
— In 2014A, the share of Rx active customers in total active customers was similar to that of OTC & BPC
— Rx active customers remained stable until 2016A due to the Rx bonus ban
— Rx basket size remained broadly stable in 2014-16A, being more than double the number for OTC & BPC
— Rx repeat orders close to 100% given inherent stickiness of the business

Zur Rose Group 21
-
10
20
30
40
50
60
70
80
90
2010 2011 2012 2013 2014 2015 2016
EU
Rm
2016
2015
2014
2013
2012
2011
201069% 78% 93% 96% 96% 107%
61% 90% 96% 91% 106%
65% 88% 94% 107%
70% 88% 102%
63% 98%
76%
69%
67% 77%
81%
81%
94%
Strong growth in OTC & BPC driven by attractive pricing (DocMorris) (OTC & BPC customer sales by cohorts (EURm) / repeat rate (%), excluding <2010 customers(1))
Repeat rate initial year vs.
2016
49% 51% 59%
63%
61%
76%
Cohorts
Cohort analysis provides predictability
Note: 1 Total sales 2016 incl. <2010 customers
Superior customer loyalty and attractive pricing support further growth
+12% y-o-y volume growth in Q1 2017
+6% y-o-y sales growth in Q1 2017
3
Segment DE
—High loyalty from early cohorts (2010-2012) with annual repeat rates consistently above 90%, providing for a strong basis despite bonus ban (Aug-12 to Oct-16)
—During the bonus ban, the size of new cohorts decreased over time, however repeat rates remained high
—Overall annual repeat rates are close to 100%
Rx cohort development

Zur Rose Group
9
16
14
11
9
6 7
0
10
20
2010 2011 2012 2013 2014 2015 2016
OTC CAC (EUR)
Significant push in Rx customer acquisition from 2016 onwards, triggered by lifting of the Rx bonus ban (ECJ ruling) and intensified, targeted marketing
Proven track on reducing customer acquisition cost (CAC) in OTC & BPC despite fast growing business and number of new customers
High leverage at constant marketing spending
Rx focused marketing campaigns also having positive spill-over effects on OTC & BPC sales
Customer acquisition paying off quickly
22 Note: 1 Management; cost of TV (branding) campaign allocated to Rx and OTC & BPC according to sales per customer (new and existing); OTC & BPC further includes online marketing, Rx further includes media inserts, i.a.
Attractive economics of customer acquisition New OTC & BPC customers breaking even after 12 months
Effective and intensified marketing mode acquiring high quality customers
2010 12
2011 15 2014 12
2015 12
Cohort of year… breaking even after …months:
2015: online marketing curbed due to
warehouse introduction
Declining OTC & BPC CAC due to increased marketing efficiencies (in EUR)
OTC & BPC CAC (EUR)(1)
OTC & BPC customer cohorts
from 2014-2015 (most recent)
3
Segment DE
Prior to the Rx bonus ban (2010, 2011), breakeven periods for Rx customers were broadly in line with that of OTC & BPC customers
The cost of acquiring Rx customers is c. 2x the cost of acquiring OTC & BPC customers mainly due to a lower customer base
As a result of our intensified marketing campaign in 2016, CAC for Rx customers increased considerably but is expected to normalize as our Rx customer base increases
Rx CAC development(1)

Zur Rose Group
Innovation initiatives
Electronic prescriptions (eRx) — Increase convenience and continuity of supply
— Introduced in Switzerland in 2001
— Digitalisation leading to less errors
App — Offers extensive information and analysis functionalities on drug
dosage
— Direct ordering of medication
— Contraindication and interaction checks
Big Data initiative — Continuous development of Big Data initiatives
— Promotion of digitalisation in healthcare
— Medication feedback loop
23
Telepharmacy — Allows patients to talk to a pharmacist via live video chat
— Professional consultation from the comfort of home
At the forefront of digitalisation in the healthcare industry
Medication feedback loop
Innovation
4
Pharmaceutical and operational excellence combined with innovation creating high barriers to entry

Zur Rose Group 24 Source: 1 Sempora Notes: 2 Search Engine Optimization | 3 Search Engine Advertising
Give dynamic to core profit base
Lead the market in Rx
Obtain market leadership in OTC &
BPC
1,017
2,042
Innovate with e-health solutions
International expansion
New markets
2015 2020
Base / short-term initiatives Upside / mid- to long-term initiatives
SEO(2) SEA(3)
Big Data
eRx
Non-Rx e-commerce market volume DE(1)
Cooperations with German health
insurance companies to be established
Media campaign
Operational excellence and economies of scale
Participate in market consolidation
Addressable Rx and OTC & BPC e-commerce market
Addressable Rx and BPC e-commerce market
Addressable OTC & BPC e-commerce market
Growth strategy Six initiatives to capitalise on substantial upside
Intensify cooperations with
insurance companies
Strategy
5
Organic growth and acquisitions
Growth with cooperations, group
practices and medical centres

Zur Rose Group
Zur Rose Group sales
434.1 468.3 470.3 114.3 116.9
481.5 366.1 409.2
99.7 112.2
915.6 834.4 879.5
214.0 229.1
2014 2015 2016 Q1 2016 Q1 2017
Strong pick up in momentum since 2015
25
Decreasing sales in 2015 due to:
Currency translation effect (EUR into CHF) of (CHF50.3m)
Reduction of low margin business in Germany (wholesale activities)
Relocation to new site and postal strike in Germany causing disruptions
Partly offset by increasing B2C sales in Switzerland (Specialty Care)
Picking up in 2016, supported by:
Recently launched marketing campaign in Germany resulting in a high number of new OTC customers and respective sales
Strong growth from DocMorris in Germany, triggered by positive ECJ ruling for Rx and intensified marketing efforts since Q4 2016
Sales (annual) FY 2014-2016, CHFm YoY growth (%)
Sales (quarterly) Q1 2016 vs. Q1 2017, CHFm YoY growth (%)
(8.9%) 7.9% (24.0%) 5.4% 0.4% 11.8%
7.1% 2.3% 12.6%
Group
Switzerland
Germany
(1) (2)
Financial
5
Notes: 1 Segment Germany net revenues in 2014 include net revenues from customers based in Germany (CHF 477.8 million) as well as in Austria, the Netherlands and the Czech Republic (CHF 3.6 million) | 2 Segment Germany net revenues in 2015 include net revenues from customers based in Austria, the Netherlands and the Czech Republic (CHF 0.3 million)

Zur Rose Group
323.9 331.4 345.8
83.8 88.6
110.1 137.0 124.5
30.5 28.3
434.1 468.3 470.3
114.3 116.9
2014 2015 2016 Q1 2016 Q1 2017
Stable development in terms of sales growth
26
Increasing sales in 2015 due to:
Solid growth in B2B sales driven by expansion of physician customer base
Strong development of B2C business, driven by high value (yet low margin) HCV(1) patients in Specialty Care business unit and partly offset by decreasing Primary Care customer base due to eRx restrictions by the Swiss federal court
Stable segment development in 2016 as a result of:
Increased growth of new physician customers / B2B sales
Partly offset by decreasing B2C sales due to terminated HCV activities
Continued trends from FY2016 observations
Sales (annual) FY 2014-2016, CHFm YoY growth (%)
Sales (quarterly) Q1 2016 vs. Q1 2017, CHFm YoY growth (%)
7.9% 2.3% 24.3% 0.4% 4.4% (9.1%)
2.3% 5.7% (7.2%)
Switzerland
B2B sales
B2C sales
Segment Switzerland sales Financial
5
Note: 1 HCV patient = Hepatitis C virus patients

Zur Rose Group
294.1 236.3 237.3
58.8 61.0
65.8 66.5 102.1
23.7 33.7
121.6
63.3 69.8
17.1 17.6
481.5 366.1 409.2
99.7 112.2
2014 2015 2016 Q1 2016 Q1 2017
Growth engine moving into gear
27
Decreasing sales in 2015 due to:
Currency translation effect (EUR into CHF)
Curbed Rx customer growth due to ongoing bonus ban
Relocation to new site and postal strike in Germany causing disruptions
Downsizing of low margin business (wholesale activities)
Pick up in 2016, supported by:
Recently launched marketing campaign in Germany resulting in a high number of new customers
Strong performance due to:
Growth triggered by positive ECJ ruling for Rx and intensified marketing efforts since Q4 2016 (Rx and OTC)
Increasing switch of OTC customers towards Rx
Sales (annual)
FY 2014-2016, CHFm YoY growth (%)
Sales (quarterly) Q1 2016 vs. Q1 2017, CHFm YoY growth (%)
(24.0%) (19.6%) 1.1% (47.9%)
11.8% 0.4% 53.6% 10.2%
12.6% 3.7% 42.0% 2.5%
Germany
Rx
OTC
Other(3)
(1) (2)
Segment Germany sales Financial
5
Notes: 1 Segment Germany net revenues in 2014 include net revenues from customers based in Germany (CHF 477.8 million) as well as in Austria, the Netherlands and the Czech Republic (CHF 3.6 million) | 2 Segment Germany net revenues in 2015 include net revenues from customers based in Austria, the Netherlands and the Czech Republic (CHF 0.3 million) | 3 Other sales include Zur Rose EU and wholesale sales

Zur Rose Group
242.2 221.3 217.7 53.7 57.0
54.2 62.3 93.7
21.7 31.5
100.0 59.3
64.0
15.6 16.4
396.4 342.9 375.5
91.0 104.9
2014 2015 2016 Q1 2016 Q1 2017
Growth engine moving into gear
28
Segment Germany sales — local currency
Decreasing sales in 2015 due to:
Curbed Rx customer growth due to ongoing bonus ban
Relocation to new site and postal strike in Germany causing disruptions
Downsizing of low margin business (wholesale activities)
Pick up in 2016, supported by:
Recently launched marketing campaign in Germany resulting in a high number of new customers
Strong performance due to:
Growth triggered by positive ECJ ruling for Rx and intensified marketing efforts since Q4 2016 (Rx and OTC)
Increasing switch of OTC customers towards Rx
Sales (annual)
FY 2014-2016, EURm YoY growth (%)
Sales (quarterly) Q1 2016 vs. Q1 2017, EURm YoY growth (%)
(13.5%) (8.6%) 15.0% (40.7%) 9.5% (1.6%) 50.5% 8.0%
15.3% 6.1% 45.4% 5.0%
Germany
Rx
OTC
Other(3)
(1) (2)
Financial
5
Notes: 1 Segment Germany net revenues in 2014 include net revenues from customers based in Germany (EUR 393.4 million) as well as in Austria, the Netherlands and the Czech Republic (EUR 3.0 million) | 2 Segment Germany net revenues in 2015 include net revenues from customers based in Austria, the Netherlands and the Czech Republic (EUR 0.3 million) | 3 Other sales include Zur Rose EU and wholesale sales

Zur Rose Group
57.3 58.6 56.7 14.1 14.0
82.3 67.1 75.2
18.3 19.4
139.7 125.7 131.9
32.4 33.4
2014 2015 2016 Q1 2016 Q1 2017
Stable and healthy gross profit margins
29
Group margins stable around 15%, mainly affected by
Decrease in Segment CH due to increasing share of B2B business
Increase in Segment DE due to increasing share of B2C business
Strong reduction of Gross Profit in absolute terms in 2015 mainly driven by currency translation effect (EUR into CHF)
Margin reduction driven by shift towards B2B business in Segment CH and increased discount of Rx products at DocMorris for Segment DE
Gross profit (annual) FY 2014-2016, CHFm Gross profit margin and YoY growth (%)
Gross profit (quarterly) Q1 2016 vs. Q1 2017, CHFm Gross profit margin and YoY growth (%)
15.3% 13.2% 17.1% 15.1% 12.5% 18.3% 15.0% 12.1% 18.4% 15.1% 12.3% 18.4% 14.6% 12.0% 17.3%
Margin (%)
(10.0%) 2.3% (18.6%) 5.0% (3.3%) 12.2%
3.0% (0.7%) 6.0%
Group
Switzerland
Germany
Gross Profit Financial
5

Zur Rose Group
45.2 45.9 47.1 11.7 12.0
80.4 69.9 82.8
18.6 27.3
127.6 116.2 135.2
31.4 41.1
2014 2015 2016 Q1 2016 Q1 2017
Operating leverage expected to kick in as business grows
30
Stable Opex in Segment CH, extraordinary expenses in 2016 due to implementation of new warehouse management system and opening of flagship pharmacy
Business disruptions such as postal strike in Germany and relocation to new site driving Opex as % sales up in FY2015, decrease in absolute numbers due to currency translation effect
Increase of Opex on Group level in 2016 driven by Segment DE
Significant increase in marketing spend in 2016
Increase of volume and variable costs
Continued high marketing spend at DocMorris
Advertising and acquisition expenses related to TV campaign in Germany affecting Q1 2017 Opex
Opex(1) (annual) FY 2014-2016, CHFm Opex as % of sales (%) and YoY growth (%)
Opex(1) (quarterly) Q1 2016 vs. Q1 2017, CHFm Opex as % of sales (%) and YoY growth (%)
Group(2)
Switzerland
Germany
13.9% 10.4% 16.7% 13.9% 9.8% 19.1% 15.4% 10.0% 20.2% 14.7% 10.2% 18.7% 17.9% 10.3% 24.3%
As % of sales (%)
(8.9%) 1.8% (13.1%) 16.3% 2.7% 18.5%
30.7% 2.6% 46.8%
Operating Expenses Financial
5
Notes: 1 Opex include personnel expenses and exclude D&A | 2 Difference between Group Opex and sum of Segment CH plus Segment DE equals corporate costs and intercompany eliminations

Zur Rose Group
17.1 17.6 14.6 3.8 2.7
7.9 4.2
(1.8)
1.2
(5.9)
17.3 15.8
2.1 2.4
(5.8)
2014 2015 2016 Q1 2016 Q1 2017
Growth mode reflected in 2016 EBITDA
31
Proven profitability in 2014 and 2015 figures on both Group and Segment level
2016 EBITDA deliberately affected by growth initiatives, in particular increased marketing spend, for which the impact of the increase in new customers will only over time fully translate into higher revenues
Marketing spend in Germany (increased since lifting of bonus ban end of 2016) a core focus for the Group
EBITDA decline of ~CHF 1m in segment Switzerland due to roll-out of omni-channel strategy, first time payment of rent to Group and WAMAS
Adjusted EBITDA(1) (annual) FY 2014-2016, CHFm Adjusted EBITDA margin (%) and YoY growth (%)
Adjusted EBITDA(1) (quarterly) Q1 2016 vs. Q1 2017, CHFm Adjusted EBITDA margin (%) and YoY growth (%)
Margin (%)
1.9% 3.9% 1.6% 1.9% 3.7% 1.2% 0.2% 3.1% nm 1.1% 3.3% 1.2% nm 2.3% nm
Group(2)
Switzerland
Germany
(8.9%) 3.0% nm nm (16.6%) nm
nm (27.8%) nm
Adjusted EBITDA Financial
5
Notes: 1 Group adjusted EBITDA equals Group reported EBITDA | 2 Difference between Group EBITDA and sum of Segment CH plus Segment DE equals EBITDA at corporate incl. intercompany eliminations

Zur Rose Group
1.8 3.2 13.8 3.2 3.0
12.8 10.9
5.7
2.0 1.7
15.8 15.2 19.9
5.5 4.7
2014 2015 2016 Q1 2016 Q1 2017
Investments in software and licences as well as logistics to underpin leading e-commerce position
32
Capital expenditures
Investments in Property, Plant and Equipment (PPE) include mainly investments in new warehouse in Heerlen (DocMorris) in 2015
Investments in intangible assets are substantial and relate mainly to software and development costs
2014: >CHF8.5m
2015: >CHF9.0m
2016: >CHF16.5m
Capital expenditures in Q1 2017 below previous year's levels due to different intra-year phasing of capex spending
Capex (annual) FY 2014-2016, CHFm YoY change in capex (CHFm)
Capex (quarterly) Q1 2016 vs. Q1 2017, CHFm YoY change in capex (CHFm)
Group(1)
Switzerland
Germany
(0.6) 1.4 (1.9) 4.7 10.6 (5.2)
(0.7) (0.2) (0.3)
5
Financial
Note: 1 Difference between Group Capex and sum of Segment CH plus Segment DE equals capex not allocated to segments

Zur Rose Group
Proven management team
Financial track-record
Established financial track record of more than 20 years DocMorris brand
award (2015) Customer award
(2015) Quality services
(2014)
Selected awards and certifications Operational excellence
Established leading position in Swiss and German e-commerce pharmaceuticals
Pioneer in e-commerce pharmacy
M&A experience
Successful acquisition and integration of NKA, Ogera, VfG, DocMorris and BlueCare
33
Entrepreneurial and highly experienced management team
Zur Rose Group — Key management team
Walter Oberhänsli
Founder, Group CEO
Marcel Ziwica
Group CFO
Walter Hess
Head Switzerland
Olaf Heinrich
Head Germany
6
Management

Zur Rose Group 34
Innovation leadership supporting pharmaceutical and operational excellence
Credible growth strategy delivering substantial upside
Comprehensive business model adding value to all stakeholders
Europe's leading pure play e-commerce pharmacy with renowned brands Zur Rose and DocMorris
Large addressable market with favorable growth drivers
Entrepreneurial and highly experienced management team
3
1
2
4
5
6
Perfectly positioned to capitalise on rapidly growing e-commerce pharmacy market
Highlights

Zur Rose Group 35
Appendix
Additional materials

Zur Rose Group 36
Launch of B2B business Expansion into e-commerce pharmacy
in selected geographical markets Significant investments made to
accelerate growth
1999 2001 2004 1993 2012
Entry into Swiss e-commerce market
Market entry in Germany with Zur Rose brand
Opening of state-of-the-art logistics center
in Frauenfeld, Switzerland
Acquisition of DocMorris
2015
Acquisition of majority interest in BlueCare
2015
Opening of new DocMorris logistics
center
2017 2017+
Intensified DocMorris marketing campaign
leads to strong increase in new Rx customers
2016
Zur Rose established in Steckborn, Switzerland
Landmark ECJ ruling on German bonus-ban
Proven track record of disrupting the medication supply business
Investments paving the way for growth
Milestones
Entering shop-in-shop cooperation in
Switzerland (pilot phase)

Zur Rose Group 37
Won 2 out of 3 ECJ rulings
Major regulatory developments
ECJ ruled that the prohibition of foreign ownership for pharmacies in Germany does not breach the European law 2009
The European Court of Justice (ECJ) allows EU-wide medication delivery via mail order 2003
Rx medication delivery via mail-order becomes legal in Germany 2004
ECJ ruled in favour of DocMorris against the fixed pricing regime for Rx drugs applying to pharmacies outside Germany, neutralizing the Rx bonus ban 2016
Introduction of Rx bonus ban in Germany 2012
1st failed attempt to ban Rx mail-order in Germany 2009
2nd failed attempt to ban Rx mail-order in Germany 2012
DocMorris is legitimate Member of §129 SGB V and thus safeguarding reimbursement from public sick funds like any other brick & mortar pharmacy (Ruling from Federal Social Court)
2009
Currently no parliamentary and government majority for a ban of Rx-mail order 2017
Proven track record in addressing regulatory challenges
Zur Rose Group
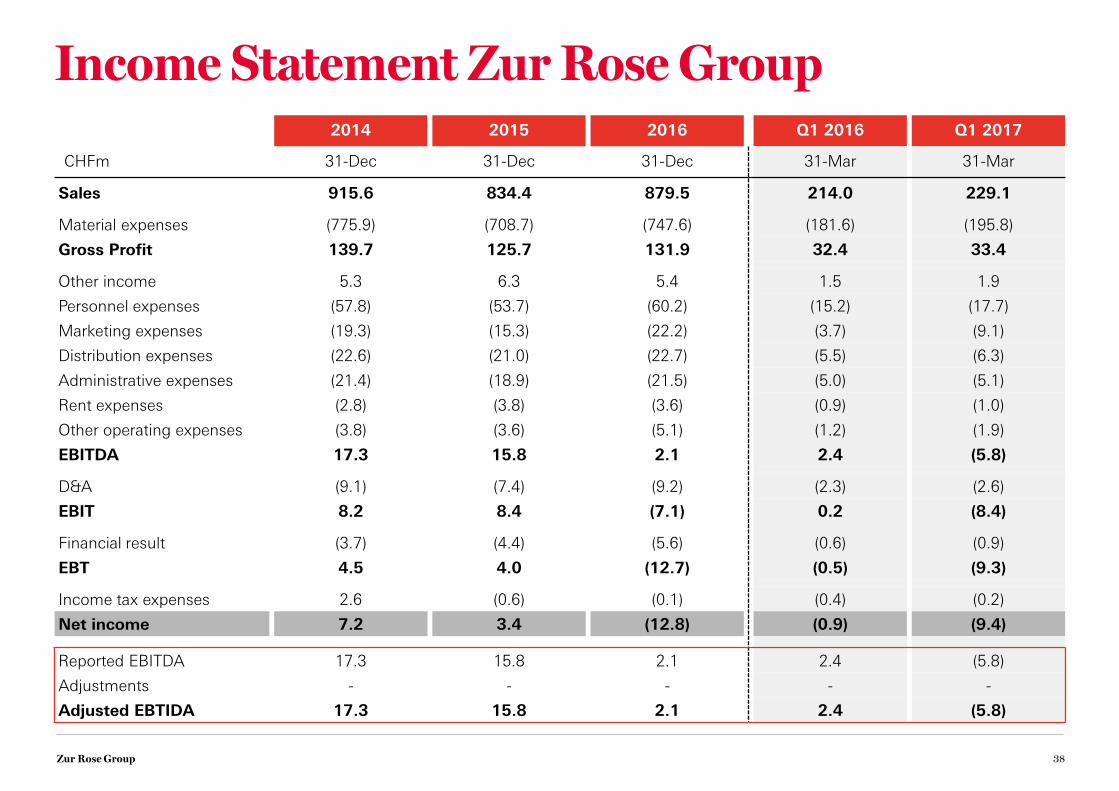
Income Statement Zur Rose Group
38
2014 2015 2016 Q1 2016 Q1 2017
CHFm 31-Dec 31-Dec 31-Dec 31-Mar 31-Mar
Sales 915.6 834.4 879.5 214.0 229.1
Material expenses (775.9) (708.7) (747.6) (181.6) (195.8)
Gross Profit 139.7 125.7 131.9 32.4 33.4
Other income 5.3 6.3 5.4 1.5 1.9
Personnel expenses (57.8) (53.7) (60.2) (15.2) (17.7)
Marketing expenses (19.3) (15.3) (22.2) (3.7) (9.1)
Distribution expenses (22.6) (21.0) (22.7) (5.5) (6.3)
Administrative expenses (21.4) (18.9) (21.5) (5.0) (5.1)
Rent expenses (2.8) (3.8) (3.6) (0.9) (1.0)
Other operating expenses (3.8) (3.6) (5.1) (1.2) (1.9)
EBITDA 17.3 15.8 2.1 2.4 (5.8)
D&A (9.1) (7.4) (9.2) (2.3) (2.6)
EBIT 8.2 8.4 (7.1) 0.2 (8.4)
Financial result (3.7) (4.4) (5.6) (0.6) (0.9)
EBT 4.5 4.0 (12.7) (0.5) (9.3)
Income tax expenses 2.6 (0.6) (0.1) (0.4) (0.2)
Net income 7.2 3.4 (12.8) (0.9) (9.4)
Reported EBITDA 17.3 15.8 2.1 2.4 (5.8)
Adjustments - - - - -
Adjusted EBTIDA 17.3 15.8 2.1 2.4 (5.8)

Zur Rose Group
Balance Sheet Zur Rose Group
39
2014 2015 2016 Q1 2016 Q1 2017
CHFm 31-Dec 31-Dec 31-Dec 31-Mar 31-Mar
Cash and cash equivalents 21.1 25.1 25.2 23.2 24.8
Short-term financial assets 0.4 0.4 0.2 0.4 0.2
Trade receivables 80.5 72.5 71.4 70.2 72.5
Other receivables & prepaid expenses 7.1 9.5 14.6 11.3 20.7
Inventories 36.1 34.8 48.3 43.8 45.6
Current assets 145.2 142.3 159.6 149.0 163.6
Property, plant & equipment 23.6 26.2 26.2 26.1 26.1
Intangible assets 50.3 53.7 63.1 54.0 63.8
Other assets(1) 9.1 11.2 12.5 16.5 12.8
Non-current assets 83.0 91.1 101.9 96.6 102.6
Total assets 228.1 233.4 261.5 245.6 266.2
Short-term financial liabilities 0.5 0.5 50.0 3.4 52.0
Trade payables 63.3 72.2 70.7 76.1 75.8
Other payables & accrued expenses(2) 20.2 16.0 17.5 20.4 20.8
Current liabilities 84.1 88.7 138.2 100.0 148.6
Long-term financial liabilities 57.8 62.3 9.1 62.1 11.5
Pension liabilities 7.3 8.1 8.9 8.3 9.6
Deferred taxes 1.6 1.6 1.5 1.6 1.5
Non-current liabilities 66.7 72.0 19.5 72.0 22.6
Equity 77.4 72.8 103.8 73.6 95.1
Total equity and liabilities 228.1 233.4 261.5 245.6 266.2
Note: 1 Includes investments in associates and JVs, long-term financial investments and deferred tax assets | 2 Includes other payables, tax payables, accrued expenses and short-term provisions

Zur Rose Group
Cash Flow Statement Zur Rose Group
40
2014 2015 2016 Q1 2016 Q1 2017
CHFm 31-Dec 31-Dec 31-Dec 31-Mar 31-Mar
Net income 7.2 3.4 (12.8) (0.9) (9.4)
D&A 9.1 7.4 9.2 2.3 2.6
Non-cash items financial result 0.2 0.2 2.1 (0.2) 0.1
Cash income taxes paid (3.1) 0.5 (0.2) 0.3 0.1
Non cash-effective expenses and income 0.5 0.1 2.8 0.8 1.5
Change in trade receivables, other receivables and accrued expenses
(3.9) (2.0) (4.9) 1.0 (7.2)
Change in inventories (1.7) (0.9) (13.8) (9.0) 2.7
Change in trade payables 0.7 10.4 3.7 7.9 10.2
Change in provisions (1.8) (0.1) (0.1) (0.1) (0.0)
Cash flow from operating activities 7.2 18.9 (13.8) 2.3 0.5
Increase in investments in associates and joint ventures
(0.2) (0.9) (2.2) (2.2) -
Investment in property, plant and equipment (7.0) (5.9) (3.0) (0.0) (0.3)
Investments in intangible assets (8.9) (9.3) (16.9) (5.4) (4.4)
Provision / (repayments) of financial investments 0.0 (0.3) (1.0) (0.6) (0.5)
Cash flow from investing activities (16.0) (16.4) (23.1) (8.2) (5.2)
Inflow from capital increases - - 42.8 1.0 0.5
Increase / (decrease) in financial liabilities (0.5) 4.4 (3.9) 3.1 4.3
Sale / (purchase) of treasury shares (0.6) 0.0 (0.2) - (0.4)
Dividends paid - (1.9) (1.6) - -
Cash flow from financing activities (1.1) 2.5 37.0 4.1 4.4
Total cash flow (9.8) 5.0 0.1 (1.8) (0.3)
Fx differences (0.2) (1.0) 0.0 0.1 (0.1)

Zur Rose Group
Prof. Stefan Feuerstein
Chairman of the Board
— Member since 2010 and Chairman since 2011 — Chairman of the BoP of the UNIMO-Gerstner Group — Executive Director and CEO of Markant AG until 2010
Walter Oberhänsli
Executive member of the Board
— Founder and Group CEO — Chairman of the Board of Zur Rose Group AG (1996–2011) — Delegate of the Board since 2011
Dr. Thomas Schneider
Vice Chairman of the Board
— Member since 1995 — Specialist (FMH) in general medicine — Member of the Medical Ethics Board of the Thurgau Medical
Society in 2009
Prof. Dr. Volker Amelung
Non-executive member of the Board
— Member since 2010 — Specialist Professor of International Health Systems Research at
Hannover Medical School since 2001
Vanessa Frey
Non-executive member of the Board
— Member since 2016 — CEO and Director of Corisol Holding Ltd. since 2007
Dr. Lukas Wagner
Non-executive member of the Board
— Member since 1996 — Specialist (FMH) in general medicine — President of the Baselland Medical Society (2002–2010) — Will resign from the Board in 2018 due to retirement
Dr. Heinz O. Baumgartner
Non-executive member to the Board
— Member since 2017 — CEO of Schweiter Technologies AG since 2008
41
Board of Directors Shareholder structure1
KWE Beteiligungen AG
20.8%
Matterhorn Pharma Holding
5.8%
Board / Management
7.6%
>2,000 physicians &
other free float 65.8%
Key developments in shareholder register
— Oct/Nov-2016: KWE Beteiligungen (100% subsidiary of Corisol) built a 20.8% stake through two consecutive capital increases
— Jan-2017: Matterhorn Pharma Holding (100% subsidiary of Al Faisaliah Group) acquires 5.8% stake through public offer
— Close cooperation with physicians since foundation in 1993, many of which form part of free float (>2,000 physicians)
Board of Directors and shareholder structure
Source: 1 Shareholdings based on annual report 2016

Zur Rose Group 42
This presentation (the "Presentation") has been prepared by Zur Rose Group AG ("Zur Rose" and together with its subsidiaries, "we", "us" or the "Group") solely for informational purposes and has not been independently verified and no representation or warranty, express or implied, is made or given by or on behalf of any of the Group. Zur Rose reserves the right to amend or replace the Presentation at any time, and undertakes no obligation to provide the recipients with access to any additional information. Zur Rose shall not be obligated to update or correct the information set forth in the Presentation or to provide any additional information. Nothing in this Presentation is, or should be relied upon as, a promise or representation as to the future.
Certain statements in this Presentation are forward-looking statements. By their nature, forward-looking statements involve a number of risks, uncertainties and assumptions that could cause actual results or events to differ materially from those expressed or implied by the forward-looking statements. These risks, uncertainties and assumptions could adversely affect the outcome and financial consequences of the plans and events described herein. Actual results may differ from those set forth in the forward-looking statements as a result of various factors (including, but not limited to, future global economic conditions, changed market conditions, intense competition in the markets in which the Group operates, costs of compliance with applicable laws, regulations and standards, diverse political, legal, economic and other conditions affecting the Group’s markets, and other factors beyond the control of the Group). Neither Zur Rose nor any of its respective directors, officers, employees, advisors, or any other person is under any obligation to update or revise any forward-looking statements, whether as a result of new information, future events or otherwise. You should not place undue reliance on forward-looking statements, which speak of the date of this Presentation. Statements contained in this Presentation regarding past trends or events should not be taken as a representation that such trends or events will continue in the future.
This Presentation does not constitute or form part of, and should not be construed as, an offer or invitation or inducement to subscribe for, underwrite or otherwise acquire, any securities of Zur Rose, nor should it or any part of it form the basis of, or be relied on in connection with, any contract to purchase or subscribe for any securities of the Group, nor shall it or any part of it form the basis of, or be relied on in connection with, any contract or commitment whatsoever. This Presentation is not a prospectus and is being made available to you solely for your information and background and is not to be used as a basis for an investment decision in securities of Zur Rose or the Group.
Disclaimer


![[PPT]EUROMONITOR CAPABILITIES - TIKZN · Web viewA presentation compiled by Euromonitor Internationalfor Export week KZN. October 2017. About Euromonitor. ABOUT EUROMONITOR INTERNATIONAL.](https://static.fdocuments.us/doc/165x107/5b2684ad7f8b9a53228b465d/ppteuromonitor-capabilities-web-viewa-presentation-compiled-by-euromonitor.jpg)