Zero Carbon Latin America - A pathway for net ... · Table 0.6 Comparison of BAU, GEA MIX and zero...
113
General rights Copyright and moral rights for the publications made accessible in the public portal are retained by the authors and/or other copyright owners and it is a condition of accessing publications that users recognise and abide by the legal requirements associated with these rights. Users may download and print one copy of any publication from the public portal for the purpose of private study or research. You may not further distribute the material or use it for any profit-making activity or commercial gain You may freely distribute the URL identifying the publication in the public portal If you believe that this document breaches copyright please contact us providing details, and we will remove access to the work immediately and investigate your claim. Downloaded from orbit.dtu.dk on: Aug 22, 2019 Zero Carbon Latin America - A pathway for net decarbonisation of the regional economy by mid-century Vision paper Vergara, Walter; Fenhann, Jørgen Villy; Schletz, Marco Christian Publication date: 2015 Document Version Publisher's PDF, also known as Version of record Link back to DTU Orbit Citation (APA): Vergara, W., Fenhann, J. V., & Schletz, M. C. (2015). Zero Carbon Latin America - A pathway for net decarbonisation of the regional economy by mid-century: Vision paper. Copenhagen: UNEP DTU Partnership.
Transcript of Zero Carbon Latin America - A pathway for net ... · Table 0.6 Comparison of BAU, GEA MIX and zero...
General rights Copyright and moral rights for the publications made accessible in the public portal are retained by the authors and/or other copyright owners and it is a condition of accessing publications that users recognise and abide by the legal requirements associated with these rights.
Users may download and print one copy of any publication from the public portal for the purpose of private study or research.
You may not further distribute the material or use it for any profit-making activity or commercial gain
You may freely distribute the URL identifying the publication in the public portal If you believe that this document breaches copyright please contact us providing details, and we will remove access to the work immediately and investigate your claim.
Downloaded from orbit.dtu.dk on: Aug 22, 2019
Zero Carbon Latin America - A pathway for net decarbonisation of the regionaleconomy by mid-centuryVision paper
Vergara, Walter; Fenhann, Jørgen Villy; Schletz, Marco Christian
Publication date:2015
Document VersionPublisher's PDF, also known as Version of record
Link back to DTU Orbit
Citation (APA):Vergara, W., Fenhann, J. V., & Schletz, M. C. (2015). Zero Carbon Latin America - A pathway for netdecarbonisation of the regional economy by mid-century: Vision paper. Copenhagen: UNEP DTU Partnership.
AUTHORS: Walter VergaraJoergen V FenhannMarco C Schletz
A PATHWAY FOR NET DECARBONISATION OF THE REGIONAL ECONOMY BY MID-CENTURY
ZERO CARBON LATIN AMERICA
VISION PAPER

ZERO CARBON LATIN AMERICA
A PATHWAY FOR NET DECARBONISATION OF THE REGIONAL ECONOMY BY MID-CENTURY
VISION PAPER
AUTHORS: Walter VergaraJoergen V FenhannMarco C Schletz
NOVEMBER 2015
Zero Carbon Latin AmericaA Pathway for Net Decarbonisation of the Regional Economy by Mid-centuryVision Paper
Walter Vergara, Joergen V Fenhann, Marco C Schletz
UNEP DTU PARTNERSHIPNovember 2015ISBN 978-87-93130-68-5
This publication may be reproduced in whole or in part and in any form for educational or non-profit purposes without special permission from the copyright holder, provided acknowledgement of the source is made. UNEP DTU Partnership would appreciate receiving a copy of any publication that uses this publication as a source. No use of this publication may be made for resale or for any other commercial purpose whatsoever without prior permission in writing from the UNEP DTU Partnership.
DisclaimerThe designations employed and the presentation of the material in this publication do not imply the expression of any opinion whatsoever on the part of the UNEP DTU Partnership concerning the legal status of any country, territory, city or area or of its authorities, or concerning delimitation of its frontiers or boundaries. Moreover, the views expressed do not necessarily represent the decision or the stated policy of the UNEP DTU Partnership, nor does citing of trade names or commercial processes constitute endorsement.
Photo creditsAction Network (cover); Carl Berger (page 6); Carla Wosniak (page ix); CIFOR (page xvi, 42, 47, 68 and cover); Danielle Pereira (page 11); kris krüg (page 56); Lang (cover); Stefan Schmidt (page 61); mariordo59 (page 24); Oscar Amaya (cover); spinster cardigan (page 62); The Danish Wind Industry Association (page 17)
Graphic design and layout: Kowsky, [email protected]
TABLE OF CONTENTS
Figures ...................................................................................................................................................................................................... v Tables .....................................................................................................................................................................................................vi Abbreviations ...................................................................................................................................................................................... vii Acknowledgements ............................................................................................................................................................................ix Foreword .................................................................................................................................................................................................. x Executive summary .......................................................................................................................................................................... xii
1 BACKGROUND AND RATIONALE ........................................................................................................................................... 1 1.1 Background ................................................................................................................................................................................ 1 1.2 Rationale .................................................................................................................................................................................... 2 1.3 Data sources .............................................................................................................................................................................. 5
2 DECARBONISATION OF POWER GENERATION ........................................................................................................... 7 2.1 Current situation ...................................................................................................................................................................... 7 2.2 Resource endowment .............................................................................................................................................................10 2.3 Market size for renewables is increasing ..........................................................................................................................12 2.4 Evolution of regulatory frameworks ..................................................................................................................................12 2.5 Renewable energy targets ....................................................................................................................................................14 2.6 Grid modernization and integration .................................................................................................................................15 2.7 Distributed power ..................................................................................................................................................................17 2.8 Hydropower reservoirs as a regional storage facility ....................................................................................................18 2.9 The economics of renewable energy generation ..............................................................................................................18
3 MASS ELECTRIFICATION OF THE TRANSPORT SECTOR ....................................................................................25 3.1 Current situation ....................................................................................................................................................................25 3.2 Characterization of the road segment of the transport sector ......................................................................................26 3.3 The impact of transport operations on air quality ..........................................................................................................35 3.4 Mass electrification of transport .........................................................................................................................................35 3.5 Levelized cost of electric transport ......................................................................................................................................38
4 LAND: FROM CARBON SOURCE TO CARBON SINK ...............................................................................................43 4.1 Current situation ....................................................................................................................................................................43 4.2 Avoided deforestation ............................................................................................................................................................43 4.3 Reforestation and land restoration .....................................................................................................................................46 4.4 Economic benefits of reforestation and restoration efforts .............................................................................................50 4.5 Low-carbon agriculture ........................................................................................................................................................52 4.6 Summary of potential measures in land use ....................................................................................................................55
5 DECARBONISATION OF INDUSTRY ...................................................................................................................................57 5.1 Current situation ....................................................................................................................................................................57 5.2 Pathway analysis to assess potential emissions reductions from industry ...............................................................58
iv
6 A ROUTE TO ZERO-CARBON EMISSIONS......................................................................................................................63 6.1 The pathway to decarbonisation of the power sector .....................................................................................................63 6.2 The route to electrification of the transport sector ...........................................................................................................64 6.3 Land use and land-use change from source to sink .........................................................................................................66 6.4 Decarbonisation of industry ................................................................................................................................................66 6.5 Projected rate of decarbonisation ........................................................................................................................................66
7 CONCLUSIONS .................................................................................................................................................................................69
REFERENCES ..............................................................................................................................................................................................72
ANNEXES ....................................................................................................................................................................................................82 Annex I Description of IIASA’s BAU (GEA-BAU) and GEA-Mix Scenarios ..................................................................83 Annex II Hydropower plants in Latin America .................................................................................................................85 Annex III Description of the GACMO Model .............................................................................................................................86 Annex I Assumptions used in the estimate of transport costs ..............................................................................................87 Annex V Estimate of N2O and CH4 abatement emissions from agriculture through
nutrient management ...................................................................................................................................................89 Annex VI Industry pathway analysis .........................................................................................................................................90 Annex VII Comparison of BAU, GEA MIX and Zero carbon pathway ...............................................................................91
v
FIGURES
Figure 1.1 Likely relationship between cumulative CO2 emissions and temperature change relative to 1861-1880............................................................................................................................................................ 1
Figure 1.2 Available carbon budget in order to remain within a 2°C temperature anomaly. ...................................... 2Figure 1.3 Per capita emissions in different regions and large countries. ............................................................................ 3Figure 2.1 Projected demand for electricity under IIASAs BAU and GEA mix scenarios. ............................................. 7Figure 2.2 Historical and projected GHG emissions from the power sector. ..................................................................... 8Figure 2.3 Historical total power generation by source from 1971 to 2014 (in PWh/year). ......................................... 9Figure 2.4 Estimated resource endowment from renewables in Latin America. ............................................................10Figure 2.5 Recent evolution of generating costs by renewable energy installations
IRENA renewable energy database (in US$/kWh). ...............................................................................................19Figure 2.6 Estimated levelized costs of generation (LCOE) through renewables in LAC. ...........................................20Figure 2.7 Estimated learning curves for renewables expressed in projected LCOEs. ..................................................21Figure 3.1 Projected energy use in the transport sector. ...........................................................................................................25Figure 3.2 Historical and projected emissions from the transport sector. .........................................................................26Figure 3.3 CO2 emissions from the transport sector in LAC in 2010 (in MtCO2e). ........................................................27Figure 3.4 Modal share of transport (in passenger trips) in urban areas. ...........................................................................28Figure 3.5 Evolution of motorization rates in the region (vehicles per 1000 inhabitants). ........................................29Figure 3.6 Aggregate vehicle-miles travelled in the US under scenarios of future travel growth, 1946-2040.....30Figure 3.7 Modal composition of freight transport in selected countries in LAC. .........................................................32Figure 3.8 The growth of railroad transport in the region. ......................................................................................................33Figure 3.9 Type of fuels used in LAC transport sector in 2013. ..............................................................................................34Figure 3.10 Evolution and projected costs of lithium-ion batteries. ......................................................................................36Figure 3.11 Current (2012) levelized cost of alternative transport drive options. ............................................................38Figure 3.12 Projected learning curves for electric vehicle options. ........................................................................................39Figure 3.13 Projected learning curves for electric vehicle options with credit for avoided cost of air pollution. 39Figure 3.14 Estimated power demand by an electrified transport sector. ............................................................................40Figure 3.15 Energy savings from full transport electrification. ...............................................................................................40Figure 4.1 Historical and projected IIASA GHG land use, land-use change emissions
and agricultural emissions ..............................................................................................................................................44Figure 4.2 Historical deforestation in the Amazon region of Brazil. ...................................................................................44Figure 4.3 Estimated 2012 GHG emissions from agriculture/forestry (in GtCO2e/year). ............................................52Figure 5.1 Projected energy use by Industry. .................................................................................................................................57Figure 5.2 Historical and projected industry emissions. ..........................................................................................................58Figure 6.1 Decarbonization of the power sector. .........................................................................................................................64Figure 6.2 Decarbonization of the transport sector. ...................................................................................................................65
vi
TABLES
Table 1.1 Composition and recent evolution of LAC’s carbon footprint. .......................................................................... 4Table 2.1 Carbon intensity of power sectors. ................................................................................................................................ 8Table 2.2 Recent additions of non-hydro renewables in selected countries (in GW). ................................................... 9Table 2.3 Irradiance in selected solar hot spots. .........................................................................................................................11Table 2.4 Summary of renewable energy policies in Latin America. ................................................................................13Table 2.5 Current status and established targets for entry of renewable sources for electricity generation. ....15Table 2.6 List of grid interconnection projects as of mid-2015. ...........................................................................................16Table 3.1 Estimated size and emissions from the domestic road fleet in Latin America. ..........................................27Table 3.2 Motorization rates in selected cities in the region (cars per inhabitant). .....................................................31Table 3.3 Cost effectiveness of different modes of mass transport in urban areas (example of Bogotá). ............31Table 3.4 Prospective transformation of transport fleet. ........................................................................................................36Table 4.1 The deforestation picture in the region (in Mha). .................................................................................................45Table 4.2 Estimates of the cost of avoiding deforestation. .....................................................................................................47Table 4.3 Restoration opportunities in LAC. ...............................................................................................................................47Table 4.4 Carbon sinks in tropical forests (Amazon region) in Latin America. ............................................................48Table 4.5 Some net carbon storage rates in land restoration systems (in tC/ha-year). ...............................................49Table 4.6 Options that have been proposed to provide for net reductions in GHG emissions
from agriculture through nutrient management. .................................................................................................53Table 4.7 Some schemes for the abatement of methane in bovine livestock in Argentina. .....................................54Table 4.8 Potential carbon storage/abatement rates through reforestation and restoration
and sustainable agriculture efforts. .............................................................................................................................54Table 4.9 Summary of the economic potential of land-use change and GHG abatement measures
in Latin America. .................................................................................................................................................................55Table 5.1 Results of analysis to estimate GHG reductions in industry. .............................................................................59Table 5.2 Potential for industrial energy savings. ......................................................................................................................60Table 6.1 Projected decarbonisation route for the power sector..........................................................................................63Table 6.2 Projected decarbonisation route for the transport sector. ..................................................................................65Table 6.3 Synergies between technologies supportive of low carbon power and transport. ...................................66Table 6.4 Projected land use and land-use change carbon sink/abatement route for LAC
in reference to IIASA-BAU. ..............................................................................................................................................67Table 6.5 GHG emissions under BAU and projected decarbonisation pathway in 2050. ..........................................67Table 7.1 Summary of measures reviewed as part of the pathway to net zero carbon in Latin America. ...........70Table 0.1 List of hydropower plants in LAC with a capacity >1000MW/1GW. .............................................................85Table 0.2 Projected vehicle costs. .....................................................................................................................................................87Table 0.3 Projected electricity costs for purposes of estimating electric vehicle operation costs. .........................87Table 0.4 Estimated of avoided costs of air pollution through the operation of electric vehicles displacing
gasoline and diesel vehicles. ...........................................................................................................................................88Table 0.5 Estimate of N2O and CH4 abatement emissions from agriculture through nutrient management. ......89Table 0.6 Comparison of BAU, GEA MIX and zero carbon pathway. .................................................................................91
vii
ABBREVIATIONS
AFOLU Agriculture, Forestry and Other Land UseAFS Agro-forestry SystemAFSP Food security premiumsAP Agricultural outputBAU Business as UsualBRT Bus Rapid Transit SystemC Carboncm CentimetreCO Carbon monoxideCO2 Carbon dioxideCO2e Carbon dioxide equivalentCOP 21 21th Conference of the Parties, Paris 2015CRF Controlled Release FertilizersCSP Concentrated Solar PowerEJ ExajouleENSO El Niño-Southern OscillationE&M Establishment and MaintenanceEU European UnionFITs Feed-in tariffsG7 Group of 7GACMO Greenhouse Gas Abatement Cost ModelGDP Gross Domestic ProductGHG Greenhouse gasGtC Giga-tons of CarbonGtCO2e Giga-tons of Carbon dioxide equivalentGW Gigawattha HectareIPCC Intergovernmental Panel on Climate
ChangekWh Kilowatt hourLAC Latin American and the Caribbean,
Mexico
LCOEs Levelized Costs of Electricity generatedLULUCF Land Use, Land-Use Change and Forestrymn MillionMW MegawattMWh Megawatt hourN2O Nitrous OxideNOx Mono-nitrogen oxidesNPVs Net Present ValueNWFP Non-wood forest productsPMs Particulate Matterppm Parts per millionPPP Purchase Power ParityPV PhotovoltaicPWh Petawatt hourRPS Renewable portfolio standardss Secondsolar PV Solar photovoltaict TontCO2e Tons of Carbon dioxide equivalenttpc Tons per capitaTW TerawattTWh Terawatt hourUN United NationsUNFCCC United Nations Framework
Convention on Climate ChangeUS United States of AmericaUS$ United States DollarVOCs Volatile Organic CompoundsWh Watt-hour WFP Wood Forest ProductsWRI World Resources Institute

viii
POPE FRANCIS IN ENCYCLICAL LETTER ‘LAUDATO SI’
“ Leaving an inhabitable planet to future
generations is, first and foremost, up to us.”
ix
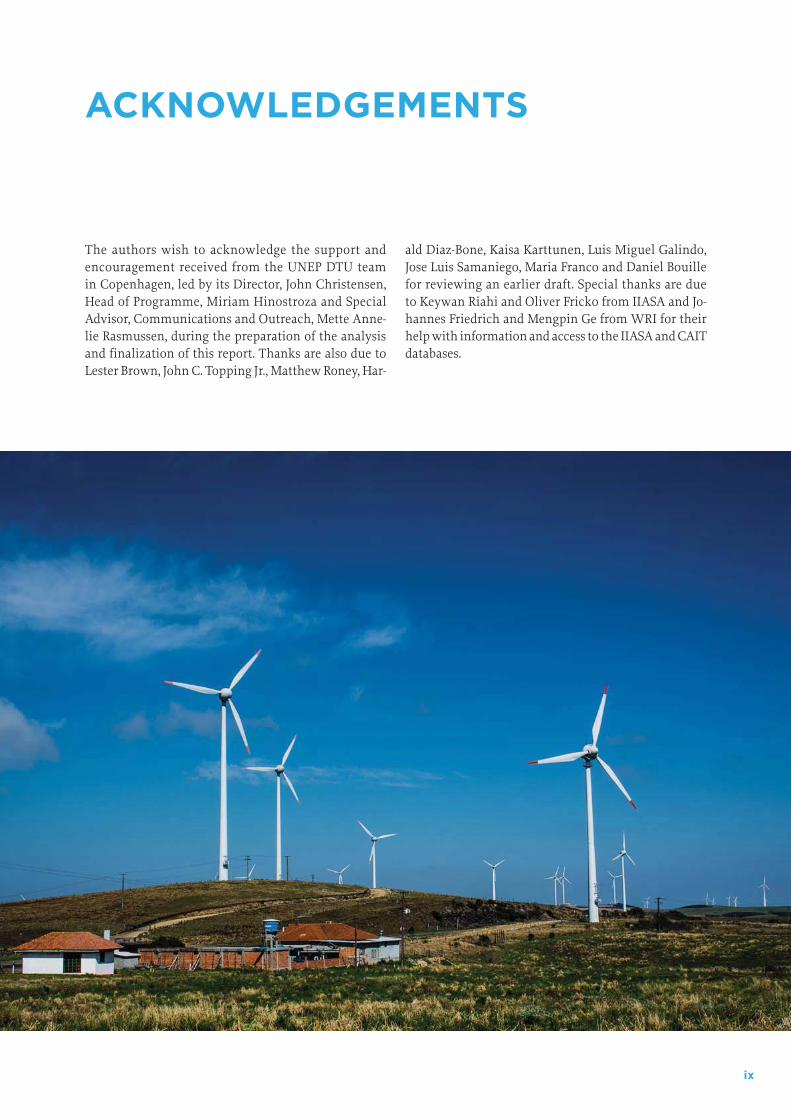
ACKNOWLEDGEMENTS
The authors wish to acknowledge the support and encouragement received from the UNEP DTU team in Copenhagen, led by its Director, John Christensen, Head of Programme, Miriam Hinostroza and Special Advisor, Communications and Outreach, Mette Anne-lie Rasmussen, during the preparation of the analysis and finalization of this report. Thanks are also due to Lester Brown, John C. Topping Jr., Matthew Roney, Har-
ald Diaz-Bone, Kaisa Karttunen, Luis Miguel Galindo, Jose Luis Samaniego, Maria Franco and Daniel Bouille for reviewing an earlier draft. Special thanks are due to Keywan Riahi and Oliver Fricko from IIASA and Jo-hannes Friedrich and Mengpin Ge from WRI for their help with information and access to the IIASA and CAIT databases.
x
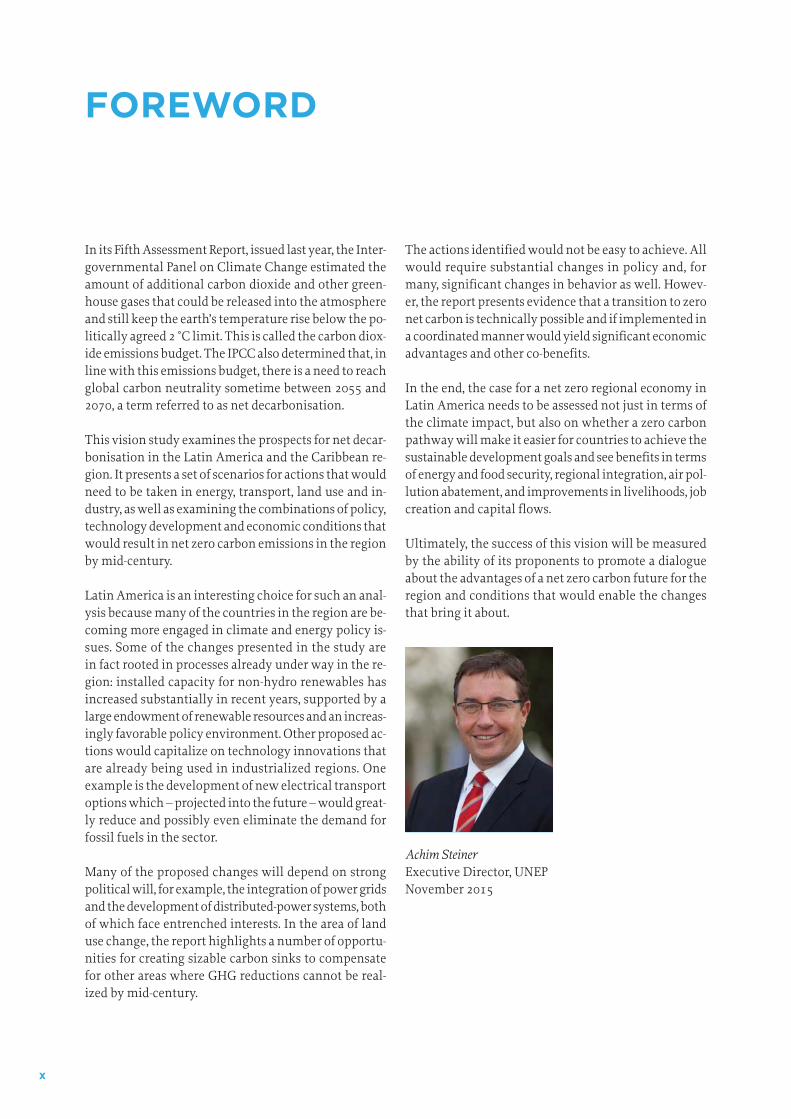
FOREWORD
In its Fifth Assessment Report, issued last year, the Inter-governmental Panel on Climate Change estimated the amount of additional carbon dioxide and other green-house gases that could be released into the atmosphere and still keep the earth’s temperature rise below the po-litically agreed 2 °C limit. This is called the carbon diox-ide emissions budget. The IPCC also determined that, in line with this emissions budget, there is a need to reach global carbon neutrality sometime between 2055 and 2070, a term referred to as net decarbonisation.
This vision study examines the prospects for net decar-bonisation in the Latin America and the Caribbean re-gion. It presents a set of scenarios for actions that would need to be taken in energy, transport, land use and in-dustry, as well as examining the combinations of policy, technology development and economic conditions that would result in net zero carbon emissions in the region by mid-century.
Latin America is an interesting choice for such an anal-ysis because many of the countries in the region are be-coming more engaged in climate and energy policy is-sues. Some of the changes presented in the study are in fact rooted in processes already under way in the re-gion: installed capacity for non-hydro renewables has increased substantially in recent years, supported by a large endowment of renewable resources and an increas-ingly favorable policy environment. Other proposed ac-tions would capitalize on technology innovations that are already being used in industrialized regions. One example is the development of new electrical transport options which – projected into the future – would great-ly reduce and possibly even eliminate the demand for fossil fuels in the sector.
Many of the proposed changes will depend on strong political will, for example, the integration of power grids and the development of distributed-power systems, both of which face entrenched interests. In the area of land use change, the report highlights a number of opportu-nities for creating sizable carbon sinks to compensate for other areas where GHG reductions cannot be real-ized by mid-century.
The actions identified would not be easy to achieve. All would require substantial changes in policy and, for many, significant changes in behavior as well. Howev-er, the report presents evidence that a transition to zero net carbon is technically possible and if implemented in a coordinated manner would yield significant economic advantages and other co-benefits.
In the end, the case for a net zero regional economy in Latin America needs to be assessed not just in terms of the climate impact, but also on whether a zero carbon pathway will make it easier for countries to achieve the sustainable development goals and see benefits in terms of energy and food security, regional integration, air pol-lution abatement, and improvements in livelihoods, job creation and capital flows.
Ultimately, the success of this vision will be measured by the ability of its proponents to promote a dialogue about the advantages of a net zero carbon future for the region and conditions that would enable the changes that bring it about.
Achim Steiner
Executive Director, UNEPNovember 2015
xi
PROLOGUE
We have reached a point where a serious debate is need-ed, at a regional level, on the ability and consequences of efforts to eliminate the carbon footprint from our econ-omies, to decarbonize our societies. We welcome this report which concludes that there is a pathway toward zero carbon emissions for the region that offers “more of an opportunity and less of a burden”. This translates in some very good news: i.e. that countries embarking on a zero carbon strategy and using it as a platform for development can result in substantial co-benefits.
Costa Rica, as well as, other countries in the region are already moving in this direction. We recently presented an ambitious INDC which sets out our long term goals towards Carbon Neutrality. It is our belief that such a direction will benefit not only our common future but also bring in benefits in energy and food security, im-
provements in terms of trade and reduce exposures to harmful pollutants. It also provides us with avenues to facilitate the achievement of the sustainable develop-ment goals, recently endorsed by the United Nations.
We know this is not an easy path, in particular as it will require addressing obsolete policies, financial obstacles and behaviors; but, it is the path that needs to be fol-lowed. It is our hope that this document will facilitate a healthy discussion around the concept and even more importantly, ambitious climate action in the coming decades by all countries of the world, large and small, developed and developing.
Dr. Edgar Gutierrez Espeleta
Minister of Environment and EnergyCOSTA RICA
xii
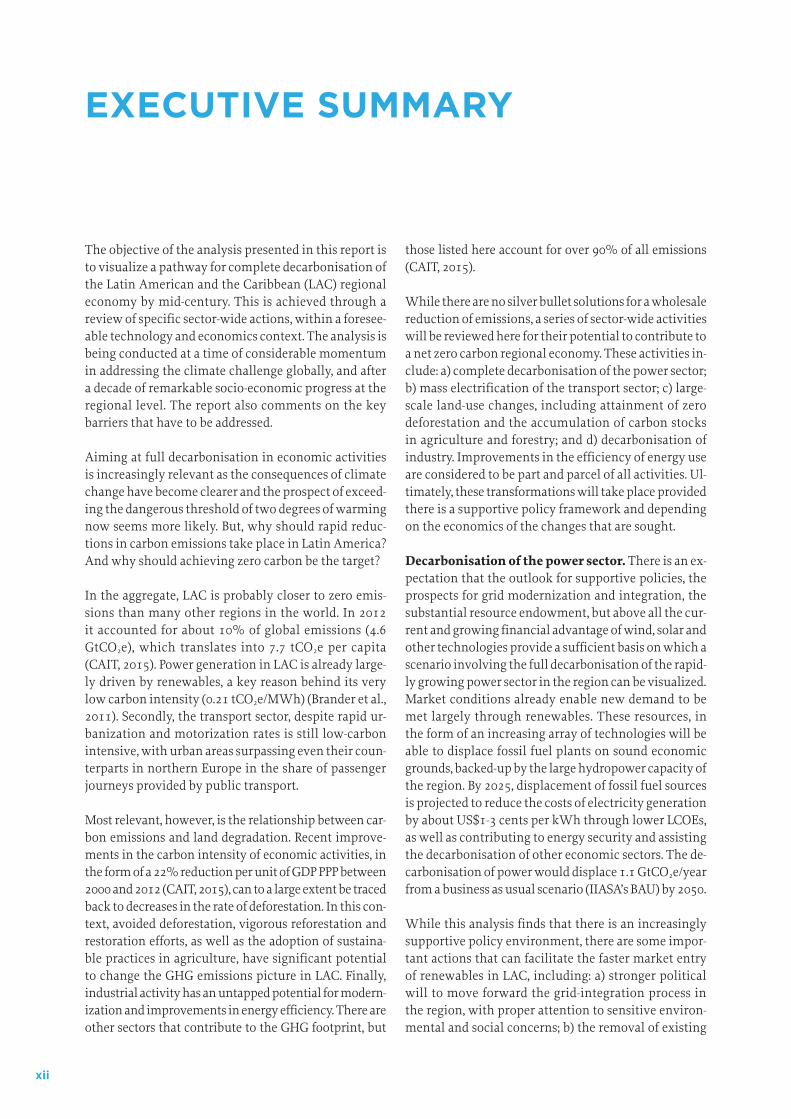
EXECUTIVE SUMMARY
The objective of the analysis presented in this report is to visualize a pathway for complete decarbonisation of the Latin American and the Caribbean (LAC) regional economy by mid-century. This is achieved through a review of specific sector-wide actions, within a foresee-able technology and economics context. The analysis is being conducted at a time of considerable momentum in addressing the climate challenge globally, and after a decade of remarkable socio-economic progress at the regional level. The report also comments on the key barriers that have to be addressed.
Aiming at full decarbonisation in economic activities is increasingly relevant as the consequences of climate change have become clearer and the prospect of exceed-ing the dangerous threshold of two degrees of warming now seems more likely. But, why should rapid reduc-tions in carbon emissions take place in Latin America? And why should achieving zero carbon be the target?
In the aggregate, LAC is probably closer to zero emis-sions than many other regions in the world. In 2012 it accounted for about 10% of global emissions (4.6 GtCO2e), which translates into 7.7 tCO2e per capita (CAIT, 2015). Power generation in LAC is already large-ly driven by renewables, a key reason behind its very low carbon intensity (0.21 tCO2e/MWh) (Brander et al., 2011). Secondly, the transport sector, despite rapid ur-banization and motorization rates is still low-carbon intensive, with urban areas surpassing even their coun-terparts in northern Europe in the share of passenger journeys provided by public transport.
Most relevant, however, is the relationship between car-bon emissions and land degradation. Recent improve-ments in the carbon intensity of economic activities, in the form of a 22% reduction per unit of GDP PPP between 2000 and 2012 (CAIT, 2015), can to a large extent be traced back to decreases in the rate of deforestation. In this con-text, avoided deforestation, vigorous reforestation and restoration efforts, as well as the adoption of sustaina-ble practices in agriculture, have significant potential to change the GHG emissions picture in LAC. Finally, industrial activity has an untapped potential for modern-ization and improvements in energy efficiency. There are other sectors that contribute to the GHG footprint, but
those listed here account for over 90% of all emissions (CAIT, 2015).
While there are no silver bullet solutions for a wholesale reduction of emissions, a series of sector-wide activities will be reviewed here for their potential to contribute to a net zero carbon regional economy. These activities in-clude: a) complete decarbonisation of the power sector; b) mass electrification of the transport sector; c) large-scale land-use changes, including attainment of zero deforestation and the accumulation of carbon stocks in agriculture and forestry; and d) decarbonisation of industry. Improvements in the efficiency of energy use are considered to be part and parcel of all activities. Ul-timately, these transformations will take place provided there is a supportive policy framework and depending on the economics of the changes that are sought.
Decarbonisation of the power sector. There is an ex-pectation that the outlook for supportive policies, the prospects for grid modernization and integration, the substantial resource endowment, but above all the cur-rent and growing financial advantage of wind, solar and other technologies provide a sufficient basis on which a scenario involving the full decarbonisation of the rapid-ly growing power sector in the region can be visualized. Market conditions already enable new demand to be met largely through renewables. These resources, in the form of an increasing array of technologies will be able to displace fossil fuel plants on sound economic grounds, backed-up by the large hydropower capacity of the region. By 2025, displacement of fossil fuel sources is projected to reduce the costs of electricity generation by about US$1-3 cents per kWh through lower LCOEs, as well as contributing to energy security and assisting the decarbonisation of other economic sectors. The de-carbonisation of power would displace 1.1 GtCO2e/year from a business as usual scenario (IIASA’s BAU) by 2050.
While this analysis finds that there is an increasingly supportive policy environment, there are some impor-tant actions that can facilitate the faster market entry of renewables in LAC, including: a) stronger political will to move forward the grid-integration process in the region, with proper attention to sensitive environ-mental and social concerns; b) the removal of existing
xiii
EXECUTIVE SUMMARY
fossil fuel subsidies, in particular for coal and gas, which constitute an important obstacle to the market entry of alternatives; and c) wider adoption of rules to allow for distributed power systems, which could accelerate the deployment of household and commercial solar installations.
Mass electrification of the transport sector. On the basis of the projected gains in the efficiency and densi-ty of energy storage in vehicles; the estimated drop in electricity prices resulting from the wholesale entry of renewables; and, projections for substantial reductions over time in the cost of electric vehicles, this option is forecast to gain in competitiveness and to surpass the financial competitiveness of fossil-fuel alternatives well before 2050. The report echoes recent announcements on the potentially disruptive character of electric vehi-cle technologies within a few years, but it also empha-sizes the customization required to meet the demand characteristics of the region, including the emphasis on mass transport vehicles. If allowances are made for the avoided costs of air pollution, the economic argument for the shift to electric propulsion is further strength-ened. The relatively large avoided cost enables the elec-tric versions to become competitive with the fossil fuel options by 2025. The shift to electric propulsion in the sector will also by itself result in very significant energy savings (about 11 EJ by 2050; see Figure 3.15), in the potential creation of whole industrial segments and in important impacts on urban air quality and economic integration. Decarbonisation of transport would result in the displacement of about 1.4 GtCO2e per year from the BAU scenario by 2050.
The technology and economic momentum for a shift to electric power in transport may ultimately provoke a major transformation of transport technologies glob-ally. However, in the shorter term and in the context of Latin America, this shift faces significant barriers that need to be addressed. These include: a) fossil fuel sub-sidies (calculated at about 1% of GDP in 2013), which continue to promote their use and delay the adoption of alternative power sources in transport; b) the lack of internalization of health and other environmental benefits associated with the displacement of diesel and other fuels, which delays the adoption of cleaner op-tions; and c) the capital value and associated jobs and enterprises linked to the refining and distribution of fossil fuels, which would be displaced by the electric vehicles.
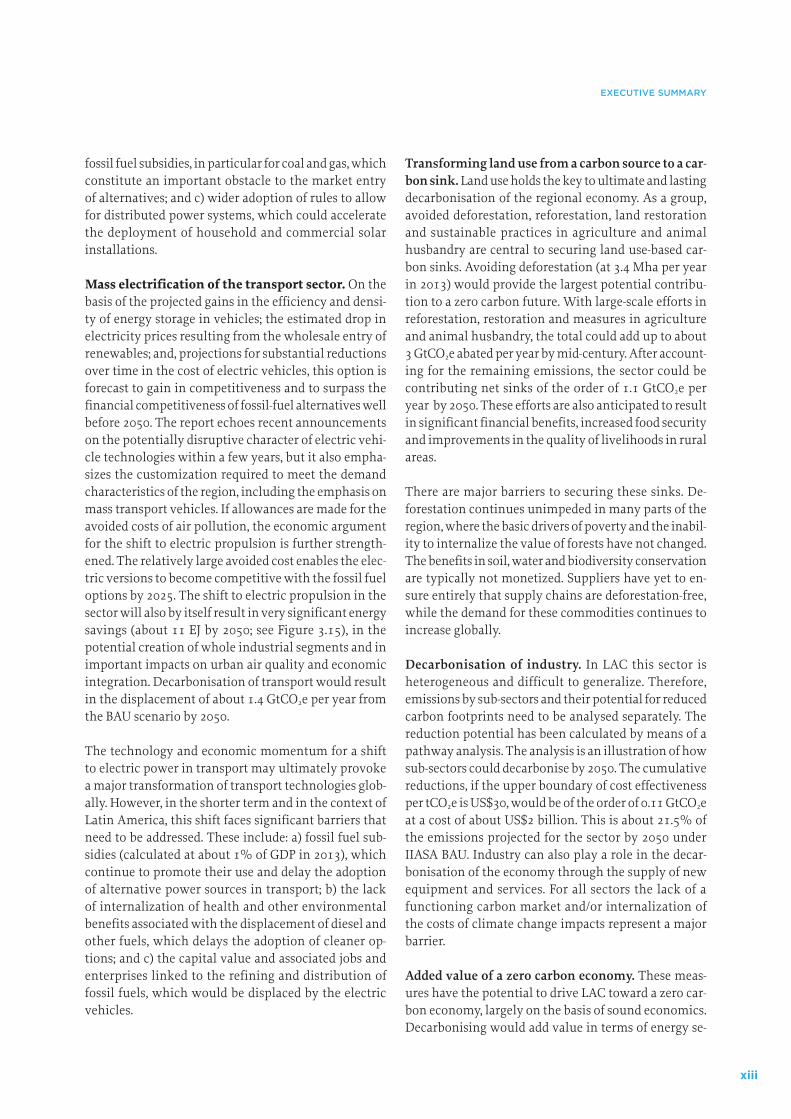
Transforming land use from a carbon source to a car-bon sink. Land use holds the key to ultimate and lasting decarbonisation of the regional economy. As a group, avoided deforestation, reforestation, land restoration and sustainable practices in agriculture and animal husbandry are central to securing land use-based car-bon sinks. Avoiding deforestation (at 3.4 Mha per year in 2013) would provide the largest potential contribu-tion to a zero carbon future. With large-scale efforts in reforestation, restoration and measures in agriculture and animal husbandry, the total could add up to about 3 GtCO2e abated per year by mid-century. After account-ing for the remaining emissions, the sector could be contributing net sinks of the order of 1.1 GtCO2e per year by 2050. These efforts are also anticipated to result in significant financial benefits, increased food security and improvements in the quality of livelihoods in rural areas.
There are major barriers to securing these sinks. De-forestation continues unimpeded in many parts of the region, where the basic drivers of poverty and the inabil-ity to internalize the value of forests have not changed. The benefits in soil, water and biodiversity conservation are typically not monetized. Suppliers have yet to en-sure entirely that supply chains are deforestation-free, while the demand for these commodities continues to increase globally.
Decarbonisation of industry. In LAC this sector is heterogeneous and difficult to generalize. Therefore, emissions by sub-sectors and their potential for reduced carbon footprints need to be analysed separately. The reduction potential has been calculated by means of a pathway analysis. The analysis is an illustration of how sub-sectors could decarbonise by 2050. The cumulative reductions, if the upper boundary of cost effectiveness per tCO2e is US$30, would be of the order of 0.11 GtCO2e at a cost of about US$2 billion. This is about 21.5% of the emissions projected for the sector by 2050 under IIASA BAU. Industry can also play a role in the decar-bonisation of the economy through the supply of new equipment and services. For all sectors the lack of a functioning carbon market and/or internalization of the costs of climate change impacts represent a major barrier.
Added value of a zero carbon economy. These meas-ures have the potential to drive LAC toward a zero car-bon economy, largely on the basis of sound economics. Decarbonising would add value in terms of energy se-
xiv
EXECUTIVE SUMMARY
curity (through the control of domestic, inexhaustible renewable resources), food security and improved liveli-hoods (through land restoration), improvements in the terms of trade (energy, food, feed), improved air quality (through the electrification of transport), regional co-operation (in the context of joint enterprises to secure an integrated grid and means of transport) and access to international financial resources (vested in low carbon investments).
A zero carbon strategy would support the deployment of new means of production and better use of natural re-sources. It would encourage the creation of enterprises and jobs, attract investments, benefit from economies of scale and support improvements in the quality of life.
It would not just signal a leadership role for the region in the climate arena.
Thus a zero carbon direction, backed up by the availa-bility of technologies and shifting economics, it is ar-gued, would present more of an opportunity and less of a burden for economic development and for regional integration and would contribute substantially to the attainment of the Sustainable Development Goals1. However, achieving the zero carbon goal will ultimately depend on the ability to navigate and address the sub-stantial barriers built up over time by business-as-usual behaviours and policies. Still, from all perspectives, the region is in pole position when it comes to completing this journey.
1 See list of SDG and summary targets in http://www.un.org/sustain-abledevelopment/sustainable-development-goals/
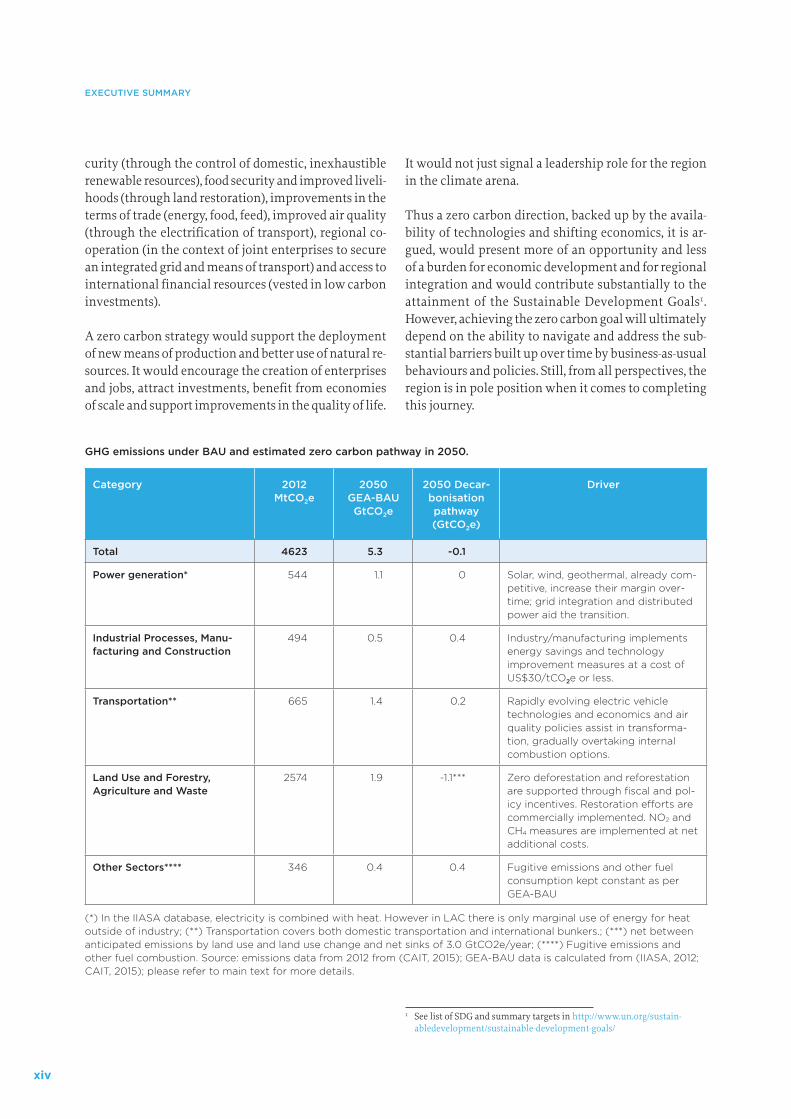
GHG emissions under BAU and estimated zero carbon pathway in 2050.
Category 2012 MtCO2e
2050 GEA-BAU GtCO2e
2050 Decar-bonisation pathway (GtCO2e)
Driver
Total 4623 5.3 -0.1
Power generation* 544 1.1 0 Solar, wind, geothermal, already com-petitive, increase their margin over-time; grid integration and distributed power aid the transition.
Industrial Processes, Manu-facturing and Construction
494 0.5 0.4 Industry/manufacturing implements energy savings and technology improvement measures at a cost of US$30/tCO2e or less.
Transportation** 665 1.4 0.2 Rapidly evolving electric vehicle technologies and economics and air quality policies assist in transforma-tion, gradually overtaking internal combustion options.
Land Use and Forestry, Agriculture and Waste
2574 1.9 -1.1*** Zero deforestation and reforestation are supported through fiscal and pol-icy incentives. Restoration efforts are commercially implemented. NO2 and CH4 measures are implemented at net additional costs.
Other Sectors**** 346 0.4 0.4 Fugitive emissions and other fuel consumption kept constant as per GEA-BAU
(*) In the IIASA database, electricity is combined with heat. However in LAC there is only marginal use of energy for heat outside of industry; (**) Transportation covers both domestic transportation and international bunkers.; (***) net between anticipated emissions by land use and land use change and net sinks of 3.0 GtCO2e/year; (****) Fugitive emissions and other fuel combustion. Source: emissions data from 2012 from (CAIT, 2015); GEA-BAU data is calculated from (IIASA, 2012; CAIT, 2015); please refer to main text for more details.

xv
EXECUTIVE SUMMARY

xvi
1
1. BACKGROUNDAND RATIONALE
The objective of this report is to visualize a pathway that would allow for the complete decarbonisation of the Latin American and the Caribbean’s (LAC) regional economy by mid-century. This is achieved through a re-view of specific sector-wide actions within a foreseeable technology and economics context and an examina-tion of the synergies between actions in these different sectors. The analysis is being conducted at a time of considerable momentum to address the climate chal-lenge at a global level and after a decade of remarkable socio-economic progress at a regional level. The report also comments on the key barriers to be addressed.
1.1 BACKGROUND
The global concentration of carbon dioxide (CO2) in the atmosphere has risen from approximately 280 parts per
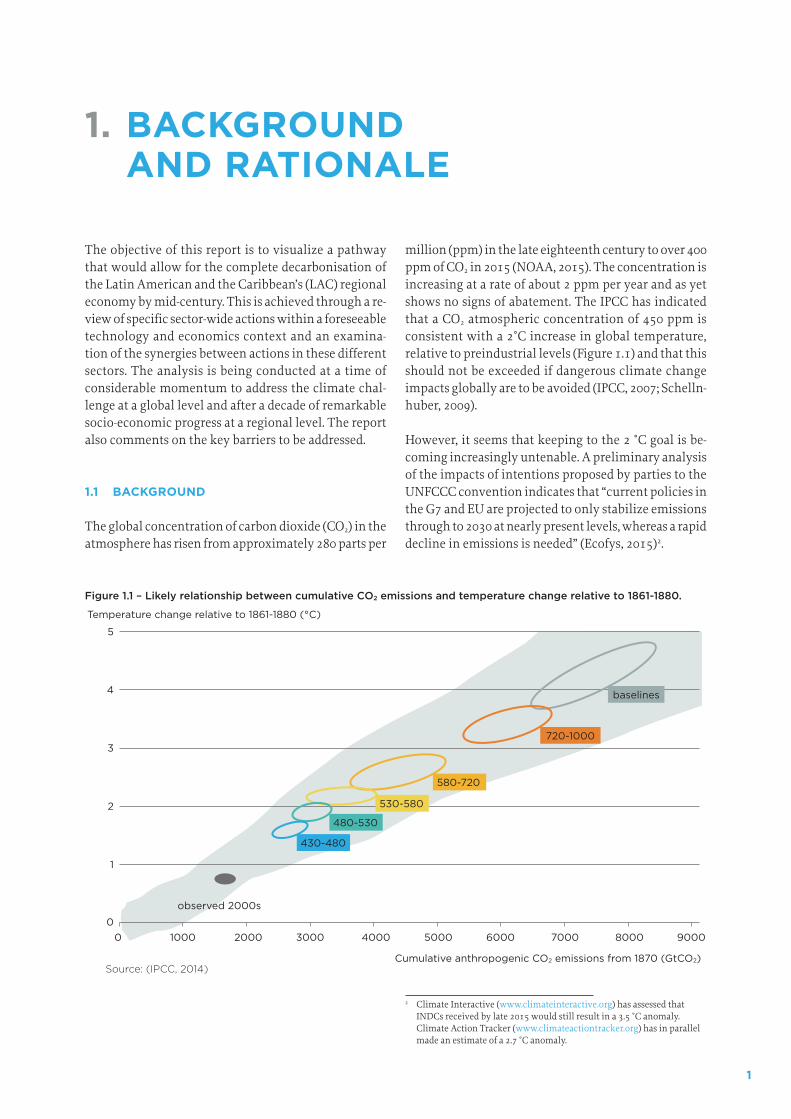
million (ppm) in the late eighteenth century to over 400 ppm of CO2 in 2015 (NOAA, 2015). The concentration is increasing at a rate of about 2 ppm per year and as yet shows no signs of abatement. The IPCC has indicated that a CO2 atmospheric concentration of 450 ppm is consistent with a 2°C increase in global temperature, relative to preindustrial levels (Figure 1.1) and that this should not be exceeded if dangerous climate change impacts globally are to be avoided (IPCC, 2007; Schelln-huber, 2009).
However, it seems that keeping to the 2 °C goal is be-coming increasingly untenable. A preliminary analysis of the impacts of intentions proposed by parties to the UNFCCC convention indicates that “current policies in the G7 and EU are projected to only stabilize emissions through to 2030 at nearly present levels, whereas a rapid decline in emissions is needed” (Ecofys, 2015)2.
2 Climate Interactive (www.climateinteractive.org) has assessed that INDCs received by late 2015 would still result in a 3.5 °C anomaly. Climate Action Tracker (www.climateactiontracker.org) has in parallel made an estimate of a 2.7 °C anomaly.
Source: (IPCC, 2014)
1
2
3
4
5
Cumulative anthropogenic CO2 emissions from 1870 (GtCO2)
Temperature change relative to 1861-1880 (°C)
observed 2000s
430-480
480-530
530-580
580-720
720-1000
baselines
00
1000 2000 3000 4000 5000 6000 7000 8000 9000
Figure 1.1 – Likely relationship between cumulative CO2 emissions and temperature change relative to 1861-1880.
2
BACKGROUND AND RATIONALE
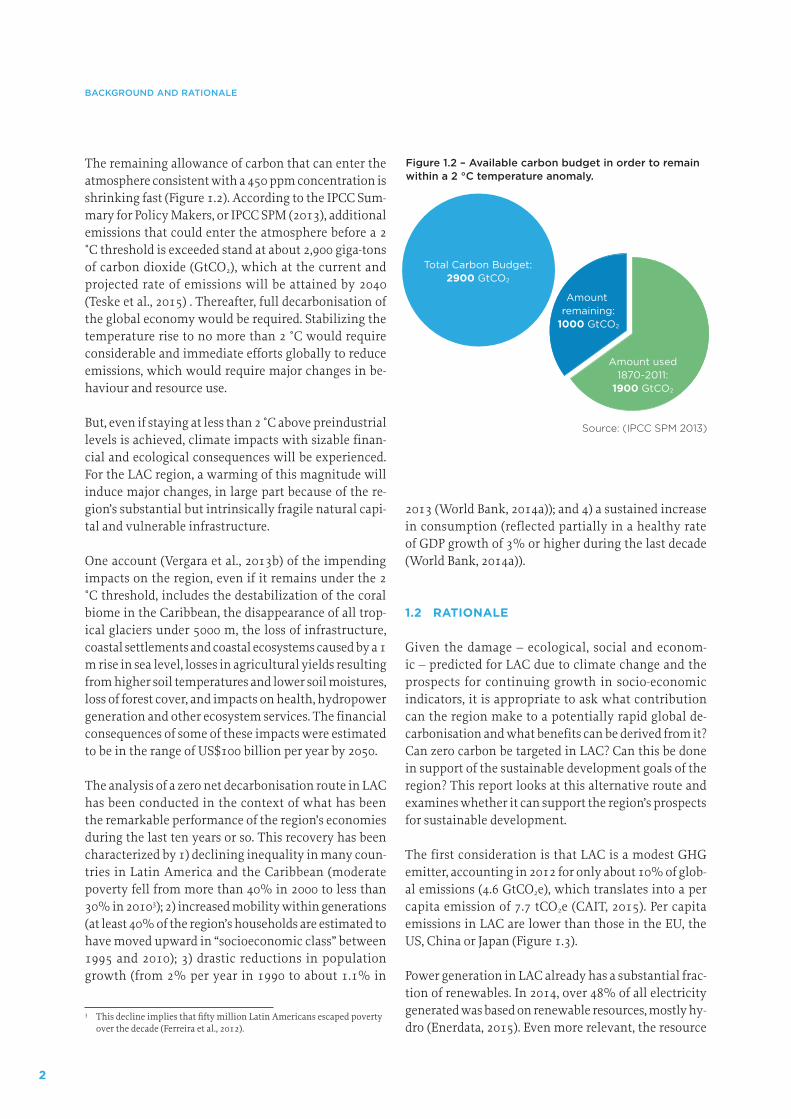
The remaining allowance of carbon that can enter the atmosphere consistent with a 450 ppm concentration is shrinking fast (Figure 1.2). According to the IPCC Sum-mary for Policy Makers, or IPCC SPM (2013), additional emissions that could enter the atmosphere before a 2 °C threshold is exceeded stand at about 2,900 giga-tons of carbon dioxide (GtCO2), which at the current and projected rate of emissions will be attained by 2040 (Teske et al., 2015) . Thereafter, full decarbonisation of the global economy would be required. Stabilizing the temperature rise to no more than 2 °C would require considerable and immediate efforts globally to reduce emissions, which would require major changes in be-haviour and resource use.
But, even if staying at less than 2 °C above preindustrial levels is achieved, climate impacts with sizable finan-cial and ecological consequences will be experienced. For the LAC region, a warming of this magnitude will induce major changes, in large part because of the re-gion’s substantial but intrinsically fragile natural capi-tal and vulnerable infrastructure.
One account (Vergara et al., 2013b) of the impending impacts on the region, even if it remains under the 2 °C threshold, includes the destabilization of the coral biome in the Caribbean, the disappearance of all trop-ical glaciers under 5000 m, the loss of infrastructure, coastal settlements and coastal ecosystems caused by a 1 m rise in sea level, losses in agricultural yields resulting from higher soil temperatures and lower soil moistures, loss of forest cover, and impacts on health, hydropower generation and other ecosystem services. The financial consequences of some of these impacts were estimated to be in the range of US$100 billion per year by 2050.
The analysis of a zero net decarbonisation route in LAC has been conducted in the context of what has been the remarkable performance of the region’s economies during the last ten years or so. This recovery has been characterized by 1) declining inequality in many coun-tries in Latin America and the Caribbean (moderate poverty fell from more than 40% in 2000 to less than 30% in 20103); 2) increased mobility within generations (at least 40% of the region’s households are estimated to have moved upward in “socioeconomic class” between 1995 and 2010); 3) drastic reductions in population growth (from 2% per year in 1990 to about 1.1% in
3 This decline implies that fifty million Latin Americans escaped poverty over the decade (Ferreira et al., 2012).
Figure 1.2 – Available carbon budget in order to remain within a 2 °C temperature anomaly.
Source: (IPCC SPM 2013)
Total Carbon Budget:2900 GtCO2
Amount used1870-2011:
1900 GtCO2
Amount remaining:
1000 GtCO2
2013 (World Bank, 2014a)); and 4) a sustained increase in consumption (reflected partially in a healthy rate of GDP growth of 3% or higher during the last decade (World Bank, 2014a)).
1.2 RATIONALE
Given the damage – ecological, social and econom-ic – predicted for LAC due to climate change and the prospects for continuing growth in socio-economic indicators, it is appropriate to ask what contribution can the region make to a potentially rapid global de-carbonisation and what benefits can be derived from it? Can zero carbon be targeted in LAC? Can this be done in support of the sustainable development goals of the region? This report looks at this alternative route and examines whether it can support the region’s prospects for sustainable development.
The first consideration is that LAC is a modest GHG emitter, accounting in 2012 for only about 10% of glob-al emissions (4.6 GtCO2e), which translates into a per capita emission of 7.7 tCO2e (CAIT, 2015). Per capita emissions in LAC are lower than those in the EU, the US, China or Japan (Figure 1.3).
Power generation in LAC already has a substantial frac-tion of renewables. In 2014, over 48% of all electricity generated was based on renewable resources, mostly hy-dro (Enerdata, 2015). Even more relevant, the resource

3
CHAPTER 1
Figure 1.3 – Per capita emissions in different regions and large countries.
Source: (CAIT, 2015)
0
Africa Asia China EU 28 India LAC USA World
5
10
15
20
25
tCO
2e P
er C
apit
a
Excl. Land-Use Change and Foresty Incl. Land-Use Change and Foresty
base of the region, including non-hydro, would be able to sustain a much higher level of renewables-based gen-eration. This opens up the possibility of shifting the production base toward electricity as an energy source with a low-carbon content.
Secondly, the region is highly urbanized. And in urban areas, most people move via public (read low carbon per passenger) transport. Therefore, the carbon signal from urban transport is much lower per capita than in industrial regions. Further, in countries with largely hy-dropower-driven power generation, demand for trans-port fuels constitutes their key dependence on fossil fuels. If transport is electrified, a major demand for fossil fuels would be addressed. Finally, while the motoriza-tion rate is rapidly increasing, smart, space-conscious transport systems (like Bus Rapid Transit Systems) are being rapidly deployed and have already shown their cost effectiveness and potential.
Thirdly, while power and transport account for a large fraction of fossil fuel use, in LAC it is land use and land use change that are responsible for a majority of GHG emissions (Table 1.1). This is contrary to most other regions in the world, where fossil fuels are the main sources of carbon emissions. Deforestation, while be-ing addressed, is still a major source of such emissions. Stopping deforestation, reforesting and restoring land have the potential for significant emissions reductions and sizable carbon sinks.
Also, the required transformation has started. Coura-geous, sometimes bold political decisions have placed some nations on a path to very low carbon emissions. Some of these decisions are expressed in the form of targets for renewable energy entry, goals to reduce or eliminate deforestation, ambitions for land restoration, targets for energy efficiency and/or other expressions of political will.
The results are beginning to show. During the period 2000-2012, the carbon intensity of the region, measured in tCO2e per Million US$ GDP PPP (including LULUCF), decreased by about 21.5% (CAIT, 2015). Most of the re-duction can be linked to significant drops in rates of deforestation, most notably in Brazil. Improvements in energy efficiency have also contributed. This is not to say that decarbonisation under business as usual conditions is assured. On the contrary, many current drivers are likely to continue contributing to a higher carbon future, as can be seen in the summary presented in Table 1.1.
More importantly, and looking at the near term, the eco-nomics of low carbon technologies are shifting, fuelled by a quick pace in innovation This is shown in the im-provements in competitiveness of renewable sources of energy; new appreciation of the advantages of a smart integrated grid and of developments in distributed pow-er; reductions in the costs of energy storage and electric vehicles; improvements in soil restoration and assisted
4
BACKGROUND AND RATIONALE
natural reforestation techniques; and innovations in agriculture and industrial processes.
Decarbonising the Latin American regional economy would add value in terms of energy security (through the control of its own inexhaustible renewable resourc-es), food security (through land restoration) improve-ments in terms of trade (energy, food, feed), regional cooperation (in the context of enterprises to secure an integrated grid and means of transport) and access to international financial resources (vested in low carbon). It would not just signal a leadership role for the region in the climate arena.
Net decarbonisation, when it takes place, will be achieved on the shoulders of economic gains for the region, provided it can satisfy the growing demand for cost-effective quality services and products. A zero car-bon strategy should support the deployment of new means of production and the better use of natural re-sources. It should create jobs and enterprises, attract in-
vestments, benefit from economies of scale and support improvements in the quality of life. Thus a change of direction towards zero carbon, it is argued, increasingly backed up by the availability of technologies and shift-ing economics, would present more of an opportunity and less of a burden for economic development and regional integration.
Furthermore, a zero carbon path for the region would be in accord with the UN Sustainable Development Goals (UN-SDGs), not only in the context of climate change, but also in the areas of energy, cities and land use, by supporting access to, and the rational use of, resources and products. It would be catalytic in securing improvements in the quality of life by exploiting its own renewable natural resources in a manner that is consistent with sustainable development.
Overall, it would be much more beneficial (and less cost-ly) to take a zero carbon approach now, thus making use of the increasingly favourable technical and economic
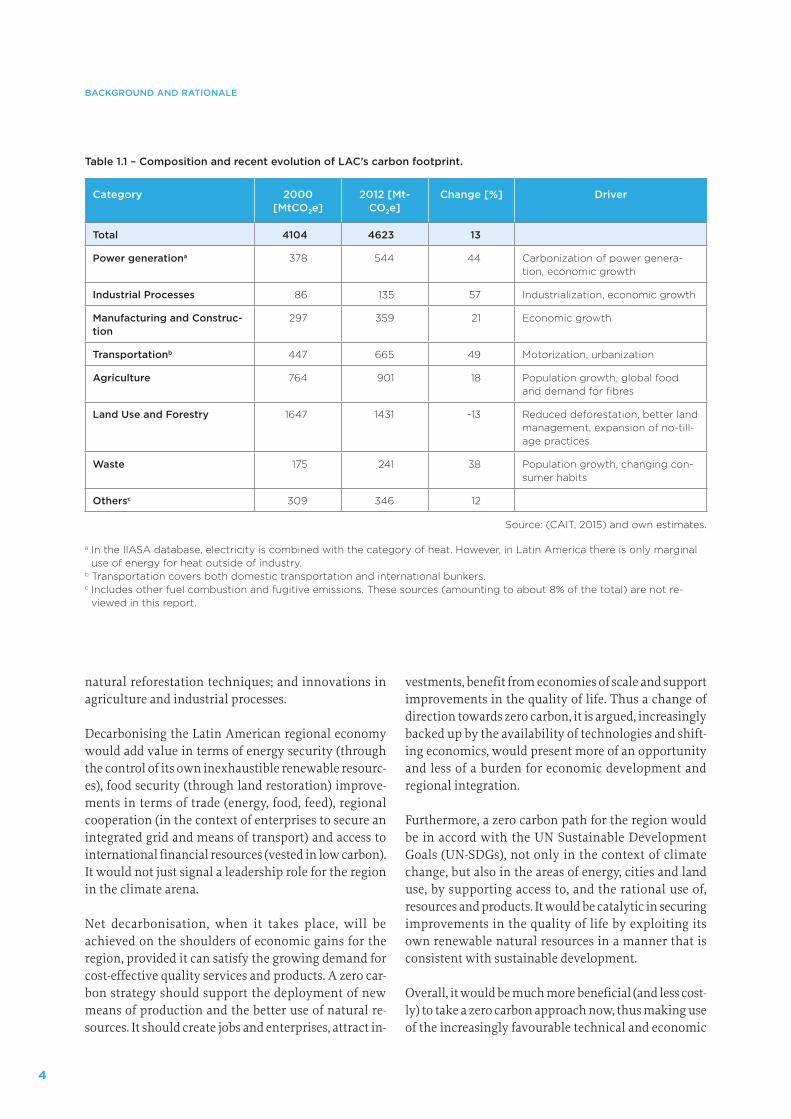
Table 1.1 – Composition and recent evolution of LAC’s carbon footprint.
Category 2000 [MtCO2e]
2012 [Mt-CO2e]
Change [%] Driver
Total 4104 4623 13
Power generationa 378 544 44 Carbonization of power genera-tion, economic growth
Industrial Processes 86 135 57 Industrialization, economic growth
Manufacturing and Construc-tion
297 359 21 Economic growth
Transportationb 447 665 49 Motorization, urbanization
Agriculture 764 901 18 Population growth, global food and demand for fibres
Land Use and Forestry 1647 1431 -13 Reduced deforestation, better land management, expansion of no-till-age practices
Waste 175 241 38 Population growth, changing con-sumer habits
Othersc 309 346 12
Source: (CAIT, 2015) and own estimates.
a In the IIASA database, electricity is combined with the category of heat. However, in Latin America there is only marginal use of energy for heat outside of industry.
b Transportation covers both domestic transportation and international bunkers.c Includes other fuel combustion and fugitive emissions. These sources (amounting to about 8% of the total) are not re-
viewed in this report.
5
CHAPTER 1
conditions, rather than later, when the changes neces-sary may require more urgent action, while moving the policy framework towards the removal of barriers and securing the benefits of the associated socio-economic transformational effects.
Finally, it should be considered that reductions in the emissions of CO2 in the atmosphere will have dimin-ishing influence on the climate as its concentration in-creases. This means that drastic reductions today will have a higher impact than if the same reductions are achieved in the future.
1.3 DATA SOURCES
It is in this current and emerging context that the re-port examines the potential for full net decarbonisation of the region through specific sector-wide activities. While the report focuses on Latin America, it uses as background and context the global and regional projec-tions of the IIASA (IIASA BAU). The following sections provide an assessment of a list of actions in the key economic sectors that are responsible for most of the carbon footprint of the region. An illustrative pathway is then constructed to reach zero net regional emissions by mid-century.
The analysis relies on existing information in the specialized literature. Historical data for the analysis came from a number of sources referenced in the report, with a particular emphasis on the database on emis-sions maintained by CAIT4. Energy data was obtained from ENERDATA5 and sector sources. The IIASA-GEA6 modelling results were used to establish the business as usual scenarios, using the latest snapshot from CAIT as a starting point. IIASA’s database has one of the most comprehensive and consistent data sets for Latin Amer-ica. FAOSTAT7 was used for historical data and projec-
4 CAIT is the climate data explorer maintained by the World Resources Institute (http://cait.wri.org/)
5 ENERDATA is an independent research & consulting firm on the global oil, gas, coal, power, renewable and carbon markets established in 1991 (http://www.enerdata.net/).
6 IIASA-GEA is a database that aims at documenting the results and as-sumptions of the GEA transformation pathways (http://www.iiasa.ac.at/web-apps/ene/geadb/dsd?Action=htmlpage&page=welcome). The sce-narios used include the GEA-BAU (where no intervention is considered to affect current trends) and the GEA-MIX (a mid-range combination of intervention measures in several sectors). More information on the projections and scenarios used can be consulted in Annex I.
7 FAOSTAT is the statistical database on agriculture and forestry main-tained by the FAO (http://faostat3.fao.org/download/G1/GT/E).
tions for the agriculture sector; the UNIDO, IRENA and REN 21 databases were also consulted.
The economic arguments for embarking on the path-way were examined using different methods, depend-ing on information available in the literature. Levelized costs, derived from GACMO8, were used to estimate the relative competitiveness of power generation and trans-port vis-à-vis business as usual options. Data available on financial viability were used to document the eco-nomic argument for restoration and reforestation ef-forts, while the net cost of measures to abate emissions was used to prioritize efforts in agriculture and industry.
8 GACMO was developed by Joergen Fenhann, UNEP DTU Partnership, to conduct an analysis of the GHG mitigation options for a country or region that have to be frequently used to develop a low carbon devel-opment strategy or an INDC. A standard version of GACMO is publicly available at: http://www.cdmpipeline.org/.
6
ANALYSIS OF GRID EMISSION FACTORS FOR THE ELECTRICITY SECTOR IN CARIBBEAN COUNTRIES
7
2. DECARBONISATION OF POWER GENERATION
This section examines the conditions under which full decarbonisation of the power sector could be realized regionally. If power generation is decarbonized, many economic activities that depend on power become low carbon, and others that today use fossil fuels could con-sider a shift toward electricity as a mechanism for re-ducing their carbon content. A renewable energy power system would also strengthen energy security though the use of domestic resources, which in practical terms would be inexhaustible.
2.1 CURRENT SITUATION
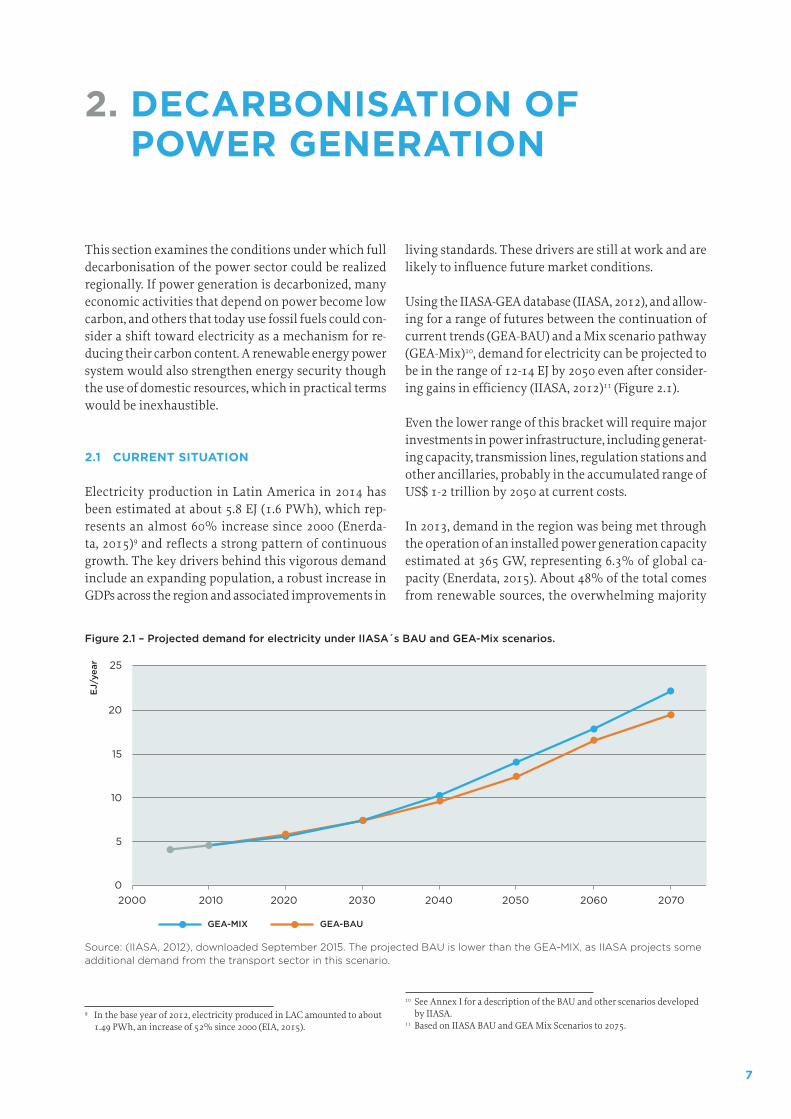
Electricity production in Latin America in 2014 has been estimated at about 5.8 EJ (1.6 PWh), which rep-resents an almost 60% increase since 2000 (Enerda-ta, 2015)9 and reflects a strong pattern of continuous growth. The key drivers behind this vigorous demand include an expanding population, a robust increase in GDPs across the region and associated improvements in
9 In the base year of 2012, electricity produced in LAC amounted to about 1.49 PWh, an increase of 52% since 2000 (EIA, 2015).
living standards. These drivers are still at work and are likely to influence future market conditions.
Using the IIASA-GEA database (IIASA, 2012), and allow-ing for a range of futures between the continuation of current trends (GEA-BAU) and a Mix scenario pathway (GEA-Mix)10, demand for electricity can be projected to be in the range of 12-14 EJ by 2050 even after consider-ing gains in efficiency (IIASA, 2012)11 (Figure 2.1).
Even the lower range of this bracket will require major investments in power infrastructure, including generat-ing capacity, transmission lines, regulation stations and other ancillaries, probably in the accumulated range of US$ 1-2 trillion by 2050 at current costs.
In 2013, demand in the region was being met through the operation of an installed power generation capacity estimated at 365 GW, representing 6.3% of global ca-pacity (Enerdata, 2015). About 48% of the total comes from renewable sources, the overwhelming majority
10 See Annex I for a description of the BAU and other scenarios developed by IIASA.
11 Based on IIASA BAU and GEA Mix Scenarios to 2075.
EJ/
year
GEA-BAUGEA-MIX
0
5
10
15
20
25
2000 2010 2020 2030 2040 2050 2060 2070
Source: (IIASA, 2012), downloaded September 2015. The projected BAU is lower than the GEA-MIX, as IIASA projects some additional demand from the transport sector in this scenario.
Figure 2.1 – Projected demand for electricity under IIASA´s BAU and GEA-Mix scenarios.
8
DECARBONISATION OF POWER GENERATION
of which, 164 GW, being hydropower (Enerdata, 2015) (Annex II lists hydropower plants in the region with at least 1 GW nominal capacity). As a consequence, the carbon signal of the regional power matrix is re-markably low, standing at about 0.21 tCO2 per MWh (Brander et al., 2011). Globally, it is by far the least car-bon-intensive (Table 2.1) power sector. It also has the capacity to continue to be at least that low due to its large hydropower potential and, as discussed later in
MtC
O2e
CAIT | GEA-BAU
0
500
1,000
1,500
2,000
2,500
1990 2012 2030 2050 2070
Figure 2.2 – Historical and projected GHG emissions from the power sector.
Source: Historic emission data from (CAIT, 2015), projections based on IIASA-GEA rates of growth of future emissions (IIASA, 2012).
this section, its significant endowment of other than hydro renewable energy sources.
The strong role played by hydropower not only reduc-es the carbon footprint of the sector. If the grid can be integrated regionally, the large capacity of multi-annu-al reservoirs could also provide for a relatively stable12 base-load capacity that could eventually be used as a power storage facility capable of dampening fluctua-tions between regional demand and supply.
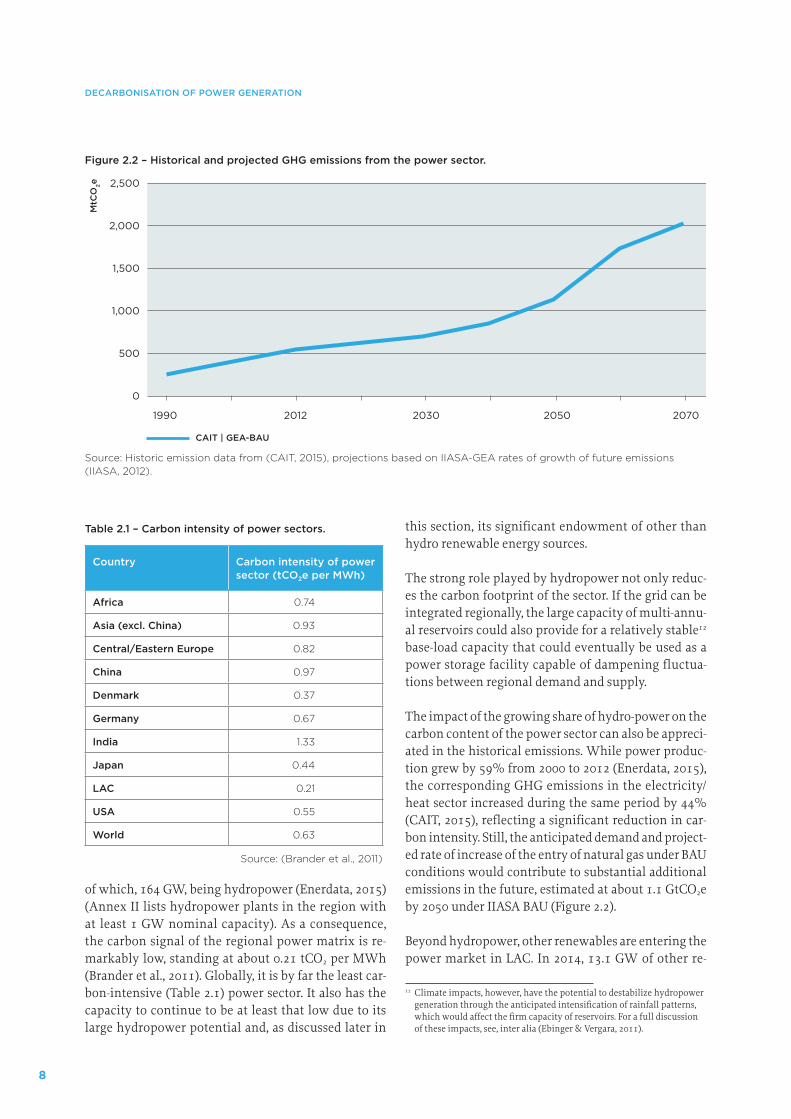
The impact of the growing share of hydro-power on the carbon content of the power sector can also be appreci-ated in the historical emissions. While power produc-tion grew by 59% from 2000 to 2012 (Enerdata, 2015), the corresponding GHG emissions in the electricity/heat sector increased during the same period by 44% (CAIT, 2015), reflecting a significant reduction in car-bon intensity. Still, the anticipated demand and project-ed rate of increase of the entry of natural gas under BAU conditions would contribute to substantial additional emissions in the future, estimated at about 1.1 GtCO2e by 2050 under IIASA BAU (Figure 2.2).
Beyond hydropower, other renewables are entering the power market in LAC. In 2014, 13.1 GW of other re-
12 Climate impacts, however, have the potential to destabilize hydropower generation through the anticipated intensification of rainfall patterns, which would affect the firm capacity of reservoirs. For a full discussion of these impacts, see, inter alia (Ebinger & Vergara, 2011).
Table 2.1 – Carbon intensity of power sectors.
Country Carbon intensity of power sector (tCO2e per MWh)
Africa 0.74
Asia (excl. China) 0.93
Central/Eastern Europe 0.82
China 0.97
Denmark 0.37
Germany 0.67
India 1.33
Japan 0.44
LAC 0.21
USA 0.55
World 0.63
Source: (Brander et al., 2011)
9
CHAPTER 2
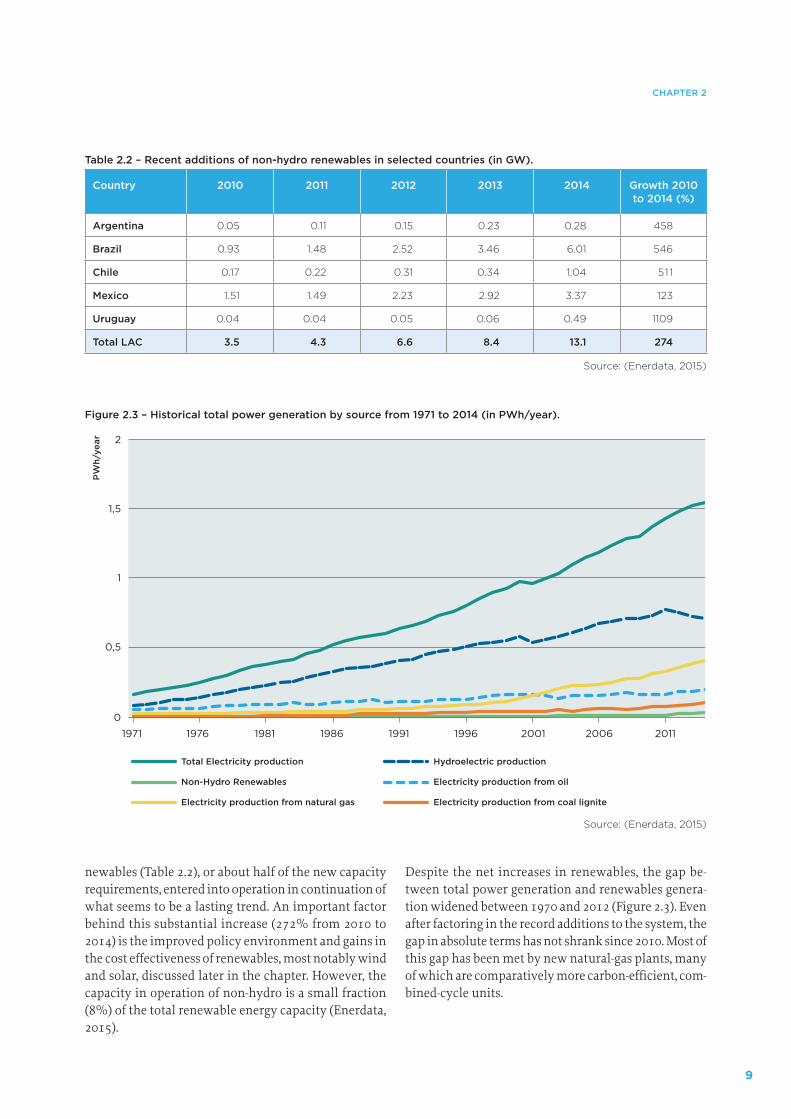
newables (Table 2.2), or about half of the new capacity requirements, entered into operation in continuation of what seems to be a lasting trend. An important factor behind this substantial increase (272% from 2010 to 2014) is the improved policy environment and gains in the cost effectiveness of renewables, most notably wind and solar, discussed later in the chapter. However, the capacity in operation of non-hydro is a small fraction (8%) of the total renewable energy capacity (Enerdata, 2015).
Despite the net increases in renewables, the gap be-tween total power generation and renewables genera-tion widened between 1970 and 2012 (Figure 2.3). Even after factoring in the record additions to the system, the gap in absolute terms has not shrank since 2010. Most of this gap has been met by new natural-gas plants, many of which are comparatively more carbon-efficient, com-bined-cycle units.
Table 2.2 – Recent additions of non-hydro renewables in selected countries (in GW).
Country 2010 2011 2012 2013 2014 Growth 2010 to 2014 (%)
Argentina 0.05 0.11 0.15 0.23 0.28 458
Brazil 0.93 1.48 2.52 3.46 6.01 546
Chile 0.17 0.22 0.31 0.34 1.04 511
Mexico 1.51 1.49 2.23 2.92 3.37 123
Uruguay 0.04 0.04 0.05 0.06 0.49 1109
Total LAC 3.5 4.3 6.6 8.4 13.1 274
Source: (Enerdata, 2015)
PW
h/ye
ar
Total Electricity production
0
0,5
1
1,5
2
201120062001199619911986198119761971
Hydroelectric production
Non-Hydro Renewables
Electricity production from natural gas
Electricity production from oil
Electricity production from coal lignite
Figure 2.3 – Historical total power generation by source from 1971 to 2014 (in PWh/year).
Source: (Enerdata, 2015)
10
DECARBONISATION OF POWER GENERATION
2.2 RESOURCE ENDOWMENT
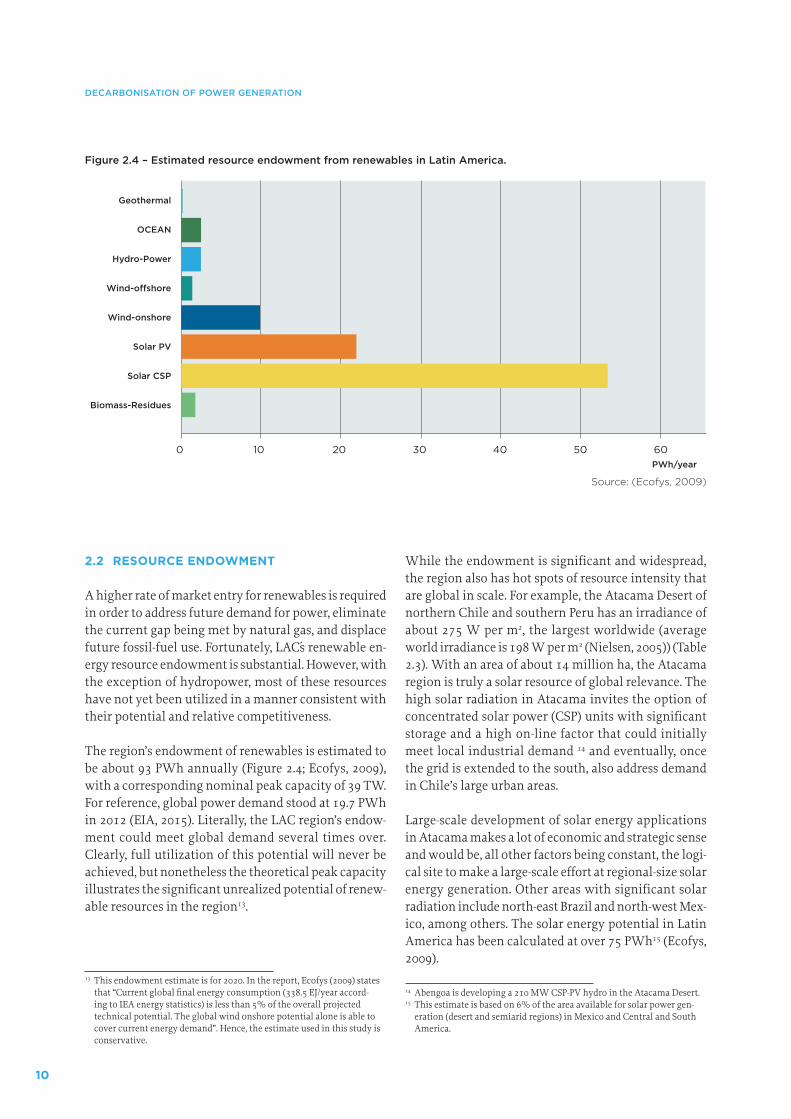
A higher rate of market entry for renewables is required in order to address future demand for power, eliminate the current gap being met by natural gas, and displace future fossil-fuel use. Fortunately, LAC´s renewable en-ergy resource endowment is substantial. However, with the exception of hydropower, most of these resources have not yet been utilized in a manner consistent with their potential and relative competitiveness.
The region’s endowment of renewables is estimated to be about 93 PWh annually (Figure 2.4; Ecofys, 2009), with a corresponding nominal peak capacity of 39 TW. For reference, global power demand stood at 19.7 PWh in 2012 (EIA, 2015). Literally, the LAC region’s endow-ment could meet global demand several times over. Clearly, full utilization of this potential will never be achieved, but nonetheless the theoretical peak capacity illustrates the significant unrealized potential of renew-able resources in the region13.
13 This endowment estimate is for 2020. In the report, Ecofys (2009) states that “Current global final energy consumption (338.5 EJ/year accord-ing to IEA energy statistics) is less than 5% of the overall projected technical potential. The global wind onshore potential alone is able to cover current energy demand”. Hence, the estimate used in this study is conservative.
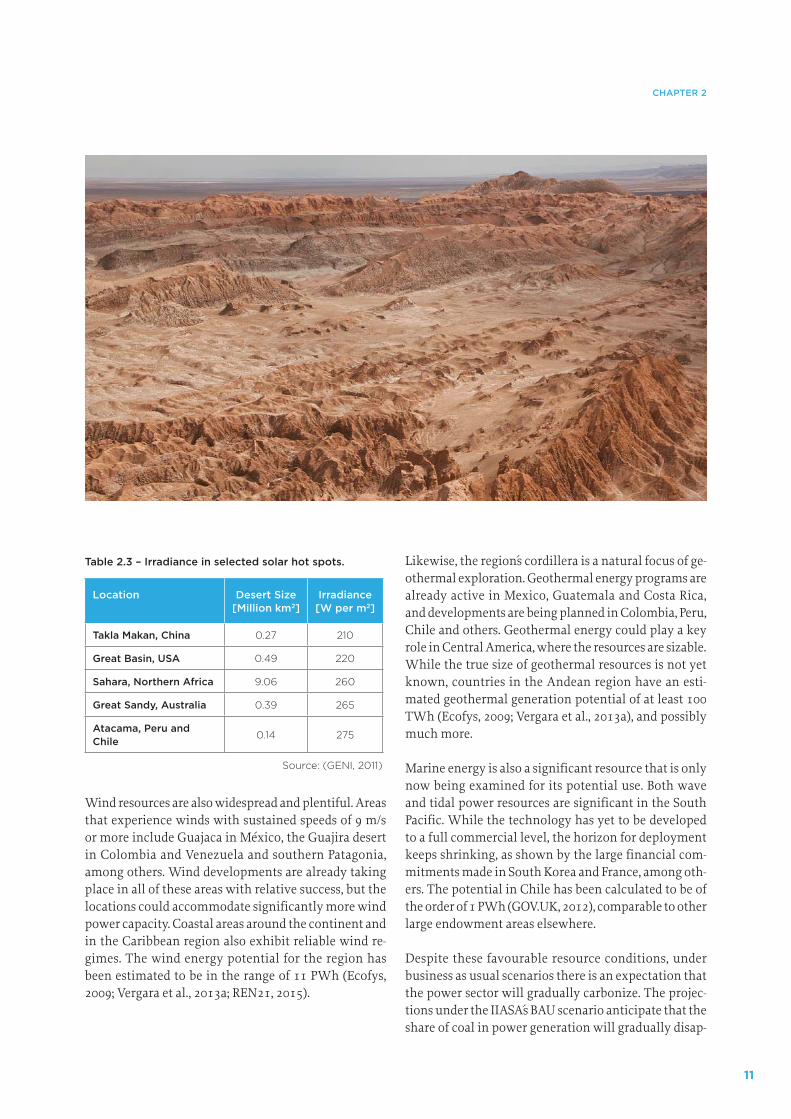
While the endowment is significant and widespread, the region also has hot spots of resource intensity that are global in scale. For example, the Atacama Desert of northern Chile and southern Peru has an irradiance of about 275 W per m2, the largest worldwide (average world irradiance is 198 W per m2 (Nielsen, 2005)) (Table 2.3). With an area of about 14 million ha, the Atacama region is truly a solar resource of global relevance. The high solar radiation in Atacama invites the option of concentrated solar power (CSP) units with significant storage and a high on-line factor that could initially meet local industrial demand 14 and eventually, once the grid is extended to the south, also address demand in Chile’s large urban areas.
Large-scale development of solar energy applications in Atacama makes a lot of economic and strategic sense and would be, all other factors being constant, the logi-cal site to make a large-scale effort at regional-size solar energy generation. Other areas with significant solar radiation include north-east Brazil and north-west Mex-ico, among others. The solar energy potential in Latin America has been calculated at over 75 PWh15 (Ecofys, 2009).
14 Abengoa is developing a 210 MW CSP-PV hydro in the Atacama Desert.15 This estimate is based on 6% of the area available for solar power gen-
eration (desert and semiarid regions) in Mexico and Central and South America.
PWh/year
Geothermal
OCEAN
Hydro-Power
Wind-offshore
Wind-onshore
Solar PV
Solar CSP
Biomass-Residues
6050403020100
Figure 2.4 – Estimated resource endowment from renewables in Latin America.
Source: (Ecofys, 2009)
11
CHAPTER 2
Wind resources are also widespread and plentiful. Areas that experience winds with sustained speeds of 9 m/s or more include Guajaca in México, the Guajira desert in Colombia and Venezuela and southern Patagonia, among others. Wind developments are already taking place in all of these areas with relative success, but the locations could accommodate significantly more wind power capacity. Coastal areas around the continent and in the Caribbean region also exhibit reliable wind re-gimes. The wind energy potential for the region has been estimated to be in the range of 11 PWh (Ecofys, 2009; Vergara et al., 2013a; REN21, 2015).
Likewise, the regions cordillera is a natural focus of ge-othermal exploration. Geothermal energy programs are already active in Mexico, Guatemala and Costa Rica, and developments are being planned in Colombia, Peru, Chile and others. Geothermal energy could play a key role in Central America, where the resources are sizable. While the true size of geothermal resources is not yet known, countries in the Andean region have an esti-mated geothermal generation potential of at least 100 TWh (Ecofys, 2009; Vergara et al., 2013a), and possibly much more.
Marine energy is also a significant resource that is only now being examined for its potential use. Both wave and tidal power resources are significant in the South Pacific. While the technology has yet to be developed to a full commercial level, the horizon for deployment keeps shrinking, as shown by the large financial com-mitments made in South Korea and France, among oth-ers. The potential in Chile has been calculated to be of the order of 1 PWh (GOV.UK, 2012), comparable to other large endowment areas elsewhere.
Despite these favourable resource conditions, under business as usual scenarios there is an expectation that the power sector will gradually carbonize. The projec-tions under the IIASAs BAU scenario anticipate that the share of coal in power generation will gradually disap-
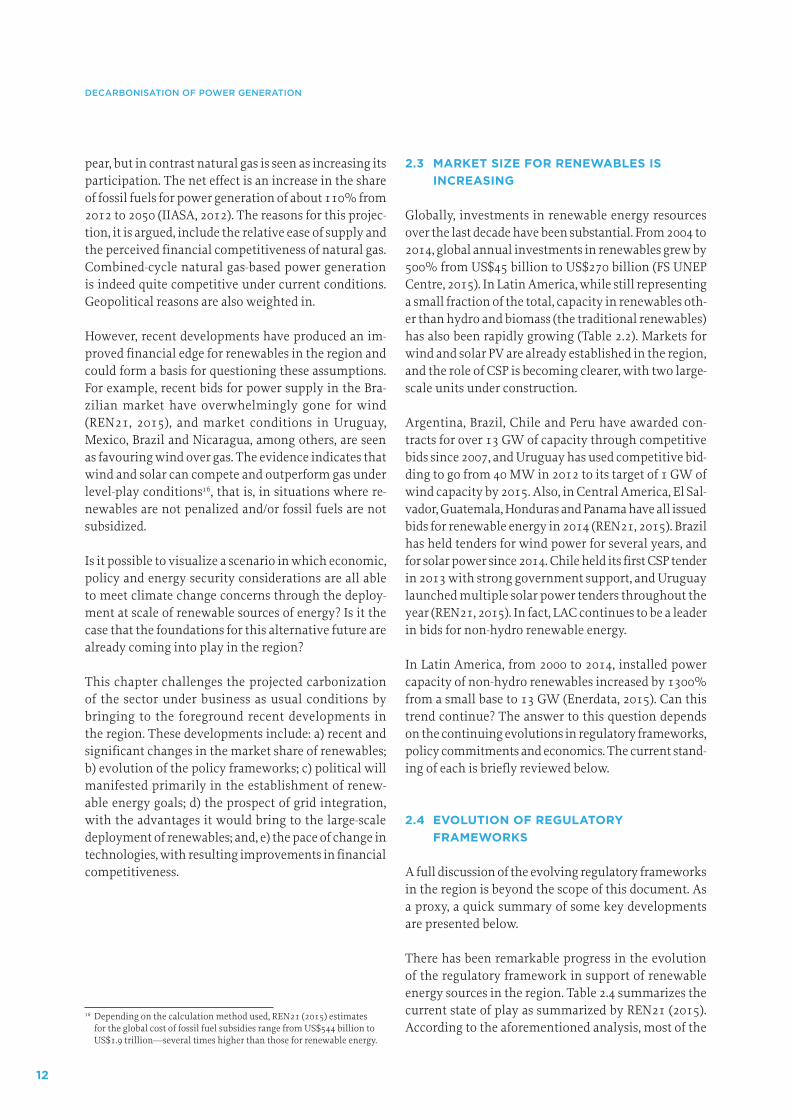
Table 2.3 – Irradiance in selected solar hot spots.
Location Desert Size [Million km2]
Irradiance [W per m2]
Takla Makan, China 0.27 210
Great Basin, USA 0.49 220
Sahara, Northern Africa 9.06 260
Great Sandy, Australia 0.39 265
Atacama, Peru and Chile
0.14 275
Source: (GENI, 2011)
12
DECARBONISATION OF POWER GENERATION
pear, but in contrast natural gas is seen as increasing its participation. The net effect is an increase in the share of fossil fuels for power generation of about 110% from 2012 to 2050 (IIASA, 2012). The reasons for this projec-tion, it is argued, include the relative ease of supply and the perceived financial competitiveness of natural gas. Combined-cycle natural gas-based power generation is indeed quite competitive under current conditions. Geopolitical reasons are also weighted in.
However, recent developments have produced an im-proved financial edge for renewables in the region and could form a basis for questioning these assumptions. For example, recent bids for power supply in the Bra-zilian market have overwhelmingly gone for wind (REN21, 2015), and market conditions in Uruguay, Mexico, Brazil and Nicaragua, among others, are seen as favouring wind over gas. The evidence indicates that wind and solar can compete and outperform gas under level-play conditions16, that is, in situations where re-newables are not penalized and/or fossil fuels are not subsidized.
Is it possible to visualize a scenario in which economic, policy and energy security considerations are all able to meet climate change concerns through the deploy-ment at scale of renewable sources of energy? Is it the case that the foundations for this alternative future are already coming into play in the region?
This chapter challenges the projected carbonization of the sector under business as usual conditions by bringing to the foreground recent developments in the region. These developments include: a) recent and significant changes in the market share of renewables; b) evolution of the policy frameworks; c) political will manifested primarily in the establishment of renew-able energy goals; d) the prospect of grid integration, with the advantages it would bring to the large-scale deployment of renewables; and, e) the pace of change in technologies, with resulting improvements in financial competitiveness.
16 Depending on the calculation method used, REN21 (2015) estimates for the global cost of fossil fuel subsidies range from US$544 billion to US$1.9 trillion—several times higher than those for renewable energy.
2.3 MARKET SIZE FOR RENEWABLES IS INCREASING
Globally, investments in renewable energy resources over the last decade have been substantial. From 2004 to 2014, global annual investments in renewables grew by 500% from US$45 billion to US$270 billion (FS UNEP Centre, 2015). In Latin America, while still representing a small fraction of the total, capacity in renewables oth-er than hydro and biomass (the traditional renewables) has also been rapidly growing (Table 2.2). Markets for wind and solar PV are already established in the region, and the role of CSP is becoming clearer, with two large-scale units under construction.
Argentina, Brazil, Chile and Peru have awarded con-tracts for over 13 GW of capacity through competitive bids since 2007, and Uruguay has used competitive bid-ding to go from 40 MW in 2012 to its target of 1 GW of wind capacity by 2015. Also, in Central America, El Sal-vador, Guatemala, Honduras and Panama have all issued bids for renewable energy in 2014 (REN21, 2015). Brazil has held tenders for wind power for several years, and for solar power since 2014. Chile held its first CSP tender in 2013 with strong government support, and Uruguay launched multiple solar power tenders throughout the year (REN21, 2015). In fact, LAC continues to be a leader in bids for non-hydro renewable energy.
In Latin America, from 2000 to 2014, installed power capacity of non-hydro renewables increased by 1300% from a small base to 13 GW (Enerdata, 2015). Can this trend continue? The answer to this question depends on the continuing evolutions in regulatory frameworks, policy commitments and economics. The current stand-ing of each is briefly reviewed below.
2.4 EVOLUTION OF REGULATORY FRAMEWORKS
A full discussion of the evolving regulatory frameworks in the region is beyond the scope of this document. As a proxy, a quick summary of some key developments are presented below.
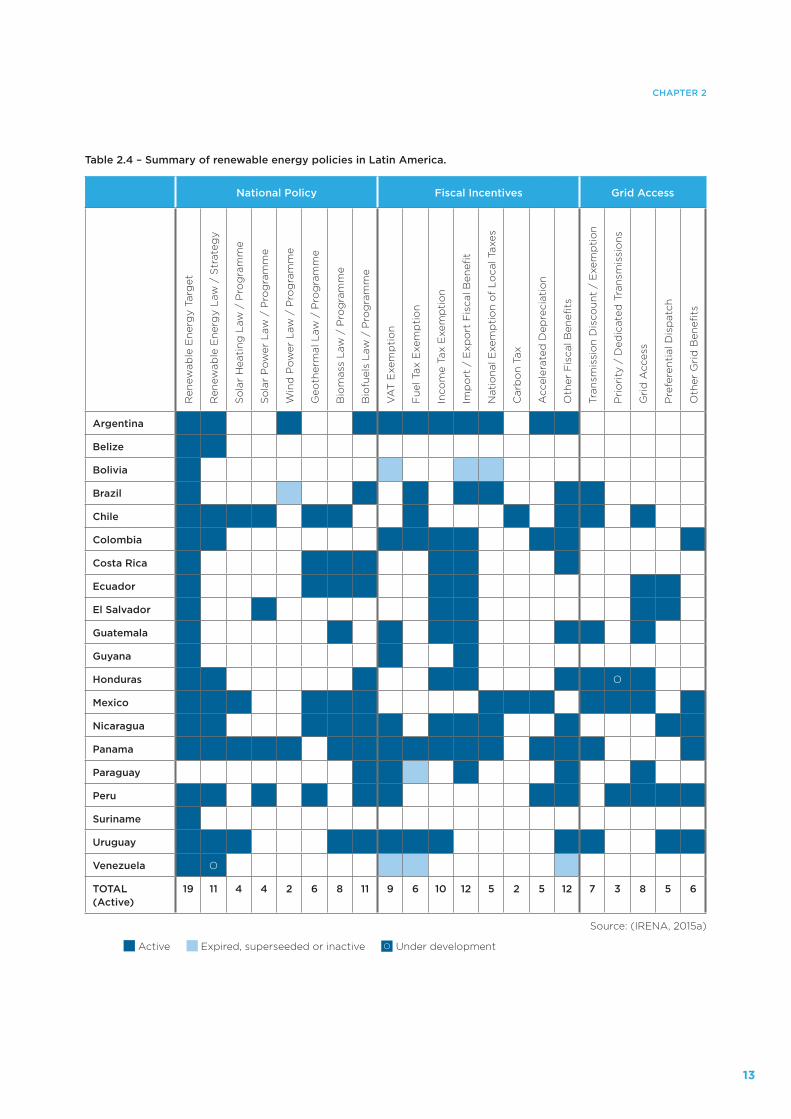
There has been remarkable progress in the evolution of the regulatory framework in support of renewable energy sources in the region. Table 2.4 summarizes the current state of play as summarized by REN21 (2015). According to the aforementioned analysis, most of the
13
CHAPTER 2
Table 2.4 – Summary of renewable energy policies in Latin America.
National Policy Fiscal Incentives Grid AccessR
enew
able
En
erg
y Ta
rget
Ren
ewab
le E
ner
gy
Law
/ S
trat
egy
So
lar
Hea
tin
g L
aw /
Pro
gra
mm
e
So
lar
Po
wer
Law
/ P
rog
ram
me
Win
d P
ow
er L
aw /
Pro
gra
mm
e
Geo
ther
mal
Law
/ P
rog
ram
me
Bio
mas
s L
aw /
Pro
gra
mm
e
Bio
fuel
s L
aw /
Pro
gra
mm
e
VA
T E
xem
pti
on
Fu
el T
ax E
xem
pti
on
Inco
me
Tax
Exe
mp
tio
n
Imp
ort
/ E
xpo
rt F
isca
l Ben
efit
Nat
ion
al E
xem
pti
on
of
Lo
cal T
axes
Car
bo
n T
ax
Acc
eler
ated
Dep
reci
atio
n
Oth
er F
isca
l Ben
efit
s
Tran
smis
sio
n D
isco
un
t /
Exe
mp
tio
n
Pri
ori
ty /
Ded
icat
ed T
ran
smis
sio
ns
Gri
d A
cces
s
Pre
fere
nti
al D
isp
atch
Oth
er G
rid
Ben
efit
s
Argentina
Belize
Bolivia
Brazil
Chile
Colombia
Costa Rica
Ecuador
El Salvador
Guatemala
Guyana
Honduras O
Mexico
Nicaragua
Panama
Paraguay
Peru
Suriname
Uruguay
Venezuela O
TOTAL (Active)
19 11 4 4 2 6 8 11 9 6 10 12 5 2 5 12 7 3 8 5 6
Source: (IRENA, 2015a)
Active Expired, superseeded or inactive Under developmentO
14
DECARBONISATION OF POWER GENERATION
power market in the region now has renewable energy targets, supportive policies and to some extent financ-ing systems in support of renewable sources of ener-gy. Carbon taxes have been introduced in Mexico and Chile, with other countries considering their potential use as an instrument to promote investments in renew-able energy.
In terms of supporting market entry, policies and regu-lations have been established in the region. For exam-ple, feed-in tariffs (FITs) and renewable portfolio stand-ards (RPS) have driven the market to procure renewable electricity by setting the price or amount of energy. Auc-tions have also been held in which a specific capacity or energy is competitively procured. FIT rates are set administratively, while auctions typically have set rates through periodic competition (Vergara et al., 2013a).
In some cases, onsite or offsite self-supply regulations that enable and encourage consumers to generate their own electricity from renewables have been established. In the Caribbean, countries such as Barbados, Grenada, Jamaica and St. Lucia have introduced different versions of net metering and net billing policies that allow onsite generation to be credited against customer electricity bills at or below the retail electricity rate.
Other tools are being used to strengthen the enabling environment for renewable energy (e.g. streamlined permitting, property tax exemptions, import tax ex-emptions), provide market support (outreach, educa-tion, capacity-building, institutional strengthening) and enhance the contribution of NRTs to local devel-opment. While these policies have played an important role in promoting the market in the region and are still very much required, there is mounting evidence that the shift in relative competitiveness (discussed later in this chapter) is having an effect.
2.5 RENEWABLE ENERGY TARGETS
There is considerable movement in the setting of targets for renewables, including in: a) some of the economies with the most intensive power sectors in Latin America (Chile and Mexico); b) some of the countries with the most ambitious and successful renewable energy pro-grams (Costa Rica, Nicaragua, Uruguay); and c) other countries with a significant share of renewables in their current power matrix (Brazil, Colombia, Peru).
Mexico and Chile, with some of the most carbon-in-tensive power systems in the region, have, among other things, established clear goals for renewable energy. In Mexico, its Climate Change Plan (Vision 10, 20, 40) (NCCS, 2013) has established a 50% renewables goal in power generation by around 2050. Chile has indicated in its energy plan an intention to be 20% renewable in power generation by 2025 (Del Campo, 2012) and recently announced a target of 70% by 2050 (EFE, 2015). Given the current make-up of their power respective matrixes, these goals amount to very substan-tial changes in fossil fuel use.
Brazil, while already a global leader on renewa-ble energy for power generation, has recently es-tablished an additional and substantial goal that would increase the share of renewables from re-sources other than hydro to the level of 20% by 2030. Brazil’s intentions were announced in the run up to COP 21, and when achieved would translate into an equivalent 24 GW of non-traditional renewables by 2030. Brazil’s intentions, given their magnitude, also have the potential to contribute to the development of industrial supply chains in the region.
Uruguay, Nicaragua, Ecuador and Costa Rica are also notable examples of countries establishing ambitious and in some ways exemplary goals and carrying out early actions to arrive at them. For ex-ample, Uruguay has indicated its intention to go car-bon-free in its power sector by 2020 and already has a share of wind energy in its power matrix that surpasses Denmark’s! In 2015, Costa Rica managed to operate its power system with no fossil fuels for an extended period and has announced its intention to transform its entire economy so that it is carbon-neutral by 2020. Nicara-gua, though facing many development needs, has still managed to move rapidly to shift its power matrix to-wards renewables. These smaller countries are in effect providing a practical example of how to move along a low-carbon pathway in power generation.
Paraguay is indicative of the potential nature of power generation in the region. The country is already 100% renewable in its power sector thanks to the large hydro endowment and multinational projects (Yacireta and Itaipu). One of its largest exports is hydropower. As a result, Paraguay should be a good testing ground for use of the power sector to influence energy consumption in other sectors of the economy.
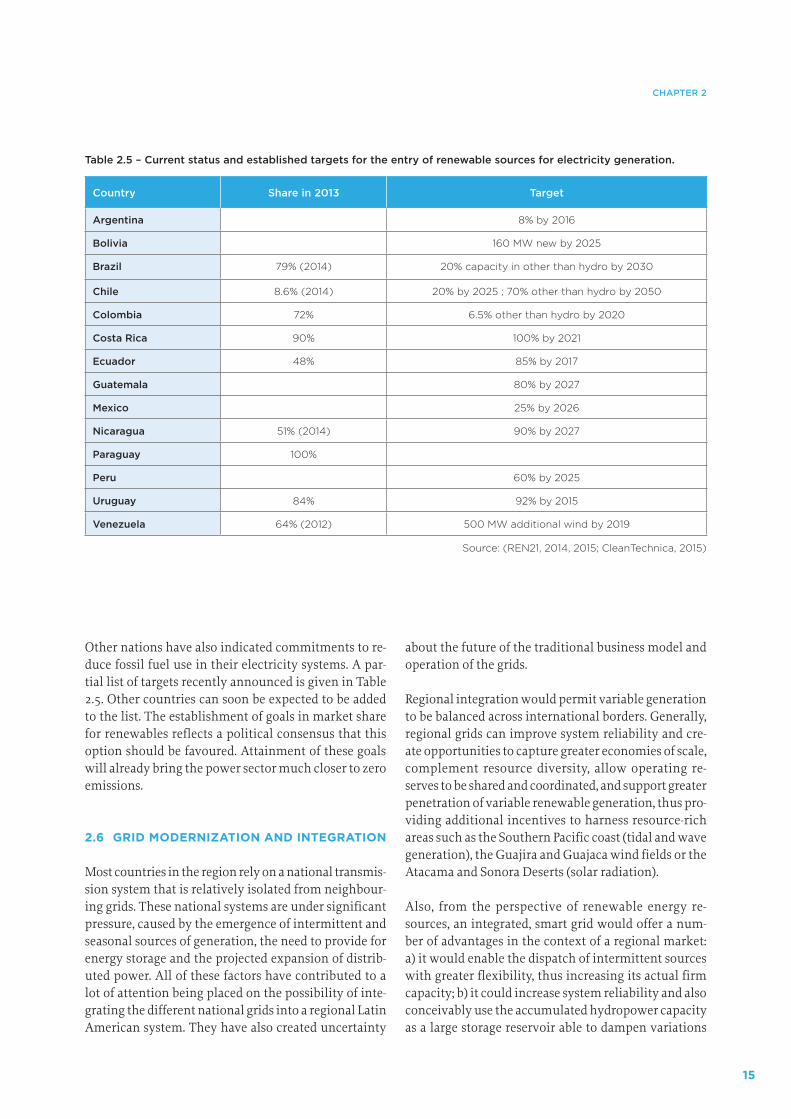
15
CHAPTER 2
Other nations have also indicated commitments to re-duce fossil fuel use in their electricity systems. A par-tial list of targets recently announced is given in Table 2.5. Other countries can soon be expected to be added to the list. The establishment of goals in market share for renewables reflects a political consensus that this option should be favoured. Attainment of these goals will already bring the power sector much closer to zero emissions.
2.6 GRID MODERNIZATION AND INTEGRATION
Most countries in the region rely on a national transmis-sion system that is relatively isolated from neighbour-ing grids. These national systems are under significant pressure, caused by the emergence of intermittent and seasonal sources of generation, the need to provide for energy storage and the projected expansion of distrib-uted power. All of these factors have contributed to a lot of attention being placed on the possibility of inte-grating the different national grids into a regional Latin American system. They have also created uncertainty
about the future of the traditional business model and operation of the grids.
Regional integration would permit variable generation to be balanced across international borders. Generally, regional grids can improve system reliability and cre-ate opportunities to capture greater economies of scale, complement resource diversity, allow operating re-serves to be shared and coordinated, and support greater penetration of variable renewable generation, thus pro-viding additional incentives to harness resource-rich areas such as the Southern Pacific coast (tidal and wave generation), the Guajira and Guajaca wind fields or the Atacama and Sonora Deserts (solar radiation).
Also, from the perspective of renewable energy re-sources, an integrated, smart grid would offer a num-ber of advantages in the context of a regional market: a) it would enable the dispatch of intermittent sources with greater flexibility, thus increasing its actual firm capacity; b) it could increase system reliability and also conceivably use the accumulated hydropower capacity as a large storage reservoir able to dampen variations
Table 2.5 – Current status and established targets for the entry of renewable sources for electricity generation.
Country Share in 2013 Target
Argentina 8% by 2016
Bolivia 160 MW new by 2025
Brazil 79% (2014) 20% capacity in other than hydro by 2030
Chile 8.6% (2014) 20% by 2025 ; 70% other than hydro by 2050
Colombia 72% 6.5% other than hydro by 2020
Costa Rica 90% 100% by 2021
Ecuador 48% 85% by 2017
Guatemala 80% by 2027
Mexico 25% by 2026
Nicaragua 51% (2014) 90% by 2027
Paraguay 100%
Peru 60% by 2025
Uruguay 84% 92% by 2015
Venezuela 64% (2012) 500 MW additional wind by 2019
Source: (REN21, 2014, 2015; CleanTechnica, 2015)
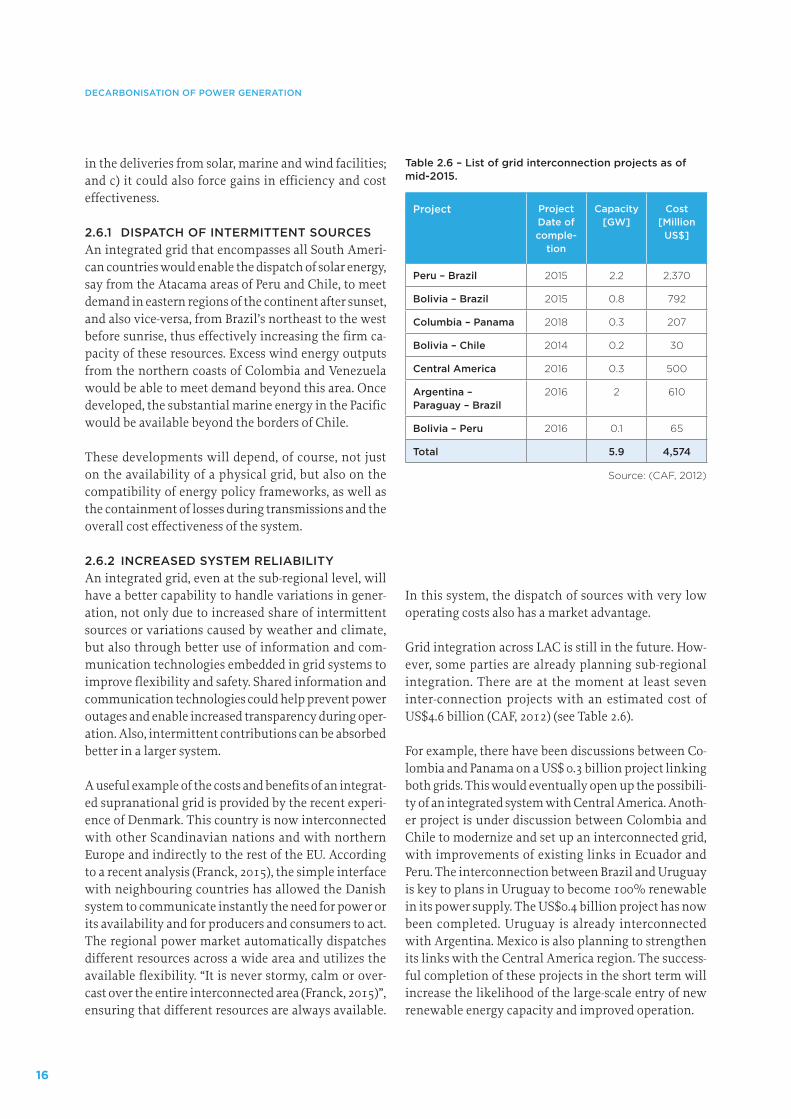
16
DECARBONISATION OF POWER GENERATION
in the deliveries from solar, marine and wind facilities; and c) it could also force gains in efficiency and cost effectiveness.
2.6.1 DISPATCH OF INTERMITTENT SOURCESAn integrated grid that encompasses all South Ameri-can countries would enable the dispatch of solar energy, say from the Atacama areas of Peru and Chile, to meet demand in eastern regions of the continent after sunset, and also vice-versa, from Brazil’s northeast to the west before sunrise, thus effectively increasing the firm ca-pacity of these resources. Excess wind energy outputs from the northern coasts of Colombia and Venezuela would be able to meet demand beyond this area. Once developed, the substantial marine energy in the Pacific would be available beyond the borders of Chile.
These developments will depend, of course, not just on the availability of a physical grid, but also on the compatibility of energy policy frameworks, as well as the containment of losses during transmissions and the overall cost effectiveness of the system.
2.6.2 INCREASED SYSTEM RELIABILITYAn integrated grid, even at the sub-regional level, will have a better capability to handle variations in gener-ation, not only due to increased share of intermittent sources or variations caused by weather and climate, but also through better use of information and com-munication technologies embedded in grid systems to improve flexibility and safety. Shared information and communication technologies could help prevent power outages and enable increased transparency during oper-ation. Also, intermittent contributions can be absorbed better in a larger system.
A useful example of the costs and benefits of an integrat-ed supranational grid is provided by the recent experi-ence of Denmark. This country is now interconnected with other Scandinavian nations and with northern Europe and indirectly to the rest of the EU. According to a recent analysis (Franck, 2015), the simple interface with neighbouring countries has allowed the Danish system to communicate instantly the need for power or its availability and for producers and consumers to act. The regional power market automatically dispatches different resources across a wide area and utilizes the available flexibility. “It is never stormy, calm or over-cast over the entire interconnected area (Franck, 2015)”, ensuring that different resources are always available.
In this system, the dispatch of sources with very low operating costs also has a market advantage.
Grid integration across LAC is still in the future. How-ever, some parties are already planning sub-regional integration. There are at the moment at least seven inter-connection projects with an estimated cost of US$4.6 billion (CAF, 2012) (see Table 2.6).
For example, there have been discussions between Co-lombia and Panama on a US$ 0.3 billion project linking both grids. This would eventually open up the possibili-ty of an integrated system with Central America. Anoth-er project is under discussion between Colombia and Chile to modernize and set up an interconnected grid, with improvements of existing links in Ecuador and Peru. The interconnection between Brazil and Uruguay is key to plans in Uruguay to become 100% renewable in its power supply. The US$0.4 billion project has now been completed. Uruguay is already interconnected with Argentina. Mexico is also planning to strengthen its links with the Central America region. The success-ful completion of these projects in the short term will increase the likelihood of the large-scale entry of new renewable energy capacity and improved operation.
Table 2.6 – List of grid interconnection projects as of mid-2015.
Project Project Date of comple-
tion
Capacity [GW]
Cost [Million
US$]
Peru – Brazil 2015 2.2 2,370
Bolivia – Brazil 2015 0.8 792
Columbia – Panama 2018 0.3 207
Bolivia – Chile 2014 0.2 30
Central America 2016 0.3 500
Argentina – Paraguay – Brazil
2016 2 610
Bolivia – Peru 2016 0.1 65
Total 5.9 4,574
Source: (CAF, 2012)
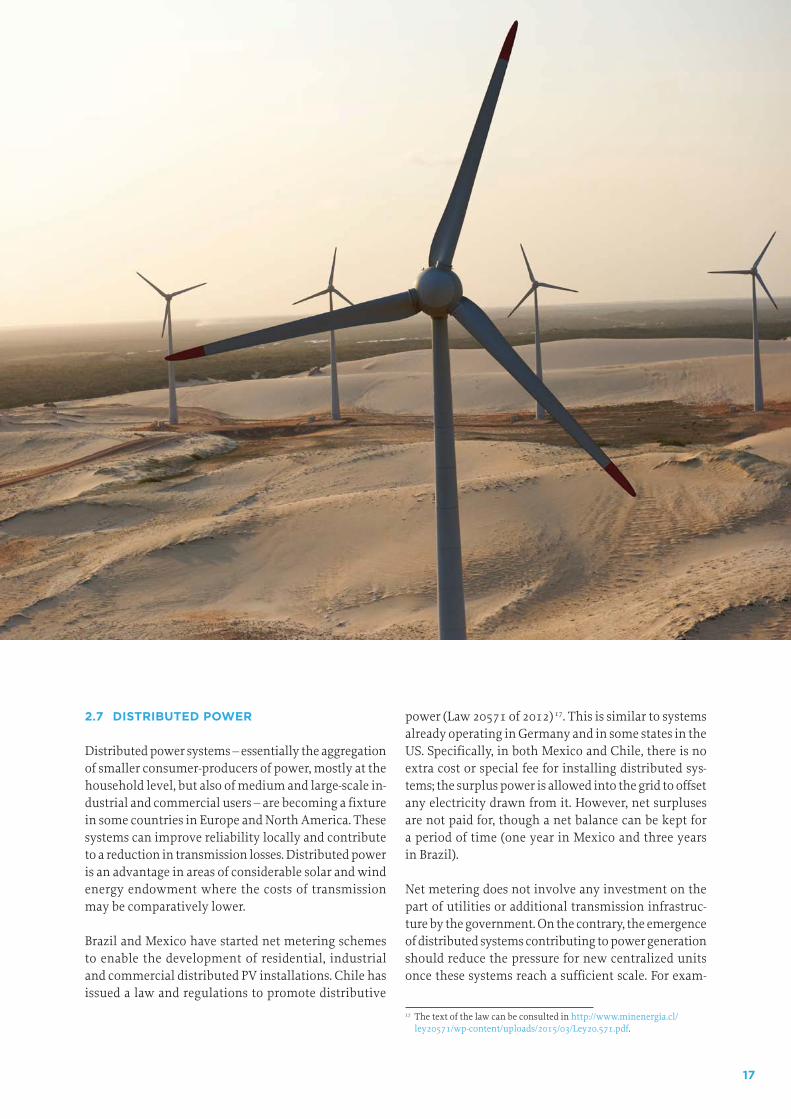
17
2.7 DISTRIBUTED POWER
Distributed power systems – essentially the aggregation of smaller consumer-producers of power, mostly at the household level, but also of medium and large-scale in-dustrial and commercial users – are becoming a fixture in some countries in Europe and North America. These systems can improve reliability locally and contribute to a reduction in transmission losses. Distributed power is an advantage in areas of considerable solar and wind energy endowment where the costs of transmission may be comparatively lower.
Brazil and Mexico have started net metering schemes to enable the development of residential, industrial and commercial distributed PV installations. Chile has issued a law and regulations to promote distributive
power (Law 20571 of 2012) 17. This is similar to systems already operating in Germany and in some states in the US. Specifically, in both Mexico and Chile, there is no extra cost or special fee for installing distributed sys-tems; the surplus power is allowed into the grid to offset any electricity drawn from it. However, net surpluses are not paid for, though a net balance can be kept for a period of time (one year in Mexico and three years in Brazil).
Net metering does not involve any investment on the part of utilities or additional transmission infrastruc-ture by the government. On the contrary, the emergence of distributed systems contributing to power generation should reduce the pressure for new centralized units once these systems reach a sufficient scale. For exam-
17 The text of the law can be consulted in http://www.minenergia.cl/ley20571/wp-content/uploads/2015/03/Ley20.571.pdf.
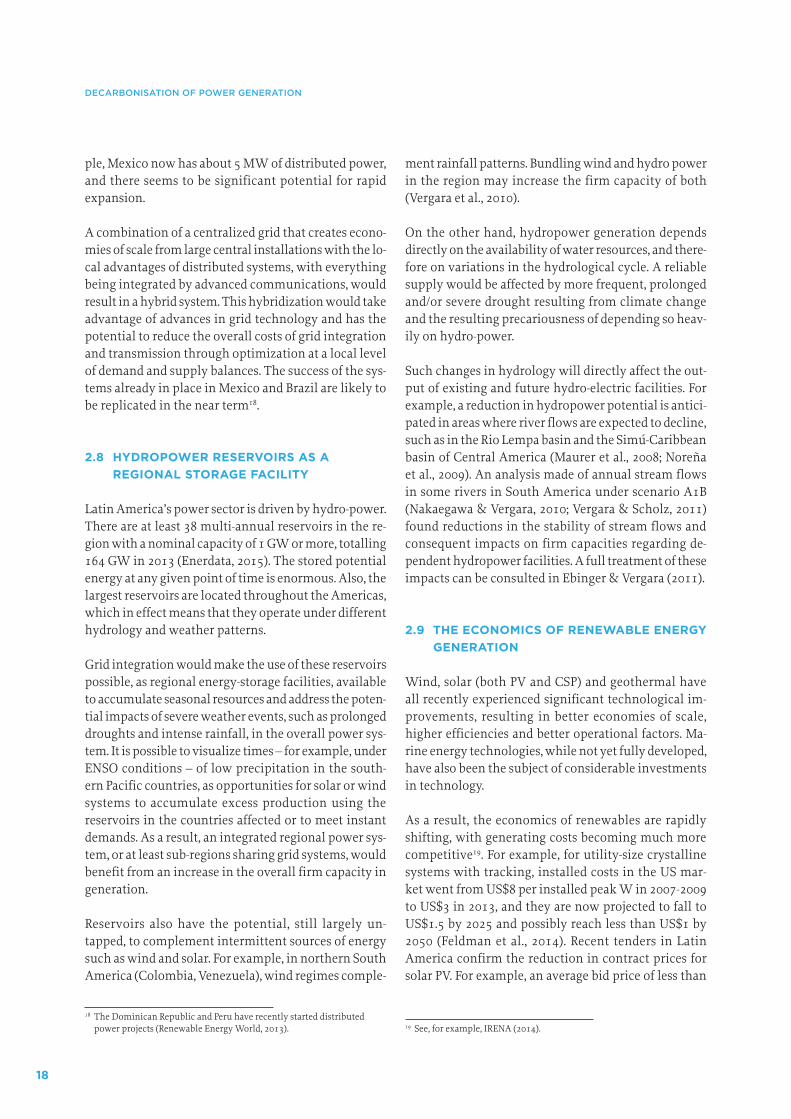
18
DECARBONISATION OF POWER GENERATION
ple, Mexico now has about 5 MW of distributed power, and there seems to be significant potential for rapid expansion.
A combination of a centralized grid that creates econo-mies of scale from large central installations with the lo-cal advantages of distributed systems, with everything being integrated by advanced communications, would result in a hybrid system. This hybridization would take advantage of advances in grid technology and has the potential to reduce the overall costs of grid integration and transmission through optimization at a local level of demand and supply balances. The success of the sys-tems already in place in Mexico and Brazil are likely to be replicated in the near term18.
2.8 HYDROPOWER RESERVOIRS AS A REGIONAL STORAGE FACILITY
Latin America’s power sector is driven by hydro-power. There are at least 38 multi-annual reservoirs in the re-gion with a nominal capacity of 1 GW or more, totalling 164 GW in 2013 (Enerdata, 2015). The stored potential energy at any given point of time is enormous. Also, the largest reservoirs are located throughout the Americas, which in effect means that they operate under different hydrology and weather patterns.
Grid integration would make the use of these reservoirs possible, as regional energy-storage facilities, available to accumulate seasonal resources and address the poten-tial impacts of severe weather events, such as prolonged droughts and intense rainfall, in the overall power sys-tem. It is possible to visualize times – for example, under ENSO conditions – of low precipitation in the south-ern Pacific countries, as opportunities for solar or wind systems to accumulate excess production using the reservoirs in the countries affected or to meet instant demands. As a result, an integrated regional power sys-tem, or at least sub-regions sharing grid systems, would benefit from an increase in the overall firm capacity in generation.
Reservoirs also have the potential, still largely un-tapped, to complement intermittent sources of energy such as wind and solar. For example, in northern South America (Colombia, Venezuela), wind regimes comple-
18 The Dominican Republic and Peru have recently started distributed power projects (Renewable Energy World, 2013).
ment rainfall patterns. Bundling wind and hydro power in the region may increase the firm capacity of both (Vergara et al., 2010).
On the other hand, hydropower generation depends directly on the availability of water resources, and there-fore on variations in the hydrological cycle. A reliable supply would be affected by more frequent, prolonged and/or severe drought resulting from climate change and the resulting precariousness of depending so heav-ily on hydro-power.
Such changes in hydrology will directly affect the out-put of existing and future hydro-electric facilities. For example, a reduction in hydropower potential is antici-pated in areas where river flows are expected to decline, such as in the Rio Lempa basin and the Simú-Caribbean basin of Central America (Maurer et al., 2008; Noreña et al., 2009). An analysis made of annual stream flows in some rivers in South America under scenario A1B (Nakaegawa & Vergara, 2010; Vergara & Scholz, 2011) found reductions in the stability of stream flows and consequent impacts on firm capacities regarding de-pendent hydropower facilities. A full treatment of these impacts can be consulted in Ebinger & Vergara (2011).
2.9 THE ECONOMICS OF RENEWABLE ENERGY GENERATION
Wind, solar (both PV and CSP) and geothermal have all recently experienced significant technological im-provements, resulting in better economies of scale, higher efficiencies and better operational factors. Ma-rine energy technologies, while not yet fully developed, have also been the subject of considerable investments in technology.
As a result, the economics of renewables are rapidly shifting, with generating costs becoming much more competitive19. For example, for utility-size crystalline systems with tracking, installed costs in the US mar-ket went from US$8 per installed peak W in 2007-2009 to US$3 in 2013, and they are now projected to fall to US$1.5 by 2025 and possibly reach less than US$1 by 2050 (Feldman et al., 2014). Recent tenders in Latin America confirm the reduction in contract prices for solar PV. For example, an average bid price of less than
19 See, for example, IRENA (2014).
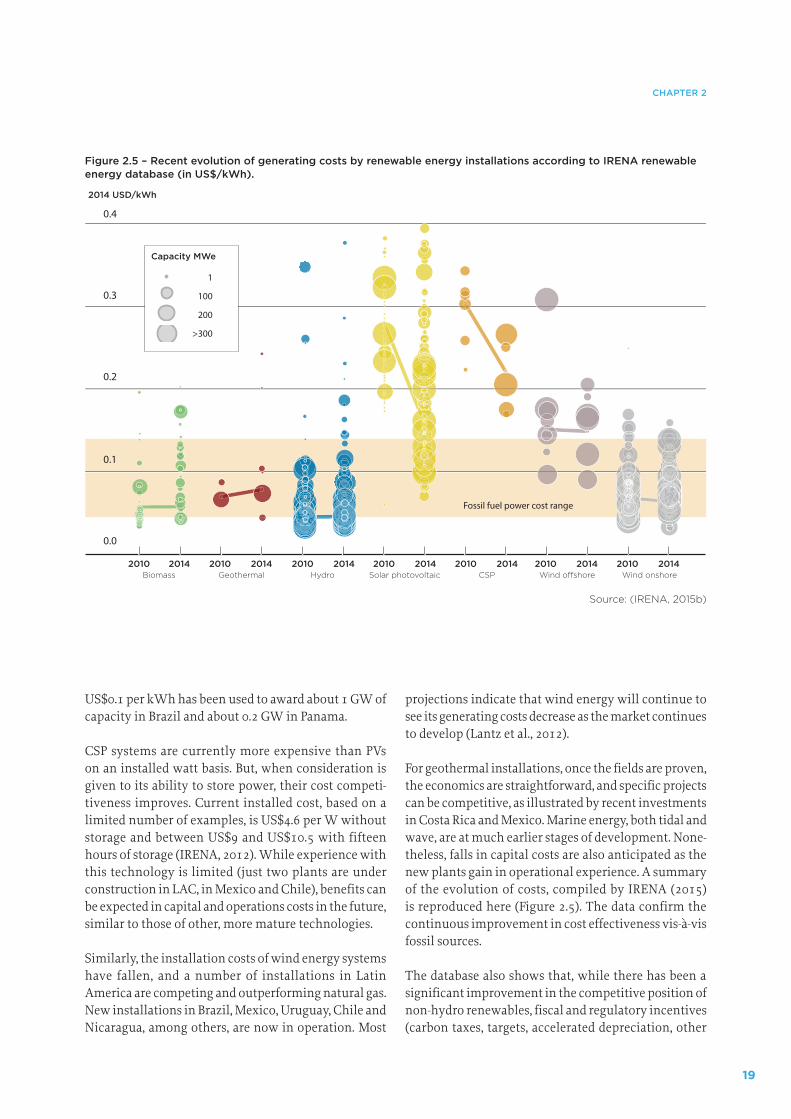
19
CHAPTER 2
US$0.1 per kWh has been used to award about 1 GW of capacity in Brazil and about 0.2 GW in Panama.
CSP systems are currently more expensive than PVs on an installed watt basis. But, when consideration is given to its ability to store power, their cost competi-tiveness improves. Current installed cost, based on a limited number of examples, is US$4.6 per W without storage and between US$9 and US$10.5 with fifteen hours of storage (IRENA, 2012). While experience with this technology is limited (just two plants are under construction in LAC, in Mexico and Chile), benefits can be expected in capital and operations costs in the future, similar to those of other, more mature technologies.
Similarly, the installation costs of wind energy systems have fallen, and a number of installations in Latin America are competing and outperforming natural gas. New installations in Brazil, Mexico, Uruguay, Chile and Nicaragua, among others, are now in operation. Most
0.4
0.3
0.2
0.1
0.0
Fossil fuel power cost range
1
100
200
>300
Capacity MWe
2010 2014
2014 USD/kWh
Capacity MWe
2010 2010 2010 2010 2010 20102014 2014 2014 2014 2014 2014Wind onshoreWind offshoreCSPHydroGeothermalBiomass Solar photovoltaic
Figure 2.5 – Recent evolution of generating costs by renewable energy installations according to IRENA renewable energy database (in US$/kWh).
Source: (IRENA, 2015b)
projections indicate that wind energy will continue to see its generating costs decrease as the market continues to develop (Lantz et al., 2012).
For geothermal installations, once the fields are proven, the economics are straightforward, and specific projects can be competitive, as illustrated by recent investments in Costa Rica and Mexico. Marine energy, both tidal and wave, are at much earlier stages of development. None-theless, falls in capital costs are also anticipated as the new plants gain in operational experience. A summary of the evolution of costs, compiled by IRENA (2015) is reproduced here (Figure 2.5). The data confirm the continuous improvement in cost effectiveness vis-à-vis fossil sources.
The database also shows that, while there has been a significant improvement in the competitive position of non-hydro renewables, fiscal and regulatory incentives (carbon taxes, targets, accelerated depreciation, other
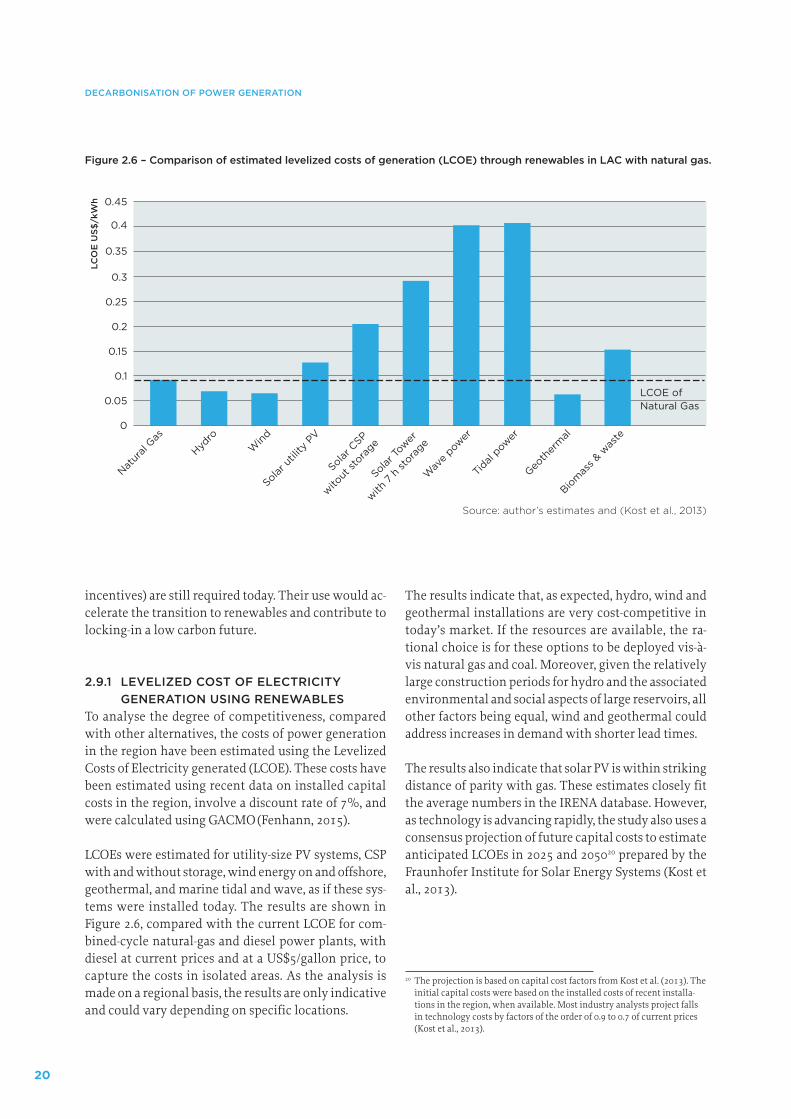
20
DECARBONISATION OF POWER GENERATION
incentives) are still required today. Their use would ac-celerate the transition to renewables and contribute to locking-in a low carbon future.
2.9.1 LEVELIZED COST OF ELECTRICITY GENERATION USING RENEWABLES
To analyse the degree of competitiveness, compared with other alternatives, the costs of power generation in the region have been estimated using the Levelized Costs of Electricity generated (LCOE). These costs have been estimated using recent data on installed capital costs in the region, involve a discount rate of 7%, and were calculated using GACMO (Fenhann, 2015).
LCOEs were estimated for utility-size PV systems, CSP with and without storage, wind energy on and offshore, geothermal, and marine tidal and wave, as if these sys-tems were installed today. The results are shown in Figure 2.6, compared with the current LCOE for com-bined-cycle natural-gas and diesel power plants, with diesel at current prices and at a US$5/gallon price, to capture the costs in isolated areas. As the analysis is made on a regional basis, the results are only indicative and could vary depending on specific locations.
The results indicate that, as expected, hydro, wind and geothermal installations are very cost-competitive in today’s market. If the resources are available, the ra-tional choice is for these options to be deployed vis-à-vis natural gas and coal. Moreover, given the relatively large construction periods for hydro and the associated environmental and social aspects of large reservoirs, all other factors being equal, wind and geothermal could address increases in demand with shorter lead times.
The results also indicate that solar PV is within striking distance of parity with gas. These estimates closely fit the average numbers in the IRENA database. However, as technology is advancing rapidly, the study also uses a consensus projection of future capital costs to estimate anticipated LCOEs in 2025 and 205020 prepared by the Fraunhofer Institute for Solar Energy Systems (Kost et al., 2013).
20 The projection is based on capital cost factors from Kost et al. (2013). The initial capital costs were based on the installed costs of recent installa-tions in the region, when available. Most industry analysts project falls in technology costs by factors of the order of 0.9 to 0.7 of current prices (Kost et al., 2013).
0
Natur
al Gas
Hydro
Win
d
Solar u
tility
PV
Solar C
SP
witout
stora
ge
Solar To
wer
with 7
h st
orage
Wav
e pow
er
Tidal
power
Geoth
erm
al
Biom
ass &
was
te
LCOE ofNatural Gas0.05
0.1
0.15
0.2
0.25
0.3
0.35
0.4
0.45
LCO
E U
S$/k
Wh
Figure 2.6 – Comparison of estimated levelized costs of generation (LCOE) through renewables in LAC with natural gas.
Source: author’s estimates and (Kost et al., 2013)
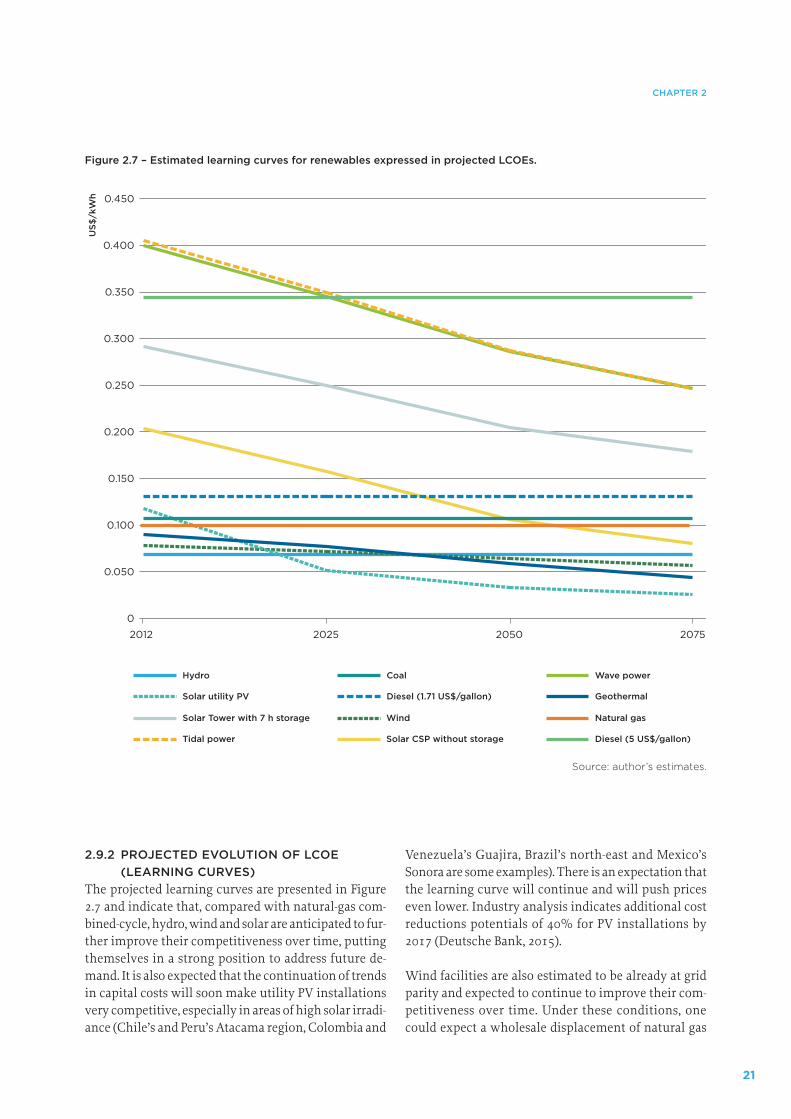
21
CHAPTER 2
2.9.2 PROJECTED EVOLUTION OF LCOE (LEARNING CURVES)
The projected learning curves are presented in Figure 2.7 and indicate that, compared with natural-gas com-bined-cycle, hydro, wind and solar are anticipated to fur-ther improve their competitiveness over time, putting themselves in a strong position to address future de-mand. It is also expected that the continuation of trends in capital costs will soon make utility PV installations very competitive, especially in areas of high solar irradi-ance (Chile’s and Peru’s Atacama region, Colombia and
Venezuela’s Guajira, Brazil’s north-east and Mexico’s Sonora are some examples). There is an expectation that the learning curve will continue and will push prices even lower. Industry analysis indicates additional cost reductions potentials of 40% for PV installations by 2017 (Deutsche Bank, 2015).
Wind facilities are also estimated to be already at grid parity and expected to continue to improve their com-petitiveness over time. Under these conditions, one could expect a wholesale displacement of natural gas
US$
/kW
h
Tidal power
0
0.050
0.100
0.150
0.200
0.250
0.300
0.350
0.400
0.450
2075205020252012
Geothermal
Coal
Diesel (1.71 US$/gallon)
Natural gas
Diesel (5 US$/gallon)
Hydro
Wind
Solar utility PV
Solar Tower with 7 h storage
Solar CSP without storage
Wave power
Figure 2.7 – Estimated learning curves for renewables expressed in projected LCOEs.
Source: author’s estimates.
22
DECARBONISATION OF POWER GENERATION
installations as a prospective supplier of power in the region. The analysis also indicates that PV and wind in-stallations will even compete with hydro installations in the short term (Figure 2.7).
The estimates also indicate the likelihood of CSP com-peting in the medium term with future natural-gas or coal installations as an option of choice. However, as shown in the case of Chile, CSP installations with storage capacity can already address local demands in areas of high irradiance. Marine resources are still more expensive for the main grid applications. Still, in situ-ations where the option is diesel-powered generation in isolated coastal communities, or the costs of trans-porting fuels are high, there are scenarios under which marine resources could be an option of choice.
On the basis of these estimates, there is an expectation that the improved outlook for supportive policies and incentives; the prospects for grid modernization and in-tegration; but above all the shifting financial advantage of wind and solar right now and of other technologies in the future, provide a sufficient basis on which a scenario of full decarbonisation of the power sector can be built. This scenario, presented later in the report, is predicat-ed on the assumption that market conditions already enable new demand to be met through renewables and that renewables, in the form of an increasing array of technologies, will be able to displace existing fossil-fuel capacity and dominate the market for new installations.
Finally, from a job generation perspective, the renew-able energy industry is much more labour-intensive than highly mechanized and capital-intensive thermal power plants like coal- or gas-powered units and would thus result in significantly more job creation. This will result in additional benefits for the regional economy. For example, it has been estimated that in the US, the introduction of a 25% renewable energy standard by 2025 would create more than three times as many jobs as producing an equivalent amount of electricity from fossil fuels (UCS, 2009).
This is not to say that the supporting policy, regula-tory and incentive framework is not required. On the contrary, even if economic conditions are expected in-creasingly to favour renewables over time, there is all the more reason to promote today the foundation and acceleration of this transition.
2.9.3 SOME BARRIERS TO THE DECAR-BONISATION OF THE POWER SECTOR
While this analysis finds a generally supportive policy environment, there are some important barriers whose removal can facilitate the more rapid market entry of renewables in Latin America. These include:
a) The political will to advance in the grid-integrationprocess in the region. The costs and technical issues of grid integration are not judged to be a major obstacle, as technologies and options are also available to reduce environmental and social concerns. Instead, a decision by neighbouring countries to integrate – a political de-cision – is what is required in most cases. Reliability and intermittency will be much less of a concern with the widespread availability of hydropower as back-up and storage, once intra-country integration has been reached.
b) Fossil-fuel subsidies, in particular for coal and gas, arean important obstacle to market entry. The estimated 1% of GDP in fossil-fuel subsidies in the region (about US$ 00 billion per year) (Di Bella et al., 2015) have no rationale for continuing, especially as these subsidies delay the elimination of negative externalities on cli-mate. The removal of these subsidies will affect the coal and gas industries in the region.
c) The failure to internalize the climate costs of fossilfuel-based generation is a major barrier. In the absence of a well-structured carbon market, some countries, like Mexico and Chile, have enacted carbon taxes, partly in an effort to account for these costs. However, most nations in the region lack this mechanism, and those that are available may still be at the lower range21 of the costs of climate impacts.
d) The adoption of rules to allow for distributed powersystems, including net metering throughout, the re-gion would promote the deployment of household and commercial solar installations, which may become an important element of the regional power matrix. Wide-spread use of distributed systems will affect transmis-sion utilities by reducing their margins. The adoption
21 For example, the current value of the carbon taxes considered in Chile is about US$5 per ton CO2e. However, price projections commonly as-sumed in carbon market studies under conservative scenarios are much higher, of the order of US$20/tCO2 for the period 2020-2040 (for example, see Luckow et al. (2015)). Also, the estimated financial consequence of CO2 emissions into the atmosphere as calculated by Stern is US$100/ton of CO2 (Stern, 2006).
23
CHAPTER 2
of a set of consistent rules throughout the region would greatly assist in the deployment of distributed systems.
Some may ask, however, why nations in the region would invest in renewables today if there is an expec-tation of even higher levels of relative competitiveness down the road? Early movers and companies that find and fill market niches ahead of the competition do have an edge in the long term and are better positioned to take advantage of market developments. Moving early in this direction will send a signal to the market to de-velop the necessary systems, components, value-chains, and institutional and engineering capabilities, thus pre-paring the economic production systems and ensuring value-added gains in other sectors. Also, shifting now to a renewable power base would lock in a long-term low price that is often lower than traditional energy sources and provides hedges against future fossil-fuel price hikes and volatility.
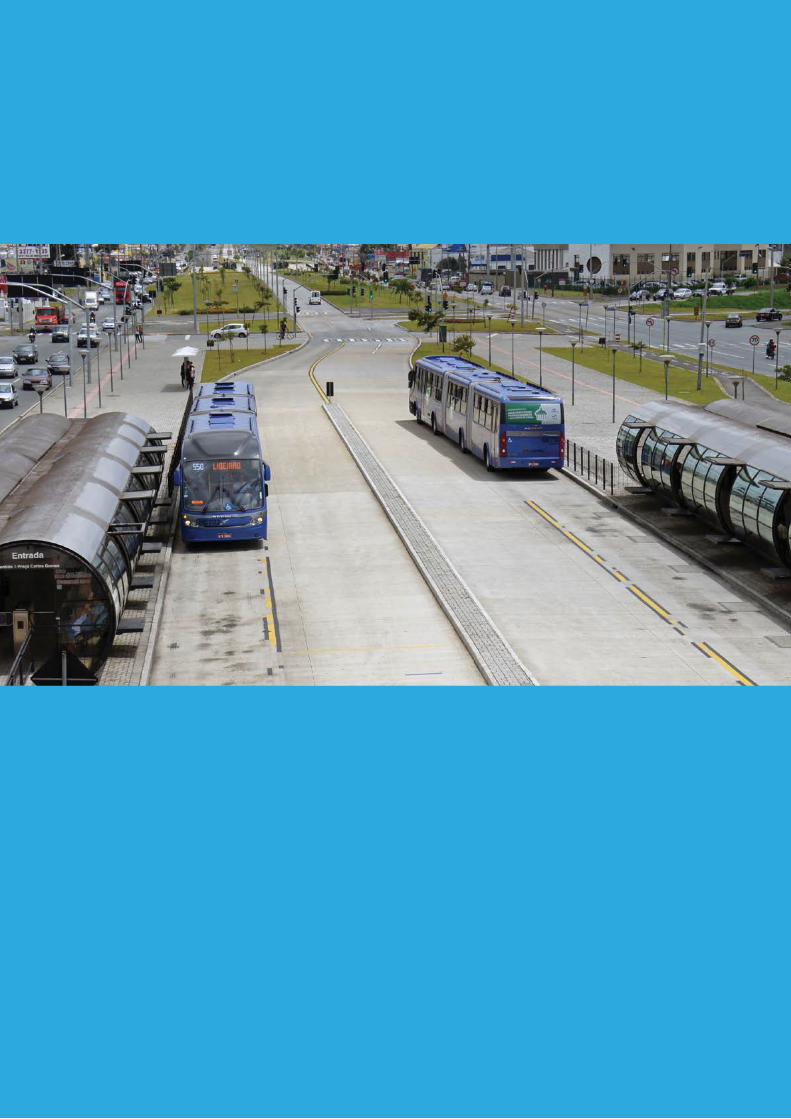
24
ANALYSIS OF GRID EMISSION FACTORS FOR THE ELECTRICITY SECTOR IN CARIBBEAN COUNTRIES
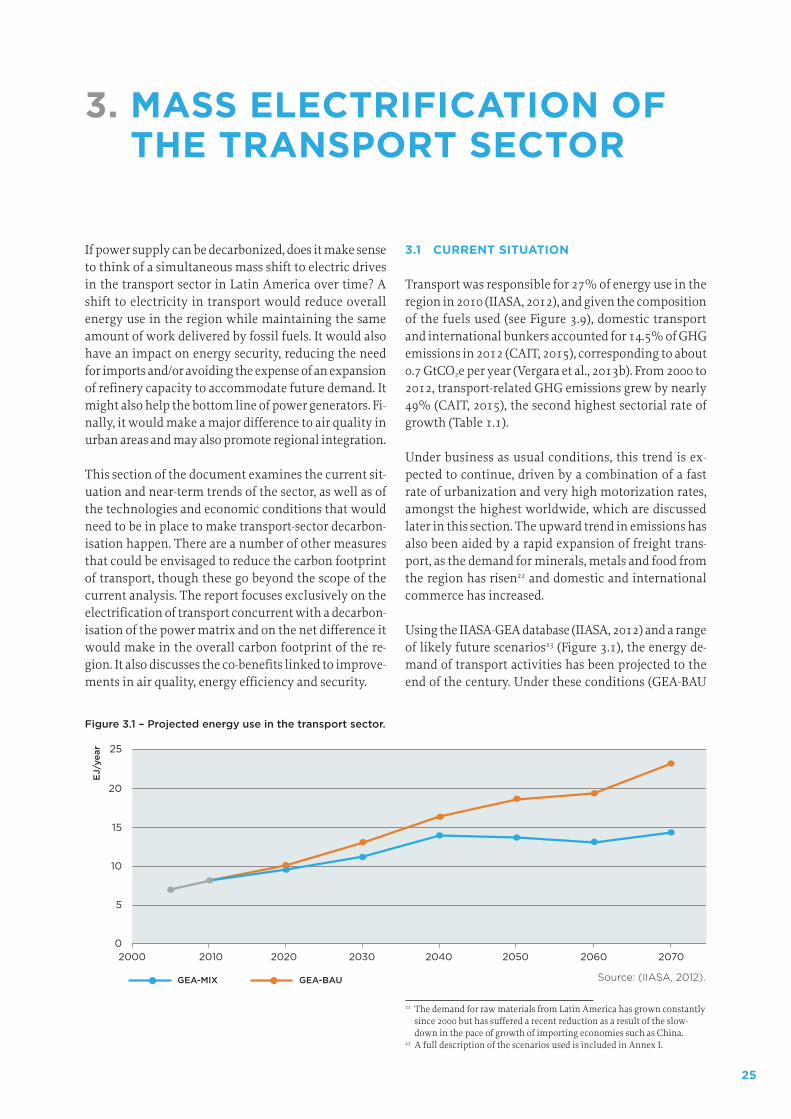
25
3. MASS ELECTRIFICATION OF THE TRANSPORT SECTOR
If power supply can be decarbonized, does it make sense to think of a simultaneous mass shift to electric drives in the transport sector in Latin America over time? A shift to electricity in transport would reduce overall energy use in the region while maintaining the same amount of work delivered by fossil fuels. It would also have an impact on energy security, reducing the need for imports and/or avoiding the expense of an expansion of refinery capacity to accommodate future demand. It might also help the bottom line of power generators. Fi-nally, it would make a major difference to air quality in urban areas and may also promote regional integration.
This section of the document examines the current sit-uation and near-term trends of the sector, as well as of the technologies and economic conditions that would need to be in place to make transport-sector decarbon-isation happen. There are a number of other measures that could be envisaged to reduce the carbon footprint of transport, though these go beyond the scope of the current analysis. The report focuses exclusively on the electrification of transport concurrent with a decarbon-isation of the power matrix and on the net difference it would make in the overall carbon footprint of the re-gion. It also discusses the co-benefits linked to improve-ments in air quality, energy efficiency and security.
3.1 CURRENT SITUATION
Transport was responsible for 27% of energy use in the region in 2010 (IIASA, 2012), and given the composition of the fuels used (see Figure 3.9), domestic transport and international bunkers accounted for 14.5% of GHG emissions in 2012 (CAIT, 2015), corresponding to about 0.7 GtCO2e per year (Vergara et al., 2013b). From 2000 to 2012, transport-related GHG emissions grew by nearly 49% (CAIT, 2015), the second highest sectorial rate of growth (Table 1.1).
Under business as usual conditions, this trend is ex-pected to continue, driven by a combination of a fast rate of urbanization and very high motorization rates, amongst the highest worldwide, which are discussed later in this section. The upward trend in emissions has also been aided by a rapid expansion of freight trans-port, as the demand for minerals, metals and food from the region has risen22 and domestic and international commerce has increased.
Using the IIASA-GEA database (IIASA, 2012) and a range of likely future scenarios23 (Figure 3.1), the energy de-mand of transport activities has been projected to the end of the century. Under these conditions (GEA-BAU
22 The demand for raw materials from Latin America has grown constantly since 2000 but has suffered a recent reduction as a result of the slow-down in the pace of growth of importing economies such as China.
23 A full description of the scenarios used is included in Annex I.
EJ/
year
GEA-BAUGEA-MIX
0
5
10
15
20
25
2000 2010 2020 2030 2040 2050 2060 2070
Figure 3.1 – Projected energy use in the transport sector.
Source: (IIASA, 2012).
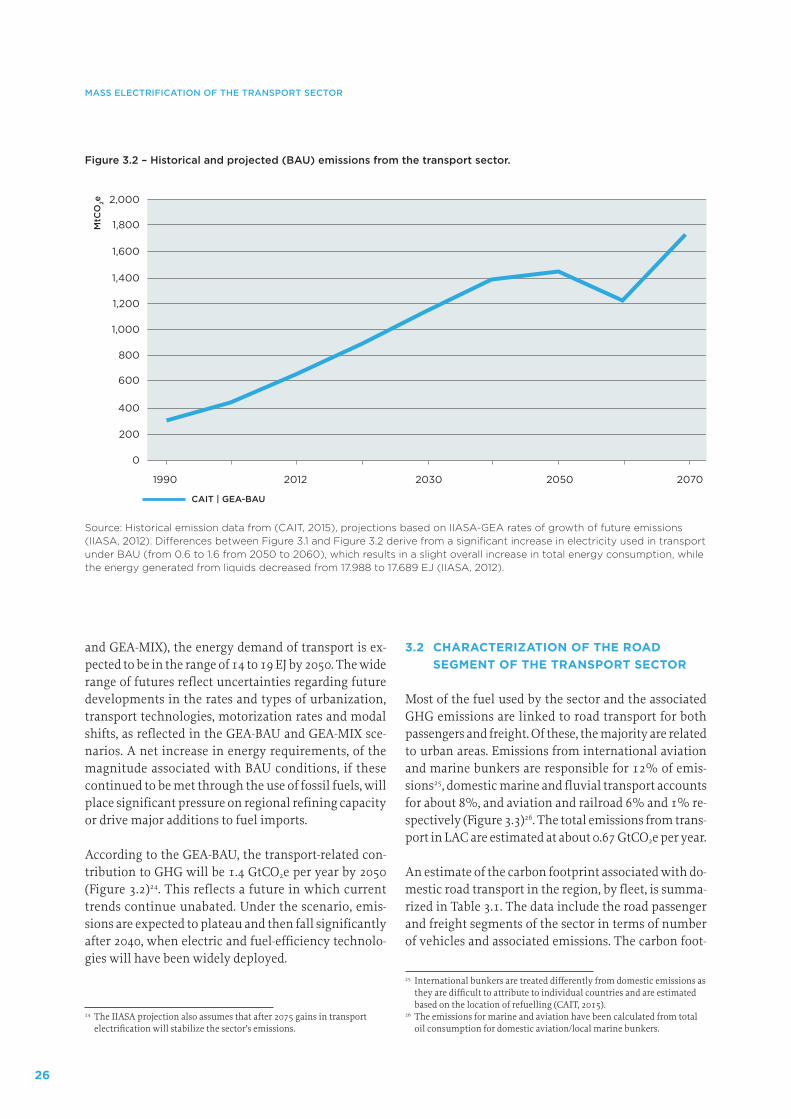
26
MASS ELECTRIFICATION OF THE TRANSPORT SECTOR
and GEA-MIX), the energy demand of transport is ex-pected to be in the range of 14 to 19 EJ by 2050. The wide range of futures reflect uncertainties regarding future developments in the rates and types of urbanization, transport technologies, motorization rates and modal shifts, as reflected in the GEA-BAU and GEA-MIX sce-narios. A net increase in energy requirements, of the magnitude associated with BAU conditions, if these continued to be met through the use of fossil fuels, will place significant pressure on regional refining capacity or drive major additions to fuel imports.
According to the GEA-BAU, the transport-related con-tribution to GHG will be 1.4 GtCO2e per year by 2050 (Figure 3.2)24. This reflects a future in which current trends continue unabated. Under the scenario, emis-sions are expected to plateau and then fall significantly after 2040, when electric and fuel-efficiency technolo-gies will have been widely deployed.
24 The IIASA projection also assumes that after 2075 gains in transport electrification will stabilize the sector’s emissions.
3.2 CHARACTERIZATION OF THE ROAD SEGMENT OF THE TRANSPORT SECTOR
Most of the fuel used by the sector and the associated GHG emissions are linked to road transport for both passengers and freight. Of these, the majority are related to urban areas. Emissions from international aviation and marine bunkers are responsible for 12% of emis-sions25, domestic marine and fluvial transport accounts for about 8%, and aviation and railroad 6% and 1% re-spectively (Figure 3.3)26. The total emissions from trans-port in LAC are estimated at about 0.67 GtCO2e per year.
An estimate of the carbon footprint associated with do-mestic road transport in the region, by fleet, is summa-rized in Table 3.1. The data include the road passenger and freight segments of the sector in terms of number of vehicles and associated emissions. The carbon foot-
25 International bunkers are treated differently from domestic emissions as they are difficult to attribute to individual countries and are estimated based on the location of refuelling (CAIT, 2015).
26 The emissions for marine and aviation have been calculated from total oil consumption for domestic aviation/local marine bunkers.
MtC
O2e
CAIT | GEA-BAU
0
600
400
200
1,400
1,200
1,000
800
1,600
1,800
2,000
1990 2012 2030 2050 2070
Source: Historical emission data from (CAIT, 2015), projections based on IIASA-GEA rates of growth of future emissions (IIASA, 2012). Differences between Figure 3.1 and Figure 3.2 derive from a significant increase in electricity used in transport under BAU (from 0.6 to 1.6 from 2050 to 2060), which results in a slight overall increase in total energy consumption, while the energy generated from liquids decreased from 17.988 to 17.689 EJ (IIASA, 2012).
Figure 3.2 – Historical and projected (BAU) emissions from the transport sector.
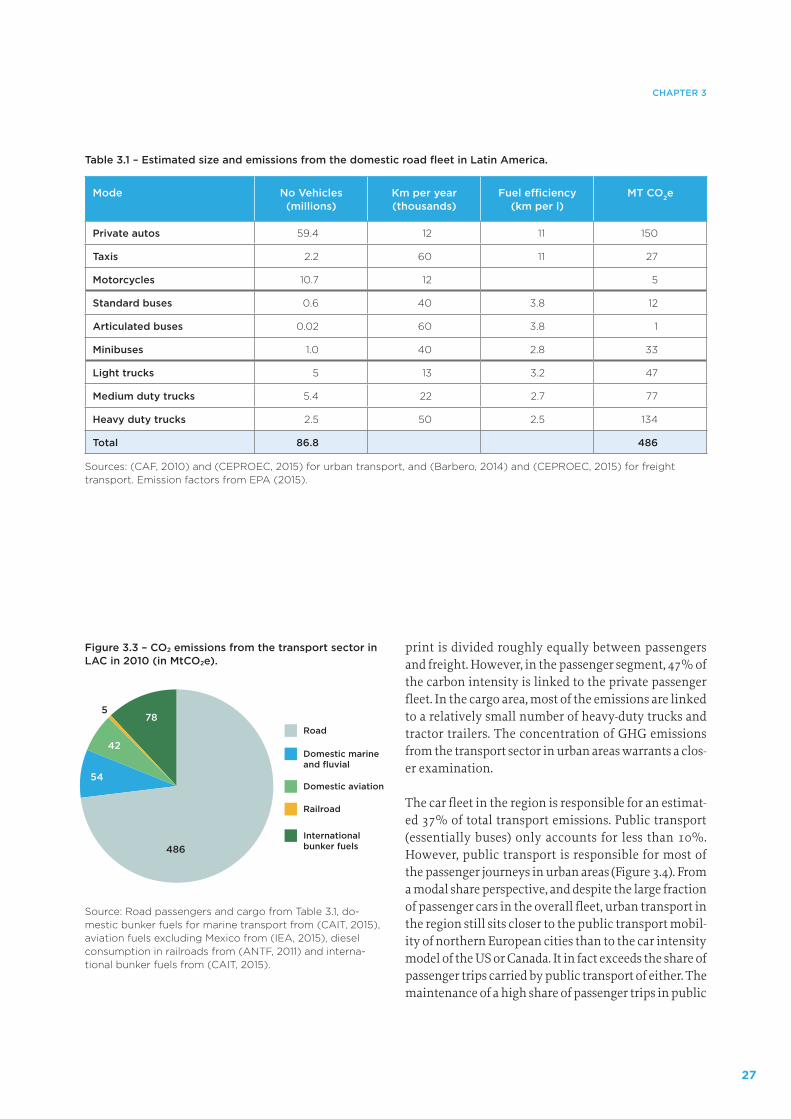
27
CHAPTER 3
print is divided roughly equally between passengers and freight. However, in the passenger segment, 47% of the carbon intensity is linked to the private passenger fleet. In the cargo area, most of the emissions are linked to a relatively small number of heavy-duty trucks and tractor trailers. The concentration of GHG emissions from the transport sector in urban areas warrants a clos-er examination.
The car fleet in the region is responsible for an estimat-ed 37% of total transport emissions. Public transport (essentially buses) only accounts for less than 10%. However, public transport is responsible for most of the passenger journeys in urban areas (Figure 3.4). From a modal share perspective, and despite the large fraction of passenger cars in the overall fleet, urban transport in the region still sits closer to the public transport mobil-ity of northern European cities than to the car intensity model of the US or Canada. It in fact exceeds the share of passenger trips carried by public transport of either. The maintenance of a high share of passenger trips in public
486
578
42
54
Road
Domestic marineand fluvial
Domestic aviation
Railroad
Internationalbunker fuels
Figure 3.3 – CO2 emissions from the transport sector in LAC in 2010 (in MtCO2e).
Source: Road passengers and cargo from Table 3.1, do-mestic bunker fuels for marine transport from (CAIT, 2015), aviation fuels excluding Mexico from (IEA, 2015), diesel consumption in railroads from (ANTF, 2011) and interna-tional bunker fuels from (CAIT, 2015).
Table 3.1 – Estimated size and emissions from the domestic road fleet in Latin America.
Mode No Vehicles (millions)
Km per year (thousands)
Fuel efficiency (km per l)
MT CO2e
Private autos 59.4 12 11 150
Taxis 2.2 60 11 27
Motorcycles 10.7 12 5
Standard buses 0.6 40 3.8 12
Articulated buses 0.02 60 3.8 1
Minibuses 1.0 40 2.8 33
Light trucks 5 13 3.2 47
Medium duty trucks 5.4 22 2.7 77
Heavy duty trucks 2.5 50 2.5 134
Total 86.8 486
Sources: (CAF, 2010) and (CEPROEC, 2015) for urban transport, and (Barbero, 2014) and (CEPROEC, 2015) for freight transport. Emission factors from EPA (2015).
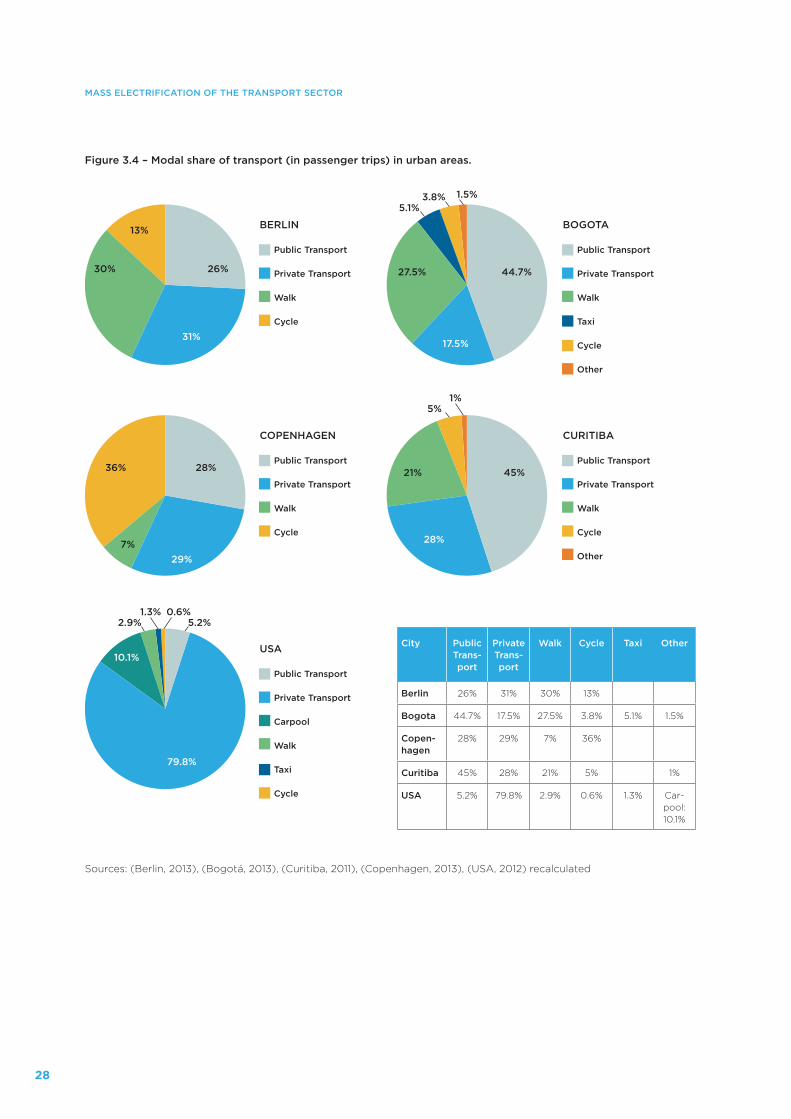
28
MASS ELECTRIFICATION OF THE TRANSPORT SECTOR
Figure 3.4 – Modal share of transport (in passenger trips) in urban areas.
Sources: (Berlin, 2013), (Bogotá, 2013), (Curitiba, 2011), (Copenhagen, 2013), (USA, 2012) recalculated
5.2%0.6%1.3%
2.9%
1%5%
3.8% 1.5%5.1%
Public Transport
Private Transport
Walk
Cycle
BERLIN
Public Transport
Private Transport
Walk
Taxi
Cycle
Other
BOGOTA
Public Transport
Private Transport
Walk
Cycle
COPENHAGEN
Public Transport
Private Transport
Carpool
Walk
Taxi
Cycle
USA
Public Transport
Private Transport
Walk
Cycle
Other
CURITIBA
79.8%
28%
29%
28% 45%
44.7%26%30%
13%
27.5%
17.5%31%
21%36%
7%
10.1%City Public
Trans-port
Private Trans-port
Walk Cycle Taxi Other
Berlin 26% 31% 30% 13%
Bogota 44.7% 17.5% 27.5% 3.8% 5.1% 1.5%
Copen-hagen
28% 29% 7% 36%
Curitiba 45% 28% 21% 5% 1%
USA 5.2% 79.8% 2.9% 0.6% 1.3% Car-pool: 10.1%
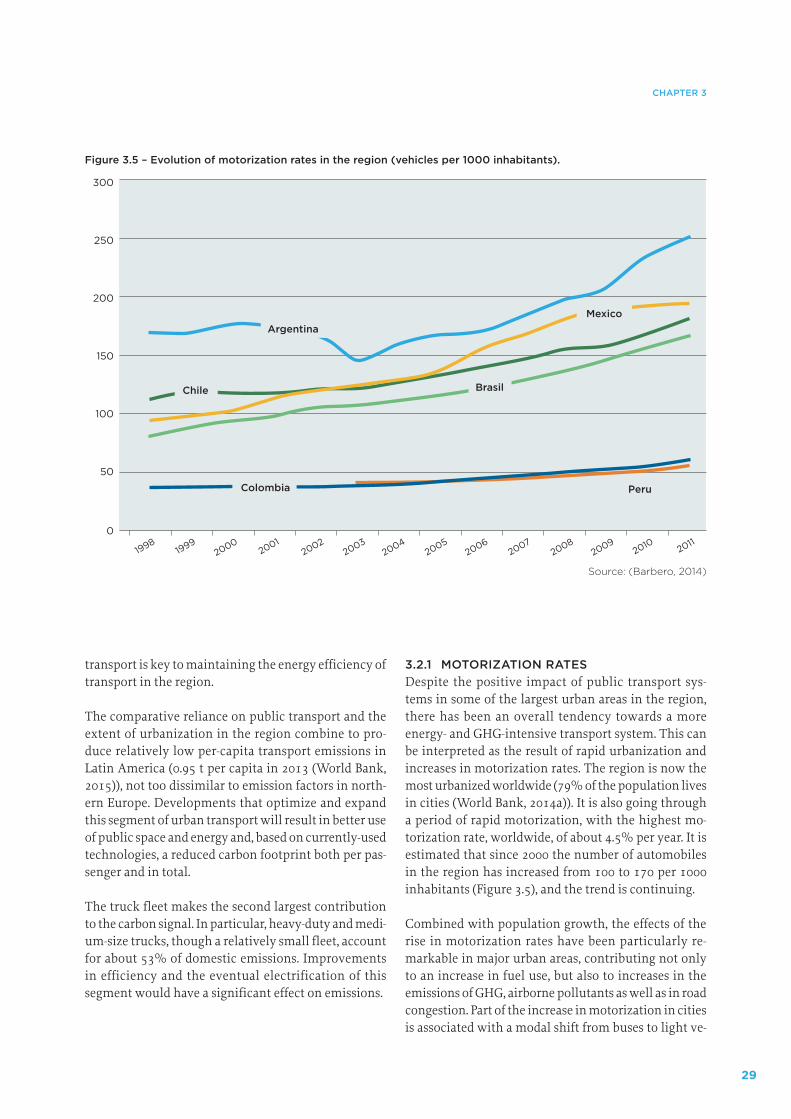
29
CHAPTER 3
transport is key to maintaining the energy efficiency of transport in the region.
The comparative reliance on public transport and the extent of urbanization in the region combine to pro-duce relatively low per-capita transport emissions in Latin America (0.95 t per capita in 2013 (World Bank, 2015)), not too dissimilar to emission factors in north-ern Europe. Developments that optimize and expand this segment of urban transport will result in better use of public space and energy and, based on currently-used technologies, a reduced carbon footprint both per pas-senger and in total.
The truck fleet makes the second largest contribution to the carbon signal. In particular, heavy-duty and medi-um-size trucks, though a relatively small fleet, account for about 53% of domestic emissions. Improvements in efficiency and the eventual electrification of this segment would have a significant effect on emissions.
3.2.1 MOTORIZATION RATESDespite the positive impact of public transport sys-tems in some of the largest urban areas in the region, there has been an overall tendency towards a more energy- and GHG-intensive transport system. This can be interpreted as the result of rapid urbanization and increases in motorization rates. The region is now the most urbanized worldwide (79% of the population lives in cities (World Bank, 2014a)). It is also going through a period of rapid motorization, with the highest mo-torization rate, worldwide, of about 4.5% per year. It is estimated that since 2000 the number of automobiles in the region has increased from 100 to 170 per 1000 inhabitants (Figure 3.5), and the trend is continuing.
Combined with population growth, the effects of the rise in motorization rates have been particularly re-markable in major urban areas, contributing not only to an increase in fuel use, but also to increases in the emissions of GHG, airborne pollutants as well as in road congestion. Part of the increase in motorization in cities is associated with a modal shift from buses to light ve-
Figure 3.5 – Evolution of motorization rates in the region (vehicles per 1000 inhabitants).
0
50
100
150
200
250
300
Peru
Brasil
MexicoArgentina
Chile
Colombia
20112010
20092008
20072006
20052004
20032002
20012000
19991998
Source: (Barbero, 2014)
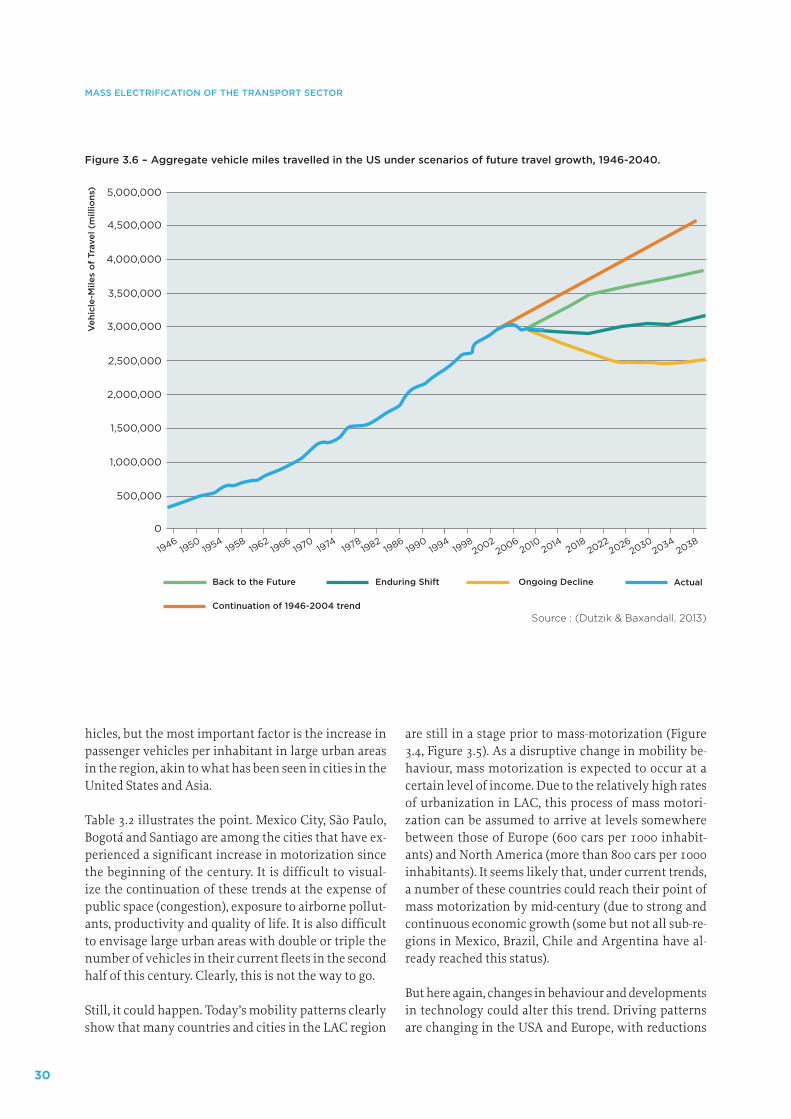
30
MASS ELECTRIFICATION OF THE TRANSPORT SECTOR
hicles, but the most important factor is the increase in passenger vehicles per inhabitant in large urban areas in the region, akin to what has been seen in cities in the United States and Asia.
Table 3.2 illustrates the point. Mexico City, São Paulo, Bogotá and Santiago are among the cities that have ex-perienced a significant increase in motorization since the beginning of the century. It is difficult to visual-ize the continuation of these trends at the expense of public space (congestion), exposure to airborne pollut-ants, productivity and quality of life. It is also difficult to envisage large urban areas with double or triple the number of vehicles in their current fleets in the second half of this century. Clearly, this is not the way to go.
Still, it could happen. Today’s mobility patterns clearly show that many countries and cities in the LAC region
0
500,000
1,000,000
1,500,000
2,000,000
2,500,000
3,000,000
3,500,000
4,000,000
4,500,000
5,000,000
20342038
20302022
20262014
20182006
201019982002
19781982
19861990
19941966
197019741962
19461950
19541958
Veh
icle
-Mile
s o
f Tr
avel
(m
illio
ns)
Enduring ShiftBack to the Future Ongoing Decline
Continuation of 1946-2004 trend
Actual
Figure 3.6 – Aggregate vehicle miles travelled in the US under scenarios of future travel growth, 1946-2040.
Source : (Dutzik & Baxandall, 2013)
are still in a stage prior to mass-motorization (Figure 3.4, Figure 3.5). As a disruptive change in mobility be-haviour, mass motorization is expected to occur at a certain level of income. Due to the relatively high rates of urbanization in LAC, this process of mass motori-zation can be assumed to arrive at levels somewhere between those of Europe (600 cars per 1000 inhabit-ants) and North America (more than 800 cars per 1000 inhabitants). It seems likely that, under current trends, a number of these countries could reach their point of mass motorization by mid-century (due to strong and continuous economic growth (some but not all sub-re-gions in Mexico, Brazil, Chile and Argentina have al-ready reached this status).
But here again, changes in behaviour and developments in technology could alter this trend. Driving patterns are changing in the USA and Europe, with reductions
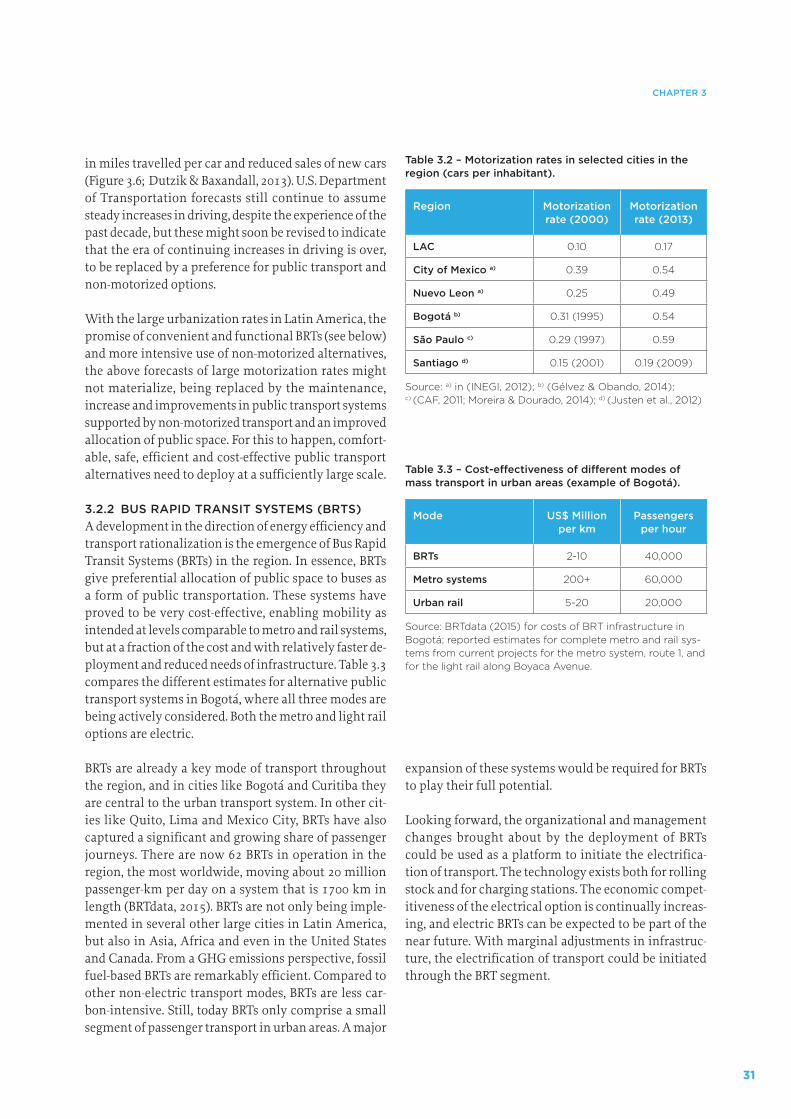
31
CHAPTER 3
in miles travelled per car and reduced sales of new cars (Figure 3.6; Dutzik & Baxandall, 2013). U.S. Department of Transportation forecasts still continue to assume steady increases in driving, despite the experience of the past decade, but these might soon be revised to indicate that the era of continuing increases in driving is over, to be replaced by a preference for public transport and non-motorized options.
With the large urbanization rates in Latin America, the promise of convenient and functional BRTs (see below) and more intensive use of non-motorized alternatives, the above forecasts of large motorization rates might not materialize, being replaced by the maintenance, increase and improvements in public transport systems supported by non-motorized transport and an improved allocation of public space. For this to happen, comfort-able, safe, efficient and cost-effective public transport alternatives need to deploy at a sufficiently large scale.
3.2.2 BUS RAPID TRANSIT SYSTEMS (BRTS)A development in the direction of energy efficiency and transport rationalization is the emergence of Bus Rapid Transit Systems (BRTs) in the region. In essence, BRTs give preferential allocation of public space to buses as a form of public transportation. These systems have proved to be very cost-effective, enabling mobility as intended at levels comparable to metro and rail systems, but at a fraction of the cost and with relatively faster de-ployment and reduced needs of infrastructure. Table 3.3 compares the different estimates for alternative public transport systems in Bogotá, where all three modes are being actively considered. Both the metro and light rail options are electric.
BRTs are already a key mode of transport throughout the region, and in cities like Bogotá and Curitiba they are central to the urban transport system. In other cit-ies like Quito, Lima and Mexico City, BRTs have also captured a significant and growing share of passenger journeys. There are now 62 BRTs in operation in the region, the most worldwide, moving about 20 million passenger-km per day on a system that is 1700 km in length (BRTdata, 2015). BRTs are not only being imple-mented in several other large cities in Latin America, but also in Asia, Africa and even in the United States and Canada. From a GHG emissions perspective, fossil fuel-based BRTs are remarkably efficient. Compared to other non-electric transport modes, BRTs are less car-bon-intensive. Still, today BRTs only comprise a small segment of passenger transport in urban areas. A major
expansion of these systems would be required for BRTs to play their full potential.
Looking forward, the organizational and management changes brought about by the deployment of BRTs could be used as a platform to initiate the electrifica-tion of transport. The technology exists both for rolling stock and for charging stations. The economic compet-itiveness of the electrical option is continually increas-ing, and electric BRTs can be expected to be part of the near future. With marginal adjustments in infrastruc-ture, the electrification of transport could be initiated through the BRT segment.
Table 3.2 – Motorization rates in selected cities in the region (cars per inhabitant).
Region Motorization rate (2000)
Motorization rate (2013)
LAC 0.10 0.17
City of Mexico a) 0.39 0.54
Nuevo Leon a) 0.25 0.49
Bogotá b) 0.31 (1995) 0.54
São Paulo c) 0.29 (1997) 0.59
Santiago d) 0.15 (2001) 0.19 (2009)
Source: a) in (INEGI, 2012); b) (Gélvez & Obando, 2014); c) (CAF, 2011; Moreira & Dourado, 2014); d) (Justen et al., 2012)
Table 3.3 – Cost-effectiveness of different modes of mass transport in urban areas (example of Bogotá).
Mode US$ Million per km
Passengers per hour
BRTs 2-10 40,000
Metro systems 200+ 60,000
Urban rail 5-20 20,000
Source: BRTdata (2015) for costs of BRT infrastructure in Bogotá; reported estimates for complete metro and rail sys-tems from current projects for the metro system, route 1, and for the light rail along Boyaca Avenue.
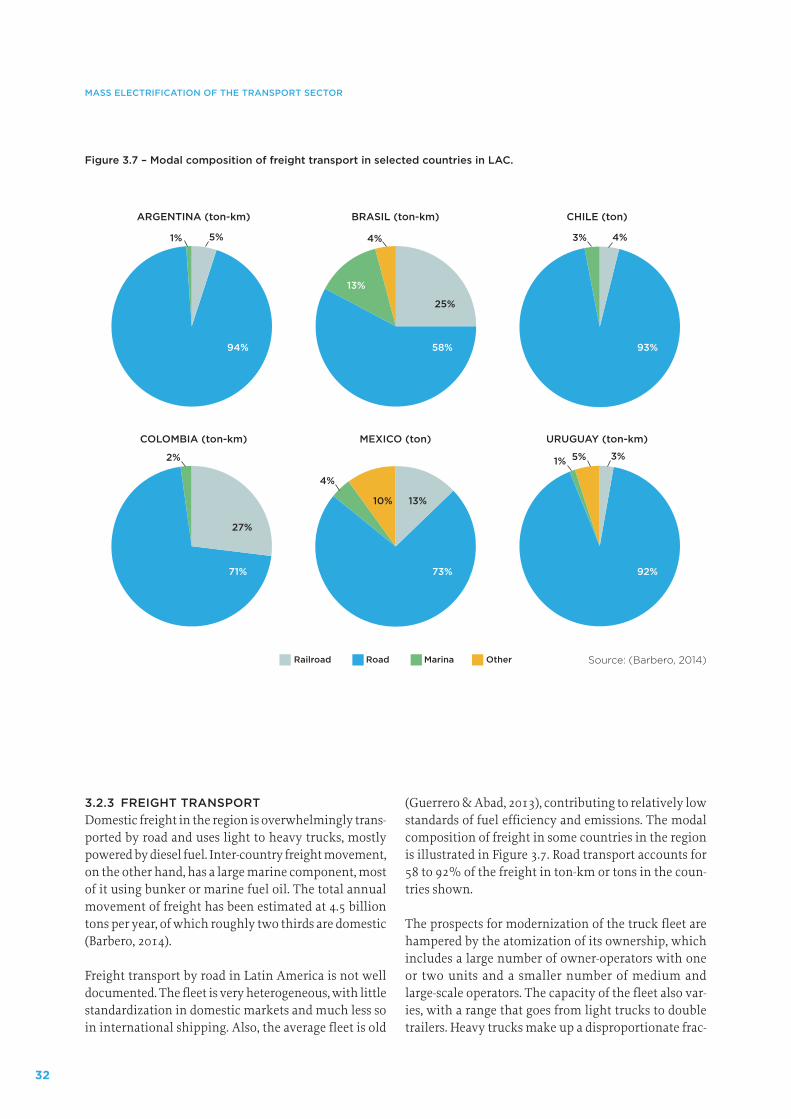
32
MASS ELECTRIFICATION OF THE TRANSPORT SECTOR
3.2.3 FREIGHT TRANSPORTDomestic freight in the region is overwhelmingly trans-ported by road and uses light to heavy trucks, mostly powered by diesel fuel. Inter-country freight movement, on the other hand, has a large marine component, most of it using bunker or marine fuel oil. The total annual movement of freight has been estimated at 4.5 billion tons per year, of which roughly two thirds are domestic (Barbero, 2014).
Freight transport by road in Latin America is not well documented. The fleet is very heterogeneous, with little standardization in domestic markets and much less so in international shipping. Also, the average fleet is old
(Guerrero & Abad, 2013), contributing to relatively low standards of fuel efficiency and emissions. The modal composition of freight in some countries in the region is illustrated in Figure 3.7. Road transport accounts for 58 to 92% of the freight in ton-km or tons in the coun-tries shown.
The prospects for modernization of the truck fleet are hampered by the atomization of its ownership, which includes a large number of owner-operators with one or two units and a smaller number of medium and large-scale operators. The capacity of the fleet also var-ies, with a range that goes from light trucks to double trailers. Heavy trucks make up a disproportionate frac-
Figure 3.7 – Modal composition of freight transport in selected countries in LAC.
Source: (Barbero, 2014)
1% 4%5%
Railroad Road Marina Other
ARGENTINA (ton-km) BRASIL (ton-km) CHILE (ton)
MEXICO (ton) URUGUAY (ton-km)COLOMBIA (ton-km)
25%
27%
13%10%
94% 58%
13%
93%
71% 73% 92%
3%
2%
4%
1% 5%
4%
3%
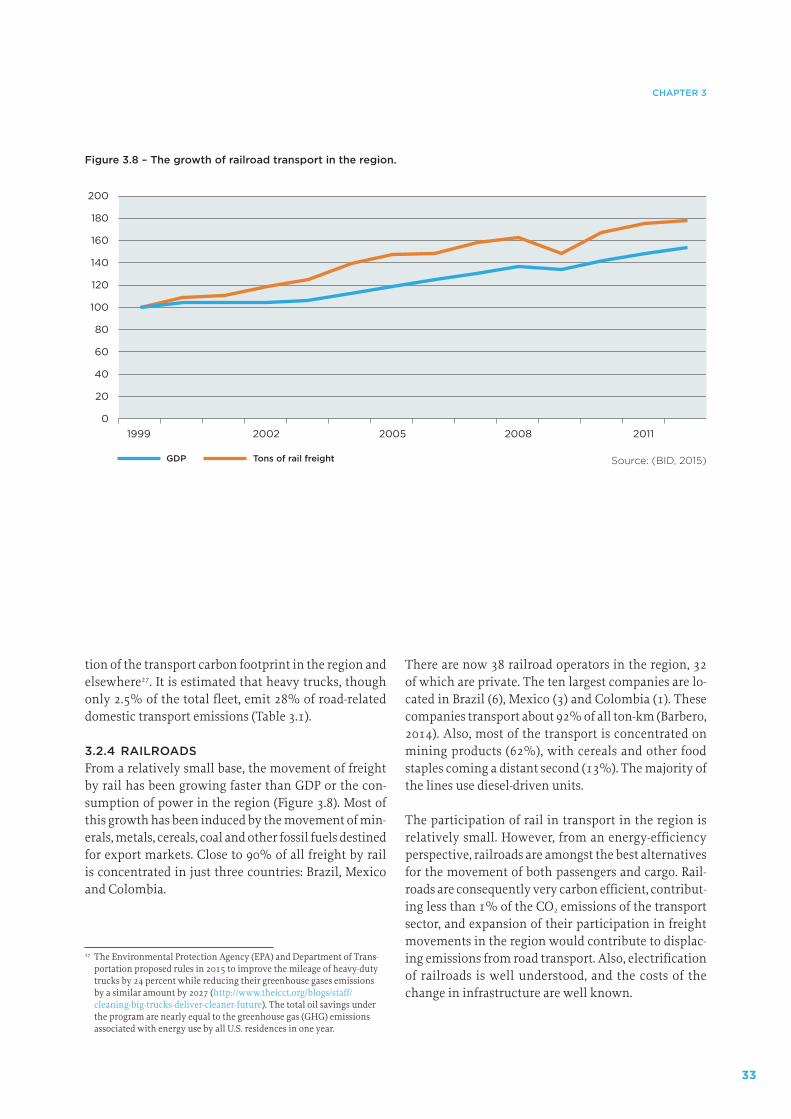
33
CHAPTER 3
tion of the transport carbon footprint in the region and elsewhere27. It is estimated that heavy trucks, though only 2.5% of the total fleet, emit 28% of road-related domestic transport emissions (Table 3.1).
3.2.4 RAILROADSFrom a relatively small base, the movement of freight by rail has been growing faster than GDP or the con-sumption of power in the region (Figure 3.8). Most of this growth has been induced by the movement of min-erals, metals, cereals, coal and other fossil fuels destined for export markets. Close to 90% of all freight by rail is concentrated in just three countries: Brazil, Mexico and Colombia.
27 The Environmental Protection Agency (EPA) and Department of Trans-portation proposed rules in 2015 to improve the mileage of heavy-duty trucks by 24 percent while reducing their greenhouse gases emissions by a similar amount by 2027 (http://www.theicct.org/blogs/staff/cleaning-big-trucks-deliver-cleaner-future). The total oil savings under the program are nearly equal to the greenhouse gas (GHG) emissions associated with energy use by all U.S. residences in one year.
There are now 38 railroad operators in the region, 32 of which are private. The ten largest companies are lo-cated in Brazil (6), Mexico (3) and Colombia (1). These companies transport about 92% of all ton-km (Barbero, 2014). Also, most of the transport is concentrated on mining products (62%), with cereals and other food staples coming a distant second (13%). The majority of the lines use diesel-driven units.
The participation of rail in transport in the region is relatively small. However, from an energy-efficiency perspective, railroads are amongst the best alternatives for the movement of both passengers and cargo. Rail-roads are consequently very carbon efficient, contribut-ing less than 1% of the CO2 emissions of the transport sector, and expansion of their participation in freight movements in the region would contribute to displac-ing emissions from road transport. Also, electrification of railroads is well understood, and the costs of the change in infrastructure are well known.
Source: (BID, 2015)
Figure 3.8 – The growth of railroad transport in the region.
Tons of rail freightGDP
0
20
40
60
80
100
120
140
160
180
200
1999 2002 2005 2008 2011
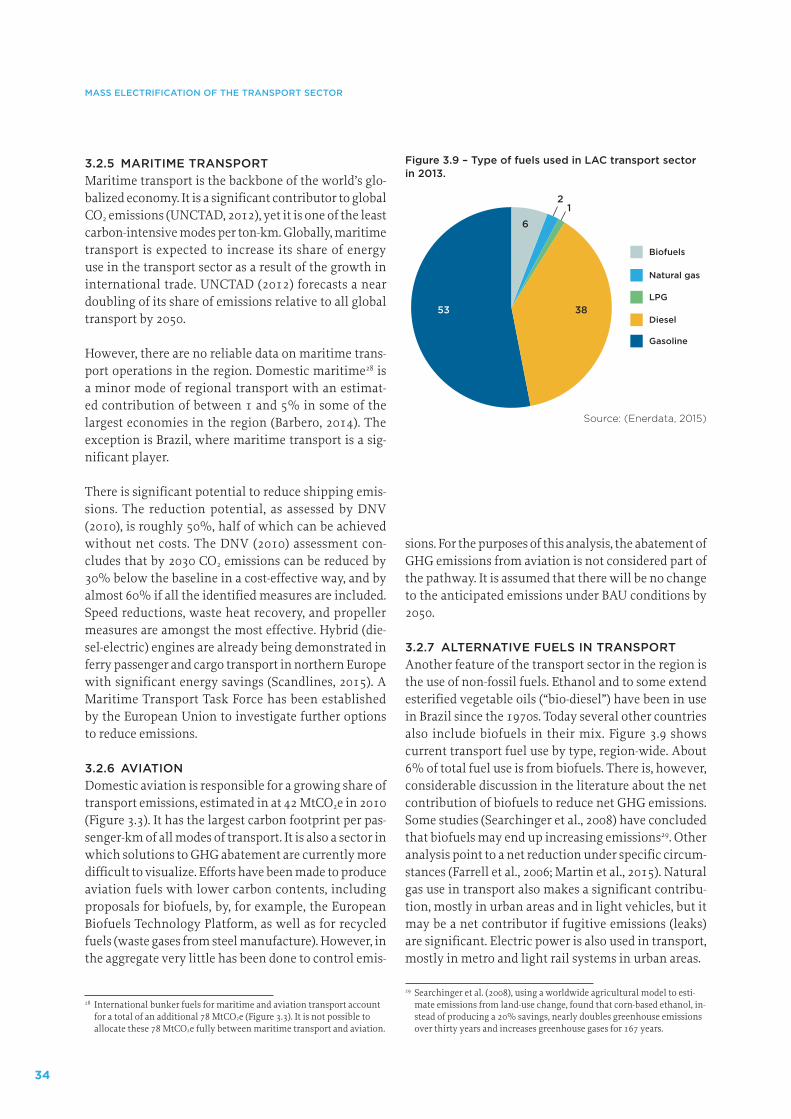
34
MASS ELECTRIFICATION OF THE TRANSPORT SECTOR
3.2.5 MARITIME TRANSPORTMaritime transport is the backbone of the world’s glo-balized economy. It is a significant contributor to global CO2 emissions (UNCTAD, 2012), yet it is one of the least carbon-intensive modes per ton-km. Globally, maritime transport is expected to increase its share of energy use in the transport sector as a result of the growth in international trade. UNCTAD (2012) forecasts a near doubling of its share of emissions relative to all global transport by 2050.
However, there are no reliable data on maritime trans-port operations in the region. Domestic maritime28 is a minor mode of regional transport with an estimat-ed contribution of between 1 and 5% in some of the largest economies in the region (Barbero, 2014). The exception is Brazil, where maritime transport is a sig-nificant player.
There is significant potential to reduce shipping emis-sions. The reduction potential, as assessed by DNV (2010), is roughly 50%, half of which can be achieved without net costs. The DNV (2010) assessment con-cludes that by 2030 CO2 emissions can be reduced by 30% below the baseline in a cost-effective way, and by almost 60% if all the identified measures are included. Speed reductions, waste heat recovery, and propeller measures are amongst the most effective. Hybrid (die-sel-electric) engines are already being demonstrated in ferry passenger and cargo transport in northern Europe with significant energy savings (Scandlines, 2015). A Maritime Transport Task Force has been established by the European Union to investigate further options to reduce emissions.
3.2.6 AVIATIONDomestic aviation is responsible for a growing share of transport emissions, estimated in at 42 MtCO2e in 2010 (Figure 3.3). It has the largest carbon footprint per pas-senger-km of all modes of transport. It is also a sector in which solutions to GHG abatement are currently more difficult to visualize. Efforts have been made to produce aviation fuels with lower carbon contents, including proposals for biofuels, by, for example, the European Biofuels Technology Platform, as well as for recycled fuels (waste gases from steel manufacture). However, in the aggregate very little has been done to control emis-
28 International bunker fuels for maritime and aviation transport account for a total of an additional 78 MtCO2e (Figure 3.3). It is not possible to allocate these 78 MtCO2e fully between maritime transport and aviation.
sions. For the purposes of this analysis, the abatement of GHG emissions from aviation is not considered part of the pathway. It is assumed that there will be no change to the anticipated emissions under BAU conditions by 2050.
3.2.7 ALTERNATIVE FUELS IN TRANSPORTAnother feature of the transport sector in the region is the use of non-fossil fuels. Ethanol and to some extend esterified vegetable oils (“bio-diesel”) have been in use in Brazil since the 1970s. Today several other countries also include biofuels in their mix. Figure 3.9 shows current transport fuel use by type, region-wide. About 6% of total fuel use is from biofuels. There is, however, considerable discussion in the literature about the net contribution of biofuels to reduce net GHG emissions. Some studies (Searchinger et al., 2008) have concluded that biofuels may end up increasing emissions29. Other analysis point to a net reduction under specific circum-stances (Farrell et al., 2006; Martin et al., 2015). Natural gas use in transport also makes a significant contribu-tion, mostly in urban areas and in light vehicles, but it may be a net contributor if fugitive emissions (leaks) are significant. Electric power is also used in transport, mostly in metro and light rail systems in urban areas.
29 Searchinger et al. (2008), using a worldwide agricultural model to esti-mate emissions from land-use change, found that corn-based ethanol, in-stead of producing a 20% savings, nearly doubles greenhouse emissions over thirty years and increases greenhouse gases for 167 years.
Figure 3.9 – Type of fuels used in LAC transport sector in 2013.
Source: (Enerdata, 2015)
6
21
3853
Biofuels
Natural gas
LPG
Diesel
Gasoline
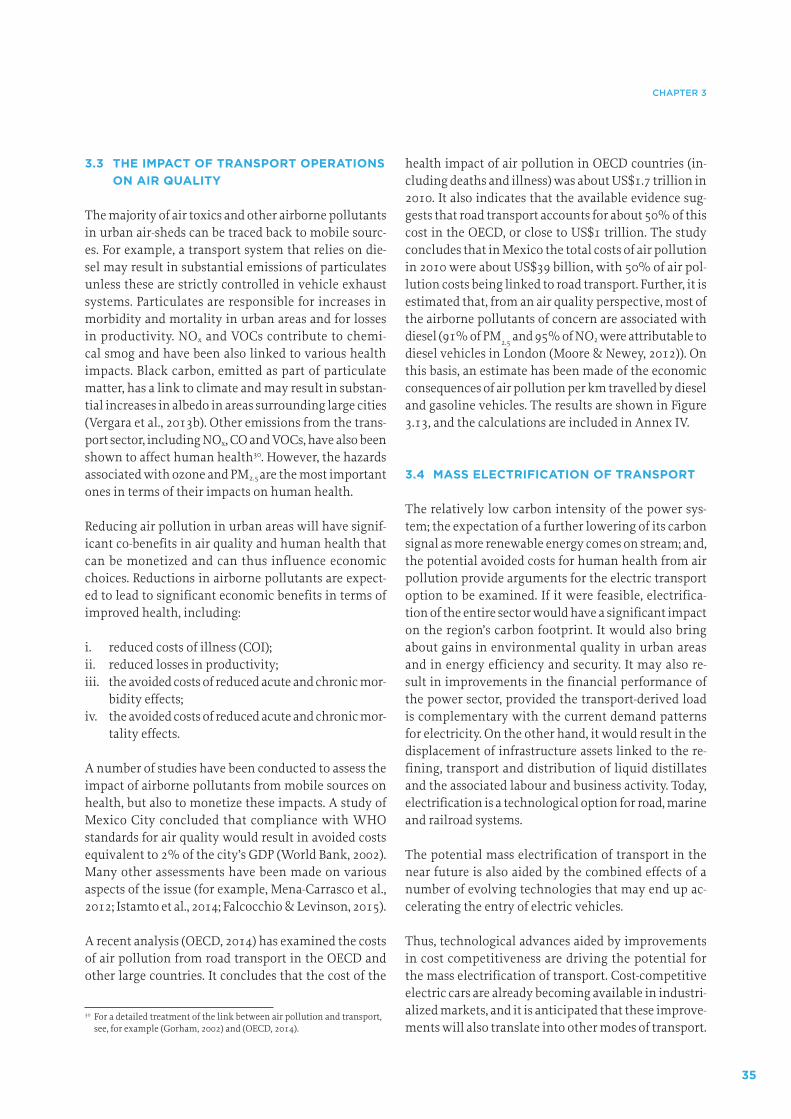
35
CHAPTER 3
3.3 THE IMPACT OF TRANSPORT OPERATIONS ON AIR QUALITY
The majority of air toxics and other airborne pollutants in urban air-sheds can be traced back to mobile sourc-es. For example, a transport system that relies on die-sel may result in substantial emissions of particulates unless these are strictly controlled in vehicle exhaust systems. Particulates are responsible for increases in morbidity and mortality in urban areas and for losses in productivity. NOx and VOCs contribute to chemi-cal smog and have been also linked to various health impacts. Black carbon, emitted as part of particulate matter, has a link to climate and may result in substan-tial increases in albedo in areas surrounding large cities (Vergara et al., 2013b). Other emissions from the trans-port sector, including NOx, CO and VOCs, have also been shown to affect human health30. However, the hazards associated with ozone and PM2.5 are the most important ones in terms of their impacts on human health.
Reducing air pollution in urban areas will have signif-icant co-benefits in air quality and human health that can be monetized and can thus influence economic choices. Reductions in airborne pollutants are expect-ed to lead to significant economic benefits in terms of improved health, including:
i. reduced costs of illness (COI); ii. reduced losses in productivity; iii. the avoided costs of reduced acute and chronic mor-
bidity effects; iv. the avoided costs of reduced acute and chronic mor-
tality effects.
A number of studies have been conducted to assess the impact of airborne pollutants from mobile sources on health, but also to monetize these impacts. A study of Mexico City concluded that compliance with WHO standards for air quality would result in avoided costs equivalent to 2% of the city’s GDP (World Bank, 2002). Many other assessments have been made on various aspects of the issue (for example, Mena-Carrasco et al., 2012; Istamto et al., 2014; Falcocchio & Levinson, 2015).
A recent analysis (OECD, 2014) has examined the costs of air pollution from road transport in the OECD and other large countries. It concludes that the cost of the
30 For a detailed treatment of the link between air pollution and transport, see, for example (Gorham, 2002) and (OECD, 2014).
health impact of air pollution in OECD countries (in-cluding deaths and illness) was about US$1.7 trillion in 2010. It also indicates that the available evidence sug-gests that road transport accounts for about 50% of this cost in the OECD, or close to US$1 trillion. The study concludes that in Mexico the total costs of air pollution in 2010 were about US$39 billion, with 50% of air pol-lution costs being linked to road transport. Further, it is estimated that, from an air quality perspective, most of the airborne pollutants of concern are associated with diesel (91% of PM2.5 and 95% of NO2 were attributable to diesel vehicles in London (Moore & Newey, 2012)). On this basis, an estimate has been made of the economic consequences of air pollution per km travelled by diesel and gasoline vehicles. The results are shown in Figure 3.13, and the calculations are included in Annex IV.
3.4 MASS ELECTRIFICATION OF TRANSPORT
The relatively low carbon intensity of the power sys-tem; the expectation of a further lowering of its carbon signal as more renewable energy comes on stream; and, the potential avoided costs for human health from air pollution provide arguments for the electric transport option to be examined. If it were feasible, electrifica-tion of the entire sector would have a significant impact on the region’s carbon footprint. It would also bring about gains in environmental quality in urban areas and in energy efficiency and security. It may also re-sult in improvements in the financial performance of the power sector, provided the transport-derived load is complementary with the current demand patterns for electricity. On the other hand, it would result in the displacement of infrastructure assets linked to the re-fining, transport and distribution of liquid distillates and the associated labour and business activity. Today, electrification is a technological option for road, marine and railroad systems.
The potential mass electrification of transport in the near future is also aided by the combined effects of a number of evolving technologies that may end up ac-celerating the entry of electric vehicles.
Thus, technological advances aided by improvements in cost competitiveness are driving the potential for the mass electrification of transport. Cost-competitive electric cars are already becoming available in industri-alized markets, and it is anticipated that these improve-ments will also translate into other modes of transport.
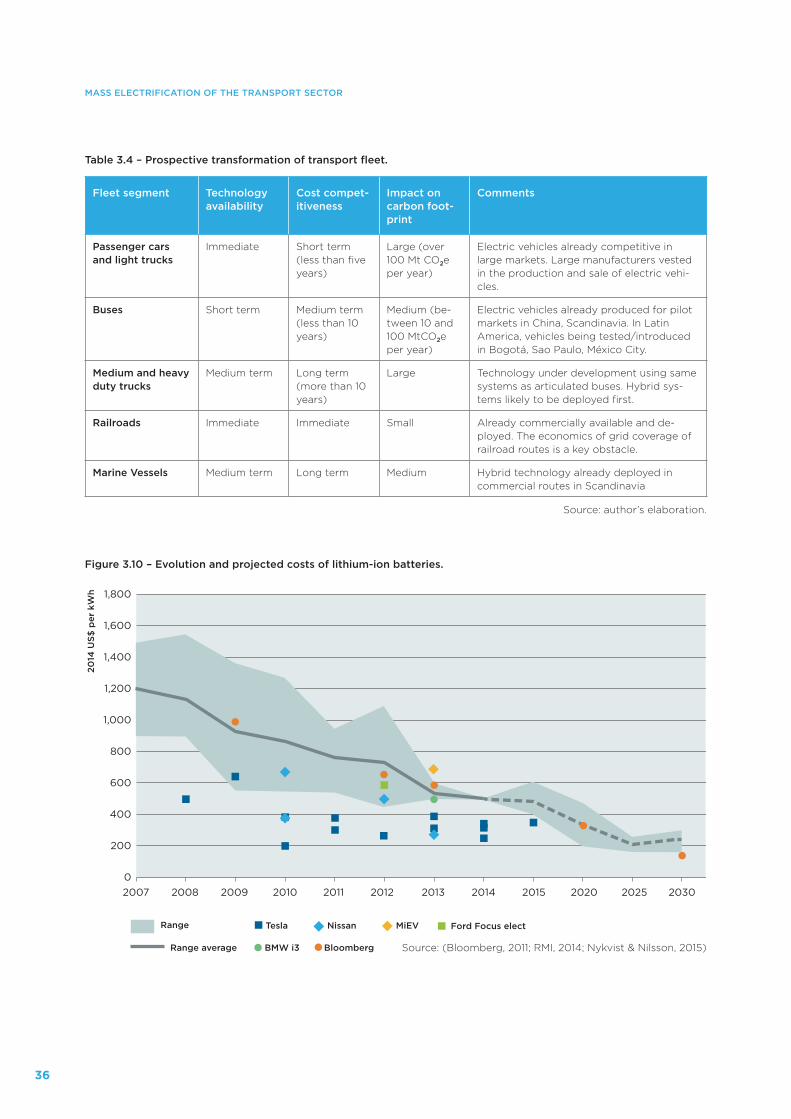
36
MASS ELECTRIFICATION OF THE TRANSPORT SECTOR
Source: (Bloomberg, 2011; RMI, 2014; Nykvist & Nilsson, 2015)
Figure 3.10 – Evolution and projected costs of lithium-ion batteries.
Range average
Tesla Ford Focus elect
BMW i3 Bloomberg
Nissan MiEVRange
0
200
400
600
800
1,000
1,200
1,400
1,600
1,800
2007 2008 2009 2010 2011 2012 2013 2014 2015 2020 2025 2030
2014
US$
per
kW
h
Table 3.4 – Prospective transformation of transport fleet.
Fleet segment Technology availability
Cost compet-itiveness
Impact on carbon foot-print
Comments
Passenger cars and light trucks
Immediate Short term (less than five years)
Large (over 100 Mt CO2e per year)
Electric vehicles already competitive in large markets. Large manufacturers vested in the production and sale of electric vehi-cles.
Buses Short term Medium term (less than 10 years)
Medium (be-tween 10 and 100 MtCO2e per year)
Electric vehicles already produced for pilot markets in China, Scandinavia. In Latin America, vehicles being tested/introduced in Bogotá, Sao Paulo, México City.
Medium and heavy duty trucks
Medium term Long term (more than 10 years)
Large Technology under development using same systems as articulated buses. Hybrid sys-tems likely to be deployed first.
Railroads Immediate Immediate Small Already commercially available and de-ployed. The economics of grid coverage of railroad routes is a key obstacle.
Marine Vessels Medium term Long term Medium Hybrid technology already deployed in commercial routes in Scandinavia
Source: author’s elaboration.
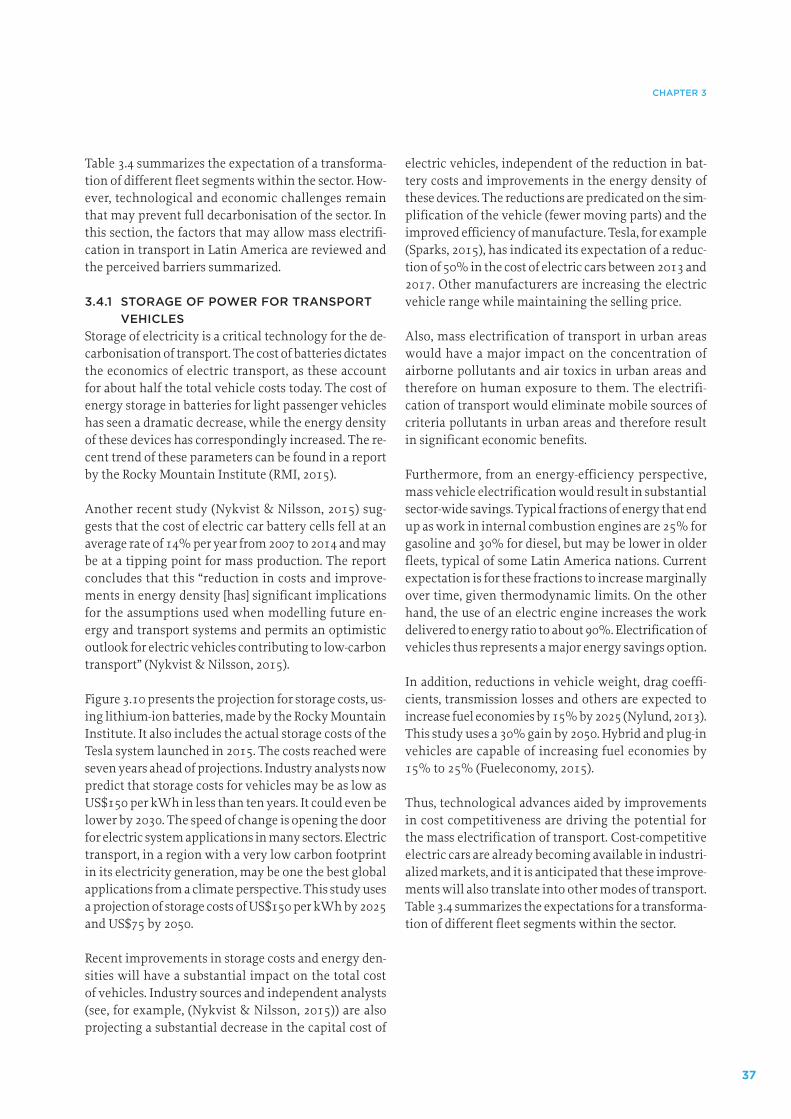
37
CHAPTER 3
Table 3.4 summarizes the expectation of a transforma-tion of different fleet segments within the sector. How-ever, technological and economic challenges remain that may prevent full decarbonisation of the sector. In this section, the factors that may allow mass electrifi-cation in transport in Latin America are reviewed and the perceived barriers summarized.
3.4.1 STORAGE OF POWER FOR TRANSPORT VEHICLES
Storage of electricity is a critical technology for the de-carbonisation of transport. The cost of batteries dictates the economics of electric transport, as these account for about half the total vehicle costs today. The cost of energy storage in batteries for light passenger vehicles has seen a dramatic decrease, while the energy density of these devices has correspondingly increased. The re-cent trend of these parameters can be found in a report by the Rocky Mountain Institute (RMI, 2015).
Another recent study (Nykvist & Nilsson, 2015) sug-gests that the cost of electric car battery cells fell at an average rate of 14% per year from 2007 to 2014 and may be at a tipping point for mass production. The report concludes that this “reduction in costs and improve-ments in energy density [has] significant implications for the assumptions used when modelling future en-ergy and transport systems and permits an optimistic outlook for electric vehicles contributing to low-carbon transport” (Nykvist & Nilsson, 2015).
Figure 3.10 presents the projection for storage costs, us-ing lithium-ion batteries, made by the Rocky Mountain Institute. It also includes the actual storage costs of the Tesla system launched in 2015. The costs reached were seven years ahead of projections. Industry analysts now predict that storage costs for vehicles may be as low as US$150 per kWh in less than ten years. It could even be lower by 2030. The speed of change is opening the door for electric system applications in many sectors. Electric transport, in a region with a very low carbon footprint in its electricity generation, may be one the best global applications from a climate perspective. This study uses a projection of storage costs of US$150 per kWh by 2025 and US$75 by 2050.
Recent improvements in storage costs and energy den-sities will have a substantial impact on the total cost of vehicles. Industry sources and independent analysts (see, for example, (Nykvist & Nilsson, 2015)) are also projecting a substantial decrease in the capital cost of
electric vehicles, independent of the reduction in bat-tery costs and improvements in the energy density of these devices. The reductions are predicated on the sim-plification of the vehicle (fewer moving parts) and the improved efficiency of manufacture. Tesla, for example (Sparks, 2015), has indicated its expectation of a reduc-tion of 50% in the cost of electric cars between 2013 and 2017. Other manufacturers are increasing the electric vehicle range while maintaining the selling price.
Also, mass electrification of transport in urban areas would have a major impact on the concentration of airborne pollutants and air toxics in urban areas and therefore on human exposure to them. The electrifi-cation of transport would eliminate mobile sources of criteria pollutants in urban areas and therefore result in significant economic benefits.
Furthermore, from an energy-efficiency perspective, mass vehicle electrification would result in substantial sector-wide savings. Typical fractions of energy that end up as work in internal combustion engines are 25% for gasoline and 30% for diesel, but may be lower in older fleets, typical of some Latin America nations. Current expectation is for these fractions to increase marginally over time, given thermodynamic limits. On the other hand, the use of an electric engine increases the work delivered to energy ratio to about 90%. Electrification of vehicles thus represents a major energy savings option.
In addition, reductions in vehicle weight, drag coeffi-cients, transmission losses and others are expected to increase fuel economies by 15% by 2025 (Nylund, 2013). This study uses a 30% gain by 2050. Hybrid and plug-in vehicles are capable of increasing fuel economies by 15% to 25% (Fueleconomy, 2015).
Thus, technological advances aided by improvements in cost competitiveness are driving the potential for the mass electrification of transport. Cost-competitive electric cars are already becoming available in industri-alized markets, and it is anticipated that these improve-ments will also translate into other modes of transport. Table 3.4 summarizes the expectations for a transforma-tion of different fleet segments within the sector.
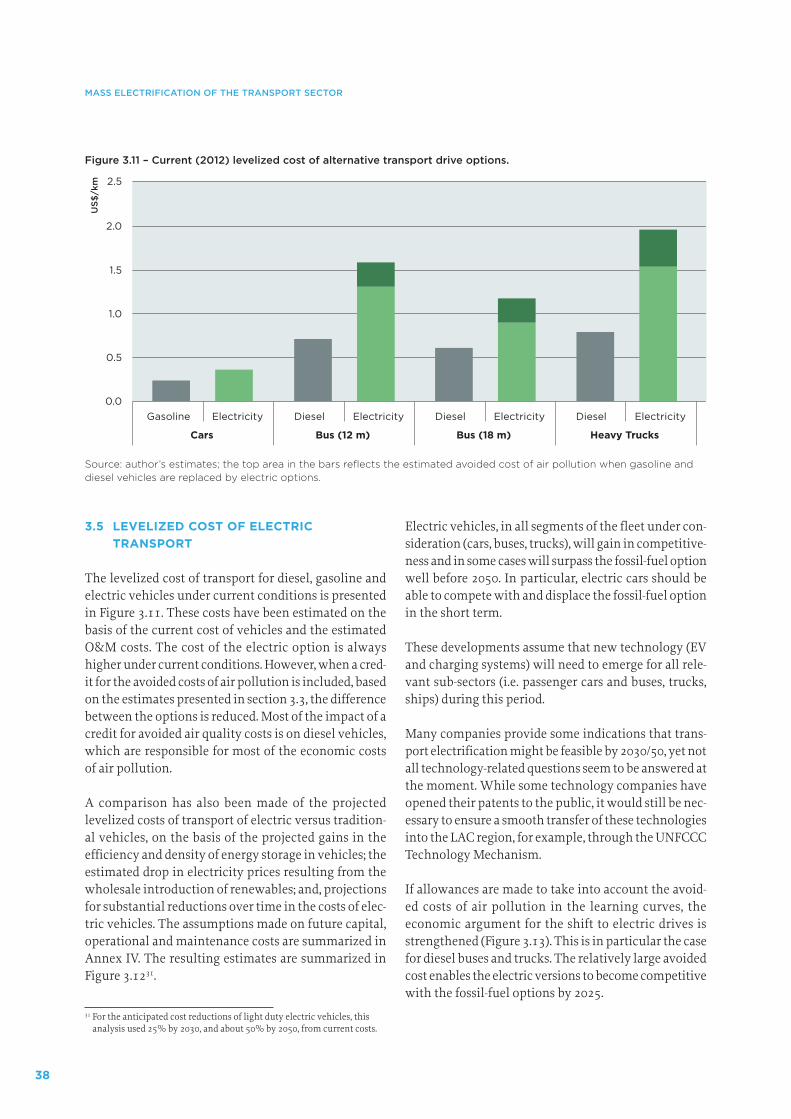
38
MASS ELECTRIFICATION OF THE TRANSPORT SECTOR
3.5 LEVELIZED COST OF ELECTRIC TRANSPORT
The levelized cost of transport for diesel, gasoline and electric vehicles under current conditions is presented in Figure 3.11. These costs have been estimated on the basis of the current cost of vehicles and the estimated O&M costs. The cost of the electric option is always higher under current conditions. However, when a cred-it for the avoided costs of air pollution is included, based on the estimates presented in section 3.3, the difference between the options is reduced. Most of the impact of a credit for avoided air quality costs is on diesel vehicles, which are responsible for most of the economic costs of air pollution.
A comparison has also been made of the projected levelized costs of transport of electric versus tradition-al vehicles, on the basis of the projected gains in the efficiency and density of energy storage in vehicles; the estimated drop in electricity prices resulting from the wholesale introduction of renewables; and, projections for substantial reductions over time in the costs of elec-tric vehicles. The assumptions made on future capital, operational and maintenance costs are summarized in Annex IV. The resulting estimates are summarized in Figure 3.1231.
31 For the anticipated cost reductions of light duty electric vehicles, this analysis used 25% by 2030, and about 50% by 2050, from current costs.
Electric vehicles, in all segments of the fleet under con-sideration (cars, buses, trucks), will gain in competitive-ness and in some cases will surpass the fossil-fuel option well before 2050. In particular, electric cars should be able to compete with and displace the fossil-fuel option in the short term.
These developments assume that new technology (EV and charging systems) will need to emerge for all rele-vant sub-sectors (i.e. passenger cars and buses, trucks, ships) during this period.
Many companies provide some indications that trans-port electrification might be feasible by 2030/50, yet not all technology-related questions seem to be answered at the moment. While some technology companies have opened their patents to the public, it would still be nec-essary to ensure a smooth transfer of these technologies into the LAC region, for example, through the UNFCCC Technology Mechanism.
If allowances are made to take into account the avoid-ed costs of air pollution in the learning curves, the economic argument for the shift to electric drives is strengthened (Figure 3.13). This is in particular the case for diesel buses and trucks. The relatively large avoided cost enables the electric versions to become competitive with the fossil-fuel options by 2025.
US$
/km
0.0
0.5
1.0
1.5
2.0
2.5
Gasoline Electricity
Cars
Diesel Electricity
Bus (12 m)
Diesel Electricity
Bus (18 m)
Diesel Electricity
Heavy Trucks
Figure 3.11 – Current (2012) levelized cost of alternative transport drive options.
Source: author’s estimates; the top area in the bars reflects the estimated avoided cost of air pollution when gasoline and diesel vehicles are replaced by electric options.
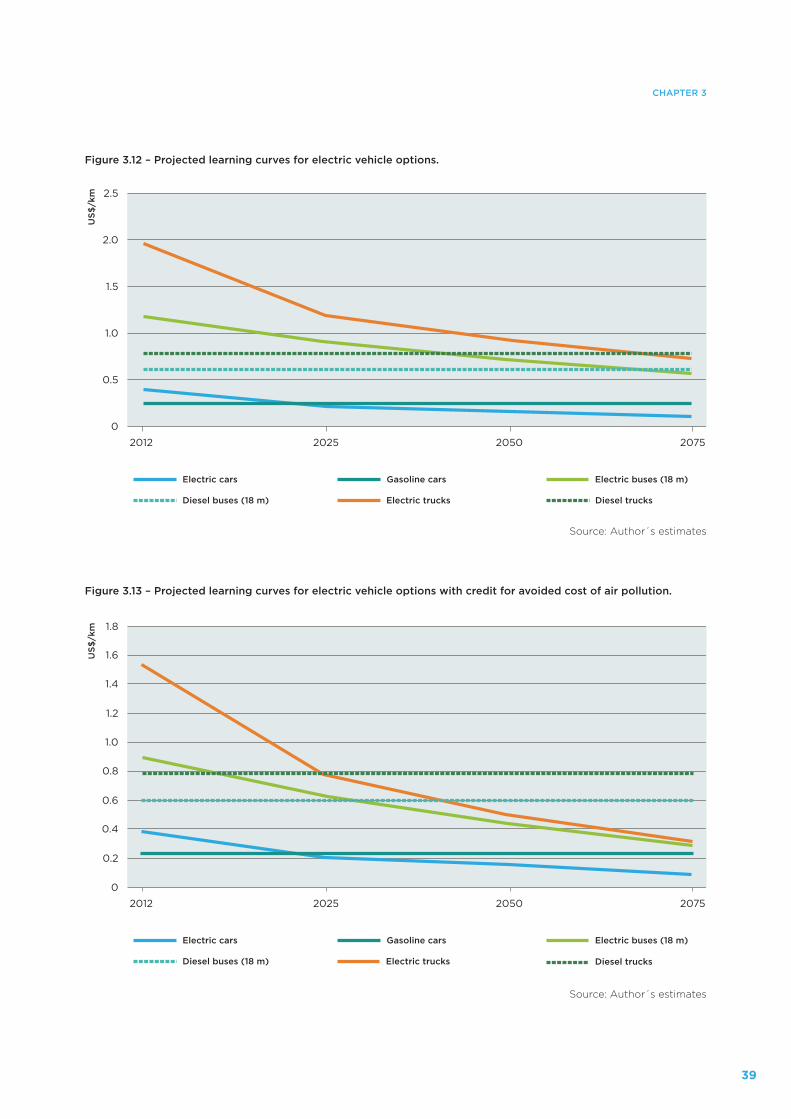
39
CHAPTER 3
Figure 3.12 – Projected learning curves for electric vehicle options.
Figure 3.13 – Projected learning curves for electric vehicle options with credit for avoided cost of air pollution.
Source: Author´s estimates
Source: Author´s estimates
US$
/km
0
0.5
1.0
1.5
2.0
2.5
2075205020252012
Gasoline carsElectric cars
Diesel trucksDiesel buses (18 m) Electric trucks
Electric buses (18 m)
US$
/km
0
0.2
0.6
0.4
1.0
0.8
1.2
1.8
1.6
1.4
2075205020252012
Gasoline carsElectric cars
Diesel trucksDiesel buses (18 m) Electric trucks
Electric buses (18 m)
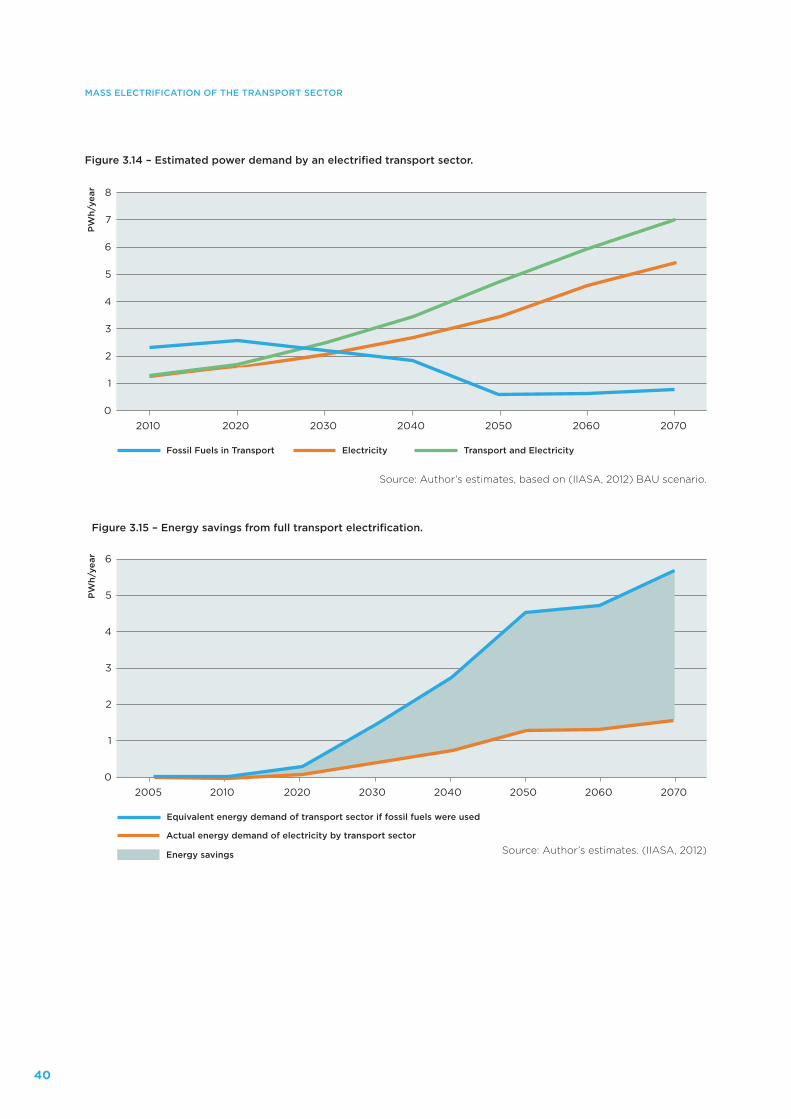
40
MASS ELECTRIFICATION OF THE TRANSPORT SECTOR
Figure 3.14 – Estimated power demand by an electrified transport sector.
Source: Author’s estimates, based on (IIASA, 2012) BAU scenario.
PW
h/ye
ar
ElectricityFossil Fuels in Transport
0
1
2
3
4
5
6
7
8
2010 2020 2030 2040 2050 2060 2070
Transport and Electricity
PW
h/ye
ar
Actual energy demand of electricity by transport sector
Energy savings
Equivalent energy demand of transport sector if fossil fuels were used
0
1
2
3
4
5
6
2005 2010 2020 2030 2040 2050 2060 2070
Figure 3.15 – Energy savings from full transport electrification.
Source: Author’s estimates. (IIASA, 2012)
41
CHAPTER 3
3.5.1 NET EFFECT OF THE MASS ELECTRIFICATION OF THE TRANSPORT SECTOR ON POWER DEMAND
The net effect on power demand by an electrified fleet was also calculated and is presented in Figure 3.14. The additional power demand is substantial and would re-quire a corresponding increase in generation capacity of approximately 1.26 PWh (4.5 EJ) by 2050.
For electric cars, however, the option of distributed pow-er at the household level could play a role, as it could in respect of fleets of light trucks at charging sites. If the load from transport is managed, it could be shifted to periods when power demand is comparatively low (late night-early morning). The net effect would be a smoothing of the variation in the daily electric load, and this could have a salutary effect on the financials of generators.
The replacement of internal combustion engines by electric motors will also have a significant impact on the overall primary energy use of the sector. Signifi-cant energy savings will be associated with the electri-fication of the sector, derived from the inherently low thermodynamic efficiency of the Otto and diesel cycles being replaced. The gains in efficiency translate into significant avoided emissions.
Figure 3.15 shows an estimate of the savings, in EJ per year, resulting from the conversion of the transport fleet. The net savings are estimated at 4 PWh per year by 2050, probably one of the largest energy efficiencies and energy-savings measures available in the region.
3.5.2 SOME BARRIERS TO THE MASS ELECTRIFICATION OF TRANSPORT
The technological and economic momentum for a shift to electric power drives in transport is building and ul-timately may provoke a major disruption in transport technologies globally. However, in the shorter term and in the context of Latin America, this shift faces signif-icant barriers that need to be addressed. These include the following:
a) Fossil-fuel subsidies continue to promote the useof fuels from an advantageous position and delay the adoption of alternative power sources in transport. Fos-sil-fuel subsidies in the LAC region have been estimated at about 1% of GDP in 2011–13 and about 2% of GDP, during the same period if negative externalities are ac-
counted for (Di Bella et al., 2015). Removing the subsi-dies would also have a salutary effect on fiscal revenues.
b) Generally, no provisions are made to account forhealth and other environmental benefits associated with the displacement of diesel, fuel oil and gasoline by electricity in transport. These benefits accrue to society and represent avoided costs that should be credited to promote the adoption of electric systems.
c) Actual consumption patterns suggest that, as in-comes increase, there is a reduction in the share of ex-penses and an increase in the expenditures for “private transport”. This pattern indicates that new low- and middle-income groups are not satisfied with existing public transport and are switching to private cars if they are able to do so. Substantial improvements in the quali-ty of private transport are thus required to avoid erosion in the use of public transport systems.
d) Wider use needs to be made of policies and incentives that encourage the efficient use of public space in urban areas, as, for example, in the preferential allocation of transit lanes to public transport systems such as BRTs and support for non-motorized transport.
e) The capital value of and associated jobs and enterpris-es linked to petroleum refining and the distribution of liquid fuels would be displaced by the introduction of electric vehicles. A natural resistance is to be expected. On the other hand, the electrification of transport can be viewed as growth opportunity, as the new transport systems will need engineers, transport economists, op-erators and logistics experts.
f) In addition, the discussion of the electrification of the transport sector has not evolved on a par with that in the power sector. As a consequence, there is a need to develop a framework of regulations for those aspects (vehicle weight, charging stations, disposal of batter-ies) that are intrinsic to the electric option. Some cities (Bogotá, for example) have initiated the development of a policy environment supportive of the electrification of the BRTs, but much more discussion and work is re-quired at the regional level.

42
ANALYSIS OF GRID EMISSION FACTORS FOR THE ELECTRICITY SECTOR IN CARIBBEAN COUNTRIES
43
The bulk of GHG emissions in Latin America are gener-ated from agriculture, forestry and other land uses (e.g. waste) (AFOLU). Of the estimated 4.6 GtCO2e emitted in LAC in 2012, about half were associated with AFOLU (Table 1.1). Therefore, land-use change is a key pillar of any decarbonisation pathway: any large-scale effort to reduce LAC’s carbon intensity would need to be heavily tilted toward this option.
This section of the document examines the prospects for major reductions in the carbon emissions from land use and the possibility of net accumulations of carbon stocks. A review of the potential for avoided deforestation and for major increases in carbon sinks through reforestation and land restoration is made. Also measures to reduce emissions from agricultural activities, including animal husbandry are identified. Finally, the section looks at the associated economic benefits and costs.
4.1 CURRENT SITUATION
LAC’s aggregate output of agricultural and forest pro-duction is estimated to have surpassed 5% of total re-gional GDP in 2012 (World Bank, 2015), driven largely by increases in the value of agricultural commodities, but also by productivity gains and increases in the area under production. It represents the key economic activ-ity in rural and small urban communities across Latin America and is likely to remain as such for the foresee-able future.
Globally, LAC is expected to play an increasingly im-portant role in food security as a leading producer and exporter of agricultural commodities. Agricultural exports now account for 23% of the region’s total ex-ports and contributed about 11% to the global trade in food feed and fibre in 2013 (Vergara et al., 2014), both indices being driven by increases in global demand. In addition, agriculture and forestry are important for the livelihoods of millions of people in the region. The share of agriculture and forestry in total household in-come reaches over 50% among poor rural households in several countries32. These activities employed about
32 Including, among others, Nicaragua (IFAD, 2010), Brazil (Valdes & Misti-aen, 2003) and El Salvador (World Bank, 1998).
15% of total labour during 2008-2011, reaching levels of employment above 50% outside large urban centres (World Bank, 2014b).
However, the dominance of land use-related emissions within the regional profile is changing. Evidence points to significant declines in the regional rate of deforest-ation: 67% in the Brazilian Amazon in 2004-2010 and one-third in Central America since the mid-1990s (Kai-mowitz, 2008; INPE, 2010; Hecht, 2014). These achieve-ments, if maintained, bode well for a substantial and lasting reduction in forestry-related emissions. On the other hand, data show that emissions from agriculture increased 18% from 2000 to 2012 (CAIT, 2015).
These developments have been used as a basis to pro-ject significant reductions in emissions from forestry under GEA-BAU and GEA-MIX scenarios. Still, under business as usual conditions, even after accounting for a robust reduction in deforestation rates, total regional emissions are anticipated to reach almost 5.3 GtCO2e by 2050 (Table 6.5), with an AFOLU contribution by then of about 1.9 GtCO2e or 38% (Figure 4.1). As discussed in Chapter 6, for the region to reach zero emissions by mid-century, net carbon sinks in the land sector would be required.
4.2 AVOIDED DEFORESTATION
From a climate perspective, and of all land-use activities, arresting deforestation and reducing forest degradation are the very first actions that should be considered. Re-ducing deforestation would prevent CO2 emissions but would also prevent changes in rainfall patterns in local and regional areas of influence and climate destabiliza-tion33. Arresting deforestation would slow down these impacts. In addition, there is a net climate benefit from the reduction of forest fires and consequently from the reduction in emissions of black carbon, which contrib-ute to radiative forcing in the atmosphere (Hurteau &
33 Several assessments have described the links between deforestation, climate and rainfall (da Silva Dias, 2008; Vergara & Scholz, 2011) and concluded that there is a substantial risk of climate affecting the standing biomass in tropical rainforests and likewise of deforestation affecting rainfall and local climate patterns.
4. LAND: FROM CARBON SOURCE TO CARBON SINK
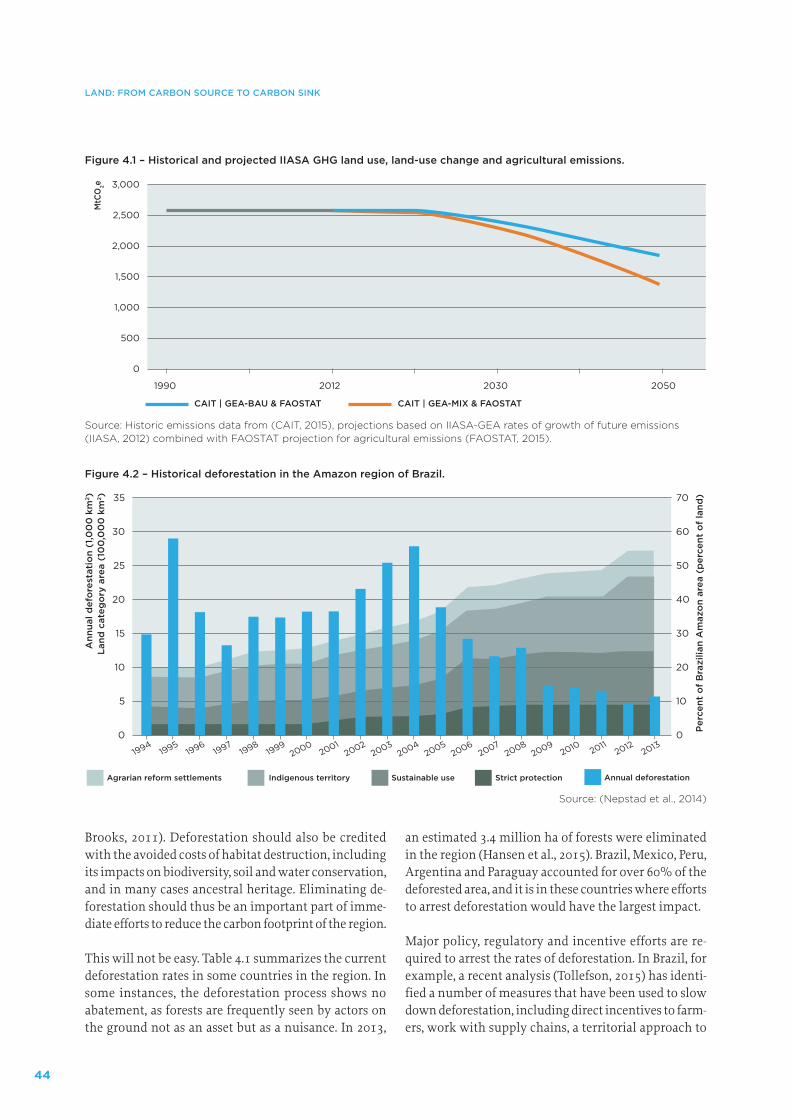
44
LAND: FROM CARBON SOURCE TO CARBON SINK
Brooks, 2011). Deforestation should also be credited with the avoided costs of habitat destruction, including its impacts on biodiversity, soil and water conservation, and in many cases ancestral heritage. Eliminating de-forestation should thus be an important part of imme-diate efforts to reduce the carbon footprint of the region.
This will not be easy. Table 4.1 summarizes the current deforestation rates in some countries in the region. In some instances, the deforestation process shows no abatement, as forests are frequently seen by actors on the ground not as an asset but as a nuisance. In 2013,
an estimated 3.4 million ha of forests were eliminated in the region (Hansen et al., 2015). Brazil, Mexico, Peru, Argentina and Paraguay accounted for over 60% of the deforested area, and it is in these countries where efforts to arrest deforestation would have the largest impact.
Major policy, regulatory and incentive efforts are re-quired to arrest the rates of deforestation. In Brazil, for example, a recent analysis (Tollefson, 2015) has identi-fied a number of measures that have been used to slow down deforestation, including direct incentives to farm-ers, work with supply chains, a territorial approach to
Figure 4.1 – Historical and projected IIASA GHG land use, land-use change and agricultural emissions.
Source: Historic emissions data from (CAIT, 2015), projections based on IIASA-GEA rates of growth of future emissions (IIASA, 2012) combined with FAOSTAT projection for agricultural emissions (FAOSTAT, 2015).
MtC
O2e
CAIT | GEA-BAU & FAOSTAT
0
500
1,000
1,500
2,000
3,000
2,500
1990 2012 2030 2050
CAIT | GEA-MIX & FAOSTAT
Figure 4.2 – Historical deforestation in the Amazon region of Brazil.
Source: (Nepstad et al., 2014)
Ann
ual d
efo
rest
atio
n (1
,00
0 k
m2 )
Land
cat
ego
ry a
rea
(10
0,0
00
km
2 )
Per
cent
of
Bra
zilia
n A
maz
on
area
(p
erce
nt o
f la
nd)
0
5
15
10
25
20
30
35
0
10
30
20
50
40
60
70
Agrarian reform settlements Indigenous territory Annual deforestationSustainable use Strict protection
19941995
19961997
19981999
20002001
20022003
20042005
20062007
20082009
2010 20112012 2013
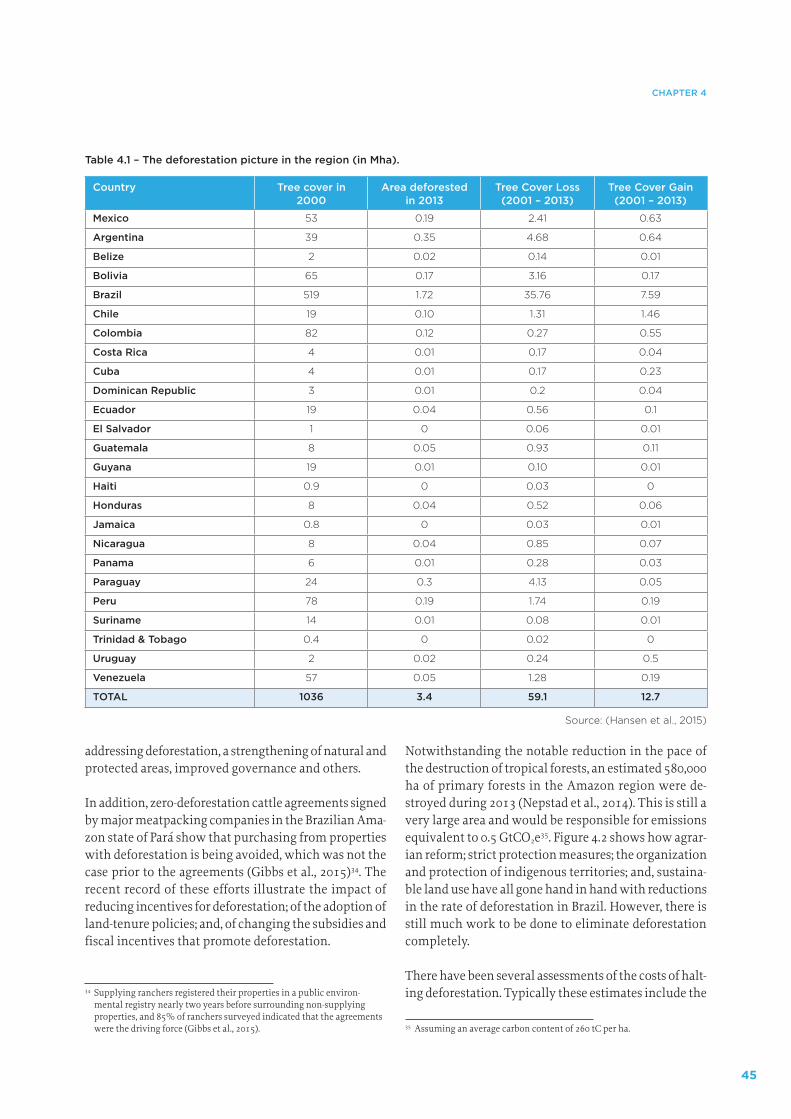
45
CHAPTER 4
Table 4.1 – The deforestation picture in the region (in Mha).
Country Tree cover in 2000
Area deforested in 2013
Tree Cover Loss (2001 – 2013)
Tree Cover Gain (2001 – 2013)
Mexico 53 0.19 2.41 0.63
Argentina 39 0.35 4.68 0.64
Belize 2 0.02 0.14 0.01
Bolivia 65 0.17 3.16 0.17
Brazil 519 1.72 35.76 7.59
Chile 19 0.10 1.31 1.46
Colombia 82 0.12 0.27 0.55
Costa Rica 4 0.01 0.17 0.04
Cuba 4 0.01 0.17 0.23
Dominican Republic 3 0.01 0.2 0.04
Ecuador 19 0.04 0.56 0.1
El Salvador 1 0 0.06 0.01
Guatemala 8 0.05 0.93 0.11
Guyana 19 0.01 0.10 0.01
Haiti 0.9 0 0.03 0
Honduras 8 0.04 0.52 0.06
Jamaica 0.8 0 0.03 0.01
Nicaragua 8 0.04 0.85 0.07
Panama 6 0.01 0.28 0.03
Paraguay 24 0.3 4.13 0.05
Peru 78 0.19 1.74 0.19
Suriname 14 0.01 0.08 0.01
Trinidad & Tobago 0.4 0 0.02 0
Uruguay 2 0.02 0.24 0.5
Venezuela 57 0.05 1.28 0.19
TOTAL 1036 3.4 59.1 12.7
Source: (Hansen et al., 2015)
addressing deforestation, a strengthening of natural and protected areas, improved governance and others.
In addition, zero-deforestation cattle agreements signed by major meatpacking companies in the Brazilian Ama-zon state of Pará show that purchasing from properties with deforestation is being avoided, which was not the case prior to the agreements (Gibbs et al., 2015)34. The recent record of these efforts illustrate the impact of reducing incentives for deforestation; of the adoption of land-tenure policies; and, of changing the subsidies and fiscal incentives that promote deforestation.
34 Supplying ranchers registered their properties in a public environ-mental registry nearly two years before surrounding non-supplying properties, and 85% of ranchers surveyed indicated that the agreements were the driving force (Gibbs et al., 2015).
Notwithstanding the notable reduction in the pace of the destruction of tropical forests, an estimated 580,000 ha of primary forests in the Amazon region were de-stroyed during 2013 (Nepstad et al., 2014). This is still a very large area and would be responsible for emissions equivalent to 0.5 GtCO2e35. Figure 4.2 shows how agrar-ian reform; strict protection measures; the organization and protection of indigenous territories; and, sustaina-ble land use have all gone hand in hand with reductions in the rate of deforestation in Brazil. However, there is still much work to be done to eliminate deforestation completely.
There have been several assessments of the costs of halt-ing deforestation. Typically these estimates include the
35 Assuming an average carbon content of 260 tC per ha.
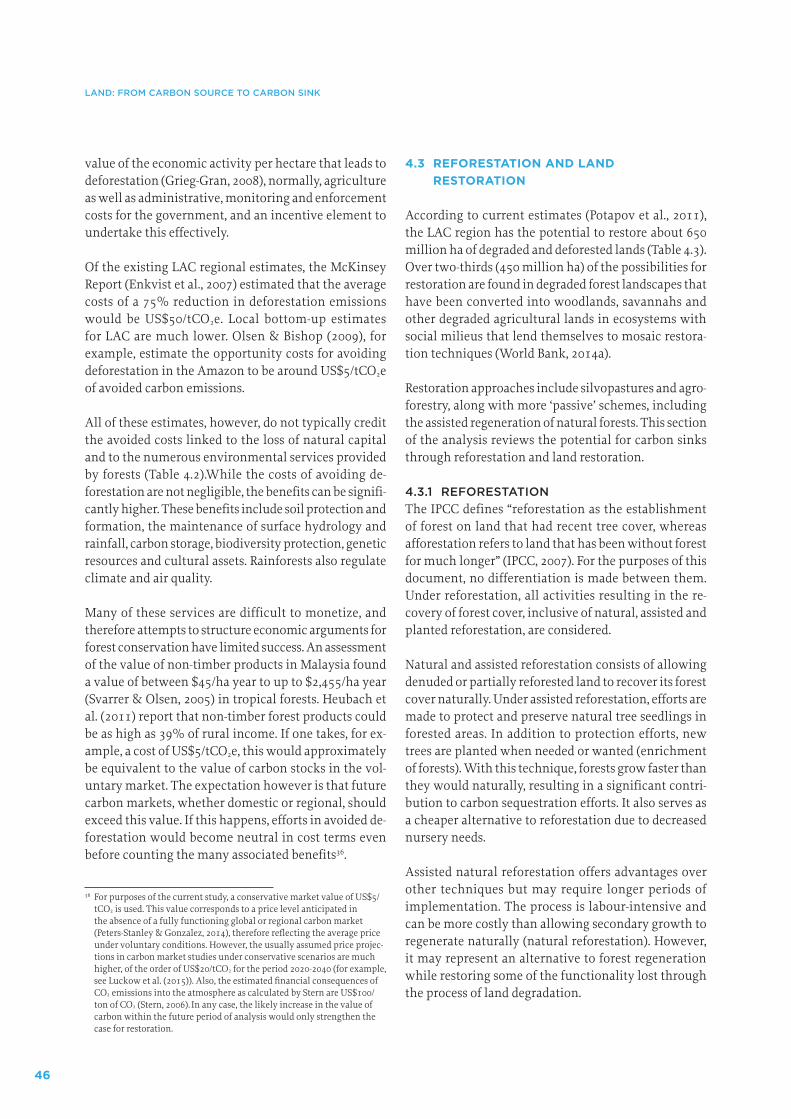
46
LAND: FROM CARBON SOURCE TO CARBON SINK
value of the economic activity per hectare that leads to deforestation (Grieg-Gran, 2008), normally, agriculture as well as administrative, monitoring and enforcement costs for the government, and an incentive element to undertake this effectively.
Of the existing LAC regional estimates, the McKinsey Report (Enkvist et al., 2007) estimated that the average costs of a 75% reduction in deforestation emissions would be US$50/tCO2e. Local bottom-up estimates for LAC are much lower. Olsen & Bishop (2009), for example, estimate the opportunity costs for avoiding deforestation in the Amazon to be around US$5/tCO2e of avoided carbon emissions.
All of these estimates, however, do not typically credit the avoided costs linked to the loss of natural capital and to the numerous environmental services provided by forests (Table 4.2).While the costs of avoiding de-forestation are not negligible, the benefits can be signifi-cantly higher. These benefits include soil protection and formation, the maintenance of surface hydrology and rainfall, carbon storage, biodiversity protection, genetic resources and cultural assets. Rainforests also regulate climate and air quality.
Many of these services are difficult to monetize, and therefore attempts to structure economic arguments for forest conservation have limited success. An assessment of the value of non-timber products in Malaysia found a value of between $45/ha year to up to $2,455/ha year (Svarrer & Olsen, 2005) in tropical forests. Heubach et al. (2011) report that non-timber forest products could be as high as 39% of rural income. If one takes, for ex-ample, a cost of US$5/tCO2e, this would approximately be equivalent to the value of carbon stocks in the vol-untary market. The expectation however is that future carbon markets, whether domestic or regional, should exceed this value. If this happens, efforts in avoided de-forestation would become neutral in cost terms even before counting the many associated benefits36.
36 For purposes of the current study, a conservative market value of US$5/tCO2 is used. This value corresponds to a price level anticipated in the absence of a fully functioning global or regional carbon market (Peters-Stanley & Gonzalez, 2014), therefore reflecting the average price under voluntary conditions. However, the usually assumed price projec-tions in carbon market studies under conservative scenarios are much higher, of the order of US$20/tCO2 for the period 2020-2040 (for example, see Luckow et al. (2015)). Also, the estimated financial consequences of CO2 emissions into the atmosphere as calculated by Stern are US$100/ton of CO2 (Stern, 2006). In any case, the likely increase in the value of carbon within the future period of analysis would only strengthen the case for restoration.
4.3 REFORESTATION AND LAND RESTORATION
According to current estimates (Potapov et al., 2011), the LAC region has the potential to restore about 650 million ha of degraded and deforested lands (Table 4.3). Over two-thirds (450 million ha) of the possibilities for restoration are found in degraded forest landscapes that have been converted into woodlands, savannahs and other degraded agricultural lands in ecosystems with social milieus that lend themselves to mosaic restora-tion techniques (World Bank, 2014a).
Restoration approaches include silvopastures and agro-forestry, along with more ‘passive’ schemes, including the assisted regeneration of natural forests. This section of the analysis reviews the potential for carbon sinks through reforestation and land restoration.
4.3.1 REFORESTATIONThe IPCC defines “reforestation as the establishment of forest on land that had recent tree cover, whereas afforestation refers to land that has been without forest for much longer” (IPCC, 2007). For the purposes of this document, no differentiation is made between them. Under reforestation, all activities resulting in the re-covery of forest cover, inclusive of natural, assisted and planted reforestation, are considered.
Natural and assisted reforestation consists of allowing denuded or partially reforested land to recover its forest cover naturally. Under assisted reforestation, efforts are made to protect and preserve natural tree seedlings in forested areas. In addition to protection efforts, new trees are planted when needed or wanted (enrichment of forests). With this technique, forests grow faster than they would naturally, resulting in a significant contri-bution to carbon sequestration efforts. It also serves as a cheaper alternative to reforestation due to decreased nursery needs.
Assisted natural reforestation offers advantages over other techniques but may require longer periods of implementation. The process is labour-intensive and can be more costly than allowing secondary growth to regenerate naturally (natural reforestation). However, it may represent an alternative to forest regeneration while restoring some of the functionality lost through the process of land degradation.
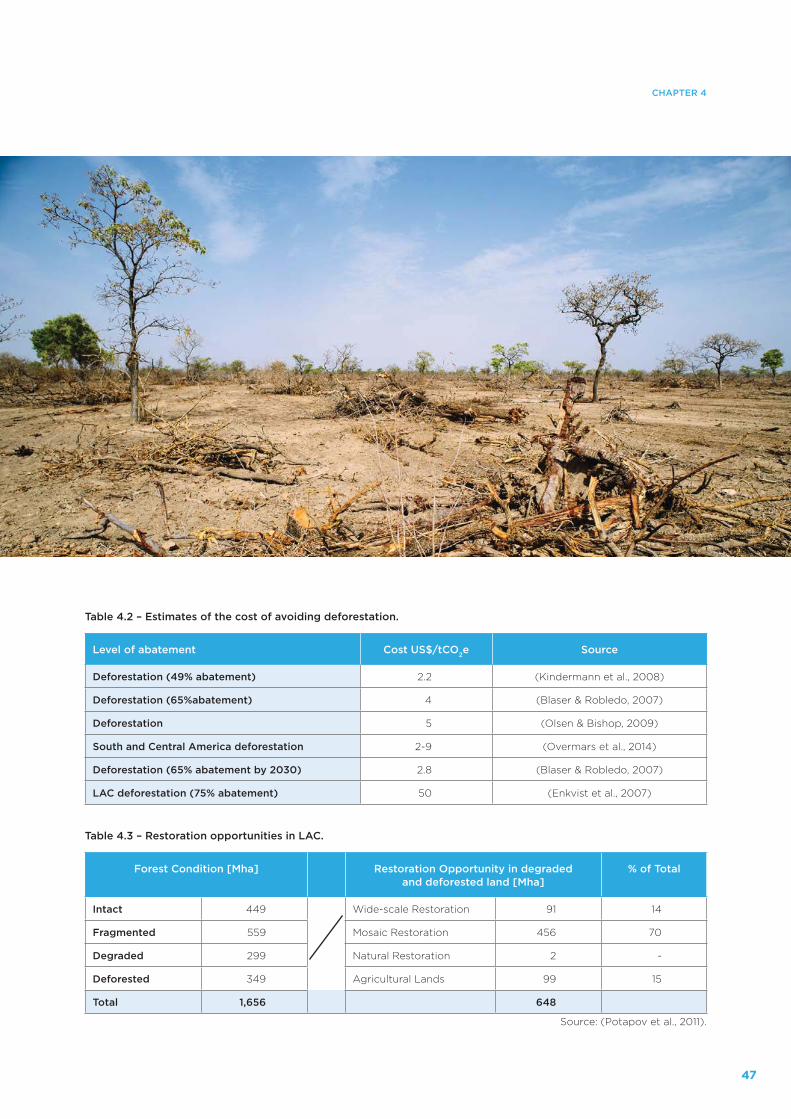
47
CHAPTER 4
Table 4.2 – Estimates of the cost of avoiding deforestation.
Level of abatement Cost US$/tCO2e Source
Deforestation (49% abatement) 2.2 (Kindermann et al., 2008)
Deforestation (65%abatement) 4 (Blaser & Robledo, 2007)
Deforestation 5 (Olsen & Bishop, 2009)
South and Central America deforestation 2-9 (Overmars et al., 2014)
Deforestation (65% abatement by 2030) 2.8 (Blaser & Robledo, 2007)
LAC deforestation (75% abatement) 50 (Enkvist et al., 2007)
Table 4.3 – Restoration opportunities in LAC.
Forest Condition [Mha] Restoration Opportunity in degraded and deforested land [Mha]
% of Total
Intact 449 Wide-scale Restoration 91 14
Fragmented 559 Mosaic Restoration 456 70
Degraded 299 Natural Restoration 2 -
Deforested 349 Agricultural Lands 99 15
Total 1,656 648
Source: (Potapov et al., 2011).
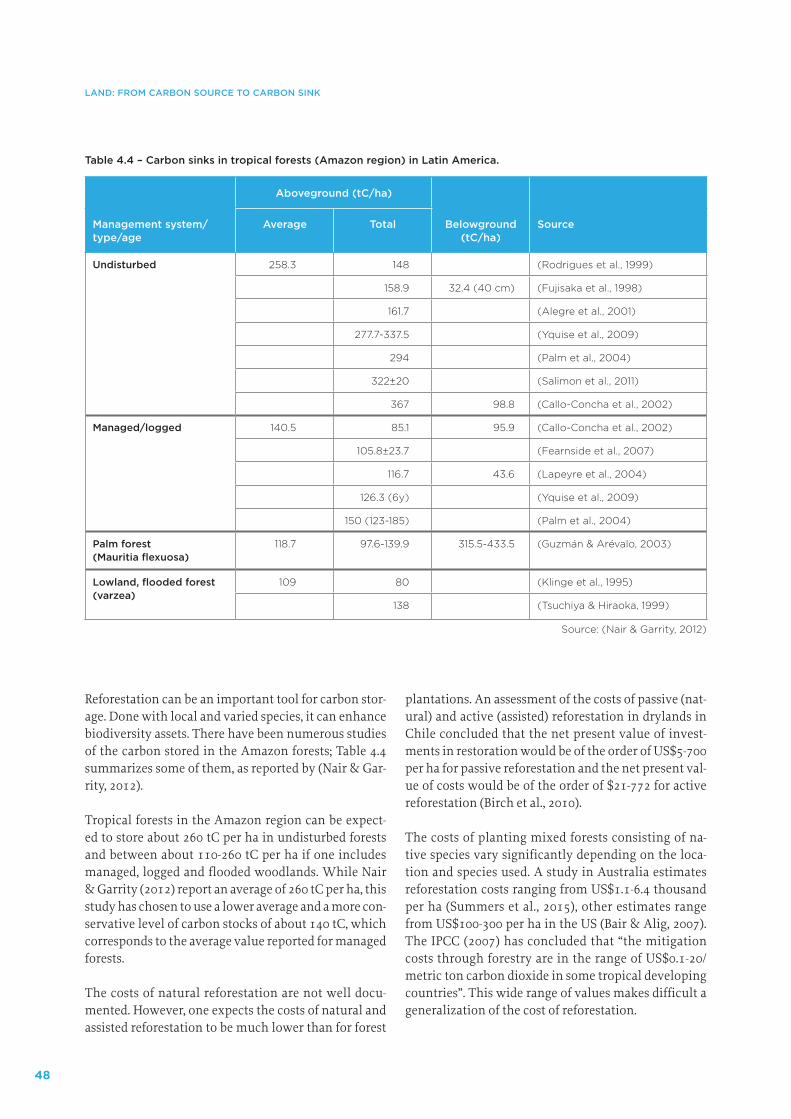
48
LAND: FROM CARBON SOURCE TO CARBON SINK
Reforestation can be an important tool for carbon stor-age. Done with local and varied species, it can enhance biodiversity assets. There have been numerous studies of the carbon stored in the Amazon forests; Table 4.4 summarizes some of them, as reported by (Nair & Gar-rity, 2012).
Tropical forests in the Amazon region can be expect-ed to store about 260 tC per ha in undisturbed forests and between about 110-260 tC per ha if one includes managed, logged and flooded woodlands. While Nair & Garrity (2012) report an average of 260 tC per ha, this study has chosen to use a lower average and a more con-servative level of carbon stocks of about 140 tC, which corresponds to the average value reported for managed forests.
The costs of natural reforestation are not well docu-mented. However, one expects the costs of natural and assisted reforestation to be much lower than for forest
plantations. An assessment of the costs of passive (nat-ural) and active (assisted) reforestation in drylands in Chile concluded that the net present value of invest-ments in restoration would be of the order of US$5-700 per ha for passive reforestation and the net present val-ue of costs would be of the order of $21-772 for active reforestation (Birch et al., 2010).
The costs of planting mixed forests consisting of na-tive species vary significantly depending on the loca-tion and species used. A study in Australia estimates reforestation costs ranging from US$1.1-6.4 thousand per ha (Summers et al., 2015), other estimates range from US$100-300 per ha in the US (Bair & Alig, 2007). The IPCC (2007) has concluded that “the mitigation costs through forestry are in the range of US$0.1-20/ metric ton carbon dioxide in some tropical developing countries”. This wide range of values makes difficult a generalization of the cost of reforestation.
Table 4.4 – Carbon sinks in tropical forests (Amazon region) in Latin America.
Aboveground (tC/ha)
Management system/type/age
Average Total Belowground (tC/ha)
Source
Undisturbed 258.3 148 (Rodrigues et al., 1999)
158.9 32.4 (40 cm) (Fujisaka et al., 1998)
161.7 (Alegre et al., 2001)
277.7-337.5 (Yquise et al., 2009)
294 (Palm et al., 2004)
322±20 (Salimon et al., 2011)
367 98.8 (Callo-Concha et al., 2002)
Managed/logged 140.5 85.1 95.9 (Callo-Concha et al., 2002)
105.8±23.7 (Fearnside et al., 2007)
116.7 43.6 (Lapeyre et al., 2004)
126.3 (6y) (Yquise et al., 2009)
150 (123-185) (Palm et al., 2004)
Palm forest (Mauritia flexuosa)
118.7 97.6-139.9 315.5-433.5 (Guzmán & Arévalo, 2003)
Lowland, flooded forest (varzea)
109 80 (Klinge et al., 1995)
138 (Tsuchiya & Hiraoka, 1999)
Source: (Nair & Garrity, 2012)
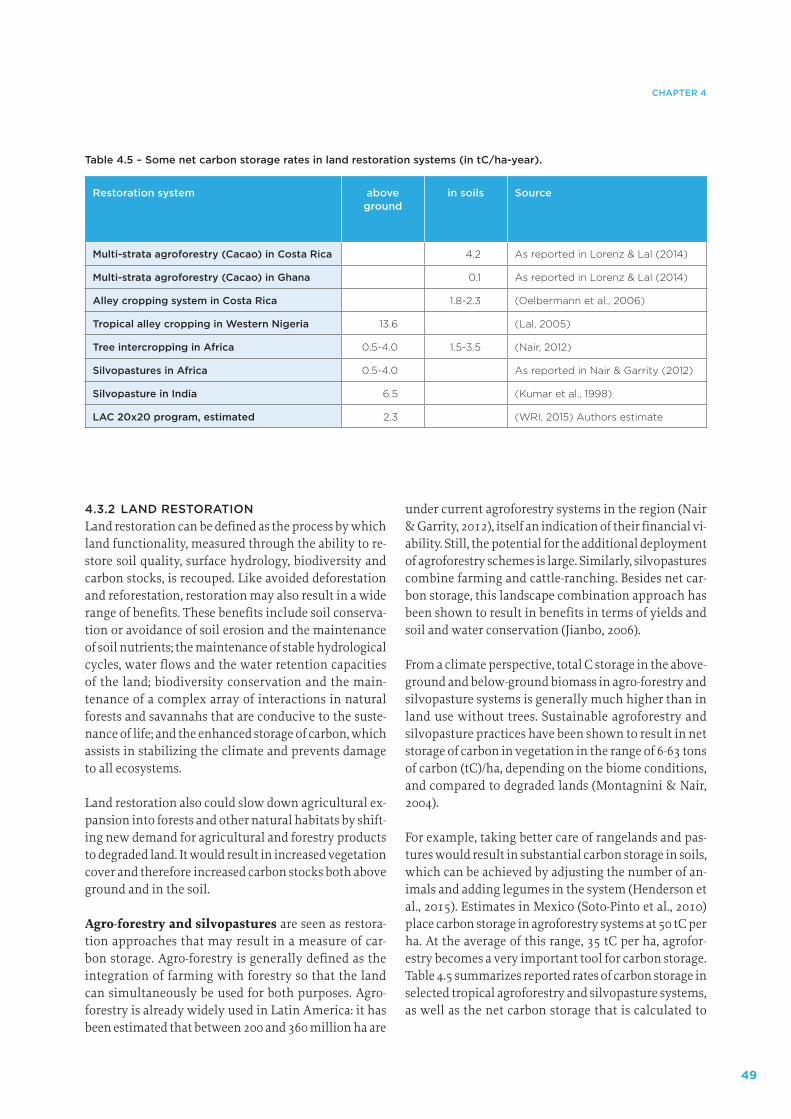
49
CHAPTER 4
4.3.2 LAND RESTORATIONLand restoration can be defined as the process by which land functionality, measured through the ability to re-store soil quality, surface hydrology, biodiversity and carbon stocks, is recouped. Like avoided deforestation and reforestation, restoration may also result in a wide range of benefits. These benefits include soil conserva-tion or avoidance of soil erosion and the maintenance of soil nutrients; the maintenance of stable hydrological cycles, water flows and the water retention capacities of the land; biodiversity conservation and the main-tenance of a complex array of interactions in natural forests and savannahs that are conducive to the suste-nance of life; and the enhanced storage of carbon, which assists in stabilizing the climate and prevents damage to all ecosystems.
Land restoration also could slow down agricultural ex-pansion into forests and other natural habitats by shift-ing new demand for agricultural and forestry products to degraded land. It would result in increased vegetation cover and therefore increased carbon stocks both above ground and in the soil.
Agro-forestry and silvopastures are seen as restora-tion approaches that may result in a measure of car-bon storage. Agro-forestry is generally defined as the integration of farming with forestry so that the land can simultaneously be used for both purposes. Agro-forestry is already widely used in Latin America: it has been estimated that between 200 and 360 million ha are
under current agroforestry systems in the region (Nair & Garrity, 2012), itself an indication of their financial vi-ability. Still, the potential for the additional deployment of agroforestry schemes is large. Similarly, silvopastures combine farming and cattle-ranching. Besides net car-bon storage, this landscape combination approach has been shown to result in benefits in terms of yields and soil and water conservation (Jianbo, 2006).
From a climate perspective, total C storage in the above-ground and below-ground biomass in agro-forestry and silvopasture systems is generally much higher than in land use without trees. Sustainable agroforestry and silvopasture practices have been shown to result in net storage of carbon in vegetation in the range of 6-63 tons of carbon (tC)/ha, depending on the biome conditions, and compared to degraded lands (Montagnini & Nair, 2004).
For example, taking better care of rangelands and pas-tures would result in substantial carbon storage in soils, which can be achieved by adjusting the number of an-imals and adding legumes in the system (Henderson et al., 2015). Estimates in Mexico (Soto-Pinto et al., 2010) place carbon storage in agroforestry systems at 50 tC per ha. At the average of this range, 35 tC per ha, agrofor-estry becomes a very important tool for carbon storage. Table 4.5 summarizes reported rates of carbon storage in selected tropical agroforestry and silvopasture systems, as well as the net carbon storage that is calculated to
Table 4.5 – Some net carbon storage rates in land restoration systems (in tC/ha-year).
Restoration system above ground
in soils Source
Multi-strata agroforestry (Cacao) in Costa Rica 4.2 As reported in Lorenz & Lal (2014)
Multi-strata agroforestry (Cacao) in Ghana 0.1 As reported in Lorenz & Lal (2014)
Alley cropping system in Costa Rica 1.8-2.3 (Oelbermann et al., 2006)
Tropical alley cropping in Western Nigeria 13.6 (Lal, 2005)
Tree intercropping in Africa 0.5-4.0 1.5-3.5 (Nair, 2012)
Silvopastures in Africa 0.5-4.0 As reported in Nair & Garrity (2012)
Silvopasture in India 6.5 (Kumar et al., 1998)
LAC 20x20 program, estimated 2.3 (WRI, 2015) Authors estimate
50
LAND: FROM CARBON SOURCE TO CARBON SINK
result from implementation of the 20x2037 initiative in Latin America. Most estimates are in the range of 2 to 6 tC per ha per year. This analysis uses a value of 2C/ha year as a conservative value in its calculations.
There seems to be ample evidence of the potential of restoration and reforestation efforts to increase carbon stocks on land. A combination of reforestation and land restoration efforts of sufficient size could neutralize all emissions from land-use activities in the region. For ex-ample, a 250 Mha effort (50 Mha in reforestation and 200 Mha in restoration) would result in an accumula-tion of sinks of about 2.0 GtCO2e per year (see details in Table 4.8).
In summary, restoration efforts could be essential for the achievement of a low-carbon development path in the region, as well as being an important strategic sup-port for maintaining and restoring the broad range of critical regulating ecosystem services that forest and woodland landscapes provide and require38. But, are these efforts economically viable?
4.4 ECONOMIC BENEFITS OF REFORESTATION AND RESTORATION EFFORTS
As there are a number of restoration schemes, and very many landscape combinations susceptible of restora-tion, it is difficult to generalize about the benefits that might result. A simple typology of the potential benefits might include the following:
• wood forest products, or the revenues that would re-sult from harvesting timber, firewood or other prod-ucts that imply a reduction, albeit temporary, in the
37 Initiative 20x20 is a country-led effort to initiate the restoration of 20 million ha by 2020 in Latin America. The initiative has three activities:
1. Political drive. A robust dialogue with Ministers of Agriculture and Environment in the region, seeking to: a) secure a sustainable policy and regulatory framework for land restoration and avoided deforestation, and b) incorporate national programs and activities to support resto-ration and avoided deforestation efforts in the region of about 20 million ha by 2020.
2. Analysis. An assessment of the societal benefits (avoided costs and eco-nomic benefits) from land restoration and avoided deforestation efforts that can be used to guide sound policies and investments on the ground.
3. Financial Drive. Securing commitments of the order of US$670 million for the financing of land restoration efforts in the region from impact investment funds, and a similar amount from bilateral and mul-tilateral funding, for sound agroforestry, agro-pastoral and agricultural practices, reforestation and avoided deforestation.
38 Land restoration efforts, including those targeting agro-ecosystems, have been positively correlated with the recovery of environmental services, including improvements in biodiversity (Berra et al., 2013).
standing of forest biomass, whether in agroforestry, silvopastures or reforestation efforts;
• non-wood forest products, or the revenues from prod-ucts harvested in a sustainable manner without neg-atively impacting the biomass of the standing forest (e.g. medicinal and animal products, fruit, nuts), also in agroforestry, silvopastures or reforestation efforts;
• potential profits from eco-tourism generated by for-ests, wilderness areas and related landscapes (in-cluding national parks) that could be augmented by landscape restoration efforts. There is historical revenue data from Costa Rica, where income in ec-otourism has been linked to reforestation programs; these revenues are related to tourism in protected areas instead of degraded land;
• profits from agricultural production or animal agricul-
ture that could be enhanced by landscape restoration efforts. In particular, expected increased revenues from agricultural production as a result of agrofor-estry and silvopasture efforts on degraded agricul-tural lands;
• avoided annual food security costs representing the potential decline in food-security premiums as ag-ricultural production increases and becomes more stable within any given and unchanged agricultur-al frontier in non-degraded landscapes. That is, im-proved sustainable food production should result in a reduction of food insecurity, which is partially captured by the market value of food security premi-ums in the region’s crop insurance market;
• monetized gains in carbon storage as a result of res-toration. This economic benefit from captured and stored carbon could be enhanced as a result of the increase in vegetation cover stemming from re-forestation, assisted regeneration, agroforestry, sil-vopastures and avoided deforestation as reflected in carbon markets.
Substantial data, methodological and other limitations make it difficult to attempt an estimate that captures and incorporates other benefits of landscape restoration such as improvements in, or avoided losses of, biodiver-sity, soil and water protection, climate resilience, etc..
A number of case studies of the financials of reforest-ation in the region are available in the literature. In many cases, reforestation has proved to be financially attractive, especially with monocultures, frequently of exotic species. However, more recently, a number of experiences have demonstrated the potential returns of reforestation with multiple native species. A few suc-
51
CHAPTER 4
cessful examples of reforestation, using native species, are listed below:
• 15,000 ha of commercial plantations with native and exotic species in Chinchina (Colombia) and 15,000 ha of sustainably managed native forests are reported to have resulted in adequate financial returns capable of guaranteeing the long–term sus-tainability of the investments (http://www.fao.org/forestry/12077-0e9dadce99f02474339f5e5c17abe-1fc1.pdf);
• 1,000 ha are now reforested with native species in the Mixteca region of Mexico. Relying on native tree species, terraced agricultural techniques and con-tainment ditches for preventing hillside erosion in the Mixteca region, the Center for Integral Small Farmer Development or CEDICAM has not only reforested but helped create more economic oppor-tunities and even gender equality within the region. CEDICAM’s founder, Jose Jesus Santos, was awarded the Goldman Environmental Prize in 2008 (http://www.cedicam-ac.org);
• Beginning in the early 1980s, residents of Gaviotas in Colombia, led by Paolo Lugari, began planting Caribbean pine trees, ensuring their survival in the acidic soil by applying mycorrhizal fungus to their roots. Villagers have successfully reforested about 8,000 ha and created economic opportunities (http://www.friendsofgaviotas.org);
• In Brazil, the ITPA (Instituto Terra de Preservacao Ambiental) forest restoration project has reforested about 950 hectares of formerly barren hillside with native Atlantic forest species such as Araguaney and fast-growing Angico Artemisiana, some of which are almost ten metres tall (http://www.itpa.org.br);
• There are many other projects, some supported through the Bio Carbon Fund and others through the voluntary market. Details can be consulted at http://www.biocarbonfund-isfl.org.
Despite the growing number of reforestation experienc-es, there remain significant barriers to expanding efforts at the scale that is required to consolidate a carbon sink of regional significance. These include: a) the lack of sufficient fiscal and financial incentives; b) an inability to internalize the economic benefits of reforestation; and c) the lack of sufficient native vegetation material (germ-plasm).
There is likewise a growing body of evidence of the market betting on agroforestry and silvopastures on
degraded land in Latin America. Investments in land restoration through these schemes are being developed at a rapid pace in the region. This reflects the fact that the economic arguments for restoration have been in-ternalized by the private sector. Under Initiative 20x20 for example, eight private impact investors have ear-marked US$670 million for investments in restoration. Numerous projects are already under implementation. For example, just to site a few:
• the CIPAV project in Colombia, which seeks the restoration of land under extensive cattle-ranch-ing through the implementation of silvopastures, which has had substantial economic success (http://www.cipav.org.co);
• the Peru-Cocoa Alliance (http://www.carana.com), which seeks to restore land through agroforestry schemes with small landholders in Peru, which has also had remarkable success;
• the management of grasslands and pasture in the Chilean and Argentinian Patagonia, developed through a network of 400 million acres of temper-ate grasslands supporting a unique biological and cultural heritage, and providing many important ecosystem services, including clean air and water, forage for livestock, carbon sequestration and habi-tat for wildlife (http://www.fao.org/nr/sustainabili-ty/grassland/best-practices/projects);
• the development of a program to re-invigorate small and medium-size farms in the Matagalpa region of Nicaragua that have been severely affected by rust and the effects of global warming (http://www.mo-ringapartnership.com/jt_files). Many others could be listed.
Besides specific investments and projects, restoration and reforestation have the potential to reactivate or pro-mote economic activity in rural areas. For example, a recent analysis has provided a high-level accounting of the size and scope of the restoration economy in terms of employment, value added and overall economic out-put on a national scale for the United States. Based on this analysis, it was concluded that the domestic ecolog-ical restoration sector directly employs ~126,000 work-ers and generates ~US$9.5 billion in economic output (sales) annually. This activity was found to support an additional 95,000 jobs and $15 billion in economic output through indirect (business-to-business) linkages and increased household spending (BenDor et al., 2015).
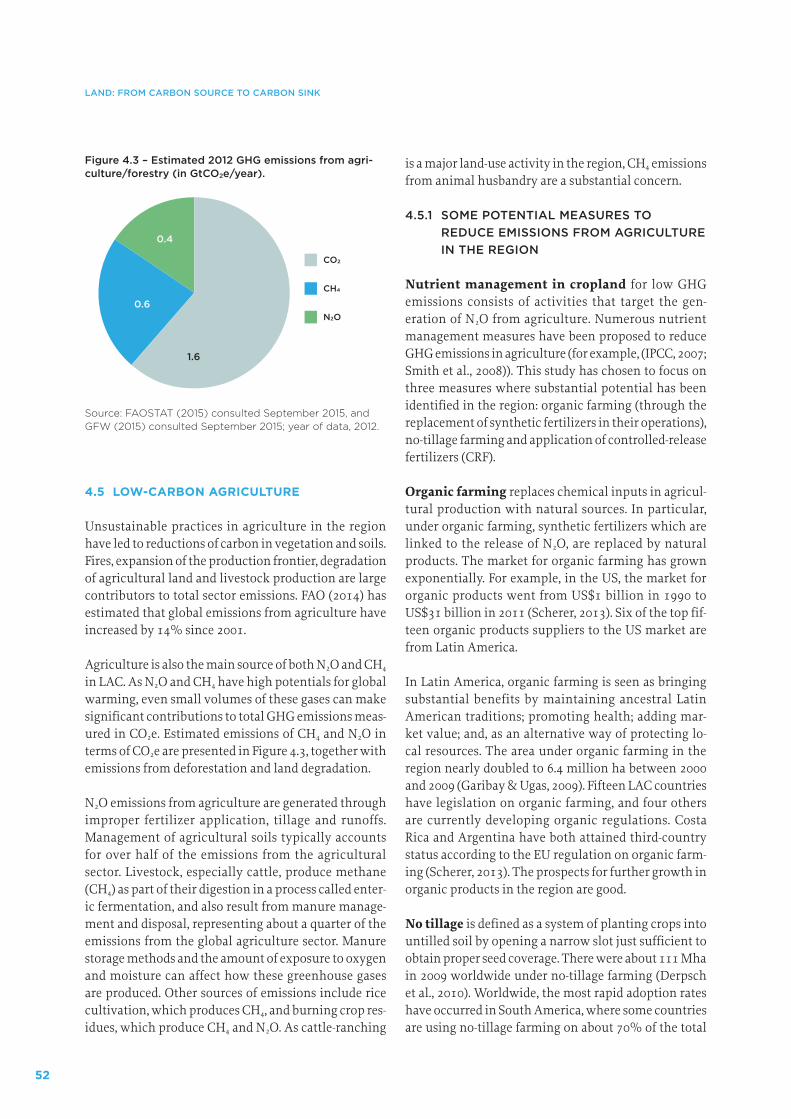
52
LAND: FROM CARBON SOURCE TO CARBON SINK
4.5 LOW-CARBON AGRICULTURE
Unsustainable practices in agriculture in the region have led to reductions of carbon in vegetation and soils. Fires, expansion of the production frontier, degradation of agricultural land and livestock production are large contributors to total sector emissions. FAO (2014) has estimated that global emissions from agriculture have increased by 14% since 2001.
Agriculture is also the main source of both N2O and CH4 in LAC. As N2O and CH4 have high potentials for global warming, even small volumes of these gases can make significant contributions to total GHG emissions meas-ured in CO2e. Estimated emissions of CH4 and N2O in terms of CO2e are presented in Figure 4.3, together with emissions from deforestation and land degradation.
N2O emissions from agriculture are generated through improper fertilizer application, tillage and runoffs. Management of agricultural soils typically accounts for over half of the emissions from the agricultural sector. Livestock, especially cattle, produce methane (CH4) as part of their digestion in a process called enter-ic fermentation, and also result from manure manage-ment and disposal, representing about a quarter of the emissions from the global agriculture sector. Manure storage methods and the amount of exposure to oxygen and moisture can affect how these greenhouse gases are produced. Other sources of emissions include rice cultivation, which produces CH4, and burning crop res-idues, which produce CH4 and N2O. As cattle-ranching
is a major land-use activity in the region, CH4 emissions from animal husbandry are a substantial concern.
4.5.1 SOME POTENTIAL MEASURES TO REDUCE EMISSIONS FROM AGRICULTURE IN THE REGION
Nutrient management in cropland for low GHG emissions consists of activities that target the gen-eration of N2O from agriculture. Numerous nutrient management measures have been proposed to reduce GHG emissions in agriculture (for example, (IPCC, 2007; Smith et al., 2008)). This study has chosen to focus on three measures where substantial potential has been identified in the region: organic farming (through the replacement of synthetic fertilizers in their operations), no-tillage farming and application of controlled-release fertilizers (CRF).
Organic farming replaces chemical inputs in agricul-tural production with natural sources. In particular, under organic farming, synthetic fertilizers which are linked to the release of N2O, are replaced by natural products. The market for organic farming has grown exponentially. For example, in the US, the market for organic products went from US$1 billion in 1990 to US$31 billion in 2011 (Scherer, 2013). Six of the top fif-teen organic products suppliers to the US market are from Latin America.
In Latin America, organic farming is seen as bringing substantial benefits by maintaining ancestral Latin American traditions; promoting health; adding mar-ket value; and, as an alternative way of protecting lo-cal resources. The area under organic farming in the region nearly doubled to 6.4 million ha between 2000 and 2009 (Garibay & Ugas, 2009). Fifteen LAC countries have legislation on organic farming, and four others are currently developing organic regulations. Costa Rica and Argentina have both attained third-country status according to the EU regulation on organic farm-ing (Scherer, 2013). The prospects for further growth in organic products in the region are good.
No tillage is defined as a system of planting crops into untilled soil by opening a narrow slot just sufficient to obtain proper seed coverage. There were about 111 Mha in 2009 worldwide under no-tillage farming (Derpsch et al., 2010). Worldwide, the most rapid adoption rates have occurred in South America, where some countries are using no-tillage farming on about 70% of the total
Figure 4.3 – Estimated 2012 GHG emissions from agri-culture/forestry (in GtCO2e/year).
Source: FAOSTAT (2015) consulted September 2015, and GFW (2015) consulted September 2015; year of data, 2012.
1.6
0.4
0.6
CO2
CH4
N2O
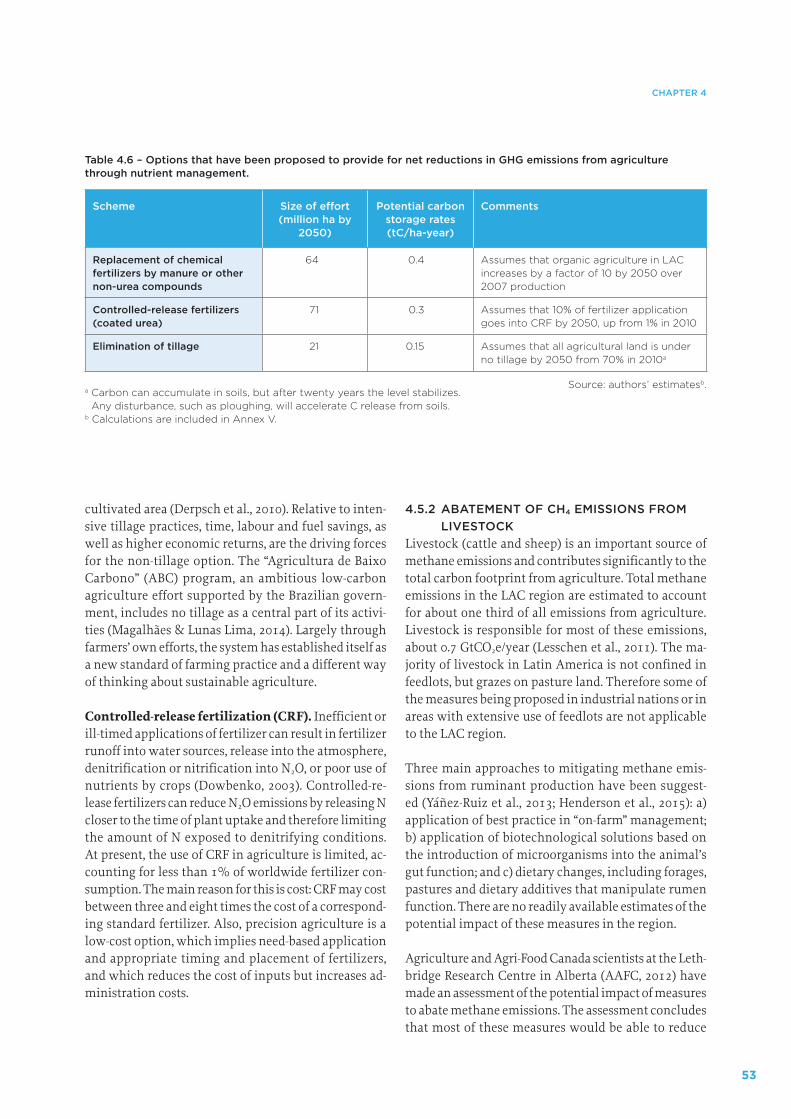
53
CHAPTER 4
cultivated area (Derpsch et al., 2010). Relative to inten-sive tillage practices, time, labour and fuel savings, as well as higher economic returns, are the driving forces for the non-tillage option. The “Agricultura de Baixo Carbono” (ABC) program, an ambitious low-carbon agriculture effort supported by the Brazilian govern-ment, includes no tillage as a central part of its activi-ties (Magalhães & Lunas Lima, 2014). Largely through farmers’ own efforts, the system has established itself as a new standard of farming practice and a different way of thinking about sustainable agriculture.
Controlled-release fertilization (CRF). Inefficient or ill-timed applications of fertilizer can result in fertilizer runoff into water sources, release into the atmosphere, denitrification or nitrification into N2O, or poor use of nutrients by crops (Dowbenko, 2003). Controlled-re-lease fertilizers can reduce N2O emissions by releasing N closer to the time of plant uptake and therefore limiting the amount of N exposed to denitrifying conditions. At present, the use of CRF in agriculture is limited, ac-counting for less than 1% of worldwide fertilizer con-sumption. The main reason for this is cost: CRF may cost between three and eight times the cost of a correspond-ing standard fertilizer. Also, precision agriculture is a low-cost option, which implies need-based application and appropriate timing and placement of fertilizers, and which reduces the cost of inputs but increases ad-ministration costs.
4.5.2 ABATEMENT OF CH4 EMISSIONS FROM LIVESTOCK
Livestock (cattle and sheep) is an important source of methane emissions and contributes significantly to the total carbon footprint from agriculture. Total methane emissions in the LAC region are estimated to account for about one third of all emissions from agriculture. Livestock is responsible for most of these emissions, about 0.7 GtCO2e/year (Lesschen et al., 2011). The ma-jority of livestock in Latin America is not confined in feedlots, but grazes on pasture land. Therefore some of the measures being proposed in industrial nations or in areas with extensive use of feedlots are not applicable to the LAC region.
Three main approaches to mitigating methane emis-sions from ruminant production have been suggest-ed (Yáñez-Ruiz et al., 2013; Henderson et al., 2015): a) application of best practice in “on-farm” management; b) application of biotechnological solutions based on the introduction of microorganisms into the animal’s gut function; and c) dietary changes, including forages, pastures and dietary additives that manipulate rumen function. There are no readily available estimates of the potential impact of these measures in the region.
Agriculture and Agri-Food Canada scientists at the Leth-bridge Research Centre in Alberta (AAFC, 2012) have made an assessment of the potential impact of measures to abate methane emissions. The assessment concludes that most of these measures would be able to reduce
Table 4.6 – Options that have been proposed to provide for net reductions in GHG emissions from agriculture through nutrient management.
Scheme Size of effort (million ha by
2050)
Potential carbon storage rates (tC/ha-year)
Comments
Replacement of chemical fertilizers by manure or other non-urea compounds
64 0.4 Assumes that organic agriculture in LAC increases by a factor of 10 by 2050 over 2007 production
Controlled-release fertilizers (coated urea)
71 0.3 Assumes that 10% of fertilizer application goes into CRF by 2050, up from 1% in 2010
Elimination of tillage 21 0.15 Assumes that all agricultural land is under no tillage by 2050 from 70% in 2010a
Source: authors’ estimatesb.a Carbon can accumulate in soils, but after twenty years the level stabilizes.
Any disturbance, such as ploughing, will accelerate C release from soils. b Calculations are included in Annex V.
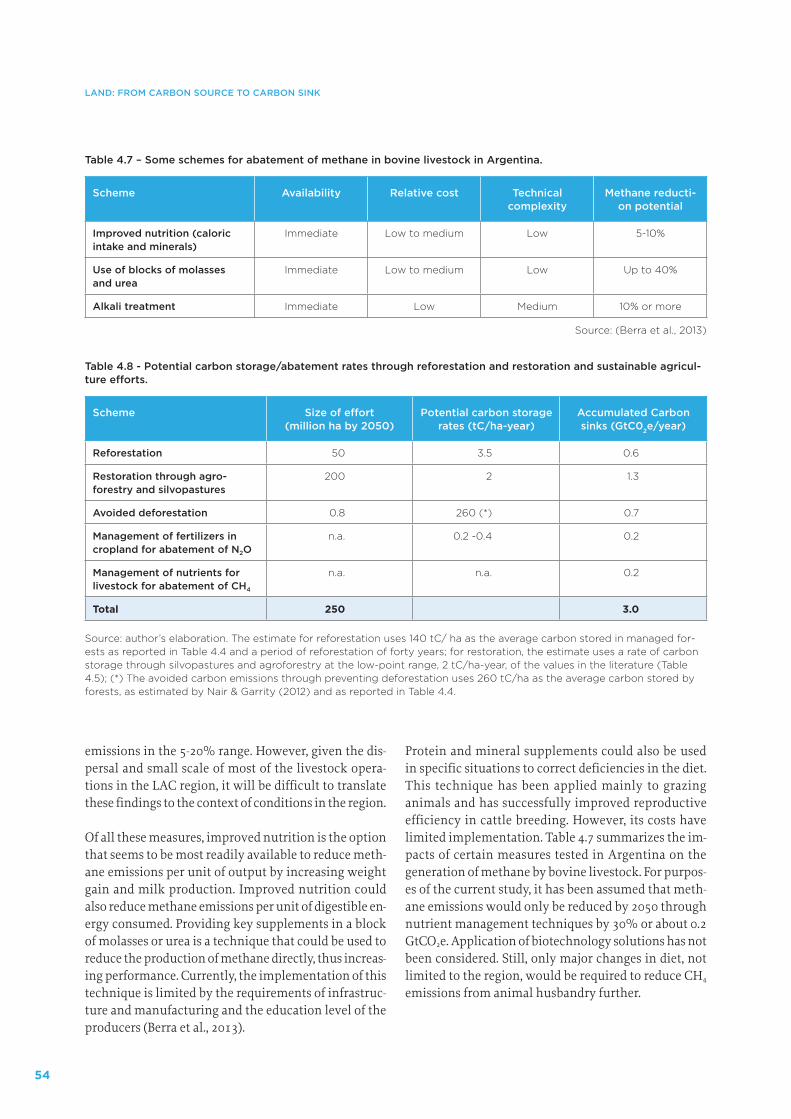
54
LAND: FROM CARBON SOURCE TO CARBON SINK
Table 4.7 – Some schemes for abatement of methane in bovine livestock in Argentina.
Scheme Availability Relative cost Technical complexity
Methane reducti-on potential
Improved nutrition (caloric intake and minerals)
Immediate Low to medium Low 5-10%
Use of blocks of molasses and urea
Immediate Low to medium Low Up to 40%
Alkali treatment Immediate Low Medium 10% or more
Source: (Berra et al., 2013)
Table 4.8 - Potential carbon storage/abatement rates through reforestation and restoration and sustainable agricul-ture efforts.
Scheme Size of effort (million ha by 2050)
Potential carbon storage rates (tC/ha-year)
Accumulated Carbon sinks (GtC02e/year)
Reforestation 50 3.5 0.6
Restoration through agro-forestry and silvopastures
200 2 1.3
Avoided deforestation 0.8 260 (*) 0.7
Management of fertilizers incropland for abatement of N2O
n.a. 0.2 -0.4 0.2
Management of nutrients forlivestock for abatement of CH4
n.a. n.a. 0.2
Total 250 3.0
Source: author’s elaboration. The estimate for reforestation uses 140 tC/ ha as the average carbon stored in managed for-ests as reported in Table 4.4 and a period of reforestation of forty years; for restoration, the estimate uses a rate of carbon storage through silvopastures and agroforestry at the low-point range, 2 tC/ha-year, of the values in the literature (Table 4.5); (*) The avoided carbon emissions through preventing deforestation uses 260 tC/ha as the average carbon stored by forests, as estimated by Nair & Garrity (2012) and as reported in Table 4.4.
emissions in the 5-20% range. However, given the dis-persal and small scale of most of the livestock opera-tions in the LAC region, it will be difficult to translate these findings to the context of conditions in the region.
Of all these measures, improved nutrition is the option that seems to be most readily available to reduce meth-ane emissions per unit of output by increasing weight gain and milk production. Improved nutrition could also reduce methane emissions per unit of digestible en-ergy consumed. Providing key supplements in a block of molasses or urea is a technique that could be used to reduce the production of methane directly, thus increas-ing performance. Currently, the implementation of this technique is limited by the requirements of infrastruc-ture and manufacturing and the education level of the producers (Berra et al., 2013).
Protein and mineral supplements could also be used in specific situations to correct deficiencies in the diet. This technique has been applied mainly to grazing animals and has successfully improved reproductive efficiency in cattle breeding. However, its costs have limited implementation. Table 4.7 summarizes the im-pacts of certain measures tested in Argentina on the generation of methane by bovine livestock. For purpos-es of the current study, it has been assumed that meth-ane emissions would only be reduced by 2050 through nutrient management techniques by 30% or about 0.2 GtCO2e. Application of biotechnology solutions has not been considered. Still, only major changes in diet, not limited to the region, would be required to reduce CH4 emissions from animal husbandry further.
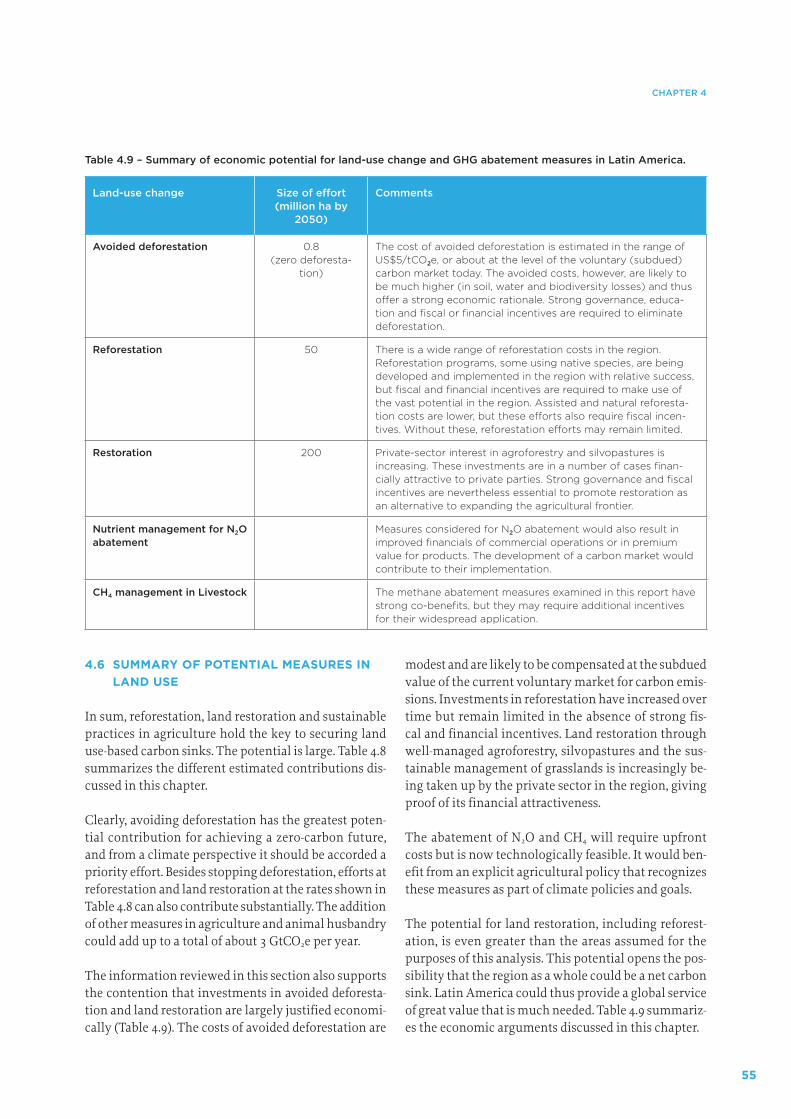
55
CHAPTER 4
4.6 SUMMARY OF POTENTIAL MEASURES IN LAND USE
In sum, reforestation, land restoration and sustainable practices in agriculture hold the key to securing land use-based carbon sinks. The potential is large. Table 4.8 summarizes the different estimated contributions dis-cussed in this chapter.
Clearly, avoiding deforestation has the greatest poten-tial contribution for achieving a zero-carbon future, and from a climate perspective it should be accorded a priority effort. Besides stopping deforestation, efforts at reforestation and land restoration at the rates shown in Table 4.8 can also contribute substantially. The addition of other measures in agriculture and animal husbandry could add up to a total of about 3 GtCO2e per year.
The information reviewed in this section also supports the contention that investments in avoided deforesta-tion and land restoration are largely justified economi-cally (Table 4.9). The costs of avoided deforestation are
modest and are likely to be compensated at the subdued value of the current voluntary market for carbon emis-sions. Investments in reforestation have increased over time but remain limited in the absence of strong fis-cal and financial incentives. Land restoration through well-managed agroforestry, silvopastures and the sus-tainable management of grasslands is increasingly be-ing taken up by the private sector in the region, giving proof of its financial attractiveness.
The abatement of N2O and CH4 will require upfront costs but is now technologically feasible. It would ben-efit from an explicit agricultural policy that recognizes these measures as part of climate policies and goals.
The potential for land restoration, including reforest-ation, is even greater than the areas assumed for the purposes of this analysis. This potential opens the pos-sibility that the region as a whole could be a net carbon sink. Latin America could thus provide a global service of great value that is much needed. Table 4.9 summariz-es the economic arguments discussed in this chapter.
Table 4.9 – Summary of economic potential for land-use change and GHG abatement measures in Latin America.
Land-use change Size of effort (million ha by
2050)
Comments
Avoided deforestation 0.8 (zero deforesta-
tion)
The cost of avoided deforestation is estimated in the range of US$5/tCO2e, or about at the level of the voluntary (subdued) carbon market today. The avoided costs, however, are likely to be much higher (in soil, water and biodiversity losses) and thus offer a strong economic rationale. Strong governance, educa-tion and fiscal or financial incentives are required to eliminate deforestation.
Reforestation 50 There is a wide range of reforestation costs in the region. Reforestation programs, some using native species, are being developed and implemented in the region with relative success, but fiscal and financial incentives are required to make use of the vast potential in the region. Assisted and natural reforesta-tion costs are lower, but these efforts also require fiscal incen-tives. Without these, reforestation efforts may remain limited.
Restoration 200 Private-sector interest in agroforestry and silvopastures is increasing. These investments are in a number of cases finan-cially attractive to private parties. Strong governance and fiscal incentives are nevertheless essential to promote restoration as an alternative to expanding the agricultural frontier.
Nutrient management for N2O abatement
Measures considered for N2O abatement would also result in improved financials of commercial operations or in premium value for products. The development of a carbon market would contribute to their implementation.
CH4 management in Livestock The methane abatement measures examined in this report have strong co-benefits, but they may require additional incentives for their widespread application.
56
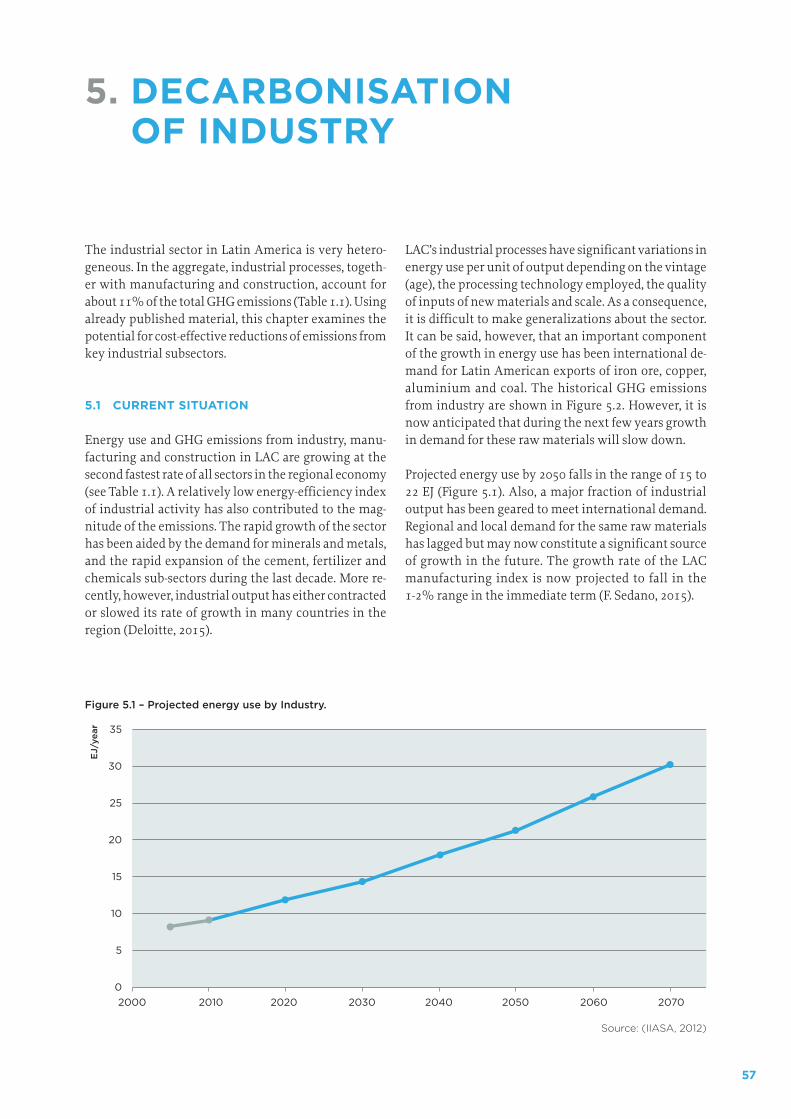
57
5. DECARBONISATION OF INDUSTRY
The industrial sector in Latin America is very hetero-geneous. In the aggregate, industrial processes, togeth-er with manufacturing and construction, account for about 11% of the total GHG emissions (Table 1.1). Using already published material, this chapter examines the potential for cost-effective reductions of emissions from key industrial subsectors.
5.1 CURRENT SITUATION
Energy use and GHG emissions from industry, manu-facturing and construction in LAC are growing at the second fastest rate of all sectors in the regional economy (see Table 1.1). A relatively low energy-efficiency index of industrial activity has also contributed to the mag-nitude of the emissions. The rapid growth of the sector has been aided by the demand for minerals and metals, and the rapid expansion of the cement, fertilizer and chemicals sub-sectors during the last decade. More re-cently, however, industrial output has either contracted or slowed its rate of growth in many countries in the region (Deloitte, 2015).
LAC’s industrial processes have significant variations in energy use per unit of output depending on the vintage (age), the processing technology employed, the quality of inputs of new materials and scale. As a consequence, it is difficult to make generalizations about the sector. It can be said, however, that an important component of the growth in energy use has been international de-mand for Latin American exports of iron ore, copper, aluminium and coal. The historical GHG emissions from industry are shown in Figure 5.2. However, it is now anticipated that during the next few years growth in demand for these raw materials will slow down.
Projected energy use by 2050 falls in the range of 15 to 22 EJ (Figure 5.1). Also, a major fraction of industrial output has been geared to meet international demand. Regional and local demand for the same raw materials has lagged but may now constitute a significant source of growth in the future. The growth rate of the LAC manufacturing index is now projected to fall in the 1-2% range in the immediate term (F. Sedano, 2015).
Figure 5.1 – Projected energy use by Industry.
Source: (IIASA, 2012)
EJ/
year
0
5
10
15
20
25
30
35
2000 2010 2020 2030 2040 2050 2060 2070
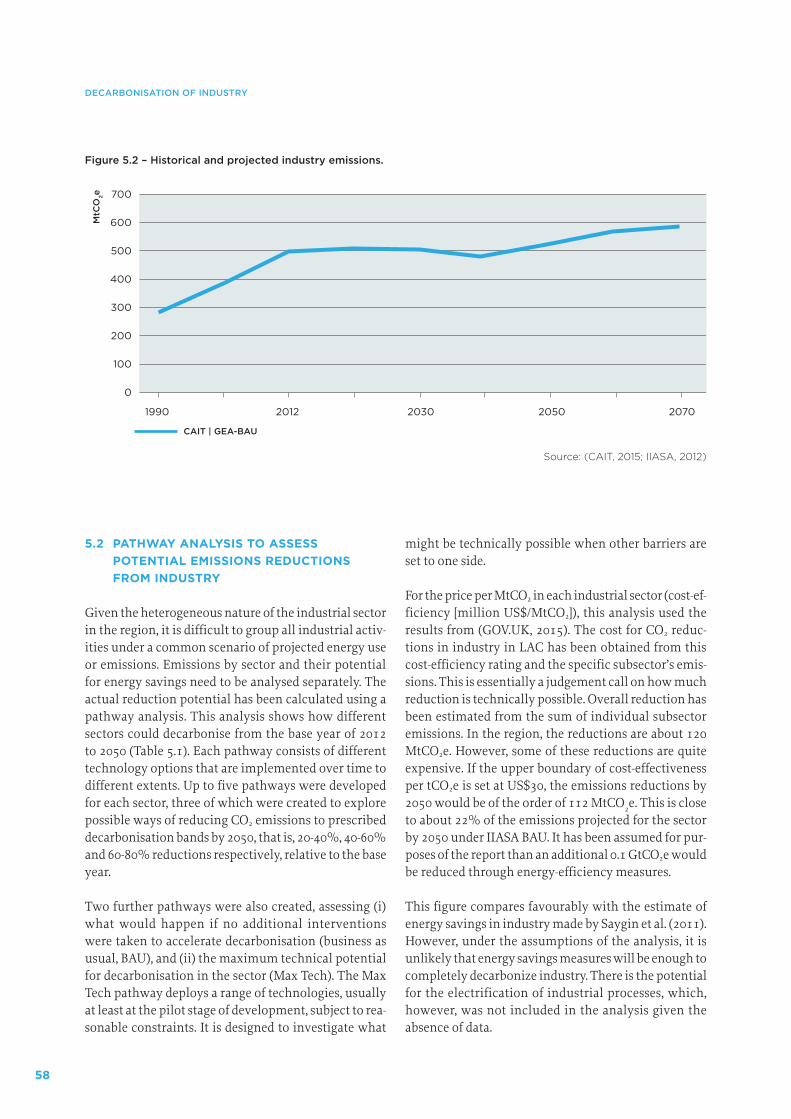
58
DECARBONISATION OF INDUSTRY
5.2 PATHWAY ANALYSIS TO ASSESS POTENTIAL EMISSIONS REDUCTIONS FROM INDUSTRY
Given the heterogeneous nature of the industrial sector in the region, it is difficult to group all industrial activ-ities under a common scenario of projected energy use or emissions. Emissions by sector and their potential for energy savings need to be analysed separately. The actual reduction potential has been calculated using a pathway analysis. This analysis shows how different sectors could decarbonise from the base year of 2012 to 2050 (Table 5.1). Each pathway consists of different technology options that are implemented over time to different extents. Up to five pathways were developed for each sector, three of which were created to explore possible ways of reducing CO2 emissions to prescribed decarbonisation bands by 2050, that is, 20-40%, 40-60% and 60-80% reductions respectively, relative to the base year.
Two further pathways were also created, assessing (i) what would happen if no additional interventions were taken to accelerate decarbonisation (business as usual, BAU), and (ii) the maximum technical potential for decarbonisation in the sector (Max Tech). The Max Tech pathway deploys a range of technologies, usually at least at the pilot stage of development, subject to rea-sonable constraints. It is designed to investigate what
might be technically possible when other barriers are set to one side.
For the price per MtCO2 in each industrial sector (cost-ef-ficiency [million US$/MtCO2]), this analysis used the results from (GOV.UK, 2015). The cost for CO2 reduc-tions in industry in LAC has been obtained from this cost-efficiency rating and the specific subsector’s emis-sions. This is essentially a judgement call on how much reduction is technically possible. Overall reduction has been estimated from the sum of individual subsector emissions. In the region, the reductions are about 120 MtCO2e. However, some of these reductions are quite expensive. If the upper boundary of cost-effectiveness per tCO2e is set at US$30, the emissions reductions by 2050 would be of the order of 112 MtCO2e. This is close to about 22% of the emissions projected for the sector by 2050 under IIASA BAU. It has been assumed for pur-poses of the report than an additional 0.1 GtCO2e would be reduced through energy-efficiency measures.
This figure compares favourably with the estimate of energy savings in industry made by Saygin et al. (2011). However, under the assumptions of the analysis, it is unlikely that energy savings measures will be enough to completely decarbonize industry. There is the potential for the electrification of industrial processes, which, however, was not included in the analysis given the absence of data.
Figure 5.2 – Historical and projected industry emissions.
Source: (CAIT, 2015; IIASA, 2012)
MtC
O2e
CAIT | GEA-BAU
0
300
200
100
700
600
500
400
1990 2012 2030 2050 2070
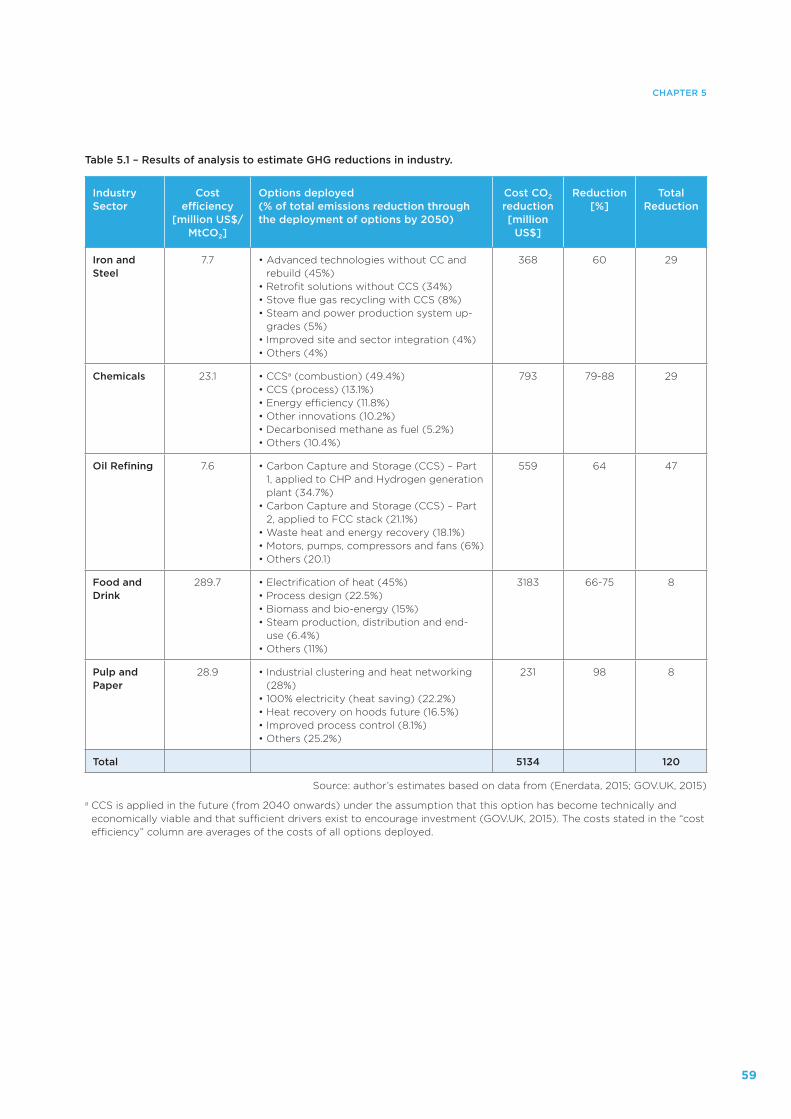
59
CHAPTER 5
Table 5.1 – Results of analysis to estimate GHG reductions in industry.
Industry Sector
Cost efficiency
[million US$/ MtCO2]
Options deployed (% of total emissions reduction through the deployment of options by 2050)
Cost CO2 reduction [million
US$]
Reduction [%]
Total Reduction
Iron and Steel
7.7 • Advanced technologies without CC and rebuild (45%)
• Retrofit solutions without CCS (34%)• Stove flue gas recycling with CCS (8%)• Steam and power production system up-
grades (5%)• Improved site and sector integration (4%)• Others (4%)
368 60 29
Chemicals 23.1 • CCSa (combustion) (49.4%)• CCS (process) (13.1%)• Energy efficiency (11.8%)• Other innovations (10.2%)• Decarbonised methane as fuel (5.2%)• Others (10.4%)
793 79-88 29
Oil Refining 7.6 • Carbon Capture and Storage (CCS) – Part 1, applied to CHP and Hydrogen generation plant (34.7%)
• Carbon Capture and Storage (CCS) – Part 2, applied to FCC stack (21.1%)
• Waste heat and energy recovery (18.1%)• Motors, pumps, compressors and fans (6%)• Others (20.1)
559 64 47
Food and Drink
289.7 • Electrification of heat (45%)• Process design (22.5%)• Biomass and bio-energy (15%)• Steam production, distribution and end-
use (6.4%)• Others (11%)
3183 66-75 8
Pulp and Paper
28.9 • Industrial clustering and heat networking (28%)
• 100% electricity (heat saving) (22.2%)• Heat recovery on hoods future (16.5%)• Improved process control (8.1%)• Others (25.2%)
231 98 8
Total 5134 120
Source: author’s estimates based on data from (Enerdata, 2015; GOV.UK, 2015)
a CCS is applied in the future (from 2040 onwards) under the assumption that this option has become technically and economically viable and that sufficient drivers exist to encourage investment (GOV.UK, 2015). The costs stated in the “cost efficiency” column are averages of the costs of all options deployed.
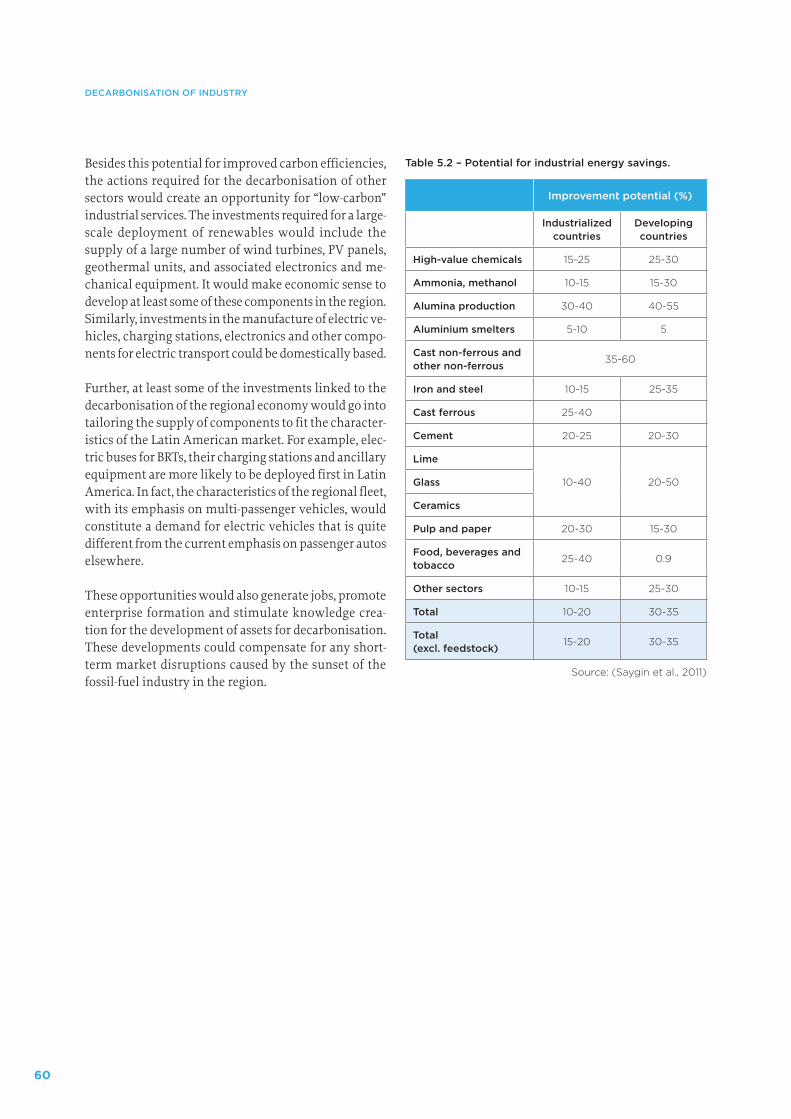
60
DECARBONISATION OF INDUSTRY
Besides this potential for improved carbon efficiencies, the actions required for the decarbonisation of other sectors would create an opportunity for “low-carbon” industrial services. The investments required for a large-scale deployment of renewables would include the supply of a large number of wind turbines, PV panels, geothermal units, and associated electronics and me-chanical equipment. It would make economic sense to develop at least some of these components in the region. Similarly, investments in the manufacture of electric ve-hicles, charging stations, electronics and other compo-nents for electric transport could be domestically based.
Further, at least some of the investments linked to the decarbonisation of the regional economy would go into tailoring the supply of components to fit the character-istics of the Latin American market. For example, elec-tric buses for BRTs, their charging stations and ancillary equipment are more likely to be deployed first in Latin America. In fact, the characteristics of the regional fleet, with its emphasis on multi-passenger vehicles, would constitute a demand for electric vehicles that is quite different from the current emphasis on passenger autos elsewhere.
These opportunities would also generate jobs, promote enterprise formation and stimulate knowledge crea-tion for the development of assets for decarbonisation. These developments could compensate for any short-term market disruptions caused by the sunset of the fossil-fuel industry in the region.
Table 5.2 – Potential for industrial energy savings.
Improvement potential (%)
Industrialized countries
Developing countries
High-value chemicals 15-25 25-30
Ammonia, methanol 10-15 15-30
Alumina production 30-40 40-55
Aluminium smelters 5-10 5
Cast non-ferrous and other non-ferrous
35-60
Iron and steel 10-15 25-35
Cast ferrous 25-40
Cement 20-25 20-30
Lime
10-40 20-50Glass
Ceramics
Pulp and paper 20-30 15-30
Food, beverages and tobacco
25-40 0.9
Other sectors 10-15 25-30
Total 10-20 30-35
Total (excl. feedstock)
15-20 30-35
Source: (Saygin et al., 2011)
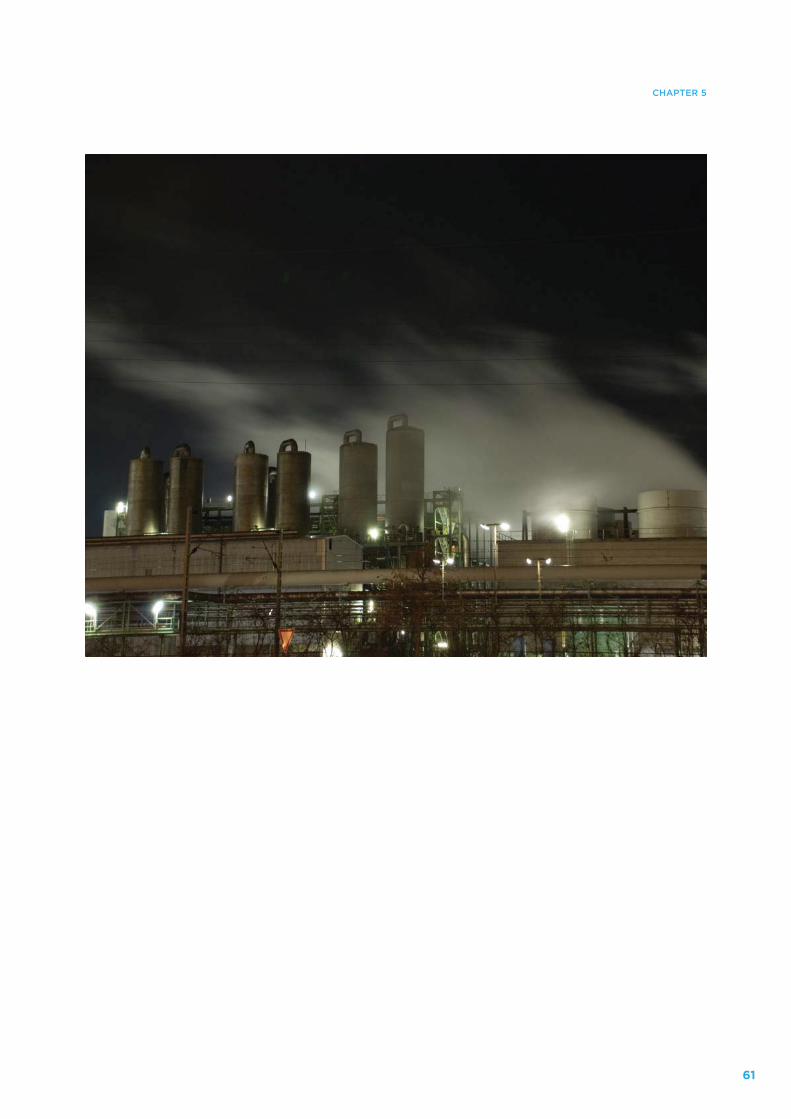
61
CHAPTER 5

62
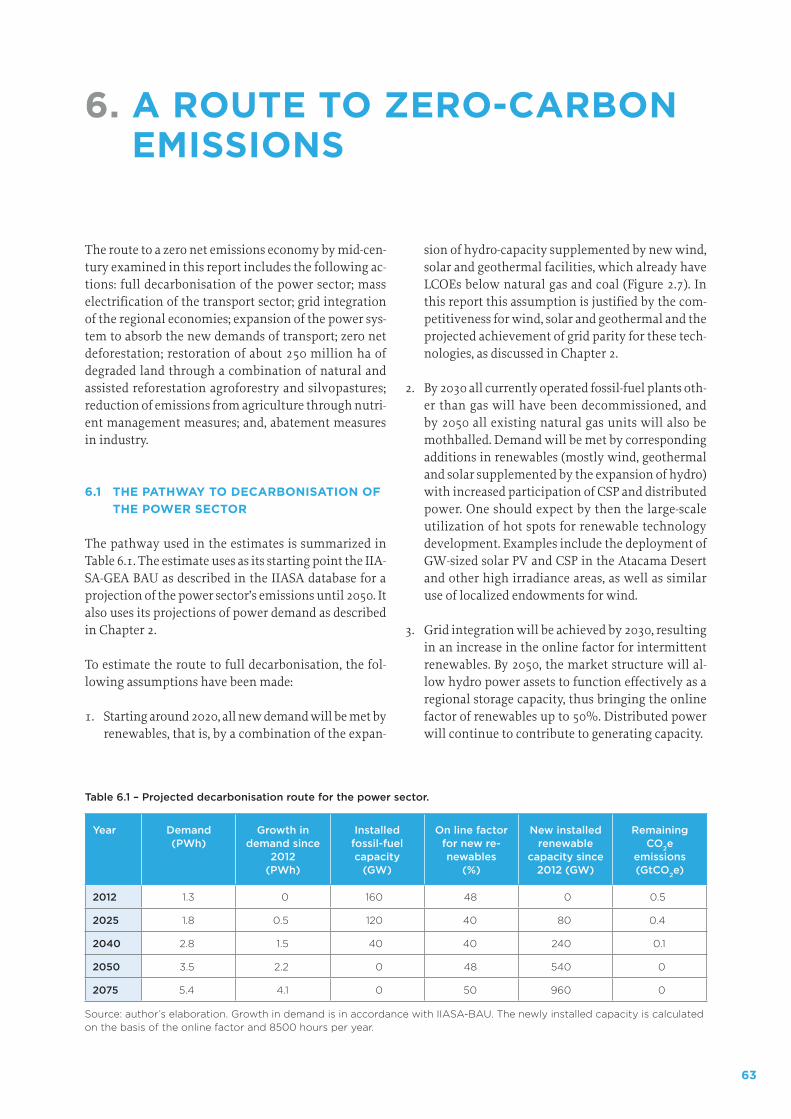
63
6. A ROUTE TO ZERO-CARBON EMISSIONS
The route to a zero net emissions economy by mid-cen-tury examined in this report includes the following ac-tions: full decarbonisation of the power sector; mass electrification of the transport sector; grid integration of the regional economies; expansion of the power sys-tem to absorb the new demands of transport; zero net deforestation; restoration of about 250 million ha of degraded land through a combination of natural and assisted reforestation agroforestry and silvopastures; reduction of emissions from agriculture through nutri-ent management measures; and, abatement measures in industry.
6.1 THE PATHWAY TO DECARBONISATION OF THE POWER SECTOR
The pathway used in the estimates is summarized in Table 6.1. The estimate uses as its starting point the IIA-SA-GEA BAU as described in the IIASA database for a projection of the power sector’s emissions until 2050. It also uses its projections of power demand as described in Chapter 2.
To estimate the route to full decarbonisation, the fol-lowing assumptions have been made:
1. Starting around 2020, all new demand will be met by renewables, that is, by a combination of the expan-
sion of hydro-capacity supplemented by new wind, solar and geothermal facilities, which already have LCOEs below natural gas and coal (Figure 2.7). In this report this assumption is justified by the com-petitiveness for wind, solar and geothermal and the projected achievement of grid parity for these tech-nologies, as discussed in Chapter 2.
2. By 2030 all currently operated fossil-fuel plants oth-er than gas will have been decommissioned, and by 2050 all existing natural gas units will also be mothballed. Demand will be met by corresponding additions in renewables (mostly wind, geothermal and solar supplemented by the expansion of hydro) with increased participation of CSP and distributed power. One should expect by then the large-scale utilization of hot spots for renewable technology development. Examples include the deployment of GW-sized solar PV and CSP in the Atacama Desert and other high irradiance areas, as well as similar use of localized endowments for wind.
3. Grid integration will be achieved by 2030, resulting in an increase in the online factor for intermittent renewables. By 2050, the market structure will al-low hydro power assets to function effectively as a regional storage capacity, thus bringing the online factor of renewables up to 50%. Distributed power will continue to contribute to generating capacity.
Table 6.1 – Projected decarbonisation route for the power sector.
Year Demand (PWh)
Growth in demand since
2012 (PWh)
Installed fossil-fuel capacity
(GW)
On line factor for new re-newables
(%)
New installed renewable
capacity since 2012 (GW)
Remaining CO2e
emissions (GtCO2e)
2012 1.3 0 160 48 0 0.5
2025 1.8 0.5 120 40 80 0.4
2040 2.8 1.5 40 40 240 0.1
2050 3.5 2.2 0 48 540 0
2075 5.4 4.1 0 50 960 0
Source: author’s elaboration. Growth in demand is in accordance with IIASA-BAU. The newly installed capacity is calculated on the basis of the online factor and 8500 hours per year.
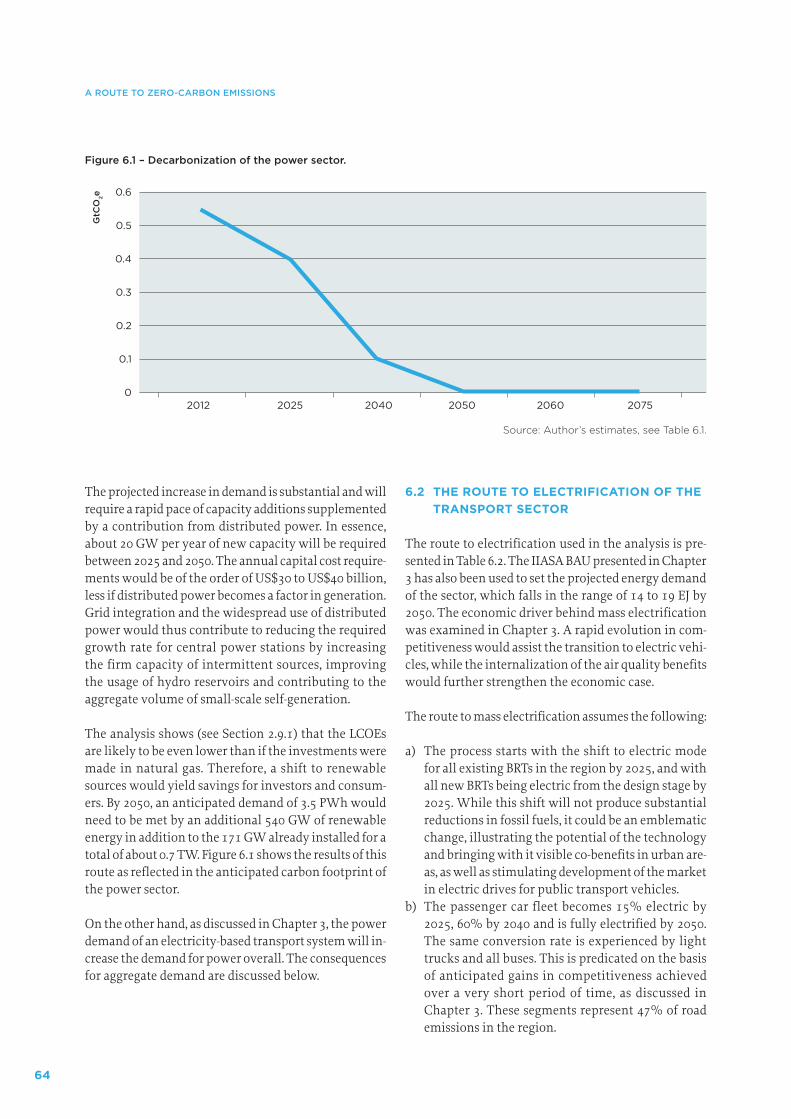
64
A ROUTE TO ZERO-CARBON EMISSIONS
The projected increase in demand is substantial and will require a rapid pace of capacity additions supplemented by a contribution from distributed power. In essence, about 20 GW per year of new capacity will be required between 2025 and 2050. The annual capital cost require-ments would be of the order of US$30 to US$40 billion, less if distributed power becomes a factor in generation. Grid integration and the widespread use of distributed power would thus contribute to reducing the required growth rate for central power stations by increasing the firm capacity of intermittent sources, improving the usage of hydro reservoirs and contributing to the aggregate volume of small-scale self-generation.
The analysis shows (see Section 2.9.1) that the LCOEs are likely to be even lower than if the investments were made in natural gas. Therefore, a shift to renewable sources would yield savings for investors and consum-ers. By 2050, an anticipated demand of 3.5 PWh would need to be met by an additional 540 GW of renewable energy in addition to the 171 GW already installed for a total of about 0.7 TW. Figure 6.1 shows the results of this route as reflected in the anticipated carbon footprint of the power sector.
On the other hand, as discussed in Chapter 3, the power demand of an electricity-based transport system will in-crease the demand for power overall. The consequences for aggregate demand are discussed below.
6.2 THE ROUTE TO ELECTRIFICATION OF THE TRANSPORT SECTOR
The route to electrification used in the analysis is pre-sented in Table 6.2. The IIASA BAU presented in Chapter 3 has also been used to set the projected energy demand of the sector, which falls in the range of 14 to 19 EJ by 2050. The economic driver behind mass electrification was examined in Chapter 3. A rapid evolution in com-petitiveness would assist the transition to electric vehi-cles, while the internalization of the air quality benefits would further strengthen the economic case.
The route to mass electrification assumes the following:
a) The process starts with the shift to electric mode for all existing BRTs in the region by 2025, and with all new BRTs being electric from the design stage by 2025. While this shift will not produce substantial reductions in fossil fuels, it could be an emblematic change, illustrating the potential of the technology and bringing with it visible co-benefits in urban are-as, as well as stimulating development of the market in electric drives for public transport vehicles.
b) The passenger car fleet becomes 15% electric by 2025, 60% by 2040 and is fully electrified by 2050. The same conversion rate is experienced by light trucks and all buses. This is predicated on the basis of anticipated gains in competitiveness achieved over a very short period of time, as discussed in Chapter 3. These segments represent 47% of road emissions in the region.
Figure 6.1 – Decarbonization of the power sector.
Source: Author’s estimates, see Table 6.1.
GtC
O2e
0
0.3
0.2
0.1
0.6
0.5
0.4
2012 2025 2040 2050 20752060
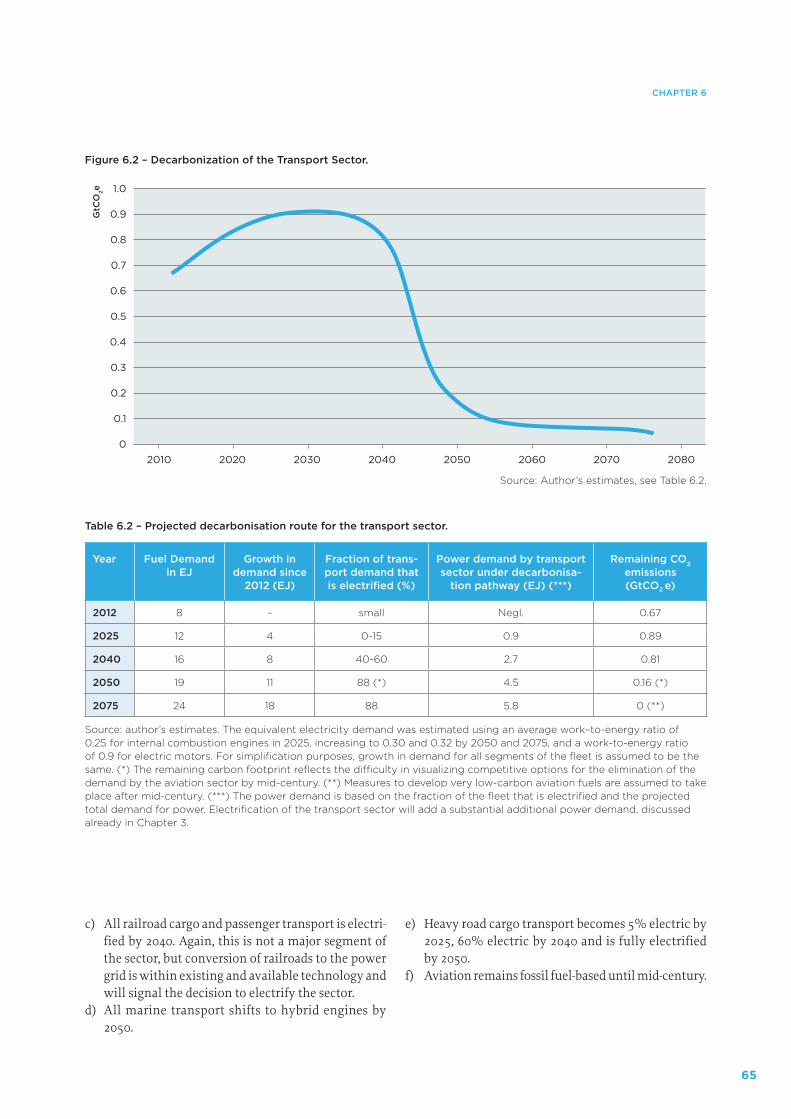
65
CHAPTER 6
c) All railroad cargo and passenger transport is electri-fied by 2040. Again, this is not a major segment of the sector, but conversion of railroads to the power grid is within existing and available technology and will signal the decision to electrify the sector.
d) All marine transport shifts to hybrid engines by 2050.
e) Heavy road cargo transport becomes 5% electric by 2025, 60% electric by 2040 and is fully electrified by 2050.
f) Aviation remains fossil fuel-based until mid-century.
Table 6.2 – Projected decarbonisation route for the transport sector.
Year Fuel Demand in EJ
Growth in demand since
2012 (EJ)
Fraction of trans-port demand that is electrified (%)
Power demand by transport sector under decarbonisa-
tion pathway (EJ) (***)
Remaining CO2 emissions (GtCO2 e)
2012 8 – small Negl. 0.67
2025 12 4 0-15 0.9 0.89
2040 16 8 40-60 2.7 0.81
2050 19 11 88 (*) 4.5 0.16 (*)
2075 24 18 88 5.8 0 (**)
Source: author’s estimates. The equivalent electricity demand was estimated using an average work–to-energy ratio of 0.25 for internal combustion engines in 2025, increasing to 0.30 and 0.32 by 2050 and 2075, and a work-to-energy ratio of 0.9 for electric motors. For simplification purposes, growth in demand for all segments of the fleet is assumed to be the same. (*) The remaining carbon footprint reflects the difficulty in visualizing competitive options for the elimination of the demand by the aviation sector by mid-century. (**) Measures to develop very low-carbon aviation fuels are assumed to take place after mid-century. (***) The power demand is based on the fraction of the fleet that is electrified and the projected total demand for power. Electrification of the transport sector will add a substantial additional power demand, discussed already in Chapter 3.
Figure 6.2 – Decarbonization of the Transport Sector.
Source: Author’s estimates, see Table 6.2.
GtC
O2e
0
0.3
0.2
0.1
0.6
0.7
0.8
0.9
1.0
0.5
0.4
2010 2020 2030 2040 2050 2070 20802060
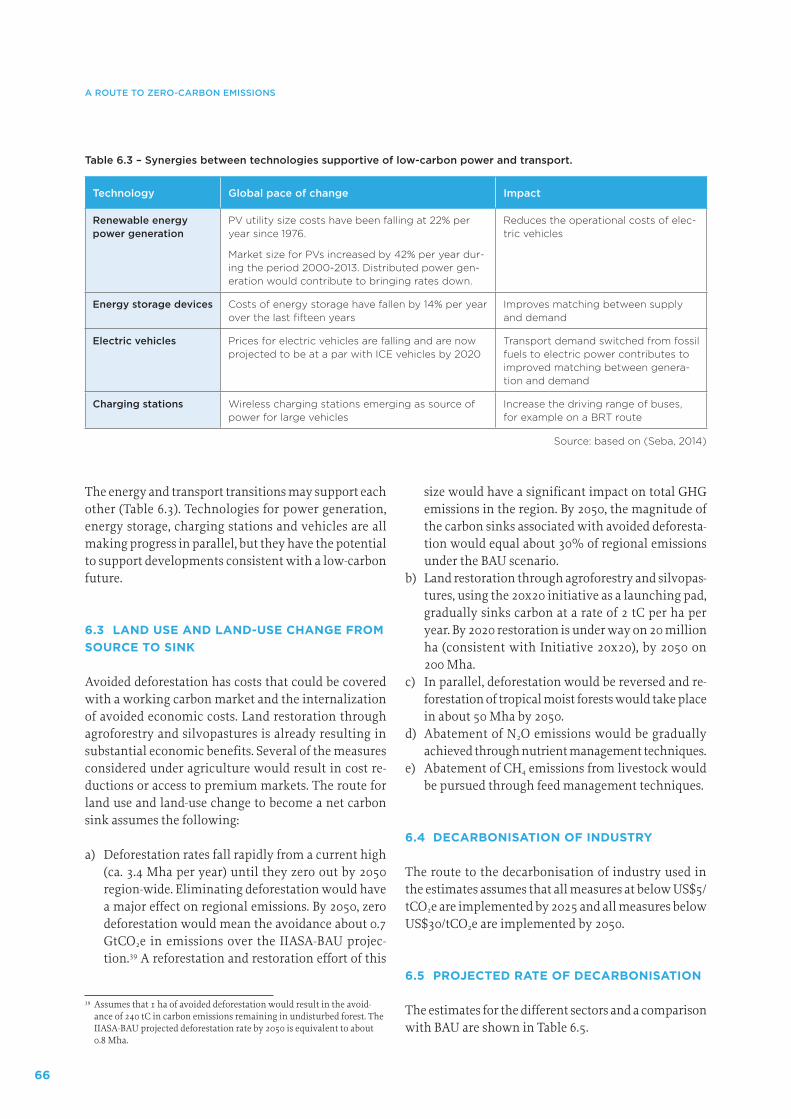
66
A ROUTE TO ZERO-CARBON EMISSIONS
The energy and transport transitions may support each other (Table 6.3). Technologies for power generation, energy storage, charging stations and vehicles are all making progress in parallel, but they have the potential to support developments consistent with a low-carbon future.
6.3 LAND USE AND LAND-USE CHANGE FROM SOURCE TO SINK
Avoided deforestation has costs that could be covered with a working carbon market and the internalization of avoided economic costs. Land restoration through agroforestry and silvopastures is already resulting in substantial economic benefits. Several of the measures considered under agriculture would result in cost re-ductions or access to premium markets. The route for land use and land-use change to become a net carbon sink assumes the following:
a) Deforestation rates fall rapidly from a current high (ca. 3.4 Mha per year) until they zero out by 2050 region-wide. Eliminating deforestation would have a major effect on regional emissions. By 2050, zero deforestation would mean the avoidance about 0.7 GtCO2e in emissions over the IIASA-BAU projec-tion.39 A reforestation and restoration effort of this
39 Assumes that 1 ha of avoided deforestation would result in the avoid-ance of 240 tC in carbon emissions remaining in undisturbed forest. The IIASA-BAU projected deforestation rate by 2050 is equivalent to about 0.8 Mha.
size would have a significant impact on total GHG emissions in the region. By 2050, the magnitude of the carbon sinks associated with avoided deforesta-tion would equal about 30% of regional emissions under the BAU scenario.
b) Land restoration through agroforestry and silvopas-tures, using the 20x20 initiative as a launching pad, gradually sinks carbon at a rate of 2 tC per ha per year. By 2020 restoration is under way on 20 million ha (consistent with Initiative 20x20), by 2050 on 200 Mha.
c) In parallel, deforestation would be reversed and re-forestation of tropical moist forests would take place in about 50 Mha by 2050.
d) Abatement of N2O emissions would be gradually achieved through nutrient management techniques.
e) Abatement of CH4 emissions from livestock would be pursued through feed management techniques.
6.4 DECARBONISATION OF INDUSTRY
The route to the decarbonisation of industry used in the estimates assumes that all measures at below US$5/tCO2e are implemented by 2025 and all measures below US$30/tCO2e are implemented by 2050.
6.5 PROJECTED RATE OF DECARBONISATION
The estimates for the different sectors and a comparison with BAU are shown in Table 6.5.
Table 6.3 – Synergies between technologies supportive of low-carbon power and transport.
Technology Global pace of change Impact
Renewable energy power generation
PV utility size costs have been falling at 22% per year since 1976.
Market size for PVs increased by 42% per year dur-ing the period 2000-2013. Distributed power gen-eration would contribute to bringing rates down.
Reduces the operational costs of elec-tric vehicles
Energy storage devices Costs of energy storage have fallen by 14% per year over the last fifteen years
Improves matching between supply and demand
Electric vehicles Prices for electric vehicles are falling and are now projected to be at a par with ICE vehicles by 2020
Transport demand switched from fossil fuels to electric power contributes to improved matching between genera-tion and demand
Charging stations Wireless charging stations emerging as source of power for large vehicles
Increase the driving range of buses, for example on a BRT route
Source: based on (Seba, 2014)
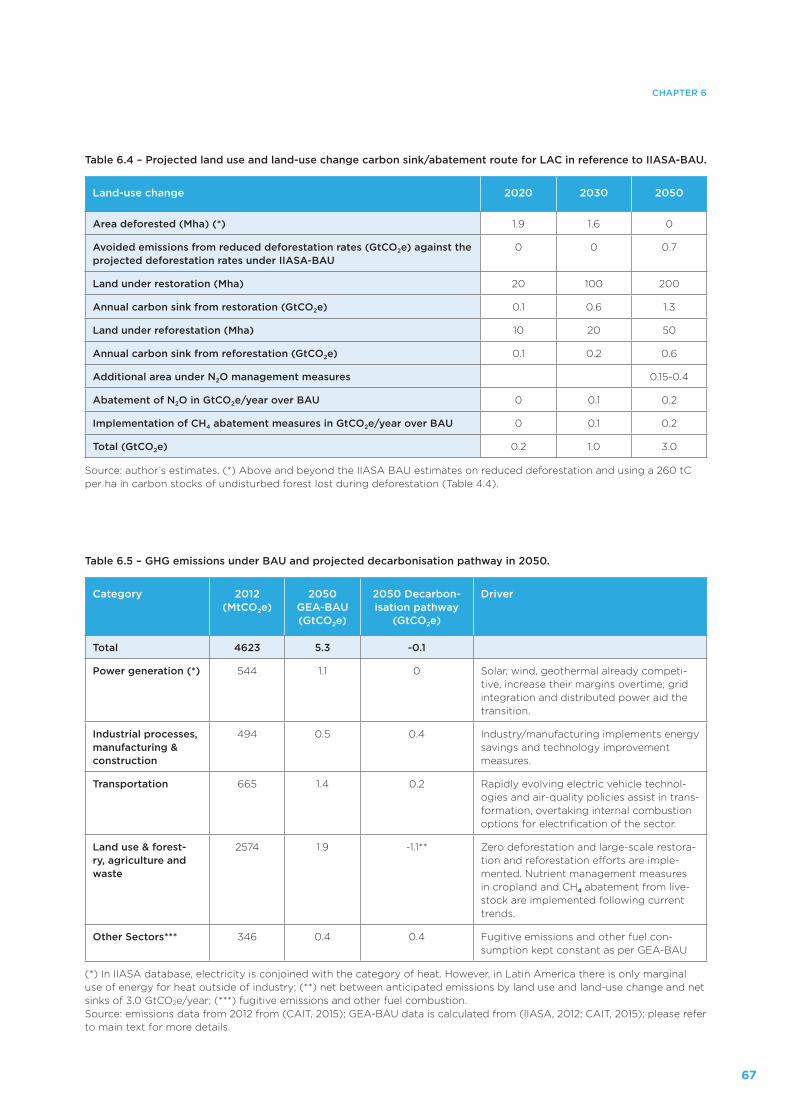
67
CHAPTER 6
Table 6.4 – Projected land use and land-use change carbon sink/abatement route for LAC in reference to IIASA-BAU.
Land-use change 2020 2030 2050
Area deforested (Mha) (*) 1.9 1.6 0
Avoided emissions from reduced deforestation rates (GtCO2e) against the projected deforestation rates under IIASA-BAU
0 0 0.7
Land under restoration (Mha) 20 100 200
Annual carbon sink from restoration (GtCO2e) 0.1 0.6 1.3
Land under reforestation (Mha) 10 20 50
Annual carbon sink from reforestation (GtCO2e) 0.1 0.2 0.6
Additional area under N2O management measures 0.15-0.4
Abatement of N2O in GtCO2e/year over BAU 0 0.1 0.2
Implementation of CH4 abatement measures in GtCO2e/year over BAU 0 0.1 0.2
Total (GtCO2e) 0.2 1.0 3.0
Source: author’s estimates. (*) Above and beyond the IIASA BAU estimates on reduced deforestation and using a 260 tC per ha in carbon stocks of undisturbed forest lost during deforestation (Table 4.4).
Table 6.5 – GHG emissions under BAU and projected decarbonisation pathway in 2050.
Category 2012 (MtCO2e)
2050 GEA-BAU (GtCO2e)
2050 Decarbon-isation pathway
(GtCO2e)
Driver
Total 4623 5.3 -0.1
Power generation (*) 544 1.1 0 Solar, wind, geothermal already competi-tive, increase their margins overtime; grid integration and distributed power aid the transition.
Industrial processes, manufacturing & construction
494 0.5 0.4 Industry/manufacturing implements energy savings and technology improvement measures.
Transportation 665 1.4 0.2 Rapidly evolving electric vehicle technol-ogies and air-quality policies assist in trans-formation, overtaking internal combustion options for electrification of the sector.
Land use & forest-ry, agriculture and waste
2574 1.9 -1.1** Zero deforestation and large-scale restora-tion and reforestation efforts are imple-mented. Nutrient management measures in cropland and CH4 abatement from live-stock are implemented following current trends.
Other Sectors*** 346 0.4 0.4 Fugitive emissions and other fuel con-sumption kept constant as per GEA-BAU
(*) In IIASA database, electricity is conjoined with the category of heat. However, in Latin America there is only marginal use of energy for heat outside of industry; (**) net between anticipated emissions by land use and land-use change and net sinks of 3.0 GtCO2e/year; (***) fugitive emissions and other fuel combustion.Source: emissions data from 2012 from (CAIT, 2015); GEA-BAU data is calculated from (IIASA, 2012; CAIT, 2015); please refer to main text for more details.

68
69
7. CONCLUSIONS
There is significant potential for reforestation in the re-gion, and while there are a growing number of success-ful experiences, the fiscal and financial incentives are not at the level required to expand reforestation efforts substantially. Agroforestry and silvopastures as alter-natives to land restoration have great potential for fur-ther expansion. These landscape approaches, when well managed, are expected to provide attractive financial returns on average. The incorporation of well-known nutrient management options and methane abatement measures in animal husbandry will also support emis-sions reductions by agriculture. A pathway analysis for emissions reductions by industry concludes that deployment of the best available technologies would result in a reduction of emissions in the sector.
The measures reviewed (Table 7.1) have the potential to drive LAC toward a zero carbon economy, largely on the basis of sound economic principles and with substantial co-benefits, albeit not all easy to monetize. However, achieving this goal will depend on the ability to navi-gate and address the substantial barriers built up over time by business-as-usual behaviours and policies. Still, from all perspectives, the region is in pole position to complete this journey.
The report concludes that the current economic and technological context, as well as the emerging policy environment, are already conducive to major reduc-tions in the carbon footprint of the LAC region. The report also concludes that foreseeable technological developments and anticipated improvements in cost competitiveness will further support abatement meas-ures in power, transport, land use and industry.
While policy frameworks and policy-making are found to be more supportive of this evolution than in the past, additional steps such as the elimination of subsidies for fossil fuels; the political will to achieve grid integration; and, clear rules for distributed power are required to facilitate the rapid transition of the power sector. For transport, substantial barriers remain, including the pervasive use of fossil-fuel subsidies; the lack of inter-nalization of the avoided costs of air pollution caused by the use of electric vehicles; policies to allocate public space to public transport systems; and, the need for sun-set provisions to ease the reduction and eventual elim-ination of the refining and distribution of fossil fuels.
Recent gains in reducing deforestation illustrate the potential to change the dynamics of land-use change. Achieving zero net deforestation will have an imme-diate effect on carbon emissions. There are, however, substantial barriers to securing these sinks. Deforesta-tion continues unimpeded in many parts of the region, where poverty and the inability to internalize the value of forests have not changed.
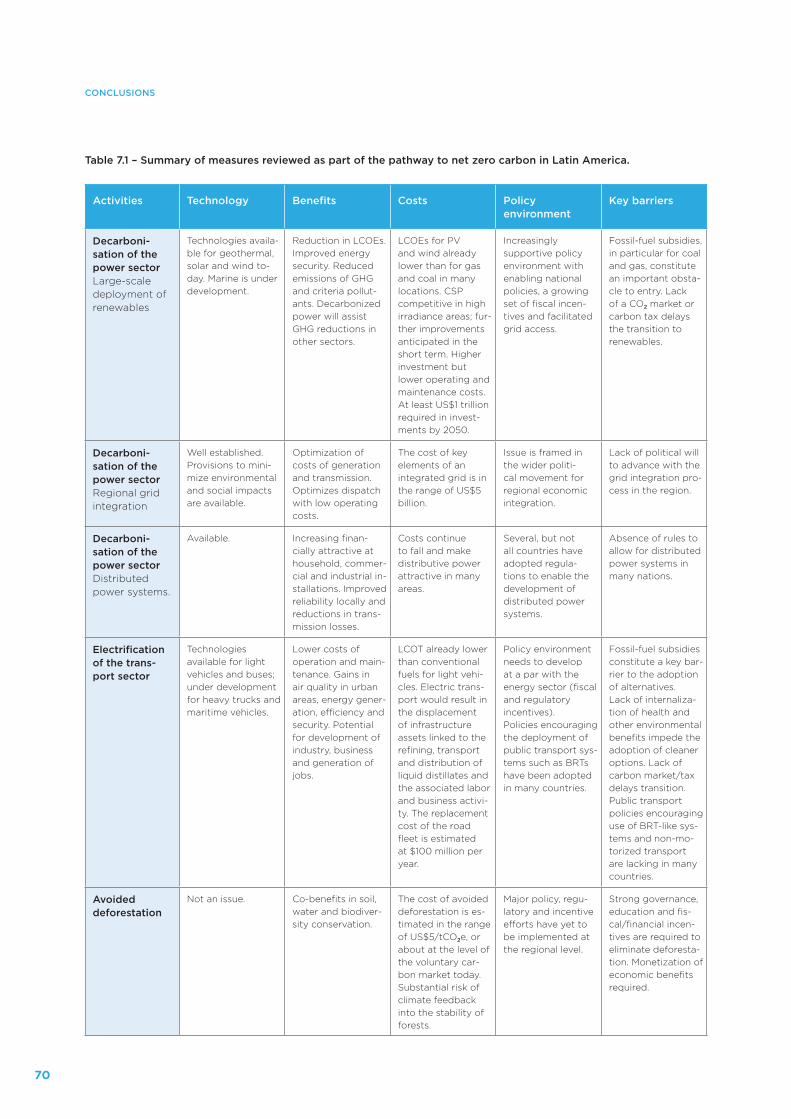
70
CONCLUSIONS
Activities Technology Benefits Costs Policy environment
Key barriers
Decarboni-sation of the power sectorLarge-scale deployment of renewables
Technologies availa-ble for geothermal, solar and wind to-day. Marine is under development.
Reduction in LCOEs. Improved energy security. Reduced emissions of GHG and criteria pollut-ants. Decarbonized power will assist GHG reductions in other sectors.
LCOEs for PV and wind already lower than for gas and coal in many locations. CSP competitive in high irradiance areas; fur-ther improvements anticipated in the short term. Higher investment but lower operating and maintenance costs. At least US$1 trillion required in invest-ments by 2050.
Increasingly supportive policy environment with enabling national policies, a growing set of fiscal incen-tives and facilitated grid access.
Fossil-fuel subsidies, in particular for coal and gas, constitute an important obsta-cle to entry. Lack of a CO2 market or carbon tax delays the transition to renewables.
Decarboni-sation of the power sectorRegional grid integration
Well established. Provisions to mini-mize environmental and social impacts are available.
Optimization of costs of generation and transmission. Optimizes dispatch with low operating costs.
The cost of key elements of an integrated grid is in the range of US$5 billion.
Issue is framed in the wider politi-cal movement for regional economic integration.
Lack of political will to advance with the grid integration pro-cess in the region.
Decarboni-sation of the power sectorDistributed power systems.
Available. Increasing finan-cially attractive at household, commer-cial and industrial in-stallations. Improved reliability locally and reductions in trans-mission losses.
Costs continue to fall and make distributive power attractive in many areas.
Several, but not all countries have adopted regula-tions to enable the development of distributed power systems.
Absence of rules to allow for distributed power systems in many nations.
Electrification of the trans-port sector
Technologies available for light vehicles and buses; under development for heavy trucks and maritime vehicles.
Lower costs of operation and main-tenance. Gains in air quality in urban areas, energy gener-ation, efficiency and security. Potential for development of industry, business and generation of jobs.
LCOT already lower than conventional fuels for light vehi-cles. Electric trans-port would result in the displacement of infrastructure assets linked to the refining, transport and distribution of liquid distillates and the associated labor and business activi-ty. The replacement cost of the road fleet is estimated at $100 million per year.
Policy environment needs to develop at a par with the energy sector (fiscal and regulatory incentives).Policies encouraging the deployment of public transport sys-tems such as BRTs have been adopted in many countries.
Fossil-fuel subsidies constitute a key bar-rier to the adoption of alternatives. Lack of internaliza-tion of health and other environmental benefits impede the adoption of cleaner options. Lack of carbon market/tax delays transition. Public transport policies encouraging use of BRT-like sys-tems and non-mo-torized transport are lacking in many countries.
Avoided deforestation
Not an issue. Co-benefits in soil, water and biodiver-sity conservation.
The cost of avoided deforestation is es-timated in the range of US$5/tCO2e, or about at the level of the voluntary car-bon market today. Substantial risk of climate feedback into the stability of forests.
Major policy, regu-latory and incentive efforts have yet to be implemented at the regional level.
Strong governance, education and fis-cal/financial incen-tives are required to eliminate deforesta-tion. Monetization of economic benefits required.
Table 7.1 – Summary of measures reviewed as part of the pathway to net zero carbon in Latin America.
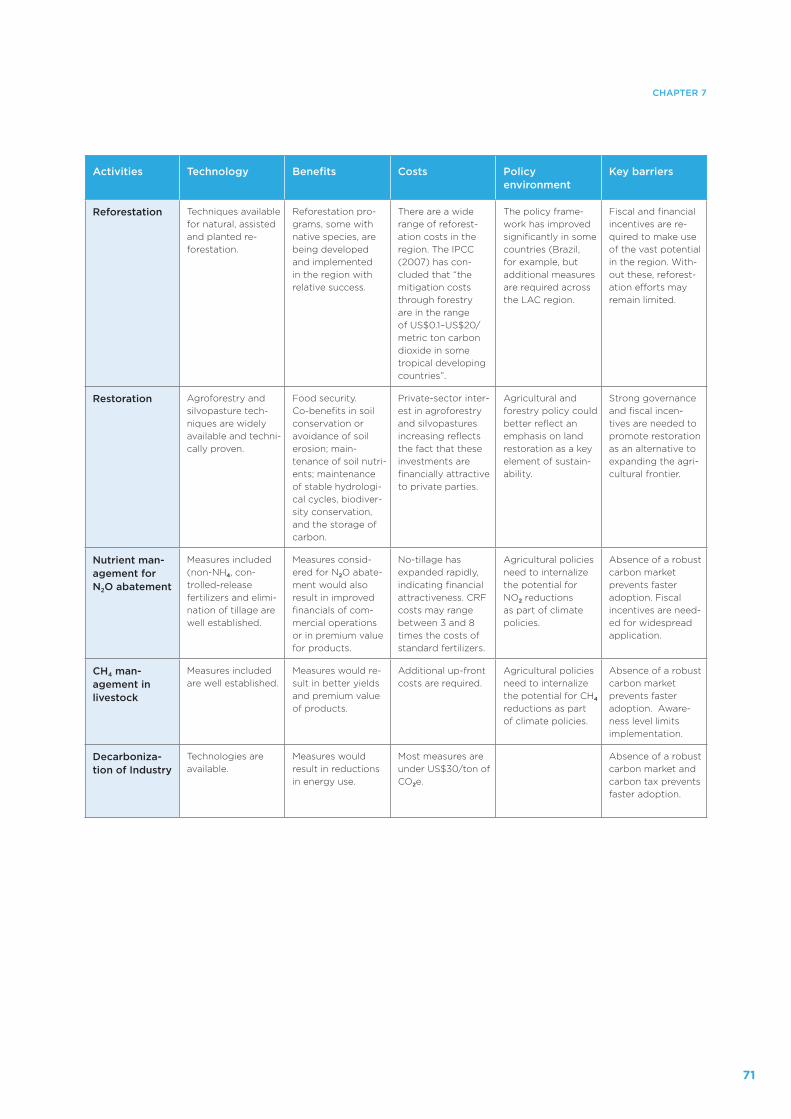
71
CHAPTER 7
Activities Technology Benefits Costs Policy environment
Key barriers
Reforestation Techniques available for natural, assisted and planted re-forestation.
Reforestation pro-grams, some with native species, are being developed and implemented in the region with relative success.
There are a wide range of reforest-ation costs in the region. The IPCC (2007) has con-cluded that “the mitigation costs through forestry are in the range of US$0.1–US$20/ metric ton carbon dioxide in some tropical developing countries”.
The policy frame-work has improved significantly in some countries (Brazil, for example, but additional measures are required across the LAC region.
Fiscal and financial incentives are re-quired to make use of the vast potential in the region. With-out these, reforest-ation efforts may remain limited.
Restoration Agroforestry and silvopasture tech-niques are widely available and techni-cally proven.
Food security. Co-benefits in soil conservation or avoidance of soil erosion; main-tenance of soil nutri-ents; maintenance of stable hydrologi-cal cycles, biodiver-sity conservation, and the storage of carbon.
Private-sector inter-est in agroforestry and silvopastures increasing reflects the fact that these investments are financially attractive to private parties.
Agricultural and forestry policy could better reflect an emphasis on land restoration as a key element of sustain-ability.
Strong governance and fiscal incen-tives are needed to promote restoration as an alternative to expanding the agri-cultural frontier.
Nutrient man-agement for N2O abatement
Measures included (non-NH4, con-trolled-release fertilizers and elimi-nation of tillage are well established.
Measures consid-ered for N2O abate-ment would also result in improved financials of com-mercial operations or in premium value for products.
No-tillage has expanded rapidly, indicating financial attractiveness. CRF costs may range between 3 and 8 times the costs of standard fertilizers.
Agricultural policies need to internalize the potential for NO2 reductions as part of climate policies.
Absence of a robust carbon market prevents faster adoption. Fiscal incentives are need-ed for widespread application.
CH4 man-agement in livestock
Measures included are well established.
Measures would re-sult in better yields and premium value of products.
Additional up-front costs are required.
Agricultural policies need to internalize the potential for CH4 reductions as part of climate policies.
Absence of a robust carbon market prevents faster adoption. Aware-ness level limits implementation.
Decarboniza-tion of Industry
Technologies are available.
Measures would result in reductions in energy use.
Most measures are under US$30/ton of CO2e.
Absence of a robust carbon market and carbon tax prevents faster adoption.
72
REFERENCESdel ganado bovino’. Available from: http://www.estrucplan.com.ar/Producciones/entrega.asp?IDEn-trega=3073 [Accessed 04 November 2015].
BID (2015): ‘Observatorio Regional de Transporte de
Carga y Logistica del BID’. Available from: http://www.iadb.org/es/proyectos/project-informa-tion-page,1303.html?id=RG-T1897 [Accessed 04 November 2015].
Birch, J.; Newton, A.;Alvarez, C.; Cantarello, E.; Echev-erría, C.; Kirtzberger, E.; Schiappacasse, I.; Tejedor, N.; and Polasky, S. (2010): ‘Proceedings of the National
Academy of Sciences of the United States of America’, Vol. 107, No. 50 (December 14, 2010), pp. 21925-21930
Blaser, J. & Robledo, C. (2007): ‘Initial Analysis of the
Mitigation Potential in the Forestry Sector’. Berne. Available from: https://unfccc.int/files/coopera-tion_and_support/financial_mechanism/applica-tion/pdf/blaser.pdf [Accessed 04 November 2015].
Bloomberg (2011): ‘Solar, Energy Smart Technologies:
Research Note’. Available from: http://sun-connect-news.org/fileadmin/DATEIEN/Dateien/New/PV_and_Batteries_as_Alternative_to_Off-Grid_Diesel_Markets_-_Bloomberg_New_Energy_Dec_2011.pdf [Accessed 04 November 2015].
Bogotá (2013): ’Cámara de Comerico de Bogotá’. Available from: http://www.ccb.org.co/Investiga-ciones-Bogota-y-Region/Desarrollo-Urbano-y-Mo-vilidad/Movilidad/Transporte-publico-y-privado [Accessed 04 November 2015].
Brander, M., Sood, A., Wylie, C., Haughton, A. & Lovell, J. (2011): ‘Electricity-specific emission factors
for grid electricity’. Available from: http://ecomet-rica.com/assets//Electricity-specific-emission-fac-tors-for-grid-electricity.pdf [Accessed 04 November 2015].
BRTdata (2015): ‘Global BRT Data’. Available from: www.BRTdata.org [Accessed 04 November 2015].
CAF (2011): ‘Desarrollo Urbano y Movilidad en America
Latina’. Available from: http://omu.caf.com/me-dia/30839/desarrollourbano_y_movilidad_ameri-calatina.pdf [Accessed 04 November 2015].
CAF (2010): ‘Observatorio de Movilidad Urbana para
América Latina’. Available from: http://www.caf.com/es/temas/o/observatorio-de-movilidad-urbana/ [Accessed 04 November 2015].
CAF (2012): ‘Nuevas Oportunidades de Interconexión Eléc-
trica en América Latina’. Colombia. Available from: http://publicaciones.caf.com/media/18406/opor-tunidades-interconexion-electrica-america-latina.pdf [Accessed 04 November 2015].
AAFC (2012): ‘Reducing methane emissions from live-
stock’. Alberta. Available from: http://www.agr.gc.ca/eng/science-and-innovation/science-pub-lications-and-resources/technical-factsheets/reducing-methane-emissions-from-live-stock/?id=1305058576718 [Accessed 04 November 2015].
Alegre, J., Arévalo, L., Ricse, A., Barbaran, J. & Palm, C. (2001): ’Reservas de Carbono y emisión de gases con
diferentes sistemas de uso de la tierra en dos sitios de la
amazonía peruana’. Tibaitatá, Colombia.ANTF (2011): ‘Rail Freight Transportation in Brazil:
Post-concessions advances and investments’. Sao Paulo, Brazil. Available from: http://www.antf.org.br/pdfs/palestra-vilaca-2011antf1205---sao-paulo---rail-and-metro---latin-america-2011---ingles.pdf [Accessed 04 November 2015].
Bair, L.S. & Alig, R.J. (2007): ‘Regional Cost Information
for Private Timberland: Conversion and Management’. DIANE Publishing.
Banerjee, R., Cong, Y., Gielen, D., Jannuzzi, G., Maréchal, F., McKane, A.T., Rosen, M.A., Es, D. van & Worrell, E. (2012): ‘Chapter 8 – Energy End Use: Industry. In: Global Energy Assessment: Toward a
Sustainable Future’. Cambridge, UK and New York, NY, USA: Cambridge University Press. Available from: http://www.iiasa.ac.at/web/home/research/Flagship-Projects/Global-Energy-Assessment/GEA_Chapter8_industry_hires.pdf [Accessed 04 November 2015].
Barbero, J.A. (2014): ‘Transporte y energía: los desafíos
del desarrollo sostenible’. Available from: http://www.uncu.edu.ar/centroasuntosglobales/upload/barbe-ro-jose-transporte-y-energia-uncuyo-ceag-seminar-io-11-4-14.pdf [Accessed 04 November 2015].
Di Bella, G., Norton, L., Ntamatungiro, J., Ogawa, S., Samake, I. & Santoro, M. (2015): ‘Energy Subsidies in
Latin America and the Caribbean: Stocktaking and Poli-
cy Challenges’. Available from: https://www.imf.org/external/pubs/ft/wp/2015/wp1530.pdf [Accessed 04 November 2015].
BenDor, T., Lester, T.W., Livengood, A., Davis, A. & Yonavjak, L. (2015): ‘Estimating the size and impact of
the ecological restoration economy’. PloS one. 10 (6). pp. e0128339.
Berlin (2013): ‘Berlin traffic data’. Available from: http://www.stadtentwicklung.berlin.de/verkehr/politik_planung/zahlen_fakten/download/Mobili-ty_en_Chap-1-2.pdf [Accessed 04 November 2015].
Berra, G., Finster, L., Castuma, E. & Maldonado, V. (2013): ‘Reducción de emisiones de metano provenientes
73
REFERENCES
CAIT (2015): ‘Climate Analysis Indicators Tool: WRI’s
Climate Data Explorer’. Washington, DC. Available from: http://cait.wri.org/ [Accessed 04 November 2015].
Callo-Concha, D., Krishnamurthy, L. & Alegre, J. (2002): ‘Secuestro de carbono por sistemas agrofore-
stales amazónicos’. México. Available from: http://www.redalyc.org/pdf/629/62980202.pdf [Accessed 04 November 2015].
Del Campo, S. (2012): ‘Estrategia Nacional de Energía 2012–2030’. Ministerio de Energía, Gobierno de Chile.
Available from: http://www.minenergia.cl/estrate-gia-nacional-de-energia-2012.html [Accessed 04 November 2015].
CEPROEC (2015): ‘Estimación del consumo de combus-
tibles en el transporte terrestre en Ecuador’. Quito, Ecuador. Available from: http://ceproec.iaen.edu.ec/download/wps(2)/2015_05.pdf [Accessed 04 November 2015].
CleanTechnica (2015): ‘US & Brazil Pledge Jointly To
Raise Renewable Energy To 20% By 2030’. Available from: http://cleantechnica.com/2015/07/01/us-bra-zil-pledge-jointly-raise-renewable-energy-20-2030/ [Accessed 04 November 2015].
Copenhagen (2013): ‘Copenhagen: Preferred Transit
Mode’. Available from: http://ddotdish.com/page/4/ [Accessed 04 November 2015].
Curitiba (2011): ‘Curitiba, Brazil: a model of transit
oriented planning’. Available from: http://www.ecomobility.org/fileadmin/template/project_tem-plates/ecomobility/files/Publications/Case_stories_EcoMobility_Curitiba_PDF_print.pdf [Accessed 04 November 2015].
Deloitte (2015): ‘Latin America Economic Outlook’. Available from: http://www2.deloitte.com/content/dam/Deloitte/global/Documents/About-Deloitte/gx-gbc-latin-america-economic-outlook-july-2015.pdf [Accessed 04 November 2015].
Derpsch, R., Friedrich, T., Kassam, A. & Hongwen, L. (2010): ‘Current status of adoption of no-till farming
in the world and some of its main benefits’. Available from: https://ijabe.org/index.php/ijabe/article/view/223 [Accessed 04 November 2015].
Deutsche Bank (2015): ‘Deutsche Bank report: solar
grid parity in a low oil price era’. Frankfurt am Main. Available from: https://www.db.com/cr/en/con-crete-deutsche-bank-report-solar-grid-parity-in-a-low-oil-price-era.htm [Accessed 04 November 2015].
DNV (2010): ‘Pathways to low carbon shipping: abate-
ment potential towards 2030’. Høvik, Norway. Avail-able from: http://cleantech.cnss.no/wp-content/
uploads/2011/05/2010-DNV-Pathways-to-low-car-bon-shipping-Abatement-potential-towards-2030.pdf [Accessed 04 November 2015].
Dowbenko, R.E. (2003): ‘New Fertility Product – ESN:
Controlled-Release Nitrogen for Enhanced Nitrogen
Efficiency and Improved Environmental Safety’. Avail-able from: http://www.umanitoba.ca/faculties/afs/MAC_proceedings/proceedings/2006/dowbenko_new_fertility_product.pdf [Accessed 04 November 2015].
Dutzik, T. & Baxandall, P. (2013): ‘A New Direction: Our
Changing Relationship with Driving and the Implica-
tions for America’s Future’. Available from: http://uspirg.org/reports/usp/new-direction [Accessed 04 November 2015].
Ebinger, J. & Vergara, W. (2011): ‘Climate impacts on
energy systems: key issues for energy sector adaptation’. Washington, DC. Available from: http://documents.worldbank.org/curated/en/2011/01/13888226/climate-impacts-energy-systems-key-issues-ener-gy-sector-adaptation [Accessed 04 November 2015].
Ecofys (2009): ‘Role and Potential of Renewable Energy
and Energy Efficiency for Global Energy Supply’. Des-sau-Roßlau, Germany. Available from: http://www.ecofys.com/files/files/report_role_potential_re-newable_energy_efficiency_global_energy_supply.pdf [Accessed 04 November 2015].
Ecofys (2015): ‘G7+EU INDCs: some improvement, but a
large emissions gap remains – Climate Action Tracker
policy brief ’. Available from: http://www.ecofys.com/en/publications/g7eu-indcs-some-improve-ment-but-a-large-emissions-gap-remains/ [Accessed 04 November 2015].
EFE (2015): ‘Chile sets 70 pct. non-conventional renewable
energy target for 2050’. Santiago, Chile. Available from: http://www.efe.com/efe/english/business/chile-sets-70-pct-non-conventional-renewable-ener-gy-target-for-2050/50000265-2726425 [Accessed 04 November 2015].
EIA (2015): ‘International Energy Statistics’. Washington, D.C. Available from: http://www.eia.gov/cfapps/ipdbproject/IEDIndex3.cfm?tid=2&pid=2&aid=12 [Accessed 04 November 2015].
Enerdata (2015): ‘Research on energy efficiency, CO2 emis-
sions, energy consumption, forecast’. Available from: http://www.enerdata.net/ [Accessed 04 November 2015].
Enkvist, P.-A., Nauclér, T. & Rosander, J. (2007): ‘A cost
curve for greenhouse gas reduction’. Available from: http://www.mckinsey.com/insights/sustainabili-
74
REFERENCES
ty/a_cost_curve_for_greenhouse_gas_reduction [Accessed 04 November 2015].
EPA (2015): ‘Emissions Factors & AP 42, Compilation of
Air Pollutant Emission Factors’. Available from: http://www3.epa.gov/ttnchie1/ap42/ [Accessed 04 Novem-ber 2015].
F. Sedano (2015): ‘Latin America Manufacturing Out-
look July 2015’. Available from: https://www.mapi.net/RESEARCH/PUBLICATIONS/LATIN-AMER-ICA-MANUFACTURING-OUTLOOK-JULY-2015 [Accessed 04 November 2015].
Falcocchio, J.C. & Levinson, H.S. (2015): ‘The Costs
and Other Consequences of Traffic Congestion’. pp. 159–182. Available from: http://link.springer.com/10.1007/978-3-319-15165-6_13 [Accessed 04 November 2015].
FAO (2014): ‘Agriculture’s greenhouse gas emissions on the
rise’. Rome, Italy. Available from: http://www.fao.org/news/story/en/item/216137/icode/ [Accessed 04 November 2015].
FAOSTAT (2015): ‘Food and Agriculture Organization of
the United Nations’. Database. Available from: http://faostat3.fao.org/download/G1/GT/E [Accessed 04 November 2015].
Farrell, A.E., Plevin, R.J., Turner, B.T., Jones, A., O’Hare, M. & Kammen, D.M. (2006): ‘Ethanol Can Con-tribute to Energy and Environmental Goals’. Science. 311 (5760). pp. 506–508. Available from: http://www.sciencemag.org/cgi/doi/10.1126/sci-ence.1121416 [Accessed 04 November 2015].
Fearnside, P.M., Barbosa, R.I. & de Alencastro Graça, P.M.L. (2007): ‘Burning of secondary forest in Am-azonia: biomass, burning efficiency and charcoal formation during land preparation for agricul-ture in Apiaú, Roraima, Brazil’. Forest Ecology and
Management. 242 (2-3). pp. 678–687. Available from: http://linkinghub.elsevier.com/retrieve/pii/S0378112707001260 [Accessed 04 November 2015].
Feldman, D., Barbose, G., Margolis, R., James, T., Weav-er, S., Darghouth, N., Fu, R., Davidson, C., Booth, S. & Ryan, W. (2014): ‘Photovoltaic System Pricing Trends
Historical, Recent, and Near-Term Projections 2014
Edition’. Available from: http://www.nrel.gov/docs/fy14osti/62558.pdf [Accessed 04 November 2015].
Fenhann, J. (2015): ‘Greenhouse Gas Abatement Cost
MOdel GACMO’. Copenhagen, Denmark. Available from: http://www.cdmpipeline.org/ [Accessed 04 November 2015].
Ferreira, F.H.G., Messina, J., Rigolini, J., López-Cal-va, L.-F., Lugo, M.A. & Vakis, R. (2012): ‘Economic
Mobility and the Rise of the Latin American Middle
Class’. Washington D.C.: The World Bank. Avail-able from: http://elibrary.worldbank.org/doi/book/10.1596/978-0-8213-9634-6 [Accessed 04 November 2015].
Franck, N.T. (2015): ‘Flexibility from an Institutional
Viewpoint, DK experiences’. Available from: www.energinet.dk [Accessed 04 November 2015].
FS UNEP Centre (2015): ‘Global Trends in Renewable
Energy Investment 2015’. Available from: http://fs-unep-centre.org/publications/global-trends-re-newable-energy-investment-2015 [Accessed 04 November 2015].
Fueleconomy (2015): ‘Plug-in Hybrid Electric Vehicles’. Available from: https://www.fueleconomy.gov/feg/label/learn-more-PHEV-label.shtml [Accessed 04 November 2015].
Fujisaka, S., Castilla, C., Escobar, G., Rodrigues, V., Veneklaas, E.., Thomas, R. & Fisher, M. (1998): ‘The effects of forest conversion on annual crops and pastures: Agriculture, Ecosystems & Environment’. 69 (1). pp. 17–26. Available from: http://linkinghub.elsevier.com/retrieve/pii/S0167880998000917 [Ac-cessed 04 November 2015].
Garibay, S. V. & Ugas, R. (2009): ‘Organic Farming in Latin America and the Caribbean’. In: The World of
Organic Agriculture: Statistics and Emerging Trends
2009. Frick, Bonn and Geneva: FiBL, IFOAM and ITC, pp. 176–185. Available from: http://orgprints.org/17931/ [Accessed 04 November 2015].
Gélvez, J.A.G. & Obando, C. (2014): ‘La motorización,
el número de viajes y la distribución modal en Bogotá:
pasado y posible futuro’. Available from: http://www.scielo.org.co/pdf/ring/n40/n40a02.pdf [Accessed 04 November 2015].
GENI (2011): ‘Renewable Energy Potential of Chile’, Global Energy Network Institute. Available from: http://www.geni.org/globalenergy/research/renew-able-energy-potential-of-chile/Chile 2020 Report II PBM final.pdf [Accessed 04 November 2015].
GFW (2015): ‘Global Forest Watch’. Available from: http://www.globalforestwatch.org/ [Accessed 04 November 2015].
Gibbs, H.K., Munger, J., L’Roe, J., Barreto, P., Pereira, R., Christie, M., Amaral, T. & Walker, N.F. (2015): ‘Did Ranchers and Slaughterhouses Respond to ZeroÐDeforestation Agreements in the Brazilian Ama-zon?’ Conservation Letters.
Gorham, R. (2002): ‘Air pollution from ground transpor-
tation: an assessment of causes, strategies and tactics,
and proposed actions for the international community’. Tournesol Conseils.
75
REFERENCES
GOV.UK (2015): ‘Industrial Decarbonisation and Energy
Efficiency Roadmaps to 2050’. Available from: https://www.gov.uk/government/publications/industri-al-decarbonisation-and-energy-efficiency-road-maps-to-2050 [Accessed 04 November 2015].
GOV.UK (2012): ‘Marine Energy Development: Taking
Steps for Developing the Chilean Resource’. Available from: https://www.gov.uk/government/uploads/system/uploads/attachment_data/file/207868/Ma-rine_Energy_Report_-_ENGLISH.pdf [Accessed 04 November 2015].
Grieg-Gran, M. (2008): ‘The Cost of Avoiding Deforesta-
tion’. London. Available from: http://pubs.iied.org/pdfs/G02489.pdf [Accessed 04 November 2015].
Guerrero, P. & Abad, J. (2013): ‘Assessment of Port Perfor-
mance and Port Connectivity Study in Belize, Central
America and the Dominican Republic’. Available from: http://idbdocs.iadb.org/wsdocs/getdocument.aspx?-docnum=37578169 [Accessed 04 November 2015].
Guzmán, W. & Arévalo, L. (2003): ‘Servicios ambientales
de almacenamiento de carbono como activo para el
desarrollo en la Amazonía Peruana: avances y retos’. Pucallpa, Universidad Nacional de Ucayali.
Hansen, M. C., P. V. Potapov, R. Moore, M. Hanch-er, S. A. Turubanova, A. Tyukavina, D. Thau, S. V. Stehman, S. J. Goetz, T. R. Loveland, A. Kom-mareddy, A. Egorov, L. Chini, C. O. Justice, and J. R. G. Townshend (2013): ‘Hansen/UMD/Google/
USGS/NASA Tree Cover Loss and Gain Area’. Uni-versity of Maryland, Google, USGS, and NASA. Accessed through Global Forest Watch. Available from: http://earthenginepartners.appspot.com/science-2013-global-forest [Accessed 04 November 2015].
Hecht, S.B. (2014): ‘The Natures of Progress: Land Use Dy-
namics and Forest Trends in Latin America and the Car-
ibbean’. Available from: http://www.iadb.org/wms-files/products/publications/documents/36735843.pdf [Accessed 04 November 2015].
Henderson, B., Falcucci, a., Mottet, a., Early, L., Werner, B., Steinfeld, H. & Gerber, P. (2015): ‘Marginal costs of abating greenhouse gases in the global ruminant livestock sector. Mitigation and Adaptation Strate-
gies for Global Change’. Available from: http://link.springer.com/10.1007/s11027-015-9673-9 [Accessed 04 November 2015].
Heubach, K., Wittig, R., Nuppenau, E.-A. & Hahn, K. (2011): ‘The economic importance of non-timber forest products (NTFPs) for livelihood maintenance of rural west African communities: a case study from northern Benin’. Ecological Economics. 70 (11).
pp. 1991–2001. Available from: http://linkinghub.elsevier.com/retrieve/pii/S0921800911002047 [Ac-cessed 04 November 2015].
Hurteau, M.D. & Brooks, M.L. (2011): ‘Short- and Long-term Effects of Fire on Carbon in US Dry Temperate Forest Systems’. BioScience. 61 (2). pp. 139–146. Available from: http://www.jstor.org/doi/abs/10.1525/bio.2011.61.2.9 [Accessed 04 November 2015].
IEA (2015): ‘Consumption of oil products: Non-OECD
Americas’. Washington, DC. Available from: http://www.iea.org/stats/WebGraphs/LATINAMERI1.pdf [Accessed 04 November 2015].
IFAD (2010): ‘Rural Poverty Report 2011’. New Realities,
New Challenges: New Opportunities for Tomorrow’s
Generation. Rome, Italy.IIASA – Riahi, K., F. Dentener, D. Gielen, A. Grubler,
J. Jewell, Z. Klimont, V. Krey, D. McCollum, S. Pachauri, S. Rao, B. van Ruijven, D. P. van Vuuren and C. Wilson (2012): ‘Chapter 17: Energy Pathways for Sustainable Development. In Global Energy
Assessment: Toward a Sustainable Future’, Cambridge University Press, Cambridge, UK and New York, NY, USA and the International Institute for Applied Systems Analysis, Laxenburg, Austria, pp. 1203-1306. ISBN - 9781 10700 5198 hardback / ISBN - 9780 52118 2935 paperback
INEGI (2012): ‘Encuesta Anual de Transportes 2011’. Available from: http://www.inegi.org.mx/prod_serv/contenidos/espanol/bvinegi/productos/integracion/encues-trans/2011/EAT1_2011.pdf [Accessed 04 November 2015].
INPE (2010): ‘Desmatemento Cai’. Available from: http://www.inpe.br/ingles/index.php [Accessed 04 November 2015].
IPCC (2007): ‘The Physical Science Basis’. Contribution
of Working Group I to the Fourth Assessment Report of
the Intergovernmental Panel on Climate Change. Cam-bridge: Cambridge University Press.
IPCC (2014): ‘Climate Change 2014: Synthesis Report’. Contribution of Working Groups I, II and III to the Fifth
Assessment Report of the Intergovernmental Panel on
Climate Change [Core Writing Team, R.K. Pachauri and L.A. Meyer (eds.)]. IPCC, Geneva, Switzerland, 151 pp.
IRENA (2012): ‘Renewable Energy Technologies: Cost
Analysis Series – Concentrating Solar Power’. Avail-able from: http://www.irena.org/documentdown-loads/publications/re_technologies_cost_analy-sis-csp.pdf [Accessed 04 November 2015].
76
REFERENCES
IRENA (2015a): ‘Renewable Energy in Latin America
2015: An Overview of Policies’. Abu Dhabi. Available from: http://www.irena.org/DocumentDownloads/Publications/IRENA_RE_Latin_America_Poli-cies_2015.pdf [Accessed 04 November 2015].
IRENA (2015b): ‘Renewable Power Generation Costs in
2014’. Available from: http://www.irena.org/Doc-umentDownloads/Publications/IRENA_RE_Pow-er_Costs_2014_report.pdf [Accessed 04 November 2015].
Istamto, T., Houthuijs, D. & Lebret, E. (2014): ‘Will-ingness to pay to avoid health risks from road-traf-fic-related air pollution and noise across five countries’. Science of The Total Environment. 497-498. pp. 420–429. Available from: http://linkinghub.elsevier.com/retrieve/pii/S0048969714011474 [Ac-cessed 04 November 2015].
Jianbo, L. (2006): ‘Energy balance and economic benefits of two agroforestry systems in northern and southern China’. Agriculture, Ecosystems &
Environment. 116 (3-4). pp. 255–262. Available from: http://linkinghub.elsevier.com/retrieve/pii/S0167880906000971 [Accessed 04 November 2015].
Justen, A., Martínez, F., Lenz, B. & Cortés, C. (2012): ‘Santiago 2030: Perspectives on the Urban Trans-port System’. In: Risk Habitat Megacity. Berlin, Hei-delberg: Springer Berlin Heidelberg, pp. 207–227. Available from: http://www.springerlink.com/con-tent/g86567515285wk80/ [Accessed 04 November 2015].
Kaimowitz, D. (2008): ‘The Prospects for Reduced Emissions from Deforestation and Degradation (REDD) in Mesoamerica’. International Forest-
ry Review. 10 (3). pp. 485–495. Available from: http://openurl.ingenta.com/content/xref?gen-re=article&issn=1465-5489&volume=10&is-sue=3&spage=485 [Accessed 04 November 2015].
Kindermann, G., Obersteiner, M., Sohngen, B., Sa-thaye, J., Andrasko, K., Rametsteiner, E., Schlamad-inger, B., Wunder, S. & Beach, R. (2008): ‘Global cost estimates of reducing carbon emissions through avoided deforestation’. Proceedings of the National
Academy of Sciences. [Online]. 105 (30). pp. 10302–10307. Available from: http://www.pnas.org/cgi/doi/10.1073/pnas.0710616105 [Accessed 04 Novem-ber 2015].
Klinge, H., Adis, J. & Worbes, M. (1995): ‘The vegeta-
tion of a seasonal varzea forest in the lower Solimões
river, Brazilian Amazonia’, Scielo, Acta Amazonica. Available from: http://www.scielo.br/scielo.php?pi
d=S0044-59671995000400201&script=sci_abstract [Accessed 04 November 2015].
Kost, C., Mayer, J.N., Thomsen, J., Hartmann, N., Senkpiel, C., Philipps, S., Nold, S., Lude, S., Saad, N. & Schlegl, T. (2013): ‘Levelized Cost of
Electricity Renewable Energy Technologies’. Frei-burg, Germany. Available from: http://www.ise.fraunhofer.de/en/publications/veroeffentlichun-gen-pdf-dateien-en/studien-und-konzeptpapiere/study-levelized-cost-of-electricity-renewable-ener-gies.pdf [Accessed 04 November 2015].
Kumar, B.M., George, S.J., Jamaludheen, V. & Suresh, T.K. (1998): ‘Comparison of biomass production, tree allometry and nutrient use efficiency of multi-purpose trees grown in woodlot and silvopastoral experiments in Kerala, India’. Forest Ecology and
Management. 112 (1). pp. 145–163.Lal, R. (2005): ‘Forest soils and carbon sequestration.
Forest Ecology and Management’. 220 (1). pp. 242–258.Lantz, E., Hand, M. & Wiser, R. (2012): ‘The Past and Fu-
ture Cost of Wind Energy’. Denver, Colorado. Availa-ble from: http://www.nrel.gov/docs/fy12osti/54526.pdf [Accessed 04 November 2015].
Lapeyre, T., Alegre, J. & Arévalo, L. (2004): ’Deter-
minación de las reservas de carbono de la biomasa
aérea, en diferentes sistemas de uso de la tierra en
San Martín, Perú’. Available from: http://www.scielo.org.pe/scielo.php?script=sci_arttex-t&pid=S1726-22162004000100006 [Accessed 04 November 2015].
Law 20571 (2012): ‘Reference to law 20571 of Chile’. Available from: http://www.minenergia.cl/ley20571/wp-content/uploads/2015/03/Ley20.571.pdf [Accessed 04 November 2015].
Lesschen, J.P., van den Berg, M., Westhoek, H.J., Wit-zke, H.P. & Oenema, O. (2011): ‘Greenhouse gas emission profiles of European livestock sectors’. Animal Feed Science and Technology. 166-167. pp. 16–28. Available from: http://linkinghub.elsevier.com/retrieve/pii/S0377840111001775 [Accessed 04 November 2015].
Lorenz, K. & Lal, R. (2014): ‘Soil organic carbon seques-tration in agroforestry systems: a review’. Agronomy
for Sustainable Development. 34 (2). pp. 443–454. Available from: http://link.springer.com/10.1007/s13593-014-0212-y [Accessed 04 November 2015].
Luckow, P., Stanton, E.A., Fields, S., Biewald, B., Jack-son, S., Fisher, J. & Wilson, R. (2015): ‘2015 Carbon
Dioxide Price Forecast’. Cambridge, Massachusetts. Available from: http://www.synapse-energy.com/
77
REFERENCES
sites/default/files/2015 Carbon Dioxide Price Re-port.pdf [Accessed 04 November 2015].
Magalhães, M.M. de & Lunas Lima, D.A.L. (2014): ‘Low-Carbon Agriculture in Brazil: The Environmental
and Trade Impact of Current Farm Policies’. Geneva, Switzerland. Available from: http://www.ictsd.org/sites/default/files/research/Low-Carbon Agricul-ture in Brazil.pdf [Accessed 04 November 2015].
Martin, E.W., Chester, M. V. & Vergara, S.E. (2015): ‘Attributional and Consequential Life-cycle Assess-ment in Biofuels: A Review of Recent Literature in the Context of System Boundaries’. Current Sus-
tainable/Renewable Energy Reports. 2 (3). pp. 82–89. Available from: http://link.springer.com/10.1007/s40518-015-0034-9 [Accessed 04 November 2015].
Maurer, E.P., Adam, J.C. & Wood, A.W. (2008): ‘Cli-mate model based consensus on the hydrologic impacts of climate change to the Rio Lempa basin of Central America’. Hydrology and Earth System
Sciences Discussions. 5 (6). pp. 3099–3128. Available from: http://www.hydrol-earth-syst-sci-discuss.net/5/3099/2008/ [Accessed 04 November 2015].
Mena-Carrasco, M., Oliva, E., Saide, P., Spak, S.N., de la Maza, C., Osses, M., Tolvett, S., Campbell, J.E., Tsao, T. es C.-C. & Molina, L.T. (2012): ‘Estimating the health benefits from natural gas use in trans-port and heating in Santiago, Chile’. Science of The
Total Environment. 429. pp. 257–265. Available from: http://linkinghub.elsevier.com/retrieve/pii/S0048969712005694 [Accessed 04 November 2015].
Messner, S. & Struebegger, M. (1995): ’User’s guide for
MESSAGE III’. Laxenburg, Austria.Montagnini, F. & Nair, P.K.R. (2004): ‘Carbon sequestra-
tion: an underexploited environmental benefit of agroforestry systems’. Agroforestry Systems. 61-62 (1-3). pp. 281–295. Available from: http://link.spring-er.com/10.1023/B:AGFO.0000029005.92691.79 [Accessed 04 November 2015].
Moore, S. & Newey, G. (2012): ‘Something in the air: the
forgotten crisis of Britain’s poor air quality’. London. Available from: http://www.policyexchange.org.uk/images/publications/something in the air.pdf [Accessed 04 November 2015].
Moran, D., Macleod, M., Wall, E., Eory, V., McVittie, A., Barnes, A., Rees, R., Topp, C.F.E. & Moxey, A. (2011): ‘Marginal Abatement Cost Curves for UK Agricultural Greenhouse Gas Emissions’. Journal
of Agricultural Economics. 62 (1). pp. 93–118. Avail-able from: http://doi.wiley.com/10.1111/j.1477-9552.2010.00268.x [Accessed 04 November 2015].
Moreira, M.R.P. & Dourado, A.B. de F. (2014): ‘A taxa
de motorização nas cidades brasileiras e a questão da
mobilidade urbana’. Available from: http://www.antp.org.br/_5dotSystem/download/dcmDocu-ment/2013/10/07/F5EE6A8C-151A-403D-8C98-56488342AEE1.pdf [Accessed 04 November 2015].
Nair, P.K.R. (2012): ‘Carbon sequestration studies in agroforestry systems: a reality-check. Agroforestry
Systems’. [Online]. 86 (2). pp. 243–253. Available from: http://link.springer.com/10.1007/s10457-011-9434-z [Accessed 04 November 2015].
Nair, P.K.R. & Garrity, D. (2012): ‘Agroforestry: The
Future of Global Land Use. Advances in Agroforestry’. P. K. R. Nair & D. Garrity (eds.). Dordrecht: Springer Netherlands. Available from: http://link.springer.com/10.1007/978-94-007-4676-3 [Accessed 04 No-vember 2015].
Nakaegawa, T. & Vergara, W. (2010): ‘First Projection of Climatological Mean River Discharges in the Magdalena River Basin, Colombia, in a Changing Climate during the 21st Century’. Hydrological
Research Letters. 4. pp. 50–54. Available from: http://joi.jlc.jst.go.jp/JST.JSTAGE/hrl/4.50?from=CrossRef [Accessed 04 November 2015].
NCCS (2013). Mexico (2013): ‘National Climate Change
Strategy: The 10-20-40 Vision’. Available from: http://mitigationpartnership.net/mexico-2013-national-climate-change-strategy-10-20-40-vision [Accessed 04 November 2015].
Nepstad, D., McGrath, D., Stickler, C., Alencar, A., Azevedo, A., Swette, B., Bezerra, T., DiGiano, M., Shimada, J., Seroa da Motta, R., Armijo, E., Castello, L., Brando, P., Hansen, M.C., McGrath-Horn, M., Carvalho, O. & Hess, L. (2014): ‘Slowing Amazon deforestation through public policy and interven-tions in beef and soy supply chains’. Science. 344 (6188). pp. 1118–1123. Available from: http://www.sciencemag.org/cgi/doi/10.1126/science.1248525 [Accessed 04 November 2015].
Nielsen, R. (2005): ‘Solar Radiation’. Available from: http://home.iprimus.com.au/nielsens/solrad.html [Accessed 04 November 2015].
NOAA (2015): ‘Earth System Research Laboratory: Trends
in Atmospheric Carbon Dioxide’. Available from: http://www.esrl.noaa.gov/gmd/ccgg/trends/weekly.html [Accessed 04 November 2015].
Noreña, J.E.O., García, C.G., Conde, A.C. & Magaña, V. (2009): ‘Vulnerability of water resources in the face of potential climate change: generation of hydroelectric power in Colombia’. Atmósfera. 22 (3). Available from: http://www.scielo.org.mx/scielo.ph
78
REFERENCES
p?pid=S0187-62362009000300001&script=sci_art-text [Accessed 04 November 2015].
Nykvist, B. & Nilsson, M. (2015): ‘Rapidly falling costs of battery packs for electric vehicles’. Nature
Climate Change. 5 (4). pp. 329–332. Available from: http://www.nature.com/doifinder/10.1038/ncli-mate2564 [Accessed 04 November 2015].
Nylund, N.-O. (2013): ‘Transport Technology Gaps’. Available from: https://www.iea.org/media/work-shops/2013/egrdmobility/Nylund_transport_tech-nology_gaps.pdf [Accessed 04 November 2015].
OECD (2014): ‘The Cost of Air Pollution’. OECD Pub-lishing. Available from: http://www.oecd-ili-brary.org/environment/the-cost-of-air-pollu-tion_9789264210448-en [Accessed 04 November 2015].
Oelbermann, M., Voroney, R.P., Thevathasan, N. V., Gordon, A.M., Kass, D.C.L. & Schlönvoigt, A.M. (2006): ‘Soil carbon dynamics and residue stabi-lization in a Costa Rican and southern Canadian alley cropping system’. Agroforestry Systems. 68 (1). pp. 27–36. Available from: http://link.springer.com/10.1007/s10457-005-5963-7 [Accessed 04 No-vember 2015].
Olsen, N. & Bishop, J. (2009): ‘The Financial Costs of
REDD: Evidence from Brazil and Indonesia’. Gland. Available from: https://portals.iucn.org/library/efiles/documents/2009-047.pdf [Accessed 04 No-vember 2015].
Overmars, K.P., Stehfest, E., Tabeau, A., van Meijl, H., Beltrán, A.M. & Kram, T. (2014): ‘Estimating the opportunity costs of reducing carbon dioxide emissions via avoided deforestation, using integrat-ed assessment modelling’. Land Use Policy. 41. pp. 45–60. Available from: http://linkinghub.elsevier.com/retrieve/pii/S0264837714000799 [Accessed 04 November 2015].
Palm, C., Tomich, T., Van Noordwijk, M., Vosti, S., Gockowski, J., Alegre, J. & Verchot, L. (2004): ‘Mitigating GHG Emissions in the Humid Tropics: Case Studies from the Alternatives to Slash-and-Burn Program (ASB)’. Environment, Development
and Sustainability. 6 (1/2). pp. 145–162. Available from: http://link.springer.com/10.1023/B:EN-VI.0000003634.50442.ca [Accessed 04 November 2015].
Peters-Stanley, M. & Gonzalez, G. (2014): ‘Sharing the stage state of the voluntary carbon markets 2014’. A Report by Forest Trends’ Ecosystem Marketplace:
Executive Summary, Washington DC.
Potapov, P., Laestadius, L. & Minnemeyer, S. (2011): ‘Global Map of Forest Landscape Restoration Opportu-
nities’. Washington, DC. Available from: www.wri.org/forest-restoration-atlas [Accessed 04 November 2015].
REN21 (2014): ‘RENEWABLES 2014: GLOBAL STA-
TUS REPORT’. Paris: REN21 Secretariat. Available from: http://www.ren21.net/Portals/0/documents/Resources/GSR/2014/GSR2014_full report_low res.pdf [Accessed 04 November 2015].
REN21 (2015): ‘RENEWABLES 2015: GLOBAL STATUS
REPORT’. Paris: REN21 Secretariat. Available from: http://www.ren21.net/status-of-renewables/glob-al-status-report/ [Accessed 04 November 2015].
Renewable energy world (2013): ‘The Future of Solar in
Latin America’. Available from: http://www.renewa-bleenergyworld.com/articles/2013/05/the-future-of-solar-in-latin-america.html [Accessed 04 November 2015].
Riahi, K., Dentener, F., Gielen, D., Grubler, A., Jewell, J., Klimont, Z., Krey, V., McCollum, D., Pachauri, S., Rao, S., Ruijven, B. van, Vuuren, D.P. van & Wilson, C. (2011): ‘2011: Energy Pathways for Sustainable Development’. In: and A. P. L. Gomez-Echeverri, T. B. Johansson, N. Nakicenovic (ed.). In Global Energy
Assessment: Toward a Sustainable Future. Laxenburg: International Institute for Applied Systems Analy-sis (IIASA); Cambridge and New York: Cambridge University Press. Available from: http://opensky.library.ucar.edu/collections/OSGC-000-000-010-509 [Accessed 04 November 2015].
Riahi, K., F. Dentener, D. Gielen, A. Grubler, J. Jewell, Z. Klimont, V. Krey, D. Mccollum, S. Pachauri, S. Rao, B. van Ruijven, D.P. van Vuuren, and C. Wilson (2011): ‘Energy pathways for sustainable development’.
Global Energy Assessment: Toward a Sustainable
Future, Cambridge University Press.Riahi, K., Grübler, A. & Nakicenovic, N. (2007): ‘Sce-
narios of long-term socio-economic and environ-mental development under climate stabilization’. Technological Forecasting and Social Change. 74 (7). pp. 887–935.
RMI (2014): ‘The Economics of Grid Defection’. Available from: http://www.rmi.org/electricity_grid_defec-tion [Accessed 04 November 2015].
RMI (2015): ‘Tesla Hitting the Battery Accelerator’. Avail-able from: http://blog.rmi.org/blog_2015_06_11_te-sla_hitting_the_battery_accelerator [Accessed 04 November 2015].
Rodrigues, V.G.S., Castilla, C., Costa, R.S.C. & Palm, C. (1999): ‘Estoque de carbono em sistema de uso da terra
79
REFERENCES
em Rondônia’. Available from: http://ainfo.cnptia.embrapa.br/digital/bitstream/item/77901/1/FOL-6097-0001.pdf [Accessed 04 November 2015].
Rubio Varas, M. del M. & Tafunell, X. (2014): ‘Latin American hydropower: a century of uneven evolu-tion’. Renewable and Sustainable Energy Reviews. 38 (C). pp. 323–334. Available from: http://econpapers.repec.org/RePEc:eee:rensus:v:38:y:2014:i:c:p:323-334 [Accessed 04 November 2015].
Salimon, C.I., Putz, F.E., Menezes-Filho, L., Anderson, A., Silveira, M., Brown, I.F. & Oliveira, L.C. (2011): ‘Estimating state-wide biomass carbon stocks for a REDD plan in Acre, Brazil’. Forest Ecology
and Management. 262 (3). pp. 555–560. Available from: http://linkinghub.elsevier.com/retrieve/pii/S0378112711002404 [Accessed 04 November 2015].
Saygin, D., Worrell, E., Patel, M.K. & Gielen, D.J. (2011): ‘Benchmarking the energy use of energy-intensive industries in industrialized and in developing countries’. Energy. 36 (11). pp. 6661–6673. Available from: http://linkinghub.elsevier.com/retrieve/pii/S036054421100555X [Accessed 04 November 2015].
Scandlines (2015): ‘Scandlines Hybrid Ferries’. Copenha-gen, Denmark. Available from: https://stateofgreen.com/en/profiles/scandlines/solutions/scand-lines-hybrid-ferries [Accessed 04 November 2015].
Schellnhuber, H.J. (2009): ‘Tipping elements in the Earth System’. Proceedings of the National Academy of
Sciences of the United States of America. 106 (49). pp. 20561–3. Available from: http://www.pnas.org/cgi/content/long/106/49/20561 [Accessed 04 November 2015].
Scherer, A.-C. (2013): ‘Organic food market in the United
States: market access opportunities for Latin American
and Caribbean producers’. Santiago, Chile. Availa-ble from: http://repositorio.cepal.org/bitstream/handle/11362/5066/LCL3696_en.pdf?sequence=1 [Accessed 04 November 2015].
Searchinger, T., Heimlich, R., Houghton, R.A., Dong, F., Elobeid, A., Fabiosa, J., Tokgoz, S., Hayes, D. & Yu, T.-H. (2008): ‘Use of U.S. Croplands for Biofuels Increases Greenhouse Gases Through Emissions from Land-Use Change’. Science. 319 (5867). pp. 1238–1240. Available from: http://www.science-mag.org/cgi/doi/10.1126/science.1151861 [Accessed 04 November 2015].
Seba, T. (2014): ‘Clean Disruption of Energy and Trans-
portation: How Silicon Valley Will Make Oil, Nuclear,
Natural Gas, Coal, Electric Utilities and Conventional
Cars Obsolete by 2030’. Tony Seba. Available from: http://tonyseba.com/portfolio-item/clean-dis-
ruption-of-energy-transportation/ [Accessed 04 November 2015].
da Silva Dias, M.A.F. (2008): ‘Forest and Rainfall Inter-
actions in the Amazon Basin’. Available from: https://www.ige.unicamp.br/terrae/V3/PDF-N3/T_A5_2.pdf [Accessed 04 November 2015].
Smith, P., Martino, D., Cai, Z., Gwary, D., Janzen, H., Kumar, P., McCarl, B., Ogle, S., O’Mara, F., Rice, C., Scholes, B., Sirotenko, O., Howden, M., McAllister, T., Pan, G., Romanenkov, V., Schneider, U., Towpray-oon, S., Wattenbach, M. & Smith, J. (2008): ‘Green-house gas mitigation in agriculture’. Philosophical
Transactions of the Royal Society B: Biological Sciences. 363 (1492). pp. 789–813. Available from: http://rstb.royalsocietypublishing.org/content/363/1492/789 [Accessed 04 November 2015].
Soto-Pinto, L., Anzueto, M., Mendoza, J., Ferrer, G.J. & de Jong, B. (2010): ‘Carbon sequestration through agroforestry in indigenous communities of Chia-pas, Mexico’. Agroforestry Systems. 78 (1). pp. 39–51.
Sparks, D. (2015): ‘Tesla Motors Inc.’s Model 3 Ambitions
May Be More Realistic Than You Think’. Available from: http://www.fool.com/investing/gener-al/2015/06/28/tesla-motors-incs-model-3-ambi-tions-more-realistic.aspx [Accessed 04 November 2015].
Stern, N. (2006): ‘Stern Review on the Economics of
Climate Change’. Cambridge University Press. Available from: http://www.amazon.co.uk/The-Eco-nomics-Climate-Change-Review/dp/0521700809 [Accessed 04 November 2015].
Summers, D.M., Bryan, B.A., Nolan, M. & Hobbs, T.J. (2015): ‘The costs of reforestation: a spatial model of the costs of establishing environmental and carbon plantings’. Land Use Policy. 44. pp. 110–121. Available from: http://linkinghub.elsevier.com/retrieve/pii/S0264837714002737 [Accessed 04 November 2015].
Svarrer, K. & Olsen, C.S. (2005): ‘The Economic Value of Non-Timber Forest Products: A Case Study from Malaysia’. Journal of Sustainable Forestry. 20 (1). pp. 17–41. Available from: http://www.tandfonline.com/doi/abs/10.1300/J091v20n01_02 [Accessed 04 November 2015].
Teske, S., Sawyer, S. & Schäfer, O. (2015): ‘Energy [R]
evolution: A Sustainable World Energy Outlook 2015’. Available from: http://www.greenpeace.org/inter-national/en/publications/Campaign-reports/Cli-mate-Reports/Energy-Revolution-2015/ [Accessed 04 November 2015].
80
REFERENCES
Tollefson, J. (2015): ‘Stopping deforestation: battle for the Amazon’. Nature. 520 (7545). pp. 20–23. Available from: http://www.nature.com/doifind-er/10.1038/520020a [Accessed 04 November 2015].
Tsuchiya, A. & Hiraoka, M. (1999): ‘Forest biomass and
wood consumption in the lower course of the Amazon:
a case study of the Urubuera Island’. Available from: http://www.scielo.br/scielo.php?pid=S0044-59671999000100079&script=sci_abstract [Accessed 04 November 2015].
UCS (2009): ‘Clean Energy, Green Jobs’. Cambridge MA. Available from: http://www.ucsusa.org/clean_en-ergy/smart-energy-solutions/increase-renewables/clean-energy-green-jobs.html#.VgjwKMuqpBc [Accessed 04 November 2015].
UNCTAD (2012): ‘Maritime Transport and the Climate
Change Challenge’. Available from: http://unctad.org/en/pages/newsdetails.aspx?OriginalVersion-ID=132 [Accessed 04 November 2015].
USA (2012): ‘United States Transportation by the Num-
bers’. Available from: http://www.rita.dot.gov/bts/sites/rita.dot.gov.bts/files/united_states.pdf [Ac-cessed 04 November 2015].
Valdes, A. & Mistiaen, J.A. (2003): ‘Rural Poverty Allevi-
ation in Brazil: Toward an Integrated Strategy’. World
Bank Country Study. ERIC.Vergara, W., Deeb, A., Cramton, P., Toba, N., Leino,
I. & Benoit, P. (2010): ‘Wind energy in Colombia: a
framework for market entry’. World Bank Publica-tions. Available from: http://www.cramton.umd.edu/papers2010-2014/vergara-deep-toba-cram-ton-leino-wind-energy-in-colombia.pdf [Accessed 04 November 2015].
Vergara, W. & Scholz, S.M. (2011): ‘Assessment of the
risk of Amazon dieback’. Washington D.C. Available from: http://documents.worldbank.org/curated/en/2010/01/13155273/assessment-risk-amazon-die-back [Accessed 04 November 2015].
Vergara, W., Alatorre, C. & Alves, L. (2013a): ‘Rethink-
ing Our Energy Future: A White Paper on Renewable
Energy for the 3GFLAC Regional Forum’. Available from: https://www.imf.org/external/np/seminars/eng/2013/caribbean/pdf/rethinking.pdf.
Vergara, W., Rios, A.R., Galindo, L.M., Gutman, P., Isbell, P., Suding, P.H. & Samaniego, J. (2013b): ‘The
Climate and Development Challenge for Latin Amer-
ica and the Caribbean. Options for climate-resilient,
low-carbon development’. Available from: http://idbdocs.iadb.org/wsdocs/getdocument.aspx?doc-num=37720722 [Accessed 04 November 2015].
Vergara, W., Rios, A.R., Trapido, P., Malarin, H. & Malarín, H. (2014): ‘Agriculture and future climate in
Latin America and the Caribbean: systemic impacts
and potential responses’. Available from: http://idbdocs.iadb.org/wsdocs/getdocument.aspx?doc-num=38585010 [Accessed 04 November 2015].
World Bank (1998): ‘El Salvador: Rural Development
Study’. Washington D.C.World Bank (2002): ‘Improving Air Quality in Metropol-
itan Mexico City: An Economic Valuation’. Available from: http://hdl.handle.net/10986/15696 [Accessed 04 November 2015].
World Bank (2014a): ‘The Little Green Data Book’. Wash-ington, D.C. Available from: http://data.worldbank.org/sites/default/files/wb-ldb_green_2014-crpd.pdf [Accessed 04 November 2015].
World Bank (2014b): ‘World Development Indicators
2014’. Washington D.C. Available from: http://data.worldbank.org/sites/default/files/wdi-2014-book.pdf [Accessed 04 November 2015].
World Bank (2015): ‘World Development Indicators
2015’. Washington, DC. Available from: http://data.worldbank.org/ [Accessed 04 November 2015].
Yáñez-Ruiz, D.R., Losa, R., Núñez, C., Tessier, N., Media, B., Shearer, A., Campanere, S. de, Morgavi, D., Fievez, F. & Newbold, C.J. (2013): ‘Smethane, a technological platform to develop nutritional additives to reduce methane emissions from rumi-nants: putting together efforts from industry and academia’. In: XV Jornadas sobre Producción Animal,
Zaragoza 14 y 15 de mayo de 2013. 2013, Asociación Interprofesional para el Desarrollo Agrario, pp. 288–290. Available from: http://www.cabdirect.org.globalproxy.cvt.dk/abstracts/20133263958.html;jsessionid=8DEC2EF0BDF000C400CFAE3D-CD4ABD18# [Accessed 04 November 2015].
Yquise, A., Pocomucha, V. & Rios, J. (2009): ‘Carbono
Almacenado en Diferentes Sistemas de Uso de la Tierra
del Distrito de José Crespo y Castillo’. Huánuco, Perú.

81
REFERENCES

82
ANNEXES
83
DESCRIPTION OF IIASA’S BAU (GEA-BAU) AND GEA-MIX SCENARIOS
This report relies heavily on the scenarios projected by IIASA under its Global Energy Assessment (GEA) mod-el. Two different scenario families are used (GEA-Mix & GEA-BAU or Counterfactual) to project sector emission development in order to identify mitigation priorities and verify the zero carbon LAC route by 2050.
The IIASA (2012) scenario database40 offers three prin-cipal Global Energy Assessment (GEA) transformation pathway groups (GEA-Efficiency, GEA-Supply, and GEA-Mix). These scenarios are divided into three branching points and thus differ significantly from each other, depending on the choices made about technologies, in-frastructures, behaviours and life-styles, as well as on future priorities with respect to the portfolio of supply- and demand-side policies (Riahi et al., 2012). The first branching point leads to three pathway groups where the GEA-Efficiency pathway assumes the most signifi-cant reduction and the GEA-Supply pathway registers only minor improvements over the historical rate into the future. Meanwhile, the GEA-Mix pathway exhibits an intermediate level of energy efficiency and decline in energy intensities. The second and third branching points of these three scenarios into still more pathways are based on41:
• The type of transportation system (that is, a conven-tional, traditional “liquids” transport infrastructure versus an advanced transport infrastructure based upon electrification and, in some cases, some use of hydrogen) that is assumed to dominate the economy in the future;
• The energy sources—or technologies—assumed to be included in or excluded from the energy and tech-nology mix along any particular pathway.
Furthermore, all of the GEA pathways share certain other common defining features as well, the most sig-nificant of which is significant mitigation of GHG emis-
40 See http://www.iiasa.ac.at/web-apps/ene/geadb/dsd?Action=html-page&page=about
41 For a complete and in-depth description of the GEA pathways see (Riahi et al., 2012).
sions into the future. In each of the 41 GEA pathways that IIASA has assessed, IIASA finds that this reduction of emissions is significant enough to make a regionally appropriate contribution to a credible global defence of the 450 parts per million (ppm) atmospheric con-centration limit and the 2 °C guardrail by 2050 (Riahi et al., 2011).
This study uses the GEA-Mix Conventional Transpor-tation pathway as the most intermediate of the three pathway groups mentioned above, one which empha-sizes a more diverse energy supply mix to enhance the system’s resilience against innovation failures or tech-nology shocks. However, this does not imply that the GEA-Mix pathway is intermediate between the other two pathways in terms of other scenario characteristics (e.g., the required policy portfolio, costs, fuel choices, or the deployment of individual technologies) (Riahi et al., 2012). Conventional transportation refers to the contin-uation of a predominantly liquid-based transportation system, while fundamental changes in infrastructures (in the case of a high degree of penetration of electric vehicles) are discussed in detail in Chapter 3.
If the GEA pathways are presented as only energy inter-vention scenarios, they would bring LAC to anywhere between 3.4 tpc and 4.3 tpc by 2050, and would there-fore need to be supplemented with significantly more intensive AFOLU policy measures in order to follow the aggressive mix-I+ (plus) (combined) intervention path-way to the LAC goal of 2 tpc annually by 2050. In other words, the energy interventions bring LAC’s per capita emissions from 9.3 under the BAU trajectory down to below 4 tpc; another 2 tpc must be reduced through AFOLU interventions in order to achieve the 2 tpc goal by 2050.
The second scenario included in this study is the GEA-BAU (MESSAGE) (or business-as-usual scenario), which is a hypothetical no-policy baseline describing the evo-lution of the energy system in the absence of any trans-formational policies for the demand- or supply-side of the energy system (Riahi et al., 2012). MESSAGE (Model for Energy Supply Strategy Alternatives and their Gen-eral Environmental Impact) is a systems engineering optimization model used for medium- to long-term
ANNEX I
84
ANNEX 1
energy system planning, energy policy analysis and scenario development (Messner & Struebegger, 1995; Riahi et al., 2007). The scenario represents all energy system interdependencies, from resource extraction, imports and exports, conversion, transport and distri-bution, to the provision of energy end-use services such as light, space heating and cooling, industrial produc-tion processes and transportation. MESSAGE covers all GHG-emitting sectors, including agriculture, forestry, energy and industrial sources, and the major GHGs and other gases: CO2, methane (NH4), nitrous oxide (N2O), nitrogen oxides (NO2), volatile organic compounds (VOCs), carbon monoxide (CO), sulphur dioxide, black carbon and organic carbon, tetrafluoromethane, hex-afluoroethane, various hydrofluorocarbons (HFC125, HFC134a, HFC143a, HFC227ea, HFC245ca) and sulphur hexafluoride. The MESSAGE BAU assumes a transit of many sectors to hydrocarbons but is unable to success-fully address energy access and security issues (Riahi et al., 2012). The GEA pathways are generated based on the BAUs combined with a set of harmonized assumptions.
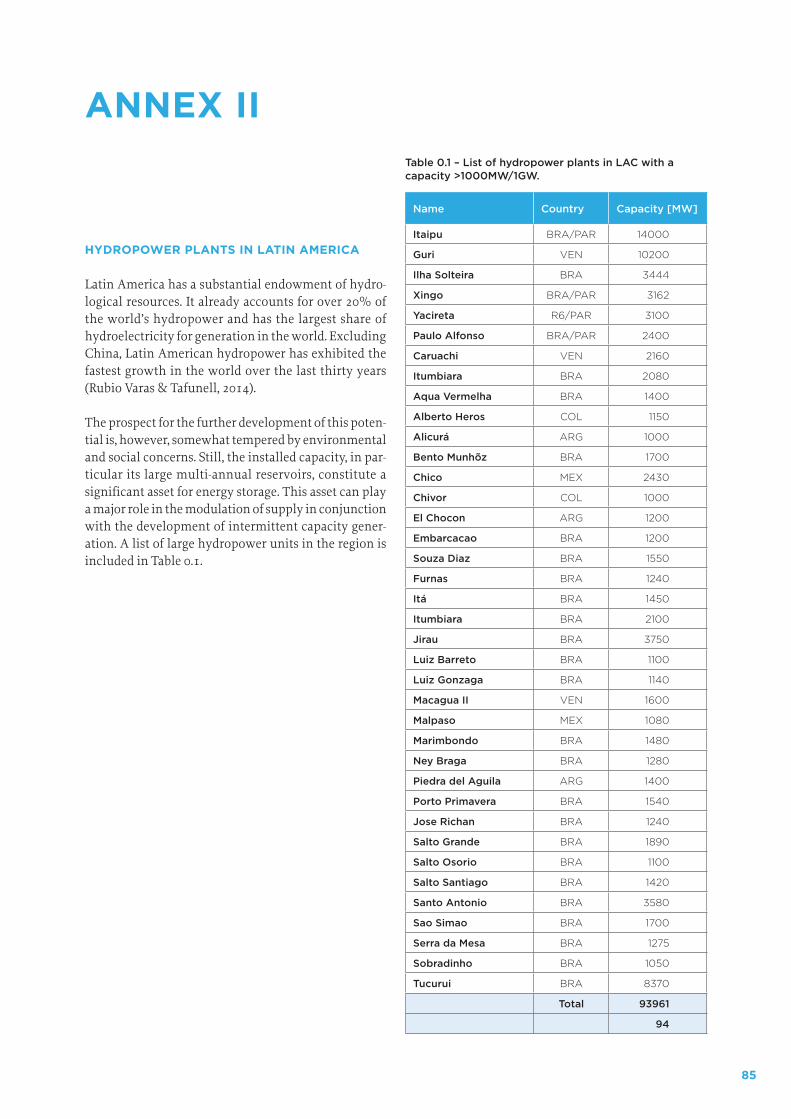
85
ANNEX II
HYDROPOWER PLANTS IN LATIN AMERICA
Latin America has a substantial endowment of hydro-logical resources. It already accounts for over 20% of the world’s hydropower and has the largest share of hydroelectricity for generation in the world. Excluding China, Latin American hydropower has exhibited the fastest growth in the world over the last thirty years (Rubio Varas & Tafunell, 2014).
The prospect for the further development of this poten-tial is, however, somewhat tempered by environmental and social concerns. Still, the installed capacity, in par-ticular its large multi-annual reservoirs, constitute a significant asset for energy storage. This asset can play a major role in the modulation of supply in conjunction with the development of intermittent capacity gener-ation. A list of large hydropower units in the region is included in Table 0.1.
Table 0.1 – List of hydropower plants in LAC with a capacity >1000MW/1GW.
Name Country Capacity [MW]
Itaipu BRA/PAR 14000
Guri VEN 10200
Ilha Solteira BRA 3444
Xingo BRA/PAR 3162
Yacireta R6/PAR 3100
Paulo Alfonso BRA/PAR 2400
Caruachi VEN 2160
Itumbiara BRA 2080
Aqua Vermelha BRA 1400
Alberto Heros COL 1150
Alicurá ARG 1000
Bento Munhõz BRA 1700
Chico MEX 2430
Chivor COL 1000
El Chocon ARG 1200
Embarcacao BRA 1200
Souza Diaz BRA 1550
Furnas BRA 1240
Itá BRA 1450
Itumbiara BRA 2100
Jirau BRA 3750
Luiz Barreto BRA 1100
Luiz Gonzaga BRA 1140
Macagua II VEN 1600
Malpaso MEX 1080
Marimbondo BRA 1480
Ney Braga BRA 1280
Piedra del Aguila ARG 1400
Porto Primavera BRA 1540
Jose Richan BRA 1240
Salto Grande BRA 1890
Salto Osorio BRA 1100
Salto Santiago BRA 1420
Santo Antonio BRA 3580
Sao Simao BRA 1700
Serra da Mesa BRA 1275
Sobradinho BRA 1050
Tucurui BRA 8370
Total 93961
94
86
ANNEX III
DESCRIPTION OF THE GACMO MODEL
GACMO is an excel spreadsheet model developed by Joergen Fenhann, UNEP DTU Partnership (e-mail [email protected]; mobile: +45 4020 2789), which is publicly availa-ble at http://www.cdmpipeline.org/. This publicly avail-able version was modified for this report with a scope on the LAC region.
GACMO can be applied on various geographical scales and is frequently used to develop a low-carbon develop-ment strategy or an INDC.
Analysis using GACMO consists of the following steps:
1. Data collection to establish an energy balance & GHG inventory, as well as a socioeconomic profile of the scope country/region in the start year (2012).
2. Projection of the data collected for the target years, in this case 2025, 2050, and 2075.
3. Analysing all GHG mitigation options available in the model concerning emissions reductions, invest-ments, annual costs and more.
4. The results of the analysis for all GHG mitigation options are available in the summary sheets of the model for the target years inserted in step 2. Here the total impact of the actions is added together in order to find the total GHG emissions reduction, the investment and the total annual cost. These results can be used to identify the most suitable options regarding costs and benefits and also to understand implementation priorities.
In this report, GACMO was utilized to calculate the levelized costs in order to compare the relative competi-tiveness for power generation using renewables, project learning curves for power generation from renewables in LAC, and explore learning curves for electric trans-port vis-à-vis business as usual options.
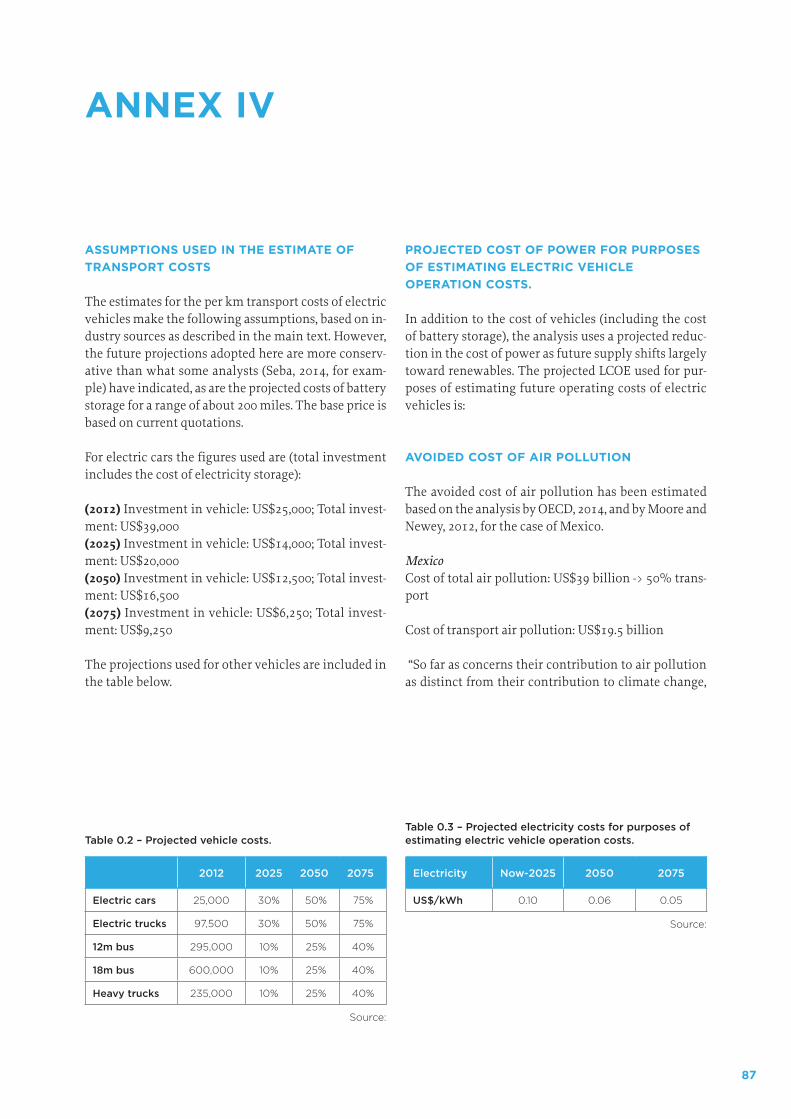
87
ANNEX IV
ASSUMPTIONS USED IN THE ESTIMATE OF TRANSPORT COSTS
The estimates for the per km transport costs of electric vehicles make the following assumptions, based on in-dustry sources as described in the main text. However, the future projections adopted here are more conserv-ative than what some analysts (Seba, 2014, for exam-ple) have indicated, as are the projected costs of battery storage for a range of about 200 miles. The base price is based on current quotations.
For electric cars the figures used are (total investment includes the cost of electricity storage):
(2012) Investment in vehicle: US$25,000; Total invest-ment: US$39,000 (2025) Investment in vehicle: US$14,000; Total invest-ment: US$20,000 (2050) Investment in vehicle: US$12,500; Total invest-ment: US$16,500 (2075) Investment in vehicle: US$6,250; Total invest-ment: US$9,250
The projections used for other vehicles are included in the table below.
PROJECTED COST OF POWER FOR PURPOSES OF ESTIMATING ELECTRIC VEHICLE OPERATION COSTS.
In addition to the cost of vehicles (including the cost of battery storage), the analysis uses a projected reduc-tion in the cost of power as future supply shifts largely toward renewables. The projected LCOE used for pur-poses of estimating future operating costs of electric vehicles is:
AVOIDED COST OF AIR POLLUTION
The avoided cost of air pollution has been estimated based on the analysis by OECD, 2014, and by Moore and Newey, 2012, for the case of Mexico.
MexicoCost of total air pollution: US$39 billion -> 50% trans-port
Cost of transport air pollution: US$19.5 billion
“So far as concerns their contribution to air pollution as distinct from their contribution to climate change,
Table 0.2 – Projected vehicle costs.
2012 2025 2050 2075
Electric cars 25,000 30% 50% 75%
Electric trucks 97,500 30% 50% 75%
12m bus 295,000 10% 25% 40%
18m bus 600,000 10% 25% 40%
Heavy trucks 235,000 10% 25% 40%
Source:
Table 0.3 – Projected electricity costs for purposes of estimating electric vehicle operation costs.
Electricity Now-2025 2050 2075
US$/kWh 0.10 0.06 0.05
Source:
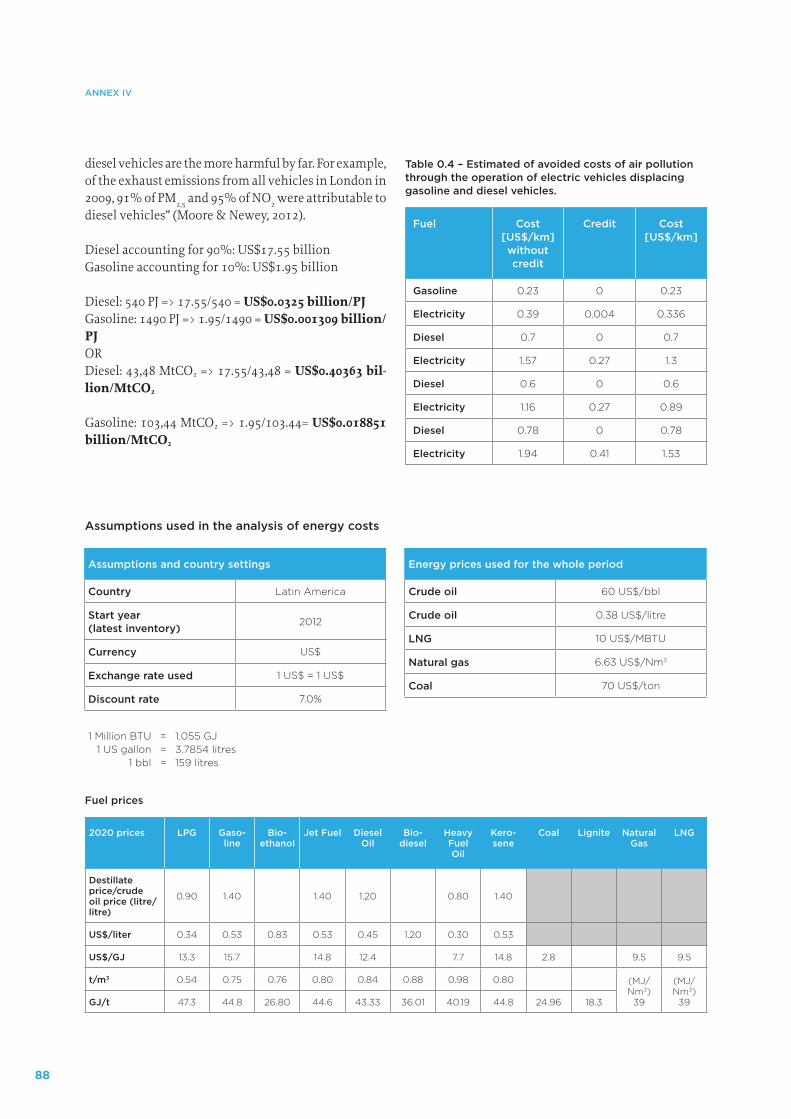
88
ANNEX IV
diesel vehicles are the more harmful by far. For example, of the exhaust emissions from all vehicles in London in 2009, 91% of PM2,5 and 95% of NO2 were attributable to diesel vehicles” (Moore & Newey, 2012).
Diesel accounting for 90%: US$17.55 billionGasoline accounting for 10%: US$1.95 billion
Diesel: 540 PJ => 17.55/540 = US$0.0325 billion/PJGasoline: 1490 PJ => 1.95/1490 = US$0.001309 billion/PJORDiesel: 43,48 MtCO2 => 17.55/43,48 = US$0.40363 bil-lion/MtCO2
Gasoline: 103,44 MtCO2 => 1.95/103.44= US$0.018851 billion/MtCO2
Table 0.4 – Estimated of avoided costs of air pollution through the operation of electric vehicles displacing gasoline and diesel vehicles.
Fuel Cost [US$/km] without credit
Credit Cost [US$/km]
Gasoline 0.23 0 0.23
Electricity 0.39 0.004 0.336
Diesel 0.7 0 0.7
Electricity 1.57 0.27 1.3
Diesel 0.6 0 0.6
Electricity 1.16 0.27 0.89
Diesel 0.78 0 0.78
Electricity 1.94 0.41 1.53
Assumptions and country settings
Country Latin America
Start year (latest inventory) 2012
Currency US$
Exchange rate used 1 US$ = 1 US$
Discount rate 7.0%
Energy prices used for the whole period
Crude oil 60 US$/bbl
Crude oil 0.38 US$/litre
LNG 10 US$/MBTU
Natural gas 6.63 US$/Nm3
Coal 70 US$/ton
1 Million BTU = 1.055 GJ 1 US gallon = 3.7854 litres 1 bbl = 159 litres
Fuel prices
2020 prices LPG Gaso-line
Bio-ethanol
Jet Fuel Diesel Oil
Bio-diesel
Heavy Fuel Oil
Kero-sene
Coal Lignite Natural Gas
LNG
Destillate price/crude oil price (litre/litre)
0.90 1.40 1.40 1.20 0.80 1.40
US$/liter 0.34 0.53 0.83 0.53 0.45 1.20 0.30 0.53
US$/GJ 13.3 15.7 14.8 12.4 7.7 14.8 2.8 9.5 9.5
t/m3 0.54 0.75 0.76 0.80 0.84 0.88 0.98 0.80 (MJ/Nm3)
39
(MJ/Nm3)
39GJ/t 47.3 44.8 26.80 44.6 43.33 36.01 40.19 44.8 24.96 18.3
Assumptions used in the analysis of energy costs
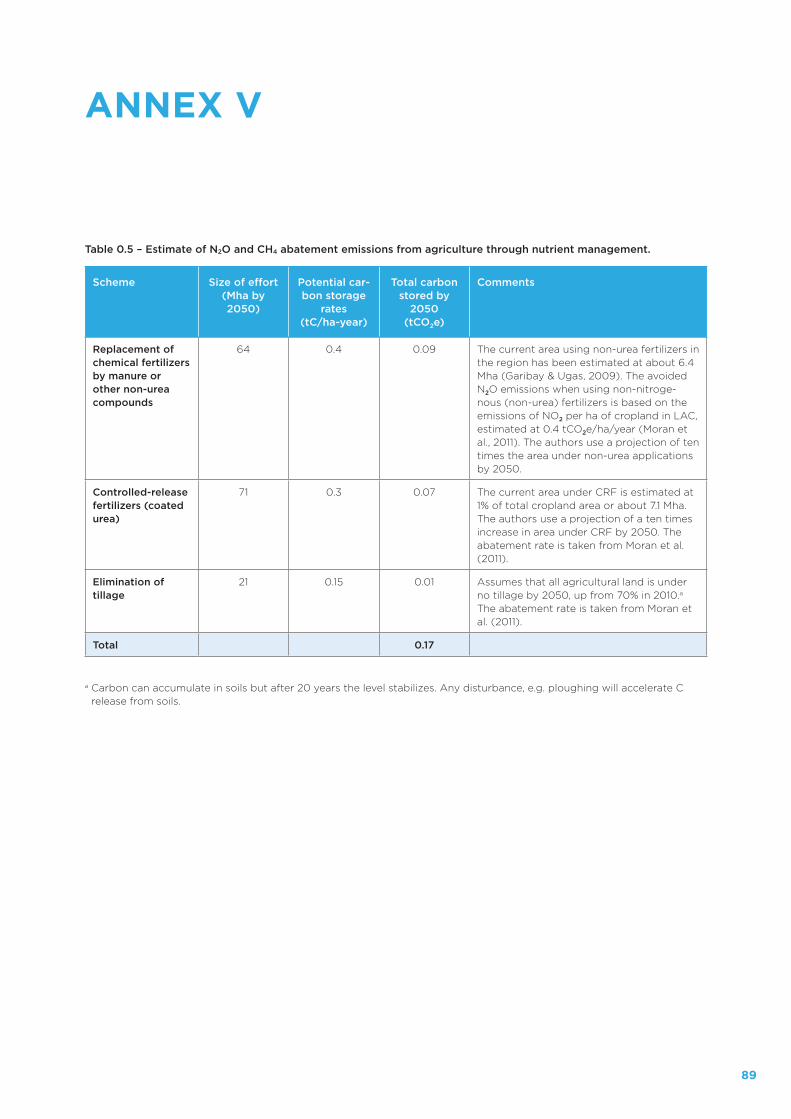
89
ANNEX V
Table 0.5 – Estimate of N2O and CH4 abatement emissions from agriculture through nutrient management.
Scheme Size of effort (Mha by 2050)
Potential car-bon storage
rates (tC/ha-year)
Total carbon stored by
2050 (tCO2e)
Comments
Replacement of chemical fertilizersby manure or other non-urea compounds
64 0.4 0.09 The current area using non-urea fertilizers in the region has been estimated at about 6.4 Mha (Garibay & Ugas, 2009). The avoided N2O emissions when using non-nitroge-nous (non-urea) fertilizers is based on the emissions of NO2 per ha of cropland in LAC, estimated at 0.4 tCO2e/ha/year (Moran et al., 2011). The authors use a projection of ten times the area under non-urea applications by 2050.
Controlled-release fertilizers (coated urea)
71 0.3 0.07 The current area under CRF is estimated at 1% of total cropland area or about 7.1 Mha. The authors use a projection of a ten times increase in area under CRF by 2050. The abatement rate is taken from Moran et al. (2011).
Elimination of tillage
21 0.15 0.01 Assumes that all agricultural land is under no tillage by 2050, up from 70% in 2010.a The abatement rate is taken from Moran et al. (2011).
Total 0.17
a Carbon can accumulate in soils but after 20 years the level stabilizes. Any disturbance, e.g. ploughing will accelerate C release from soils.
90
ANNEX VI
INDUSTRY PATHWAY ANALYSIS
GOV.UK (2015) reports potential pathways for the eight most energy-intensive industrial sectors to reduce GHG emissions and improve energy efficiency. These reports were used to establish the emission reduction potential and related costs under the Max Tech pathway.42 This reduction potential and costs were applied to relevant industrial sectors in LAC43 to calculate the total reduc-tions potential and total costs associated (Table 5.1).
The options deployed are laid down in the reports for each industrial subsector (GOV.UK, 2015). Carbon cap-ture and storage is applied in some sectors (i.e. iron and steel, chemicals and oil refining) from 2040 onwards un-der the assumption that this has become economically and technically viable. CCS may not be a feasible option, as its commercial application is not yet assured, and it is also associated with high energy use. Therefore its de-ployment during the period under analysis is doubtful.
The reduction potential and costs established are cal-culated based on data from UK industry, which can be considered more advanced than LAC industry. The im-provement potential in LAC industry might be signifi-cantly higher, while the costs might be lower (Table 5.2).
42 The Max Tech pathway deploys a range of technologies generally at least at a pilot stage of development, subject to reasonable constraints. It is designed to investigate what might be technically possible when other barriers are set to one side (GOV.UK, 2015).
43 This was restrained by emission data availability for the sectors.
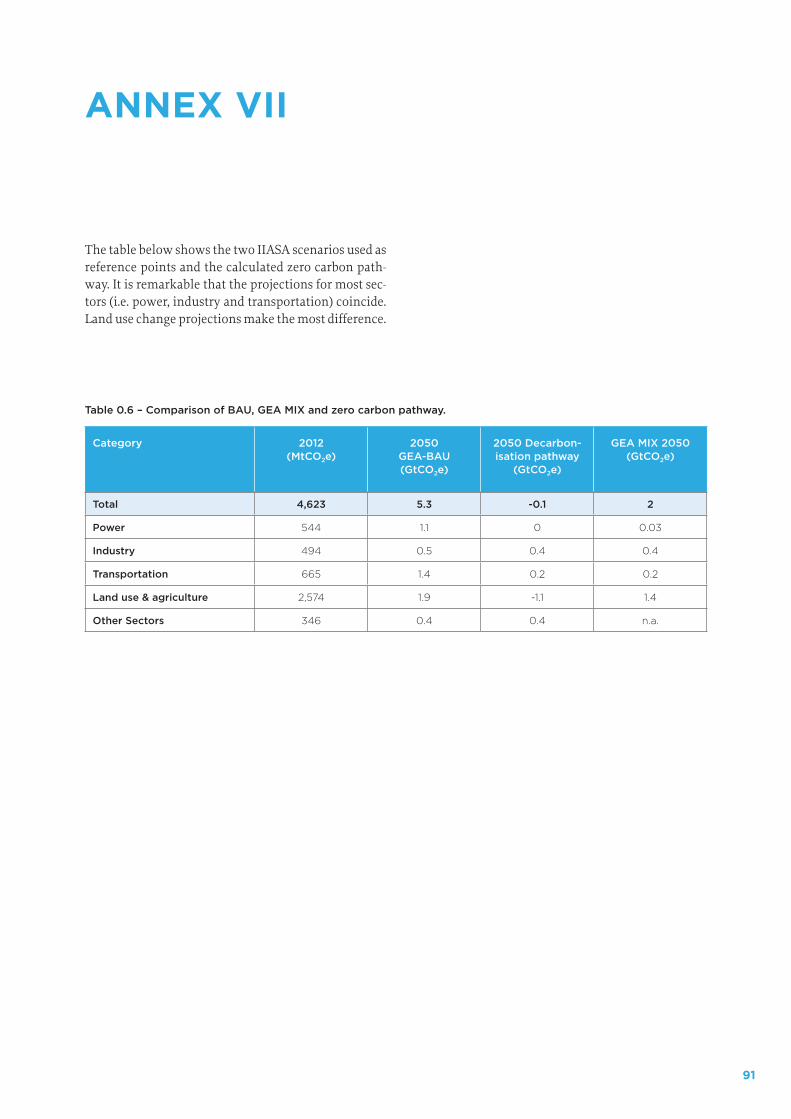
91
ANNEX VII
The table below shows the two IIASA scenarios used as reference points and the calculated zero carbon path-way. It is remarkable that the projections for most sec-tors (i.e. power, industry and transportation) coincide. Land use change projections make the most difference.
Table 0.6 – Comparison of BAU, GEA MIX and zero carbon pathway.
Category 2012 (MtCO2e)
2050 GEA-BAU (GtCO2e)
2050 Decarbon-isation pathway
(GtCO2e)
GEA MIX 2050 (GtCO2e)
Total 4,623 5.3 -0.1 2
Power 544 1.1 0 0.03
Industry 494 0.5 0.4 0.4
Transportation 665 1.4 0.2 0.2
Land use & agriculture 2,574 1.9 -1.1 1.4
Other Sectors 346 0.4 0.4 n.a.


ISBN 978-87-93130-68-5
“The authors are to be congratulated on a remarkable achievement. The zero car-bon strategy is comprehensive, imaginative and credible.”JOHN C. TOPPING, JR., PRESIDENT AND CEO OF THE CLIMATE INSTITUTE
“This study provides a vision on how to go about deep decarbonisation in the region. While the task is immense and many barriers are faced, the authors have managed to identify the key actions, associated costs and benefits that would make this possible.” LUIS M. GALINDO, CEPAL
“This is a pioneering analysis that lays down a visionary strategy for achieving zero carbon emissions in Latin America and the Caribbean”. LESTER R. BROWN, FOUNDER WORLDWATCH INSTITUTE, FOUNDER AND PRESIDENT OF
THE EARTH POLICY INSTITUTE
“This study reviews, for the first time, concrete actions that could drive the car-bon footprint of the regional economy toward zero. It constitutes an important piece for what should be a regional and national dialogue on this issue”. ADRIAN FERNANDEZ, CEO LATIN AMERICA REGIONAL CLIMATE INITIATIVE, FORMER
PRESIDENT OF THE NATIONAL ECOLOGY INSTITUTE OF MEXICO