bnrs-testing.s3-ap-southeast-1.amazonaws.com · bnrs-testing.s3-ap-southeast-1.amazonaws.com

Company Report Industry: Information Technology
Madhu Babu ([email protected]) +91-22-66322300
Zensar Technologies Mix shift in favour of Digital could revive growth momentum

January 08, 2018 2
Zensar Technologies
Prabhudas Lilladher Pvt. Ltd. and/or its associates (the 'Firm') does and/or seeks to do business with companies covered in its research reports. As a result investors should be aware that the Firm may have a conflict of interest that could affect the objectivity of the report. Investors should consider this report as only a single factor in making their investment decision.
Please refer to important disclosures and disclaimers at the end of the report
Contents Page No.
Signs of Stabilization ................................................................................................... 5
Investment Thesis ....................................................................................................... 7
Strong competencies in Digital to drive client stickiness and wins ................................................... 7
Focused approach with strength in Manufacturing and Retail ....................................................... 10
Large Deal Team replenished, focus could be on Horizontal led deals ........................................... 11
Focused strategy to drive growth momentum ................................................................................ 12
Strong expertise in Oracle offerings remains the key proposition .................................................. 14
Professional Access Acquisition strengthens Retail Vertical ........................................................... 15
Renewed Focus on IMS with a focused strategy ............................................................................. 16
Scope to tap business from Apax Group Companies....................................................................... 18
Strategic initiatives under the new leadership .......................................................................... 19
Can Client Concentration lead to Revenue Volatility? .................................................................... 19
Earnings and Financial Outlook ................................................................................ 21
EBIDTA Margins likely to stabilise at 13-14% by FY19 ..................................................................... 22
Acquisition Strategy aims at boosting capabilities .......................................................................... 24
Valuation ................................................................................................................... 25
Company Profile ....................................................................................................... 26
Brief profile of the company ............................................................................................................ 26

Zensar Technologies
Company Report January 08, 2018
Rating BUY
Price Rs868
Target Price Rs1,000
Implied Upside 15.2%
Sensex 34,154
Nifty 10,559
(Prices as on January 05, 2018)
Trading data
Market Cap. (Rs m) 39,060.0
Shares o/s (m) 45.0
3M Avg. Daily value (Rs m) 11.9
Major shareholders
Promoters 48.93%
Foreign 6.06%
Domestic Inst. 11.41%
Public & Other 33.60%
Stock Performance
(%) 1M 6M 12M
Absolute 3.8 7.7 (8.0)
Relative (0.3) (1.6) (35.0)
How we differ from Consensus
EPS (Rs) PL Cons. % Diff.
2019 65.4 66.3 (1.4)
2020 79.6 77.2 3.1
Price Performance (RIC: ZENT.BO, BB: ZENT IN)
Source: Bloomberg
0
200
400
600
800
1,000
Jan
/17
Mar
/17
May
/17
Jul/
17
Sep
/17
No
v/1
7
Jan
/18
(Rs)
Zensar, a mid-sized IT services vendor appears to be on a transformational path
with increased investments in Digital services (~37% of total revenues) and
Platform-led offerings (Vinci, Zen Analytica). The midsized IT vendor (revenues at
USD460mn, Headcount at ~8400 employees) enjoys strong positioning in key
verticals which include Manufacturing, Retail, CPG and Insurance. Among service-
lines, Zensar has robust offerings in Oracle competency and Digital services. Zensar
also appears to be re-positioning its IMS and Business Process management service
lines through focus on Automation led delivery to drive new deal wins.
Zensar has replenished its senior management under the leadership of Mr
Sandeep Kishore (CEO effective January 2016). This includes strengthening its large
deals team as well as US sales function with several senior recruits over the past
one year. The initiatives are visible with Zensar seeing a strong improvement in
deal pipeline as well as steady TCV wins.
We estimate 3.7/10.3/11% USD revenue growth for FY18E/FY19E/FY20E (vs 1.5%
USD revenue growth delivered in FY17). Increasing proportion of revenues from the
Digital SBU coupled with deal wins in select horizontals could revive revenue
growth trajectory. While FY17/FY18E have seen weaker margins, we expect a
gradual recovery on the margin front. We estimate EBITDA margin at
11.6/13.3/14.3% for FY18E/FY19E/FY20E (vs 12.6% in FY17). Revival in growth
could drive SG&A leverage and remain the key driver for margin expansion over
FY18-FY20E. Our EPS estimates are Rs52/65/80/sh for FY18/FY19E/FY20E.
Valuations remain reasonable with stock trading at 13.2x FY19E EPS (20% discount
to Mindtree) and we see room for re-rating over a two-year period. We Initiate
coverage with “BUY” and TP of Rs1000/sh (13.5x Sep19E EPS).
Contd...4 Key financials (Y/e March) 2017 2018E 2019E 2020E
Revenues (Rs m) 30,604 30,749 34,133 37,291
Growth (%) 3.7 0.5 11.0 9.3
EBITDA (Rs m) 3,867 3,563 4,527 5,317
PAT (Rs m) 2,349 2,352 2,946 3,588
EPS (Rs) 52.3 52.3 65.4 79.6
Growth (%) (19.3) (0.1) 25.0 21.8
Net DPS (Rs) 11.9 11.9 13.2 15.1
Profitability & Valuation 2017 2018E 2019E 2020E
EBITDA margin (%) 12.6 11.6 13.3 14.3
RoE (%) 17.2 15.1 16.8 17.9
RoCE (%) 15.5 14.1 15.6 16.8
EV / sales (x) 1.2 1.2 1.0 0.9
EV / EBITDA (x) 9.3 9.6 7.1 5.5
PE (x) 16.6 16.6 13.3 10.9
P / BV (x) 2.6 2.4 2.1 1.8
Net dividend yield (%) 1.4 1.4 1.5 1.7
Source: Company Data; PL Research

Zensar Technologies
January 08, 2018 4
Strong positioning in focused competencies: Zensar has a strong positioning in
Oracle competency with over 3100 consultants in this practice. Zensar
competencies span across the Oracle Suite which include ATG, Oracle
Commerce Cloud, Oracle SalesCloud, Oracle R12, Oracle EPM etc. Company has
been named by Gartner in the magic quadrant for the Oracle competency.
Among verticals, Manufacturing is the largest vertical for Zensar (contributes to
49% of total revenues as on 2QFY18). Zensar has strong relationships with
marquee clients with specialized focus on Hitech and Discrete Manufacturing
sub-segments. Zensar is also seeing strong traction in Retail and CPG vertical
(29% of revenues as on Q2FY18) led by focus on e-commerce and digital
transformation initiatives of Retailers. We expect Zensar’s focused vertical
approach to enable garner higher client wallet share.
Robust offering in Digital Services: Digital accounts to 37% of total revenues for
Zensar as on Q2FY18. With Digital, Zensar includes SMAC (Big Data, Analytics,
and Cloud) and Digital Commerce offerings. Zensar enjoys strong competence
across the sub-segments of Digital. Management guided that it is currently selling
at least one Digital service to ~60 clients (of the total client base of 187 Clients).
Apart from Digital, Zensar is also using Platform and solution-led approach to drive
new client wins. Zensar’s “Vinci” Platform has enabled it to win new deals in IMS.
Company is using similar strategy to chase Robotic Process Automation deals in
Business process management. Our view is that Zensar is trying to use the
Automation to chase new deal wins in IMS and BPM services (Similar strategy has
yielded good results at Hexaware).
Focus on large deal wins: Zensar has appointed Mr Sandeep Kishore as the
MD&CEO effective January 2016. He was the erstwhile head of HCL Tech’s
global Life sciences, Healthcare and the Public services verticals. Under the
leadership of Mr Sandeep, Zensar has constituted a large deal team with an aim
to chase deals with Total Contract Value (TCV) of US$25mn and above. Mr
Sandeep has also beefed up the senior management team over the past one
year with new recruits which include Mr Sanjeev Malik, Mr Ullas Nambiar and
Mr Malay Verma. Deal pipeline has also shown significant acceleration over the
past four quarters. We expect improved conversion by FY19E and Zensar’s
revenue growth to converge with peers in the sector by FY19E.
Opportunity to tap Apax portfolio companies: In October 2015, Private equity
(PE) firm Apax Partners acquired a 23% stake in Zensar from Electra Private
Equity Plc at Rs834/sh (Rs8.59bn paid for this stake). We believe that Apax’s
strong parentage with over US$40bn portfolio companies could enable Zensar
tap business opportunities in these clients. We believe that under the leadership
of Mr Sandeep Kishore, Zensar has been re-shaping its business portfolio and
improving the quality of client engagements and deal wins. We believe worst is
behind and see scope for turnaround in revenue growth and margin from FY19E
onwards. Valuations are reasonable at 13.2x FY19E EPS. Initiate with BUY and TP
of Rs1000/sh (13.5x Sep19E EPS).
Zensar Technologies
January 08, 2018 5
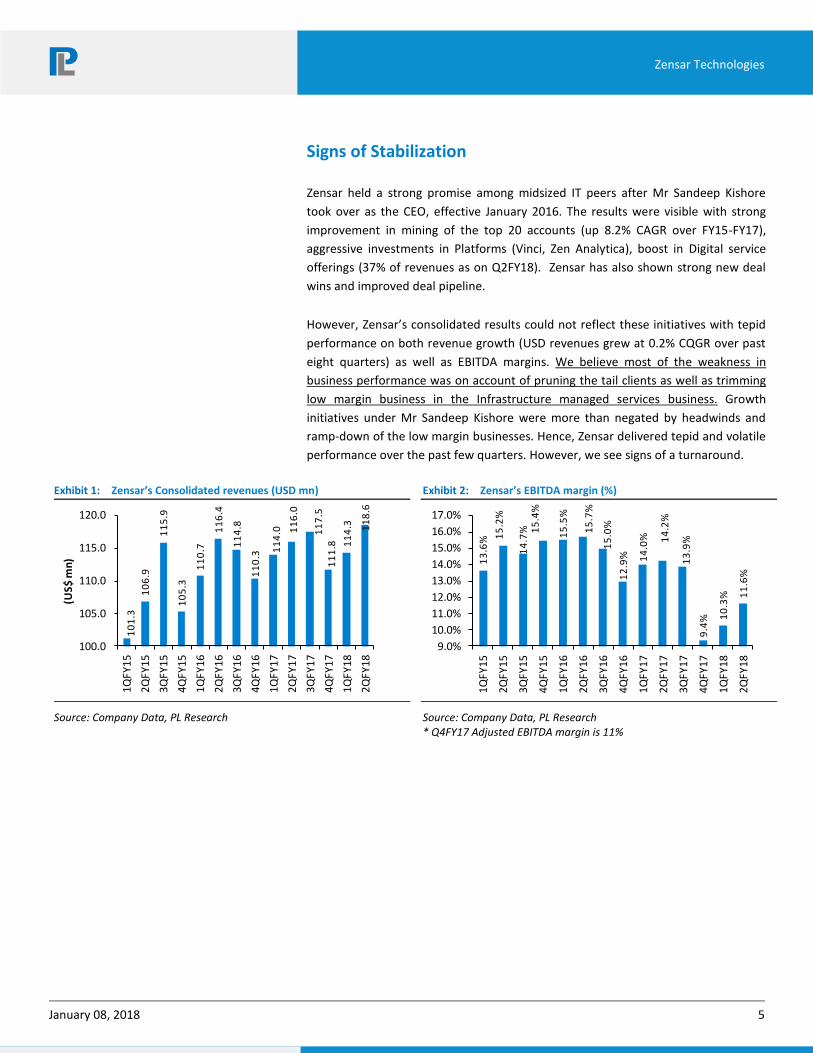
Signs of Stabilization
Zensar held a strong promise among midsized IT peers after Mr Sandeep Kishore
took over as the CEO, effective January 2016. The results were visible with strong
improvement in mining of the top 20 accounts (up 8.2% CAGR over FY15-FY17),
aggressive investments in Platforms (Vinci, Zen Analytica), boost in Digital service
offerings (37% of revenues as on Q2FY18). Zensar has also shown strong new deal
wins and improved deal pipeline.
However, Zensar’s consolidated results could not reflect these initiatives with tepid
performance on both revenue growth (USD revenues grew at 0.2% CQGR over past
eight quarters) as well as EBITDA margins. We believe most of the weakness in
business performance was on account of pruning the tail clients as well as trimming
low margin business in the Infrastructure managed services business. Growth
initiatives under Mr Sandeep Kishore were more than negated by headwinds and
ramp-down of the low margin businesses. Hence, Zensar delivered tepid and volatile
performance over the past few quarters. However, we see signs of a turnaround.
Exhibit 1: Zensar’s Consolidated revenues (USD mn)
10
1.3
10
6.9
11
5.9
10
5.3
11
0.7
11
6.4
11
4.8
11
0.3
11
4.0 1
16
.0
11
7.5
11
1.8 1
14
.3 11
8.6
100.0
105.0
110.0
115.0
120.0
1Q
FY
15
2Q
FY
15
3Q
FY
15
4Q
FY
15
1Q
FY
16
2Q
FY
16
3Q
FY
16
4Q
FY
16
1Q
FY
17
2Q
FY
17
3Q
FY
17
4Q
FY
17
1Q
FY
18
2Q
FY
18
(US
$ m
n)
Source: Company Data, PL Research
Exhibit 2: Zensar’s EBITDA margin (%) 1
3.6
% 15
.2%
14
.7% 1
5.4
%
15
.5%
15
.7%
15
.0%
12
.9% 14
.0% 14
.2%
13
.9%
9.4
% 10
.3% 1
1.6
%
9.0%
10.0%
11.0%
12.0%
13.0%
14.0%
15.0%
16.0%
17.0%
1Q
FY
15
2Q
FY
15
3Q
FY
15
4Q
FY
15
1Q
FY
16
2Q
FY
16
3Q
FY
16
4Q
FY
16
1Q
FY
17
2Q
FY
17
3Q
FY
17
4Q
FY
17
1Q
FY
18
2Q
FY
18
Source: Company Data, PL Research * Q4FY17 Adjusted EBITDA margin is 11%

Zensar Technologies
January 08, 2018 6
Management indicated that pruning of the tail accounts has reached its fag end. Our
view is that the growth from new deal wins and traction in Digital would be able to
more than offset any leakage in traditional business from hereon. Hence, while FY18
could be a year of transition, FY19E could see a turnaround in performance. We
Initiate coverage with BUY.
Exhibit 3: Zensar’s Digital revenues v/s Legacy revenues (USD mn)
376331 322
54122
137
0
100
200
300
400
FY15 FY16 FY17
Legacy revenues Digital revenues
Source: Company Data, PL Research
Exhibit 4: Zensar’s EBITDA and PAT (USD mn)
6467
59
4347
37
20
30
40
50
60
70
FY15 FY16 FY17
EBITDA PAT
Source: Company Data, PL Research

Zensar Technologies
January 08, 2018 7
Investment Thesis
Strong competencies in Digital to drive client stickiness and wins
Digital currently accounts for 36.8% of total revenues for Zensar as on Q2FY18
(27.8% of revenues as on Q2FY17). Digital Segment’s USD revenues have grown at
7% CQGR over the past five quarters aided by organic growth as well as
acquisitions (v/s overall company revenues which grew by 0.8% CQGR). For FY17,
revenues from Digital have grown at 11.6% YoY. However, company’s consolidated
USD revenues grew modestly by 1.5% YoY owing to pruning of non-profitable
business.
Zensar includes SMAC (Social Media, Analytics, Mobility, and Cloud), IoT, Security
and Digital Commerce in its Digital segment revenues. As per the management,
Digital Commerce accounts to ~65% of the Digital Revenues, while the remaining
35% of revenues from Digital would include SMAC, IoT and Cloud. Within Digital
Commerce, Zensar has a strong competency in Oracle e-Commerce and Magneto
(which includes B2C or B2B). Zensar is rated by Gartner as the Digital Commerce
Service Provider for 2016. Within the sub-segments of the SMAC, Zensar has focus in
seven areas which include Cloud, Customer Design Experience, Big Data analytics,
Digital Marketing Experience, Cyber security, Commerce, Industrial IoT.
Exhibit 5: Zensar’s digital offerings across competencies
Competency Nature Of Services
Customer/ Design Experience UX, CXM, AR, Wearables, Proprietary Experience Platform
Cloud SaaS, IaaS, PaaS, Cloud Migration and Integration
Big Data and Analytics Data Wrangling, Analytics and Visualization
Digital Marketing Services Web , Data , Marketing and Social apps
Commerce Omni Channel Experience
Cyber security Threat and Vulnerability Management
IoT/Industrial Internet Extensive Domain Expertise in Discrete Management
Source: Company Data, PL Research
Zensar has a strong competency in targeting and addressing the Chief Marketing
Officer (CMO) spends in Digital.
“So if you look at our definition of digital we include SMAC; IOT and security that is
what we cover apart from Commerce and if you would have noticed large part of
digital revenues is around Commerce, which it is digital commerce whether it is B2C
or B2B and bulk of our revenue growth is largely driven around commerce.” Zensar’s
CEO in Q4FY16 concall.

Zensar Technologies
January 08, 2018 8
Zensar addresses the full stack of the Digital value chain which include Digital agility
(front-end, analytics, customer experience, and user interface), Digital cross-over
(application modernization, infrastructure management and cloud migration, cyber
security, commerce interface) as well as core IT systems. Zensar aims to tap the
existing top 20 clients (56% of total revenues), which currently have massive
investment in digital initiatives in these three buckets. Management guided that 80%
of the top 50 clients have been covered with at least one digital solution.
Exhibit 6: Deals won by Zensar in Digital Services
Client Nature of Deal
US based Clothing and accessories retailer Development of a global unified commerce platform
America’s leading flower and gift e-tailor Mobile Control and Automation development
America’s leading fashion retailer Digital Commerce rollout using Next Gen Service oriented front end architecture
A South African Fund Administration Robotic Process Automation using Zen Bots
American Departmental Store Implementation of Next Generation Commerce Platform
Source: Company Data, PL Research
“We are investing heavily on client partners as well as delivery leadership onsite just
to make sure that in any of the digital transformation conversations, which comes up
we are right there working with the customer to make sure that we do not miss any
heartbeat” Zensar CEO on mining clients for the Digital
Zensar has also strengthened its Digital Practice with acquisitions. Zensar acquired
FoolProof in November 2016 with an intent to further strengthen CX/UX practice.
FoolProof is a UK headquartered company working in the Customer Experience/
User Experience space. The company provides consulting and design services to
global corporations in defining and managing user experience for their products and
services. FP’s Experience Design capabilities in the UK enable Zensar to provide end-
to-end Digital services for the CMO organizations.
Exhibit 7: User-Interface designed by Zensar
Source: Company Data, PL Research

Zensar Technologies
January 08, 2018 9
Full End-to-End offering for e-Commerce transformation: Zensar enjoys strong
competency in the B2C commerce. While Oracle ATG expertise has aided in
Transaction Processing for e-Commerce, Foolproof’s acquisition has aided in Front
End User Interface design. Zensar has also acquired Keystone to address the
Fulfilment services. Hence, Zensar is now positioned to address the complete value
chain in Retail eCommerce. Zensar expects its competency in Digital to enable a key
factor for winning deals. Zensar also aims to win more integrated deals in which
revenues from cross-over Integration opportunities would be large.
Exhibit 8: Zensar’s ability to tap the entire Digital Value Chain
Source: Company Data, PL Research
Apart from Service offerings, Zensar also followed the Platform-centric approach to
boost its Digital Portfolio. Over the past one and half year, Zensar has substantially
invested in Automation Platforms (Vinci), Digital solutions ( Zen Analytica) as well as
RPA solutions. We believe that these initiatives will aid non-linearity into the
revenue model and also boost revenue productivity.
Exhibit 9: Digital platforms of Zensar Technologies
Source: Company Data, PL Research
Traditional Stack
l Custom applications and Testing
l Enterprise applications
l Infrastructure management services
Cross-Over Stack
l Next Gen End User Engagements
l Legacy Modernization
l Hybrid IT
Digital Stack
l Artificial Intelligence
l Bots
l Augmented Reality
l Security
l Internet of Things
l Social Mobile, Commerce and Cloud

Zensar Technologies
January 08, 2018 10
Focused approach with strength in Manufacturing and Retail
As with mid-sized IT vendors, Zensar has narrowed its focus to few key verticals
which include Manufacturing, Retail and Financial Services. With Manufacturing,
Zensar indicated that the sub-vertical break-up would be Hitech (60% of
manufacturing vertical revenues), Industrial (30% of revenues) and Automotive (10%
of revenues). The largest client accounts to 25% of the company’s total revenues and
falls under the Manufacturing Vertical (implies half of Manufacturing vertical
revenues is derived from one client). Zensar guided that Manufacturing vertical
revenues are predominantly from North American clients. Zensar also has B2B
platform-based offerings in the Manufacturing vertical (Shop floor to Top Floor). This
B2B platform uses IOT data and combines it with manufacturing systems and ERP to
produce customized dashboards for clients. Various solutions for Manufacturing
vertical include Zensar Lean Warehousing Solution, Smart Manufacturing, and Digital
Factory etc.
Zensar gets more than half its revenue from manufacturing and its expertise and
knowledge of the industry's priorities is evident in the service offerings available. We
find they are particularly strong in the supply chain domain and in the high tech
segments of manufacturing. -Bob Parker Group Vice President, Research IDC
Manufacturing and Retail Insights at IDC
Retail and Consumer Services has been the strongest growing vertical for Zensar
delivering 51% CAGR (FY13-FY17). This is led by robust traction for its e-Commerce
implementations as well as inorganic initiatives. Zensar continues to win slew of
deals in Retail over the past few quarters led by strong competency in Digital. Zensar
is focused in e-Commerce segment in Retail and hence is not impacted by the
challenges being faced in the traditional Retail Industry business.
Within BFSI vertical, Zensar’s also derives a significant revenue from South Africa.
Zensar is working on providing Robotic process automation solutions for clients in
Banking vertical in South Africa. With Insurance, Zensar is predominately focused on
US and UK. We believe that Zensar’s focus on BFSI in developed markets is limited
considering the late entry. Management indicated that it is looking for acquisitions
to boost its offering in BFS and Insurance vertical for the developed markets.
Exhibit 10: Zensar’s Revenue mix by vertical (%)
FY13 FY14 FY15 FY16 FY17 2QFY18
Manufacturing 67.4 64.1 60.2 53.8 52.6 48.7
Retail and Consumer Services 5.7 8.5 15.3 21.6 25.3 28.9
Financial Services 22.0 22.8 20.6 18.9 18.2 19.2
Emerging 4.9 4.6 3.8 5.7 3.8 3.2
Source: Company Data, PL Research* Acquisitions also aided in strong growth in Retail.

Zensar Technologies
January 08, 2018 11
We analyse the vertical-wise strengths of Zensar to analyse its positioning.
Exhibit 11: Vertical wise strengths of Zensar
Vertical Strength
Retails This is the vertical of strength owing to Zensar’s Competency in e-Commerce. Recent acquisitions have also strengthened this vertical. Most the new deal wins are being won in this vertical.
Manufacturing Half of this vertical’s revenues are derived from one account (which is also the largest client of Zensar). Zensar has select areas of competency in ERP with special focus of Hitech and Discrete Manufacturing clients.
Financial Services
Within this vertical, ~40% of revenues are derived from Africa (Zensar has four of the Top 5 South African Banks as its accounts). Within Developed Markets, Zensar is strong in Insurance with few accounts contributing to lion’s share of revenues. We believe that Zensar needs to do acquisitions to tap BFSI clients in developed markets.
Source: Company Data, PL Research
Zensar’s strength in developed market BFSI is limited in our view. We believe
company is trying to penetrate this area predominantly through deals focused on
horizontals (Robotic process Automation and IMS).
Large Deal Team replenished, focus could be on Horizontal led deals
Zensar has revamped its Sales and Marketing function with several senior recruits
over the past one year. Our view is that Zensar is well placed in the Retail vertical
owing to broad-based competency and offerings in e-commerce portfolio. However,
Zensar‘s domain strength and client access could remain limited in BFSI vertical in
the developed markets. Hence, the company is chasing deals by focussing on
Horizontals (RPA in BPO and Automation in IMS).
Exhibit 12: New hires by Zensar Technologies
Person Hired Role in Zensar Earlier Role Date of joining
Mr Sanjeev Malik Sr Vice President – Large Deals Team Head Wipro Consulting January 2017
Mr Ullas Nambiar Head of Zensar Digital Labs Myntra, EMC November 2016
Mr Malay Verma Executive Vice president – Head of US Sales Predominantly with Wipro as the Business Head December 2016
Source: Company Data, PL Research
Exhibit 13: Digital v/s Traditional service wins
Digital Services wins Traditional Services wins
Digital transformation for Europe Auto insurance Mobile solutions for American Multinational finance services corporation
App cloud migration & management for leading US Hi-tech manufacturing company
Application management deal with top UK department store
Omni channel implementation for leading US clothing and accessories retailer
Application development and support for leading industrial manufacturing company is US
RPA for South Africa’s leading financial services company Oracle deal with Japanese Multinational IT equipment & services company
Digital testing services for leading online/Mobile gaining companies
IMS cloud deal with leading Airlines in US
Source: Company Data, PL Research

Zensar Technologies
January 08, 2018 12
Focused strategy to drive growth momentum
A lion’s share of Zensar’s revenues is derived from developed markets (North
America). Among Emerging market Geographies, Zensar has a strong footprint in
South Africa in which it has a strong base among financial services customers. South
Africa has been a growth engine and Zensar has top 5 Banking, Insurance companies
in South Africa as its customers. The company is also foraying into other areas which
include mining, retail, manufacturing and government in Africa.
Among service lines, Zensar offerings spans across Applications, IMS and Digital
Enterprise. IMS revenues have seen a moderation in proportion as the company has
been reducing its low margin business in this portfolio.
Exhibit 14: Zensar’s focused vertical and geographic approach
Source: Company Data, PL Research
Exhibit 15: Zensar’s Revenue mix by Geography (%)
FY13 FY14 FY15 FY16 FY17 2QFY18
US 72.0 75.0 76.1 77.1 74.5 72.0
Europe 9.0 11.0 10.2 9.9 11.5 14.2
Africa 9.0 9.0 8.2 8.1 8.7 9.9
ROW 10.0 5.0 5.5 4.8 5.2 3.9
Source: Company Data, PL Research
Exhibit 16: Zensar’s Revenue mix by Service line (%)
FY13 FY14 FY15 FY16 FY17 2QFY18
Application Management Services 66.8 76.0 72.7 76.0 77.8 83.1
Infrastructure Management Services(a+b) 33.5 24.0 27.3 24.0 22.2 16.9
a) Maintenance 15.3 13.0 10.5 8.3 7.2 5.6
b) Services 18.2 11.0 16.8 15.7 15.0 11.3
Source: Company Data, PL Research

Zensar Technologies
January 08, 2018 13
Within its focused verticals, Zensar also develops IP-based solutions which offer
scope for non-linearity for the company.
Exhibit 17: Zensar solutions and IP-led offerings
Source: Company Data, PL Research
Zensar is well rated by consulting firms like Zinnov and Everest in its chosen area of
expertise. Some of the leading accolades of the company include as mentioned
below.
Exhibit 18: Zensar’s Ratings by consulting firms
Consulting Firm Rating for Zensar
Gartner A Challenger in Gartner's Magic Quadrant, for Oracle Application Services, North America
Gartner A Niche Player in Gartner’s Magic Quadrant for Managed Mobility Services, Worldwide
Gartner A Niche Player in Gartner’s Magic Quadrant for Data Center Outsourcing and Infrastructure
Forrester A Strong Performer in Forrester Wave - Application Outsourcing Capabilities Of Midsize Offshore Vendors, 2016
Zinnov A Niche and Established service provider in Zinnov Zones - Digital in Retail 2016
Everest An Aspirant in Everest Group’s Insurance AO PEAK Matrix 2016
Source: Company Data, PL Research
Exhibit 19: Offerings by Zensar
Client Offering
Leading luxury fashion retailer Commerce solution from Zensar generated a 91% increase in online revenue and 60% increase in order inflow.
A hi-tech and Manufacturing Company Hybrid IT solution comprising the development of Hybrid infrastructure across premises and public Cloud generated a 40% reduction in IT operation costs.
A leading Online Retailer Customer Experience solution for helped support 10mn online transactions during the peak season
A leading Insurance Company Automation solution generated a 60% reduction in test cycles through automation and improving multi-country time-to-market by 30%.
Source: Company Data, PL Research

Zensar Technologies
January 08, 2018 14
Strong expertise in Oracle offerings remains the key proposition
Zensar enjoys successful and long standing technology partnerships globally with
industry leading OEMs like Oracle, Microsoft, SAP and SFDC. Zensar’s Oracle
expertise and Platinum partnership enables the company to implement industry
focused solutions with visible transformation in the client's business. Zensar’s
strength in the Oracle technology space is enhanced with over 3100 experts. Zensar
derives 33% of revenues from the Oracle Ecosystem and company has complete
Portfolio of services in the Oracle Suite. Zensar is making a strong bet on Oracle
Cloud SaaS and PaaS solutions.
“We are Oracle Platinum Partners and have more than 3100 trained Oracle
consultants across global locations. Zensar's Oracle practice delivers Oracle
enterprise and digital commerce solutions to retailers and manufacturers globally.
Our range of Oracle expertise encompasses the entire range of Oracle offerings
and solutions. We have more than 900 successful implementations, including
upgrades and global rollouts” Zensar CEO in concall
Exhibit 20: Zensar positioned in Magic Quadrant for Oracle
Source: Company Data, PL Research

Zensar Technologies
January 08, 2018 15
Apart from Oracle, Zensar continues to demonstrate industry knowledge in SAP and
has a Gold Partnership status. Zensar has successful strides in the area of SAP
deployments and company has preconfigured solutions certified by SAP for select
verticals like Dairy, Pharma, Chemical, Retail and Life Sciences. Zensar has over 400
experienced SAP professionals globally. Zensar has complete SAP lifecycle service
capabilities across the portfolio of SAP solutions covering Applications, Analytics and
Mobility capabilities.
Professional Access Acquisition strengthens Retail Vertical
In August 2014, Zensar Technologies acquired Professional Access, a US based e-
commerce Company which is one of the largest Oracle ATG and Endeca partners in
the world. Professional Access worked with several large and mid-sized retailers in
these geographies to build and implement their e-Commerce strategies. Professional
Access had ~800 employees across USA and India. At the time of acquisition,
Professional access had revenues of US$56mn for FY16 and delivered a 21% CAGR
(FY14-FY16). The acquisition has further strengthened Zensar’s dominant position in
Oracle e-Commerce space. Professional access’ acquisition has strengthened
Zensar’s Retail vertical as well as Oracle-Based offerings. e-Commerce Sales are
growing at 2x the growth of Global Retail Sales. ATG is the e-commerce platform of
choice for Retail vertical with the highest market share of 20% among online
retailers. However, Oracle has now discontinued its support for ATG and hence,
Zensar is now focused on Oracle Commerce Cloud. Professional access’ acquisition
was also one of the drivers which enabled Zensar deliver strong growth in its Retail
vertical over FY14-FY17.
Exhibit 21: Professional access’ acquisition strengthens Zensar Oracle Portfolio
Source: Company Data, PL Research

Zensar Technologies
January 08, 2018 16
Exhibit 22: Oracle’s portfolio offerings strengthened with PA Acquisition
Source: Company Data, PL Research
Renewed Focus on IMS with a focused strategy
Zensar’s IMS business has declined over FY13-FY17 owing to ramp-down of low
margin products business as well as scale-down of MVS business. IMS currently
accounts to 17% of total revenues as on Q2FY18 (v/s 23% as on Q2FY17). Within
IMS, Zensar has two segments (Services and MVS). The company has built a new
team to chase large deals wins in IMS vertical.
Zensar has scaled the IMS practice with the acquisition of Akibia in November 2010.
Zensar’s acquisition of Akibia strengthened its position in the fast growing
infrastructure management and information security space by combining Zensar’s
Remote Infrastructure Management (RIM) offshore services for global clients with
Akibia’s United States and European data center practice. At the time of acquisition,
Akibia had annual revenues of ~US$100mn. However, Zensar has gradually pruned
its low margin product business in Akibia. This led to a weak performance in the IMS
business over FY13-FY17.
The IMS business has two major components:
Multi-Vendor Support (MVS) (~5.6% of total revenues as on Q2FY18): MVS
allows organizations to consolidate their hardware support and maintenance
under one service contract with one provider, irrespective of the OEM for
hardware. Zensar is one of the top MVS providers worldwide and only one of
three headquartered in India who renders this service, making it a one-stop
shop for all infrastructure management needs. We see only modest growth in
this segment over FY18-FY20E.

Zensar Technologies
January 08, 2018 17
Exhibit 23: MVS business of Zensar Technologies
Source: Company Data, PL Research
IMS Services (Accounts for 11.3% of overall revenues): Zensar is well-
positioned to deliver to its clients a wider range of infrastructure services.
Zensar indicated that it is seeing strong traction in Cloud migration projects
within the IMS segment.
Exhibit 24: Proportion of revenues from IMS
IMS as a % of Total Revenues FY13 FY14 FY15 FY16 FY17 2QFY18
Infrastructure Management Services (a+b) 33.5 24.0 27.3 24.0 22.2 16.9
a) Maintenance (MVS) 15.3 13.0 10.5 8.3 7.2 5.6
b) Services 18.2 11.0 16.8 15.7 15.0 11.3
Source: Company Data, PL Research
Exhibit 25: Constant currency growth by services (YoY %)
CC growth by Service offerings (YoY % ) FY13 FY14 FY15 FY16 FY17
Infrastructure Management Services (4) 10 (6) (7.4) (6.1)
Maintenance (MVS) (4) NMF (9) (17.2) 11.6
Services (2) NMF (4) (1.3) (3.2)
Source: Company Data, PL Research
Focus on Automation in IMS: Zensar has launched Vinci, a platform powered by
automation utilizing machine learning to bring together the operational and
transformational activities. Zensar indicated that Enterprises will be able to leverage
the solution to impact substantial reduction in the OPEX cost.

Zensar Technologies
January 08, 2018 18
“We launched Vinci in Q3 with clear differentiating factors through Autonomics and
hyper orchestration layer for cloud as a proposition. We have taken it to our existing
customers just to make sure that we first test it out with them. We are currently
deploying it with half a dozen of our existing customers in the US. We have of course
also now taken this as a wedge and lead opening the door with all the net new
accounts.
The business benefits that we have seen in the existing customer is that it actually
automates to the extent of close to 45% to 50% on the Level 1, Level 2 of the
standard operating environment in a traditional infrastructure data center run”
Zensar CEO in Q3FY17 concall.
Apart from IMS, Zensar Technologies has its focus on automation initiatives to drive
growth in the BPM service line. Zensar has implemented Bots for the Business
Process service in select clients which include Silica Software Solutions, a leading
technology and service provider in the Financial Services industry in South Africa.
Zensar has won a few deals in RPA which include Two Sisters in UK in which they are
automating one back-end financial processes. We believe that renewed thrust on
IMS and BPM with Automation and new Sales team will enable the company gain
scale in both these service lines.
Exhibit 26: Zensar Bots drive operational efficiency
Source: Company Data, PL Research
Scope to tap business from Apax Group Companies
Apax Partners is an independent global partnership focused solely on long-term
investment in growth companies. The funds invest in four sectors: Tech & Telco,
Services, Healthcare, and Consumer. The portfolio companies of APAX employed in
excess of 200,000 people and generated combined revenues of US$29bn. We note
that Apax Group has a successful track record in Tech investments which include
IGate. The current Technology portfolio of Apax Includes Duck Creek Technologies,
Global Logic, ThoughtWorks, Evry ASA, ECI Software Solution, Sophos and Zensar
Technologies. We believe that strong PE backing is also a positive for Zensar as it can
also enable tap business from Apax Portfolio companies.

Zensar Technologies
January 08, 2018 19
Strategic initiatives under the new leadership
Launched a large deal team: A new large-deal team has been formed to focus
exclusively on US$25mn TCV deals. Company has hired over four senior
resources to drive this large deal team. Apart from this, Zensar has also hired
various executives to strengthen the Digital Business as well as Sales function.
Exhibit 27: New hires by Zensar
Person Hired Role in Zensar Earlier Role Date of joining
Mr Sanjeev Malik Sr Vice President – Large Deals Team Head Wipro Consulting January 2017
Mr Ullas Nambiar Head of Zensar Digital Labs Myntra, EMC November 2016
Mr Malay Verma Executive Vice president – Head of US Sales Predominantly with Wipro as the Business Head December 2016
Source: Company Data, PL Research
Twelve focus areas for growth: Zensar has identified 12 high growth focus areas
which include big data & analytics, cloud (SaaS and PaaS), user experience and
customer experience (UX and CX), enterprise mobility, commerce (B2C and
B2B), Internet of Things and analytics- driven business process management.
Launch of Internal Communication Platform: Apart from focus on customers,
Zensar launched apps for in-house efficiency. Zenverse (a communication
platform) allows the company head to have a direct conversation with any
employee.
3*1 Sales Model: The management has identified 32 key accounts identified
for driving top-line growth with focus on multiservice deals. For these
accounts, Zensar has a 3-in-a-box model for each account. This indicates
each account would have a Sales Manager, a Delivery Manager and a Digital
Evangelist.
Can Client Concentration lead to Revenue Volatility?
Zensar derives 25% of total revenues from the top account (A leading US networking
equipment major). Zensar works on both Traditional and new Digital Initiatives in
this account. This account has been a long standing customer for Zensar over the
past 17 years. Management indicated that the entire B2B sales of this client are run
on the platform maintained by Zensar.
“So, in our top account, it has never declined, it has not declined this year as well, so
there is a single-digit growth in that account. The big difference there is a change in
portfolio, we are moving from the traditional legacy business to doing a lot more
digital. And therefore, there has been a shift in our onsite offshore ratio in our
account. So when you look at the overall Zensar onsite offshore ratio there has been
some shift in the top account as well. But that account continues to grow and our
proportion of business there is moving favourably towards digital rather than
traditional” Zensar CEO in Q4FY17 concall.

Zensar Technologies
January 08, 2018 20
Exhibit 28: Proportion of Revenues from top clients
35%38% 37%
39% 38% 38%35% 35%
43%46% 46%
49%45% 46%
43% 44%
52%56% 56%
59%56% 56%
55%56%
30%
35%
40%
45%
50%
55%
60%
65%
3QFY16 4QFY16 1QFY17 2QFY17 3QFY17 4QFY17 1QFY18 2QFY18
Revenues From Top 5 Clients Revenues from Top 10 Clients
Revenues from Top 20 Clients
Source: Company Data, PL Research
Zensar derives 44% of revenues from top 10 clients and 56% of revenues from top
20 Clients. Management guided that 75% of the company’s customers belong to
Global 1000 and 70% of Zensar revenues have been derived from customers with 10
+ years of engagement. Zensar also indicated that 50% of relationships with clients
comprise of multi-services.

Zensar Technologies
January 08, 2018 21
Earnings and Financial Outlook
Zensar has seen phenomenal growth in FY11/FY12 aided by acquisition of Akibia.
Acquisition of Professional Access (August 2014) aided higher growth in FY15.
Professional Access strengthened the ecommerce and Retail vertical with Oracle
ATG competency and aided strong scale up. Zensar’s USD revenues have grown at
4.3% CAGR (FY13-FY17). Traction in Retail and Emerging markets like Africa has
aided growth over this period. However, softness in IMS was the main drag which
led to overall tepid revenues.
Zensar’s revenue growth remained tepid for FY17 owing to pruning of tail accounts
and moderation in IMS business (led by trimming low margin business). Company’s
revenues grew by 1.5% in USD and 3.5% in constant currency in FY17 (Organic USD
revenues would have been flat in FY17). We expect USD revenues to grow at 7%
CAGR (FY17-FY19E) with strong revenue momentum expected in FY19E. We model
Zensar’s USD revenues to grow at 3.7/10.3/11% for FY18/FY19E/FY20E.
Exhibit 29: USD Revenues (USD mn) and revenue growth (%) (RHS)
134 196 195 201
251
372 389 383 430 454 460 477
527 584
38.6%
45.5%
-0.3%3.0%
24.9%
48.2%
4.6%
-1.5%
12.3%
5.5%1.5%
3.7%10.3%
10.9%
-10.0%
0.0%
10.0%
20.0%
30.0%
40.0%
50.0%
60.0%
100
200
300
400
500
600
700
FY07
FY08
FY09
FY10
FY11
FY12
FY13
FY14
FY15
FY16
FY17
FY18
E
FY19
E
FY20
E
(US$
mn)
USD Revenues (USD mn) Growth (RHS)
Source: Company Data, PL Research, Zensar’ growth in FY07, FY08, FY11 and FY12 were aided by inorganic initiatives.

Zensar Technologies
January 08, 2018 22
EBIDTA Margins likely to stabilise at 13-14% by FY19
Zensar’s margins have been relatively lower than midcap peers. Zensar’s EBITDA
margin stood at 12.6% for FY17 which is below peers like Hexaware/NIIT Tech
(17.0/16% respectively). Higher onsite effort and weaker revenue growth could be
the reason for lower margins. We believe that pick-up in growth and improving mix
shift of business can aid margin expansion over FY19/FY20E. We model Zensar’s
EBITDA margin at 11.6/13.3/14.3% for FY18/FY19E (v/s 12.6% in FY17). Improving
quality of business (lower proportion from low margin IMS business) would also be a
margin driver for the company.
Exhibit 30: EBITDA Margins and Average Rupee Dollar rate
17.8%
14.6%13.9%14.1%
15.3%14.7%
14.9%
12.6%11.6%
13.3%14.3%
40.0
45.0
50.0
55.0
60.0
65.0
8.0%
10.0%
12.0%
14.0%
16.0%
18.0%
20.0%
FY10
FY11
FY12
FY13
FY14
FY15
FY16
FY17
FY18
E
FY19
E
FY20
E
EBITDA Margins Average rate (USD vs INR)
Source: Company Data, PL Research
Exhibit 31: Quarterly EBITDA Margins and average rupee dollar rate
15.2%
14.7%15.4%15.5%
15.7%15.0%
12.9%14.0%14.2%13.9%
9.4%10.3%
11.6%
58.0
60.0
62.0
64.0
66.0
68.0
70.0
9.0%
11.0%
13.0%
15.0%
17.0%
2Q
FY
15
3Q
FY
15
4Q
FY
15
1Q
FY
16
2Q
FY
16
3Q
FY
16
4Q
FY
16
1Q
FY
17
2Q
FY
17
3Q
FY
17
4Q
FY
17
1Q
FY
18
2Q
FY
18
EBITDA Margins Average Exchange rate
Source: Company Data, PL Research
Most of the midcap IT companies have been suffering on the margin trajectory and
Zensar is no exception. However, recovery in growth and pruning of low margin
business should aid turnaround in margins for Zensar in FY19E.
Exhibit 32: EBITDA margin trajectory of mid-sized IT vendors
2QFY15 3QFY15 4QFY15 1QFY16 2QFY16 3QFY16 4QFY16 1QFY17 2QFY17 3QFY17 4QFY17 1QFY18 2QFY18
Average Rate ( USD v/s INR) 61.0 62.1 62.09 63.6 65.6 66.0 67.5 67.05 66.87 67.7 66.3 64.4 64.5
EBIDTA Margin (%)
Mindtree 19.8 20.5 19.5 17.6 18.5 17.7 17.0 14.7 12.5 13.4 14.2 11.1 11.6
Persistent 20.6 20.1 20.2 19.4 18.7 18.8 15.9 15.1 15.7 15.9 16.3 14.3 15.2
Hexaware 18.0 19.9 18.0 18.2 19.2 16.0 15.4 16.1 18.2 17.8 17.5 17.5 18.3
Cyient 16.1 16.3 12.3 12.7 15.1 14.1 13.0 13.2 13.9 13.2 13.3 12.8 14.3
Zensar 15.2 14.7 15.4 15.5 15.7 15.0 12.9 14.0 14.2 13.9 9.4 10.3 11.6
Mphasis* 14.3 14.5 14.6 14.0 14.7 14.0 15.5 15.7 15.2 14.4 14.0 12.2* 13.2
NIIT Tech* 12.5 13.0 14.6 15.5 17.2 17.9 18.3 14.4 15.0 15.2 15.7 13.5 14.7
Source: Company Data, PL Research * We presented adjusted EBIDTA margins of Mphasis and NIIT Tech as both these companies include hedge gains in topline.

Zensar Technologies
January 08, 2018 23
Zensar has high revenue per reported employee which is much higher than peers.
This is owing to the IMS Product business (Akibia portfolio) which is predominantly
onsite revenues. Zensar is also seeing higher traction in Digital Services which is
leading to mix shift in favour of onsite. We believe gradual shift in favour of offshore
could drive margins for the company.
Exhibit 33: Metrics of Mid-sized IT vendors
USD Revenue for FY18E (mn) Closing Headcount at end of
Q2FY18 Revenues per Reported
Employee per year (USD) Percentage of Revenues from
Onsite as on Q2FY18 (%)
KPIT Tech 563 11,946 47,099 55.1
Mindtree 837 16,910 49,497 57.6
Hexaware 600 13,488 44,484 65.4
Cyient 595 13,568 43,853 59.3
Zensar Technologies 479 8,414 56,929 66.0
Persistent Systems 481 9,246 51,992 NA
Source: Company Data, PL Research* Revenue per reported employee is calculated using FY18 annual revenues by 2QFY18 headcount
Exhibit 34: Onsite employees as a % total employees for Zensar
20.9%
18.9% 18.9%
19.4%
18.1%
18.6%
18.4%
18.6%
18.5%
18.9%
19.8%
21.1%21.5%
17.0%
18.0%
19.0%
20.0%
21.0%
22.0%
2Q
FY
15
3Q
FY
15
4Q
FY
15
1Q
FY
16
2Q
FY
16
3Q
FY
16
4Q
FY
16
1Q
FY
17
2Q
FY
17
3Q
FY
17
4Q
FY
17
1Q
FY
18
2Q
FY
18
Source: Company Data, PL Research
Exhibit 35: Revenue by Onsite delivery centers for Zensar (%)
67.0%
67.0%
65.0%
65.0%
63.0%
66.0%
63.7%
68.8%
66.2%
66.5%
66%
63%63%
60.0%
62.0%
64.0%
66.0%
68.0%
70.0%2
QF
Y1
5
3Q
FY
15
4Q
FY
15
1Q
FY
16
2Q
FY
16
3Q
FY
16
4Q
FY
16
1Q
FY
17
2Q
FY
17
3Q
FY
17
4Q
FY
17
1Q
FY
18
2Q
FY
18
Source: Company Data, PL Research

Zensar Technologies
January 08, 2018 24
Acquisition Strategy aims at boosting capabilities
Zensar acquisition strategy over the past few quarters were aimed at boosting the
Digital and vertical specific competencies. Both Keystone and FoolProof’s
acquisitions were aimed at strengthening the Digital capabilities and boosting
Zensar’s competence in the e-Commerce value. We believe that company might
continue to target acquisition in BFSI vertical in the developed markets to make
inroads into the vertical.
Exhibit 36: Acquisitions have aided in building competencies
Target Rationale Amount Spent Revenues of Target at time of acquisition (Annual)
Year of acquisition
KeyStone Strengthen eCommerce offering in Retail Vertical
USD20mn USD12.7mn March 2017
FoolProof Strengthen User interface NA USD12mn November 2016
Professional Access Strengthen Oracle ATG practice USD34mn USD38mn Aug-14
Akibia Strengthen IMS vertical USD66mn USD100mn Dec-10
Zensar Thought Digital Enhanced Oracle capabilities and added 120 experienced people
USD28mn USD27mn Feb-07
Zensar OBT Global Augment SAP capabilities (400 strong team of SAP professionals)
NA NA Dec-05
Source: Company Data, PL Research

Zensar Technologies
January 08, 2018 25
Valuation
We expect Zensar’s USD revenues to grow by 8.2% CAGR (FY17-20E). Improved deal
win rate under Mr Sandeep Kishore, continued traction in Retail & CPG vertical as
well as new deal wins on Horizontals (Robotic BPO and IMS) would be the key
growth drivers. We model EBITDA margin expansion to 11.6/13.3/14.3% for
FY18/FY19E/FY20E (v/s 12.6% for FY17). Margin expansion would be the key driver
for earnings growth and we model 15% CAGR over FY17-FY20E. Stock currently
trades at 13.2x FY19E EPS which is at 20% discount to Mindtree. Net cash on the
balance sheet stands at Rs3100mn (Rs 70/sh which implies 8% of Mcap). Initiate
coverage with BUY.
Exhibit 37: Zensar’s one-year forward P/E
8
11
14
17
20
23
De
c-1
4
Ma
r-1
5
Jun
-15
Se
p-1
5
De
c-1
5
Ma
r-1
6
Jun
-16
Se
p-1
6
De
c-1
6
Ma
r-1
7
Jun
-17
Se
p-1
7
De
c-1
7
P/E Mean Mean + Std Dev Mean - Std Dev
Source: Company Data, PL Research
Exhibit 38: Zensar v/s Mindtree discount/premium
-70.0%-60.0%-50.0%-40.0%-30.0%-20.0%-10.0%
0.0%10.0%20.0%30.0%
De
c/1
3
Ap
r/1
4
Au
g/1
4
De
c/1
4
Ap
r/1
5
Au
g/1
5
De
c/1
5
Ap
r/1
6
Au
g/1
6
De
c/1
6
Ap
r/1
7
Au
g/1
7
De
c/1
7
Source: Company Data, PL Research

Zensar Technologies
January 08, 2018 26
Company Profile
Brief profile of the company
Zensar is a leading digital solutions and technology services company that specializes
in partnering with global organizations across industries on their Digital
Transformation journey. The company has a complete technology services portfolio
which includes Applications, Infrastructure, Digital and Industry specific solutions
Lineage. Zensar is a part of the US$3bn RPG Enterprises and the US$40bn APAX
portfolio of companies. The company derives 75% of revenue from Global 1000
companies and 70% revenue from customers with 10+ years of engagement. Digital
business is 34% of Zensar’s revenue and has shown strong growth.
Exhibit 39: Business profile of the company
Source: Company Data, PL Research
Exhibit 40: Geography mix of Revenues (%)
Q3FY16 Q4FY16 Q1FY17 Q2FY17 Q3FY17 4QFY17 1QFY18 2QFY18
US 77.0 77.7 74.9 75.1 74.4 73.8 74.4 72.0
Europe 10.0 10.5 10.5 9.9 12.0 13.8 13.8 14.2
Africa 7.0 7.2 8.0 8.6 9.3 9.0 9.5 9.9
ROW 6.0 4.7 6.6 6.4 4.3 3.5 2.4 3.9
Source: Company Data, PL Research
Revenues
Vertical Mix
Manufacturing: 48.7
Retail/CPG:28.9
BFSI : 19.2
Others : 3.2
Geography Mix
North America: 74.4
Europe : 13.8
Africa : 9.5
Rest of the world: 2.4
Key Competitors
TCS
Infosys
Wipro
HCL Tech
Headcount
8,414
Client concentration as on
Q2FY18
Top 5- 35.3
Top 10- 43.6
Top 20- 56.1
Zensar Technologies
January 08, 2018 27
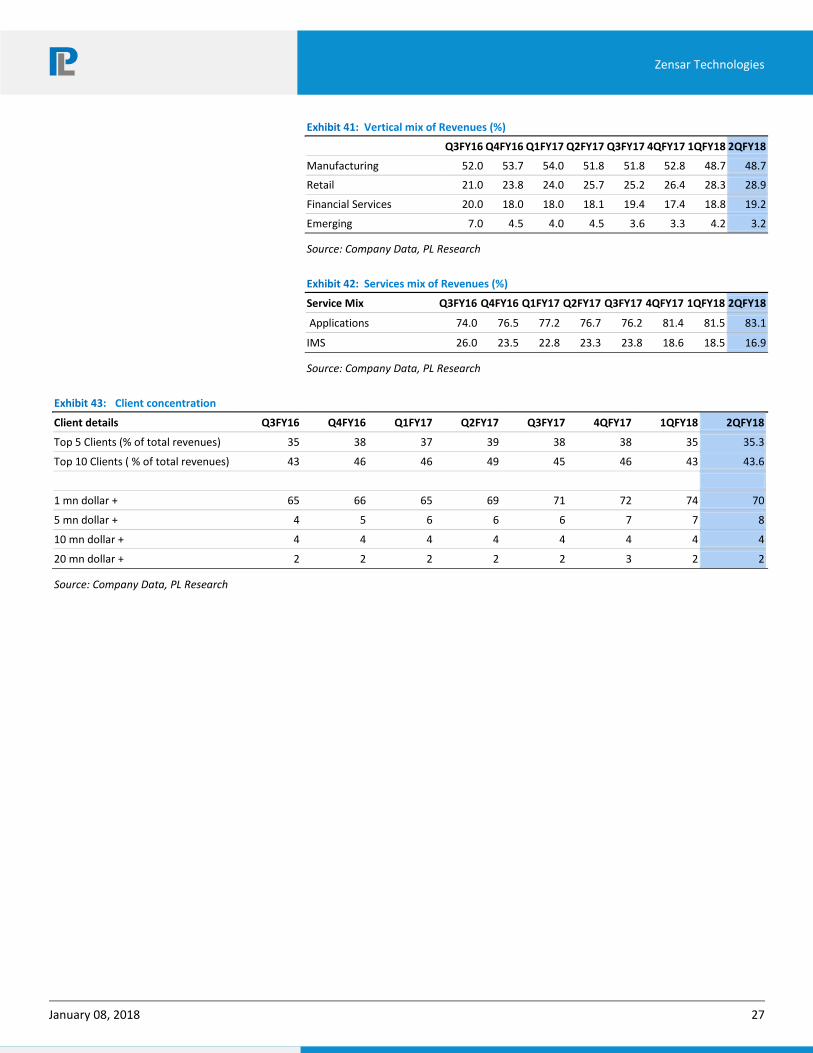
Exhibit 41: Vertical mix of Revenues (%)
Q3FY16 Q4FY16 Q1FY17 Q2FY17 Q3FY17 4QFY17 1QFY18 2QFY18
Manufacturing 52.0 53.7 54.0 51.8 51.8 52.8 48.7 48.7
Retail 21.0 23.8 24.0 25.7 25.2 26.4 28.3 28.9
Financial Services 20.0 18.0 18.0 18.1 19.4 17.4 18.8 19.2
Emerging 7.0 4.5 4.0 4.5 3.6 3.3 4.2 3.2
Source: Company Data, PL Research
Exhibit 42: Services mix of Revenues (%)
Service Mix Q3FY16 Q4FY16 Q1FY17 Q2FY17 Q3FY17 4QFY17 1QFY18 2QFY18
Applications 74.0 76.5 77.2 76.7 76.2 81.4 81.5 83.1
IMS 26.0 23.5 22.8 23.3 23.8 18.6 18.5 16.9
Source: Company Data, PL Research
Exhibit 43: Client concentration
Client details Q3FY16 Q4FY16 Q1FY17 Q2FY17 Q3FY17 4QFY17 1QFY18 2QFY18
Top 5 Clients (% of total revenues) 35 38 37 39 38 38 35 35.3
Top 10 Clients ( % of total revenues) 43 46 46 49 45 46 43 43.6
1 mn dollar + 65 66 65 69 71 72 74 70
5 mn dollar + 4 5 6 6 6 7 7 8
10 mn dollar + 4 4 4 4 4 4 4 4
20 mn dollar + 2 2 2 2 2 3 2 2
Source: Company Data, PL Research

Zensar Technologies
January 08, 2018 28
Exhibit 44: Consolidated Model sheet of Zensar
FY12 FY13 FY14 FY15 FY16 FY17 FY18E FY19E FY20E
USD Revenues 372 389 383 430 454 460 476 525 583
Growth (%) 48.2% 4.6% -1.5% 12.3% 5.5% 1.5% 3.7% 10.3% 11.0%
Organic Growth (%) 15.0% 0.0% 0.0% 4.2% 2.6% 0.0% -1.5% 10.3% 11.0%
Average Rate 48 55 61 61 66 67 65 65 64
Revenues (INR mn) 17,942 21,288 23,350 26,558 29,519 30,604 30,749 34,133 37,291
Growth (%) 55.6% 18.6% 9.7% 13.7% 11.1% 3.7% 0.5% 11.0% 9.3%
EBIDTA 2,490 3,003 3,582 3,917 4,388 3,867 3,563 4,527 5,317
EBIT 2,156 2,671 3,199 3,501 3,737 3,381 2,872 3,827 4,590
PAT 1,587 1,745 2,375 2,646 2,897 2,349 2,352 2,946 3,588
EBIDTA Margin (%) 13.9% 14.1% 15.3% 14.7% 14.9% 12.6% 11.6% 13.3% 14.3%
EBIT Margin (%) 12.0% 12.5% 13.7% 13.2% 12.7% 11.0% 9.3% 11.2% 12.3%
PAT margin (%)( 8.8% 8.2% 10.2% 10.0% 9.8% 7.7% 7.6% 8.6% 9.6%
EPS 36.2 39.3 53.4 59.3 64.2 51.8 52.1 65.3 79.5
EPS growth 20.9% 8.8% 35.7% 11.1% 8.2% -19.3% 0.7% 25.3% 21.8%
Dividend Payout Ratio ( Including Tax) 19.4% 23.2% 20.6% 21.9% 20.8% 27.2% 27.6% 24.4% 23.0%
DPS 7 8 10 11 12 12 12 13 15
Dividend Yield(%) 0.9% 1.0% 1.2% 1.3% 1.4% 1.4% 1.4% 1.5% 1.8%
ROE(%) 31.1 26.8 28.4 25.2 25.0 17.2 15.1 16.8 17.9
ROCE(%) 20.4 22.0 23.8 23.2 20.4 15.3 12.2 14.7 15.8
EPS 36.2 39.3 53.4 59.3 64.2 51.8 52.1 65.3 79.5
EPS growth (%) 20.9% 8.8% 35.7% 11.1% 8.2% -19.3% 0.7% 25.3% 21.8%
P/E 23.8 21.7 14.6 14.4 13.4 16.6 16.5 13.2 10.8
EV/EBIDTA 14.3 12.0 9.8 9.3 8.2 9.3 9.6 7.1 5.5
Consolidated Balance Sheet (Rs mn)
Networth 5,759 7,289 9,455 11,570 12,690 14,779 16,484 18,711 21,476
Net Cash 364 511 1,984 1,925 2,630 4,412 5,784 7,464 9,296
Net cash per share 8 12 45 43 58 98 128 165 206
Net cash as a % of mcap 1.0% 1.4% 5.4% 5.2% 6.7% 11.2% 14.7% 19.0% 23.7%
Consolidated Cash flows (Rs mn)
Cash Flow from Operations 1,735 1,060 2,094 3,206 2,549 3,073 2,733 2,653 2,959
Capex+ Acquisition (266) (336) (332) (2,451) (427) (958) (600) (600) (900)
Free cash Flow 1,469 725 1,762 755 2,122 2,115 2,133 2,053 2,059
FCF/EBIDTA 59.0% 24.1% 49.2% 19.3% 48.3% 54.7% 59.9% 45.4% 38.7%
Source: x, Company Data, PL Research
Zensar Technologies
January 08, 2018 29
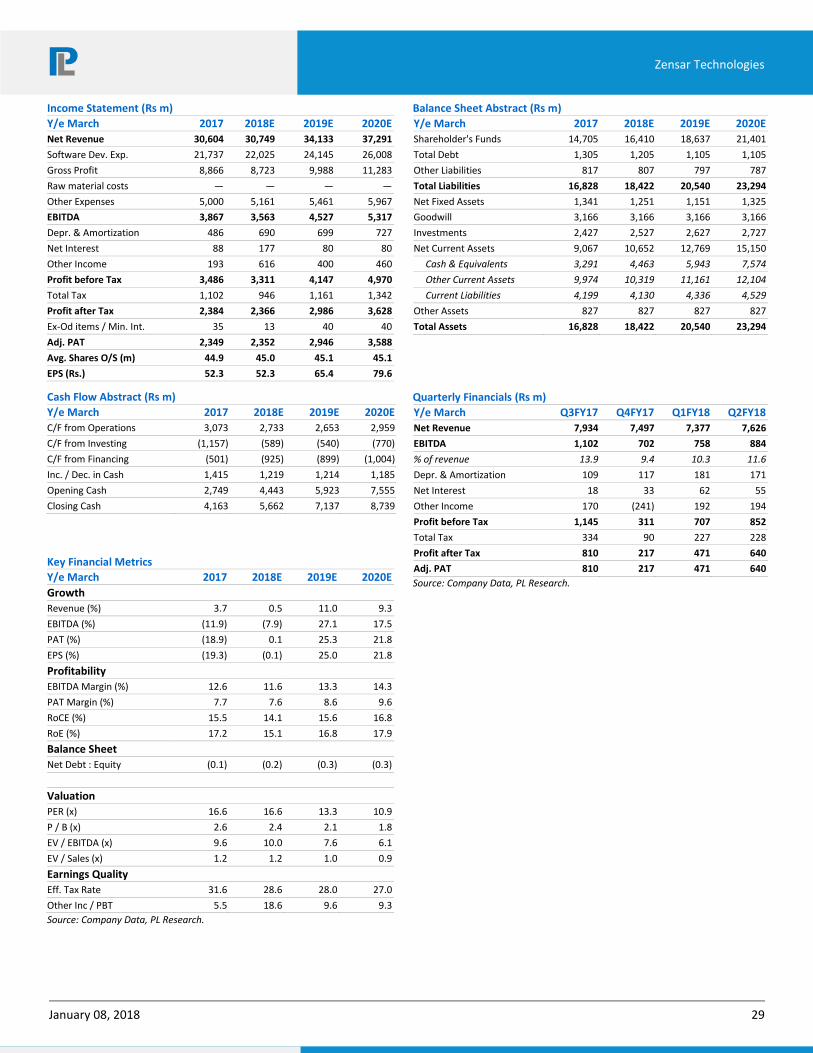
Income Statement (Rs m)
Y/e March 2017 2018E 2019E 2020E
Net Revenue 30,604 30,749 34,133 37,291
Software Dev. Exp. 21,737 22,025 24,145 26,008
Gross Profit 8,866 8,723 9,988 11,283
Raw material costs — — — —
Other Expenses 5,000 5,161 5,461 5,967
EBITDA 3,867 3,563 4,527 5,317
Depr. & Amortization 486 690 699 727
Net Interest 88 177 80 80
Other Income 193 616 400 460
Profit before Tax 3,486 3,311 4,147 4,970
Total Tax 1,102 946 1,161 1,342
Profit after Tax 2,384 2,366 2,986 3,628
Ex-Od items / Min. Int. 35 13 40 40
Adj. PAT 2,349 2,352 2,946 3,588
Avg. Shares O/S (m) 44.9 45.0 45.1 45.1
EPS (Rs.) 52.3 52.3 65.4 79.6
Cash Flow Abstract (Rs m)
Y/e March 2017 2018E 2019E 2020E
C/F from Operations 3,073 2,733 2,653 2,959
C/F from Investing (1,157) (589) (540) (770)
C/F from Financing (501) (925) (899) (1,004)
Inc. / Dec. in Cash 1,415 1,219 1,214 1,185
Opening Cash 2,749 4,443 5,923 7,555
Closing Cash 4,163 5,662 7,137 8,739
Key Financial Metrics
Y/e March 2017 2018E 2019E 2020E
Growth
Revenue (%) 3.7 0.5 11.0 9.3
EBITDA (%) (11.9) (7.9) 27.1 17.5
PAT (%) (18.9) 0.1 25.3 21.8
EPS (%) (19.3) (0.1) 25.0 21.8
Profitability
EBITDA Margin (%) 12.6 11.6 13.3 14.3
PAT Margin (%) 7.7 7.6 8.6 9.6
RoCE (%) 15.5 14.1 15.6 16.8
RoE (%) 17.2 15.1 16.8 17.9
Balance Sheet
Net Debt : Equity (0.1) (0.2) (0.3) (0.3)
Valuation
PER (x) 16.6 16.6 13.3 10.9
P / B (x) 2.6 2.4 2.1 1.8
EV / EBITDA (x) 9.6 10.0 7.6 6.1
EV / Sales (x) 1.2 1.2 1.0 0.9
Earnings Quality
Eff. Tax Rate 31.6 28.6 28.0 27.0
Other Inc / PBT 5.5 18.6 9.6 9.3
Source: Company Data, PL Research.
Balance Sheet Abstract (Rs m)
Y/e March 2017 2018E 2019E 2020E
Shareholder's Funds 14,705 16,410 18,637 21,401
Total Debt 1,305 1,205 1,105 1,105
Other Liabilities 817 807 797 787
Total Liabilities 16,828 18,422 20,540 23,294
Net Fixed Assets 1,341 1,251 1,151 1,325
Goodwill 3,166 3,166 3,166 3,166
Investments 2,427 2,527 2,627 2,727
Net Current Assets 9,067 10,652 12,769 15,150
Cash & Equivalents 3,291 4,463 5,943 7,574
Other Current Assets 9,974 10,319 11,161 12,104
Current Liabilities 4,199 4,130 4,336 4,529
Other Assets 827 827 827 827
Total Assets 16,828 18,422 20,540 23,294
Quarterly Financials (Rs m)
Y/e March Q3FY17 Q4FY17 Q1FY18 Q2FY18
Net Revenue 7,934 7,497 7,377 7,626
EBITDA 1,102 702 758 884
% of revenue 13.9 9.4 10.3 11.6
Depr. & Amortization 109 117 181 171
Net Interest 18 33 62 55
Other Income 170 (241) 192 194
Profit before Tax 1,145 311 707 852
Total Tax 334 90 227 228
Profit after Tax 810 217 471 640
Adj. PAT 810 217 471 640
Source: Company Data, PL Research.

Zensar Technologies
January 08, 2018 30
Notes

Zensar Technologies
January 08, 2018 31
Notes

Zensar Technologies
January 08, 2018 32
Prabhudas Lilladher Pvt. Ltd.
3rd Floor, Sadhana House, 570, P. B. Marg, Worli, Mumbai-400 018, India
Tel: (91 22) 6632 2222 Fax: (91 22) 6632 2209
Rating Distribution of Research Coverage PL’s Recommendation Nomenclature
42.5% 42.5%
15.0%
0.0%0%
10%
20%
30%
40%
50%
BUY Accumulate Reduce Sell
% o
f To
tal C
ove
rage
BUY : Over 15% Outperformance to Sensex over 12-months
Accumulate : Outperformance to Sensex over 12-months
Reduce : Underperformance to Sensex over 12-months
Sell : Over 15% underperformance to Sensex over 12-months
Trading Buy : Over 10% absolute upside in 1-month
Trading Sell : Over 10% absolute decline in 1-month
Not Rated (NR) : No specific call on the stock
Under Review (UR) : Rating likely to change shortly
DISCLAIMER/DISCLOSURES
ANALYST CERTIFICATION
We/I, Mr. Madhu Babu, BTech & PG MBA, Research Analysts, authors and the names subscribed to this report, hereby certify that all of the views expressed in this research report accurately reflect our views about the subject issuer(s) or securities. We also certify that no part of our compensation was, is, or will be directly or indirectly related to the specific recommendation(s) or view(s) in this report.
Terms & conditions and other disclosures:
Prabhudas Lilladher Pvt. Ltd, Mumbai, India (hereinafter referred to as “PL”) is engaged in the business of Stock Broking, Portfolio Manager, Depository Participant and distribution for third party financial products. PL is a subsidiary of Prabhudas Lilladher Advisory Services Pvt Ltd. which has its various subsidiaries engaged in business of commodity broking, investment banking, financial services (margin funding) and distribution of third party financial/other products, details in respect of which are available at www.plindia.com
This document has been prepared by the Research Division of PL and is meant for use by the recipient only as information and is not for circulation. This document is not to be reported or copied or made available to others without prior permission of PL. It should not be considered or taken as an offer to sell or a solicitation to buy or sell any security.
The information contained in this report has been obtained from sources that are considered to be reliable. However, PL has not independently verified the accuracy or completeness of the same. Neither PL nor any of its affiliates, its directors or its employees accepts any responsibility of whatsoever nature for the information, statements and opinion given, made available or expressed herein or for any omission therein.
Recipients of this report should be aware that past performance is not necessarily a guide to future performance and value of investments can go down as well. The suitability or otherwise of any investments will depend upon the recipient's particular circumstances and, in case of doubt, advice should be sought from an independent expert/advisor.
Either PL or its affiliates or its directors or its employees or its representatives or its clients or their relatives may have position(s), make market, act as principal or engage in transactions of securities of companies referred to in this report and they may have used the research material prior to publication.
PL may from time to time solicit or perform investment banking or other services for any company mentioned in this document.
PL is in the process of applying for certificate of registration as Research Analyst under Securities and Exchange Board of India (Research Analysts) Regulations, 2014
PL submits that no material disciplinary action has been taken on us by any Regulatory Authority impacting Equity Research Analysis activities.
PL or its research analysts or its associates or his relatives do not have any financial interest in the subject company.
PL or its research analysts or its associates or his relatives do not have actual/beneficial ownership of one per cent or more securities of the subject company at the end of the month immediately preceding the date of publication of the research report.
PL or its research analysts or its associates or his relatives do not have any material conflict of interest at the time of publication of the research report.
PL or its associates might have received compensation from the subject company in the past twelve months.
PL or its associates might have managed or co-managed public offering of securities for the subject company in the past twelve months or mandated by the subject company for any other assignment in the past twelve months.
PL or its associates might have received any compensation for investment banking or merchant banking or brokerage services from the subject company in the past twelve months.
PL or its associates might have received any compensation for products or services other than investment banking or merchant banking or brokerage services from the subject company in the past twelve months
PL or its associates might have received any compensation or other benefits from the subject company or third party in connection with the research report.
PL encourages independence in research report preparation and strives to minimize conflict in preparation of research report. PL or its analysts did not receive any compensation or other benefits from the subject Company or third party in connection with the preparation of the research report. PL or its Research Analysts do not have any material conflict of interest at the time of publication of this report.
It is confirmed that Mr. Madhu Babu, BTech & PG MBA, Research Analysts of this report have not received any compensation from the companies mentioned in the report in the preceding twelve months
Compensation of our Research Analysts is not based on any specific merchant banking, investment banking or brokerage service transactions.
The Research analysts for this report certifies that all of the views expressed in this report accurately reflect his or her personal views about the subject company or companies and its or their securities, and no part of his or her compensation was, is or will be, directly or indirectly related to specific recommendations or views expressed in this report.
The research analysts for this report has not served as an officer, director or employee of the subject company PL or its research analysts have not engaged in market making activity for the subject company
Our sales people, traders, and other professionals or affiliates may provide oral or written market commentary or trading strategies to our clients that reflect opinions that are contrary to the opinions expressed herein, and our proprietary trading and investing businesses may make investment decisions that are inconsistent with the recommendations expressed herein. In reviewing these materials, you should be aware that any or all o the foregoing, among other things, may give rise to real or potential conflicts of interest.
PL and its associates, their directors and employees may (a) from time to time, have a long or short position in, and buy or sell the securities of the subject company or (b) be engaged in any other transaction involving such securities and earn brokerage or other compensation or act as a market maker in the financial instruments of the subject company or act as an advisor or lender/borrower to the subject company or may have any other potential conflict of interests with respect to any recommendation and other related information and opinions.
DISCLAIMER/DISCLOSURES (FOR US CLIENTS)
ANALYST CERTIFICATION
The research analysts, with respect to each issuer and its securities covered by them in this research report, certify that: All of the views expressed in this research report accurately reflect his or her or their personal views about all of the issuers and their securities; and No part of his or her or their compensation was, is or will be directly related to the specific recommendation or views expressed in this research report
Terms & conditions and other disclosures:
This research report is a product of Prabhudas Lilladher Pvt. Ltd., which is the employer of the research analyst(s) who has prepared the research report. The research analyst(s) preparing the research report is/are resident outside the United States (U.S.) and are not associated persons of any U.S. regulated broker-dealer and therefore the analyst(s) is/are not subject to supervision by a U.S. broker-dealer, and is/are not required to satisfy the regulatory licensing requirements of FINRA or required to otherwise comply with U.S. rules or regulations regarding, among other things, communications with a subject company, public appearances and trading securities held by a research analyst account.
This report is intended for distribution by Prabhudas Lilladher Pvt. Ltd. only to "Major Institutional Investors" as defined by Rule 15a-6(b)(4) of the U.S. Securities and Exchange Act, 1934 (the Exchange Act) and interpretations thereof by U.S. Securities and Exchange Commission (SEC) in reliance on Rule 15a 6(a)(2). If the recipient of this report is not a Major Institutional Investor as specified above, then it should not act upon this report and return the same to the sender. Further, this report may not be copied, duplicated and/or transmitted onward to any U.S. person, which is not the Major Institutional Investor.
In reliance on the exemption from registration provided by Rule 15a-6 of the Exchange Act and interpretations thereof by the SEC in order to conduct certain business with Major Institutional Investors, Prabhudas Lilladher Pvt. Ltd. has entered into an agreement with a U.S. registered broker-dealer, Marco Polo Securities Inc. ("Marco Polo").
Transactions in securities discussed in this research report should be effected through Marco Polo or another U.S. registered broker dealer.