Zensar Technologies Limited - Bombay Stock Exchange Technologies Limited Zensar Knowledge Park,...
169
Transcript of Zensar Technologies Limited - Bombay Stock Exchange Technologies Limited Zensar Knowledge Park,...
Zensar Technologies LimitedZensar Knowledge Park, Kharadi, Plot # 4, MIDC,
Off Nagar Road, Pune - 411014, Maharashtra, India
Tel: +91-20-6605 7500 | Fax: +91-20-6605 7888
[email protected] | www.zensar.com

C O N T E N T S
01 R E T U R N O N D I G I TA L : T H E T H E M E 02 C O R P O R AT E S N A P S H O T
03 M I S S I O N R E P O R T 04 B O A R D O F D I R E C T O R S 05 L E A D E R S H I P T E A M
06-07 C H A I R M A N ’ S M E S S A G E 08-09 C E O ’ S N O T E
10-14 R E T U R N O N D I G I TA L : T H E Z E N S A R W AY
15-16 R E T U R N O N D I G I TA L : A D I F F E R E N T TA K E
17-78 D I R E C T O R S ’ R E P O R T A N D A N N E X U R E S
79-116 F I N A N C I A L S TAT E M E N T S
117-154 C O N S O L I D AT E D F I N A N C I A L S TAT E M E N T S
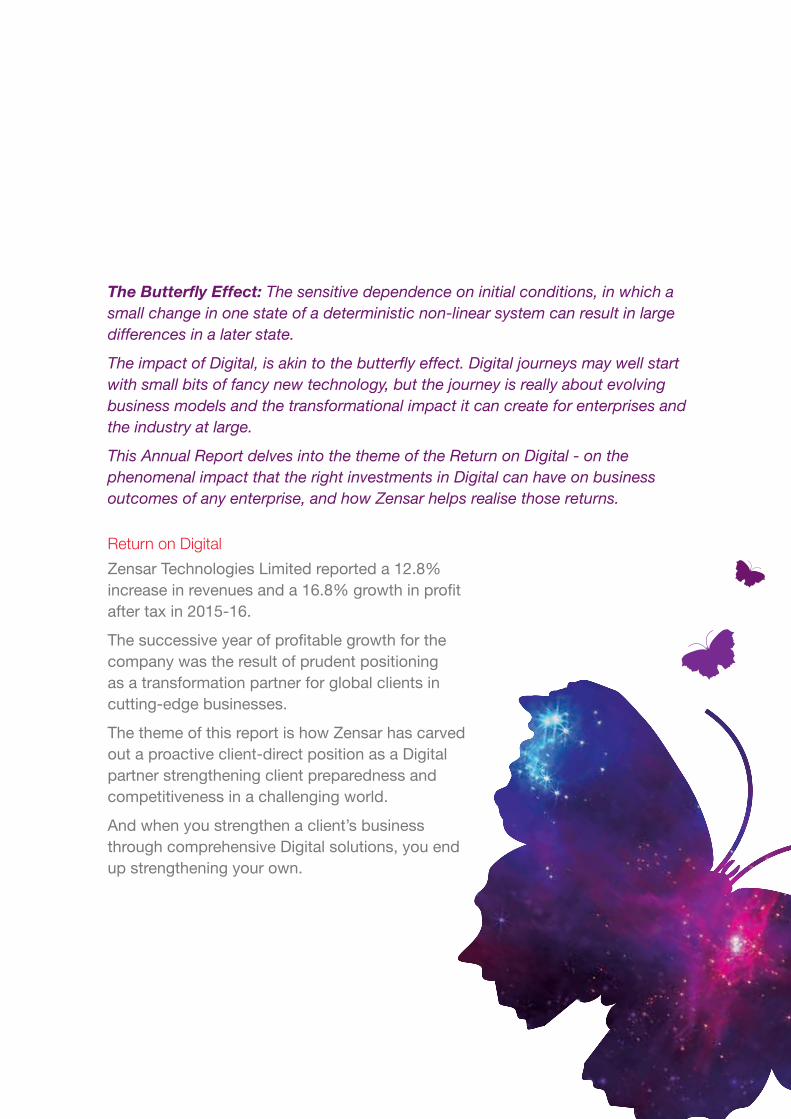
The Butterfly Effect: The sensitive dependence on initial conditions, in which a small change in one state of a deterministic non-linear system can result in large differences in a later state.
The impact of Digital, is akin to the butterfly effect. Digital journeys may well start with small bits of fancy new technology, but the journey is really about evolving business models and the transformational impact it can create for enterprises and the industry at large.
This Annual Report delves into the theme of the Return on Digital - on the phenomenal impact that the right investments in Digital can have on business outcomes of any enterprise, and how Zensar helps realise those returns.
Return on Digital
Zensar Technologies Limited reported a 12.8% increase in revenues and a 16.8% growth in profit after tax in 2015-16.
The successive year of profitable growth for the company was the result of prudent positioning as a transformation partner for global clients in cutting-edge businesses.
The theme of this report is how Zensar has carved out a proactive client-direct position as a Digital partner strengthening client preparedness and competitiveness in a challenging world.
And when you strengthen a client’s business through comprehensive Digital solutions, you end up strengthening your own.
Corporate snapshot
• Part of the $ 3 Billion RPG Enterprises and $ 40 Billion APAX Partners.
• Among �ve global technology companies to be listed on a major global stock exchange (BSE) for 52+ years.
• Helping customers graduate from the traditional to the transformational.
Providing a complete technology services portfolio – Applications, Infrastructure, Digital and Industry-speci�c solutions.
VisionLeaders in business transformation
MissionWe will be the best in delivering
innovative, industry-focused
solutions with measurable business
outcomes
We will partner with customers for
their success
ValuesCustomer-centricity
Commitment to People and the
Community
Continuous Innovation and
Excellence
Zensar is a leading digital solutions
and technology services company
that specialises in partnering global
organisations across industries on their
Digital Transformation journey, while
headquartered out of India.
Zensar possesses a strong record
of innovation drawn from a culture
comprising around 8300 associates
and a footprint in multiple global
locations. Zensar’s comprehensive
software services and solutions make it
possible for Global 1000 customers to
enhance performance and productivity.
Zensar has invested extensively in
partnerships to strengthen technology-
led service capabilities.
Zensar differentiates itself through
strong associate and enduring
customer relationships.
OfferingsZensar offers a complete range
of traditional and transformational
IT services and solutions across
application management and
infrastructure management services.
Zensar’s portfolio comprises services
for mission-critical applications,
enterprise applications, infrastructure
management, business intelligence
and analytics, customer relationship
management, business process
management and digital enterprise
services. Zensar powers next-
generation enterprises through cloud,
mobility and social media solutions.
PresenceZensar enjoys a presence across US,
UK, Africa, Singapore, China, Australia
as well as in European and Middle
Eastern nations serviced through
dedicated delivery centers in India
(Pune, Hyderabad and Bangalore)
as also in the US (San Jose, CA and
Westborough, MA), UK (Slough) and
Africa (Johannesburg).
2 Zensar Technologies Limited
Mission reportA five year perspective of profitability, prosperity and sustainability
13.6%Five year CAGR growth of revenues
leading to 2015-16
18.1%Five year CAGR growth of EBIDTA
leading to 2015-16
15.3%Five year CAGR growth of profit after
tax leading to 2015-16
12.8%Growth
Rs. 2964crore
in 2015-16
Rs. 2628crore
in 2014-15
Revenue
12.3%Growth
16.8%Growth
Rs. 440crore
in 2015-16
Rs. 309crore
in 2015-16
Rs. 392crore
in 2014-15
Rs. 265crore
in 2014-15
EBIDTA Profit after tax
Associates Women% Resource utilisation (%)
Critical talent retention (%)
Market capitalisation
(Rs. cr.)
Home grown leaders from within
Zensar (%)
8256 25.1 81 92 4156 75
As on 31 March 2016
Geography-wise revenues
US 77% Africa 8%
Europe 10% Rest of the world 5%
Annual Report 2015-16 3
Board of Directors
H. V. GoenkaChairman, Non
Executive Director
Shashank SinghNon-Independent,
Non Executive Director
A. T. VaswaniIndependent, Non
Executive Director
Madhabi Puri BuchIndependent, Non
Executive Director
Sandeep KishoreChief Executive Officer
and Managing Director
Venkatesh KasturiranganIndependent, Non
Executive Director
Arvind AgarwalNon-Independent,
Non Executive Director
Sudip NandyIndependent, Non
Executive Director
P. K. MohapatraIndependent, Non
Executive Director
4 Zensar Technologies Limited

Leadership team
Sandeep KishoreChief Executive Officer and
Managing Director
Syed Azfar HussainChief Human Resources
Officer
Prameela KaliveExecutive Vice President and
Head, Custom Application
Solutions
Krishna KumarSenior Vice President
and Head Delivery, Digital
Commerce Solutions
Pinaki KarPresident, IMS & Cloud
Krishna RamaswamiDelivery Head, Digital
Application Services
Chaitanya RajebahadurSenior Vice President and
Head, Europe
Nitin ParabPresident, Platinum Accounts
& Strategic Deals
Ajay BhandariChief Corporate Development
Officer
Chakri VaddiSenior Vice President and
Head, Enterprise Business, US
Mohan HastakSenior Vice President and
Head, Strategic Business
Function, Custom Application
Solutions
Kumar RayasamSenior Vice President and
Head, Digital Commerce
Solutions Business
S. BalasubramaniamChief Financial Officer
Harish GalaExecutive Vice President and
Head, Enterprise Application
Solutions
Deepanjan BanerjeeExecutive Vice President
and Head, Client Assurance
Organisation
Harish LalaSenior Vice President and
Head, Africa
Annual Report 2015-16 5
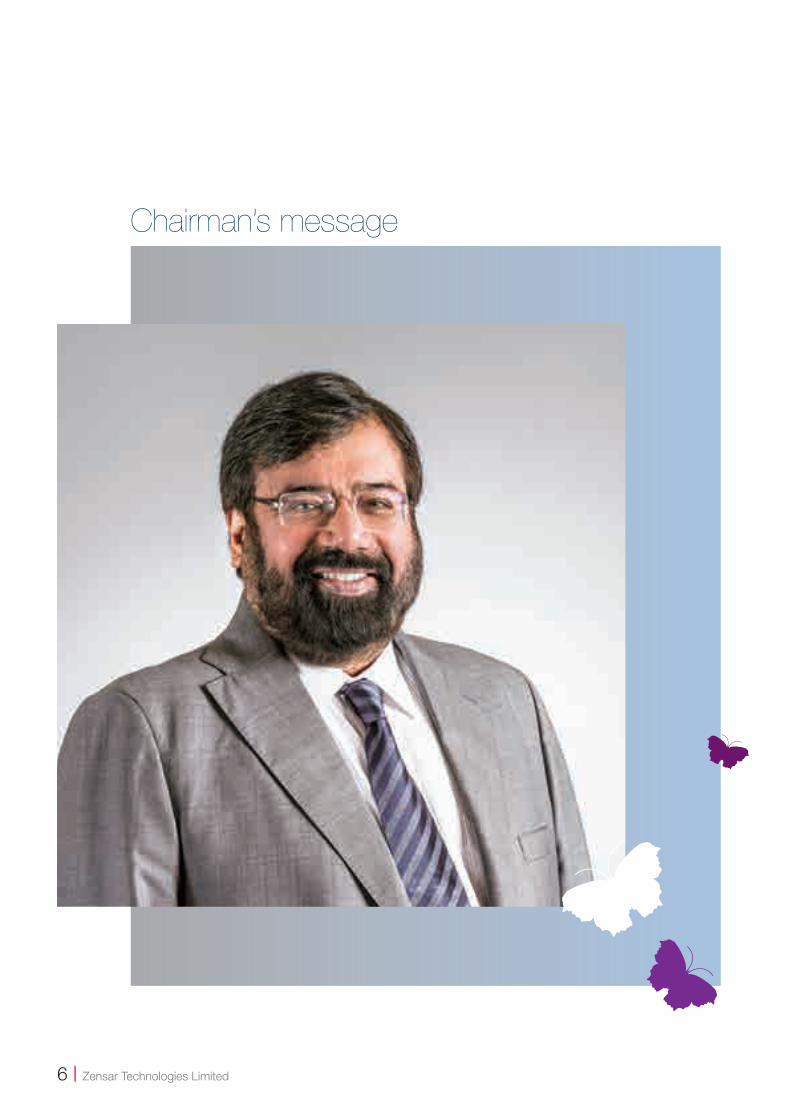
Chairman’s message
6 Zensar Technologies Limited

We operate in very interesting times, with
technology and its relevance evolving at a
significant pace. Consolidation between pure-
play enterprise IT frameworks and digital-led
tools continue to create multiple opportunities
for companies like ours. Global enterprises are
straddling dual realms of going digital, while
harnessing the benefits of legacy systems.
Previously emerging technology stack of cloud,
mobility, big data and Internet of Things, Social
are now mainstream. This is the future of IT,
with fast or smart IT becoming a must-have
rather than a good-to-consider. There is a shift
in strategy, vision and execution of IT, evinced
across varied sectors.
The speed with which organisations achieve
digital transformations will define the quality of
customer engagement, build competitive edge
as well as increase operational efficiencies.
Both, digital and e-commerce have emerged
as significant contributors to Zensar’s overall
performance. This factor underlines our industry
readiness to chart new success stories in
areas that have untapped potential. We will
continue to focus with renewed efforts in helping
customers realise significant benefits. Zensar
is focused towards being a holistic digital
partner to customers as they embark on their
transformation journey.
The recent investment by APAX Partners in
Zensar is a welcome development and is
expected to bring benefits to the company.
Zensar is a key focus area for the RPG Group,
and we aim to scale the company into a Top-
10 Indian technology services business in the
medium-term, through a combination of organic
growth and acquisitions.
Companies embracing digital will have enhanced
agility and efficiency, putting them ahead in the
race. It is these companies that will be able to
sustain themselves in the context of volatile
market conditions and geopolitical issues.
Today, it is not about making a choice, it is
about how soon the choice is made. Zensar is
geared to play the role of a strategic consultant,
implementation partner and enabler. The team at
Zensar is ready with its global experience, deep
technology expertise and proven capabilities
in enabling customers successfully navigate
through the digital world of today and tomorrow.
Under the leadership of Sandeep Kishore,
Zensar’s new Chief Executive Officer, and a fine
organisation, we are ready to take the next leap
to a more robust growth and success trajectory,
for our shareholders, customers and associates
worldwide.
H.V. Goenka
Chairman
Today, it is not about making a choice, it is about how soon the choice is made.
Annual Report 2015-16 7
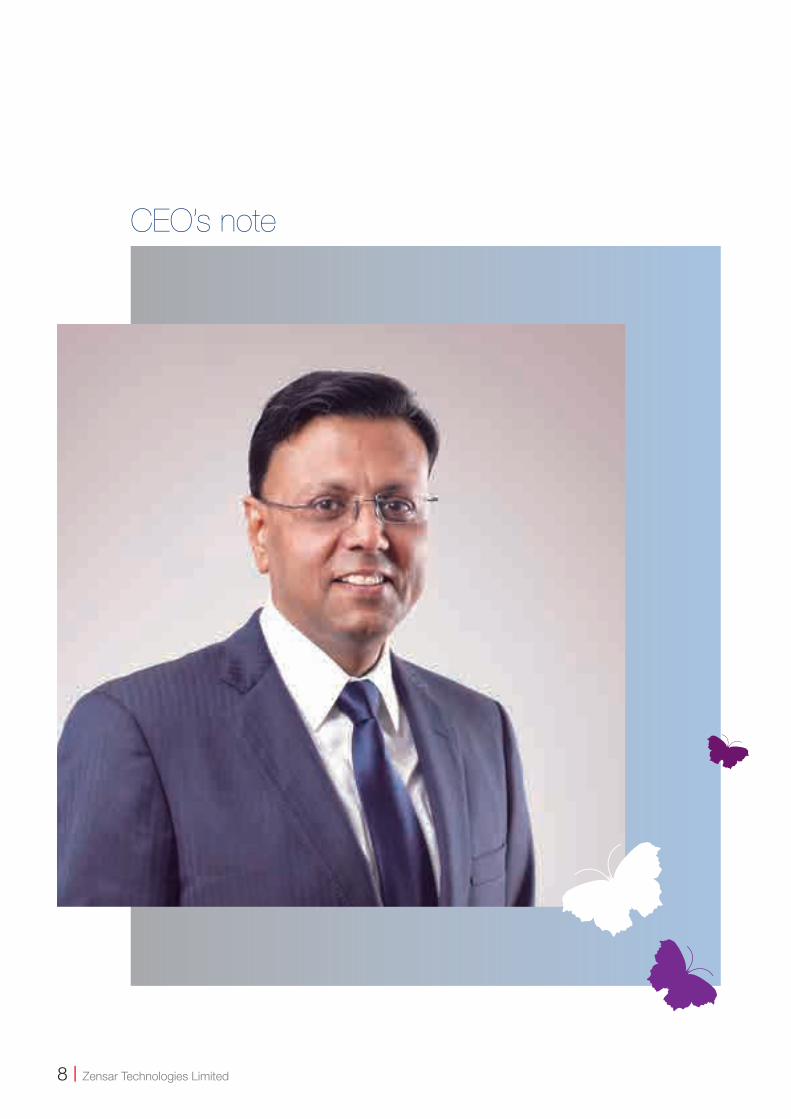
CEO’s note
8 Zensar Technologies Limited
It is my pleasure to make this inaugural note
to all Zensar shareholders as CEO and MD of
your company. These are exciting times in the
industry – made exciting by the prospect of the
transformational impact of Digital.
Even as there is enhanced clarity on the growing
digital role in corporate competitiveness, there is a
deterring reality. A number of global organisations
are finding it increasingly difficult to scale their
digital investments due to the inability to forecast or
estimate a clear return on their investments.
Of all the companies that invested in digital
technologies to strengthen their competitiveness,
only 40% could establish accountability measures
(targets, incentives or ‘owners’ of digital programs).
A high 93% of senior executives indicated that their
organisations could not estimate the precise value
they could extract from the digital initiatives. Only
4% of the companies that made digital investments
could generate high returns at all.
So even as there is a growing corporate priority in
enhancing digital investments to remain competitive,
there is a concurrent need to precisely estimate the
kind of returns one would be able to generate from
digital investments, to even invest in the first place.
Which explains why a far-sighted technology
transformation services provider like ourselves,
Zensar is doing something more than merely
evangelising digital services. It is taking these
solutions to its clients against prospects of
measurable business gains that translate into
quicker payback. Transforming the concept of
digital from expenditure on a fancy suite of new
or emerging technologies like artificial intelligence,
bots, augmented reality, real-time analytics and the
like, to a business strengthening investment.
At Zensar, we have made concise this paradigm-
changing proposition in just three words.
Return on Digital.
The company has moved:
• From a singular focus on project execution,
to helping customers realise a Return on Digital
investments
• Beyond use of specific technologies, to flexible
use of diverse and emerging technologies in
customising solutions around customer needs
• Beyond the experimental, to leveraging
established processes and customer experiences of
hundreds of successful projects, to deliver relevant
solutions
• From the prospect of generating incremental
benefits, to focus on next-generation business
impact
• From a client focus on generating one-time
profit spike, to enabling a sustained competitive
advantage
• From a small use of digital within our own
company, to an ambitious ‘100% Digital’ Zensar,
to leverage the benefits ourselves and to gain
maximum ‘Return on Digital’ as a business.
All these are strengthening Zensar’s credentials as
a competent, trusted and long-term holistic digital
partner that empowers customers in getting their
digital outcomes right, the first time.
This focus on returns for the clients we work with,
coupled with our delivery excellence through
automation and efficiency frameworks, further
bolstered through transparent and performance
driven people practices, built on the strong
foundation of a solid strategy and sharpened go to
market – has Zensar poised for significant growth
ahead.
Sandeep Kishore
Chief Executive Officer and Managing Director
Annual Report 2015-16 9

The Digital opportunity size125,000 large organisations are expected to launch digital initiatives; CEOs
expect their digital revenues to increase to more than 20% of overall revenues
by 2020.*
Enterprises creating advanced digital transformation initiatives are expected to
double - from 22% to almost 50% by 2020.**
Interestingly, only 27% of global businesses profess any digital strategy to
enhance customer value through a digital-led business.***
In 2015, Digital continued to stay top-of-mind for key executives; more than
46% CEOs were executive sponsors of digital initiatives; 56% expected an
increase in return on these investments in three years.
The result is that even as the size of the global digital play is a small portion of
the global enterprise technology market, this could emerge as a USD 4 trillion
opportunity by 2025.
Gartner estimate*, IDC** and Forrester ***
Return on Digital
B2C businesses need more
customers. Return on Digital will
help personalise the consumer
experience
Insurance service providers seek
customer loyalty. Return on Digital
will make it possible to customise
premium.
Manufacturing companies need
enhanced efficiencies. Return
on Digital through platform and
sensor-based solutions will help
deliver analytics from consumer to
the manufacturer intelligently and
directly
Zensar’s distinctive Digital competence
Zensar brings to its distinctive Return
on Digital proposition an impressive
track record of having strengthened the
businesses of its customers – across
sectors, technologies, geographies and
time.
Zensar brings demonstrated capabilities
to the customers table. 75% of the
company’s customers belong to Global
1000; 70% of Zensar revenues have
been derived from customers with
10+ years of engagement; 50% of
relationships comprise multi-services;
Digital business accounts for 27% of
overall revenues; this business has
been growing 100% year-on-year; nine
of Zensar’s 10 largest clients use its
business-transforming digital services.
Zensar’s partnership proposition has
been backed by a strong innovation
track-record, proactive investment
in Digital solutions, enunciation
of commitment to client success,
comprehensive range of digital and
technology services and solutions,
and a visible showcase of long-term
projects. These have helped customers
transform, plan for business expansion
and grow through innovative and digital
strategies.
Zensar focuses on key aspects
like Automation, Customer
Experience, Business Resilience and
Standardisation of the core back-
end systems that make it possible
for customers to capitalize on digital
opportunities.
Extending beyond transactions to
enduring relationships; graduating the
engagement from fleeting vendorship to
trusted partnership.
Zensar’s opportunitiesGrowing room for digital solutions in the manufacturing
(automation and digital solutions), retail and insurance
spaces
Growing need to integrate business ERP and shop floor
ERP into a seamless solution
Growing need to enhance customer experience (in store
brick and mortar to e-commerce)
AcquisitionIn 2014, Zensar acquired Professional Access (PA), a
leading commerce specialist, Oracle ATG and Endeca
partner. The acquisition resulted in significant customer
additions across the retail and e-commerce spaces.
10 Zensar Technologies Limited
Digital wave, Zensar and you
The writing’s on the Digital wallHow the average consumer leverages
the digital world has an impact on what
products are created and how they are
marketed. The reality is that Digital is
the single biggest factor impacting the
future of companies. Disrupting status
quo. Warranting new business models.
Enhancing the need for relevance.
Creating unprecedented opportunities.
The result is that location is becoming
increasingly irrelevant, industry segment
is increasingly meaningless and what
products and services one delivers of
declining consequence.
Digital is more than technology; it
is about evolving business models
and how they can transform
organisations. No longer an enabler;
it is the competitive advantage that
takes companies from one level to
another. No longer another lever in
the corporate arsenal; it is emerging
as the single biggest reason why
companies are succeeding or failing in
evolving marketplaces. No longer about
Cloud, Mobility and Analytics; it is also
about automation and new algorithms
converging disjointed aspects through a
digital thread and IoT-led processes.
This has enhanced the relevance of
first-moving and fast-moving Zensar as
a Digital Solutions provider.
• By 2020, more than 7 billion people
and business and nearly 35 billion
devices will be connected to the
Internet.
Making it imperative for businesses to
weave their strategies around this single
biggest technology reality.
• 32% of corporate leaders with $
250 Million or more in revenues (2014)
feel they fundamentally run digital
businesses.
Making it imperative to invest more
aggressively on the digital side of their
businesses than ever before.
• When asked about the impact of
digital business – negative or positive
over the next five years - the consensus
was positive for customer experience
and management (86%), IT organisation
(86%), people productivity (84%) and
sales organisation (83%).
Making the Chief Marketing Officer a
key stakeholder in decision-making on
IT investments in many companies.
• 47% manufacturers expect big data
analytics to be central to the digital
factory.
Making it imperative to know more
about what consumers are buying, how
and where, and in real time.
• 86% retail consumers are willing
to pay 25% more for a personalised
consumer experience.
Making it imperative to know how
consumers want to be connected with
across moments of truth.
• 42% physical processes supporting
the large global insurance vertical will be
progressively automated in the digital
world.
Making it possible for consumer-
interfacing companies to move faster
and in more informed manner in
responding to consumer needs
• 50% of technology spends by
companies needing to move faster, and
more effectively, will be in new digital
technologies.
Making it imperative for customers
intending to enhance competitiveness
to seek long-term business-
strengthening digital partners.
This annual report touches upon
how Zensar has proactively invested
in addressing the transformational
opportunity that the Digital wave has
provided.
Source: SCM World, Oracle Right Now user survey
analysis, PwC Insurance 2020, IDC predictions
2016
Even as you are reading this, there is a possibility that in the last hour, you …
… read the day’s news headlines on your smartphone
… purchased tickets online
… accessed information about a product on a website
… checked the number of steps you walked today on your watch
… downloaded music directly onto your phone, and
… were pleasantly surprised to read that your municipal corporation would accept taxes online.
Annual Report 2015-16 11

Enough said about Digital. Time to deliver the Return
12 Zensar Technologies Limited
All businesses worldwide are impacted by the ability to launch new propositions, deliver delightful customer experiences and automate business processes while maintaining pace and ensuring scale.
To make Digital real and deliver a return, there are three tenets that need to steadily evolve and work in a completely coordinated manner to support rapid growth and expansion of any enterprise.
Return on Digital is delivered through a harmonious combination of the following:
Stability of Core Systems • Creation of secure, scalable and
stable systems
• Integration of core services in different
avatars
• Variety of custom and enterprise
applications as well as infrastructure
platforms
• Partnered organisations in
development and integration of
applications and infrastructure to
support entire business processes
Cross-over Systems and Processes• Re-engineering of legacy systems
through flexibility and modernisation
• Transformation and alignment of
existing infrastructure with Cloud
infrastructure
• Fusion of core systems and next-gen
technologies
• Delivery of next-generation
automation to drive IT speed
• Seamless integration of technologies
and business
• Next-gen end user engagements –
self-service, admin-based unique tool
across devices
Digital Agility • Blend of cloud and analytics to
enhance customer agility
• Use of analytics empowering
customers to derive a meaningful
marketplace insight that enhances
decision-making
• Personalisation of offerings,
strengthening customer loyalty
• Mapping consumer preferences
based on retrospective spending
patterns coupled with relevant product
offerings
• Influencing customers through wider
product choice in real-time
• Experience of 200+ global digital
commerce implementations
Our Traditional Stack
• Custom applications and Testing
• Enterprise applications
• Infrastructure management
services
Our Cross-Over Stack
• Next Gen End User Engagements
• Legacy Modernization
• Hybrid IT
Our Digital Stack
• Artificial Intelligence
• Bots
• Augmented Reality
• Security
• Internet of Things
• Social, Mobile, Analytics,
Commerce and Cloud
Digitally ready for the multi speed world
Annual Report 2015-16 13
Core legacy systems of a leading
insurance services provider were
not designed for multi-channel or
integration with emerging technologies.
Our self-service Digital platform
integrated with the legacy system and
helped define priorities to take products
faster to market, improve customer
engagement, streamline business
processes and adhere to security
norms.
The result: simpler systems, legacy
asset modernisation and transition to
next gen technologies helping the client
achieve strategic objectives, quicker,
generating 70% cost savings.
A Global specialty retailer was
dissatisfied with volumes generated
from digital channels.
Our Analytics solution through a
recommendation engine built on the
Zensar Analytics platform generated
a higher basket size and thus a 17%
increase in revenues in the first quarter.
Our Smart Manufacturing Solution
automates the manufacturing shop
floor. The solution comprises automated
platforms integrated through advanced
Internet of Things, devices and machine
PLCs (Programmable Logic Controller).
This ensures a fully-integrated,
collaborative manufacturing system that
responds in real-time to meet changing
factory realities, supply network, new
regulatory norms and customer needs.
Strengthening client competitiveness.
Our Customer Service solution for
a Fortune 100 manufacturing leader
generated 100% orders from B2B
platform resulting in 8% increase in
revenues.
Our Commerce solution for a leading
luxury fashion retailer generated a 91%
increase in online revenue and 60%
increase in order inflow.
Our Hybrid IT solution for a leading
hi-tech manufacturing company,
comprising the development of
hybrid infrastructure across premises
and public Cloud, generated a 40%
reduction in IT operation costs.
Our Cloud solution for a leading utilities
provider helped result in 45% savings
reinvested into innovation initiatives.
Our Customer Experience solution for
a leading online retailer helped support
10 million online transactions during the
peak season.
Our Automation solution for a leading
insurance company generated a
60% reduction in test cycles through
automation and improving multi-country
time-to-market by 30%.
A European utilities provider reduced
IT spend more than 45% by moving to
a Hybrid Cloud. These savings were
reinvested in digital innovation to build a
stronger business.
Digital outcomes delivered
Sharpen Your Game
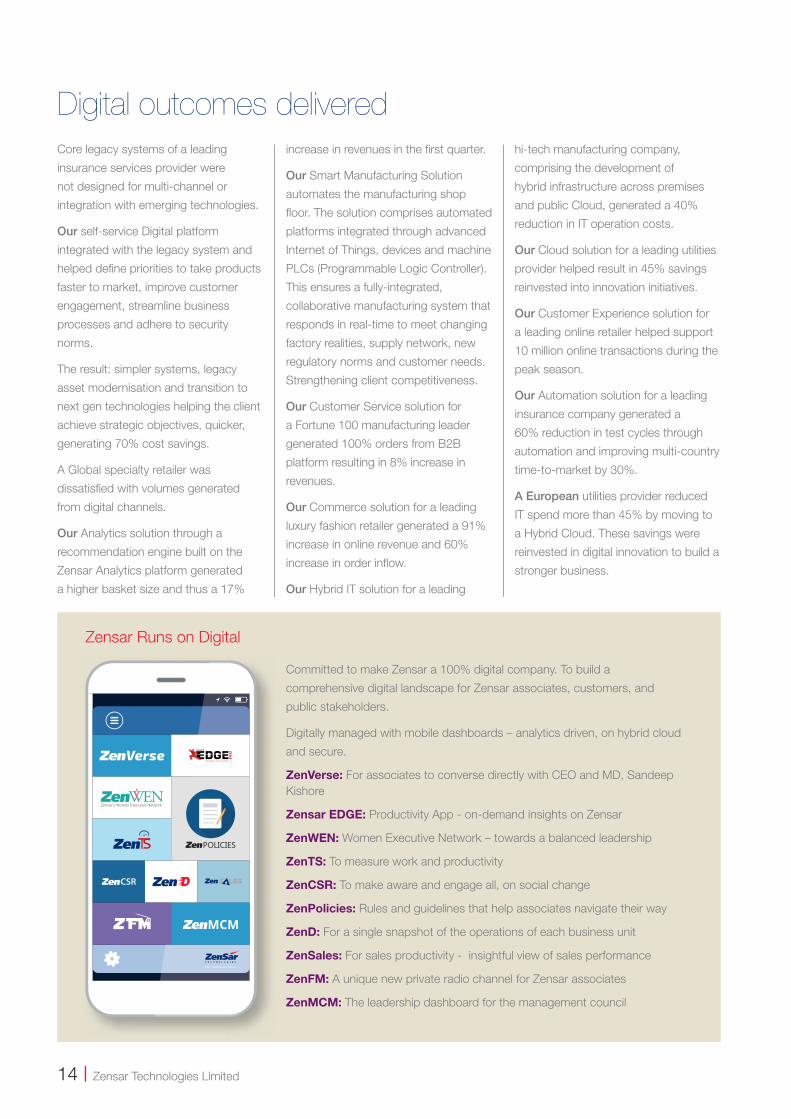
Zensar Runs on Digital
Committed to make Zensar a 100% digital company. To build a
comprehensive digital landscape for Zensar associates, customers, and
public stakeholders.
Digitally managed with mobile dashboards – analytics driven, on hybrid cloud
and secure.
ZenVerse: For associates to converse directly with CEO and MD, Sandeep Kishore
Zensar EDGE: Productivity App - on-demand insights on Zensar
ZenWEN: Women Executive Network – towards a balanced leadership
ZenTS: To measure work and productivity
ZenCSR: To make aware and engage all, on social change
ZenPolicies: Rules and guidelines that help associates navigate their way
ZenD: For a single snapshot of the operations of each business unit
ZenSales: For sales productivity - insightful view of sales performance
ZenFM: A unique new private radio channel for Zensar associates
ZenMCM: The leadership dashboard for the management council
14 Zensar Technologies Limited
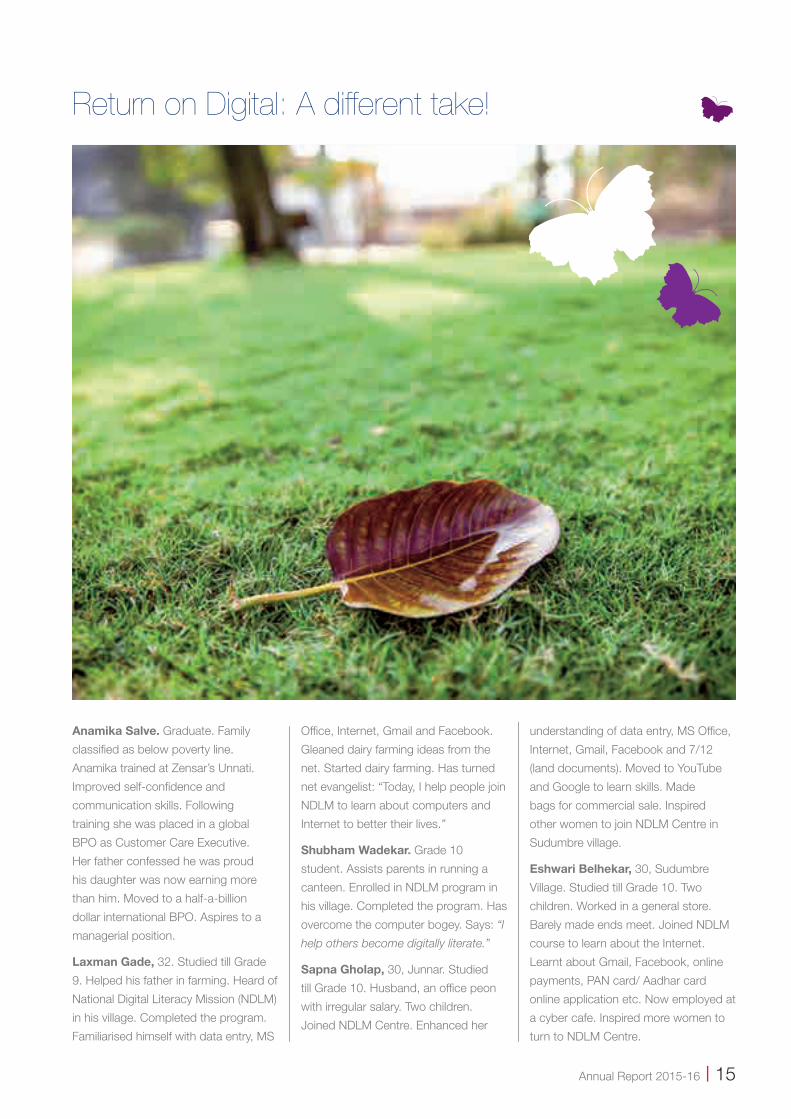
Return on Digital: A different take!
Anamika Salve. Graduate. Family
classified as below poverty line.
Anamika trained at Zensar’s Unnati.
Improved self-confidence and
communication skills. Following
training she was placed in a global
BPO as Customer Care Executive.
Her father confessed he was proud
his daughter was now earning more
than him. Moved to a half-a-billion
dollar international BPO. Aspires to a
managerial position.
Laxman Gade, 32. Studied till Grade
9. Helped his father in farming. Heard of
National Digital Literacy Mission (NDLM)
in his village. Completed the program.
Familiarised himself with data entry, MS
Office, Internet, Gmail and Facebook.
Gleaned dairy farming ideas from the
net. Started dairy farming. Has turned
net evangelist: “Today, I help people join
NDLM to learn about computers and
Internet to better their lives.”
Shubham Wadekar. Grade 10
student. Assists parents in running a
canteen. Enrolled in NDLM program in
his village. Completed the program. Has
overcome the computer bogey. Says: “I
help others become digitally literate.”
Sapna Gholap, 30, Junnar. Studied
till Grade 10. Husband, an office peon
with irregular salary. Two children.
Joined NDLM Centre. Enhanced her
understanding of data entry, MS Office,
Internet, Gmail, Facebook and 7/12
(land documents). Moved to YouTube
and Google to learn skills. Made
bags for commercial sale. Inspired
other women to join NDLM Centre in
Sudumbre village.
Eshwari Belhekar, 30, Sudumbre
Village. Studied till Grade 10. Two
children. Worked in a general store.
Barely made ends meet. Joined NDLM
course to learn about the Internet.
Learnt about Gmail, Facebook, online
payments, PAN card/ Aadhar card
online application etc. Now employed at
a cyber cafe. Inspired more women to
turn to NDLM Centre.
Annual Report 2015-16 15

And then there’s the eternal love – that makes the little impossible happenThree years at Udaan, different children
- some aggressive, some timid; some
shy, some bold; some talkative, some
tight-lipped.
Ten year old Payal Chavan was irregular
to class. When she did turn up Payal
would either be quiet or start crying.
When brought to her mother’s notice
she shouted at her, threatening to send
her to an orphanage.
Single mother, worked hard and sent
Payal to school so she would not have
to get into manual labour for a living.
After that I addressed Payal as ‘my
princess’ and said she would come to
class every day. She smiled and ran
away. Next day, she did come. Called
me near and pecked my cheek and
said I looked beautiful. Payal. She came
every day thereafter. Each day she
enters class with a smile - ‘Teacher, I
have come.’
Teacher at Zensar’s Udaan School.
To get each child to just show up.
And because she loves it.
To lend smiles to faces.
That, is our endeavour.
That, is the Return.
16 Zensar Technologies Limited
DIRECTORS’REPORT & ANNEXURES 2015-16
17 | Annual Report 2015-16
Directors' Report
Dear Members,
Your Directors are pleased to present their 53rd Annual Report together with the Audited Financial Statements,
Directors Report and Annexures for the year ended 31st March 2016.
FINANCIAL SUMMARY:
Year ended 31st March 2016
Year ended 31st March 2015
Revenue from operations 1,233.12 1,052.45
Other Income 59.61 48.27
Total 1,292.73 1,100.72
Profit Before Taxation 317.15 253.45
Profit After Taxation 234.25 183.11
Proposed Dividend - 28.81
Transfer to General Reserves 140.00 100.00
Year ended 31st March 2016
Year ended 31st March 2015
Revenue from operations 2,964.26 2,627.68
Other Income 58.33 55.05
Total 3,022.59 2,682.73
Profit Before Taxation 428.81 365.91
Profit After Taxation 309.15 264.59
Standalone
Consolidated
(H Crores)
(H Crores)
In the preparation of financial statements, no treatment
different from that prescribed in the Accounting
Standards has been followed.
On standalone basis, during the financial year 2015-16,
your Company recorded total income of Rs. 1,292.73
Crores comprising Income from Software Development
and Allied Services of Rs. 1,169.65 Crores, Sale of
license for software applications Rs. 63.47 Crores and
Other income of Rs. 59.61 Crores. The Company
recorded a net profit of Rs. 234.25 Crores reflecting an
increase of approximately 28%.
On consolidated basis, your Company has maintained
growth with total income of Rs. 3,022.59 Crores
comprising Income from Software Development and
Allied Services of Rs. 2,714.28 Crores, Sale of licenses
for software applications including products Rs. 249.99
Crores and Other income of Rs. 58.33 Crores. The
Consolidated Net profit was Rs. 309.15 Crores
reflecting growth of approximately 17%.
There are no material changes and commitments,
affecting the financial position of the company which
have occurred between the end of the financial year on
31st March, 2016 to which the financial statements
relate and the date of the report.
BUSINESS UPDATE AND STATE OF
COMPANY'S AFFAIRS
Digital continues to dominate conversations and
discussions across global enterprises. The sphere of
influence and implementation of digital technologies
like cloud, mobility, social media and big data analytics
is on an upward adoption trend. Transformation of IT is
rapidly becoming enabled through digital. According to
Gartner's estimates*, 1,25,000 large organizations will
launch digital initiatives and CEOs expect their digital
revenues to in increase to more than 20 % by 2020. As
per IDC industry predictions enterprises creating
advanced digital transformation initiatives will double
from 22 % to almost 50 % by 2020.
The worldwide IT-BPM spend through 2015 saw a
growth of 0.4 percent amounting to USD 1.2 trillion. The
growth rate of 3 percent over 2014, was largely
contributed by analytics services having created
Zensar Technologies Ltd | 18
19 | Annual Report 2015-16
increased focus and demand. The other significant
growth driver was the verticalised offerings of
horizontal services. Global ecommerce industry
reported a positive growth of 11.5 % standing at USD
1.7 trillion.
By 2025, digital technology will rise to USD 4 trillion,
forming the major pie of the overall global enterprise
technology market. Jobs will be created across new
platforms and applications. One of the interesting
changes running through new and emerging trends is
the fact that technology consumption is increasingly
consumer led, as demand for wearables, smarter
devices, mobility, 24x7 connectivity sees momentum.
Another new entrant to this mix are governments and
related civic bodies that are adopting technology
platforms to build enhanced citizen services.
Your company has taken the lead, staying well ahead of
the curve by leveraging all these new growth
opportunities. Your company has maintained its steady
growth trend amidst the volatile global and local
geopolitical economic trends with year ended revenues
reported at Rs. 3,022.59 Crores, a growth of 13 % over
the previous year's revenues of Rs. 2,682.73 Crores.
The profits after tax were at Rs. 309.15 Crores, marking
an 17% increase over the previous year's PAT at
264.59 Crores on a consolidated basis
Further, the Company has reported revenue of Rs.
1,292.74 Crores, a growth of 17% over the previous
year's revenues of Rs. 1,100.73 Crores. The profits
after tax were at Rs. 234.25 Crores, marking an 28%
increase over the previous year's PAT at 183.11 Crores
on standalone basis.
Your company retains its reputation and position as a
consistent performer.
Digital is a way of working and not only an enabler;
there is a conscious shift across multiple enterprises
from varied sectors into exploring new ways in which
digital IT can help achieve faster results. There is equal
emphasis on automation, new algorithms bringing
disjoint aspects together with a digital thread and IoT
led processes. The rest of this decade will change the
way we interpret, implement and internalize digital
technologies. In contrast to the flat global spend trends,
the outsourcing services segment continued on a
growth path reporting a growth of 8.5 percent,
estimated at USD 162-166 billion. India retained the top
spot as the leading destination for outsourcing
services, commanding 56 % share globally.
While, our core application led and infrastructure
business has seen sustained growth in both innovation
and new skills training across new and existing
customer engagements, our digital and ecommerce
thrust have become significant contributors. We have
been able to retain a distinct competitive market
position due to this approach year on year. Some of the
partnerships and initiatives were lauded by industry
leading analysts as well as a larger universe of media
and the industry.
We continued performing and focusing across our key
industry verticals-- Manufacturing, Retail, Banking,
Financial Services and Insurance. Investments made
in new senior talent and digital technologies proved
successful. While, we continue to build our core skills
and capabilities across application development,
testing, support, modernization; our focus on
strengthening our enterprise applications business led
by Oracle and SAP continued to grow. We invested in
developing new platforms for increased and
collaborative knowledge sharing through our DevOps
and Agile CoE, Oracle Cloud Lab and the Oracle
Exalytics Lab. Our flagship service in the area of social
listening and analytics, the Zen Social was well
accepted by customers who enjoyed the value addition
it brought to their customer engagement models.
Zensar was included as a niche player in Gartner's
Magic Quadrant for 'Data Centre Outsourcing and
Infrastructure Utility Services' in North America. Hybrid
IT and IMS Cloud will continue to drive revenues, with
the leading differentiator being Zensar's cutting edge
Automation IP key. The Multi-Vendor support (MVS)
services continued to deliver results across critical
needs of customers worldwide.
Building and strengthening key partnerships has been
a continued focus, including Oracle, SAP, Microsoft,
and SFDC, enabling us to keep abreast with industry
needs and demands. Your company is an Oracle
Platinum Partner with a strong and comprehensive
portfolio of Oracle services and solutions. Oracle has
been putting all its energies on its Cloud business as
part of its changing enterprise IT strategy. Your
company tapped into this potential early on, with
increased expertise being developed and the setting up
of the Oracle Cloud Lab in Pune, to aid customers in
leveraging the benefits of the entire portfolio.
Digital commerce was a stellar addition to our overall
revenue mix. Our acquisition of Professional Access
(PA), a leading commerce specialist, Oracle ATG and
Endeca partner resulted in significant additions through
new customers, across retail and ecommerce space.
We remain one of the largest Oracle Commerce
practices globally giving us pride of place.
Directors' Report (Contd.)

Zensar Technologies Ltd | 20
The US region was a significant market in terms of the
businesses won and the extension in current customer
engagements. Our commerce and digital offerings saw
multiple successes as this region continues to be one of
the leading digital led enterprise IT transformation.
Europe performed better than the earlier years with
some key additions in existing customers as well as
new logos that are large in size and reputation. South
Africa operations expanded, with considerable
enhancement in the kind of work being done and the
level on engagement with existing customers.
Your company has continued i ts consistent
performance, earning worthwhile mentions for its
robust strategy and deep set customer relationships
from analysts and other influencers.
(*Reference URL:
http://www.forbes.com/sites/gilpress/2015/12/06/6-
predictions-about-the-future-of-digital-
transformation/#22142e5f25b4)
EXTRACT OF ANNUAL RETURN
Details forming part of the extract of the Annual Return
in form MGT 9 is annexed herewith as “Annexure A”.
NUMBER OF MEETINGS OF THE BOARD
During the year under review, 6 (Six) meetings of the
Board of Directors were held, details of which are set
out in the Corporate Governance Report which forms a
part of this Report.
BOARD COMMITTEES
Detailed composition of the Board committees namely
Audit Committee, Nomination and Remuneration
Committee, Stakeholders Relationship Committee,
Corporate Social Responsibility Committee and
Banking Committee number of meetings held during
the year under review and other related details are set
out in the Corporate Governance Report which forms a
part of this Report.
There have been no situations where the Board has not
accepted any recommendation of the Audit Committee.
Directors' Report (Contd.)
D I R E C T O R S ' R E S P O N S I B I L I T Y
STATEMENT AS REQUIRED UNDER
SECTION 134 OF THE COMPANIES ACT,
2013
The Directors confirm that –
a) in the preparation of the annual accounts for the
financial year ended 31st March, 2016, the
applicable accounting standards have been
followed and there were no material departures;
b) the directors have selected such accounting
policies and applied them consistently and made
judgments and estimates that are reasonable and
prudent so as to give a true and fair view of the state
of affairs of the company at the end of the financial
year as at 31st March, 2016 and of the profit and
loss of the company for that period;
c) the directors have taken proper and sufficient care
for the maintenance of adequate accounting
records in accordance with the provisions of this Act
for safeguarding the assets of the company and for
preventing and detecting fraud and other
irregularities;
d) the directors have prepared the annual accounts on
a going concern basis;
e) the directors, have laid down internal financial
controls to be followed by the company and that
such internal financial controls are adequate and
were operating effectively.
f) the directors have devised proper systems to
ensure compliance with the provisions of all
applicable laws and that such systems were
adequate and operating effectively.
STATEMENT ON DECLARATION OF
INDEPENDENT DIRECTORS.
The Company has received declaration from each of
the Independent Directors under Section 149 (6) and
(7) of the Companies Act, 2013 and Regulation 25 of
SEBI (L i s t i ng Ob l i ga t i ons and D isc losu re
Requirements) Regulations 2015
P E C U N I A R Y R E L A T I O N S H I P O R
T R A N S A C T I O N S O F T H E N O N -
E X E C U T I V E D I R E C T O R S A N D
DISCLOSURES ON THE REMUNERATION
OF THE DIRECTORS
All pecuniary relationship or transactions of the non-
executive Directors vis-à-vis the company, along with
criteria for such payments and disclosures on the
21 | Annual Report 2015-16
remuneration of the Directors along with their
shareholding are disclosed in Corporate Governance
Report and Form MGT 9 which forms a part of this
Report.
NOMINATION &REMUNERATION POLICY
The Company's policy on Directors' appointment and
remuneration, including criteria for determining
qualifications, positive attributes, independence of a
Director and other matters provided under Section 178
(3) is enclosed with this Report as Annexure B.
EXPLANATION AND COMMENTS ON
AUDITOR'S AND SECRETARIAL AUDIT
REPORT
There is no qualification, disclaimer, reservation or
adverse remark made by the Statutory Auditors in the
Auditors' Report.
Further, there is no qualification, disclaimer,
reservation or adverse remark made by the Company
Secretary in practice in the Secretarial Audit Report
PARTICULARS OF LOANS, GUARANTEES
OR INVESTMENTS
The full particulars of the loans granted are mentioned
in the Note No. 15 and 28 of Notes to the financial
statement pursuant to Section 186 (4) read with
Companies (Meetings of Board and its Powers) Rules,
2014. The purpose for granting the loan was to meet the
gap in working capital.
The details of guarantee given and security provided by
the Company for Zensar Technologies Inc, USA are
stated in Note No 31 of Notes to the financial statement.
The said security was provided for securing borrowing
availed of for acquisition.
Full particulars of investments made are stated in Note
No. 13 and Note No. 16 in the Notes to Accounts.
RELATED PARTY TRANSACTIONS
All related party transactions that were entered into
during the financial year were on an arm's length basis
and were in the ordinary course of business.
All Related Party Transactions are placed before the
Audit Committee. Prior omnibus approval of the Audit
Committee is obtained on a yearly basis for the
transactions which are repetitive in nature. The actual
transactions entered into pursuant to the omnibus
approval so granted are placed at quarterly meetings of
the Audit Committee.
The Company has formulated a policy on related party
transactions. This policy as approved by the Board is
uploaded on the Company's website on the below link:
Directors' Report (Contd.)
http://www.zensar.com/sites/all/themes/zensar/pdf/In
vestors/Policy%20on%20Related%20Party%20Trans
actions.pdf
TRANSFER TO RESERVE
Your Directors propose to transfer a sum of Rs. 140.00
Crore to General Reserve.
DIVIDEND
Your Company had reported satisfactory profit levels in
the first three quarters of the current financial year. In
keeping with the Company's tradition of rewarding the
Members, 1st Interim dividend of Rs. 5.00/- per share
aggregating to Rs. 22.31 Crores was paid in the month
February, 2016 and of 2nd interim dividend of Rs.
7.00/- per share aggregating to Rs. 31.24 Crores was
paid in the month of March 2016.
M A T E R I A L C H A N G E S A N D
COMMITMENTS, IF ANY AFFECTING THE
FINANCIAL POSITION OF THE COMPANY
There are no Material changes and commitments,
affecting the financial position of the Company which
have occurred between the end of the financial year on
31st March, 2016 to which the financial statements
relate and the date of this report.
C O N S E R V A T I O N O F E N E R G Y ,
TECHNOLOGY ABSORPTION AND
FOREIGN EXCHANGE EARNINGS AND
OUTGO
The provisions relating to disclosure of details
regarding energy consumption, both total and per unit
of production are not applicable as the company is
engaged in the services sector and provides IT and IT
related services.
Particulars prescribed under Section 134 (3)(m) of The
Companies Act, 2013, read with the Companies
(Accounts) Rules, 2014 in respect of technology
absorption are set out in “Annexure C” to this report.
Particulars regarding Foreign Exchange earnings and
outgo during the year are given in Note No. 35 and Note
No. 36 of the Notes to the Financial Statement
respectively. Particulars regarding R & D expenditure
during the year are given in Note No. 40 of the Notes to
the Financial Statement.
RISK MANAGEMENT
A detailed report on Risk Management is included in
Management Discussion and Analysis which forms
part of this Report. The report clearly states
development and implementat ion of a r isk
management policy for the company including
identification therein of elements of risks along with a
risk mitigation plan.
CORPORATE SOCIAL RESPONSIBILITY
Zensar Foundation, an independent trust operating
under Zensar Technologies, leads the company's
social outreach programs and is committed to
improving the overall wellbeing of slum communities in
the cities where Zensar is located. Its work is focused
on Urban Slum Community Development; Digital
Literacy Employability Enhancement and Environment
Sustenance. The commitment to volunteering remains
high and in fact the entire volunteering program
underwent a strategic shift such that the Foundation is
investing in facilitation of active citizenship and the
ability of each individual to make change happen.
Zensar is proud to say that over 11% of its employees in
India have volunteered their time, in the year under
review. Details about the CSR policy and CSR
initiatives undertaken during the year are annexed
herewith as “Annexure D” and uploaded on the website
of the Company on the link below.
http://www.zensar.com/about-us/csr/csr-policy
A few of the highlights in the areas of Community
Development, Digital Literacy, Employability
Enhancement and Environment sustenance are:
• Investment for the community: Zensar Foundation
has made its first foray into a village, with a Digital
Literacy center being set up in Sudumbre Village in
the outskirts of Pune. This year also saw the
'adoption' of six Municipal Schools in Pune and
Hyderabad, with work being initiated within these
schools for overall school transformation. This is in
partnership with the respective Municipal
Corporations. The Foundation invested in the
setting up water purifiers, digital centers, science
lab, library and additional classrooms as required. In
addition, renovation of the Anganwadi in Ambedkar
Vasti slum community was carried out and the
Foundation also created a community development
center in Chandan Nagar.
• Expansion of National Digital Literacy Mission
(NDLM) centers: The vertical of Digital Literacy
came into its own with the Foundation committing to
a total of eight Digital Literacy Centres in and around
Pune and Hyderabad. Three of these centers are
mobile Digital Literacy buses, undertaken in a
public-private partnership mode and pioneering a
new model for Digital Literacy.
• The Employability Skills Development program has
expanded significantly. Under it over 1500 students
from Tier 2 and Tier 3 colleges in Maharashtra
(Engineering, MCA, BCA, BSc and MSc streams)
were trained. In addition, livelihood generation
programs in the areas of Tailoring, Data Entry,
Administrative Assistant, Retail assistant etc. were
undertaken for the benefit of underprivileged
communities.
• Environment Sustenance: The 2-acre Biodiversity
Park which was developed by Zensar Foundation in
September 2012 in partnership with the PMC, is
maintained actively. The enthusiastic volunteers of
ZenViro (Zensar's volunteers who work towards
environment sustenance) have developed a terrace
garden in Gachbowli school, Hyderabad and the
Late Hambirao Moze school, Pune. Zensar
Foundation has participated actively in the Swachh
Bharat mission.
The Company was required to spend Rs. 4.67 Crores
towards CSR activities out of which Rs. 4.62 Crores
was spent. Delay in implementation of one project has
resulted in underspent of Rs. 0.05 Crores. The
Company has evaluated appropriate programmes and
projects to scale up in the chosen areas of CSR spends
during the year 2016-17.
DIRECTORS AND KEY MANAGERIAL
PERSONNEL
During the year under review, Mr. Sandeep Kishore,
Managing Director was designated as Key Managerial
Personnel in addition to the existing Key Managerial
Persons of the Company namely Dr. Ganesh
Natarajan, Vice Chairman and Managing Director, Mr.
S. Balasubramaniam, CFO and Mr. Nilesh Limaye,
Company Secretary within the meaning of Section
203 of the Companies Act, 2013.
During the year 2015-16 following changes have
occurred in the Directorships:
1. Mr. Sudip Nandy was appointed as Director with
effect from 15th July, 2015
2. Mr. John Levack, Nominee Director of Electra
Partners Mauritius Ltd resigned with effect from 9th
October, 2015.
3. Mr. Shashank Singh was appointed as Director with
effect from 20th October, 2015 as a Nominee
Director of Marina Holdco (FPI) Ltd
4. Dr. Ganesh Natarajan's term of office ends on 30th
April, 2016. Dr. Ganesh Natarajan handed over his
responsibilities as Managing Director and CEO to
Mr. Sandeep Kishore on 12th January, 2016
Mr. Sandeep Kishore was appointed as Managing
Director and CEO with effect from that date.
Directors' Report (Contd.)
Zensar Technologies Ltd | 22
23 | Annual Report 2015-16
5. During the year, Mr. P. K. Choksey passed away on
26th December, 2015 and consequently ceased to
be a Director on that date. The Board records its
deep appreciation of the services rendered by
Mr. P. K. Choksey during his tenure of 35 years as a
Director.
In accordance with the provisions of Companies Act,
2013 and Memorandum and Articles of Association of
the Company, Mr. Arvind Agrawal, Non-executive
Non Independent Director of the Company retires by
rotation at the ensuing Annual General Meeting and,
being eligible, offers himself for reappointment.
Brief particulars of Mr. Arvind Agrawal, his expertise in
various functional areas are given in the Notice
convening the Annual General Meeting. The Board of
Directors recommends the re-appointment of
Mr. Arvind Agrawal as mentioned above.
SUBSIDIARY COMPANIES
Your Company along with subsidiaries provides
software solutions and services globally. A Report on
the performance and financial position of each of the
subsidiaries pursuant to Rule 8 (1) and Form AOC 1
read with Rule 5 of Companies (Accounts) Rules, 2014
is annexed as Annexure E and forms a part of this
Report.
Further, during the year under review, there was no
change in Subsidiaries
Dr. Ganesh Natarajan, Vice Chairman and Managing
Director and Mr. Sandeep Kishore, Managing Director
and CEO have not received any commission during the
year from the Company nor any of its subsidiary
companies.
The Company has framed policy for determining
material subsidiaries as per requirement of explanation
to Regulation 16 (1) (c) in SEBI (Listing Obligations and
Disclosure Requirements) Regulations 2015 read with
earlier Clause 49 of the Listing Agreement and has
uploaded the same on website and link for the same is
as below:
http://www.zensar.com/sites/all/themes/zensar/pdf/In
vestors/Zensar%20Policy%20for%20determining%20
material%20subsidiaries.pdf
Stand-alone Financial Statements and Consolidated
Financial Statements of your Company along with its
subsidiaries, prepared in accordance with the relevant
Accounting Standards issued by The Institute of
Chartered Accountants of India, forms a part of this
Annual Report.
DEPOSITS
The Company has not accepted Deposits under
Chapter V of the Companies Act, 2013.
SIGNIFICANT AND MATERIAL ORDERS
PASSED BY THE REGULATORS OR
COURTS OR TRIBUNALS IMPACTING THE
GOING CONCERN STATUS
There are no significant and material orders passed by
the Regulators or Courts or Tribunals impacting the
going concern status and company's operations in
future.
CHANGE IN THE NATURE OF BUSINESS
During the year under review, there was no change in
the nature of the business.
INTERNAL FINANCIAL CONTROL
Details in respect of adequacy of internal financial
controls with reference to the Financial Statements are
stated in Management Discussion and Analysis which
forms part of this Report.
Directors' Report (Contd.)
INFORMATION PURSUANT TO RULE 5 OF THE COMPANIES (APPOINTMENT AND
REMUNERATION OF MANAGERIAL REMUNERATION) RULES, 2014
Directors' Report (Contd.)
1 The ratio of the remuneration of each director to the median remuneration of the employees of the company excluding Managing Director for the financial year
Please refer Annexure F- 1 to this Report for details.
2 The percentage increase in remuneration of each director, Chief Financial Officer, Chief Executive Officer, Company Secretary or Manager, if any, in the financial year;
Please refer Annexure F- 2 to this Report or details
3 The percentage increase in the median remuneration of employees
The percentage increase in the median remuneration in the financial year 2015-16 of employees on India Payroll was 9.1%*
4 The number of permanent employees on the rolls of company
6573
5 The explanation on the relationship between average increase in remuneration and company performance
The profit before tax for the financial year ended 31st March, 2016 on standalone basis Rs. 317.16 Crores whereas the average percentage increase in the remuneration of employees on India Payroll excluding Managing Director in the financial year 2015-16 was 9.6%. The average increase in remuneration and company performance are directly related to each other. However, it is subject to Individual performance, industry trends, economic situation, future growth prospects and possible replacement of employee.
6 Comparison of the remuneration of the Key
Manager ia l Pe rsonne l aga ins t t he
performance of the company
The profit before tax for the financial year ended 31st March, 2016 on standalone basis Rs. 234.25 Crores whereas the average percentage increase in the remuneration of key managerial personnel in the financial year 2015-16 was 11% The average increase in remuneration and company performance are directly related to each other. However, it is subject to Individual performance, industry trends, economic situation, future growth prospects and possible replacement of employee.
7 Variations in the market capitalisation of the
company, price earnings ratio as at the
closing date of the current financial year and
previous financial year and percentage
increase over decrease in the market
quotations of the shares of the company in
comparison to the rate at which the company
came out with the last public offer in case of
listed companies, and in case of unlisted
companies, the variations in the net worth of
the company as at the close of the current
financial year and previous financial year
Market capitalization and PE Ratio
increased by 46.02% and 11.17% respectively as compared to
last year.
% increase in market quotation over last Public issue price:
Public issue of equity shares was made in the year 1979 with
issue price of Rs. 10.00 per share. The average closing price
on BSE and NSE as on 31st March, 2016 was
932. The market price per share has increased by 9220 % as
on 31.03.2016.
(Subsequent to last public issue of the shares, there were
multiple changes in the capital structure of the Company by
way of rights issue, preferential issue, conversion of
debentures in to equity shares, buy back of shares, bonus
issue etc. and impact of it has not been considered.)
Zensar Technologies Ltd | 24
31st March, 2016
31st March, 2015
31st March, 2014
Market
Capitalisation
4,157.98Crores
2,847.55 Crores
1,639.97 Crores
PE ratio 12.00 10.66 6.88

25 | Annual Report 2015-16
8 Average percentile increase already made in the salaries of employees other than the managerial personnel in the last financial year and its comparison with the percentile increase in the managerial remuneration and justification thereof and point out if there are any exceptional circumstances for increase in the managerial remuneration
Average percentile increase already made in the salaries of
employees other than the managerial personnel in the last
financial year is 47.8th percentile. The percentile increase in
the managerial remuneration is 48th percentile.
9 Comparison of the each remuneration of the
Key Managerial personnel against the
performance of the Company
The profit before tax for the financial year ended 31st March,
2016 on standalone basis is Rs. 234.25 Crores. The increase
in remuneration of each of the Key Managerial Personnel is
as below:
1. Dr. Ganesh Natarajan, Managing Director: 6.84%
2. Mr. S Balasubramaniam, CFO: 15%
3. Mr. Nilesh Limaye, CS: 10%
The increase in remuneration and company performance are
directly related to each other however, subject to Individual
performance, industry trends, economic situation, future
growth prospects and possible replacement of employee.
10 The key parameters for any variable
component of remuneration availed by the
directors
The variable component of remuneration availed by the Directors is based on Profit After Tax reported by the Company at the end of each financial year and recommendation of Nomination and Remuneration Committee.
11 The ratio of the remuneration of the highest paid director to that of the employees who are not directors but receive remuneration in excess of the highest paid director during the year
Not applicable
12 Affirmation that the remuneration is as per the remuneration policy of the company.
The remuneration to employees of the Company is as per the remuneration policy of the company.
Directors' Report (Contd.)
* The percentage increase in the median remuneration of employees has been calculated after excluding Managing
Director's remuneration.
Directors' Report (Contd.)
VIGIL MECHANISM/WHISTLE BLOWER
POLICY
The Audit Committee's terms of reference inter alia
include vigil mechanism which also incorporates a
whistle blower policy in terms of Section 177 (10) of the
Companies Act, 2013 and Regulation 4, 22 of SEBI
(Listing Agreement and Disclosure Requirements)
Regulations 2015 read with earlier Clause 49 of the
Listing Agreement. The Company has adopted whistle
blower policy in the meeting of Board of Directors held
on 24th July, 2014. The whistle blower mechanism
provides for Directors and employees to report
concerns about unethical behaviour, actual or
suspected fraud or violation of Company's Code of
Governance and Ethics. The whistle blower policy is
uploaded on the website of the Company on the link
below.
http://www.zensar.com/sites/all/themes/zensar/pdf/In
vestors/Model_Whistle_blower_policy.pdf
INTER SE RELATIONSHIPS BETWEEN
THE DIRECTORS
There are no relationships between the Directors inter
se.
FAMILIARISATION PROGRAMMES FOR
INDEPENDENT DIRECTORS
The Company has Familiarisation programmes and the
details of it have been uploaded on the website of the
Company on the link below:
http://www.zensar.com/sites/all/themes/zensar/pdf/In
vestors/FAMILIARISATION%20PROGRAMMES%20
FOR%20INDEPENDENT%20DIRECTORS.pdf
FORMAL ANNUAL EVALUATION OF
BOARD AND ITS COMMITTEES
Pursuant to provisions of Section 134 of the Companies
Act, 2013 and Regulation 17 of SEBI (Listing
Agreement and Disclosure Requirements) Regulations
2015 read with earlier clause 49 of the Listing
Agreement, the Nomination and Remuneration
Committee laid down a criteria for evaluating Board
effectiveness by assessing performance of the Board
as a whole, performance of individual Director and
Committees of the Board namely Audit Committee,
Nominat ion and Remunerat ion Commi t tee,
Stakeholders Relationship Committee, Banking
Committee and Corporate Social Responsibility
Committee. The Board approved the criteria laid down
by Nomination and Remuneration Committee for
evaluating Board effectiveness and engaged a third
party agency to conduct Board effectiveness survey
during the year under review.
MANAGEMENT D ISCUSSION AND
ANALYSIS
Management Discussion and Analysis in terms of
Regulation 34 of SEBI (Listing Agreement and
Disclosure Requirements) Regulations 2015 forms a
part of this Report and is annexed to this Report as
“Annexure G”.
AUDITORS
Statutory Auditor:
M/s Price Waterhouse, Chartered Accountants,
Statutory Auditors of the Company, retire at the ensuing
Annual General Meeting and, being eligible, offer
themselves for re-appointment.
They have confirmed their eligibility under Section 141
of the Companies Act, 2013 and the Rules framed
thereunder for reappointment as Statutory Auditors of
the Company. The Statutory Auditors have also
confirmed that they hold a valid certificate issued by the
Peer Review Board of the Institute of Chartered
Accountants of India.
Secretarial Auditor:
Pursuant to the provisions of Section 204 of the
Companies Act , 2013 and The Companies
(Appointment and Remuneration of Managerial
Personnel) Rules, 2014, the Board had appointed M/s
SVD & Associates, a firm of Company Secretaries in
Practice to undertake the Secretarial Audit of the
Company. The Report of the Secretarial Audit in Form
MR – 3 is annexed herewith as “Annexure H”.
The Board has reappointed M/s SVD & Associates, a
firm of Company Secretaries in Practice to undertake
the Secretarial Audit of the Company for the financial
year 2016-17.
Internal Auditors
The Board had appointed Ernst and Young LLP as
Internal Auditors for the financial year 2015-16 under
Section 138 of the Companies Act, 2013 and they have
completed the internal audit as per scope given by the
Audit Committee for the financial year 2015-16.
The Board has reappointed Ernst & Young LLP as
Internal Auditors for the financial year 2016-17.
Zensar Technologies Ltd | 26

27 | Annual Report 2015-16
CORPORATE GOVERNANCE
Your Company continues to benchmark itself with the
best-of-the-breed practices as far as corporate
governance standards are concerned. Your Company
has complied with regulations provided in clause 49 of
the Listing Agreement it has entered into with the stock
exchanges. The compliance report on the various
requirements under the said clause along with the
practicing Company Secretary's certification thereof is
provided in the corporate governance section of this
report at “Annexure I”
EMPLOYEES STOCK OPTION PLAN
Currently, the Company has two Employees Stock
Option Schemes in force namely, “2002 Employees
Stock Option Scheme” (2002 ESOS) and “2006
Employees Stock Option Scheme” (2006 ESOS) for
granting term based and performance based Stock
Options to employees and these schemes are being
implemented as specified by Securities Exchange
Board of India in this regard.
In the financial year 2015-16, 63,412 equity shares
were allotted under “2002 Employees Stock Option
Scheme” and 2,41,242 equity shares were allotted
under “2006 Employees Stock Option Scheme”. The
Disclosures in compliance with Clause 12 of the
Securities and Exchange Board of India (Employees
Stock Option Scheme and Employees Stock Purchase
Scheme) Guidelines, 1999 read with Clause 14 of the
Securities and Exchange Board of India (Share Based
Employee Benefits) Regulations, 2014 in this respect
are stated in “Annexure J” to this report.
Disclosures for the financial year ended 31st March, 2016 regarding 2002 ESOS and 2006 ESOS in terms of
Companies (Share Capital and Debentures) Rules, 2014 are as below:
Particulars 2002 ESOS 2006 ESOS
Options granted NIL 3,01,000
Options vested 55,850 5,35,642
Options exercised 63,412 2,41,242
The total no of shares arising as a result of exercise of option
63,412 2,41,242
Options lapsed/cancelled during the year
5,428 97,606
The exercise price Exercise Price for each grant is different and decided by the Nomination and Remuneration Committee as per the Securities and Exchange Board of India (Employees Stock Option Scheme and Employees Stock Purchase S c h e m e ) G u i d e l i n e s , 1 9 9 9 prevailing at the time of grant.
Exercise Price for each grant is different and decided by the Nomination and Remuneration Committee as per the Securities and Exchange Board of India (Employees Stock Option Scheme and Employees Stock Purchase Scheme) Guidelines, 1999 read with SEBI (Share based employee benefits) Regulations, 2014 prevailing at the time of grant.
Variation of terms of options No variation in the terms of options during the year under review
No variation in the terms of options during the year under review
Money realized by exercise of options
Rs. 46,04,424 Rs. 3,88,44,018
Total no of options in force 55,850 10,29,982
Employee wise details of options granted to:
Key Managerial Personnel (KMP) No new options were granted to KMPs during the year under review
Mr. Sandeep Kishore was granted 1,25,000 stock options during the year.
Directors' Report (Contd.)
Zensar Technologies Ltd | 28
Particulars 2002 ESOS 2006 ESOS
any other employee who receives a grant of options in any one year of option amounting to five percent or more of options granted during that year
NIL
Identified employees who were granted option, during any one year, equal to or exceeding one percent of the issued capital (excluding outstanding warrants and conversions) of the company at the time of grant
Dr. Ganesh Natarajan : 5,00,000(All these options have been
exercised.)
NIL
Name of Employee No of Options
Mr. Sandeep Kishore 1,25,000
Mr. Pinaki Kar 1,00,000
Mr. Harish Gala 20,000
Mr. Deepanjan Banerjee 20,000
P A R T I C U L A R S O F E M P L O Y E E S
PURSUANT TO SECTION 197 READ WITH
R U L E 5 O F T H E C O M P A N I E S
(APPOINTMENT AND REMUNERATION OF
MANAGERIAL PERSONNEL) RULES, 2014
Particulars of employees pursuant to Section 197 read
with Rule 5 of The Companies (Appointment and
Remuneration of Managerial Personnel) Rules, 2014
are annexed with this report as “Annexure K”.
D I S C L O S U R E U N D E R S E X U A L
HARASSMENT OF WOMEN AT THE
W O R K P L A C E ( P R E V E N T I O N ,
PROHIBITION AND REDRESSAL) ACT,
2013
The Company has in place an Anti-Sexual Harassment
Policy in line with the requirements of the Sexual
Harassment of Women at the Workplace (Prevention,
Prohibition and Redressal) Act, 2013. Internal
Complaints Committee has been set up to redress
complaints. The following is the summary of complaints
received and disposed off during the year under review:
Number of complaints received and disposed off 3
issued SEBI (Listing Agreement and Disclosure
Requirements) Regulations 2015 (Regulations)with
effect from December 1, 2015. As per the Regulations,
Company had entered in to Listing Agreement with
National Stock Exchange of India Limited and Bombay
Stock Exchange Limited during the year.
EMPLOYEE PERFORMANCE AWARD
UNIT PLAN 2016.
The Company has launched “Zensar Technologies
Limited – Employee Performance Award Unit Plan
2016 (Plan) on which approval of the Members was
received by way of Postal Ballot result of which was
declared on 22nd March 2016. The Company is at
present in the process of making an application for its in
principal approval with National Stock Exchange of
India Limited and Bombay Stock Exchange Limited.
Performance Award Units shall be granted under this
Plan on the receipt of in principal approval.
ACKNOWLEDGEMENTS
The Board places on record its appreciation of the
contribution of Associates at all levels, customers,
business and technology partners, vendors, investors,
Government Authorities and all other stakeholders
towards the performance of the Company during the
year under review.
For and on behalf of the Board
H.V. Goenka
Chairman
Place: Mumbai
Dated: 22nd April, 2016
Directors' Report (Contd.)
MATERIAL TRANSACTIONS WITH
RELATED PARTIES
The Company has not entered in to any transaction with
related parties during the year under review which
requires reporting in Form AOC 2 in terms of
Companies Act, 2013 read with Companies (Accounts)
Rules, 2014.
LISTING AGREEMENT
The Securities and Exchange Board of India (SEBI) has
29 | Annual Report 2015-16
Annexure A to the Directors' Report
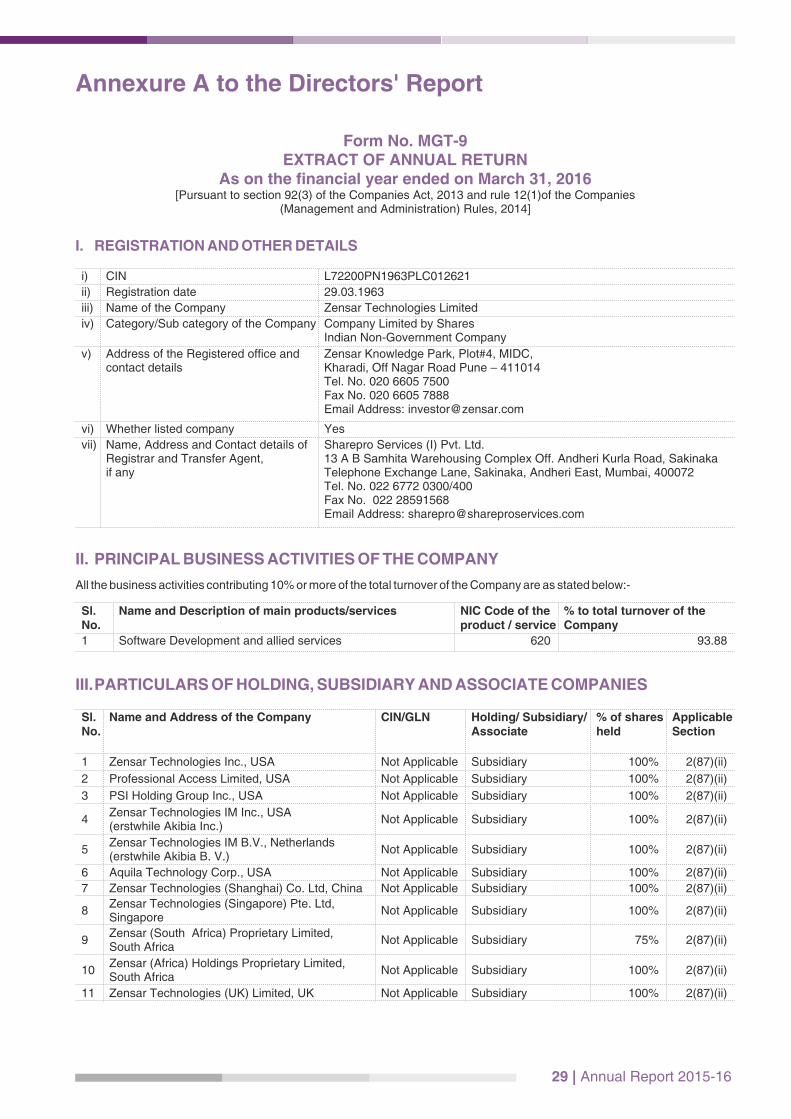
Form No. MGT-9EXTRACT OF ANNUAL RETURN
As on the financial year ended on March 31, 2016[Pursuant to section 92(3) of the Companies Act, 2013 and rule 12(1)of the Companies
(Management and Administration) Rules, 2014]
I. REGISTRATION AND OTHER DETAILS
i) CIN L72200PN1963PLC012621
ii) Registration date 29.03.1963
iii) Name of the Company Zensar Technologies Limited
iv) Category/Sub category of the Company Company Limited by SharesIndian Non-Government Company
v) Address of the Registered office and contact details
Zensar Knowledge Park, Plot#4, MIDC, Kharadi, Off Nagar Road Pune – 411014 Tel. No. 020 6605 7500 Fax No. 020 6605 7888Email Address: [email protected]
vi) Whether listed company Yes
vii) Name, Address and Contact details of Registrar and Transfer Agent,if any
Sharepro Services (I) Pvt. Ltd. 13 A B Samhita Warehousing Complex Off. Andheri Kurla Road, Sakinaka Telephone Exchange Lane, Sakinaka, Andheri East, Mumbai, 400072 Tel. No. 022 6772 0300/400 Fax No. 022 28591568 Email Address: [email protected]
II. PRINCIPAL BUSINESS ACTIVITIES OF THE COMPANY
All the business activities contributing 10% or more of the total turnover of the Company are as stated below:-
Sl. No.
Name and Description of main products/services NIC Code of the product / service
% to total turnover of the Company
1 Software Development and allied services 620 93.88
III. PARTICULARS OF HOLDING, SUBSIDIARY AND ASSOCIATE COMPANIES
Sl. No.
Name and Address of the Company CIN/GLN Holding/ Subsidiary/Associate
% of shares held
Applicable Section
1 Zensar Technologies Inc., USA Not Applicable Subsidiary 100% 2(87)(ii)
2 Professional Access Limited, USA Not Applicable Subsidiary 100% 2(87)(ii)
3 PSI Holding Group Inc., USA Not Applicable Subsidiary 100% 2(87)(ii)
4Zensar Technologies IM Inc., USA (erstwhile Akibia Inc.)
Not Applicable Subsidiary 100% 2(87)(ii)
5Zensar Technologies IM B.V., Netherlands (erstwhile Akibia B. V.)
Not Applicable Subsidiary 100% 2(87)(ii)
6 Aquila Technology Corp., USA Not Applicable Subsidiary 100% 2(87)(ii)
7 Zensar Technologies (Shanghai) Co. Ltd, China Not Applicable Subsidiary 100% 2(87)(ii)
8Zensar Technologies (Singapore) Pte. Ltd, Singapore
Not Applicable Subsidiary 100% 2(87)(ii)
9Zensar (South Africa) Proprietary Limited,South Africa
Not Applicable Subsidiary 75% 2(87)(ii)
10Zensar (Africa) Holdings Proprietary Limited, South Africa
Not Applicable Subsidiary 100% 2(87)(ii)
11 Zensar Technologies (UK) Limited, UK Not Applicable Subsidiary 100% 2(87)(ii)

Zensar Technologies Ltd | 30
Annexure A to the Directors' Report (Contd.)IV
) S
HA
RE
HO
LD
ING
PA
TT
ER
N (
Eq
uit
y S
hare
Cap
ital B
reaku
p a
s p
erc
en
tag
e o
f T
ota
l E
qu
ity)
i)
Cate
go
ry-w
ise S
hare
Ho
ldin
g a
s o
f M
arc
h 3
1,
2016
Ca
teg
ory
of
Sh
are
ho
lders
No
. o
f sh
are
s a
t th
e b
eg
inn
ing
of
the y
ear
No
of
sh
are
s a
t th
e e
nd
of
the y
ear
% c
han
ge
du
rin
g t
he
year
Dem
at
Ph
ysic
al
To
tal
% o
f T
ota
l S
hare
sD
em
at
Ph
ysic
al
To
tal
% o
f T
ota
l S
hare
s
A.
Pro
mo
ters
(1)
Ind
ian
a)
Indiv
idual/
HU
F 774
-
774
-
777
-
777
-
-
b)
Centr
al G
ovt
. -
-
-
-
-
-
-
-
-
c)
Sta
te G
ovt
(s).
-
-
-
-
-
-
-
-
-
d)
Bodie
s C
orp
. 2,0
0,9
9,0
92
-
2,0
0,9
9,0
92
45.3
4 2,1
3,5
2,1
14
-
2,1
3,5
2,1
14
47.8
4
2.5
0
e)
Banks
/ FI
-
-
-
-
-
-
-
-
-
f)
Any
Oth
er
-
-
-
-
-
-
-
-
-
Su
b-t
ota
l (A
) (1) :
- 2,0
0,9
9,8
66
-
2,0
0,9
9,8
66
45.3
4 2,1
3,5
2,8
91
-
2,1
3,5
2,8
91
47.8
42.5
0
(2)
Fo
reig
n
a)
NR
Is -
Indiv
iduals
-
-
-
-
-
-
-
-
-
b)
Oth
ers
- In
div
iduals
-
-
-
-
-
-
-
-
-
c)
Bodie
s C
orp
. 10,3
0,9
22
-
10,3
0,9
22
2.3
3 -
-
-
-
-2
.33
d)
Banks
/ FI
-
-
-
-
-
-
-
-
-
e)
Any
Oth
er
-
-
-
-
-
-
-
-
-
Su
b- t
ota
l (A
) (2):
- 10,3
0,9
22
-
10,3
0,9
22
2.3
3 -
-
-
-
-2
.33
To
tal S
hare
ho
ldin
g
of
Pro
mo
ter
(A)
= (
A)(
1)
+ (
A)(
2)
2,1
1,3
0,7
88
-
2,1
1,3
0,7
88
47.6
7 2,1
3,5
2,8
91
-
2,1
3,5
2,8
91
47.8
40.1
7
Ca
teg
ory
of
Sh
are
ho
lders
No
. o
f sh
are
s a
t th
e b
eg
inn
ing
of
the y
ear
No
of
sh
are
s a
t th
e e
nd
of
the y
ear
% c
han
ge
du
rin
g t
he
year
Dem
at
Ph
ysic
al
To
tal
% o
f T
ota
l S
hare
sD
em
at
Ph
ysic
al
To
tal
% o
f T
ota
l S
hare
s
B.
Pu
blic S
hare
ho
ldin
g
1.
Insti
tuti
on
s
a)
Mutu
al F
unds
2,2
1,5
60
750
2,2
2,3
10
0.5
0
2,2
1,8
21
750
2,2
2,5
71
0.5
0
-
b)
Banks
/ FI
8,4
94
1,6
85
10,1
79
0.0
3
16,2
95
1,6
85
17,9
80
0.0
4
0.0
1
c)
Centr
al G
ovt
. -
-
-
-
-
-
-
-
-
d)
Sta
te G
ovt
(s).
-
-
-
-
-
-
-
-
-
e)
Ventu
re C
ap
ital F
unds
-
-
-
-
-
-
-
-
-
f)
Insu
rance
Co
mpanie
s 1,0
00
500
1,5
00
-
1,0
00
500
1,5
00
0.0
0
0.0
0
g)
FIIs
57,7
0,5
51
1,3
50
57,7
1,9
01
13.0
2
62,9
0,8
07
1,3
50
62,9
2,1
57
14.1
0
1.0
8
h)
Fore
ign V
en
ture
Capita
l Funds
-
-
-
-
-
-
-
-
-
i)
Oth
ers
(speci
fy)
-
-
-
-
-
-
-
-
-
Su
b -t
ota
l (B
) (1) ;
- 60,0
1,6
05
4,2
85
60,0
5,8
90
13.5
5
65,2
9,9
23
4,2
85
65,3
4,2
08
14.6
4
1.0
9
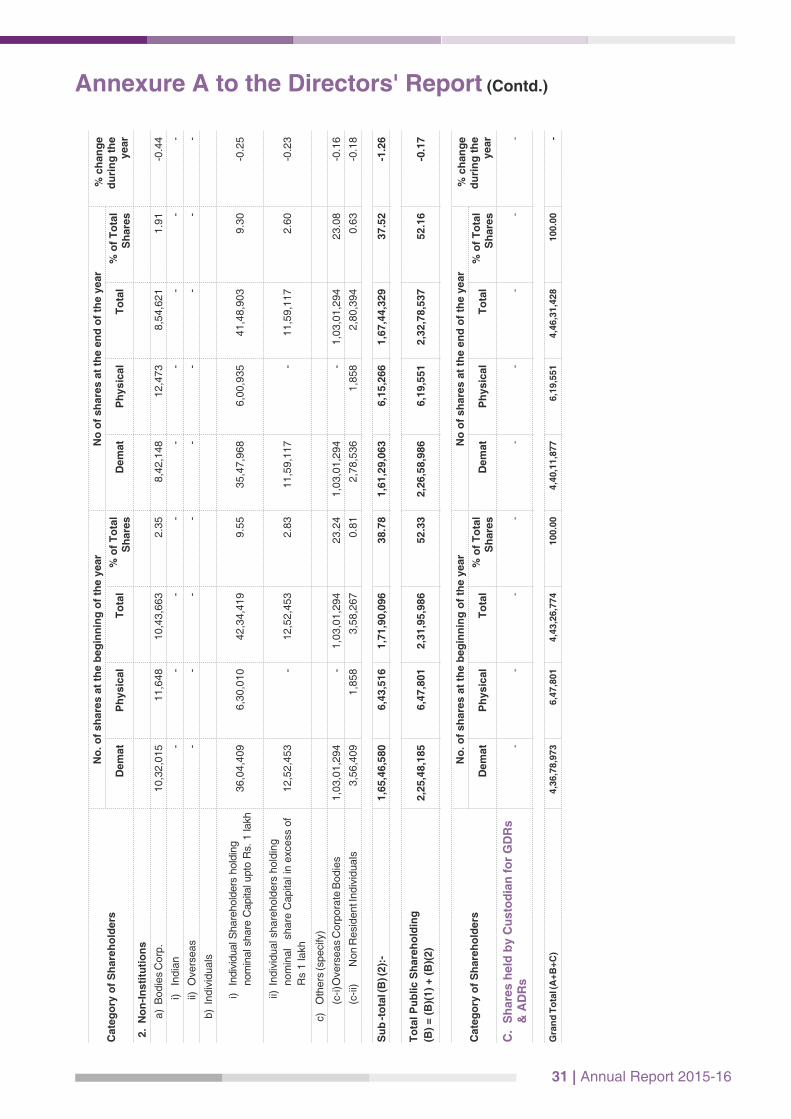
31 | Annual Report 2015-16
Annexure A to the Directors' Report (Contd.)
Ca
teg
ory
of
Sh
are
ho
lders
No
. o
f sh
are
s a
t th
e b
eg
inn
ing
of
the y
ear
No
of
sh
are
s a
t th
e e
nd
of
the y
ear
% c
han
ge
du
rin
g t
he
year
Dem
at
Ph
ysic
al
To
tal
% o
f T
ota
l S
hare
sD
em
at
Ph
ysic
al
To
tal
% o
f T
ota
l S
hare
s
2.
No
n-I
nsti
tuti
on
s
a)
Bodie
s C
orp
. 10,3
2,0
15
11,6
48
10,4
3,6
63
2.3
5 8,4
2,1
48
12,4
73
8,5
4,6
21
1.9
1
-0.4
4
i)
India
n -
-
-
-
-
-
-
-
-
ii) O
vers
ea
s -
-
-
-
-
-
-
-
-
b)
Indiv
iduals
i)
Indiv
idual S
hare
hold
ers
hold
ing
nom
inal s
hare
Capita
l upto
Rs.
1 la
kh 36,0
4,4
09
6,3
0,0
10
42,3
4,4
19
9.5
5 35,4
7,9
68
6,0
0,9
35
41,4
8,9
03
9.3
0
-0.2
5
ii)
Indiv
idual s
hare
hold
ers
hold
ing
nom
inal
share
Capita
l in e
xcess
of
Rs
1 la
kh
12,5
2,4
53
-
12,5
2,4
53
2.8
3 11,5
9,1
17
-
11,5
9,1
17
2.6
0
-0.2
3
c)
Oth
ers
(speci
fy)
(c-i) O
vers
eas
Corp
ora
te B
odie
s 1,0
3,0
1,2
94
-
1,0
3,0
1,2
94
23.2
4 1,0
3,0
1,2
94
-
1,0
3,0
1,2
94
23.0
8
-0.1
6
(c-ii)
Non R
esi
dent I
ndiv
iduals
3,5
6,4
09
1,8
58
3,5
8,2
67
0.8
1 2,7
8,5
36
1,8
58
2,8
0,3
94
0.6
3
-0.1
8
Su
b -t
ota
l (B
) (2):
- 1,6
5,4
6,5
80
6,4
3,5
16
1,7
1,9
0,0
96
38.7
8 1,6
1,2
9,0
63
6,1
5,2
66
1,6
7,4
4,3
29
37.5
2 -
1.2
6
To
tal P
ub
lic S
hare
ho
ldin
g
(B)
= (
B)(
1)
+ (
B)(
2)
2,2
5,4
8,1
85
6,4
7,8
01
2,3
1,9
5,9
86
52.3
3
2,2
6,5
8,9
86
6,1
9,5
51
2,3
2,7
8,5
37
52.1
6
-0.1
7
Ca
teg
ory
of
Sh
are
ho
lders
No
. o
f sh
are
s a
t th
e b
eg
inn
ing
of
the y
ear
No
of
sh
are
s a
t th
e e
nd
of
the y
ear
% c
han
ge
du
rin
g t
he
year
Dem
at
Ph
ysic
al
To
tal
% o
f T
ota
l S
hare
sD
em
at
Ph
ysic
al
To
tal
% o
f T
ota
l S
hare
s
C.
Sh
are
s h
eld
by C
usto
dia
n f
or
GD
Rs
& A
DR
s -
-
-
-
-
-
-
-
-
Gra
nd
To
tal (
A+
B+
C)
4,3
6,7
8,9
73
6,4
7,8
01
4,4
3,2
6,7
74
100.0
0
4,4
0,1
1,8
77
6
,19
,55
1
4
,46
,31
,42
8
10
0.0
0 -
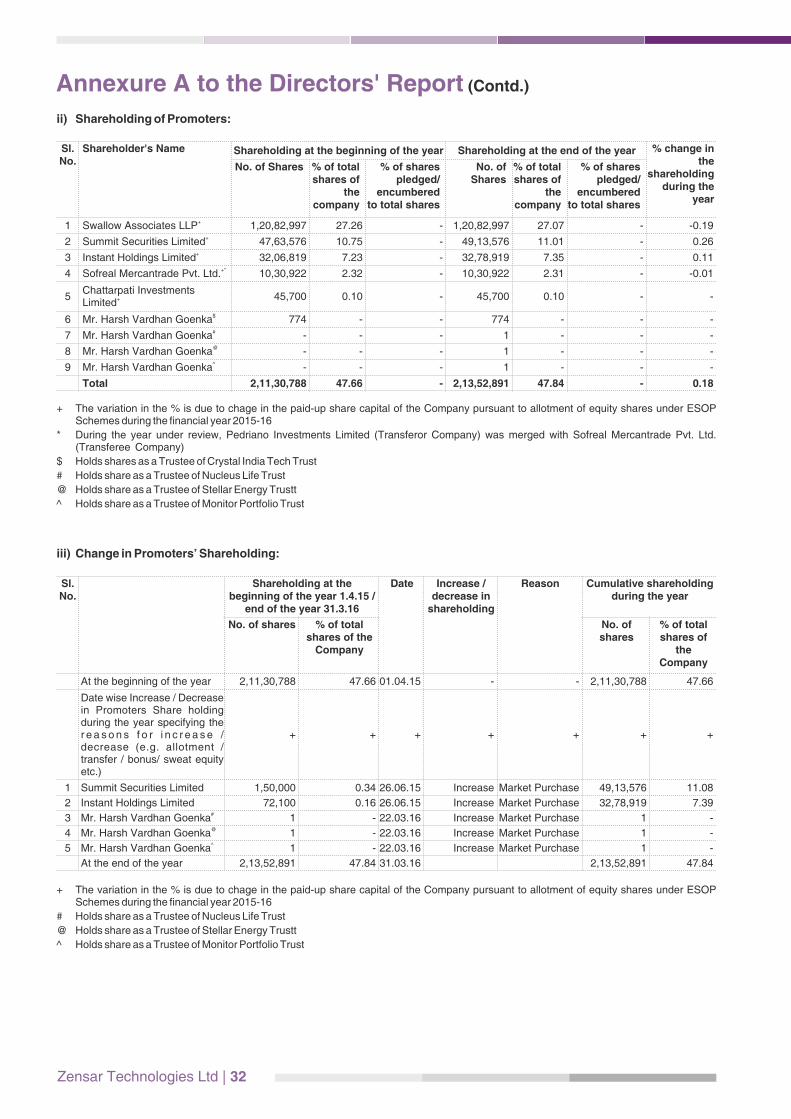
Zensar Technologies Ltd | 32
Annexure A to the Directors' Report (Contd.)
ii) Shareholding of Promoters:
Sl. No.
Shareholder's Name Shareholding at the beginning of the year Shareholding at the end of the year % change in the
shareholding during the
year
No. of Shares % of total shares of
the company
% of shares pledged/
encumbered to total shares
No. of Shares
% of total shares of
the company
% of shares pledged/
encumbered to total shares
1 +Swallow Associates LLP 1,20,82,997 27.26 - 1,20,82,997 27.07 - -0.19
2 +Summit Securities Limited 47,63,576 10.75 - 49,13,576 11.01 - 0.26
3 +Instant Holdings Limited 32,06,819 7.23 - 32,78,919 7.35 - 0.11
4 +*Sofreal Mercantrade Pvt. Ltd. 10,30,922 2.32 - 10,30,922 2.31 - -0.01
5Chattarpati Investments
+Limited 45,700 0.10 - 45,700 0.10 - -
6 $Mr. Harsh Vardhan Goenka 774 - - 774 - - -
7 #Mr. Harsh Vardhan Goenka - - - 1 - - -
8 @Mr. Harsh Vardhan Goenka - - - 1 - - -
9 ^Mr. Harsh Vardhan Goenka - - - 1 - - -
Total 2,11,30,788 47.66 - 2,13,52,891 47.84 - 0.18
+ The variation in the % is due to chage in the paid-up share capital of the Company pursuant to allotment of equity shares under ESOP Schemes during the financial year 2015-16
* During the year under review, Pedriano Investments Limited (Transferor Company) was merged with Sofreal Mercantrade Pvt. Ltd. (Transferee Company)
$ Holds shares as a Trustee of Crystal India Tech Trust
# Holds share as a Trustee of Nucleus Life Trust
@ Holds share as a Trustee of Stellar Energy Trustt
^ Holds share as a Trustee of Monitor Portfolio Trust
iii) Change in Promoters’ Shareholding:
Sl. No.
Shareholding at the beginning of the year 1.4.15 /
end of the year 31.3.16
Date Increase / decrease in
shareholding
Reason Cumulative shareholding during the year
No. of shares % of total shares of the
Company
No. of shares
% of total shares of
the Company
At the beginning of the year 2,11,30,788 47.66 01.04.15 - - 2,11,30,788 47.66
Date wise Increase / Decrease in Promoters Share holding during the year specifying the r e a s o n s f o r i n c r e a s e / decrease (e.g. allotment / transfer / bonus/ sweat equity etc.)
+ + + + + + +
1 Summit Securities Limited 1,50,000 0.34 26.06.15 Increase Market Purchase 49,13,576 11.08
2 Instant Holdings Limited 72,100 0.16 26.06.15 Increase Market Purchase 32,78,919 7.39
3 #Mr. Harsh Vardhan Goenka 1 - 22.03.16 Increase Market Purchase 1 -
4 @Mr. Harsh Vardhan Goenka 1 - 22.03.16 Increase Market Purchase 1 -
5 ^Mr. Harsh Vardhan Goenka 1 - 22.03.16 Increase Market Purchase 1 -
At the end of the year 2,13,52,891 47.84 31.03.16 2,13,52,891 47.84
+ The variation in the % is due to chage in the paid-up share capital of the Company pursuant to allotment of equity shares under ESOP Schemes during the financial year 2015-16
# Holds share as a Trustee of Nucleus Life Trust
@ Holds share as a Trustee of Stellar Energy Trustt
^ Holds share as a Trustee of Monitor Portfolio Trust
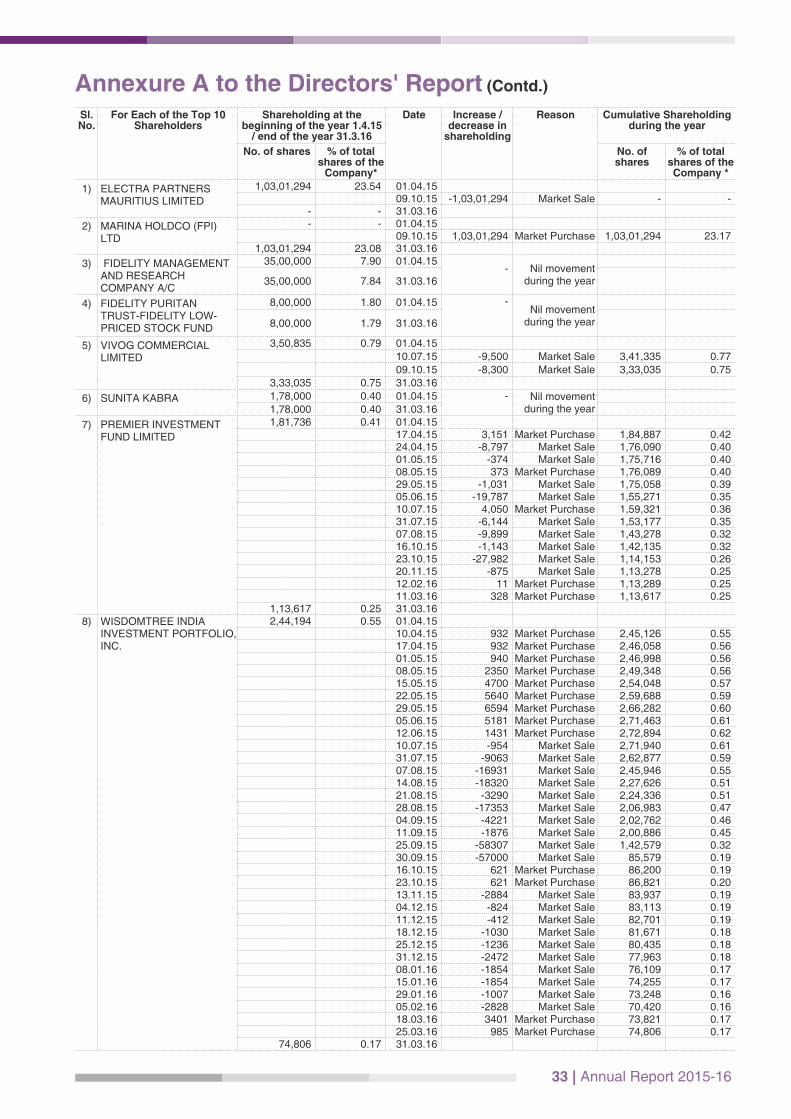
33 | Annual Report 2015-16
Annexure A to the Directors' Report (Contd.)
Sl. No.
For Each of the Top 10 Shareholders
Shareholding at the beginning of the year 1.4.15
/ end of the year 31.3.16
Date Increase / decrease in
shareholding
Reason Cumulative Shareholding during the year
No. of shares % of total shares of the
Company*
No. of shares
% of total shares of the Company *
1) ELECTRA PARTNERS MAURITIUS LIMITED
1,03,01,294 23.54 01.04.1509.10.15 -1,03,01,294 Market Sale - -
- - 31.03.16
2) MARINA HOLDCO (FPI) LTD
- - 01.04.1509.10.15 1,03,01,294 Market Purchase 1,03,01,294 23.17
1,03,01,294 23.08 31.03.16
3) FIDELITY MANAGEMENT AND RESEARCH COMPANY A/C
35,00,000 7.90 01.04.15 - Nil movement
during the year 35,00,000 7.84 31.03.16
4) FIDELITY PURITAN TRUST-FIDELITY LOW-PRICED STOCK FUND
8,00,000 1.80 01.04.15 - Nil movement
during the year 8,00,000 1.79 31.03.16
5) VIVOG COMMERCIAL LIMITED
3,50,835 0.79 01.04.1510.07.15 -9,500 Market Sale 3,41,335 0.77 09.10.15 -8,300 Market Sale 3,33,035 0.75
3,33,035 0.75 31.03.16
6) SUNITA KABRA 1,78,000 0.40 01.04.15 - Nil movement during the year 1,78,000 0.40 31.03.16
7) PREMIER INVESTMENT FUND LIMITED
1,81,736 0.41 01.04.1517.04.15 3,151 Market Purchase 1,84,887 0.42 24.04.15 -8,797 Market Sale 1,76,090 0.40 01.05.15 -374 Market Sale 1,75,716 0.40 08.05.15 373 Market Purchase 1,76,089 0.40 29.05.15 -1,031 Market Sale 1,75,058 0.39 05.06.15 -19,787 Market Sale 1,55,271 0.35 10.07.15 4,050 Market Purchase 1,59,321 0.36 31.07.15 -6,144 Market Sale 1,53,177 0.35 07.08.15 -9,899 Market Sale 1,43,278 0.32 16.10.15 -1,143 Market Sale 1,42,135 0.32 23.10.15 -27,982 Market Sale 1,14,153 0.26 20.11.15 -875 Market Sale 1,13,278 0.25 12.02.16 11 Market Purchase 1,13,289 0.25 11.03.16 328 Market Purchase 1,13,617 0.25
1,13,617 0.25 31.03.168) WISDOMTREE INDIA
INVESTMENT PORTFOLIO, INC.
2,44,194 0.55 01.04.1510.04.15 932 Market Purchase 2,45,126 0.55 17.04.15 932 Market Purchase 2,46,058 0.56 01.05.15 940 Market Purchase 2,46,998 0.56 08.05.15 2350 Market Purchase 2,49,348 0.56 15.05.15 4700 Market Purchase 2,54,048 0.57 22.05.15 5640 Market Purchase 2,59,688 0.59 29.05.15 6594 Market Purchase 2,66,282 0.60 05.06.15 5181 Market Purchase 2,71,463 0.61 12.06.15 1431 Market Purchase 2,72,894 0.62 10.07.15 -954 Market Sale 2,71,940 0.61 31.07.15 -9063 Market Sale 2,62,877 0.59 07.08.15 -16931 Market Sale 2,45,946 0.55 14.08.15 -18320 Market Sale 2,27,626 0.51 21.08.15 -3290 Market Sale 2,24,336 0.51 28.08.15 -17353 Market Sale 2,06,983 0.47 04.09.15 -4221 Market Sale 2,02,762 0.46 11.09.15 -1876 Market Sale 2,00,886 0.45 25.09.15 -58307 Market Sale 1,42,579 0.32 30.09.15 -57000 Market Sale 85,579 0.19 16.10.15 621 Market Purchase 86,200 0.19 23.10.15 621 Market Purchase 86,821 0.20 13.11.15 -2884 Market Sale 83,937 0.19 04.12.15 -824 Market Sale 83,113 0.19 11.12.15 -412 Market Sale 82,701 0.19 18.12.15 -1030 Market Sale 81,671 0.18 25.12.15 -1236 Market Sale 80,435 0.18 31.12.15 -2472 Market Sale 77,963 0.18 08.01.16 -1854 Market Sale 76,109 0.17 15.01.16 -1854 Market Sale 74,255 0.17 29.01.16 -1007 Market Sale 73,248 0.16 05.02.16 -2828 Market Sale 70,420 0.16 18.03.16 3401 Market Purchase 73,821 0.17 25.03.16 985 Market Purchase 74,806 0.17
74,806 0.17 31.03.16
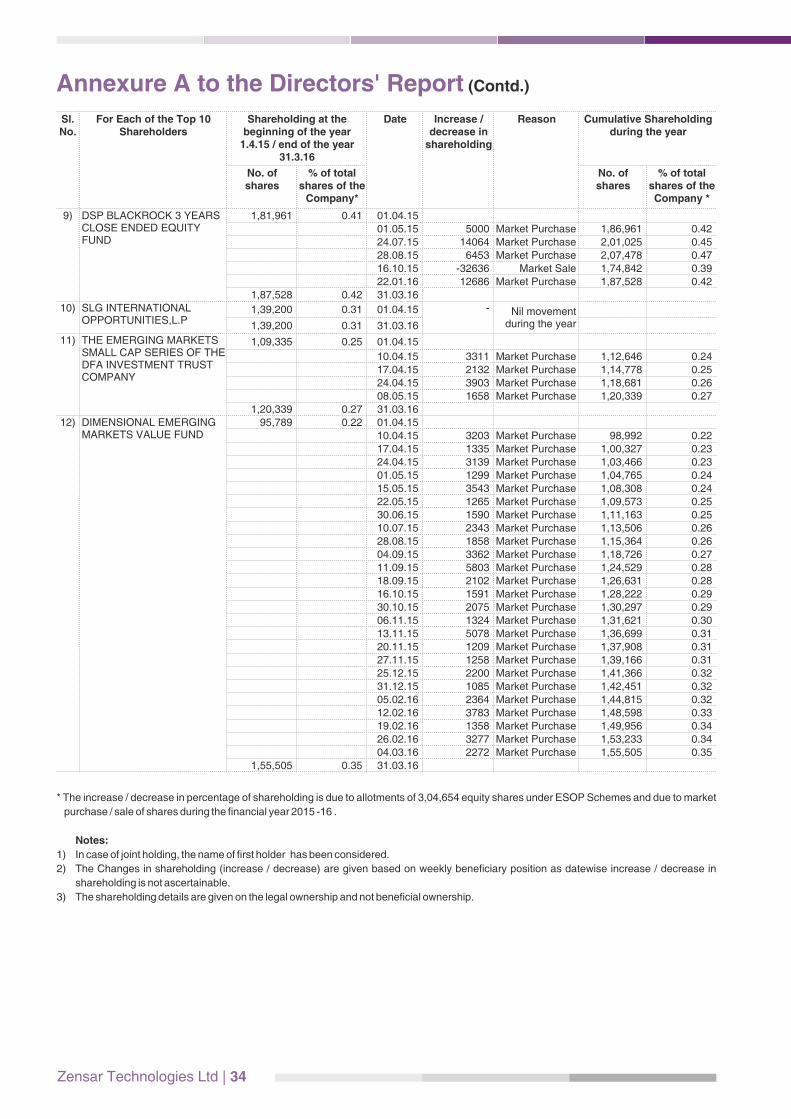
Zensar Technologies Ltd | 34
Sl. No.
For Each of the Top 10 Shareholders
Shareholding at the beginning of the year
1.4.15 / end of the year 31.3.16
Date Increase / decrease in
shareholding
Reason Cumulative Shareholding during the year
No. of shares
% of total shares of the
Company*
No. of shares
% of total shares of the Company *
9) DSP BLACKROCK 3 YEARS CLOSE ENDED EQUITY FUND
1,81,961 0.41 01.04.1501.05.15 5000 Market Purchase 1,86,961 0.42 24.07.15 14064 Market Purchase 2,01,025 0.45 28.08.15 6453 Market Purchase 2,07,478 0.47 16.10.15 -32636 Market Sale 1,74,842 0.39 22.01.16 12686 Market Purchase 1,87,528 0.42
1,87,528 0.42 31.03.1610) SLG INTERNATIONAL
OPPORTUNITIES,L.P 1,39,200 0.31 01.04.15 - Nil movement
during the year 1,39,200 0.31 31.03.16
11) THE EMERGING MARKETS SMALL CAP SERIES OF THE DFA INVESTMENT TRUST COMPANY
1,09,335 0.25 01.04.15
10.04.15 3311 Market Purchase 1,12,646 0.24 17.04.15 2132 Market Purchase 1,14,778 0.25 24.04.15 3903 Market Purchase 1,18,681 0.26 08.05.15 1658 Market Purchase 1,20,339 0.27
1,20,339 0.27 31.03.1612) DIMENSIONAL EMERGING
MARKETS VALUE FUND 95,789 0.22 01.04.15
10.04.15 3203 Market Purchase 98,992 0.22 17.04.15 1335 Market Purchase 1,00,327 0.23 24.04.15 3139 Market Purchase 1,03,466 0.23 01.05.15 1299 Market Purchase 1,04,765 0.24 15.05.15 3543 Market Purchase 1,08,308 0.24 22.05.15 1265 Market Purchase 1,09,573 0.25 30.06.15 1590 Market Purchase 1,11,163 0.25 10.07.15 2343 Market Purchase 1,13,506 0.26 28.08.15 1858 Market Purchase 1,15,364 0.26 04.09.15 3362 Market Purchase 1,18,726 0.27 11.09.15 5803 Market Purchase 1,24,529 0.28 18.09.15 2102 Market Purchase 1,26,631 0.28 16.10.15 1591 Market Purchase 1,28,222 0.29 30.10.15 2075 Market Purchase 1,30,297 0.29 06.11.15 1324 Market Purchase 1,31,621 0.30 13.11.15 5078 Market Purchase 1,36,699 0.31 20.11.15 1209 Market Purchase 1,37,908 0.31 27.11.15 1258 Market Purchase 1,39,166 0.31 25.12.15 2200 Market Purchase 1,41,366 0.32 31.12.15 1085 Market Purchase 1,42,451 0.32 05.02.16 2364 Market Purchase 1,44,815 0.32 12.02.16 3783 Market Purchase 1,48,598 0.33 19.02.16 1358 Market Purchase 1,49,956 0.34 26.02.16 3277 Market Purchase 1,53,233 0.34 04.03.16 2272 Market Purchase 1,55,505 0.35
1,55,505 0.35 31.03.16
Annexure A to the Directors' Report (Contd.)
* The increase / decrease in percentage of shareholding is due to allotments of 3,04,654 equity shares under ESOP Schemes and due to market
purchase / sale of shares during the financial year 2015 -16 .
Notes:
1) In case of joint holding, the name of first holder has been considered.
2) The Changes in shareholding (increase / decrease) are given based on weekly beneficiary position as datewise increase / decrease in
shareholding is not ascertainable.
3) The shareholding details are given on the legal ownership and not beneficial ownership.
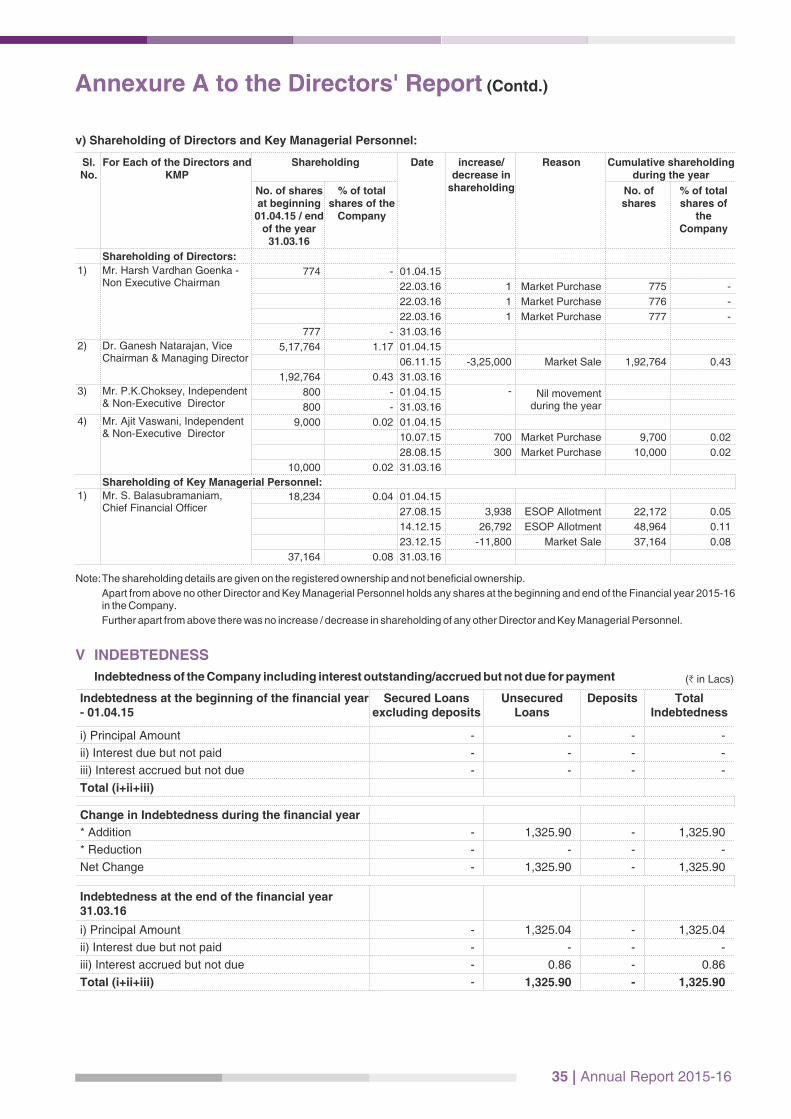
35 | Annual Report 2015-16
Annexure A to the Directors' Report (Contd.)
v) Shareholding of Directors and Key Managerial Personnel:
Sl. No.
For Each of the Directors and KMP
Shareholding Date increase/ decrease in
shareholding
Reason Cumulative shareholding during the year
No. of shares at beginning
01.04.15 / end of the year
31.03.16
% of total shares of the
Company
No. of shares
% of total shares of
the Company
Shareholding of Directors:
1) Mr. Harsh Vardhan Goenka - Non Executive Chairman
774 - 01.04.15
22.03.16 1 Market Purchase 775 -
22.03.16 1 Market Purchase 776 -
22.03.16 1 Market Purchase 777 -
777 - 31.03.16
2) Dr. Ganesh Natarajan, Vice Chairman & Managing Director
5,17,764 1.17 01.04.15
06.11.15 -3,25,000 Market Sale 1,92,764 0.43
1,92,764 0.43 31.03.16
3) Mr. P.K.Choksey, Independent & Non-Executive Director
800 - 01.04.15 - Nil movement during the year
800 - 31.03.16
4) Mr. Ajit Vaswani, Independent & Non-Executive Director
9,000 0.02 01.04.15
10.07.15 700 Market Purchase 9,700 0.02
28.08.15 300 Market Purchase 10,000 0.02
10,000 0.02 31.03.16
Shareholding of Key Managerial Personnel:
1) Mr. S. Balasubramaniam, Chief Financial Officer
18,234 0.04 01.04.15
27.08.15 3,938 ESOP Allotment 22,172 0.05
14.12.15 26,792 ESOP Allotment 48,964 0.11
23.12.15 -11,800 Market Sale 37,164 0.08
37,164 0.08 31.03.16
Note: The shareholding details are given on the registered ownership and not beneficial ownership.
Apart from above no other Director and Key Managerial Personnel holds any shares at the beginning and end of the Financial year 2015-16 in the Company.
Further apart from above there was no increase / decrease in shareholding of any other Director and Key Managerial Personnel.
V INDEBTEDNESS
Indebtedness of the Company including interest outstanding/accrued but not due for payment
Indebtedness at the beginning of the financial year - 01.04.15
Secured Loans excluding deposits
Unsecured Loans
Deposits Total Indebtedness
i) Principal Amount - - - -
ii) Interest due but not paid - - - -
iii) Interest accrued but not due - - - -
Total (i+ii+iii)
Change in Indebtedness during the financial year
* Addition - 1,325.90 - 1,325.90
* Reduction - - - -
Net Change - 1,325.90 - 1,325.90
Indebtedness at the end of the financial year 31.03.16
i) Principal Amount - 1,325.04 - 1,325.04
ii) Interest due but not paid - - - -
iii) Interest accrued but not due - 0.86 - 0.86
Total (i+ii+iii) - 1,325.90 - 1,325.90
(H in Lacs)
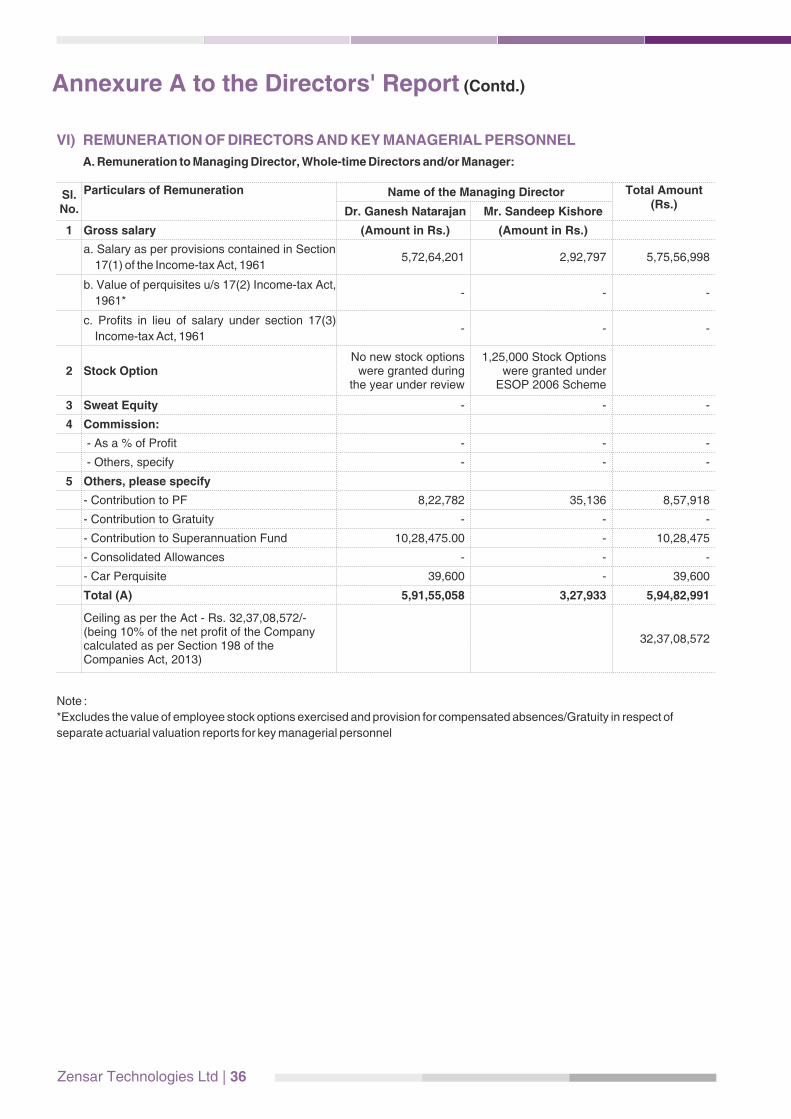
Zensar Technologies Ltd | 36
Annexure A to the Directors' Report (Contd.)
VI) REMUNERATION OF DIRECTORS AND KEY MANAGERIAL PERSONNEL
A. Remuneration to Managing Director, Whole-time Directors and/or Manager:
Sl. No.
Particulars of Remuneration Name of the Managing Director Total Amount (Rs.)
Dr. Ganesh Natarajan Mr. Sandeep Kishore
1 Gross salary (Amount in Rs.) (Amount in Rs.)
a. Salary as per provisions contained in Section
17(1) of the Income-tax Act, 1961 5,72,64,201 2,92,797 5,75,56,998
b. Value of perquisites u/s 17(2) Income-tax Act,
1961* - - -
c. Profits in lieu of salary under section 17(3)
Income-tax Act, 1961 - - -
2 Stock OptionNo new stock options
were granted during the year under review
1,25,000 Stock Options were granted under
ESOP 2006 Scheme
3 Sweat Equity - - -
4 Commission:
- As a % of Profit - - -
- Others, specify - - -
5 Others, please specify
- Contribution to PF 8,22,782 35,136 8,57,918
- Contribution to Gratuity - - -
- Contribution to Superannuation Fund 10,28,475.00 - 10,28,475
- Consolidated Allowances - - -
- Car Perquisite 39,600 - 39,600
Total (A) 5,91,55,058 3,27,933 5,94,82,991
Ceiling as per the Act - Rs. 32,37,08,572/- (being 10% of the net profit of the Company calculated as per Section 198 of the Companies Act, 2013)
32,37,08,572
Note :
*Excludes the value of employee stock options exercised and provision for compensated absences/Gratuity in respect of
separate actuarial valuation reports for key managerial personnel

37 | Annual Report 2015-16
Annexure A to the Directors' Report (Contd.)B
. R
em
un
era
tio
n t
o o
ther
dir
ecto
rs:
Sl.
No
.P
art
icu
lars
of
Rem
un
era
tio
n
Nam
e o
f D
irecto
rs
To
tal
Mr.
A. T
. V
asw
an
iM
r. P
. K
. C
ho
ksey
Mr.
P. K
. M
oh
ap
atr
aM
r. V
en
kate
sh
K
astu
rira
ng
an
Mr.
Su
dip
N
an
dy
Ms. M
ad
hab
i P
uri
Bu
ch
Mr.
H. V
. G
oen
ka
Mr.
Arv
ind
A
gra
wal
Mr.
Sh
ash
an
k
Sin
gh
Mr.
Jo
hn
L
evack
1In
dep
en
den
t D
irecto
rs
- F
ees
for
attendin
g B
oard
/ C
om
mitt
ee M
eetin
gs
9,0
2,0
00
4,5
8,0
00
6,4
5,0
00
3,0
0,0
00
2,2
5,0
00
3,7
5,0
00
-
-
-
-
29,0
5,0
00
- C
om
mis
sion
6,5
0,0
00
4,8
7,5
00
6,5
0,0
00
6,5
0,0
00
4,8
7,5
00
6,5
0,0
00
-
-
-
-
35,7
5,0
00
- O
thers
-
-
-
-
-
-
-
-
-
-
-
To
tal (1
) 15,5
2,0
00
9,4
5,5
00
12,9
5,0
00
9,5
0,0
00
7,1
2,5
00
10,2
5,0
00
-
-
-
-
64,8
0,0
00
2O
ther
No
n-
Execu
tive D
irecto
rs
- F
ees
for
attendin
g B
oard
/ C
om
mitt
ee M
eetin
gs
-
-
-
-
-
-
4,5
0,0
00
4,3
5,0
00
4,4
0,0
00
1,6
0,0
00
14,8
5,0
00
- C
om
mis
sion
-
-
-
-
-
-
2,8
5,7
5,0
00
-
3,2
5,0
00
3,2
5,0
00
2,9
2,2
5,0
00
- O
thers
-
-
-
-
-
-
-
-
-
-
-
To
tal (2
) -
-
-
-
-
-
2,9
0,2
5,0
00
4,3
5,0
00
7,6
5,0
00
4,8
5,0
00
3,0
7,1
0,0
00
To
tal (B
) =
(1+
2)
15,5
2,0
00
9,4
5,5
00
12,9
5,0
00
9,5
0,0
00
7,1
2,5
00
10,2
5,0
00
2,9
0,2
5,0
00
4,3
5,0
00
7,6
5,0
00
4,8
5,0
00
3,7
1,9
0,0
00
To
tal M
an
ag
eri
al R
em
un
era
tio
n*
9,6
6,7
2,9
91
Overa
ll C
eilin
g a
s p
er
the A
ct
**R
s. 3
5,6
0,7
9,4
29 ca
lcula
ted a
s per
Sect
ion 1
98 o
f th
e C
om
panie
s A
ct, 2013]
No
tes:
* T
ota
l rem
unera
tion to
Managin
g D
irect
or,
Whole
-Tim
e D
irect
ors
and o
ther D
irect
ors
(bein
g th
e to
tal o
f A a
nd B
).
**S
ittin
g fe
es
paid
have
not b
een c
onsi
dere
d a
s a c
om
ponent f
or r
eck
onin
g o
vera
ll ce
iling a
s per C
om
panie
s A
ct, 2
013
(Am
ou
nt
in R
s.)
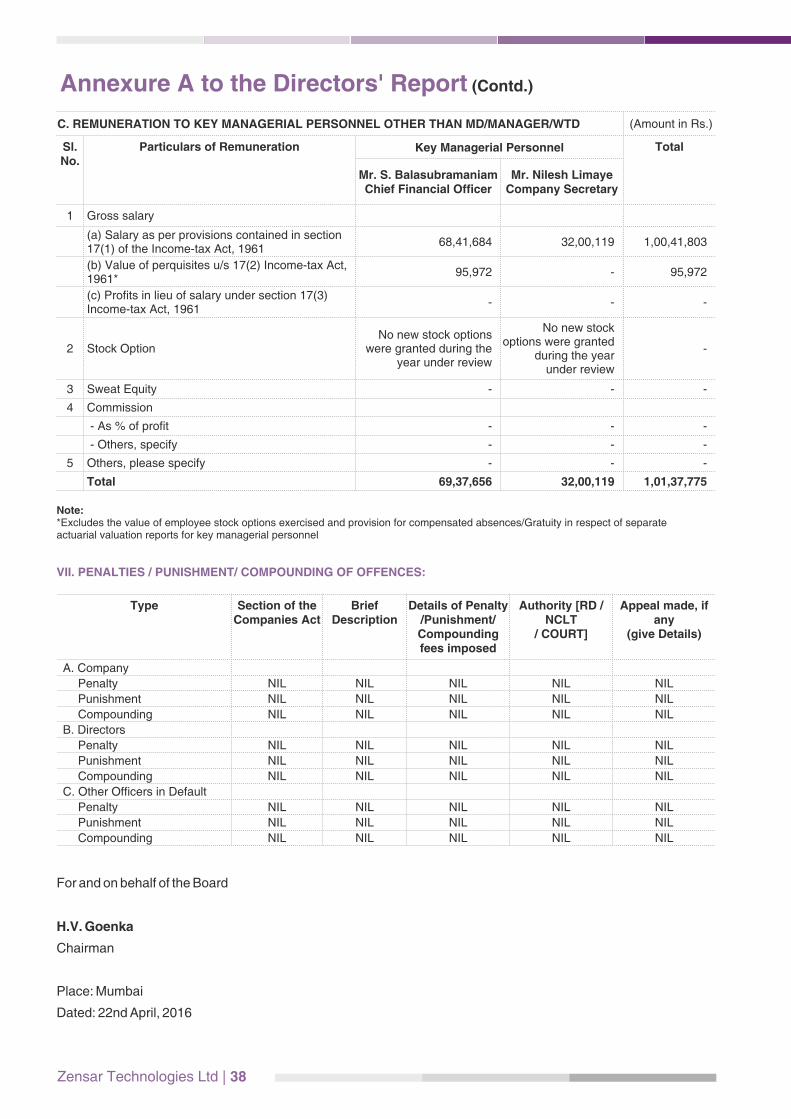
Zensar Technologies Ltd | 38
Annexure A to the Directors' Report (Contd.)
C. REMUNERATION TO KEY MANAGERIAL PERSONNEL OTHER THAN MD/MANAGER/WTD (Amount in Rs.)
Sl. No.
Particulars of Remuneration Key Managerial Personnel Total
Mr. S. Balasubramaniam Chief Financial Officer
Mr. Nilesh Limaye Company Secretary
1 Gross salary
(a) Salary as per provisions contained in section 17(1) of the Income-tax Act, 1961
68,41,684 32,00,119 1,00,41,803
(b) Value of perquisites u/s 17(2) Income-tax Act, 1961*
95,972 - 95,972
(c) Profits in lieu of salary under section 17(3) Income-tax Act, 1961
- - -
2 Stock OptionNo new stock options
were granted during the year under review
No new stock options were granted
during the year under review
-
3 Sweat Equity - - -
4 Commission
- As % of profit - - -
- Others, specify - - -
5 Others, please specify - - -
Total 69,37,656 32,00,119 1,01,37,775
Note:*Excludes the value of employee stock options exercised and provision for compensated absences/Gratuity in respect of separate actuarial valuation reports for key managerial personnel
VII. PENALTIES / PUNISHMENT/ COMPOUNDING OF OFFENCES:
Type Section of the Companies Act
Brief Description
Details of Penalty /Punishment/ Compounding fees imposed
Authority [RD / NCLT
/ COURT]
Appeal made, if any
(give Details)
A. Company
Penalty NIL NIL NIL NIL NIL
Punishment NIL NIL NIL NIL NIL
Compounding NIL NIL NIL NIL NIL
B. Directors
Penalty NIL NIL NIL NIL NIL
Punishment NIL NIL NIL NIL NIL
Compounding NIL NIL NIL NIL NIL
C. Other Officers in Default
Penalty NIL NIL NIL NIL NIL
Punishment NIL NIL NIL NIL NIL
Compounding NIL NIL NIL NIL NIL
For and on behalf of the Board
H.V. Goenka
Chairman
Place: Mumbai
Dated: 22nd April, 2016

39 | Annual Report 2015-16
NOMINATION AND REMUNERATION POLICY
Annexure B to the Directors' Report
1. Introduction:
This policy on Nomination and Remuneration of
Directors, Key Managerial Personnel and other
employees has been formulated in terms of the
provisions of the Companies Act, 2013 and the
Listing Agreement in order to pay equitable
remuneration to Directors, Key Managerial
Personnel and other employees of the Company.
2. Objective:
I. Formulate the cr i ter ia for determining
qua l ifica t ions , pos i t i ve a t t r ibu tes and
independence for appointment of a Director
(Executive/Non-Executive) and recommend to
the Board a policy relating to the remuneration
for the Directors, Key Managerial Personnel and
other employees.
II. To formulate the criteria for performance
evaluation of all Directors.
III. Formulate Board diversity policy.
3. Constitution of the Nomination and
Remuneration Committee:
The Board has constituted the Nomination and
Remuneration Committee (NRC) on 8th April, 2014
as per Companies Act, 2013.
4. Definitions:
“Act” means the Companies Act, 2013 and Rules
framed there under, as amended from time to time.
“Board” means Board of Directors of the Company.
“Company” means Zensar Technologies Limited
“Directors” means Directors of the Company.
“Independent Director” (ID) means a Director
referred to in Section 149 (6) of the Companies Act,
2013 and Rules made thereunder.
“Key Managerial Personnel “ (KMP) means
1. Chief Executive Officer or the Managing Director
or the Manager; and in their absence, a
Whole time Director;
2. Chief Financial Officer; and
3. Company Secretary
“Senior Management Personnel” (SMP) means
the employees of the company who are directly
reporting to the Managing Director/Chief Executive
Officer.
Unless the context otherwise requires, words and
expressions used in this policy and not defined
herein but defined in the Companies Act, 2013 as
may be amended from time to time shall have the
meaning respectively assigned to them therein.
5. Matters to be dealt with and recommended
by NRC to the Board
The following matters shall be dealt by the
Committee:
a) Directors
Formulate the cr i ter ia for determining
qua l ifica t ions , pos i t i ve a t t r ibu tes and
independence of a Director and recommending
candidates to the Board, when circumstances
warrants the appointment of a new Director,
having regard to the variety of skills, experience
and expertise on the Board and who will best
complement the Board.
b) Evaluation of performance
Making recommendations to the Board on
appropriate performance criteria for the
Directors. Formulate criteria and framework for
evaluation of every Director's performance.
Identifying familiarization and training programs
for the Board to ensure that Non- Executive
Directors are provided adequate information
regarding the operations of the business, the
i n d u s t r y a n d t h e i r d u t i e s a n d l e g a l
responsibilities
c) Board diversity
NRC is to assist the Board in ensuring Board
nomination process with diversity of gender,
t hough t , expe r i ence , know ledge and
perspective in the Board in accordance with the
Board diversity.
d) Remuneration framework and policies
NRC is responsible for reviewing and making
recommending to the Board on the following:
i. The remuneration of MD/CEO and KMPs.
ii. Remuneration of Non-executive Directors
and chairman.
iii. Remuneration Policy for all employees
including KMPs and SMPs which requires to
take note of need to:
a. Attract and motivate talent to accomplish
Company's long term growth.
Zensar Technologies Ltd | 40
b. Demonstrate a clear l ink between
e x e c u t i v e c o m p e n s a t i o n a n d
performance.
e) Company's stock option schemes.
6. Policy for appointment and retirement and
removal of Director, KMP and SMP:
A. Appointment criteria and qualifications
NRC shall identity person and criteria for the
qualification, expertise and experience of the
person for appointment as Director, KMP or SMP
and recommend to the Board h is /her
appointment.
B. Retirement
The Director, KMP and SMP shall retire as per
the provisions of the applicable Act, and the
prevailing policy of the Company. On the
recommendation of the NRC, the Board if it
considers to be in the Company's interest, shall
have the discretion to retain, Director, KMP and
SMP even after attaining the retirement age.
C. Removal
In case any Director or KMP incurs any
disqualification as provided under the Act or
Rules made thereunder or is in breach of Code of
Governance and Ethics adopted by the
Company, the NRC may recommend to the
Board removal of such Director or KMP.
7. Policy for remuneration to Directors,
MD/CEO, KMP, SMP
MD/CEO:
Remuneration to the MD/CEO shall be proposed by
the NRC and subsequently approved by the Board
of Directors and the shareholders of the Company,
whenever required.
NEDs:
i. NEDs shall be entitled to sitting fees as may be
decided by the Board of Directors from time to
time for attending the meeting of the Board and
sub Committees of the Board.
ii. Commission as may be recommended by NRC
and subsequently approved by the Board of
Directors and shareholders whenever required.
iii. The NEDs shall be eligible for remuneration of
such professional services rendered if in the
opinion of the NRC, the NED possesses the
requisite qualification for rendering such
professional services.
KMPs & SMPs:
The remuneration to be paid to the KMPs and
SMPs, shall be recommended by the NRC
consider ing re levant qual ificat ion and
experience of the individual as well as the
prevailing market condition. The remuneration
shall be combination of fixed and variable pay.
8. NRC may consider to grant Stock Options to
MD/CEO, KMPs, SMPs and other employees
pursuant to any Stock Option Plan adopted
by the Company.
9. General:
This policy is framed based on the provisions of the
Companies Act, 2013 and Rules thereunder and the
requirements of Clause 49 of the Listing Agreement
with Stock Exchanges. In case of any subsequent
changes in the provisions of the Companies Act,
2013 or any other Regulations which makes any of
the provisions in the policy inconsistent with the Act
or Regulations, then the provisions of the Act or
Regulations would prevail over the policy and the
provisions in the policy would be modified in due
course to make it consistent with law.
Annexure B to the Directors' Report (Contd.)
For and on behalf of the Board
H.V. Goenka
Chairman
Place: Mumbai
Dated: 22nd April, 2016
41 | Annual Report 2015-16
CONSERVATION OF ENERGY,
TECHNOLOGY ABSORPTION
A. RESEARCH & DEVELOPMENT (R&D)
Your Company is pleased to report that Research
and Development Program activities (program
recognized by Department of Science and Industrial
Research (DSIR), Department of Science and
Technology, Government of India in September
2008) are on schedule in the following areas:
Digital Enterprise Strategy
As most of the customers are embarking on the
digital transformation journey, your company is
engaged with customers to define their digital
strategy, architecture and implementation. The
SMAC (Social, Mobility, Analytics and Cloud) and
IOT are increasingly defining the new business
models across verticals.
Your company has built Social Command Center to
provide key insights to improve the customer
experience by leveraging the social data in the
various forms. The solution is showcased in Kharadi
campus at Pune.
Automation Technologies
Automation plays key role in overall reducing the
total cost of operations without compromising on the
service quality. Your company has focused in two
key areas of automation defined as ITPA (IT
Process Automation) and Robotics Process
Automation (RPA). Your company has engaged
with key partners in these areas to build
differentiated service offerings.
Your company has built platform for ITPA that
consolidates the IT operational data across multiple
ITSM, monitoring tools. It has feature to map IT
systems to business processes and helps to make
better investment decisions to improve operational
efficiency. It provides data insights which will enable
IT to act on corrective, preventive, adaptive &
perfective maintenance of the IT stack.
Your company has built platform called DigiSmart ,
an innovative Robotic Process Automation (RPA)
solution to transform hand-written or typed
documents images or physical documents into
digital documents. The solution is the combination
of machine and human intelligence to automate the
digitization process. The platform provides
significant cost and t ime savings for any
organization that uses paper documents for
capturing or presenting business information.
API Strategy and API Gateways
API Strategy is key part of overall digital strategy as
enterprises share the enterprise information
outside. Your company continues to focus on API
(Applicable Programming Interface) as many
mobility strategies are dependent on the API. The
API gateways plays pivotal role in the overall API
strategy along with API design for any enterprise.
Your company continues to engage with customers
to define their API strategy and its implementation
across verticals.
Global Delivery Platform/Solution BluePrint
Development
Your Company conceptualized and developed
Solution BluePrint (SBP) – a Framework for
leveraging automated software development, which
continues to be a framework of choice for our
associates in leveraging automation and model-
driven approaches in the software delivery lifecycle
based on software engineering practices prevalent
within the industry.
Your company has built multiple tools within
Solution Blueprint that focuses on the individual
phase in software lifecycle development. Your
company has built Application Requirement
Analyzer for requirements management and
Express Application System Modeler for system
design.
SOA (Service-Oriented Architecture) Toolkit
Service Oriented Architecture (SOA) is an approach
used to create an architecture based upon the use
of services. Services (such as RESTful Web
services) carry out some small function, such as
producing data, validating a customer, or providing
simple analytical services.
Your company has developed SOA toolkit. It is tool
that enables creation of high-quality and SOA-
based designs using industry best practices and
specifications. The toolkit incorporates engineering
practices to enable the design of complex, service-
oriented services for enterprise class systems
rapidly. It supports Model-driven Design (MDD) to
create system designs based on the SoaML
(Service oriented architecture modelling language).
Annexure C to the Directors' Report
Use of Emerging Technologies (DevOps, IoT,
Machine learning, predictive analytics)
Your company cont inues to develop the
competencies in the new technologies and trends.
The DevOps is defining the new operating model for
successful IT. Your company is engaged with its top
customers to assess and define the DevOps
roadmap for them.
Your company is evaluating industry leading IoT
platforms and build business cases for IoT across
manufacturing and retail verticals. Your company is
working on couple of assignments in IoT to
demonstrate the value from the data generated by
sensors, analyzing them and defining the optimum
operating model.
Your company is focusing on open source
technologies in the area of machine learning,
predictive analysis and applying to various business
scenarios across verticals and IT operations. Along
with analytics, your company continues to work on
visualization technologies.
B. T E C H N O L O G Y A D O P T I O N A N D
ASSIMILATION
Platform Adoption
As your company builds new IPs in the area of
digitization, automation platforms, multiple
technology practices then build them into their
respective service offerings. The newly defined
value propositions are then used in existing and new
customers. In addition to platform, your company
builds the competency in industry leading trends like
DevOps. These new trends are being offered as
new consulting services to the customers.
Ideas Assimilation
Your company has new ideation platform launched
this year where any associate can start with an idea.
The ideas are then evaluated and presented to
senior management for approval. Once the idea is
approved, it is built and then implemented internally
or at existing customer. The benefits are then
measured, analyzed and then rolled out to other
customers across Zensar.
Zensar Technologies Ltd | 42
Annexure C to the Directors' Report (Contd.)
For and on behalf of the Board
H.V. Goenka
Chairman
Place: Mumbai
Dated: 22nd April, 2016

43 | Annual Report 2015-16
Annexure D to the Directors' Report
1A
brief outli
ne o
f th
e c
om
pany'
s C
SR
polic
y, in
cludin
g o
verv
iew
of
pro
ject
s or
pro
gra
ms
pro
pose
d to b
e u
ndert
ake
n a
nd a
refe
rence
to t
he w
eb-lin
k to
the
CS
R p
olic
y a
nd p
roje
cts
or
Pro
gra
ms
CS
R P
olic
y of
the C
om
pany
is e
ncl
ose
d h
ere
with
. F
urt
he
r, t
he
de
tails
of
CS
R p
olic
y and a
ctiv
ities
of
the C
om
pany
are
ho
ste
d o
n w
eb
site
of
the
Co
mp
an
y o
n t
he
lin
k belo
w:
htt
p:/
/ww
w.z
ensa
r.co
m/a
bo
ut-
us/
csr/
csr-
po
licy
2T
he C
om
posi
tion o
f th
e C
SR
Com
mitt
ee.
In a
ccord
ance
with
Sect
ion 1
35
of
the
Co
mp
an
ies
Act
, 2
01
3 a
nd
th
e R
ule
s th
ere
under,
CS
R C
om
mitt
ee,
a s
ub
-Co
mm
itte
e o
f th
e B
oa
rd o
f D
ire
cto
rs h
as
be
en
co
nst
itute
d c
om
prisi
ng o
f D
r. G
an
esh
Na
tara
jan
, M
r. A
rvin
d A
gra
wa
l an
d M
r. P
. K
. M
ohapatr
a w
ith D
r. G
anesh
Na
tara
jan
as
the
Ch
airm
an
of
the
CS
R C
om
mitt
ee
.
3A
vera
ge n
et pro
flt o
f th
e c
om
pany
for
last
thre
e f
inanci
al y
ears
23,3
35
4P
resc
ribed C
SR
Exp
enditu
re (
two p
er
cent. o
fthe a
mount
as
in ite
m 3
above
)467
5D
eta
ils o
f C
SR
spent during the fin
anci
al y
ea
r.
(a
) Tota
l am
ount t
o b
e s
pent f
or t
he fi
nanci
al y
ear
467
(b
) Am
ount u
nsp
ent, if
any
5
(c
) Manner in
whic
h th
e a
mount s
pent d
uring th
e fi
nanci
al y
ear is
giv
en b
elo
w
AN
NU
AL
RE
PO
RT
ON
CS
R A
CT
IVIT
IES
(1)
(2)
(3)
(4)
(5)
(6)
(7)
(8)
Sl.
No
. C
SR
Pro
ject
or
Acti
vit
y Id
en
tifi
ed
Secto
r in
Wh
ich
th
e P
roje
ct
is C
overe
dP
roje
cts
or
Pro
gra
ms
Am
ou
nt
Ou
tlay
(Bu
dg
et)
P
roje
ct
or
Pro
gra
m w
ise
Am
ou
nt
Sp
en
t o
n P
roje
cts
o
r P
rog
ram
s
Cu
mu
lati
ve
Exp
en
dit
ure
up
to
th
e r
ep
ort
ing
p
eri
od
Am
ou
nt
Sp
en
t:
Dir
ect
or
thro
ug
h
imp
lem
en
tin
g
ag
en
cy
Lo
cal A
rea
or
Oth
er
Sp
ecif
y t
he s
tate
an
d
dis
tric
t w
here
pro
jects
or
pro
gra
ms w
ere
un
dert
aken
Dir
ect
Exp
en
ses
Overh
ead
s
1D
onatio
n to Z
ensa
r F
oundatio
nS
ect
ors
cove
red u
nder
Sch
edule
VII a
ppended to the
Com
panie
s A
ct, 2013. B
rief
deta
ils o
f pro
gra
ms
are
m
entio
ned in
Table
A b
elo
w
as
well
as
in the B
oard
's
Report
Loca
l Are
aP
une, M
ahara
shtr
a &
H
ydera
bad, A
ndra
Pra
desh
317
317
-
-
Am
ount paid
direct
ly
by
the C
om
pany
to
Zensa
r F
oundatio
n ,
An im
ple
mentin
g
agency
and s
pent
by
Zensa
r F
oundatio
n
2T
rain
ing p
rogrm
mes
for
Em
plo
yabili
ty &
Ski
ll D
eve
lopm
ent
Em
plo
yabili
ty E
nhance
me
nt
Loca
l Are
aP
une, M
ahara
shtr
a
150
145
-
-
Direct
ly
To
tal
467
462
-
-
Gra
nd
To
tal
462
Zensar Technologies Ltd | 44
6 The reasons for not to spend the two per cent of the average net profit ofthe last three financial years are stated in
Board report
7 CSR Committee hereby states that the implementation and monitoring of CSR Policy, is in compliance with CSR
objectives and Policy of the company
Dr. Ganesh Natarajan M r. Sandeep Kishore
Chairman of the Corporate Social M anaging Director and CEO
Responsibility Committee
Annexure D to the Directors' Report (Contd.)
Table A
Sr No
Programme Details Sector in which covered
1 Udaan English program, Health programs, Community mobilization. Gender Equity Program, Mentoring Program, School Programs
Community development
2 Training progrmmes for Employability & Skill Development, Unnati employability program Employability enhancement
3 Udaan Biodiversity Park, Development of a terrace garden Environment Sustenance
4 National Digital Literacy Centers in Anjaiah Nagar (Hyderabad) , Sudumbre (Pune Rural) , Ambedkar Vasti (Chandan Nagar, Pune) and Yamuna Nagar (Pune) Community and through Digital Literacy Buses
Digital Literacy
Zensar Foundation, a trust established by Zensar
Technologies Limited (Zensar), leads Zensar's social
outreach programs. Zensar Technologies also
undertakes a few CSR programs outside of Zensar
Foundation.
As a responsible business corporation, we take pride in
being socially committed and focused on building
susta inable and ef fect ive Corporate Socia l
Responsibility (CSR) initiatives by focusing on three
pillars - Community Development, Employability
Enhancement and Environment Sustenance. The
management has a strong belief in the merits of
participation in CSR by the employees of Zensar and
therefore, places much emphasis on employee
volunteering for CSR activities. We choose to work in
the neighbourhood of Zensar locations, so as to
engage in an interactive and harmonious relationship
with the communities around.
Partnerships
Zensar Foundation is an 'implementing organization'
and is directly involved in the CSR projects being
undertaken. Collaborative partnerships are formed with
both, Government & Non-Government Organisations
(NGOs) for example, Pune Municipal Corporation
(PMC), Unnati Foundation, Connecting NGO, Equal
Community Foundation (ECF), and other like-minded
stakeholders. This helps widen the Company's reach
and leverages the collective expertise, wisdom and
experience that these partnerships bring to the issues
that Zensar is committed to.
Budget
Each year, the budget for CSR spend is in line with the
provisions under the Companies Act, 2013 in this
regard. The budget is project driven and approved by
the CSR Committee. Any surplus arising out of CSR
programs shall not form part of the business profit of
Zensar and would be ploughed back to the CSR corpus
for spending on CSR projects only.
Monitoring mechanism and responsibilities
Zensar has a CSR team comprising of personnel
having adequate experience and passion for CSR
activities. CSR team is responsible for implementation
Corporate Social Responsibility Policy – Zensar Technologies Limited
For and on behalf of the Board
H.V. Goenka
Chairman
Place: Mumbai
Dated: 22nd April, 2016

Circles of InfluenceZensar aspires to expand its circle of influence outwards
current location: Zensar Foundation is entering the second circle
Founda�on
Achieving industry and city-wide impact through the adoption of demonstrable models;
achieving multiplier effect through employees and leaders demonstrating individual social responsibility.
c iti
zen
ship
and
larg
ersy
stem
s
go
vern
ance
and
lead
ersh
ip
Building small replicable models in the areas of community, school,
employability and volunteering programmes.
demonstrable models
Extending influence to the entire unit; unit being community/school/Zensar. Emergence of leaders within each of
these systems, as change-makers.
45 | Annual Report 2015-16
Annexure D to the Directors' Report (Contd.)
and execution of CSR projects/programs. All projects are reviewed once every 6 months against targets and
approved budgets by CSR Committee and wherever necessary, midcourse corrections are initiated.
CSR strategy and details about CSR Committee are given in Appendix 1 & 2 respectively.
Appendix 1: CSR Strategy
A core tenet of the CSR strategy is the creation of demonstrable, scalable and replicable models of operation, which
can be taken up by other corporates, thus expanding the circle of influence both within and across cities.
Zensar aspires to expand its circle of influence through:
Appendix 2: CSR Committee
Corporate Social Responsibility (CSR) Committee:
In accordance with Section 135 of the Companies Act, 2013 and the Rules thereunder, CSR Committee, a sub-
Committee of the Board of Directors has been constituted comprising Dr. Ganesh Natarajan, Mr. Arvind Agrawal
and Mr. P. K. Mohapatra with Dr. Ganesh Natarajan as the Chairman of the CSR Committee.
The CSR Committee shall act in accordance with following terms of reference:
1. Formulate and recommend a Corporate Social Responsibility Policy to the Board.
2. Recommend the amount of expenditure to be incurred on the activities.
3. Institute a transparent monitoring mechanism for implementation of the CSR projects or programs or activities
undertaken by the company which would form a part of CSR Policy.
4. Monitor CSR Policy of the Company.
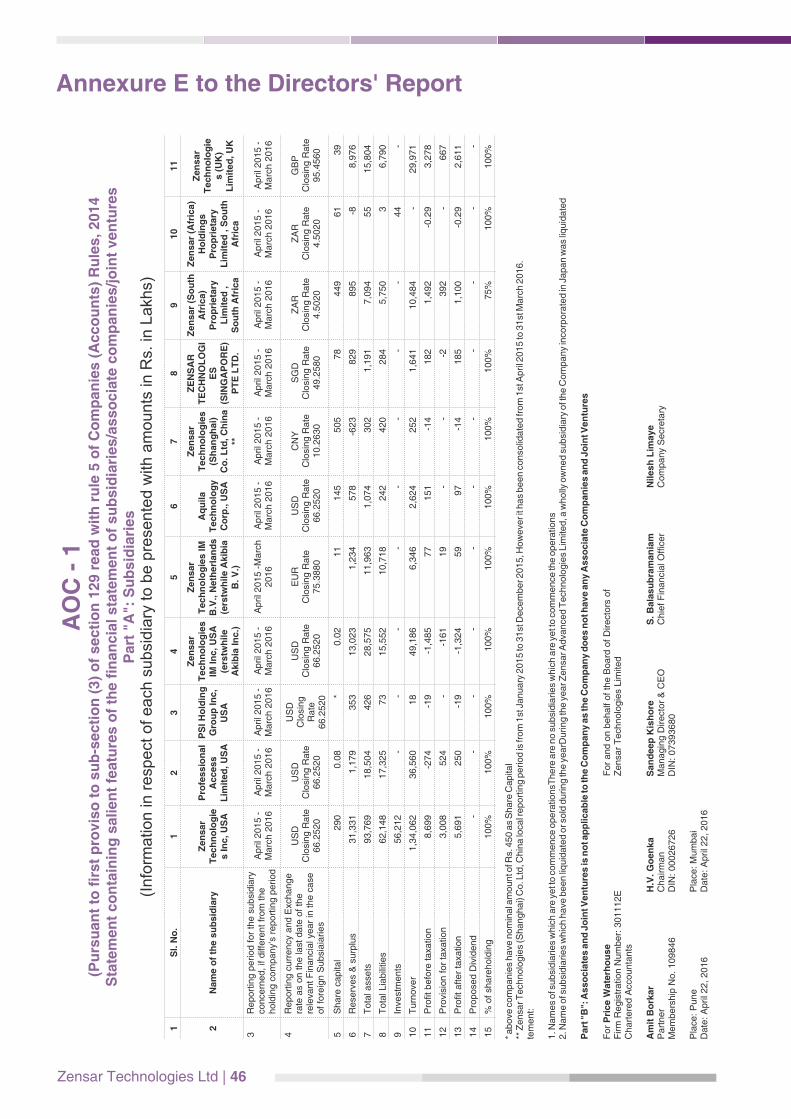
Annexure E to the Directors' ReportA
OC
- 1
(Pu
rsu
an
t to
firs
t p
rovis
o t
o s
ub
-secti
on
(3)
of
secti
on
129 r
ead
wit
h r
ule
5 o
f C
om
pa
nie
s (
Ac
co
un
ts)
Ru
les
, 2
01
4
Sta
tem
en
t co
nta
inin
g s
alien
t fe
atu
res o
f th
e fi
nan
cia
l sta
tem
en
t o
f su
bsid
iari
es/a
ss
oc
iate
co
mp
an
ies
/jo
int
ve
ntu
res
P
art
"A
": S
ub
sid
iari
es
(Info
rmatio
n in
re
spect
of each
subsi
dia
ry to b
e p
rese
nte
d w
ith a
mounts
in R
s. in
Lakh
s)
1S
l. N
o.
12
34
56
78
91
01
1
2N
am
e o
f th
e s
ub
sid
iary
Zen
sar
Tech
no
log
ies In
c, U
SA
Pro
fessio
nal
Access
Lim
ite
d,
US
A
PS
I H
old
ing
G
rou
p I
nc,
US
A
Zen
sar
Tech
no
log
ies
IM I
nc,
US
A
(ers
twh
ile
Akib
ia I
nc.)
Zen
sar
Tech
no
log
ies I
M
B.V
., N
eth
erl
an
ds
(ers
twh
ile A
kib
ia
B.
V.)
Aq
uil
a
Tech
no
log
y
Co
rp.,
US
A
Zen
sa
r T
ech
no
log
ies
(S
han
gh
ai)
C
o.
Ltd
, C
hin
a
**
ZE
NS
AR
T
EC
HN
OL
OG
IE
S
(SIN
GA
PO
RE
) P
TE
LT
D.
Ze
ns
ar
(So
uth
A
fric
a)
Pro
pri
eta
ry
Lim
ite
d ,
So
uth
Afr
ica
Ze
ns
ar
(Afr
ica
) H
old
ing
s
Pro
pri
eta
ry
Lim
ite
d , S
ou
th
Afr
ica
Ze
ns
ar
Te
ch
no
log
ies
(U
K)
Lim
ite
d, U
K
3R
eport
ing p
eriod for
the s
ubsi
dia
ry
conce
rned, if
diff
ere
nt fr
om
the
hold
ing c
om
pany’s
report
ing p
eriod
April 2
015 -
Marc
h 2
016
April 2
015 -
Marc
h 2
016
April 2
015 -
Marc
h 2
016
April 2
015 -
Marc
h 2
016
April 2
015 -
Marc
h
2016
April 2
015 -
Marc
h 2
016
April 2
01
5 -
Marc
h 2
01
6A
pril 2
01
5 -
Ma
rch
20
16
Ap
ril 2
01
5 -
Ma
rch
20
16
Ap
ril 2
01
5 -
Ma
rch
20
16
Ap
ril 2
01
5 -
Ma
rch
20
16
4R
eport
ing c
urr
ency
and E
xchange
rate
as
on the la
st d
ate
of th
e
rele
vant F
inanci
al y
ear
in the c
ase
of fo
reig
n S
ubsi
aia
ries
US
DC
losi
ng R
ate
66.2
520
US
DC
losi
ng R
ate
66.2
520
US
DC
losi
ng
Rate
66.2
520
US
DC
losi
ng R
ate
66.2
520
EU
RC
losi
ng R
ate
75.3
880
US
DC
losi
ng R
ate
66.2
520
CN
YC
losi
ng R
ate
10.2
63
0
SG
DC
losi
ng
Ra
te
49
.25
80
ZA
RC
losi
ng
Ra
te4
.50
20
ZA
RC
losi
ng
Ra
te4
.50
20
GB
PC
losi
ng
Ra
te
95
.45
60
5S
hare
capita
l 290
0.0
8
*
0.0
2
11
145
5
05
7
8
4
49
6
1
3
9
6R
ese
rves
& s
urp
lus
31,3
31
1,1
79
353
13,0
23
1,2
34
578
-6
23
8
29
8
95
-
8
8
,97
6
7T
ota
l ass
ets
93,7
69
18,5
04
426
28,5
75
11,9
63
1,0
74
3
02
1
,19
1
7
,09
4
5
5
1
5,8
04
8T
ota
l Lia
bili
ties
62,1
48
17,3
25
73
15,5
52
10,7
18
242
4
20
2
84
5
,75
0
3
6
,79
0
9In
vest
ments
56,2
12
-
-
-
-
-
-
-
-
4
4
-
10
Turn
ove
r 1,3
4,0
62
36,5
60
18
49,1
86
6,3
46
2,6
24
2
52
1
,64
1
1
0,4
84
-
2
9,9
71
11
Pro
fit b
efo
re taxa
tion
8,6
99
-274
-19
-1,4
85
77
151
-1
4
1
82
1
,49
2
-0
.29
3
,27
8
12
Pro
visi
on for
taxa
tion
3,0
08
524
-
-161
19
-
-
-2
3
92
-
6
67
13
Pro
fit a
fter
taxa
tion
5,6
91
250
-19
-1,3
24
59
97
-1
4
1
85
1
,10
0
-0
.29
2
,61
1
14
Pro
pose
d D
ivid
end
-
-
-
-
-
-
-
-
-
-
-
15
% o
f sh
are
hold
ing
100%
100%
100%
100%
100%
100%
10
0%
10
0%
75
%1
00
%1
00
%
* a
bove
com
panie
s have
nom
inal a
mount o
f Rs.
450 a
s S
hare
Capita
l**
Zensa
r Tech
nolo
gie
s (S
hanghai) C
o. L
td, C
hin
a lo
cal r
eport
ing p
eriod is
from
1st
January
2015 to
31st
Dece
mber 2015, H
ow
eve
r it
has
been c
onso
lida
ted
fro
m 1
st A
pril 2
01
5 to
31
st M
arc
h 2
01
6.
tem
ent:
1. N
am
es
of s
ubsi
dia
ries
whic
h a
re y
et t
o c
om
mence
opera
tionsT
here
are
no s
ubsi
dia
ries
whic
h a
re y
et t
o c
om
mence
the o
pera
tions
2. N
am
e o
f subsi
dia
ries
whic
h h
ave
been li
quid
ate
d o
r sold
during th
e y
earD
uring th
e y
ear Z
ensa
r Adva
nce
d T
ech
nolo
gie
s Lim
ited, a
wholly
ow
ned s
ubsi
dia
ry o
f th
e C
om
pa
ny
inco
rpo
rate
d in
Ja
pa
n w
as
liqu
ida
ted
Part
"B
": A
sso
cia
tes a
nd
Jo
int V
en
ture
s is
no
t ap
plicab
le to
the C
om
pan
y a
s th
e C
om
pan
y d
oes n
ot h
ave a
ny A
sso
cia
te C
om
pan
ies a
nd
Jo
int V
en
ture
s
Fo
r P
rice W
ate
rho
use
For
and o
n b
ehalf
of
the B
oard
of
Direct
ors
of
Firm
Regis
tratio
n N
um
ber:
301112E
Zensa
r T
ech
nolo
gie
s Lim
ited
Chart
ere
d A
ccounta
nts
Am
it B
ork
ar
H.V
. G
oen
ka
San
deep
Kis
ho
re
S.
Bala
su
bra
man
iam
N
ilesh
Lim
ay
eP
art
ner
Chairm
an
Managin
g D
irect
or
& C
EO
C
hie
f F
inanci
al O
ffice
r C
om
pany
Secr
eta
ryM
em
bers
hip
No. 109846
DIN
: 00026726
DIN
: 07393680
Pla
ce: P
une
Pla
ce: M
um
bai
Date
: A
pril 2
2, 2016
Date
: A
pril 2
2, 2016
Zensar Technologies Ltd | 46
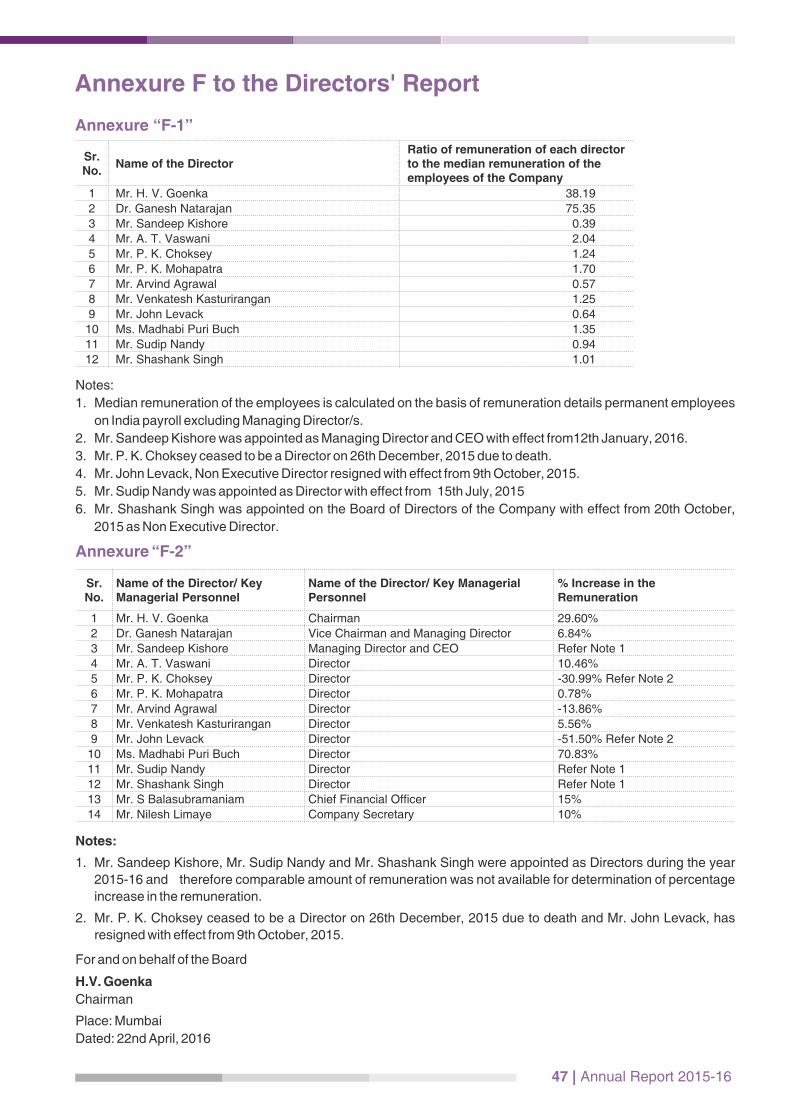
47 | Annual Report 2015-16
Annexure F to the Directors' Report
Annexure “F-1”
Sr. No.
Name of the DirectorRatio of remuneration of each director to the median remuneration of the employees of the Company
1 Mr. H. V. Goenka 38.19
2 Dr. Ganesh Natarajan 75.35
3 Mr. Sandeep Kishore 0.39
4 Mr. A. T. Vaswani 2.04
5 Mr. P. K. Choksey 1.24
6 Mr. P. K. Mohapatra 1.70
7 Mr. Arvind Agrawal 0.57
8 Mr. Venkatesh Kasturirangan 1.25
9 Mr. John Levack 0.64
10 Ms. Madhabi Puri Buch 1.35
11 Mr. Sudip Nandy 0.94
12 Mr. Shashank Singh 1.01
Notes:
1. Median remuneration of the employees is calculated on the basis of remuneration details permanent employees
on India payroll excluding Managing Director/s.
2. Mr. Sandeep Kishore was appointed as Managing Director and CEO with effect from12th January, 2016.
3. Mr. P. K. Choksey ceased to be a Director on 26th December, 2015 due to death.
4. Mr. John Levack, Non Executive Director resigned with effect from 9th October, 2015.
5. Mr. Sudip Nandy was appointed as Director with effect from 15th July, 2015
6. Mr. Shashank Singh was appointed on the Board of Directors of the Company with effect from 20th October,
2015 as Non Executive Director.
Annexure “F-2”
Sr. No.
Name of the Director/ Key Managerial Personnel
Name of the Director/ Key Managerial Personnel
% Increase in the Remuneration
1 Mr. H. V. Goenka Chairman 29.60%
2 Dr. Ganesh Natarajan Vice Chairman and Managing Director 6.84%
3 Mr. Sandeep Kishore Managing Director and CEO Refer Note 1
4 Mr. A. T. Vaswani Director 10.46%
5 Mr. P. K. Choksey Director -30.99% Refer Note 2
6 Mr. P. K. Mohapatra Director 0.78%
7 Mr. Arvind Agrawal Director -13.86%
8 Mr. Venkatesh Kasturirangan Director 5.56%
9 Mr. John Levack Director -51.50% Refer Note 2
10 Ms. Madhabi Puri Buch Director 70.83%
11 Mr. Sudip Nandy Director Refer Note 1
12 Mr. Shashank Singh Director Refer Note 1
13 Mr. S Balasubramaniam Chief Financial Officer 15%
14 Mr. Nilesh Limaye Company Secretary 10%
Notes:
1. Mr. Sandeep Kishore, Mr. Sudip Nandy and Mr. Shashank Singh were appointed as Directors during the year
2015-16 and therefore comparable amount of remuneration was not available for determination of percentage
increase in the remuneration.
2. Mr. P. K. Choksey ceased to be a Director on 26th December, 2015 due to death and Mr. John Levack, has
resigned with effect from 9th October, 2015.
For and on behalf of the Board
H.V. Goenka
Chairman
Place: Mumbai
Dated: 22nd April, 2016
Annexure G to the Directors' Report (Contd.)
Management Discussion and Analysis
CORPORATE PROFILE
Zensar is a leading digital solutions and technology
services company that specializes in partnering global
organizations across industries on their Digital
Transformation Journey. A technology partner of
choice, backed by a strong record of innovation,
credible investment in Digital solutions; assertion of
commi tmen t to c l i en t ' s success , Zensar ' s
comprehensive range of digital and technology
services and solutions enable its customers to achieve
new thresholds of business performance. Zensar, with
its experience of delivering excellence and superior
client satisfaction through myriad technology solutions
is uniquely positioned to help them surpass challenges
around running their existing business most efficiently,
helping in their legacy transformation, and planning for
business expansion and growth through innovative and
digital ways.
DIGITAL
Zensar helps clients deliberate not only on executing
Digital initiatives but also realizing the Return on Digital.
The Return on Digital is about focusing on business
outcomes. It is about focusing on key aspects like
Automation, Customer Experience, Business
Resilience, Standardization etc. of the core back end
systems to help realize the Digital World of today and
tomorrow. In summary, for enterprises to be resilient
and successful in the long run-they will need to focus on
three aspects-Digital Agility, Cross-over IT and
fundamentally, the stability of core enterprise systems.
Digital is the business. Digital delivery is fundamentally
aligned to business outcome, and Zensar's business
model is evolving to meet the pace of change in its
customer's customer base.
GEOGRAPHIC NETWORK
Our business is well spread across 29 global locations
with presence in the key regions of US, Europe, Africa,
Middle East, India and APAC. Having 11 global delivery
centers, we support customers 365 days, 24x7. We
remain well-entrenched, with both managerial and
technical talent on ground across these worldwide
markets. This outlines our objective of being close to
our customers for optimum delivery results.
SERVICES AND CAPABILITY
Your company is well poised to help global enterprises
deliver across both traditional and new and emerging
technologies equally. Aimed at helping customers
navigate through complexity in their IT environment,
our solutions and capabilities are designed to leverage
digital tools and technologies to generate maximum
outcomes.
Zensar's services and capabilities portfolio spans
across both the traditional to digital tools.
Our services include Consulting, Business Application
Serv ices , Enterpr ise So lu t ions , Enterpr ise
Collaboration Services, Testing and Assurance
Services, BPM, Infrastructure Management Services
and Digital Enterprise.
Our objective has been to keep innovating with agile
and speedy solutions, having a clear goal of extracting
business outcomes for the customers within clearly
defined timelines. This route helps us maintain the
competitive edge as well as deliver consistent
enhanced services.
With new propositions in the realm of digital and cloud
led capabilities, analytics, automation we will continue
to build deeper relationships as we strive ahead to
partner customers across key technology innovations
and platforms.
CLIENTS OVERVIEW
In the last year, your company has seen growth from
existing client engagements and the addition of new
ones across all the key regions. Some of our existing
customers have taken ahead the relationship with
extended engagements and new implementations
spread over the next 3-5 years. The year has also seen
some key partnerships achieving key milestones in
terms of the kind of work done and the number of years
completed. This fact clearly underlines our continued
commitment to industry leading service excellence.
Some of the key additions were in the space of
ecommerce, digital, retail, manufacturing and utilities.
The common thread remains the renewed focus on
enhanced capabilities across all digital tools and
technologies, coupled with new methodologies like
DevOps and Agile.
We have also seen significant work done is the realm of
organization wide implementation of key technology
solutions. Our strategy will continue in introducing
innovative ways to engage with customers to help
achieve specific business outcomes and enable them
to be competitive in the marketplace.
T R A N S F O R M A T I O N A L C U S T O M E R
MANAGEMENT AND SERVICE DELIVERY
EXCELLENCE
One of the key differentiators of the Zensar approach to
Zensar Technologies Ltd | 48
client management lies in our partnership-led
engagement model. Your company goes beyond the
scope, to be a guide and an execution driver at all times
of the project lifecycle. It is this one single factor that has
helped us build long-standing relationships with leading
global enterprises.
Many of our existing customers proactively seek our
strategic inputs as they look towards embarking on their
digital journey. Our teams are cognizant of the critical
business impact, each project must have on the
customer's business objectives. This helps us in going
beyond the norm and becoming a true strategic IT
partner, rather than remaining a service provider.
Your company intends to continue building on the
strength of its excellent service delivery culture and
imbibe leading best practices to remain ahead of the
curve at all times. Our global delivery model will see
increased attention and training to ensure that
customers glean the best from us.
C U R R E N T S T R E N G T H A N D F U T U R E
PROJECTIONS
In the midst of a challenging business environment,
your company has continued on its growth trajectory,
building on key customer relationships across all our
regions of operations. We saw our strategic acquisition
of one of the largest Oracle ATG and Endeca partners,
Professional Access (PA) contribute significantly to our
e-commerce success story. Deeper learnings and
company-wide integration resulted in a competitive go
to market positioning in the burgeoning ecommerce
and Oracle space. Oracle continued to be a leading
arrowhead with us having the largest Oracle
Commerce practice worldwide.
Digital transformation services and offerings enabled
our customers to leverage business outcomes that
were strategic and long-ranging. Vertical offerings
continued to drive growth with differentiated
capabilities in retail, manufacturing and Oracle setting
the foundation for expansion. We were able to offer
social listening benefits to more industries like
insurance who are looking to engage increasingly with
customers using the digital medium.
Our FY16 3x3x3 strategic focus in the 3 geographies of
the US, UK and Africa; key verticals of retail,
manufacturing and insurance; across application
management services, digital and infrastructure
management helped us in remaining profitable, amidst
a volatile market.
Digital and ecommerce proved to be one of the key
contributors to our growth. We were able to empower
an increased number of customers leverage new and
emerging trends, while remaining secure and stable at
the backend.
Oracle offerings and in particular, Oracle Cloud
remained one of our biggest focus areas through the
past year. We continued building on market trends of
analytics, mobility and new organizational approaches
to technology adoption. Our Pune campus has
Zensar's first innovation platform of Oracle Cloud
offerings. Our Oracle e-Commerce positioning was
strengthened by combining Zensar's Oracle EBS,
Oracle Retail and Fusion Middleware solutions for
global clients with Professional Access (PA) expertise
in these areas.
Zensar's Infrastructure Management practice, with
focus on data centre management, security and
compliance, network and end user computing saw
increased engagements with key customers. The year
saw this business gain from enterprises investing in
next-generation solutions around end user computing,
mobility and cloud. Your company was positioned in the
July 2015 Gartner Magic Quadrant for Data Center
Outsourcing and Infrastructure Utility Services, North
America. The industry-wide recognition has provided
us with increased visibility and thought leadership.
Our key levers of expansion and growth continue to
remain our consistent delivery excellence, in-depth
expertise and digital preparedness. Backed by
increasing demand for cloud-led services, we are well
positioned to deliver on leading market enterprise
technologies with our consulting expertise and delivery
networks.
Talent building, key initiatives to retain and train
existing talent across levels was an important focus
area for us in 2015 and will continue to remain going
forward too. In order to foster a culture of innovation and
growth, your company did away with the bell curve
system of performance appraisals. Introduction of
globally recognized systems like 360 degree feedback,
customized training and learning roadmaps as well as a
newly formed HR operations team, your company is
well posed to build the future workplace of choice.
APAX PARTNERS
Marina Holdco (FPI) Ltd., a fund advised by Apax
Partners acquired a 23.2% stake in your company in
line with our objective to add significant value in the next
phase of our growth. Apax Partners is an independent
global partnership focused solely on long-term
investment in growth companies having USD 40 billion
Annexure G to the Directors' Report (Contd.)
49 | Annual Report 2015-16

of portfolio investments across leading global
companies. Your company will leverage their
successful track record in the technology services
space, gaining access to a wider global customer base
and best industry practices.
THE INDUSTRY LANDSCAPE IN 2016 – 17
Global IT sourcing market grew at 9-10% in 2015, in
comparison to the previous year, with India contributing
67% to the overall growth. The worldwide IT BPM
spend was USD 1.2 trillion. Global IT spend (excluding
hardware) stood at more than USD 160 billion.
One of the highlights going forward across the way
global enterprises plan their IT budgets includes 51%
spend towards new and digital technologies like cloud,
mobile and big data. According to industry estimates,
approximately 67% of the Global 2000 companies will
have digital transformation at the core of their corporate
planning and strategy. Market trends clearly lead with
digital and bi-modal IT taking consumption of
technology to a new adoption rates across multi-
industry enterprises.
WORLDWIDE IT-BPM SPEND
The worldwide IT-BPM spend through 2015 saw a
growth of 0.4% amounting to USD 1.2 trillion. The
growth curve remained flat, as a result of the multiple
volatilities faced by the worldwide IT sector.
In contrast to the flat global spend trends, the
outsourcing services segment continued on a growth
path reporting a growth of 8.5%. India retained the top
spot as the leading destination for outsourcing
services, commanding 56% share globally. Last year
saw an increase in the number of worldwide delivery
centres at 169 in total, at a growth rate of 13%, with
India and Europe standing at 55% share. This was
primarily in new and futuristic technologies like
automation, robotics, IoT, connected enterprises and
more. All digital technologies, including cloud, mobility,
and social media are playing a pivotal role in driving
new ways of implementing technology.
• BFSI and manufacturing remained the leading
verticals on the growth path like last year at 60%
• Healthcare, retail, utilities and government
increased adoption at the rate of 12% across digital
technologies like social, mobility, analytics and the
cloud
• CADM, as a segment saw maximum growth driven
by digital transformation and mobility
• Bundled services were responsible for the average
deal per value
Global IT sourcing market grew at 9-10% in 2015, with
India contributing 67% to the overall growth. The year
saw increased M&A activity with buyouts, spinoffs,
mergers and acquisitions adding to various industry-
wide changes. Some IT players saw organic and
inorganic growth and business restructuring in some
companies.
IT services deals saw a significant growth over 2014 at
57% with an increase in number of deals standing at
19%. While the total number of deals decreased, there
was a significant increase in the deal value size. This
was a clear indicator with companies wanting to
develop competitive capabilities to remain relevant and
leverage the benefits of digital led market trends.
America led deals grew by 50% and APAC grew 2X
over the Americas. 70% of the deals were in the IT
bundled and ICT services, with SMAC deals were
valued at USD 2.6 billion. Europe grew at a small rate at
4%.
One of the key common denominators influencing IT
decisions continued to be integration of digital
technologies in different forms. The overall industry and
business climate bore the brunt of multiple challenging
trends–geopolitical, economy led and financial
instability. Even in this tumultuous scenario, digital has
contributed with interesting work being done in the area
of robotics, cloud models, applications, Industrial
internet and automation.
The Indian IT-BPM sector stood at USD 132 billion in
2015 and was projected to grow at 8.5% to USD 143
billion (excluding ecommerce) in 2016. This industry is
expected to employ approximately 3.7 million people,
constituting an addition of 200,000 individuals. The
ecommerce market is expected to be USD 16.7 billion,
a growth of 19% over last year. India has assumed the
distinction of becoming the third largest destination for
start-ups. Key contributors were IT services at 52%,
BPM at 20%, ER&D and packaged software at 19%
and hardware at 10%.
Indian IT-BPM exports reported a growth of 10.3%,
valued at USD 108 billion. Leading drivers of the growth
were ER&D and product development at 12.6%,
influenced by connected devices and demands across
customer 's increasing interest in emerging
technologies. Modernization of legacy and traditional
systems has seen significant increase as customers
demand SMAC tools and technologies. IT services
remains on the same growth path as the overall IT-BPM
Annexure G to the Directors' Report (Contd.)
Zensar Technologies Ltd | 50
exports. Key technologies driving the year on year
growth of 9% include analytics, BPaaS and Mobility.
(Source: NASSCOM Strategic Review 2016)
VERTICAL STRATEGY DELIVERS RESULTS
Our vertical led strategy helped us to deliver more value
and expertise to customers. Verticals seeing growth
due to this approach include retail, manufacturing and
banking, insurance. We have subject matter experts
who combine technical expertise with the vertical
implementation knowledge, leading to enhanced
service and delivery models. We will continue to take
this vertical approach ahead, strengthening it with
digital led capabilities.
SERVICE LINES
Zensar continues to display consistent growth due to its
comprehensive capabilities. Application management
continued to contribute significantly, followed by
Infrastructure management. Our digital commerce
capability consists of 500 consultants globally, with 190
live implementations and more than 75 upgrades. This
is a significant expansion of our market leading
position.
Zensar has benefitted from consistent growth due to
better operational efficiency as well as customer
additions. In FY 16, your company has 2 customers in
the USD 20 million segment, followed by 4 customers in
the USD 10 million, 4 customers in the USD 5 million
segment and an encouraging 65 customers in the USD
1million segment.
One of the clear success factors of your company is the
traditional capability cutting across the new and
emerging areas of digital offerings. Return on Digital
will drive the next set of growth drivers for your
company as we witness crossover of business and IT.
KEY PARTNERSHIPS AND ALLIANCES
Our alliances and partnerships with industry leading
technology enable us to leverage industry leading point
of views, expertise and solutions. Our customers gain
in terms of best practices and measurable outcomes.
We are Oracle Platinum Partners and have more than
2900 trained Oracle consultants across global
locations. Zensar's Oracle practice delivers Oracle
enterprise and digital commerce solutions to retailers
and manufacturers globally. Our range of Oracle
expertise encompasses the entire range of Oracle
offerings and solutions. We have more than 800
successful implementations, including upgrades and
global rollouts. One of the key differentiators for us
continues to be in the area of developing customized
solutions based on an enterprise's need.
Zensar is a certified SAP Gold partner. With over 400
experienced SAP professionals globally, SAP is a
critical and key growth focus area for Zensar. It has
complete SAP lifecycle service capabilities across the
portfolio of SAP solutions covering Applications
(Financials, Supply Chain Management & Distribution,
Projects Systems, Human Capital Management),
Analytics (Business Intelligence with SAP Business
Warehouse, SAP Business Objects) and Mobility
capabilities. Zensar also focuses on clients getting the
maximum value from new dimension Innovations from
SAP like SAP HANA with their ERP and BW Upgrade
offerings. Zensar has over the years implemented
several SAP life cycle projects and assimilated deep
expertise and best practices which it effectively
leverages for its clients.
Zensar is also focused on building a strong ecosystem
of partnerships in the digital enterprise space, with
niche providers in new technologies like social media,
mobility, analytics and cloud. Some of the key
partnerships include with JIVE software in the area of
digital collaboration.
FOCUSED COST OPTIMIZATION
Continuous initiatives and investments have been
made to make Zensar's operations more cost effective.
This includes better resource management, cost
effective operations, financial management and
improving overall operational excellence. Finding
smarter ways to work, automating internal systems and
processes has helped in making life across the
operational eco-system smarter and more productive.
We will keep focusing on internalizing and learning new
industry led practices.
CUSTOMER DRIVEN INNOVATION
Your company's strategies and go to market
propositions are led with a singular focus on customer
centricity. We maintain our seamless service delivery
excellence by constantly introducing new and
innovative strategies to remain relevant for our
customers. Our focus in enhanced customer service,
includes continuous capability enhancement through
training, new thinking into customer partnerships and a
company-wide culture, where the customer is at the
core of our actions. In fact, 'Customer Centricity' forms
one of our value statements. We lead all our customer
engagement initiatives with this guiding principle
across the entire organization.
Annexure G to the Directors' Report (Contd.)
51 | Annual Report 2015-16
ENLARGING OPERATIONAL SCOPE
Zensar understands, that in order to remain competitive
and to continue being a trusted partner to our
customers, we need to expand our scope of services
and capabilities. Leading market indicators and
changing customer demands need to be incorporated
in our thinking. In order to stay ahead of the dynamically
changing enterprise IT landscape, we have identified
proven capabilities, narrowed our geographical
markets and operate in niche industry segments. We
have built a CoE led framework, strategic technology
partnership led expertise and integrated our traditional
offerings with new tools and technologies. This
strategic approach ensures that we remain large, yet
nimble to deliver.
ENABLING DIGITAL TRANSFORMATION
Your company has a consistent successful track record
of providing market leading capabilities to global
organizations. We are poised to deliver on critical IT
systems, while helping customers benefit from
disruptive digital tools. Helping enterprises to compete
on global arena is our objective. Market trends are
driving new accelerators of growth and expansion, for
which we are clearly prepared. Steady customer
partnerships, subject matter expertise, critical technical
talent, broad based operations and successful
implementations have put us in a frontrunner position to
generate enhanced value and growth.
CORPORATE SOCIAL RESPONSIBILITY
Sustainable CSR continues to be a key focus across
the organization. Our philanthropic outreach programs
are mainly in the areas of Community Development,
Employability Enhancement and Environment
Sustenance. The last year has seen innovative ways of
supporting the community across various tenets of
sustainability. Some of the key initiatives included
making a significant step towards advocating digital
literacy under the aegis of government of India's
National Digital Literacy Mission (NDLM). This included
the launch of Pune's first digital literacy bus equipped
with computers with the objective of teaching basic
internet literacy to communities. Another initiative was
the launch of the first digital literacy centre in a rural
area in the village of Sudumbre, on the outskirts of
Pune. Leveraging the strength of Zensar volunteers, all
CSR activities display the spirit of agency.
SEGMENT-WISE PERFORMANCE
For the financial year under consideration, your
Company has reported results of the Segments viz.
App l i ca t i on Management Serv i ces (AMS) ,
Infrastructure Management Services (IMS) and
Product & Licenses.
Secondary segmental reporting is done on the basis of
geographical location of clients.
The performance of these segments has been
separately reported in Note no. 29 of the Consolidated
Financial statements of the Company.
ENTERPRISE RISK MANAGEMENT
The Enterprise Risk Management program at Zensar
aims at protecting shareholder value and your
company's business from potential risks from various
environments the company operates in. The risk
management program covers end-to-end Risk
governance / management process. including
identification, prioritization, monitoring and reporting of
risks affecting various business units and geographies.
The program covers compliance with applicable
government and regulatory requirements, potentials
risk area in various economic, social and industry
environments Zensar operates. The risks are identified
along with leading key risk indicators and assigned Risk
Champions to monitor such risks as well as conducts
periodic assessment of these risks. The company
routinely reassesses its Risk governance framework,
seeking professional advice from experts in risk
advisory field to ensure the framework is updated and
effective at all times. Risk management is a key
business driver of Zensar's strategy in competitive
market place and is linked to plan of achieving its long-
term goals and overall governance under the
supervision of the Board of directors. Your company
has set up Risk Management Council, which is
responsible for identifying various risks, prioritize them,
and monitoring potential threats and occurrences
based on various key indicators. This council works in
consultation with the Board of Directors, Management
Council Members, respective Function and Country
heads.
Annexure G to the Directors' Report (Contd.)
Zensar Technologies Ltd | 52
Annexure G to the Directors' Report (Contd.)
53 | Annual Report 2015-16
Risk Management Process:
The risk management process undertaken at Zensar is set of coordinated activities described as follows:
Risk Governance Risk Identification and Evaluation
Risk Mitigation & Response
Risk Monitoring & Reporting
• Board and Audit Committee to oversee and manage risks on various parameters.
• Risk Council to identify, define and update risk threshold.
• Senior Management to define and ensure implementation of Mitigation measures
• Business Units and Function Heads responsible for Transactional risks and Mitigation thereof.
• External and Internal Risk factors to be identified in context of Operational Strategy.
• Risk factors potentially affecting performance vis-à-vis these stated objectives to be identified.
• Defining criteria for determining consequence and probability of risks
• Prioritization and evaluation on parameters such as Insignificant, Minor, Major and Critical
• Draw a mitigation plan.
• Assign Risk Champions and ownership for mitigation plan.
• Define timelines and key indicators for mitigation plans.
• Define Risk Response as Tolerate, Treat, Transfer and Terminate.
• Risk Council, Senior Management, Audit Committee and Board to review Risk Management Process on periodic basis.
• Risk Council to collate and review information on new and existing risks.
Certain inherent risks associated with the IT Industry as well as the Company broadly are listed below:
Client Risk
Excessive exposure to particular clients have the potential to limit the company's negotiating capacity and any unfavorable change in client business may result in sudden downfall in company's revenue as well as profits. The Company is constantly de-risking by soliciting customers from different verticals and geographies.
Information Security and Disaster Recovery
The nature of business of the IT industry as well as company, around client data and technology poses a potential risk of breach of security of company's network and possible impact on its operations as well delivery work for its customers. The company takes security of customer data; it's infrastructure and network as well as company's assets very seriously. The information security team has developed and implemented elaborate security measures, including business continuity plan, using latest technology and tools available.
Geographical Concentration Risk
Concentration of revenue from a particular country exposes the company to the risks specific to its economic conditions, trade policies, local laws, political environment and work culture. In order to curtail this risk, Zensar has not imposed any rigid limits on geographical concentration. While US continue to be the major revenue generating territory, Company's operations in South Africa, Europe also makes
significant contribution to the aggregate.
Technology Obsolescence Risk
The Company operates in an ever evolving and dynamic technology environment and it is of utmost importance that the Company continuously reviews and upgrades its technology solutions and services, resources and processes so as to avoid technology obsolescence of a Company's expertise and services, posing a serious threat to the predictability of its revenues and loss of market share. The Company continuously makes investments in new technologies, looks for suitable acquisitions with a view to keep pace with the latest developments in the technology space augment portfolio of services to clients.
Client Liability Risk
A Client Liability Risk arises in the advent of the failure or deficiency in services rendered to a particular client. Any such deficiency could result in a claim for damages against the company. Zensar pays adequate attention to the negotiation and documentation of contracts wherein an effort is made to limit the contractual liability for damages arising out of errors, mistakes or omissions in service delivery. Also the company has robust quality controls in place to ensure regular monitoring and tracking of delivery operations. In addition, Zensar has taken sufficient insurance cover for protection from such professional liability as well as errors and omissions.
International Exposure Risk
As the company's headquarter is in India, this could result in regulatory, visa and tax complications, leading to unexpected delays in performing contractual obligations and potential non-compliance of local laws

Zensar Technologies Ltd | 54
of the country company conducts business. In order to mi t igate th is r isk , company 's management understands the local country environments systematically, with the help from experts and professional agencies, which has helped reduce exposure to these risks.
Human Resource Risk
Global economy has made available more and more opportunities to the skilled human resource. Due to resource intensive business model, IT service organizations are heavily impacted by this inherent risk. In India, there is uptick in attrition in companies operating in IT Industry. Better opportunities in Market place lead to attrition in human resources, which could drain valuable knowledge and customer experience and, hence, potentially have an adverse impact on revenues. The Company continuously creates and maintains a pool of world-class resources by recruiting best talents from leading colleges and industry, imparting efficient & effective training, blending them into productive resources by creating challenging opportunities on projects. The company also undertakes surveys and feedback from employees to create better working environment as well as number of initiatives are taken to make Zensar a great place to work.
Foreign Currencies Risk
Global economic situation continues to remain volatile with and since India IT industry is largely focused on markets outside India, fluctuations in major currencies due to unstable economic conditions impact revenue and profits of the IT industry. This trend is expected to continue in near to medium term with added complexity of cross -currency movements. The Company hedges a major part of the risk on exchange rate by entering into forward cover for predictable inward remittances minimizing the risks associated with foreign currency rate fluctuations.
INTERNAL FINANCIAL CONTROL AND THEIR ADEQUACY
Compliance with the best of the breed practices and regular management oversight make the internal controls at Zensar strong. Strong internal controls minimize the risk of frauds by introducing effective checks and balances into the financial system. Zensar's Audit Committee along with Management oversees financial controls and their implementation on a regular basis. The Audit Committee meetings, reviews and verification of controls ensure that the Terms of Reference given by the Board of Directors are adhered to. The internal audit is carried out by one of the leading audit and risk advisory firm. s, along with the key management personnel.
Internal Financial Control and Their Adequacy
Compliance with the best practices and regular
management oversight make the internal controls at
Zensar strong. Rigorous testing of the internal controls
is one of the strengths of the organization. Strong
internal controls minimize the risk of frauds by
introducing effective checks and balances into the
financial system. Zensar's Audit Committee along with
Management oversees financial controls and their
implementation on a regular basis. The internal audit is
carried out by one of the leading audit and risk advisory
firm.
FINANCIAL MANAGEMENT
Accounting principles consistently used in the
preparation of financial statements are also
consistently applied to record income and expenditure
in individual segments.
1. Revenue
Revenue for the year ended 31st March 2016 is as
under:
A. BY SEGMENTSRs. Crores
SEGMENT 2015-2016 2014-2015
Application Management Services
2179.61 1860.63
Infrastructure Management Services
534.67 534.97
Products & Licences 249.98 232.08
Total 2964.26 2627.68
Location 2015-2016 2014-2015
Onsite 64% 66%
Offshore 36% 34%
Geography 2015-2016 2014-2015
United States of America 2286.53 2000.52
United Kingdom 294.13 268.49
Rest of the World 383.60 358.67
Total 2964.26 2627.68
B. BY GEOGRAPHY
Rs. Crores
BY LOCATION
Rs. Crores
Annexure G to the Directors' Report (Contd.)
2. Other Income
Other Income comprises dividends from mutual fund
investments, interest on bank deposits and others.
Other income during the current year was Rs. 44.55
Crores as against Rs. 26.95 Crores in the previous
year.
3. Share Capital
During the year, Company has allotted total 304,654
equity shares fully paid up of Rs. 10/- each. Out of
these, 63,412 equity shares were allotted under 2002
Employees Stock Option Scheme” and 241,242
numbers of equity shares were allotted under “2006
Employees Stock Option Scheme”.
4. Reserves and Surplus
The Company's reserves and surplus as on 31st March
2016 were Rs. 1381.16 Crores as against Rs. 1112.65
Crores as on 31st March 2015.
5. Long Term Borrowings
As of 31st March 2016, Long term borrowings were Rs.
0.77 Crores (Previous year Rs.1.49 Crores) out of
which Finance lease liabilities were Rs. 0.77 Crores
(Previous year Rs.1.49 Crores).
The current maturities of long term finance lease
obligation amounting to Rs. 1.20 Crores (Previous
year: Rs.1.91 Crores) which is shown under Other
Current Liabilities.
The portion of current maturities of long term loan is
amounting to Rs. Nil (Previous year: Rs. 75.00 Crores)
which is payable within twelve months, is shown under
Other Current Liabilities.
6. Short Term Borrowings
As of 31st March 2016, Short term borrowings of Rs.
147.31Crores (Rs. 102.69 crores taken by Zensar
Technologies Inc., Rs. 31.37 Crores taken by PSI
Holding Inc. and Rs. 13.25 crores taken by Zensar
Technologies Limited) Previous year it was Rs. 97.16
Crores.
7. Fixed Assets
There was an increase in Net Gross Block of Fixed
Assets by Rs. 23.29 Crores compared to previous year,
which is on account of acquisition of assets for ordinary
business .
8. Return on Capital Employed
The return on capital employed (ROCE) for the year
2015-16 is 28.10%.
As at 31st
March, 2015As at 31st
March, 2014
Outstanding for less than six months
415.93 454.02
Outstanding for more than six months
161.88 19.90
Provision for doubtful debts (35.07) (20.04)
Total Sundry Debtors 542.74 453.88
Annexure G to the Directors' Report (Contd.)
9. DEBTORS
The position of outstanding debtors was:
Rs. Crores
10. CASH AND BANK BALANCES
The Cash and Bank Balances represent the
Company's balances in banks in India and overseas.
The Company also retains funds in the Exchange
Earners Foreign Currency (EEFC) account in India,
which is mainly used to meet the remittance
requirements of the Company's branches and also for
travel purposes. The Company possessed cash and
bank balances (India and overseas excluding unpaid
dividend) of Rs. 282.25 Crores as on 31st March, 2016.
11. OTHER CURRENT ASSETS
Other Current Assets of Rs. 237.14 Crores consist
mainly of accrued income i.e. where services have
been rendered as per contract but the client has not
been billed as on 31st March 2016.
12. LOANS AND ADVANCES
The Loans and Advances largely comprise advances
recoverable in cash or in kind for value to be received
amounting to Rs. 147.50 Crores (Previous Year: Rs.
133.42 Crores) as on 31st March, 2016 out of which
Long term was Rs. 40.34 Crores (Previous Year: 46.67
Crores) and Short Term was Rs.107.16 Crores
(Previous year: 86.75 Crores), against which a
provision for doubtful advances is Rs. Nil (Previous
year was 0.02 Crores).
13. OTHER CURRENT LIABILIT IES &
PROVISIONS
Other Current liabilities & Provisions amounting to Rs.
284.87 Crores (Previous year Rs. 343.38 Crores)
represent payments due to suppliers and advances
from customers. Provisions consist mainly of accrual
for expenses and provision for tax and dividend.
14. PROVISION FOR TAXATION
The Company's income-tax expense is Rs.
116.91Crores (Previous year Rs. 101.28 Crores).
55 | Annual Report 2015-16
Annexure G to the Directors' Report (Contd.)
15. CONTINGENT LIABILITIES
Contingent Liabilities have been disclosed in Note 27 in
the "Consolidated Financial Statement - Notes to the
Accounts".
Accounting principles consistently used in the
preparation of financial statements are also
consistently applied to record income and expenditure
in individual segments.
H. MATERIAL DEVELOPMENTS IN HUMAN
RESOURCES
The Talent Management practices at ZENSAR focus
on engaging, developing and retaining the talent pool.
We at Zensar strive towards providing a conducive
environment to sustain high performance. Our
retention rate was 84.1% for FY15-16
The following is a summary of our key talent initiatives:
The industry in which we operate in is rapidly changing.
A significant focus on business outcomes, the need for
integrated solutions and digital technologies etc is
expected. These changes require us as an
organization to gear up and reenergize the pillars of
Zensar - the vision, the strategy and the values.
Vision:
Leaders in Business Transformation
Mission:
We will be the best in delivering innovative industry-
focused solutions with measurable business
outcomes. We will partner customers for their success
Values:
F Customer Centricity
F Commitment to People and Community
F Continuous Innovation and Excellence
Extensive initiatives such as global webcasts,
workshops, e-mail campaigns and other activities have
been undertaken across our global locations to
disseminate the re-articulated Vision, Mission and
Values.
HR Digitalisation
We have embarked on a journey to make HR 100%
digitalised. This will ensure that all HR process will be
available to associates on their hand held devices at all
the time. It will also provide leaders access to HR
metrics to make informed decision.
Organization and Management Review (OMR):
OMR is our comprehensive process to review the
organization structure and incumbents of key roles in
the structure to ensure alignment to the overall
strategy of the Company. This process also includes
succession planning and development planning for
high potential associates.
Making Zensar a Great Place to Work:
Having an engaged workforce is a building block for
organization's success. The organization's value of
'Commitment to People and Community' is embodied in
every effort to make Zensar a great place to work - a
workplace where employees trust who they work for,
take pride in what they do and enjoy the company of the
people they work with. Over the last few years, we have
taken significant steps towards this. In continuation of
this journey, this year we launched the 'Great Place to
Work Survey' to measure associate engagement.
Great Place to Work is a globally recognized and widely
used platform from Great Place to Work® Institute, to
measure associate engagement. The Great Place to
Work model measures engagement levels of
associates through the levels of Trust, Pride and
Camaraderie prevalent in the organization. The survey
witnessed extensive participation from associates
globally.
Apart from the survey, we are also participating in the
Great Place to Work Culture Audit. The culture audit will
benchmark our practices vis-à-vis the industry.
Open Culture: Transparency and Openness
Zensar provides multiple platforms for management
and associate communication.
The Everybody Meetings (EBM) are held to share
Business updates, Technology trends and future road
map. The Pizza and Coke is an informal meeting of
Senior Management with associates over lunch for
sharing perspectives and ideas.
Zensar has a very vibrant platform for virtual
collaboration – our Intranet called ZenLounge+ which is
actively used by our associates for sharing views,
technical collaboration as well as information sharing.
This is a collaborative platform that combines the power
of social networking, content collaboration, and real
time enhanced communication.
Diversity and Inclusion (D&I)
Zensar has been constantly striving to build a diverse
and inclusive work culture that respects and thrives on
diversity in gender, age, nationality, race and capability.
The Vision Community is ZENSAR's signature D&I
Zensar Technologies Ltd | 56
initiative where cross-functional teams across the
levels in the organization contribute to the strategy
building exercise of the organization. The success of
Vision Community has been documented in Harvard
Journals as a case study.
WE (Women for Excellence) is another key D&I
initiative which aims to develop women Zensarians
take leadership positions.
Additionally, to bring in diversity of perspectives in the
Strategic Decision making process of the organization,
the following boards have been set up: Shadow
Executive Board, Women Executive Board and D&I
Council. The composition of these Boards is cross
functional and each Board is led by a member of the
Strategy Council.
CAUTIONARY STATEMENT
This Report to the Shareholders is in compliance with
the Corporate Governance Standard incorporated in
the Listing Agreement with the Stock Exchanges and
as such cannot be construed as holding out for any
forecasts, projections, expectations, invitations, offers,
etc. within the meaning of applicable securities laws
and regulations. This Report furnishes information as
laid down within the different headings provided under
the sub-head Management Discussion and Analysis to
meet the Listing Agreement requirements.
Annexure G to the Directors' Report (Contd.)
57 | Annual Report 2015-16
For and on behalf of the Board
H.V. Goenka
Chairman
Place: Mumbai
Dated: 22nd April, 2016
Form No. MR-3
SECRETARIAL AUDIT REPORT
FOR THE FINANCIAL YEAR ENDED 31ST MARCH 2016
[Pursuant to section 204 (1) of the Companies Act,
2013 and Rule No.9 of the Companies (Appointment
and Remuneration of Managerial Personnel) Rules,
2014]
To,
The Members,
Zensar Technologies Limited
Zensar Knowledge Park Plot No.4
Kharadi MIDC off Nagar Road,
Pune - 411014
We have conducted the secretarial audit of the
compliance of applicable statutory provisions and the
adherence to good corporate practices by Zensar
Technologies Limited. (hereinafter called “the
Company”). Secretarial Audit was conducted in a
manner that provided us a reasonable basis for
evaluat ing the corporate conducts/statutory
compliances and expressing our opinion thereon.
Based on our verification of the Company's books,
papers, minute books, forms and returns filed and other
records maintained by the company and also the
information provided by the Company, its officers,
agents and authorized representatives during the
conduct of secretarial audit, We hereby report that in
our opinion, the Company has, during the audit period stcovering the financial year ended on 31 March 2016
complied with the statutory provisions listed hereunder
and also that the Company has proper Board-
processes and compliance-mechanism in place to the
extent, in the manner and subject to the reporting made
hereinafter:
We have examined the books, papers, minute books,
forms and returns filed and other records maintained by stthe Company for the financial year ended on 31 March
2016 according to the provisions of:
(i) The Companies Act, 2013 (the Act) and the rules
made thereunder (in so far as they are made
applicable);
(ii) The Securities Contracts (Regulation) Act, 1956
('SCRA') and the rules made thereunder;
(iii) The Depositories Act, 1996 and the Regulations
and Bye-laws framed thereunder;
(iv) Foreign Exchange Management Act, 1999 and the
rules and regulations made thereunder to the
extent of Foreign Direct Investment, Overseas
Annexure H to the Directors' Report
Direct Investment and External Commercial
Borrowings;
(v) The following Regulations and Guidelines
prescribed under the Securities and Exchange
Board of India Act, 1992 ('SEBI Act'):-
(a) The Securities and Exchange Board of India
(Substantial Acquisit ion of Shares and
Takeovers) Regulations, 2011;
(b) The Securities and Exchange Board of India
(Prohibition of Insider Trading) Regulations, th1992 (upto 14 May, 2015) and Securities and
Exchange Board of India (Prohibition of Insider thTrading) Regulations, 2015 (effective from 15
May, 2015);
(c) The Securities and Exchange Board of India
(Issue of Capital and Disclosure Requirements)
Regulations, 2009;
(d) The Securities and Exchange Board of India
(Employee Stock Option Scheme and Employee
Stock Purchase Scheme) Guidelines, 1999;
(e) The Securities and Exchange Board of India
( Issue and List ing of Debt Securi t ies)
Regulations, 2008 (not applicable to the
company during the Audit Period);
(f) The Securities and Exchange Board of India
(Registrars to an Issue and Share Transfer
Agents) Regulations, 1993 regarding the
Companies Act and dealing with client;
(g) The Securities and Exchange Board of India
(Delisting of Equity Shares) Regulations, 2009
(not applicable to the company during the
Audit Period);
(h) The Securities and Exchange Board of India
(Buyback of Securities) Regulations, 1998 (not
applicable to the company during the Audit
Period).
(vi) The specific laws applicable to the Company:
a) Special Economic Zone Act, 2005 and the Rules
made thereunder;
b) Trade Mark Act, 1999 and the Rules made
thereunder;
c) Information Technology Act, 2000 and the Rules
made thereunder;
d) Policy relating to Software Technology Parks of
India and its Regulations;
e) The Export and Import Policy of India;
We have also examined compliance with the
Zensar Technologies Ltd | 58

applicable clauses and regulations of the
following:
(i) Secretarial Standards issued by 'The Institute
of Company Secretaries of India' effective
from 1st July, 2015;
(ii) The Listing Agreements entered into by the
Company with Stock Exchange(s) till 30th
November, 2015; and the provision of sub
regulation (4) of the Regulation 23 and
Regulation 31A of SEBI (Listing Obligations
and Disclosure Requirements) Regulations,
2015, applicable from 2nd September, 2015;
and
(iii) The Listing Agreement entered into by the
Company with Stock Exchange(s) pursuant
to SEBI (Listing Obligations and Disclosure
Requirements) Regulations, 2015 effective
from 1st December, 2015.
During the period under review the Company
has complied with the provisions of the Act,
Rules, Regulations, Guidelines, Standards,
etc. mentioned above.
We further report that
The Board of Directors of the Company is duly
constituted with proper balance of Executive Directors,
Non-Executive Directors and Independent Directors.
The changes in the composition of the Board of
Directors that took place during the period under review
were carried out in compliance with the provisions of
the Act.
Adequate notice is given to all directors to schedule the
Board Meetings, agenda and detailed notes on agenda
were sent at least seven days in advance, and a system
exists for seeking and obtaining further information and
clarifications on the agenda items before the meeting
and for meaningful participation at the meeting.
All decisions at Board Meetings and Committee
Meetings are carried out unanimously as recorded in
the minutes of the meetings of the Board of Directors or
Committees of the Board, as the case may be.
We further report that there are adequate systems
and processes in the company commensurate with the
size and operations of the company to monitor and
ensure compliance with applicable laws, rules,
regulations and guidelines.
We further report that during the audit period:
1. The Electra Partners Mauritius Limited (EPML) one
of the equity investors in the Company has sold its
23.17% shareholding in the Company to
M/s. Marina Holdco (FPI) Ltd., Fund, a Mauritius
based Company.
2. The Company has altered the Articles of
Association of the Company to protect the interest of
the investor i.e. M/s. Marina Holdco (FPI) Ltd.
Place: Pune For SVD & AssociatesndDate: 22 April, 2016 Company Secretaries
S. V. Deulkar
Partner
FCS No. 1321
C P No. 965
Note: This report is to be read with letter of even date by
the Secretarial Auditors, which is annexed as Annexure
A and forms an integral part of this report.
Annexure H to the Directors' Report (Contd.)
59 | Annual Report 2015-16

To,
Members,
Zensar Technologies Limited
Zensar Knowledge Park Plot No.4
Kharadi MIDC off Nagar Road,
Pune - 411014
Our Secretarial Audit Report of even date is to be read
along with this letter.
Management's Responsibility
1. It is the responsibility of the management of the
Company to maintain secretarial records, devise
proper systems to ensure compliance with the
provisions of all applicable laws and regulations and
to ensure that the systems are adequate and
operate effectively.
Auditor's Responsibility
2. Our responsibility is to express an opinion on these
secretarial records, standards and procedures
followed by the Company with respect to secretarial
compliances.
3. We believe that audit evidence and information
obtained from the Company's management is
adequate and appropriate for us to provide a basis
for our opinion.
4. Wherever required, we have obtained the
management 's representa t ion about the
compliance of laws, rules and regulations and
happening of events, etc.
Disclaimer
5. The Secretarial Audit Report is neither an assurance
as to the future viability of the Company nor of the
efficacy or e f fect iveness wi th which the
management has conducted the affairs of the
Company.
Place: Pune For SVD & AssociatesndDate: 22 April, 2016 Company Secretaries
S. V. Deulkar
Partner
FCS No: 1321
C P No: 965
‘ANNEXURE A’
Annexure H to the Directors' Report (Contd.)
Zensar Technologies Ltd | 60

Annexure I to the Directors' Report
The Company's Corporate Governance
Philosophy
Corporate Governance is a set of systems, policies and
practices deep-rooted in the Company to ensure that
the affairs are being managed in a way which ensures
accountability, transparency, fairness in all its
transactions with all its stakeholders. Zensar believes
that good governance practices stem from the culture
and mind-set of the organization. Effective corporate
governance is the strong foundation on which
commercial enterprises are built and succeed. The
Company's philosophy of Corporate Governance that
of timely disclosures, transparent accounting policies
and a strong and Independent Board goes a long way in
preserving all stakeholders' interest, while maximizing
long-term shareholder worth. Strong leadership and
effective corporate governance practices have been
the Company's plus point.
A report, in line with the requirements of SEBI (Listing
Obl igat ions and Disc losure Requi rements)
Regulations, 2015 (hereinafter “Listing Regulations”)
for the year ended 31st March, 2016 is given below:
1. Board of Directors:
A. Size and Composition of Board:
The composition of the Board of Directors of the
Company represents an optimum combination of
professionalism, knowledge and experience.
At Zensar, we believe that Good Governance cannot be
imposed from the outside. It must come also from within
hence the Board of Directors, at the apex of a
company's corporate governance structure, is the key
factor to ensure highest standards of corporate
governance. Their contribution is immensely important
for ensuring appropriate directions with regard to
leadership, vision, strategy, policy making, monitoring
and achieving greater levels of performance. The
Company's Board of Directors' is characterised in
Independence, professionalism, transparency in
decision making and accountability. It comprises
combination of Executive and Non-Executive
Directors, each of whom adds value and brings
independent view in the decision-making process. As
per statutory requirements, Company has duly
constituted Board consisting an optimum mix of
Executive, Non-executive and Independent Directors.
As on 31st March, 2016, the Board comprises of ten
Directors, two of which are Executive Directors and
eight are Non-Executive Directors. The Company has a
Non- Executive Chairman from the Promoter Group.
None of the Directors on the Board is a member of more
than 10 Committees or Chairman of more than 5
Committees across all Companies in which he is a
Director. Further, none of the Independent Directors on
the Board is serving as an Independent Director in more
than seven listed companies. The necessary
disclosures regarding Committee positions have been
made by all the Directors. None of the Directors is
related to another.
B. Board Meetings:
The Board of Directors of the Company met six times
during the Financial Year 2015-16
On 28th April, 2015, 15th July, 2015, 20th October,
2015, 14th December, 2015, 19th January, 2016 and
14th March, 2016. Composition of the Board and other
Directorship/Membership of Committees held as on
31st March, 2016 along with Attendance of Board
Meeting/AGM during the year are given below:
CORPORATE GOVERNANCE REPORT
61 | Annual Report 2015-16
Annexure I to the Directors' Report (Contd.)
Sr. No.
Name of Director Category Date of Appointment
Attendance in Board Meetings
during2015-16
Attendance in last AGM
Other Boards / Committees
Director-ships*
Committee*
Member Chairman
1 Mr. H. V. Goenka Chairman Non- Independent Non- Executive Director
04.09.2001 6 No 6 Nil Nil
2 Mr. Sandeep $Kishore
Managing Director and CEO
12.01.2016 2 No 1 Nil Nil
3 Dr. Ganesh Natarajan
Vice Chairman and Managing Director
04.09.2001 4 Yes Nil Nil Nil
4 Mr. A.N. Agrawal Non Independent Non-Executive Director
29.01.2002 5 No 2 Nil Nil
5 Mr. P.K. @Choksey
Independent Non- Executive Director
24.04.1980 3 No 1 Nil 1
6 Mr. Venkatesh Kasturirangan
Independent Non- Executive Director
28.01.2008 4 Yes 1 Nil Nil
7 ^Mr. John Levack Non-Independent Non- Executive Director
16.01.2003 2 Yes 1 1 Nil
8 Mr. Shashank $$Singh
Non-Independent Non- Executive Director
20.10.2015 4 No 2 Nil Nil
9 Mr. Sudip $$$Nandy
Independent Non-Executive Director
15.07.2015 3 No Nil Nil Nil
10 Mr. P.K. Mohapatra
Independent Non- Executive Director
31.01.2001 4 Yes 9 Nil Nil
11 Mr. A.T. Vaswani Independent Non- Executive Director
09.02.1996 6 Yes 2 1 1
12 Ms. Madhabi Puri Buch
Independent Non -Executive Director
30.09.2014 5 Yes 2 0 1
* This number excludes the directorships / committee memberships held in Private Limited Companies, Companies registered under Section 8 of the Companies Act, 2013. In accordance with the provisions of Listing Regulations, Memberships/ Chairmanships of only Audit Committee and Stakeholders Relationship Committee in all Public Limited Companies (excluding Zensar Technologies Limited) have been considered.
$ Mr. Sandeep Kishore was appointed as Managing Director and Chief Executive Officer of the Company with effect from 12th January, 2016.
@ Mr. P. K. Choksey ceased to be Director from 26th December, 2015 because of his passing away on that date.
^ Mr. John Levack nominee director of Electra Partners Mauritius Ltd. resigned with effect from 9th October, 2015 pursuant to sale of stake by Electra Partners (Mauritius) Ltd. to Marina Holdco (FPI) Ltd.
$$ Mr. Shashank Singh was appointed on the Board of Directors of the Company with effect from 20th October, 2015 as Nominee Director of Marina Holdco (FPI) Ltd. pursuant to sale of stake by Electra Partners (Mauritius) Ltd. to Marina Holdco (FPI) Ltd.
$$$ Mr. Sudip Nandy was appointed as Independent Non-Executive Director with effect from 15th July, 2015.
Note:
• Information placed before the Board:
Agenda papers along with detailed notes are being circulated in advance of each meeting of the Board. Information pursuant to Corporate Governance practices as required under Listing Regulations have been made available to the Board from time to time.
The Company periodically places Compliance Reports / Certificates with respect to all applicable laws before the Board of Directors for its review.
• Directors with material pecuniary or business relationship with the Company:
The Company did not have any pecuniary relationship or transactions with its Non-Executive and/or Independent Directors during the year under review except payment of sitting fees and commission as disclosed in this report.
Zensar Technologies Ltd | 62
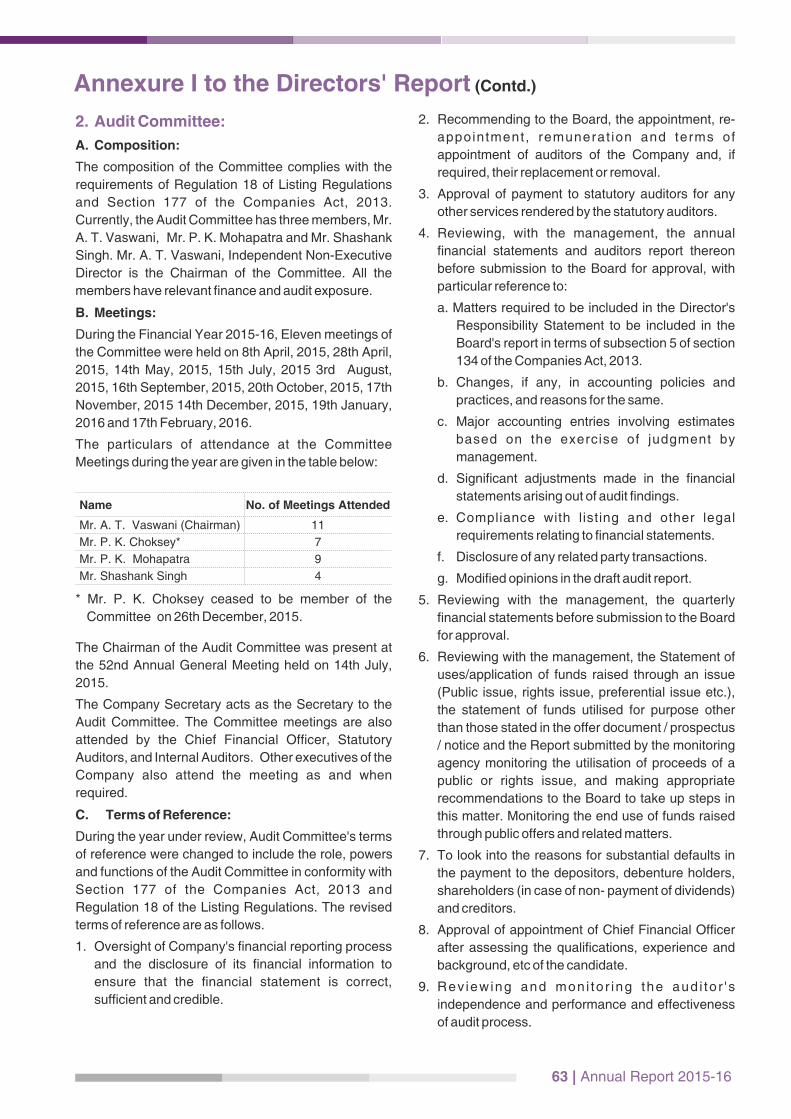
2. Audit Committee:
A. Composition:
The composition of the Committee complies with the
requirements of Regulation 18 of Listing Regulations
and Section 177 of the Companies Act, 2013.
Currently, the Audit Committee has three members, Mr.
A. T. Vaswani, Mr. P. K. Mohapatra and Mr. Shashank
Singh. Mr. A. T. Vaswani, Independent Non-Executive
Director is the Chairman of the Committee. All the
members have relevant finance and audit exposure.
B. Meetings:
During the Financial Year 2015-16, Eleven meetings of
the Committee were held on 8th April, 2015, 28th April,
2015, 14th May, 2015, 15th July, 2015 3rd August,
2015, 16th September, 2015, 20th October, 2015, 17th
November, 2015 14th December, 2015, 19th January,
2016 and 17th February, 2016.
The particulars of attendance at the Committee
Meetings during the year are given in the table below:
Annexure I to the Directors' Report (Contd.)
Name No. of Meetings Attended
Mr. A. T. Vaswani (Chairman) 11
Mr. P. K. Choksey* 7
Mr. P. K. Mohapatra 9
Mr. Shashank Singh 4
* Mr. P. K. Choksey ceased to be member of the
Committee on 26th December, 2015.
The Chairman of the Audit Committee was present at
the 52nd Annual General Meeting held on 14th July,
2015.
The Company Secretary acts as the Secretary to the
Audit Committee. The Committee meetings are also
attended by the Chief Financial Officer, Statutory
Auditors, and Internal Auditors. Other executives of the
Company also attend the meeting as and when
required.
C. Terms of Reference:
During the year under review, Audit Committee's terms
of reference were changed to include the role, powers
and functions of the Audit Committee in conformity with
Section 177 of the Companies Act, 2013 and
Regulation 18 of the Listing Regulations. The revised
terms of reference are as follows.
1. Oversight of Company's financial reporting process
and the disclosure of its financial information to
ensure that the financial statement is correct,
sufficient and credible.
2. Recommending to the Board, the appointment, re-
appointment, remunerat ion and terms of
appointment of auditors of the Company and, if
required, their replacement or removal.
3. Approval of payment to statutory auditors for any
other services rendered by the statutory auditors.
4. Reviewing, with the management, the annual
financial statements and auditors report thereon
before submission to the Board for approval, with
particular reference to:
a. Matters required to be included in the Director's
Responsibility Statement to be included in the
Board's report in terms of subsection 5 of section
134 of the Companies Act, 2013.
b. Changes, if any, in accounting policies and
practices, and reasons for the same.
c. Major accounting entries involving estimates
based on the exercise of judgment by
management.
d. Significant adjustments made in the financial
statements arising out of audit findings.
e. Compliance with listing and other legal
requirements relating to financial statements.
f. Disclosure of any related party transactions.
g. Modified opinions in the draft audit report.
5. Reviewing with the management, the quarterly
financial statements before submission to the Board
for approval.
6. Reviewing with the management, the Statement of
uses/application of funds raised through an issue
(Public issue, rights issue, preferential issue etc.),
the statement of funds utilised for purpose other
than those stated in the offer document / prospectus
/ notice and the Report submitted by the monitoring
agency monitoring the utilisation of proceeds of a
public or rights issue, and making appropriate
recommendations to the Board to take up steps in
this matter. Monitoring the end use of funds raised
through public offers and related matters.
7. To look into the reasons for substantial defaults in
the payment to the depositors, debenture holders,
shareholders (in case of non- payment of dividends)
and creditors.
8. Approval of appointment of Chief Financial Officer
after assessing the qualifications, experience and
background, etc of the candidate.
9. Rev iewing and mon i to r ing the aud i to r ' s
independence and performance and effectiveness
of audit process.
63 | Annual Report 2015-16
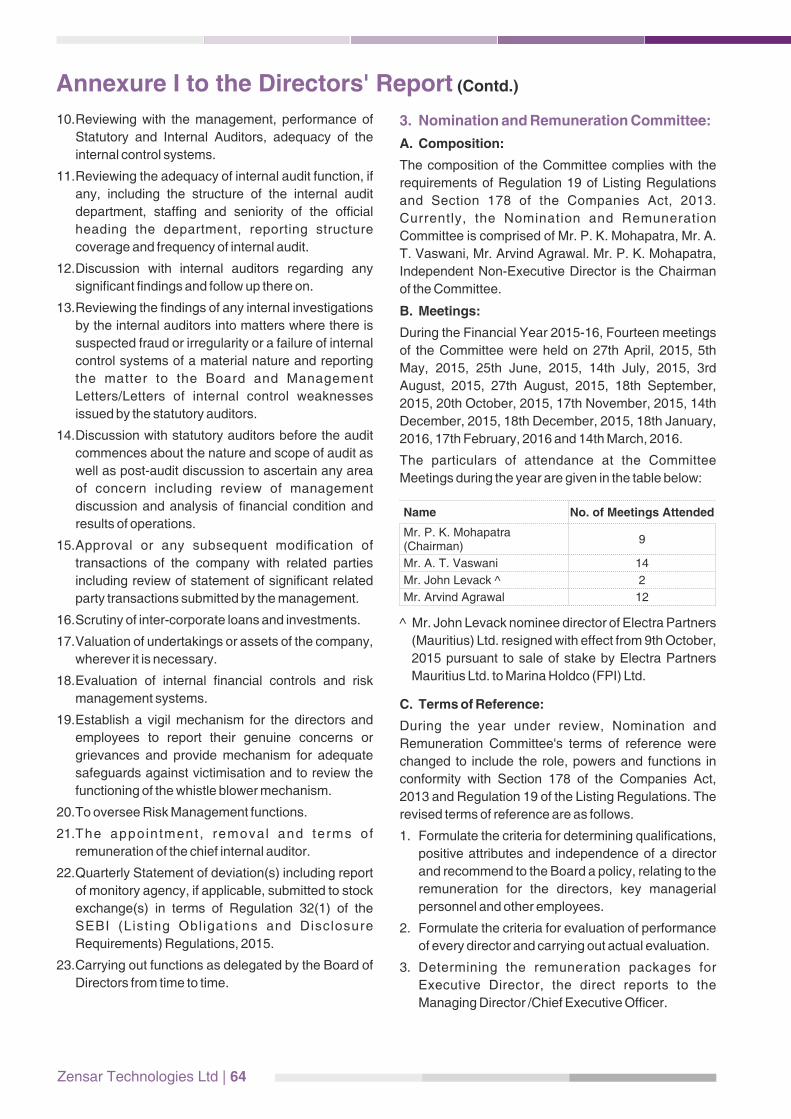
Annexure I to the Directors' Report (Contd.)
10. Reviewing with the management, performance of
Statutory and Internal Auditors, adequacy of the
internal control systems.
11. Reviewing the adequacy of internal audit function, if
any, including the structure of the internal audit
department, staffing and seniority of the official
heading the department, reporting structure
coverage and frequency of internal audit.
12. Discussion with internal auditors regarding any
significant findings and follow up there on.
13. Reviewing the findings of any internal investigations
by the internal auditors into matters where there is
suspected fraud or irregularity or a failure of internal
control systems of a material nature and reporting
the matter to the Board and Management
Letters/Letters of internal control weaknesses
issued by the statutory auditors.
14. Discussion with statutory auditors before the audit
commences about the nature and scope of audit as
well as post-audit discussion to ascertain any area
of concern including review of management
discussion and analysis of financial condition and
results of operations.
15. Approval or any subsequent modification of
transactions of the company with related parties
including review of statement of significant related
party transactions submitted by the management.
16. Scrutiny of inter-corporate loans and investments.
17. Valuation of undertakings or assets of the company,
wherever it is necessary.
18. Evaluation of internal financial controls and risk
management systems.
19. Establish a vigil mechanism for the directors and
employees to report their genuine concerns or
grievances and provide mechanism for adequate
safeguards against victimisation and to review the
functioning of the whistle blower mechanism.
20. To oversee Risk Management functions.
21. The appointment , removal and terms of
remuneration of the chief internal auditor.
22. Quarterly Statement of deviation(s) including report
of monitory agency, if applicable, submitted to stock
exchange(s) in terms of Regulation 32(1) of the
SEBI (List ing Obligat ions and Disclosure
Requirements) Regulations, 2015.
23. Carrying out functions as delegated by the Board of
Directors from time to time.
3. Nomination and Remuneration Committee:
A. Composition:
The composition of the Committee complies with the
requirements of Regulation 19 of Listing Regulations
and Section 178 of the Companies Act, 2013.
Currently, the Nomination and Remuneration
Committee is comprised of Mr. P. K. Mohapatra, Mr. A.
T. Vaswani, Mr. Arvind Agrawal. Mr. P. K. Mohapatra,
Independent Non-Executive Director is the Chairman
of the Committee.
B. Meetings:
During the Financial Year 2015-16, Fourteen meetings
of the Committee were held on 27th April, 2015, 5th
May, 2015, 25th June, 2015, 14th July, 2015, 3rd
August, 2015, 27th August, 2015, 18th September,
2015, 20th October, 2015, 17th November, 2015, 14th
December, 2015, 18th December, 2015, 18th January,
2016, 17th February, 2016 and 14th March, 2016.
The particulars of attendance at the Committee
Meetings during the year are given in the table below:
Name No. of Meetings Attended
Mr. P. K. Mohapatra (Chairman)
9
Mr. A. T. Vaswani 14
Mr. John Levack ^ 2
Mr. Arvind Agrawal 12
^ Mr. John Levack nominee director of Electra Partners
(Mauritius) Ltd. resigned with effect from 9th October,
2015 pursuant to sale of stake by Electra Partners
Mauritius Ltd. to Marina Holdco (FPI) Ltd.
C. Terms of Reference:
During the year under review, Nomination and
Remuneration Committee's terms of reference were
changed to include the role, powers and functions in
conformity with Section 178 of the Companies Act,
2013 and Regulation 19 of the Listing Regulations. The
revised terms of reference are as follows.
1. Formulate the criteria for determining qualifications,
positive attributes and independence of a director
and recommend to the Board a policy, relating to the
remuneration for the directors, key managerial
personnel and other employees.
2. Formulate the criteria for evaluation of performance
of every director and carrying out actual evaluation.
3. Determining the remuneration packages for
Executive Director, the direct reports to the
Managing Director /Chief Executive Officer.
Zensar Technologies Ltd | 64
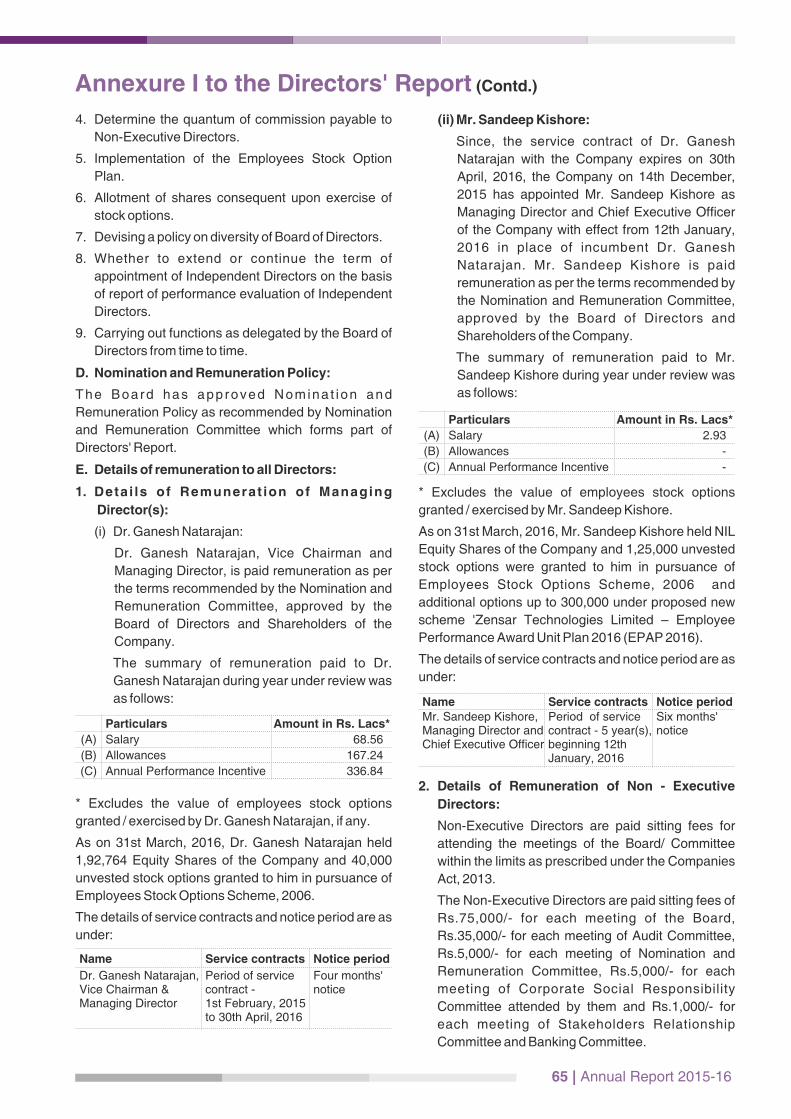
4. Determine the quantum of commission payable to
Non-Executive Directors.
5. Implementation of the Employees Stock Option
Plan.
6. Allotment of shares consequent upon exercise of
stock options.
7. Devising a policy on diversity of Board of Directors.
8. Whether to extend or continue the term of
appointment of Independent Directors on the basis
of report of performance evaluation of Independent
Directors.
9. Carrying out functions as delegated by the Board of
Directors from time to time.
D. Nomination and Remuneration Policy:
The Board has approved Nomina t ion and
Remuneration Policy as recommended by Nomination
and Remuneration Committee which forms part of
Directors' Report.
E. Details of remuneration to all Directors:
1. Deta i ls of Remunerat ion of Managing
Director(s):
(i) Dr. Ganesh Natarajan:
Dr. Ganesh Natarajan, Vice Chairman and
Managing Director, is paid remuneration as per
the terms recommended by the Nomination and
Remuneration Committee, approved by the
Board of Directors and Shareholders of the
Company.
The summary of remuneration paid to Dr.
Ganesh Natarajan during year under review was
as follows:
Particulars Amount in Rs. Lacs*
(A) Salary 68.56
(B) Allowances 167.24
(C) Annual Performance Incentive 336.84
* Excludes the value of employees stock options
granted / exercised by Dr. Ganesh Natarajan, if any.
As on 31st March, 2016, Dr. Ganesh Natarajan held
1,92,764 Equity Shares of the Company and 40,000
unvested stock options granted to him in pursuance of
Employees Stock Options Scheme, 2006.
The details of service contracts and notice period are as
under:
Name Service contracts Notice period
Dr. Ganesh Natarajan, Vice Chairman & Managing Director
Period of service contract - 1st February, 2015 to 30th April, 2016
Four months' notice
(ii) Mr. Sandeep Kishore:
Since, the service contract of Dr. Ganesh
Natarajan with the Company expires on 30th
April, 2016, the Company on 14th December,
2015 has appointed Mr. Sandeep Kishore as
Managing Director and Chief Executive Officer
of the Company with effect from 12th January,
2016 in place of incumbent Dr. Ganesh
Natarajan. Mr. Sandeep Kishore is paid
remuneration as per the terms recommended by
the Nomination and Remuneration Committee,
approved by the Board of Directors and
Shareholders of the Company.
The summary of remuneration paid to Mr.
Sandeep Kishore during year under review was
as follows:
Particulars Amount in Rs. Lacs*
(A) Salary 2.93
(B) Allowances -
(C) Annual Performance Incentive -
* Excludes the value of employees stock options
granted / exercised by Mr. Sandeep Kishore.
As on 31st March, 2016, Mr. Sandeep Kishore held NIL
Equity Shares of the Company and 1,25,000 unvested
stock options were granted to him in pursuance of
Employees Stock Options Scheme, 2006 and
additional options up to 300,000 under proposed new
scheme 'Zensar Technologies Limited – Employee
Performance Award Unit Plan 2016 (EPAP 2016).
The details of service contracts and notice period are as
under:
Name Service contracts Notice periodMr. Sandeep Kishore, Managing Director and Chief Executive Officer
Period of service contract - 5 year(s), beginning 12th January, 2016
Six months' notice
2. Details of Remuneration of Non - Executive
Directors:
Non-Executive Directors are paid sitting fees for
attending the meetings of the Board/ Committee
within the limits as prescribed under the Companies
Act, 2013.
The Non-Executive Directors are paid sitting fees of
Rs.75,000/- for each meeting of the Board,
Rs.35,000/- for each meeting of Audit Committee,
Rs.5,000/- for each meeting of Nomination and
Remuneration Committee, Rs.5,000/- for each
meeting of Corporate Social Responsibility
Committee attended by them and Rs.1,000/- for
each meeting of Stakeholders Relationship
Committee and Banking Committee.
Annexure I to the Directors' Report (Contd.)
65 | Annual Report 2015-16

Annexure I to the Directors' Report (Contd.)
The members of the Company at their 52nd Annual
General Meeting held on 14th July, 2015 had
approved payment of Remuneration to Non-
Executive Directors by way of Commission not
exceeding one percent of Company's net profit.
During the year under review, apart from the Sitting
Fees paid for attending the meetings of the Board
and the Committees, the Non-Executive Directors
have been paid Commission after taking into
account the qualifications, experience, time spent
on strategic matters and contribution to the
company. The said Commission was duly
r e c o m m e n d e d b y t h e N o m i n a t i o n a n d
Remuneration Committee and approved by the
Board of Directors.
Remuneration to Non-Executive Directors.
Sr. No.
Name of the Director Sitting fees paid during
2015-16 (In Rupees)
Commission paid in 2015-16
for the year 2014-15
(In Rupees)
1. Mr. H. V. Goenka 4,50,000 2,18,50,0002. @Mr. P.K. Choksey 4,58,000 6,00,0003. Mr. Venkatesh
Kasturirangan3,00,000 6,00,000
4. ^Mr. John Levack 1,60,000 6,00,0005. Mr. P.K. Mohapatra 6,45,000 6,00,0006. Mr. A.T. Vaswani 9,02,000 6,00,0007. Mr. Arvind Agrawal 4,35,000 -8. Ms. Madhabi Puri Buch 3,75,000 3,00,0009. $$Mr. Shashank Singh 4,40,000 -
10. $$$Mr. Sudip Nandy 2,25,000 -11. #Mr. Niraj Bajaj - 4,50,000
@ Mr. P. K. Choksey ceased to be Director from 26th
December, 2015 on account of his passing away on
that date.
^ Mr. John Levack nominee director of Electra Partners
(Mauritius) Ltd. resigned with effect from 9th October,
2015 pursuant to sale of stake by Electra Partners
Mauritius Ltd. to Marina Holdco (FPI) Ltd.
$$ Mr. Shashank Singh was appointed on the Board of
Directors of the Company with effect from 20th
October, 2015 as Nominee Director of Marina Holdco
(FPI) Ltd. pursuant to sale of stake by Electra Partners
(Mauritius) Ltd. to Marina Holdco (FPI) Ltd.
$$$ Mr. Sudip Nandy was appointed as Independent
Non-Executive with effect from 15th July, 2015.
# Mr. Niraj Bajaj resigned from the directorship of the
Board with effect from 8th January, 2015
Shareholding of Non-Executive Directors:
Mr. Harsh Goenka*, Mr. A. T. Vaswani and Mr. P. K.
Choksey, Non-Executive Directors, holds 777, 10,000
and 800 equity shares of Rs. 10/- each respectively of
the Company and do not hold any convertible
instruments of the Company. Apart from the above,
other Non-Executive Directors do not hold any equity
shares or convertible instruments of the Company.
* Mr. Harsh Goenka holds 774 equity shares as a
Trustee of Crystal India Tech Trust and 1 Equity Share
each as a Trustee of Nucleus Life Trust, Stellar Energy
Trust and Monitor Portfolio Trust.
4. Stakeholders Relationship Committee:
A. Composition:
Currently, the Stakeholders Relationship Committee is
comprised of Mr. A. T. Vaswani and Dr. Ganesh
Natarajan. Mr. A. T. Vaswani is the Chairman of the
Committee. Mr. Nilesh Limaye, Company Secretary is
designated as a Compliance Officer.
The Committee meets at regular intervals in order to
faci l i tate prompt and ef fect ive redressal of
Shareholders' complaints, to effect transfers,
transmissions and give approval for issue of duplicate
share certificates/name deletion etc. The Company in
coordination with Registrars and Share Transfer Agent
takes all necessary steps for prompt resolution of all
Shareholder complaints and the Committee
periodically reviews the reports of the same. With the
intention of servicing the shareholders more
expeditiously, the Committee has delegated the
authority to approve transfers and transmissions up to
500 shares per transaction identified by a separate
transfer number to Mr. S. Balasubramaniam, Chief
Financial Officer and/or Mr. Nilesh Limaye, Company
Secretary.
B. Meetings:
During the Financia l Year 2015-16, twelve
Stakeholders Relationship Committee meetings were
held on 28th April, 2015, 29th May, 2015, 24th June,
2015, 29th July, 2015, 31st August, 2015, 18th
September, 2015, 20th October, 2015, 24th November,
2015, 29th December, 2015, 19th January, 2016, 24th
February, 2016 and 28th March, 2016.
The particulars of attendance at the Committee
Meetings during the year are given in the table below:
Name No. of Meetings Attended
Mr. A. T. Vaswani (Chairman) 12@Mr. P. K. Choksey 6
Dr. Ganesh Natarajan 12
@ Mr. P. K. Choksey ceased to be member of
Committee from 26th December, 2015 due to his
demise on that date.
Zensar Technologies Ltd | 66
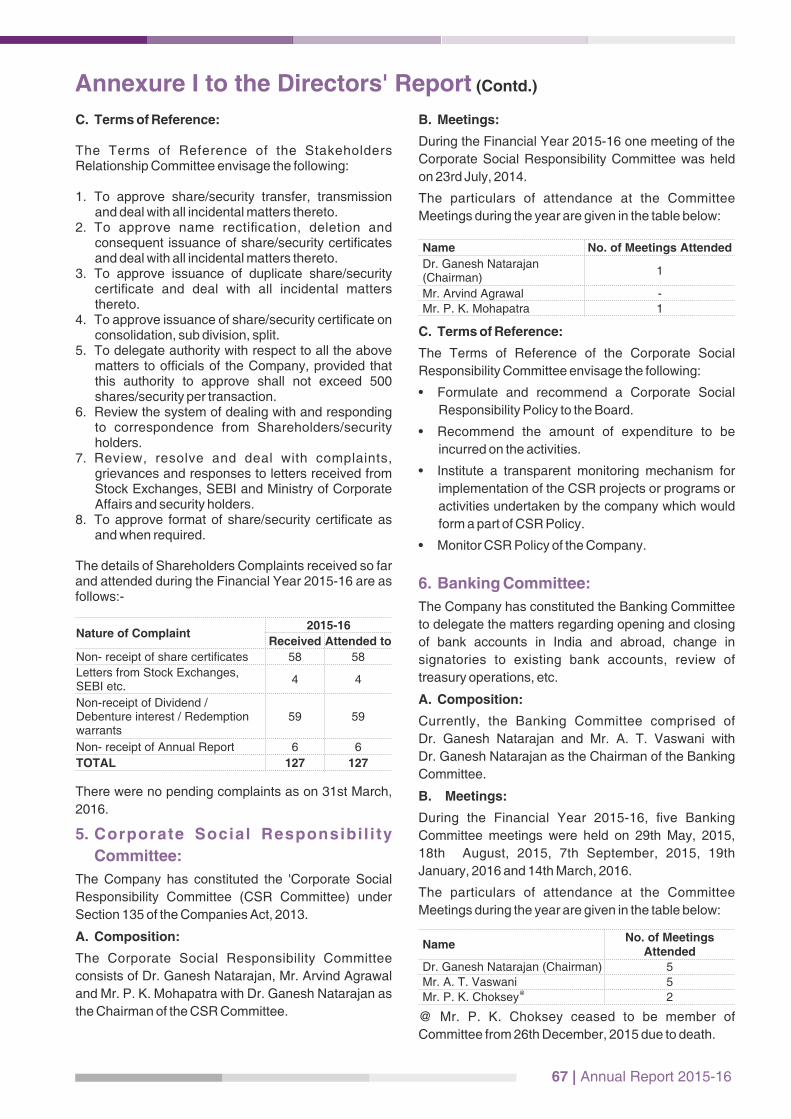
C. Terms of Reference:
The Terms of Reference of the Stakeholders Relationship Committee envisage the following:
1. To approve share/security transfer, transmission and deal with all incidental matters thereto.
2. To approve name rectification, deletion and consequent issuance of share/security certificates and deal with all incidental matters thereto.
3. To approve issuance of duplicate share/security certificate and deal with all incidental matters thereto.
4. To approve issuance of share/security certificate on consolidation, sub division, split.
5. To delegate authority with respect to all the above matters to officials of the Company, provided that this authority to approve shall not exceed 500 shares/security per transaction.
6. Review the system of dealing with and responding to correspondence from Shareholders/security holders.
7. Review, resolve and deal with complaints, grievances and responses to letters received from Stock Exchanges, SEBI and Ministry of Corporate Affairs and security holders.
8. To approve format of share/security certificate as and when required.
The details of Shareholders Complaints received so far and attended during the Financial Year 2015-16 are as follows:-
Annexure I to the Directors' Report (Contd.)
Nature of Complaint2015-16
Received Attended to
Non- receipt of share certificates 58 58
Letters from Stock Exchanges, SEBI etc.
4 4
Non-receipt of Dividend / Debenture interest / Redemption warrants
59 59
Non- receipt of Annual Report 6 6
TOTAL 127 127
There were no pending complaints as on 31st March,
2016.
5. Corporate Social Responsibi l i ty
Committee:
The Company has constituted the 'Corporate Social
Responsibility Committee (CSR Committee) under
Section 135 of the Companies Act, 2013.
A. Composition:
The Corporate Social Responsibility Committee
consists of Dr. Ganesh Natarajan, Mr. Arvind Agrawal
and Mr. P. K. Mohapatra with Dr. Ganesh Natarajan as
the Chairman of the CSR Committee.
B. Meetings:
During the Financial Year 2015-16 one meeting of the
Corporate Social Responsibility Committee was held
on 23rd July, 2014.
The particulars of attendance at the Committee
Meetings during the year are given in the table below:
Name No. of Meetings Attended
Dr. Ganesh Natarajan (Chairman)
1
Mr. Arvind Agrawal -
Mr. P. K. Mohapatra 1
C. Terms of Reference:
The Terms of Reference of the Corporate Social
Responsibility Committee envisage the following:
• Formulate and recommend a Corporate Social
Responsibility Policy to the Board.
• Recommend the amount of expenditure to be
incurred on the activities.
• Institute a transparent monitoring mechanism for
implementation of the CSR projects or programs or
activities undertaken by the company which would
form a part of CSR Policy.
• Monitor CSR Policy of the Company.
6. Banking Committee:
The Company has constituted the Banking Committee
to delegate the matters regarding opening and closing
of bank accounts in India and abroad, change in
signatories to existing bank accounts, review of
treasury operations, etc.
A. Composition:
Currently, the Banking Committee comprised of
Dr. Ganesh Natarajan and Mr. A. T. Vaswani with
Dr. Ganesh Natarajan as the Chairman of the Banking
Committee.
B. Meetings:
During the Financial Year 2015-16, five Banking
Committee meetings were held on 29th May, 2015,
18th August, 2015, 7th September, 2015, 19th
January, 2016 and 14th March, 2016.
The particulars of attendance at the Committee
Meetings during the year are given in the table below:
Name No. of Meetings
Attended
Dr. Ganesh Natarajan (Chairman) 5
Mr. A. T. Vaswani 5@Mr. P. K. Choksey 2
@ Mr. P. K. Choksey ceased to be member of
Committee from 26th December, 2015 due to death.
67 | Annual Report 2015-16
Annexure I to the Directors' Report (Contd.)
C. Terms of Reference:
The Terms of Reference of the Banking Committee
envisage the following:
• Authorising opening and closure of all types of bank
accounts (including EEFC Account) in India and
overseas.
• Authorising new signatories and/or change,
removal of existing authorized signatories in
relation to bank accounts, loans (granted and
availed), working capital facilities and all other types
of borrowings.
• Defining/amending signing powers of new/existing
authorized signatories, in relation to bank accounts,
loans (granted and availed), working capital
facilities and all other type of borrowings.
• Authorising new signatories and/or change,
removal of existing authorised signatories in terms
of forward contracts and forex transactions.
• Review of Treasury Operations.
7. Meeting of Independent Directors:
During the year under review, the Independent
Directors met on 19th October, 2015, inter alia, to
discuss matters as prescribed under the Companies
Act, 2013 and Listing Regulations. All the Independent
Directors were present at the Meeting.
Code of Conduct:
The Board of Directors of the Company has laid down a
Code of Conduct for all its Members and Senior
Management personnel of the Company. This Code of
Conduct is uploaded on Company's website
www.zensar.com. The Directors and Senior
Management have affirmed their compliance with the
Code of Conduct for the Financial Year 2015-16. A
declaration from the Managing Director and Chief
Executive Officer confirming the above is annexed to
this report.
8. FAMILIARISATION PROGRAMME FOR
DIRECTORS:
The Company through its Managing Director and other
Senior Officials of the Company have presentations
sessions periodically to familiarize the Independent
Directors with the strategy, operations and functions of
the Company. Such presentations provide an
opportunity to the Independent Directors to interact with
the Senior Officials of the Company and help them to
understand the Company's strategy, business model,
operations, service and product offerings, markets,
organisation structure, finance, human resources and
such other areas as may arise from time to time.
The details of the Familiarization programme have
been uploaded on the Company's websi te:
http://www.zensar.com/sites/all/themes/zensar/pdf/In
vestors/FAMILIARISATION%20PROGRAMMES%20
FOR%20INDEPENDENT%20DIRECTORS.pdf
9. Details of previous Annual General Meetings and special resolutions passed at such
Annual General Meetings:
Particulars Financial Year 2012-13 Financial Year 2013-14 Financial Year 2014-15
Date and Time 16th July, 2013 at 12.00 Noon 23rd July, 2014 at 12.00 Noon 14th July, 2015 at 12.00 Noon
Venue Registered Office of the Company at Zensar Knowledge Park, Plot # 4, Kharadi MIDC, Off Nagar Road, Pune 411014
Registered Office of the Company at Zensar Knowledge Park, Plot # 4, Kharadi MIDC, Off Nagar Road, Pune 411014
Registered Office of the Company at Zensar Knowledge Park, Plot # 4, Kharadi MIDC, Off Nagar Road, Pune 411014
The following Special Resolutions were passed by
Shareholders of the Company at the previous three
Annual General Meetings:
(i) In the Annual General Meeting held on 16th July,
2013.
(a) Grant of additional Stock options under 2006
Employees Stock Opt ions Plan to the
employees of Company's subsidiaries.
(ii) In the Annual General Meeting held on 23rd July,
2014
(a) None
(iii) In the Annual General Meeting held on 14th July,
2015.
(a) Approval of Payment of Commission to Non-
Executive Directors of the Company.
The Company conducted postal ballot to obtain
Zensar Technologies Ltd | 68
approval of its Shareholders as stated in table below for
the Ordinary / Special Resolutions pursuant to Section
110 and other applicable provisions, if any, of the
Companies Act, 2013 read together with the
Companies (Management and Administration) Rules,
2014 (the Rules).
In compliance with Regulation 44 of the Listing
Regulations and provisions of Section 108, Section 110
of the Companies Act, 2013 read with Rule 20 and 22 of
the Rules, the Company had offered e-voting facility to
all its Members as an alternate mode to exercise their
right to vote. For this purpose, the Company had
entered into an agreement with National Securities
Depository Limited (NSDL) for facilitating e-voting.
The Company had appointed Mr. S. V. Deulkar of SVD
& Associates, Company Secretaries, as Scrutinizer for
conducting the postal ballot process (which includes e-
voting) in fair and transparent manner.
Annexure I to the Directors' Report (Contd.)
The result of the postal ballot was declared on 22nd March, 2016 wherein these Ordinary / Special Resolutions were
declared passed with overwhelming majority by the Shareholders. Details of Voting Pattern are as under:
Particulars / Description of item No.
No. of Shares held
No. of Votes Polled
% of Votes Polled
Votes in favour
Votes Against
No. % No. %
Appointment of Mr. Sudip Nandy (DIN: 07199187) as an Independent Director not liable to retire by rotation.
44612638 37636102 84.361 37634301 99.995 1841 0.005
Amendments to Articles of Association of the Company.
44612638 37629799 84.347 37628200 99.996 1599 0.004
Appointment of Mr. Shashank Singh (DIN: 02826978) as Non-Independent and Non-Executive Director liable to retire by rotation.
44612638 37629820 84.348 33112913 87.996 4516907 12.004
Appointment of Mr. Sandeep Kishore (DIN: 07393680) as Managing Director and Chief Executive Officer of the Company.
44612638 37629484 84.347 33112611 87.996 4516873 12.004
Approval of Zensar Technologies Limited – Employees Stock Options Plan 2016 (EPAP 2016).
44612638 37629521 84.347 31996315 85.030 5633206 14.970
Grant of Performance Award Units to the employees of the Subsidiary Company (ies) of the Company under Zensar Technologies Limited – Employee Performance Award Unit Plan 2016 (EPAP 2016).
44612638 37635667 84.361 32001113 85.029 5634554 14.971
10. Disclosures:
A. Related Party Transactions:
All related party transactions that were entered into
during the financial year were on an arm's length basis
and were in the ordinary course of business.
All Related Party Transactions are placed before the
Audit Committee. Prior omnibus approval of the Audit
Committee is obtained on a yearly basis for the
transactions which are repetitive in nature. The actual
transactions entered into pursuant to the omnibus
approval so granted are placed at quarterly meetings of
the Audit Committee.
The transactions with the related parties are disclosed
in the Note No. 27 of the Annual Accounts in
compliance with Accounting Standard 18 relating to
“Related Party Disclosures” and Companies Act, 2013
read with Rules thereunder and Listing Regulations.
The Board has approved a 'Policy on Related Party
Transactions' web link of which forms part of Directors'
Report.
There are no materially significant related party
transactions that may have potential conflict with the
interests of the Company at large.
69 | Annual Report 2015-16
Annexure I to the Directors' Report (Contd.)
B. Statutory Compliance, Penalties and Strictures:
There were no instances of material non-compliance
and no strictures or penalties were imposed on the
Company either by SEBI, Stock Exchanges or any
statutory authorities on any matter related to capital
markets during the last three years.
C. Disclosure relating to Whistle Blower Policy and
affirmation that no personnel have been denied
access to the audit committee:
The Board of Directors have adopted Whistle Blower
Policy. All Associates of the Company are free to
access the Audit Committee of the Company and none
of them has been denied access to the Audit
Committee during the year under review. The Whistle
Blower Policy's web link forms part of Directors' Report.
D. Details of compliance with mandatory
requirements and adoption of the non-mandatory
requirements.
The Company has complied with all mandatory
requirements laid down by Listing Regulations. The
Company has also complied with some of the Non
Mandatory requ i rements such as updat ing
Shareholders about the financial performance of the
Company including summary of the significant events
on quarterly basis, Separate posts of Chairman and
Managing Director, Reporting of Internal Auditor
directly to the Audit Committee.
9. Means of Communication
• The quarterly, half-yearly and Annual Consolidated
Financial Results are published in widely circulated
newspapers such as Business Standard / Economic
Times / Financial Express, Prabhat / Maharashtra
Times / Loksatta, etc. in terms of Regulation 47 of
the Listing Regulations.
• The Company organizes press meets / Analyst's
meets to apprise and make public the information
relating to the Company's working and future
outlook. The transcripts of the same are uploaded
o n t h e C o m p a n y ' s w e b s i t e n a m e l y
www.zensar.com
• Official Press releases are also hosted on
Company's website www.zensar.com
• The Financial Results and presentations made to
institutional investors or analysts are displayed on
the Company's website www.zensar.com
• The Company's website is updated periodically to
include information on new developments and
business opportunities of the Company.
• The Company has the practice of mailing quarterly
Newsletter to the Company's Shareholders. The
Shareholders are kept informed about important
developments in the Company.
• The investors can contact the Company on the
email id [email protected].
• Management discussion and analysis forms part of
this Annual Report.
• The Company has as per Green initiatives taken by
Ministry of Corporate Affairs, invited the members to
register their e mail addresses with the Company so
that all communications / documents including the
Notice calling the Annual General Meeting and
other General Meeting of the members along with
explanatory statement(s) thereto, Balance Sheets,
Director's reports, Auditor's Reports etc. for the
financial year 2010-11 and thereafter, can be sent to
them in electronic mode.
11. General Shareholder information:
1. Annual General Meeting: The Annual General
Meeting of the Company will be held on 20th July,
2016, at the registered office of the Company at
12.00 Noon.
2. Financial Year: 1st April to 31st March
3. Book Closure Dates: The Company's Register of
Members and Share Transfer Books will remain
closed for the purpose of dividend from 13th July,
2016 to 20th July, 2016 (both days inclusive).
4. Dividend payment: The Board of Directors did not
declared any final dividend to the Shareholders of
the Company during the Financial Year 2015-16.
However, earlier during the year, the Board of
Directors declared two Interim Dividends at the rate
of Rs.5/- and Rs.7/- per equity share of Rs.10/- each
which was paid on 16th February, 2016 and 29th
March, 2016.
5. Financial calendar (tentative and subject to
change)
Event Due Date
Financial reporting for the quarter ending 30th June, 2016
15th August, 2016
Financial reporting for the quarter ending 30th September, 2016
15th November, 2016
Financial reporting for the quarter ending 31st December, 2016
15th February, 2017
Financial reporting for the quarter ending 31st March, 2017
30th May, 2017 (Audited)
54th Annual General Meeting for the year ending 31st March, 2017
19th September, 2017
Zensar Technologies Ltd | 70
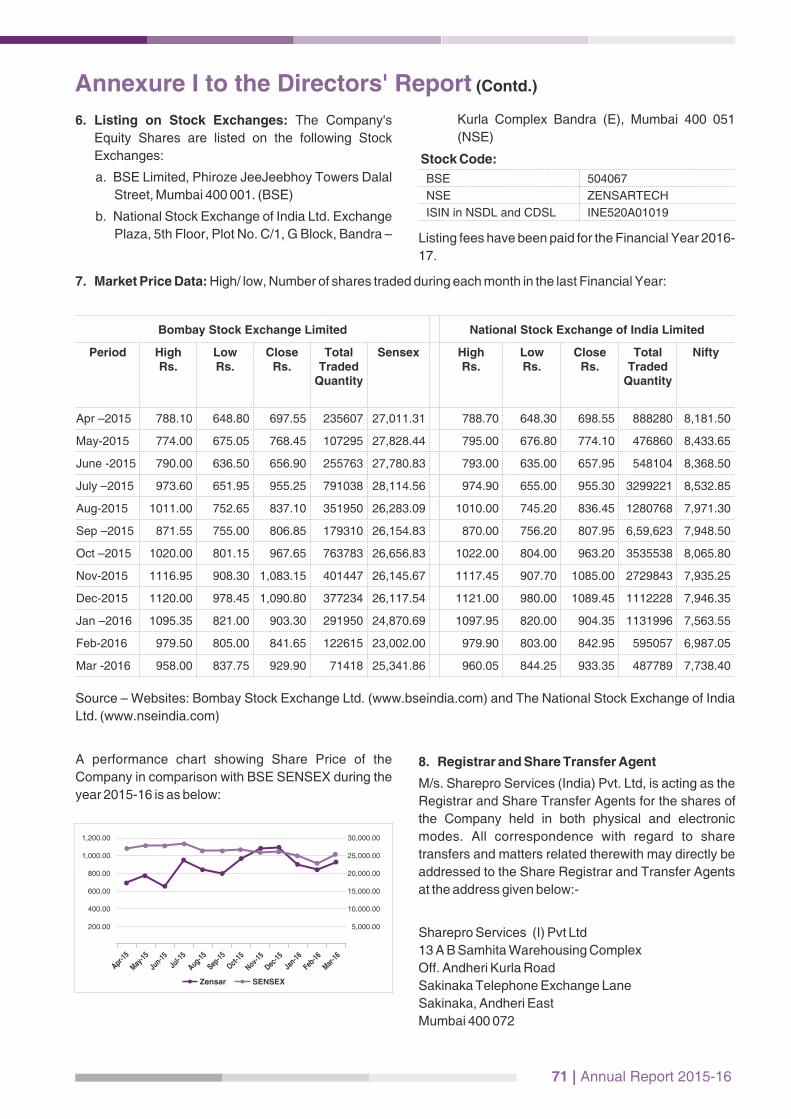
Annexure I to the Directors' Report (Contd.)
6. Listing on Stock Exchanges: The Company's
Equity Shares are listed on the following Stock
Exchanges:
a. BSE Limited, Phiroze JeeJeebhoy Towers Dalal
Street, Mumbai 400 001. (BSE)
b. National Stock Exchange of India Ltd. Exchange
Plaza, 5th Floor, Plot No. C/1, G Block, Bandra –
BSE 504067
NSE ZENSARTECH
ISIN in NSDL and CDSL INE520A01019
Kurla Complex Bandra (E), Mumbai 400 051
(NSE)
Stock Code:
7. Market Price Data: High/ low, Number of shares traded during each month in the last Financial Year:
Listing fees have been paid for the Financial Year 2016-
17.
Bombay Stock Exchange Limited National Stock Exchange of India Limited
Period HighRs.
LowRs.
CloseRs.
Total Traded
Quantity
Sensex HighRs.
LowRs.
CloseRs.
Total Traded
Quantity
Nifty
Apr –2015 788.10 648.80 697.55 235607 27,011.31 788.70 648.30 698.55 888280 8,181.50
May-2015 774.00 675.05 768.45 107295 27,828.44 795.00 676.80 774.10 476860 8,433.65
June -2015 790.00 636.50 656.90 255763 27,780.83 793.00 635.00 657.95 548104 8,368.50
July –2015 973.60 651.95 955.25 791038 28,114.56 974.90 655.00 955.30 3299221 8,532.85
Aug-2015 1011.00 752.65 837.10 351950 26,283.09 1010.00 745.20 836.45 1280768 7,971.30
Sep –2015 871.55 755.00 806.85 179310 26,154.83 870.00 756.20 807.95 6,59,623 7,948.50
Oct –2015 1020.00 801.15 967.65 763783 26,656.83 1022.00 804.00 963.20 3535538 8,065.80
Nov-2015 1116.95 908.30 1,083.15 401447 26,145.67 1117.45 907.70 1085.00 2729843 7,935.25
Dec-2015 1120.00 978.45 1,090.80 377234 26,117.54 1121.00 980.00 1089.45 1112228 7,946.35
Jan –2016 1095.35 821.00 903.30 291950 24,870.69 1097.95 820.00 904.35 1131996 7,563.55
Feb-2016 979.50 805.00 841.65 122615 23,002.00 979.90 803.00 842.95 595057 6,987.05
Mar -2016 958.00 837.75 929.90 71418 25,341.86 960.05 844.25 933.35 487789 7,738.40
Source – Websites: Bombay Stock Exchange Ltd. (www.bseindia.com) and The National Stock Exchange of India
Ltd. (www.nseindia.com)
A performance chart showing Share Price of the
Company in comparison with BSE SENSEX during the
year 2015-16 is as below:
8. Registrar and Share Transfer Agent
M/s. Sharepro Services (India) Pvt. Ltd, is acting as the
Registrar and Share Transfer Agents for the shares of
the Company held in both physical and electronic
modes. All correspondence with regard to share
transfers and matters related therewith may directly be
addressed to the Share Registrar and Transfer Agents
at the address given below:-
Sharepro Services (I) Pvt Ltd
13 A B Samhita Warehousing Complex
Off. Andheri Kurla Road
Sakinaka Telephone Exchange Lane
Sakinaka, Andheri East
Mumbai 400 072
71 | Annual Report 2015-16
Apr-15
May-15
Jun-15
Jul-15
Aug-15
Sep-15
Oct-15
Nov-15
Dec-15
Jan-16
Feb-16
Mar-16
1,200.00
1,000.00
800.00
600.00
400.00
200.00
30,000.00
25,000.00
20,000.00
15,000.00
10,000.00
5,000.00
Zensar SENSEX
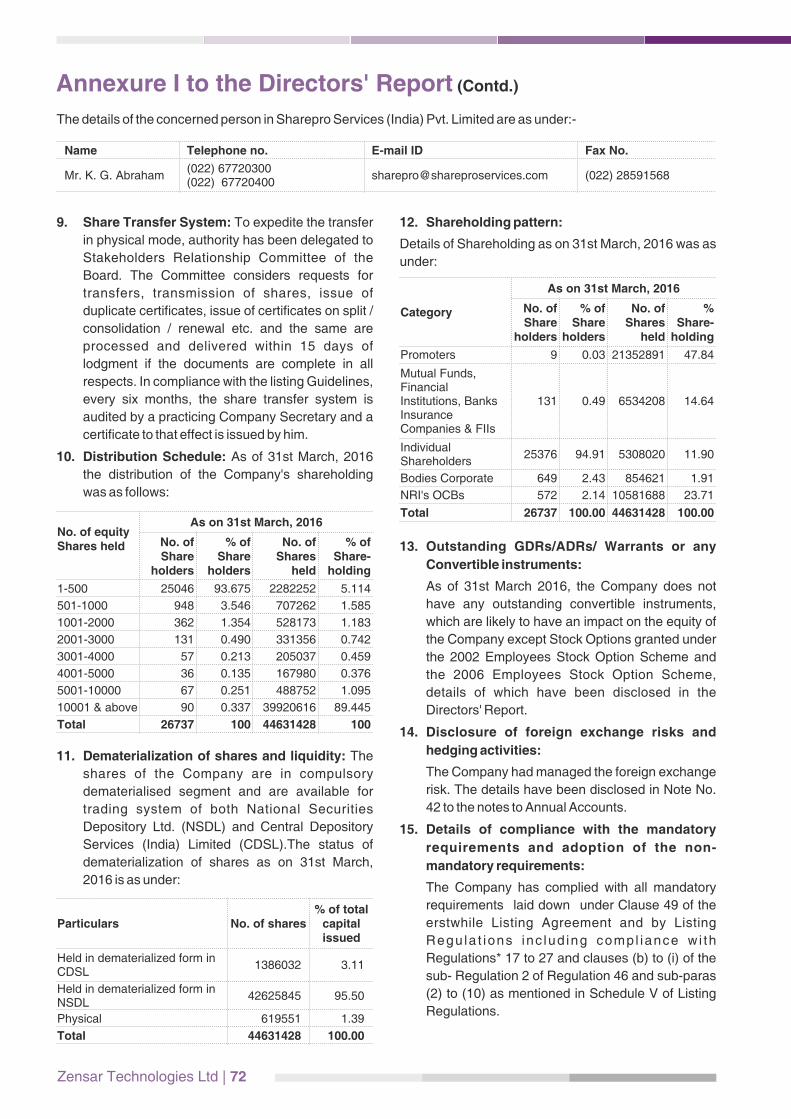
Annexure I to the Directors' Report (Contd.)
The details of the concerned person in Sharepro Services (India) Pvt. Limited are as under:-
Name Telephone no. E-mail ID Fax No.
Mr. K. G. Abraham (022) 67720300 (022) 67720400
[email protected] (022) 28591568
9. Share Transfer System: To expedite the transfer
in physical mode, authority has been delegated to
Stakeholders Relationship Committee of the
Board. The Committee considers requests for
transfers, transmission of shares, issue of
duplicate certificates, issue of certificates on split /
consolidation / renewal etc. and the same are
processed and delivered within 15 days of
lodgment if the documents are complete in all
respects. In compliance with the listing Guidelines,
every six months, the share transfer system is
audited by a practicing Company Secretary and a
certificate to that effect is issued by him.
10. Distribution Schedule: As of 31st March, 2016
the distribution of the Company's shareholding
was as follows:
No. of equity Shares held
As on 31st March, 2016
No. of Share
holders
% of Share
holders
No. of Shares
held
% of Share-
holding
1-500 25046 93.675 2282252 5.114
501-1000 948 3.546 707262 1.585
1001-2000 362 1.354 528173 1.183
2001-3000 131 0.490 331356 0.742
3001-4000 57 0.213 205037 0.459
4001-5000 36 0.135 167980 0.376
5001-10000 67 0.251 488752 1.095
10001 & above 90 0.337 39920616 89.445
Total 26737 100 44631428 100
11. Dematerialization of shares and liquidity: The
shares of the Company are in compulsory
dematerialised segment and are available for
trading system of both National Securities
Depository Ltd. (NSDL) and Central Depository
Services (India) Limited (CDSL).The status of
dematerialization of shares as on 31st March,
2016 is as under:
Particulars No. of shares% of total
capital issued
Held in dematerialized form in CDSL
1386032 3.11
Held in dematerialized form in NSDL
42625845 95.50
Physical 619551 1.39
Total 44631428 100.00
12. Shareholding pattern:
Details of Shareholding as on 31st March, 2016 was as
under:
Category
As on 31st March, 2016
No. of Share
holders
% of Share
holders
No. of Shares
held
% Share-
holding
Promoters 9 0.03 21352891 47.84
Mutual Funds, Financial Institutions, Banks Insurance Companies & FIIs
131 0.49 6534208 14.64
Individual Shareholders
25376 94.91 5308020 11.90
Bodies Corporate 649 2.43 854621 1.91
NRI's OCBs 572 2.14 10581688 23.71
Total 26737 100.00 44631428 100.00
13. Outstanding GDRs/ADRs/ Warrants or any
Convertible instruments:
As of 31st March 2016, the Company does not
have any outstanding convertible instruments,
which are likely to have an impact on the equity of
the Company except Stock Options granted under
the 2002 Employees Stock Option Scheme and
the 2006 Employees Stock Option Scheme,
details of which have been disclosed in the
Directors' Report.
14. Disclosure of foreign exchange risks and
hedging activities:
The Company had managed the foreign exchange
risk. The details have been disclosed in Note No.
42 to the notes to Annual Accounts.
15. Details of compliance with the mandatory
requirements and adoption of the non-
mandatory requirements:
The Company has complied with all mandatory
requirements laid down under Clause 49 of the
erstwhile Listing Agreement and by Listing
Regu la t ions inc lud ing compl iance w i th
Regulations* 17 to 27 and clauses (b) to (i) of the
sub- Regulation 2 of Regulation 46 and sub-paras
(2) to (10) as mentioned in Schedule V of Listing
Regulations.
Zensar Technologies Ltd | 72

* Regulation 21 is not applicable to the Company as
on March 31, 2016.
16. Nomination:
Members can avail of nomination facility. Blank
nomination forms will be supplied on request which
is also available on the website of the Company
under the Investor's section.
17. Address for Communication
Mr. Nilesh Limaye
Company Secretary, Zensar Technologies Ltd.
Zensar Knowledge Park, Kharadi, Plot # 4, MIDC,
Off Nagar Road, Pune 411 014, India.
Phone No. (020) 66074000,
Fax No: (020) 66074433,
Email: [email protected]
Other Shareholders related information:
Provision of the Listing Regulations with respect to
Unclaimed Shares
• In compliance with the amendment to Clause 5A of
the Listing Agreement issued by SEBI, the
Company has opened a demat account in the
name of ”Zensar Technologies Limited-
Unclaimed Securities Suspense Account” for the
purpose of transferring the unclaimed shares. As
per the said circular, the shares which remained
unclaimed even after three reminders, were
dematerialized and transferred to the above said
demat account in FY 2014-15.
• As and when any shareholder approaches the
Company or the Registrar and Transfer Agent
(RTA) to claim the above said shares, after proper
verification, the shares lying in the Unclaimed
suspense account shall either be credited to the
demat account of the shareholder or the physical
certificates shall be delivered after rematerialising
the same, depending on what has been opted by
the Shareholder.
• Disclosure with respect to shares lying in
suspense account:
Annexure I to the Directors' Report (Contd.)
Particulars Shareholders Shares
Aggregate number of shareholders and the outstanding shares in the suspense account lying as on 1st April, 2015
1353 76425
Number of shareholders who approached the Company for transfer of shares from suspense account during the period 2015-16
19 1241
Number of shareholders to whom the shares were transferred from the suspense account during the period 2015-16
19 1241
Aggregate number of shareholders and the outstanding shares in the suspense account lying as on 31st March, 2016
1334 75184
The voting rights on such shares shall remain frozen till
the rightful owner claims the shares.
Code of Conduct
In tune with the corporate philosophy, the Board of Directors of the Company has laid down a Code of Conduct for all
Board Members and Senior Management of the Company in terms of provisions of the Listing Agreement. The Code
of Conduct is uploaded at Company's Website.
I hereby confirm that the Company has obtained from all members of the Board and Senior Management personnel,
affirmation that they have complied with the Code of Conduct for the Financial Year 2015-16.
Mr. Sandeep Kishore
Managing Director & Chief Executive Officer
Mumbai
Dated 22nd April, 2016
73 | Annual Report 2015-16
For and on behalf of the Board
H.V. Goenka
Chairman
Place: Mumbai
Dated: 22nd April, 2016
Annexure I to the Directors' Report (Contd.)
CEO/CFO CERTIFICATION
We, Sandeep Kishore, Managing Director and Chief Executive Officer and Mr. S. Balasubramaniam, Chief Financial Officer of Zensar Technologies Ltd. hereby certify to the Board that:
(a) We have reviewed financial statements and the cash flow statement for the Financial Year ended 31st March 2016 and that to the best of our knowledge and belief:
(i) these statements do not contain any materially untrue statement or omit any material fact or contain statements that might be misleading;
(ii) these statements together present a true and fair view of the Company's affairs and are in compliance with existing accounting standards, applicable laws and regulations.
(b) There are, to the best of our knowledge and belief, no transactions entered into by the Company during the year which are fraudulent, illegal or violative of the Company's code of conduct.
(c) We accept responsibility for establishing and maintaining internal controls for financial reporting and we have evaluated the effectiveness of internal control systems of the Company pertaining to financial reporting and we have disclosed to the auditors and the Audit Committee, deficiencies in the design or operation of such internal controls, if any, of which we are aware and the steps taken or proposed to be taken to rectify these deficiencies.
(d) We have indicated to the auditors and the Audit committee:
(i) significant changes in internal control over financial reporting during the year;
(ii) significant changes in accounting policies during the year and that the same have been disclosed in the notes to the financial statements; and
(iii) instances of significant fraud of which we have become aware and the involvement therein, if any, of the management or an employee having a significant role in the Company's internal control system over financial reporting.
Sandeep Kishore S. Balasubramaniam
Managing Director and Chief Executive Officer Chief Financial Officer
Mumbai
Dated 22nd April, 2016
PRACTICING COMPANY SECRETARY'S CERTIFICATETo,
The Members of Zensar Technologies Limited
We have examined the compliance of conditions of corporate governance by Zensar Technologies Limited (hereinafter referred “the Company”), for the year ended on 31st March, 2016 as stipulated in Clause 49 of the Listing Agreement ('Listing Agreement') of the Company with the stock exchanges for the period 1st April, 2015 to 30th November, 2015 and as per relevant provisions of Chapter IV of Securities and Exchange Board of India (Listing Obligations and Disclosures requirements) Regulations, 2015 ('Listing Regulations') for the period 1st December, 2015 to 31st March, 2016.
The compliance of conditions of corporate governance is the responsibility of the management. Our examination was limited to procedures and implementation thereof, adopted by the company for ensuring the compliance of the conditions of the Corporate Governance. It is neither an audit nor an expression of opinion on the financial statements of the Company.
In our opinion and to the best of our information and according to the explanations given to us, we certify that the Company has complied with the conditions of corporate governance as stipulated in the above mentioned Listing Agreement/Listing Regulations, as applicable.
We further state that such compliance is neither an assurance as to the future viability of the Company nor efficiency or effectiveness with which the management has conducted the affairs of the Company.
For SVD & AssociateCompany Secretaries
S. V. Deulkar Date: 22nd April, 2016 Partner Place: Pune F.C.S. 1321 C.P. No. 965
Zensar Technologies Ltd | 74
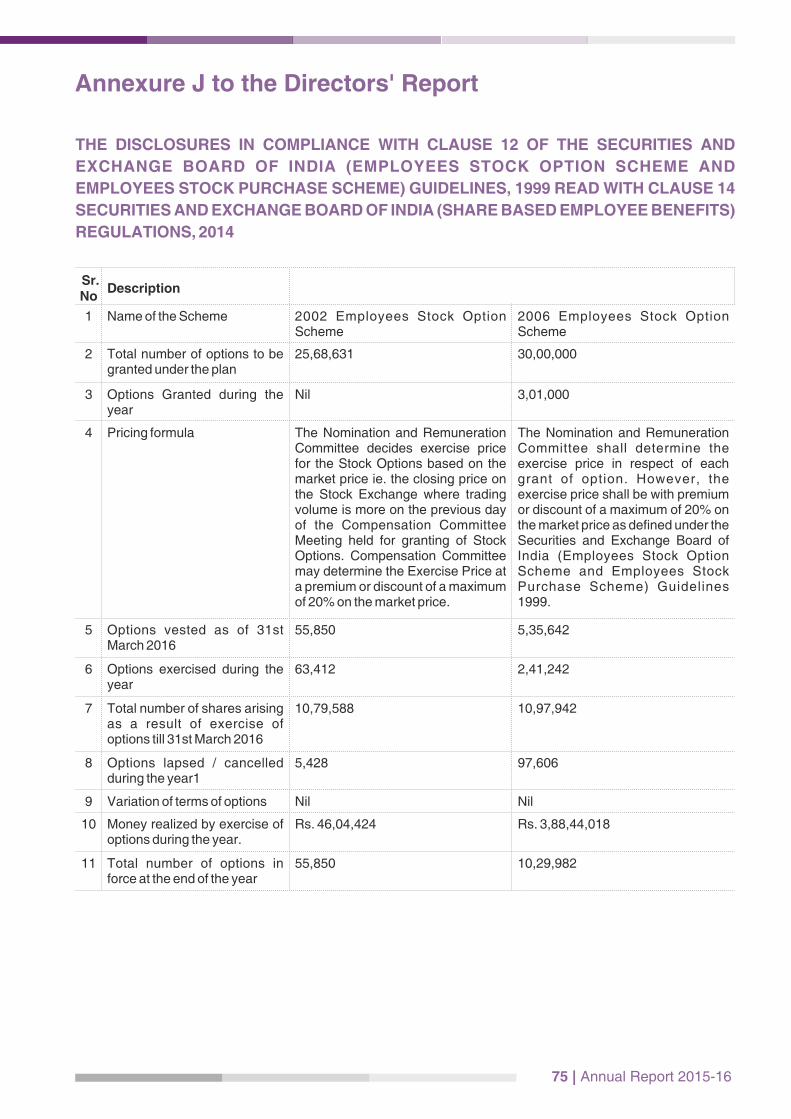
Annexure J to the Directors' Report
THE DISCLOSURES IN COMPLIANCE WITH CLAUSE 12 OF THE SECURITIES AND
EXCHANGE BOARD OF INDIA (EMPLOYEES STOCK OPTION SCHEME AND
EMPLOYEES STOCK PURCHASE SCHEME) GUIDELINES, 1999 READ WITH CLAUSE 14
SECURITIES AND EXCHANGE BOARD OF INDIA (SHARE BASED EMPLOYEE BENEFITS)
REGULATIONS, 2014
Sr. No
Description
1 Name of the Scheme 2002 Employees Stock Option Scheme
2006 Employees Stock Option Scheme
2 Total number of options to be granted under the plan
25,68,631 30,00,000
3 Options Granted during the year
Nil 3,01,000
4 Pricing formula The Nomination and Remuneration Committee decides exercise price for the Stock Options based on the market price ie. the closing price on the Stock Exchange where trading volume is more on the previous day of the Compensation Committee Meeting held for granting of Stock Options. Compensation Committee may determine the Exercise Price at a premium or discount of a maximum of 20% on the market price.
The Nomination and Remuneration Committee shall determine the exercise price in respect of each grant of option. However, the exercise price shall be with premium or discount of a maximum of 20% on the market price as defined under the Securities and Exchange Board of India (Employees Stock Option Scheme and Employees Stock Purchase Scheme) Guidelines 1999.
5 Options vested as of 31st March 2016
55,850 5,35,642
6 Options exercised during the year
63,412 2,41,242
7 Total number of shares arising as a result of exercise of options till 31st March 2016
10,79,588 10,97,942
8 Options lapsed / cancelled during the year1
5,428 97,606
9 Variation of terms of options Nil Nil
10 Money realized by exercise of options during the year.
Rs. 46,04,424 Rs. 3,88,44,018
11 Total number of options in force at the end of the year
55,850 10,29,982
75 | Annual Report 2015-16

Sr. No
Description
12 Employee-wise details of Stock Options granted to Senior Managerial Personnel as on 31st March 2016.
Senior Management comprises the Managing Director and his direct reports. Accordingly, the details of Stock Options granted are as follows:- Dr. Ganesh Natarajan - 500000; Mr. Parmod Bhalla – 100000; Mr. Vivek Gupta – 21039; Mr. Nitin Parab – 18476; Mr. V. Balasubramanian – 19125; Mr. S. Balasubramaniam – 10407; Prameela Kalive - 1575; J Pardhasaradhi - 2100; Krishna Ramaswamy - 1575 (Of these, certain stock options have been exercised)
Senior Management comprises the Managing Director and his direct reports. Accordingly, the details of Stock Options granted are as follows:- Dr. Ganesh Natarajan – 400000; Mr. Vivek Gupta – 110000; Mr. Nitin Parab – 110000; S Balasubramaniam – 9000; Prameela Kalive – 6000, Krishna Ramaswamy – 6000, Mr. Sandeep Kishore - 125000Mr. Pinaki Kar- 100000, Mr. Harish Gala - 20000, Mr. Deepanjan Banerjee-20000
(Of these, certain stock options have been exercised)
13 Employees who were granted options amounting to 5% or more of the options granted during the year.
None
14 Employees who were granted options in any one year equal to or exceeding 1% of the issued capital of the Company at the time of grant.
Dr. Ganesh Natarajan : 500000 Al l these opt ions have been exercised.
Nil
15 Diluted Earnings Per Share (EPS) pursuant to issue of shares on exercise of option calculated in accordance with Accounting Standard (AS 20)
H 52.00 H 52.00
16 Where the Company has calculated the employee compensation cost using the intrinsic value of the stock o p t i o n s , t h e d i f f e r e n c e b e t w e e n t h e e m p l o y e e c o m p e n s a t i o n c o s t s o computed and the employee compensation cost that shall have been recognized if it had used the fair value of the options shall be disclosed. The impact of this difference on p r o fi t s a n d E P S o f t h e c o m p a n y s h a l l a l s o b e disclosed.
The Company calculates the Employee Compensation Cost using the intrinsic value of the Stock Options. The difference between the Employee Compensation Cost computed as per Intrinsic Value method and Fair Value Method is Rs Nil for the year, Fair Value being higher than Intrinsic Value. The impact on Profits and EPS is Re. Nil and Re. Nil respectively.
The Company calculates the Employee Compensation Cost using the intrinsic value of the Stock Options. The difference between the Employee Compensation Cost computed as per Intrinsic Value method and Fair Value Method is Rs 2.57 Crores for the year, Fair Value being higher than Intrinsic Value. The impact on Profits and EPS is Rs 2 . 5 7 C r o r e s a n d R e . 0 . 5 7 respectively.
Annexure J to the Directors' Report (Contd.)
Name of EmployeeNo of
Options
Mr. Sandeep Kishore 1,25,000
Mr. Pinaki Kar 1,00,000
Mr. Harish Gala 20,000
Mr. Deepanjan Banerjee 20,000
Zensar Technologies Ltd | 76

77 | Annual Report 2015-16
Sr. No
Description
17 Weighted-average exercise prices and weighted-average fair values of options shall be disclosed separately for options whose exercise price either equals or exceeds or is less than the market price of the stock on the grant date
Not applicable as there were no grants during the year under this plan.
Weighted average exercise price of the options is Rs 812.43Weighted average fair value of the options is 441.19
18 Description of the method and significant assumptions used during the year to estimate the fair values of options:
The Company has used the Black
Scholes Model for estimating the
Fair Value of the options. The
Company has applied the following
assumptions while computing the
fair value:
1. Risk-free interest rate : 7.59% -
7.99%
2. Expected life : 96 months
3. Weighted average of expected
volatility : 36.18% - 42.28%
4. Expected dividends : 1.11% -
1.62%
The weighted average price of
the underlying share in market at
the time of option grant: Nil.
The Company has used the Black
Scholes Model for estimating the
Fair Value of the options. The
Company has applied the following
assumptions while computing the
fair value:
1. Risk-free interest rate : 7.59% -
7.99%
2. Expected life : 96 months
3. Weighted average of expected
volatility : 36.18% - 42.28%
4. Expected dividends : 1.11% -
1.62%
5. The weighted average price of
the underlying share in market at
the time of option grant: Rs.
839.94
Annexure J to the Directors' Report (Contd.)
1 As per the 2002 ESOP and 2006 ESOP, options lapse after completion of the exercise period, which is 10 years
from the dates of respective vesting. If an option is cancelled on account of separation of the employee, without
having been exercised, such cancelled option shall become available for future grant under the plan.
2 No Option granted under ESOP 2002 scheme during the year.
For and on behalf of the Board
H.V. Goenka
Chairman
Place: MumbaindDated: 22 April, 2016
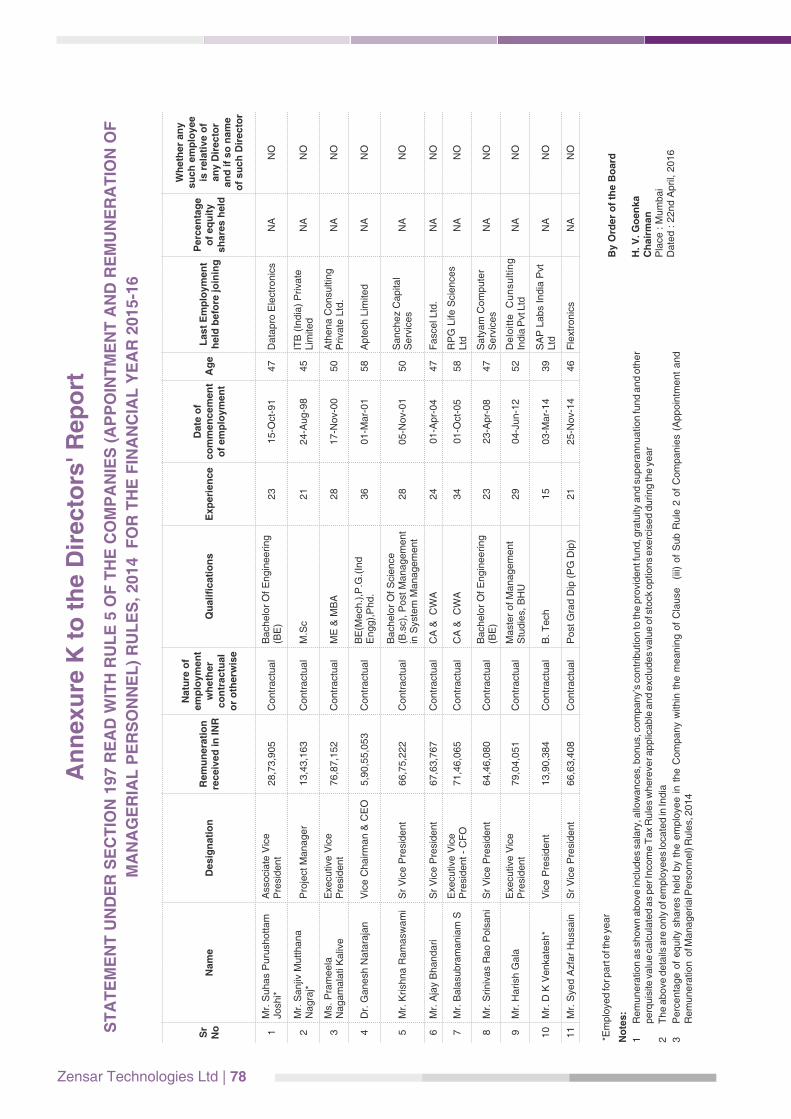
An
nexu
re K
to
th
e D
irecto
rs' R
ep
ort
ST
AT
EM
EN
T U
ND
ER
SE
CT
ION
19
7 R
EA
D W
ITH
RU
LE
5 O
F T
HE
CO
MP
AN
IES
(A
PP
OIN
TM
EN
T A
ND
RE
MU
NE
RA
TIO
N O
F
MA
NA
GE
RIA
L P
ER
SO
NN
EL
) R
UL
ES
, 2014 F
OR
TH
E F
INA
NC
IAL
YE
AR
2015-1
6
Sr
No
Nam
eD
esig
nati
on
Rem
un
era
tio
n
rec
eiv
ed
in
IN
R
Na
ture
of
em
plo
ym
en
t w
he
the
r c
on
tra
ctu
al
or
oth
erw
ise
Qu
alifi
ca
tio
ns
Ex
pe
rie
nc
e
Date
of
co
mm
en
cem
en
t o
f e
mp
loym
en
tA
ge
Last
Em
plo
ym
en
t h
eld
befo
re j
oin
ing
Perc
en
tag
e
of
eq
uit
y
sh
are
s h
eld
Wh
eth
er
an
y
su
ch
em
plo
yee
is r
ela
tive o
f an
y D
irecto
r an
d i
f so
nam
e
of
su
ch
Dir
ecto
r
1M
r. S
uhas
Puru
shott
am
Jo
shi*
Ass
oci
ate
Vic
e
Pre
sident
28
,73
,90
5
Co
ntr
actu
al
Ba
che
lor
Of E
ng
ine
erin
g
(BE
)2
31
5-O
ct-9
147
Data
pro
Ele
ctro
nic
sN
AN
O
2M
r. S
anjiv
Mutth
ana
Nagra
j*P
roje
ct M
anager
13
,43
,16
3
Co
ntr
actu
al
M.S
c2
12
4-A
ug-9
845
ITB
(In
dia
) P
riva
te
Lim
ited
NA
NO
3M
s. P
ram
eela
N
agam
ala
ti K
aliv
eE
xecu
tive V
ice
Pre
sident
76
,87
,15
2
Co
ntr
actu
al
ME
& M
BA
28
17-N
ov-
00
50
Ath
ena C
onsu
lting
Priva
te L
td.
NA
NO
4D
r. G
anesh
Nata
raja
nV
ice C
hairm
an &
CE
O
5,9
0,5
5,0
53
C
on
tra
ctu
al
BE
(Me
ch.)
,P.G
.(In
d
En
gg
),P
hd
.3
60
1-M
ar-
01
58
Apte
ch L
imite
d
NA
NO
5M
r. K
rish
na R
am
asw
am
iS
r V
ice P
resi
dent
66
,75
,22
2
Co
ntr
actu
al
Ba
che
lor
Of S
cie
nce
(B
.sc)
, P
ost
Ma
na
ge
me
nt
in S
yste
m M
an
ag
em
en
t2
80
5-N
ov-
01
50
Sanch
ez
Capita
l S
erv
ices
NA
NO
6M
r. A
jay
Bhandari
Sr
Vic
e P
resi
dent
67
,63
,76
7
Co
ntr
actu
al
CA
& C
WA
24
01
-Apr-
04
47
Fasc
el L
td.
NA
NO
7M
r. B
ala
subra
ma
nia
m S
Exe
cutiv
e V
ice
Pre
sident
- C
FO
71
,46
,06
5
Co
ntr
actu
al
CA
& C
WA
34
01
-Oct
-05
58
RP
G L
ife S
cience
s Ltd
NA
NO
8M
r. S
riniv
as
Rao P
ols
ani
Sr
Vic
e P
resi
dent
64
,46
,08
0
Co
ntr
actu
al
Ba
che
lor
Of E
ng
ine
erin
g
(BE
)2
32
3-A
pr-
08
47
Saty
am
Com
pute
r S
erv
ices
NA
NO
9M
r. H
arish
Gala
Exe
cutiv
e V
ice
Pre
sident
79
,04
,05
1
Co
ntr
actu
al
Ma
ste
r o
f M
an
ag
em
en
t S
tud
ies,
BH
U2
90
4-J
un-1
252
De
loit
te
Cu
nsu
ltin
g
India
Pvt
Ltd
NA
NO
10
Mr.
D K
Venka
tesh
*V
ice P
resi
dent
13
,90
,38
4
Co
ntr
actu
al
B. T
ech
15
03
-Mar-
14
39
SA
P L
abs
India
Pvt
Ltd
NA
NO
11
Mr.
Sye
d A
zfar
Huss
ain
Sr
Vic
e P
resi
dent
66
,63
,40
8
Co
ntr
actu
al
Po
st G
rad
Dip
(P
G D
ip)
21
25-N
ov-
14
46
Fle
xtro
nic
sN
AN
O
*E
mplo
yed fo
r part
of t
he y
ear
No
tes:
1
Rem
unera
tion a
s sh
ow
n a
bove
incl
udes
sala
ry, a
llow
ance
s, b
on
us,
co
mp
an
y’s
co
ntr
ibu
tion
to th
e p
rovi
de
nt f
un
d, g
ratu
ity a
nd
su
pe
ran
nu
atio
n fu
nd a
nd o
ther
perq
uis
ite v
alu
e c
alc
ula
ted a
s per In
com
e T
ax
Rule
s w
here
ver a
pp
lica
ble
an
d e
xclu
de
s va
lue
of s
tock
op
tion
s e
xerc
ise
d d
urin
g th
e y
ea
r
2
The a
bove
deta
ils a
re o
nly
of e
mplo
yees
loca
ted in
India
3
Perc
enta
ge o
f equity
share
s held
by
the e
mplo
yee i
n t
he
Co
mp
an
y w
ithin
th
e m
ea
nin
g o
f C
lau
se
(iii)
of
Su
b R
ule
2 o
f C
om
pa
nie
s (A
ppoin
tment
and
Rem
unera
tion o
f Managerial P
ers
onnel) R
ule
s, 2
014
By O
rder
of
the B
oard
H.
V.
Go
en
ka
Ch
air
man
Pla
ce :
Mum
bai
Date
d :
22nd A
pril,
2016
Zensar Technologies Ltd | 78
Zensar Technologies Ltd | 79
FINANCIALSTATEMENTS

Zensar Technologies Ltd | 80
81 | Annual Report 2015-16
TO THE MEMBERS OF ZENSAR TECHNOLOGIES LIMITED
Report on the Standalone Financial Statements
1. We have audited the accompanying standalone
financial statements of Zensar Technologies
Limited (“the Company”), which comprise the
Balance Sheet as at March 31, 2016, the Statement
of Profit and Loss, the Cash Flow Statement for the
year then ended, and a summary of the significant
accounting policies and other explanatory
information.
Management's Responsibility for the Standalone Financial Statements
2. The Company's Board of Directors is responsible for
the matters stated in Section 134(5) of the
Companies Act, 2013 (“the Act”) with respect to the
preparation of these standalone financial
statements to give a true and fair view of the
financial position, financial performance and cash
flows of the Company in accordance with the
accounting principles generally accepted in India,
including the Accounting Standards specified under
Section 133 of the Act, read with Rule 7 of the
Companies (Accounts) Rules, 2014 and Accounting
Standard 30, Financial Instruments: Recognition
and Measurement issued by the Institute of
Chartered Accountants of India to the extent it does
not contradict any other accounting standard
referred to in Section 133 of the Act read with Rule 7
of the Companies (Accounts) Rules, 2014. This
responsibility also includes maintenance of
adequate accounting records in accordance with
the provisions of the Act for safeguarding of the
assets of the Company and for preventing and
detecting frauds and other irregularities; selection
and application of appropriate accounting policies;
making judgments and estimates that are
r e a s o n a b l e a n d p r u d e n t ; a n d d e s i g n ,
implementation and maintenance of adequate
internal financial controls, that were operating
effectively for ensuring the accuracy and
completeness of the accounting records, relevant to
the preparation and presentation of the financial
statements that give a true and fair view and are free
from material misstatement, whether due to fraud or
error.
Auditors' Responsibility
3. Our responsibility is to express an opinion on these
standalone financial statements based on our audit.
4. We have taken into account the provisions of the Act
and the Rules made thereunder including the
accounting standards and matters which are
required to be included in the audit report.
5. We conducted our audit in accordance with the
Standards on Auditing specified under Section
143(10) of the Act and other applicable authoritative
pronouncements issued by the Institute of
Chartered Accountants of India. Those Standards
and pronouncements require that we comply with
ethical requirements and plan and perform the audit
to obtain reasonable assurance about whether the
financial statements are free from material
misstatement.
6. An audit involves performing procedures to obtain
audit evidence about the amounts and the
disclosures in the financial statements. The
procedures selected depend on the auditors'
judgment, including the assessment of the risks of
material misstatement of the financial statements,
whether due to fraud or error. In making those risk
assessments, the auditor considers internal
financial control relevant to the Company's
preparation of the financial statements that give a
true and fair view, in order to design audit
p rocedures tha t a re approp r ia te i n the
circumstances. An audit also includes evaluating
the appropriateness of the accounting policies used
and the reasonableness of the accounting
estimates made by the Company's Directors, as
well as evaluating the overall presentation of the
financial statements.
7. We believe that the audit evidence we have
obtained is sufficient and appropriate to provide a
basis for our audit opinion on the standalone
financial statements.
Opinion
8. In our opinion and to the best of our information and
according to the explanations given to us, the
aforesaid standalone financial statements give the
information required by the Act in the manner so
required and give a true and fair view in conformity
with the accounting principles generally accepted in
India, of the state of affairs of the Company as at
March 31, 2016, and its profit and its cash flows for
the year ended on that date.
Independent Auditors' Report

Zensar Technologies Ltd | 82
Report on Other Legal and Regulatory Requirements
9. As required by 'the Companies (Auditor's Report)
Order, 2016', issued by the Central Government of
India in terms of sub-section (11) of section 143 of
the Act (hereinafter referred to as the “Order”), and
on the basis of such checks of the books and
records of the Company as we considered
appropriate and according to the information and
explanations given to us, we give in the Annexure B
a statement on the matters specified in paragraphs
3 and 4 of the Order.
10. As required by Section 143 (3) of the Act, we report
that:
(a) We have sought and obtained all the information
and explanations which to the best of our
knowledge and belief were necessary for the
purposes of our audit.
(b) In our opinion, proper books of account as
required by law have been kept by the Company
so far as it appears from our examination of
those books.
(c) The Balance Sheet, the Statement of Profit and
Loss, and the Cash Flow Statement dealt with by
this Report are in agreement with the books of
account.
(d) In our opinion, the aforesaid standalone financial
statements comply with the Accounting
Standards specified under Section 133 of the
Act, read with Rule 7 of the Companies
(Accounts) Rules, 2014 and Accounting
Standard 30, Financial Instruments: Recognition
and Measurement issued by the Institute of
Chartered Accountants of India to the extent it
does not contradict any other accounting
standard referred to in Section 133 of the Act
read with Rule 7 of the Companies (Accounts)
Rules, 2014.
(e) On the basis of the written representations
received from the directors as on March 31, 2016
taken on record by the Board of Directors, none
of the directors is disqualified as on March 31,
2016 from being appointed as a director in terms
of Section 164 (2) of the Act.
(f) With respect to the adequacy of the internal
financial controls over financial reporting of the
Company and the operating effectiveness of
such controls, refer to our separate Report in
Annexure A.
(g) With respect to the other matters to be included
in the Auditors' Report in accordance with Rule
11 of the Companies (Audit and Auditors) Rules,
2014, in our opinion and to the best of our
knowledge and belief and according to the
information and explanations given to us:
i. The Company has disclosed the impact, if
any, of pending litigations as at March 31,
2016 on its financial position in its standalone
financial statements – Refer Note 33;
ii. The Company has long-term contracts
including derivative contracts as at March 31,
2016 for which there were no material
foreseeable losses.
iii. There has been no delay in transferring
amounts, required to be transferred, to the
Investor Education and Protection Fund by
the Company during the year ended March
31, 2016
For Price Waterhouse
Firm Registration Number: 301112E
Chartered Accountants
Amit Borkar
Place: Pune Partner
Date: April 22, 2016 Membership No. 109846
Independent Auditors' Report (Contd.)
83 | Annual Report 2015-16
Annexure A to Independent Auditors' Report
Report on the Internal Financial Controls
under Clause (i) of Sub-section 3 of
Section 143 of the Act
1. We have audited the internal financial controls
over financial reporting of Zensar Technologies
Limited (“the Company”) as of March 31, 2016 in
conjunction with our audit of the standalone
financial statements of the Company for the year
ended on that date.
Management's Responsibility for Internal
Financial Controls
2. The Company's management is responsible for
establishing and maintaining internal financial
controls based on the internal control over financial
reporting criteria established by the Company
considering the essential components of internal
control stated in the Guidance Note on Audit of
Internal Financial Controls Over Financial
Reporting issued by the Institute of Chartered
Accountants of India (ICAI). These responsibilities
include the design, implementat ion and
maintenance of adequate internal financial
controls that were operating effectively for
ensuring the orderly and efficient conduct of its
business, including adherence to company's
policies, the safeguarding of its assets, the
prevention and detection of frauds and errors, the
accuracy and completeness of the accounting
records, and the timely preparation of reliable
financial information, as required under the Act.
Auditors' Responsibility
3. Our responsibility is to express an opinion on the
Company's internal financial controls over
financial reporting based on our audit. We
conducted our audit in accordance with the
Guidance Note on Audit of Internal Financial
Controls Over Financial Reporting (the “Guidance
Note”) and the Standards on Auditing deemed to
be prescribed under section 143(10) of the Act to
the extent applicable to an audit of internal
financial controls, both applicable to an audit of
internal financial controls and both issued by the
ICAI. Those Standards and the Guidance Note
require that we comply with ethical requirements
and plan and perform the audit to obtain
reasonable assurance about whether adequate
internal financial controls over financial reporting
was established and maintained and if such
controls operated effectively in all material
respects.
4. Our audit involves performing procedures to obtain
audit evidence about the adequacy of the internal
financial controls system over financial reporting
and their operating effectiveness. Our audit of
internal financial controls over financial reporting
included obtaining an understanding of internal
financial controls over financial reporting,
assessing the risk that a material weakness exists,
and testing and evaluating the design and
operating effectiveness of internal control based
on the assessed risk. The procedures selected
depend on the auditor's judgement, including the
assessment of the risks of material misstatement
of the financial statements, whether due to fraud or
error.
5. We believe that the audit evidence we have
obtained is sufficient and appropriate to provide a
basis for our audit opinion on the Company's
internal financial controls system over financial
reporting.
Meaning of Internal Financial Controls
Over Financial Reporting
6. A company's internal financial control over
financial reporting is a process designed to provide
reasonable assurance regarding the reliability of
financial reporting and the preparation of financial
statements for external purposes in accordance
with generally accepted accounting principles. A
company's internal financial control over financial
reporting includes those policies and procedures
that (1) pertain to the maintenance of records that,
in reasonable detail, accurately and fairly reflect
the transactions and dispositions of the assets of
the company; (2) provide reasonable assurance
that transactions are recorded as necessary to
permit preparation of financial statements in
accordance with generally accepted accounting
principles, and that receipts and expenditures of
the company are being made only in accordance
with authorisations of management and directors
of the company; and (3) provide reasonable
assurance regarding prevention or timely
detection of unauthorised acquisition, use, or
Referred to in paragraph 10(f) of the Independent Auditors' Report of even date to the members of Zensar Technologies Limited on the standalone financial statements for the year ended 31st March, 2016.
Zensar Technologies Ltd | 84
disposition of the company's assets that could
have a material effect on the financial statements.
Inherent Limitations of Internal Financial
Controls Over Financial Reporting
7. Because of the inherent limitations of internal
financial controls over financial reporting, including
the possib i l i ty of co l lus ion or improper
management override of controls, material
misstatements due to error or fraud may occur and
not be detected. Also, projections of any
evaluation of the internal financial controls over
financial reporting to future periods are subject to
the risk that the internal financial control over
financial reporting may become inadequate
because of changes in conditions, or that the
degree of compliance with the policies or
procedures may deteriorate.
Opinion
8. In our opinion, the Company has, in all material
respects, an adequate internal financial controls
system over financial reporting and such internal
financial controls over financial reporting were
operating effectively as at March 31, 2016, based
on the internal control over financial reporting
criteria established by the Company considering
the essential components of internal control stated
in the Guidance Note on Audit of Internal Financial
Controls Over Financial Reporting issued by the
Institute of Chartered Accountants of India.
For Price Waterhouse
Firm Registration Number: 301112E
Chartered Accountants
Amit Borkar
Place: Pune Partner
Date: April 22, 2016 Membership No. 109846
Annexure A to Independent Auditors' ReportReferred to in paragraph 10(f) of the Independent Auditors' Report of even date to the members of Zensar Technologies Limited on the standalone financial statements for the year ended 31st March, 2016.
85 | Annual Report 2015-16
Annexure B to Independent Auditors' Report
Referred to in paragraph 9 of the Independent Auditors' Report of even date to the members of Zensar Technologies Limited on the standalone financial statements as of and for the year ended March 31, 2016.
i. (a) The Company is maintaining proper records
showing full particulars, including quantitative
details and situation, of fixed assets.
(b) The fixed assets are physically verified by the
Management according to a phased
programme designed to cover all the items
over a period of two years which, in our
opinion, is reasonable having regard to the
size of the Company and the nature of its
assets. Pursuant to the programme, a portion
of the fixed assets has been physically verified
by the Management during the year and no
material discrepancies have been noticed on
such verification.
(c) The title deeds of immovable properties, as
disclosed in Note 11 on fixed assets to the
financial statements, are held in the name of
the Company.
ii. The Company is in the business of rendering
services, and consequently, does not hold any
inventory. Therefore, the provisions of Clause 3(ii)
of the said Order are not applicable to the
Company.
iii. The Company has granted unsecured loans, to
two companies covered in the register maintained
under Section 189 of the Act. The Company has
not granted any secured/ unsecured loans to firms
or other parties covered in the register maintained
under Section 189 of the Act.
(a) In respect of the aforesaid loans, the terms
and conditions under which such loans were
granted .are not prejudicial to the Company's
interest.
(b) The Company has fully provided for the
aforesaid loans in the books of account.
(c) Except for INR 1,317.42 lakhs in respect of a
liquidated subsidiary, which has been fully
provided for, there is no amount which is
overdue for more than ninety days.
iv. In our opinion, and according to the information
and explanations given to us, the Company has
complied with the provisions of Section 185 and
186 of the Companies Act, 2013 in respect of the
guarantees provided by it.
v. The Company has not accepted any deposits from
the public within the meaning of Sections 73, 74,
75 and 76 of the Act and the Rules framed there
under to the extent notified.
vi. The Central Government of India has not specified
the maintenance of cost records under sub-section
(1) of Section 148 of the Act for any of the products
of the Company.
vii. (a) According to the information and explanations
given to us and the records of the Company
examined by us, in our opinion, the Company
is regular in depositing the undisputed
statutory dues, including provident fund,
employees' state insurance, income tax, sales
tax, service tax, duty of customs, duty of
excise, value added tax, cess and other
material statutory dues, as applicable, with
the appropriate authorities.
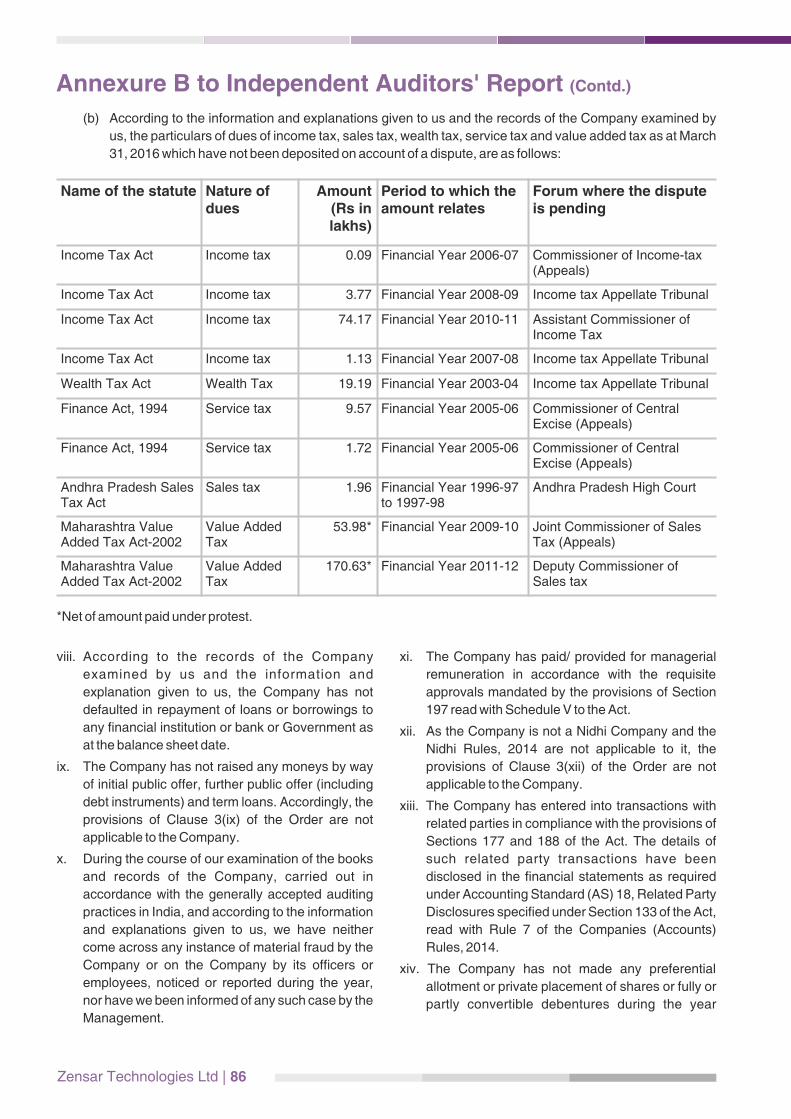
Zensar Technologies Ltd | 86
Name of the statute Nature of dues
Amount(Rs in lakhs)
Period to which the amount relates
Forum where the dispute is pending
Income Tax Act Income tax 0.09 Financial Year 2006-07 Commissioner of Income-tax (Appeals)
Income Tax Act Income tax 3.77 Financial Year 2008-09 Income tax Appellate Tribunal
Income Tax Act Income tax 74.17 Financial Year 2010-11 Assistant Commissioner of Income Tax
Income Tax Act Income tax 1.13 Financial Year 2007-08 Income tax Appellate Tribunal
Wealth Tax Act Wealth Tax 19.19 Financial Year 2003-04 Income tax Appellate Tribunal
Finance Act, 1994 Service tax 9.57 Financial Year 2005-06 Commissioner of Central Excise (Appeals)
Finance Act, 1994 Service tax 1.72 Financial Year 2005-06 Commissioner of Central Excise (Appeals)
Andhra Pradesh Sales Tax Act
Sales tax 1.96 Financial Year 1996-97 to 1997-98
Andhra Pradesh High Court
Maharashtra Value Added Tax Act-2002
Value Added Tax
53.98* Financial Year 2009-10 Joint Commissioner of Sales Tax (Appeals)
Maharashtra Value Added Tax Act-2002
Value Added Tax
170.63* Financial Year 2011-12 Deputy Commissioner of Sales tax
(b) According to the information and explanations given to us and the records of the Company examined by
us, the particulars of dues of income tax, sales tax, wealth tax, service tax and value added tax as at March
31, 2016 which have not been deposited on account of a dispute, are as follows:
Annexure B to Independent Auditors' Report (Contd.)
*Net of amount paid under protest.
viii. According to the records of the Company
examined by us and the information and
explanation given to us, the Company has not
defaulted in repayment of loans or borrowings to
any financial institution or bank or Government as
at the balance sheet date.
ix. The Company has not raised any moneys by way
of initial public offer, further public offer (including
debt instruments) and term loans. Accordingly, the
provisions of Clause 3(ix) of the Order are not
applicable to the Company.
x. During the course of our examination of the books
and records of the Company, carried out in
accordance with the generally accepted auditing
practices in India, and according to the information
and explanations given to us, we have neither
come across any instance of material fraud by the
Company or on the Company by its officers or
employees, noticed or reported during the year,
nor have we been informed of any such case by the
Management.
xi. The Company has paid/ provided for managerial
remuneration in accordance with the requisite
approvals mandated by the provisions of Section
197 read with Schedule V to the Act.
xii. As the Company is not a Nidhi Company and the
Nidhi Rules, 2014 are not applicable to it, the
provisions of Clause 3(xii) of the Order are not
applicable to the Company.
xiii. The Company has entered into transactions with
related parties in compliance with the provisions of
Sections 177 and 188 of the Act. The details of
such related party transactions have been
disclosed in the financial statements as required
under Accounting Standard (AS) 18, Related Party
Disclosures specified under Section 133 of the Act,
read with Rule 7 of the Companies (Accounts)
Rules, 2014.
xiv. The Company has not made any preferential
allotment or private placement of shares or fully or
partly convertible debentures during the year
87 | Annual Report 2015-16
Annexure B to Independent Auditors' Report (Contd.)
under review. Accordingly, the provisions of
Clause 3(xiv) of the Order are not applicable to the
Company.
xv. The Company has not entered into any non cash
transactions with its directors or persons
connected with him. Accordingly, the provisions of
Clause 3(xv) of the Order are not applicable to the
Company.
xvi. The Company is not required to be registered
under Section 45-IA of the Reserve Bank of India
Act, 1934. Accordingly, the provisions of Clause
3(xvi) of the Order are not applicable to the
Company.
For Price Waterhouse
Firm Registration Number: 301112E
Chartered Accountants
Amit Borkar
Place: Pune Partner
Date: April 22, 2016 Membership No. 109846
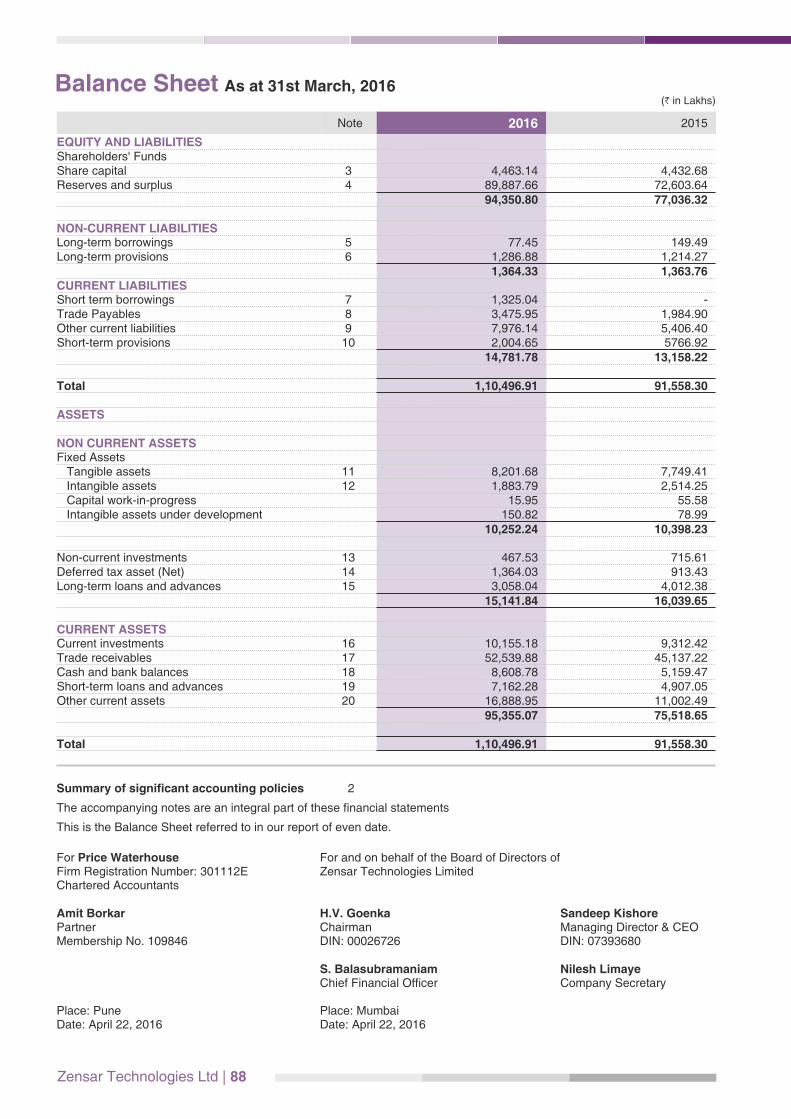
Zensar Technologies Ltd | 88
Note 2016 2015
EQUITY AND LIABILITIESShareholders' FundsShare capital 3 4,463.14 4,432.68Reserves and surplus 4 89,887.66 72,603.64
94,350.80 77,036.32
NON-CURRENT LIABILITIESLong-term borrowings 5 77.45 149.49Long-term provisions 6 1,286.88 1,214.27
1,364.33 1,363.76CURRENT LIABILITIESShort term borrowings 7 1,325.04 - Trade Payables 8 3,475.95 1,984.90Other current liabilities 9 7,976.14 5,406.40Short-term provisions 10 2,004.65 5766.92
14,781.78 13,158.22
Total 1,10,496.91 91,558.30
ASSETS
NON CURRENT ASSETSFixed Assets Tangible assets 11 8,201.68 7,749.41 Intangible assets 12 1,883.79 2,514.25 Capital work-in-progress 15.95 55.58 Intangible assets under development 150.82 78.99
10,252.24 10,398.23
Non-current investments 13 467.53 715.61Deferred tax asset (Net) 14 1,364.03 913.43Long-term loans and advances 15 3,058.04 4,012.38
15,141.84 16,039.65
CURRENT ASSETSCurrent investments 16 10,155.18 9,312.42Trade receivables 17 52,539.88 45,137.22Cash and bank balances 18 8,608.78 5,159.47Short-term loans and advances 19 7,162.28 4,907.05Other current assets 20 16,888.95 11,002.49
95,355.07 75,518.65
Total 1,10,496.91 91,558.30
Balance Sheet As at 31st March, 2016(H in Lakhs)
Summary of significant accounting policies 2
The accompanying notes are an integral part of these financial statements
This is the Balance Sheet referred to in our report of even date.
For Price Waterhouse For and on behalf of the Board of Directors of Firm Registration Number: 301112E Zensar Technologies Limited Chartered Accountants Amit Borkar H.V. Goenka Sandeep KishorePartner Chairman Managing Director & CEOMembership No. 109846 DIN: 00026726 DIN: 07393680 S. Balasubramaniam Nilesh Limaye Chief Financial Officer Company Secretary
Place: Pune Place: MumbaiDate: April 22, 2016 Date: April 22, 2016
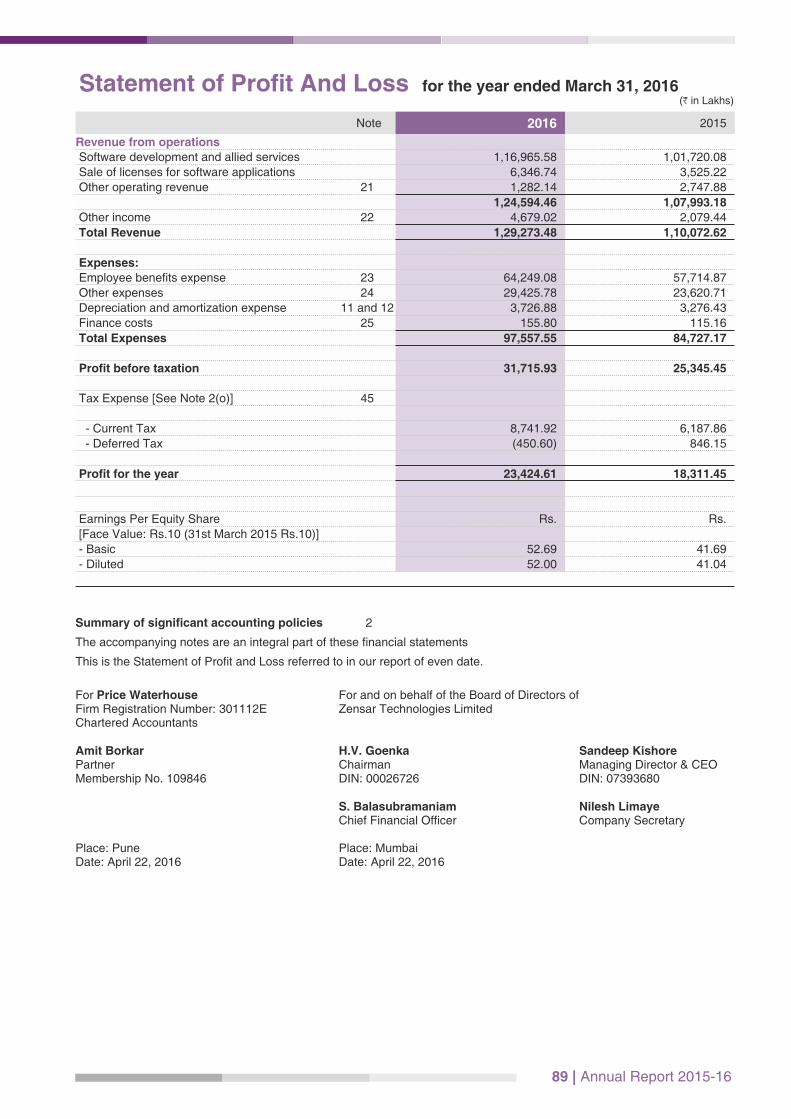
89 | Annual Report 2015-16
Note 2016 2015
Revenue from operations Software development and allied services 1,16,965.58 1,01,720.08
Sale of licenses for software applications 6,346.74 3,525.22
Other operating revenue 21 1,282.14 2,747.88
1,24,594.46 1,07,993.18 Other income 22 4,679.02 2,079.44
Total Revenue 1,29,273.48 1,10,072.62
Expenses: Employee benefits expense 23 64,249.08 57,714.87
Other expenses 24 29,425.78 23,620.71
Depreciation and amortization expense 11 and 12 3,726.88 3,276.43
Finance costs 25 155.80 115.16
Total Expenses 97,557.55 84,727.17
Profit before taxation 31,715.93 25,345.45
Tax Expense [See Note 2(o)] 45
- Current Tax 8,741.92 6,187.86
- Deferred Tax (450.60) 846.15
Profit for the year 23,424.61 18,311.45
Earnings Per Equity Share Rs. Rs.
[Face Value: Rs.10 (31st March 2015 Rs.10)]
- Basic 52.69 41.69
- Diluted 52.00 41.04
Summary of significant accounting policies 2
The accompanying notes are an integral part of these financial statements
This is the Statement of Profit and Loss referred to in our report of even date.
Statement of Profit And Loss for the year ended March 31, 2016(H in Lakhs)
For Price Waterhouse For and on behalf of the Board of Directors of Firm Registration Number: 301112E Zensar Technologies Limited Chartered Accountants Amit Borkar H.V. Goenka Sandeep KishorePartner Chairman Managing Director & CEOMembership No. 109846 DIN: 00026726 DIN: 07393680 S. Balasubramaniam Nilesh Limaye Chief Financial Officer Company Secretary
Place: Pune Place: MumbaiDate: April 22, 2016 Date: April 22, 2016
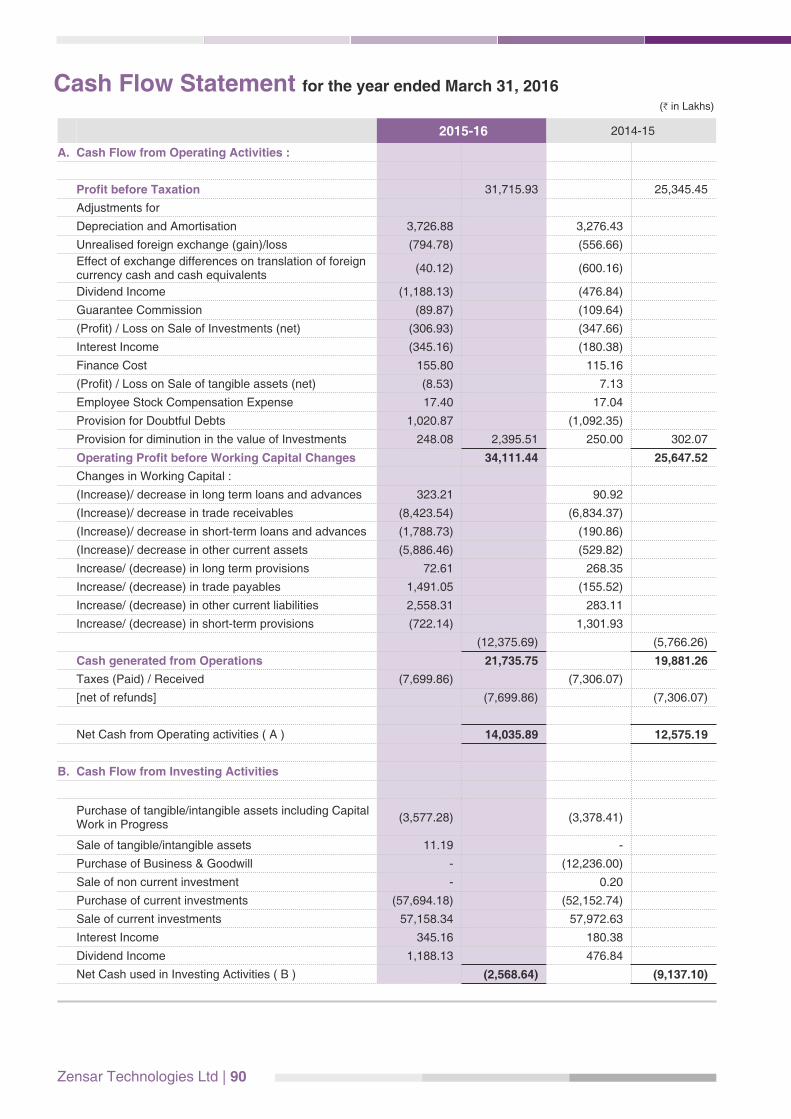
Zensar Technologies Ltd | 90
Cash Flow Statement for the year ended March 31, 2016
2015-16 2014-15
A. Cash Flow from Operating Activities :
Profit before Taxation 31,715.93 25,345.45
Adjustments for
Depreciation and Amortisation 3,726.88 3,276.43
Unrealised foreign exchange (gain)/loss (794.78) (556.66)
Effect of exchange differences on translation of foreign currency cash and cash equivalents
(40.12) (600.16)
Dividend Income (1,188.13) (476.84)
Guarantee Commission (89.87) (109.64)
(Profit) / Loss on Sale of Investments (net) (306.93) (347.66)
Interest Income (345.16) (180.38)
Finance Cost 155.80 115.16
(Profit) / Loss on Sale of tangible assets (net) (8.53) 7.13
Employee Stock Compensation Expense 17.40 17.04
Provision for Doubtful Debts 1,020.87 (1,092.35)
Provision for diminution in the value of Investments 248.08 2,395.51 250.00 302.07
Operating Profit before Working Capital Changes 34,111.44 25,647.52
Changes in Working Capital :
(Increase)/ decrease in long term loans and advances 323.21 90.92
(Increase)/ decrease in trade receivables (8,423.54) (6,834.37)
(Increase)/ decrease in short-term loans and advances (1,788.73) (190.86)
(Increase)/ decrease in other current assets (5,886.46) (529.82)
Increase/ (decrease) in long term provisions 72.61 268.35
Increase/ (decrease) in trade payables 1,491.05 (155.52)
Increase/ (decrease) in other current liabilities 2,558.31 283.11
Increase/ (decrease) in short-term provisions (722.14) 1,301.93
(12,375.69) (5,766.26)
Cash generated from Operations 21,735.75 19,881.26
Taxes (Paid) / Received (7,699.86) (7,306.07)
[net of refunds] (7,699.86) (7,306.07)
Net Cash from Operating activities ( A ) 14,035.89 12,575.19
B. Cash Flow from Investing Activities
Purchase of tangible/intangible assets including CapitalWork in Progress
(3,577.28) (3,378.41)
Sale of tangible/intangible assets 11.19 -
Purchase of Business & Goodwill - (12,236.00)
Sale of non current investment - 0.20
Purchase of current investments (57,694.18) (52,152.74)
Sale of current investments 57,158.34 57,972.63
Interest Income 345.16 180.38
Dividend Income 1,188.13 476.84
Net Cash used in Investing Activities ( B ) (2,568.64) (9,137.10)
(H in Lakhs)

91 | Annual Report 2015-16
2015-16 2014-15
C. Cash Flow from Financing Activities
Proceeds from share allotment under Employee Stock Option Schemes
30.46 55.93
Securities Premium 404.02 561.63
Interest paid (155.80) (115.16)
Proceeds / (Repayment) of short-term borrowings 1,325.04 -
Proceeds / (Repayment) of finance lease liability (142.79) (150.87)
Guarantee Commission 89.87 109.64
Dividend on Equity Shares and Tax Thereon (9,692.48) (5,441.25)
Net Cash used in Financing Activities ( C ) (8,141.68) (4,980.08)
Effect of exchange differences on translation of foreign currency cash and cash equivalents
40.12 600.16
D. Net Increase/(Decrease) in Cash and
Cash Equivalents (A+B+C) 3,365.69 (941.84)
Cash and cash Equivalents taken over in Business Acquisition
- 413.69
3,365.69 (528.15)
Opening Balance of Cash & Cash Equivalents 5,034.72 5,562.87
Closing Balance of Cash & Cash Equivalents 8,400.41 5,034.72
Cash Flow Statement for the year ended March 31, 2016
Notes :
1 The above Cash Flow Statement has been prepared under the "Indirect Method" set out in Accounting Standard 3 on Cash
Flow Statements.
2 Prior year comparatives have been reclassified to conform with current year's presentation, where applicable.
3 Cash and cash equivalents comprise of:
2015-16 2014-15 2013-14 Cash on Hand 4.59 3.84 3.13
Balances with Banks 8,395.82 5,030.88 5,559.74
Total 8,400.41 5,034.72 5,562.87
(H in Lakhs)
(H in Lakhs)
The accompanying notes are an integral part of these financial statements This is the Cash Flow Statement referred to in our report of even date.
For Price Waterhouse For and on behalf of the Board of Directors of Firm Registration Number: 301112E Zensar Technologies Limited Chartered Accountants Amit Borkar H.V. Goenka Sandeep KishorePartner Chairman Managing Director & CEOMembership No. 109846 DIN: 00026726 DIN: 07393680 S. Balasubramaniam Nilesh Limaye Chief Financial Officer Company Secretary
Place: Pune Place: MumbaiDate: April 22, 2016 Date: April 22, 2016
Zensar Technologies Ltd | 92
Notes to the Financial Statements as at and for the year ended March 31, 2016
1. General Information
Zensar Technologies Limited (the "Company")
along with its wholly owned and controlled
subsidiaries Zensar Technologies Inc., Zensar
Technologies (UK) Limited, Zensar Technologies
(Singapore) Pte. Limited, Zensar Technologies
(Shanghai) Company Limited, PSI Holding Group
Inc., Zensar Technologies IM Inc., Zensar
Technologies IM B.V., Aquila Technology Corp.,
Zensar (Africa) Holdings Pty Limited and Zensar
(South Africa) Pty Limited and Professional Access
Limited (effective from August 14, 2014) is engaged
in providing a complete range of IT Services and
Solutions. The Company's industry expertise spans
across Manufacturing, Retail, Media, Banking,
Insurance, Healthcare and Utilities. The Company
is public limited company and is listed on the
Bombay Stock Exchange (BSE) and the National
Stock Exchange (NSE).
2. Summary of significant accounting
policies
a. Basis of preparation
These Financial Statements of the Company
have been prepared in accordance with the
generally accepted accounting principles in
India under historical cost convention on accrual
basis. Pursuant to section 133 of the Companies
Act, 2013 read with Rule 7 of the Companies
(Accounts) Rules, 2014, till the standards of
accounting or any addendum thereto are
prescr ibed by Centra l Government in
consultation and recommendation of the
National Financial Reporting Authority, the
existing Accounting Standards notified under the
Companies Act, 1956 shall continue to apply.
Consequently, these financial statements have
been prepared to comply in all material aspects
with the accounting standards notified under
Section 211(3C) [Companies (Accounting
Standards) Rules, 2006, as amended] and other
relevant provisions of the Companies Act, 2013.
The Ministry of Corporate Affairs( MCA) has
notified the Companies (Accounting Standards)
Amendment Rules, 2016 vide its notification
dated 30 March 2016. The said notification read
with Rule 3(2) of the Companies (Accounting
Standards) Rules, 2006 is applicable to
accounting period commencing on or after the
date of notification i.e. 1 April 2016 and has
therefore not been considered for year ended
March 31, 2016.
All assets and liabilities have been classified as
current or non-current as per the Company's
operating cycle and other criteria set out in the
Schedule III to the Companies Act, 2013. Based
on the nature of products and services and their
realisation in cash and cash equivalents, the
Company has ascertained its operating cycles
as 12 months for the purpose of current -non
current classification of assets and liabilities.
b. Use of estimates
The preparation of financial statements in
conformity with Indian GAAP, requires
Managemen t to make es t ima tes and
assumptions that affect the reported amounts of
assets and liabilit ies, the disclosure of
contingent liabilities on the date of the financial
statements and the reported amounts of
revenues and expenses during the period.
Actual results could differ from these estimates.
Any revision to accounting estimates is
recognised prospectively in the current and
future periods.
c. Revenue Recognition
Revenue f rom sof tware main tenance,
development and allied services comprises of
revenues earned from time and material and
fixed price contracts. Revenue from time and
material contracts is recognised as the related
services are performed. Revenue from fixed
price contracts are recognised using the
proport ionate complet ion method. The
cumulative impact of any revision in estimates of
the stage of completion is reflected in the period
in which the change becomes known. Provisions
for estimated losses on such engagements are
made during the period in which such losses
become probable and can be reasonably
estimated. Amounts included in the financial
statements, which relate to recoverable costs
and accrued profits not yet billed on contracts,
are included in other current assets as Accrued
Income (Unbilled Services). Bil l ings on
incomplete contracts in excess of accrued costs
and accrued profits are included in other current
liabilities as Deferred Revenue. Revenue from
the sale of user l icenses for software
applications is recognised on transfer of title in
the user license.
d. Other Income
(i) Profit on sale of investments is recorded on
transfer of title from the Company and is
determined as the difference between the
93 | Annual Report 2015-16
Notes to the Financial Statements as at and for the year ended March 31, 2016 (Contd.)
sale price and the then carrying amount of the
investment.
(ii) Dividend income is recognised when the
Company’s right to receive dividend is
established.
(iii) Interest income on t ime deposits is
recognised using the time proportion basis
taking into account the amount outstanding
and applicable interest rates.
e. Leases
Finance Lease
As a lessee:
Asse ts acqu i red under finance lease
agreements are capitalised at the inception of
lease, at lower of the fair value and present value
of minimum lease payments, and a liability is
created for an equivalent amount. Lease rentals
are allocated between the liability and the
Finance cost, so as to obtain a uniform periodic
rate of interest on the outstanding liability for
each period. The outstanding liability is included
in borrowings. The Finance cost is charged to
the Statement of Profit and Loss over the lease
period.
Operating Lease
As a lessee:
Lease arrangements under which all risks and
rewards of ownership are effectively retained by
the lessor are classified as operating lease.
Payments made under operating leases are
charged to the Statement of Profit and Loss on
straight line basis over the period of lease.
f. Tangible Assets
Tangible assets are stated at acquisition cost
less accumulated depreciation. Cost of tangible
assets comprises purchase price, duties, levies
and any directly attributable costs of bringing the
asset to its working condition for the intended
use, net of refundable taxes.
Subsequent expenditures related to an item of
fixed asset are added to its book value only if
they increase the future benefits from the
existing asset beyond its previously assessed
standard of performance.
Items of fixed assets that have been retired from
active use and are held for disposal are stated at
the lower of their net book value and net
realisable value and are shown separately in the
financial statements. Any expected loss is
recognised immediately in the Statement of
Profit and Loss.
Losses arising from the retirement of, and gains
or losses arising from disposal of fixed assets
which are carried at cost are recognised in the
Statement of Profit and Loss.
g. Intangible Assets
Intangib le assets are recorded at the
consideration paid for acquisition. Internally
generated intangible asset arising from
development activity is recognised at cost on
demonstration of its technical feasibility, the
intention and ability of the Company to complete,
use or sell it, only if, it is probable that the asset
would generate future economic benefit and the
expenditure attributable to the said assets during
its development can be measured reliably.
Intangible assets are carried at cost less
accumulated amortization.
Goodwill arising on acquisition of business is
presented as an intangible asset. Goodwill
comprises the excess of purchase consideration
over the carrying value of the net assets of the
acquired business.
h. Depreciation and Amortisation
Depreciation on fixed assets is computed on a
straight-line method as per the useful lives
prescribed under Schedule II of the Companies
Act, 2013 except in respect of the following
assets (based on technical evaluation):
Class of AssetUseful life as prescribed in Schedule II
Useful life as followed
by the Company
Server and Networking Equipment 6 years 4 years
ii. Intangible Assets
Intangible assets are amortised on straight
line basis over their estimated useful lives:
Class of Asset Useful Life
Intangible Assets – Software 1-5 years
Goodwill 5 years
Technical Know-how (Internally generated) 3 years
i. Impairment
The assessment is done at each Balance Sheet
date as to whether there is any indication that an
asset (tangible and intangible) may be impaired.
For the purpose of assessing impairment, the
smallest identifiable group of assets that
generates cash inflows from continuing use that
Zensar Technologies Ltd | 94
Notes to the Financial Statements as at and for the year ended March 31, 2016 (Contd.)
are largely independent of the cash inflows from
other assets or groups of assets, is considered
as a cash generating unit. If any such indication
exists, an estimate of the recoverable amount of
the asset/cash generating unit is made. Assets
whose carrying value exceeds their recoverable
amount are written down to the recoverable
amount. Recoverable amount is higher of an
asset's or cash generating unit's net selling price
and its value in use. Value in use is the present
value of estimated future cash flows expected to
arise from the continuing use of an asset and
from its disposal at the end of its useful life.
j. Investments
Investments that are readily realisable and are
intended to be held for not more than one year
from the date, on which such investments are
made, are classified as current investments. All
other investments are classified as long term
investments. Current investments are carried at
cost or fair value, whichever is lower. Long-term
investments are carried at cost. However,
provision for diminution is made to recognise a
decline, other than temporary, in the value of the
investments, such reduction being determined
and made for each investment individually.
k. Employee Retirement Benefits
i. Provident Fund:
Provident Fund contributions are made to a
Trust administered by the Company. The
Company's liability is actuarially determined
(using the Projected Unit Credit method) at
the end of the year. Actuarial losses/ gains
are recognised in the Statement of Profit and
Loss in the year in which they arise.
The contributions made to the trust are
recognised as plan assets. The defined
benefit obligation recognised in the balance
sheet represents the present value of the
defined benefit obligation as reduced by the
fair value of plan assets.
ii. Gratuity:
The Company provides for gratuity, a defined
benefit plan (the “Gratuity Plan”) covering
eligible employees in accordance with the
Scheme. The Gratuity Plan provides a lump
sum payment to vested employees at
re t i rement death, incapaci ta t ion or
termination of employment, of an amount
based on the respective employee's salary
and the tenure of employment. The
Company's liability is actuarially determined
(using the Projected Unit Credit method) at
the end of each year. Actuarial losses/ gains
are recognised in the Statement of Profit and
Loss in the year in which they arise.The
retirement benefit obligation recognised in
the Balance Sheet represents the present
value of the defined benefit obligation as
adjusted for unrecognised past service cost,
and as reduced by the fair value of scheme
assets. Any asset resulting from this
calculation is limited to the present value of
available refunds and reductions in future
contributions to the scheme.
iii. Superannuation:
The Company has Defined Contribution
Plans for Post-employment benefits for
e l i g i b l e emp loyees i n t he fo rm o f
Superannuation Fund administered by the
Life Insurance Corporation of India.
The Company has Defined Contribution
Plans for Post-employment benefits for all
employees in the form of Family Pension
Fund administered by Regional Provident
Fund Commissioner.
These funds are classified as defined
contribution plans as the Company has no
further obligation beyond making the
contributions. The Company's contributions
to Defined Contribution Plans are charged to
the Statement of Profit and Loss as and
when incurred.
iv. Compensated Absences:
Accumulated compensated absences, which
are expected to be availed or encashed
within 12 months from the end of the year are
treated as short term employee benefits. The
obligation towards the same is measured at
the expected cost o f accumulat ing
compensated absences as the additional
amount expected to be paid as a result of the
unused entitlement as at the year end.
Accumulated compensated absences, which
are expected to be availed or encashed
beyond 12 months from the end of the year
are treated as other long term employee
benefits. The Company's l iabi l i ty is
actuarially determined (using the Projected
Unit Credit method) at the end of each year.
Actuarial losses/ gains are recognised in the
Statement of Profit and Loss in the year in
which they arise.
95 | Annual Report 2015-16
Notes to the Financial Statements as at and for the year ended March 31, 2016 (Contd.)
l. Foreign Currency Transactions
i) On initial recognition, all foreign currency
transactions are recorded by applying to the
foreign currency amount the exchange rate
between the reporting currency and the
foreign currency at the date of the
transaction.
ii) As at the reporting date, non-monetary items
which are carried in terms of historical cost
denominated in a foreign currency are
reported using the exchange rate at the date
of the transaction.
iii) Monetary assets and monetary liabilities
denominated in foreign currency at the year-
end are translated at the year-end exchange
rates, and the resulting exchange differences
are recognised in the Statement of Profit and
Loss, except for the exchange differences
arising on monetary items that, in substance,
form a part of the Company's net investment
in non-integral foreign operation, which are
accumulated in a Foreign Currency
Translation Reserve until the disposal of net
investment.
iv) Foreign operations are classified as either
'integral' or 'non-integral' operations.
Exchange differences arising on a monetary
items that, in substance, form part of an
enterprise's net investment in a non-integral
foreign operation are accumulated in the
Foreign Currency Translation Reserve until
the disposal of the net investment, at which
time they are recognised as income or as
expenses. The Financial statements of an
integral foreign operation are translated
using the principles and procedures as if the
translations of the foreign operation are
those of the Company itself.
m. Financial Instruments
The Company early adopted Accounting
Standard (AS) 30 “Financial Instruments:
Recognition and Measurement” issued by the
Institute of Chartered Accountants of India,
along with the consequent limited revisions to
other accounting standards, except so far as
they are in conflict with other mandatory
accounting standards and other regulatory
requirements
Derivative Financial Instruments
The Company uses foreign exchange forward
contracts to hedge its exposure to movements
in foreign exchange rates. The use of these
foreign exchange forward contracts reduces the
risk or cost to the Company and the Company
does not use the foreign exchange forward
contracts for trading or speculation purposes.
Forward contracts are fair valued at each
reporting date. Changes in the fair values of
forward contracts designated as cash flow
hedges are recognized directly in the Hedging
Reserve Account and reclassified into the
Statement of Profit and Loss upon the
occurrence of the hedged transaction. Changes
in fair value relating to the ineffective portion of
the hedges and derivatives not designated as
hedges are recognised in the Statement of Profit
and Loss as they arise.
Non-Derivative Financial Instruments
A financial instrument is any contract that gives
rise to a financial asset of one entity and a
financial liability or equity instrument of another
entity. Financial assets of the Company mainly
include cash and bank balances, trade
receivables, accrued income (unbilled services),
employee travel and other advances, other loans
and advances and der ivat ive financial
instruments with a positive fair value. Financial
liabilities of the Company mainly comprise trade
payables, accrued expenses, bank borrowings
and derivative financial instruments with a
negative fair value. Financial assets / liabilities
are recognized on the Balance Sheet when the
Company becomes a party to the contractual
provisions of the instrument.
The Company assesses at each Balance Sheet
date whether there is any objective evidence that
a financial asset or group of financial assets is
impaired. If any such indication exists, the
Company estimates the amount of impairment
loss as the difference between the assets
carrying amount and undiscounted amount of
future cash flows, which is recognised in the
Statement of Profit and Loss.
The Company measures the short–term
payables with no stated rate of interest at original
invoice amount, if the effect of discounting is
immaterial.
n. Employee Stock Option Schemes
Stock options granted to employees under
Employee Stock Option 2002 Scheme and
Employee Stock Option 2006 Scheme are
accounted as per the accounting treatment
prescribed by the Guidance Notes on Employee
Share-based Payments issued by Institute of
Zensar Technologies Ltd | 96
Notes to the Financial Statements as at and for the year ended March 31, 2016 (Contd.)
Chartered Accountants of India as required by
the SEBI (Share Based Employee Benefits)
Regulations, 2014. Accordingly, the intrinsic
value of the option being the excess of the
market value of the stock options as on the date
of the grant over the exercise price of the options
i s r ecogn i sed as de fe r red emp loyee
compensation and is charged to Statement of
Profit and Loss over the vesting period. In the
case of graded vesting, the vesting period is
determined separately for each portion of the
option. The unamortised portion of the cost is
shown under “Reserves and Surplus”.
o. Taxation
Current Tax
Current tax is measured at the amount expected
to be paid to the tax authorities in accordance
with the taxation laws prevailing in the respective
jurisdictions. Current tax assets and current tax
liabilities are offset when there is a legally
enforceable right to set off the recognised
amounts and there is an intention to settle the
asset and the liability on a net basis.
Deferred Tax
Deferred tax for timing differences between the
book profits and tax profits is accounted for using
the tax rates and laws that have been enacted or
substantively enacted as of the Balance Sheet
date. Deferred tax assets arising from the timing
differences are recognised to the extent there is
reasonable certainty that sufficient future taxable
income will be available against which such
deferred tax assets can be realised.
Deferred tax assets are recognised for tax loss
and depreciation carried forward to the extent
that the realisation of the related tax benefit
through the future taxable profits is virtually
certain and is supported by convincing evidence
that sufficient future taxable profits can be
realised. Deferred tax assets and deferred tax
liabilities are offset when there is a legally
enforceable right to set off assets against
liabilities representing current tax and where the
deferred tax assets and the deferred tax
liabilities relate to taxes on income levied by the
same governing taxation laws.
Minimum Alternative Tax (MAT)
Minimum Alternative Tax (MAT) credit is
recognized as an asset only when and to the
extent there is convincing evidence that the
Company will pay income tax higher than that
computed under MAT, during the period that
MAT is permitted to be set off under the Income
Tax Act, 1961 (specified period). In the year, in
which the MAT credit becomes eligible to be
recognized as an asset in accordance with the
recommendations contained in the guidance
note issued by the ICAI, the said asset is created
by way of a credit to the Statement of Profit and
Loss and shown as MAT credit entitlement. The
Company reviews the same at each Balance
Sheet date and writes down the carrying amount
of MAT credit entitlement to the extent there is no
longer convincing evidence to the effect that the
Company will pay income tax higher than MAT
during the specified period.
p. Provisions and contingent liabilities
Provisions are recognised when the Company
has a present obligation as a result of a past
event and, it is probable that an outflow of
resources will be required to settle the obligation
and a reliable estimate of the amount of the
obligation can be made. Provisions are
determined based on best estimate required to
settle the present obligation at the balance sheet
date. Provisions are reviewed at each Balance
Sheet date and adjusted to reflect current best
estimates. A disclosure for a contingent liability is
made where there is a possible obligation or a
present obligation that may, but probably will not,
require an outflow of resources.
q. Earnings per share
The basic earnings per share is computed by
dividing the net profit for the period attributable to
equity shareholders by the weighted average
number of equity shares outstanding during the
period. The number of shares used in computing
diluted earnings per share comprises the
weighted average shares considered for
deriving basic earnings per share and also the
weighted average number of equity shares
which would have been issued on the conversion
of all dilutive potential equity shares. Dilutive
potential equity shares are deemed converted as
of the beginning of the period unless they have
been issued at a later date.
r. Cash and Cash Equivalents
In the cash flow statement, cash and cash
equivalents includes cash in hand, demand
deposits with banks, other short-term highly
liquid investments with original maturities of
three months or less.
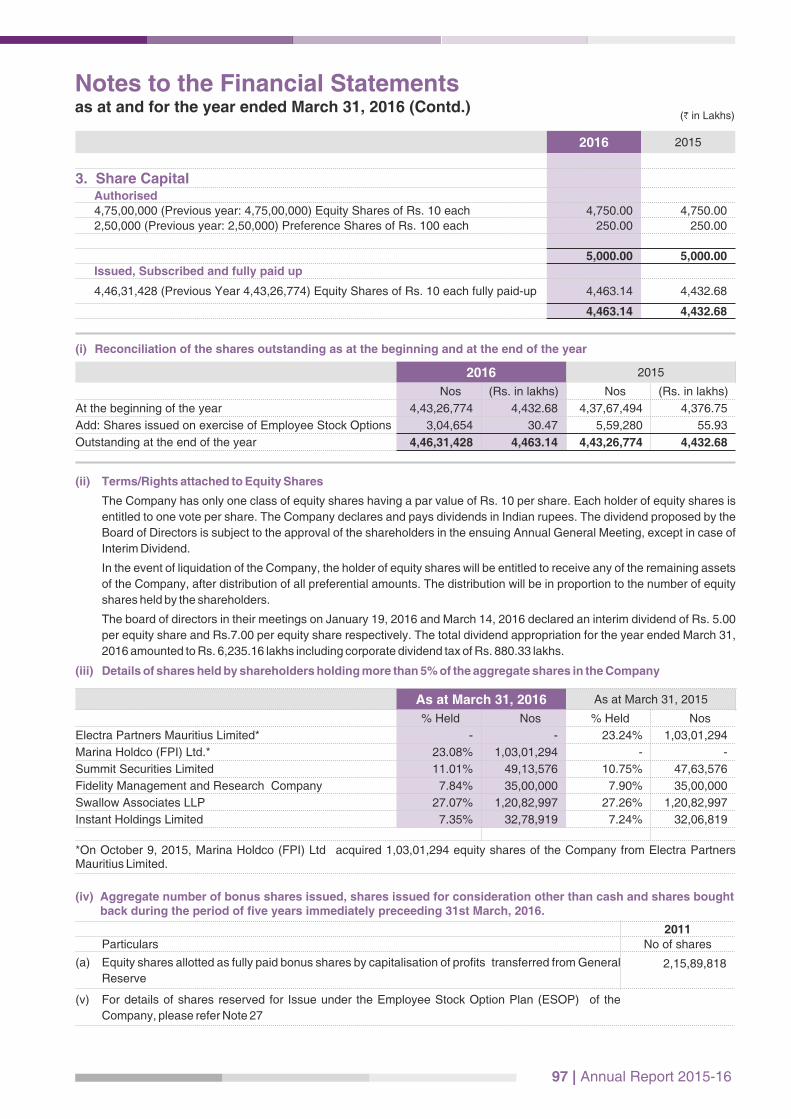
97 | Annual Report 2015-16
2016 2015
3. Share CapitalAuthorised 4,75,00,000 (Previous year: 4,75,00,000) Equity Shares of Rs. 10 each 4,750.00 4,750.00
2,50,000 (Previous year: 2,50,000) Preference Shares of Rs. 100 each 250.00 250.00
5,000.00 5,000.00
Issued, Subscribed and fully paid up
4,46,31,428 (Previous Year 4,43,26,774) Equity Shares of Rs. 10 each fully paid-up 4,463.14 4,432.68
4,463.14 4,432.68
(i) Reconciliation of the shares outstanding as at the beginning and at the end of the year
2016 2015
Nos (Rs. in lakhs) Nos (Rs. in lakhs)
At the beginning of the year 4,43,26,774 4,432.68 4,37,67,494 4,376.75
Add: Shares issued on exercise of Employee Stock Options 3,04,654 30.47 5,59,280 55.93
Outstanding at the end of the year 4,46,31,428 4,463.14 4,43,26,774 4,432.68
(ii) Terms/Rights attached to Equity Shares
The Company has only one class of equity shares having a par value of Rs. 10 per share. Each holder of equity shares is
entitled to one vote per share. The Company declares and pays dividends in Indian rupees. The dividend proposed by the
Board of Directors is subject to the approval of the shareholders in the ensuing Annual General Meeting, except in case of
Interim Dividend.
In the event of liquidation of the Company, the holder of equity shares will be entitled to receive any of the remaining assets
of the Company, after distribution of all preferential amounts. The distribution will be in proportion to the number of equity
shares held by the shareholders.
The board of directors in their meetings on January 19, 2016 and March 14, 2016 declared an interim dividend of Rs. 5.00
per equity share and Rs.7.00 per equity share respectively. The total dividend appropriation for the year ended March 31,
2016 amounted to Rs. 6,235.16 lakhs including corporate dividend tax of Rs. 880.33 lakhs.
(iii) Details of shares held by shareholders holding more than 5% of the aggregate shares in the Company
As at March 31, 2016 As at March 31, 2015
% Held Nos % Held Nos
Electra Partners Mauritius Limited* - - 23.24% 1,03,01,294
Marina Holdco (FPI) Ltd.* 23.08% 1,03,01,294 - -
Summit Securities Limited 11.01% 49,13,576 10.75% 47,63,576
Fidelity Management and Research Company 7.84% 35,00,000 7.90% 35,00,000
Swallow Associates LLP 27.07% 1,20,82,997 27.26% 1,20,82,997
Instant Holdings Limited 7.35% 32,78,919 7.24% 32,06,819
*On October 9, 2015, Marina Holdco (FPI) Ltd acquired 1,03,01,294 equity shares of the Company from Electra Partners Mauritius Limited.
(iv) Aggregate number of bonus shares issued, shares issued for consideration other than cash and shares bought back during the period of five years immediately preceeding 31st March, 2016.
2011 Particulars No of shares
(a) Equity shares allotted as fully paid bonus shares by capitalisation of profits transferred from General
Reserve2,15,89,818
(v) For details of shares reserved for Issue under the Employee Stock Option Plan (ESOP) of the
Company, please refer Note 27
Notes to the Financial Statements as at and for the year ended March 31, 2016 (Contd.)
(H in Lakhs)

Zensar Technologies Ltd | 98
Notes to the Financial Statements as at and for the year ended March 31, 2016 (Contd.)
2016 2015
4. Reserves and SurplusCapital Reserve
Balance at the beginning and end of the year 10.18 10.18
Capital Redemption Reserve
Balance at the beginning and end of the year 442.40 442.40
Securities Premium Account
Balance as at the beginning of the year 1,151.74 535.07
Add: Received during the year on exercise of stock options issued to employees 413.42 616.67
1,565.16 1,151.74
General Reserve
Balance as at the beginning of the year 60,598.05 50,598.05
Add: ESOP Cancellation during the year 9.64 -
Add : Transferred from Statement of Profit and Loss 14,000.00 10,000.00
74,607.69 60,598.05
Hedging Reserve
Balance as at the beginning of the year 367.82 316.29
Add : Movement during the year 465.50 51.53
833.32 367.82
Employee Stock Options
Options granted till date 106.17 162.11
Add: Compensation for options granted during the year 69.81 0.09
Less: Transfer to securities premium on exercise of stock options during the year 9.40 55.85
Less : Deferred Employee Compensation 135.31 75.69
Balance as at the end of the year 31.27 30.48
Foreign Currency Translation Reserve
Balance as at the beginning of the year (983.41) (426.75)
Foreign Currency Translation Reserve for the year (794.78) (556.66)
(1,778.19) (983.41)
Surplus in Statement of Profit and Loss
Balance as at the beginning of the year 10,986.38 8,505.84
Add: Profit for the year 23,424.61 18,311.45
Less: Transitional effect of change in the useful life of assets, as per the provisions of schedule II of the Companies Act 2013.
- 30.43
34,410.99 26,786.86
Less: Appropriations
Interim Dividend 5,354.83 1,978.51
Proposed Dividend - 2,881.24
Dividend distribution tax on Interim and Proposed dividend on Equity Shares 880.33 940.73
Transfer to General Reserve 14,000.00 10,000.00
20,235.16 15,800.48
Balance as at the end of the year 14,175.83 10,986.38
89,887.66 72,603.64
(H in Lakhs)

99 | Annual Report 2015-16
Notes to the Financial Statements as at and for the year ended March 31, 2016 (Contd.)
2016 2015
5. Long-term BorrowingsFinance Lease Obligation (Secured) [See Note 41 (B)] 77.45 149.49
77.45 149.49
6. Long-term provisionsProvision for Compensated Absences 1,195.71 1,123.52
Provision for Disputed statutory matters (See Note 29) 27.25 27.25
Other Obligations (See Note 29) 63.92 63.50
1,286.88 1,214.27
7. Short term borrowingsFrom Banks:
-Unsecured (Refer Note below) 1,325.04 -
1,325.04 -
Note:
i) The Company has availed export packing credit of $ 2 million for a tenor of 180 days.
ii) The Loan carries Interest rate of LIBOR + 30 basis points.
8. Trade PayablesDues to micro and small enterprises (See Note 39) - -
Dues to other than micro and small enterprises 3,475.95 1,984.90
3,475.95 1,984.90
9. Other Current liabilitiesCurrent maturities of finance lease obligation ( See Note 41 (B)) 120.34 191.09
Deferred Revenue 702.78 407.74
Unpaid Dividends 208.37 124.76
Employee benefits payable 3,810.18 2,837.54
Withholding and other taxes 686.43 384.65
Other Payables 2,448.04 1,460.62
7,976.14 5,406.40
10.Short-term provisionsTaxation less payments there against (net of advance tax of Rs. 7,825.82 lakhs, Previous year: Rs. 1,774.68 lakhs)
545.44 128.25
Proposed Dividend on Equity Shares - 2,881.24
Tax on proposed dividend - 576.08
Provision for Gratuity 554.82 1,394.45
Provision for Compensated Absences 904.39 786.90
2,004.65 5,766.92
(H in Lakhs)

Zensar Technologies Ltd | 100
Notes to the Financial Statements as at and for the year ended March 31, 2016 (Contd.)
Assets
GR
OS
S B
LO
CK
DE
PR
EC
IAT
ION
NE
T B
LO
CK
Co
st
as a
t31st
Marc
h
2015
Ad
dit
ion
sd
uri
ng
the y
ear
Dele
tio
ns
du
rin
g
the y
ear
Co
st
as a
t31st
Marc
h
2016
Accu
mu
late
d
Dep
recia
tio
nas a
t31st
Marc
h 2
015
Dep
recia
tio
n
du
rin
g
the y
ear
Dep
recia
tio
n
wri
tten
back
on
dele
tio
ns
Accu
mu
late
d
Dep
recia
tio
nas a
t31st
Marc
h 2
016
As a
t31st
Marc
h
2016
As a
t31st
Marc
h
2015
Tangib
le a
ssets
:
Land-
- Lease
hold
264.2
5 -
-
264.2
536.3
52.7
7 -
39.1
2225.1
3227.9
0
- F
reehold
0.4
9 -
-
0.4
9 -
-
-
-
0.4
90.4
9
Build
ings
5,3
69.1
024.2
7 -
5,3
93.3
71,4
57.3
1178.9
4 -
1,6
36.2
53,7
57.1
23,9
11.7
9
Impro
vem
ent to
Lea
sehold
P
rem
ises
959.5
633.4
6 -
993.0
2547.4
2163.3
4 -
710.7
6282.2
6412.1
4
Pla
nt and E
quip
me
nt
4,3
68.6
7336.4
631.1
14,6
74.0
23,9
57.9
8161.3
231.1
14,0
88.1
9585.8
3410.6
9
Furn
iture
and F
ixtu
res
2,8
83.4
2343.8
117.1
03,2
10.1
32,0
50.7
3188.3
217.1
02,2
21.9
5988.1
8832.6
9
Offic
e E
quip
ment
1,4
42.6
40.8
5 -
1,4
43.4
9979.4
6108.7
4 -
1,0
88.2
0355.2
9463.1
8
Moto
r V
ehic
les
343.3
639.9
16.3
2376.9
5191.5
263.9
34.1
4251.3
1125.6
4151.8
4
Data
Pro
cess
ing E
quip
ment-
Ow
n u
se6,0
08.6
31,4
34.7
3107.0
67,3
36.3
04,9
00.1
5778.6
2107.0
65,5
71.7
11,7
64.5
91,1
08.4
8
Data
Pro
cess
ing E
quip
ments
ta
ken o
n F
inance
Lease
989.3
1111.9
7300.7
7800.5
1759.1
0224.5
6300.3
0683.3
6117.1
5230.2
1
T O
T A
L22,6
29.4
32,3
25.4
6462.3
624,4
92.5
314,8
80.0
21,8
70.5
4459.7
116,2
90.8
58,2
01.6
87,7
49.4
1
Pre
vious
year
20,4
46.1
0*2
,24
9.0
765.6
922,6
29.4
313,1
49.8
1**
1,7
95.7
365.5
214,8
80.0
27,7
49.4
1 -
* In
cludes
Additi
ons
on A
cquis
ition o
f B
usi
ness
fro
m P
rofe
ssio
nal A
ccess
Softw
are
Deve
lopm
ent -
Rs.
304.5
1 la
khs
(Refe
r N
ote
46)
** Incl
udes
Rs.
30.4
3 la
khs
reco
gnis
ed in
openin
g b
ala
nce
of re
tain
ed e
arn
ings,
base
d o
n tra
nsi
tional p
rovi
sion r
efe
rred to in
Sch
edule
II to
the C
om
panie
s A
ct , 2
013.
12. In
tan
gib
le A
ssets
[S
ee N
ote
s 2
(h)
an
d 2
(i)]
Assets
GR
OS
S B
LO
CK
AM
OR
TIS
AT
ION
NE
T B
LO
CK
Co
st
as a
t31st
Marc
h
2015
Ad
dit
ion
sd
uri
ng
the y
ear
Dele
tio
ns
du
rin
gth
e y
ear
Co
st
as a
t31st
Marc
h
2016
Accu
mu
late
d
Am
ort
isati
on
as a
t31st
Marc
h 2
015
Am
ort
isati
on
d
uri
ng
the y
ear
Am
ort
isati
on
w
ritt
en
back
on
dele
tio
ns
Accu
mu
late
d
Am
ort
isati
on
as a
t31st
Marc
h 2
016
As a
t31st
Marc
h
2016
As a
t31st
Marc
h
2015
Inta
ng
ible
assets
:
Acq
uir
ed
Softw
are
5,7
05.9
41,2
25.8
8 -
6,9
31.8
24,8
92.5
41,4
06.1
9 -
6,2
98.7
3633.0
9813.4
0
Goodw
ill1,2
76.2
9 -
-
1,2
76.2
9158.5
9255.2
6 -
413.8
5862.4
41,1
17.7
0
Inte
rnally G
en
era
ted
Tech
nic
al K
now
-ho
w583.1
5 -
-
583.1
5 -
194.8
9 -
194.8
9388.2
6583.1
5
T O
T A
L7,5
65.3
81,2
25.8
8 -
8,7
91.2
65,0
51.1
31,8
56.3
4 -
6,9
07.4
71,8
83.7
92,5
14.2
5
Pre
vio
us y
ear
4,8
93.4
8*3
,02
9.5
8357.6
87,5
65.3
83,8
93.8
71,5
11.1
3353.8
75,0
51.1
32,5
14.2
5 -
11. T
an
gib
le A
ssets
[S
ee N
ote
s 2
(f),
2(g
), 2
(h)
an
d 2
(i)]
* In
cludes
Additi
ons
on A
cquis
ition o
f Busi
ness
from
Pro
fess
ional A
ccess
Soft
ware
Deve
lopm
ent -
Rs.
97.2
3 la
khs
(Refe
r N
ote
46
)
(H in
La
kh
s)
(H in
La
kh
s)
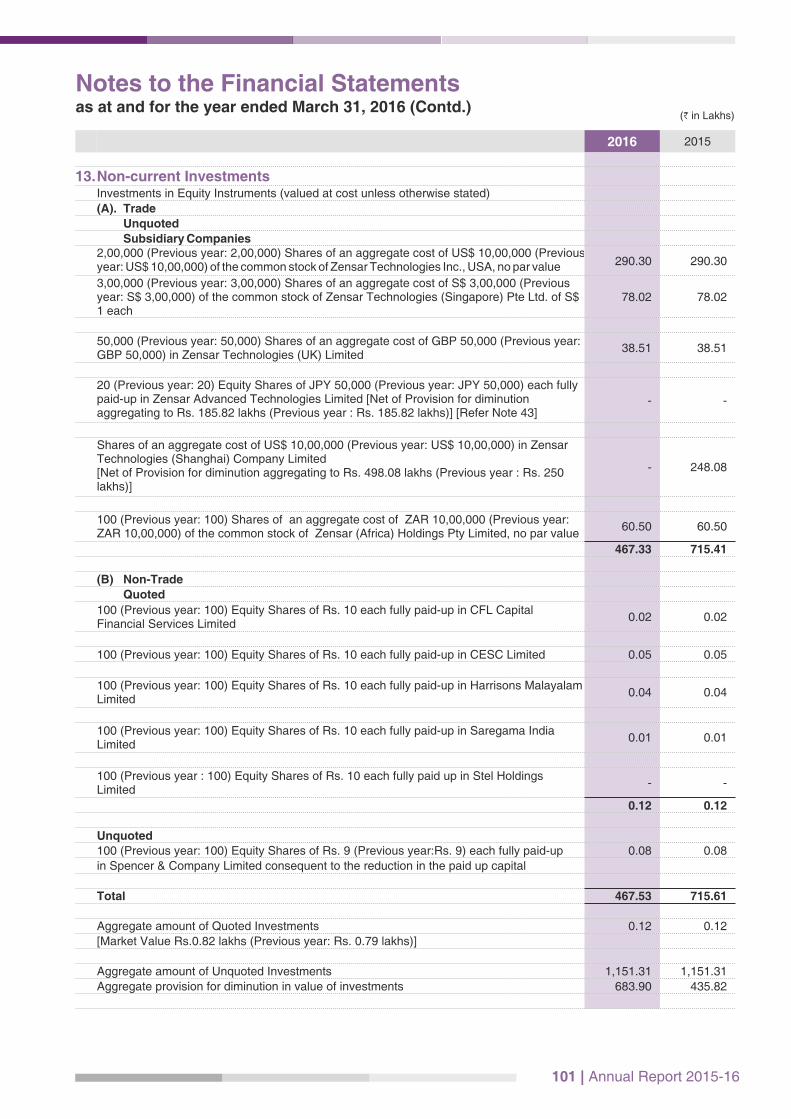
101 | Annual Report 2015-16
2016 2015
13.Non-current InvestmentsInvestments in Equity Instruments (valued at cost unless otherwise stated)
(A). Trade
Unquoted
Subsidiary Companies2,00,000 (Previous year: 2,00,000) Shares of an aggregate cost of US$ 10,00,000 (Previous year: US$ 10,00,000) of the common stock of Zensar Technologies Inc., USA, no par value 290.30 290.30
3,00,000 (Previous year: 3,00,000) Shares of an aggregate cost of S$ 3,00,000 (Previous year: S$ 3,00,000) of the common stock of Zensar Technologies (Singapore) Pte Ltd. of S$ 1 each
78.02 78.02
50,000 (Previous year: 50,000) Shares of an aggregate cost of GBP 50,000 (Previous year: GBP 50,000) in Zensar Technologies (UK) Limited
38.51 38.51
20 (Previous year: 20) Equity Shares of JPY 50,000 (Previous year: JPY 50,000) each fully paid-up in Zensar Advanced Technologies Limited [Net of Provision for diminution aggregating to Rs. 185.82 lakhs (Previous year : Rs. 185.82 lakhs)] [Refer Note 43]
- -
Shares of an aggregate cost of US$ 10,00,000 (Previous year: US$ 10,00,000) in Zensar Technologies (Shanghai) Company Limited[Net of Provision for diminution aggregating to Rs. 498.08 lakhs (Previous year : Rs. 250 lakhs)]
- 248.08
100 (Previous year: 100) Shares of an aggregate cost of ZAR 10,00,000 (Previous year: ZAR 10,00,000) of the common stock of Zensar (Africa) Holdings Pty Limited, no par value
60.50 60.50
467.33 715.41
(B) Non-Trade
Quoted
100 (Previous year: 100) Equity Shares of Rs. 10 each fully paid-up in CFL Capital Financial Services Limited
0.02 0.02
100 (Previous year: 100) Equity Shares of Rs. 10 each fully paid-up in CESC Limited 0.05 0.05
100 (Previous year: 100) Equity Shares of Rs. 10 each fully paid-up in Harrisons Malayalam Limited
0.04 0.04
100 (Previous year: 100) Equity Shares of Rs. 10 each fully paid-up in Saregama India Limited
0.01 0.01
100 (Previous year : 100) Equity Shares of Rs. 10 each fully paid up in Stel Holdings Limited
- -
0.12 0.12
Unquoted100 (Previous year: 100) Equity Shares of Rs. 9 (Previous year:Rs. 9) each fully paid-up 0.08 0.08
in Spencer & Company Limited consequent to the reduction in the paid up capital
Total 467.53 715.61
Aggregate amount of Quoted Investments 0.12 0.12
[Market Value Rs.0.82 lakhs (Previous year: Rs. 0.79 lakhs)]
Aggregate amount of Unquoted Investments 1,151.31 1,151.31
Aggregate provision for diminution in value of investments 683.90 435.82
Notes to the Financial Statements as at and for the year ended March 31, 2016 (Contd.)
(H in Lakhs)
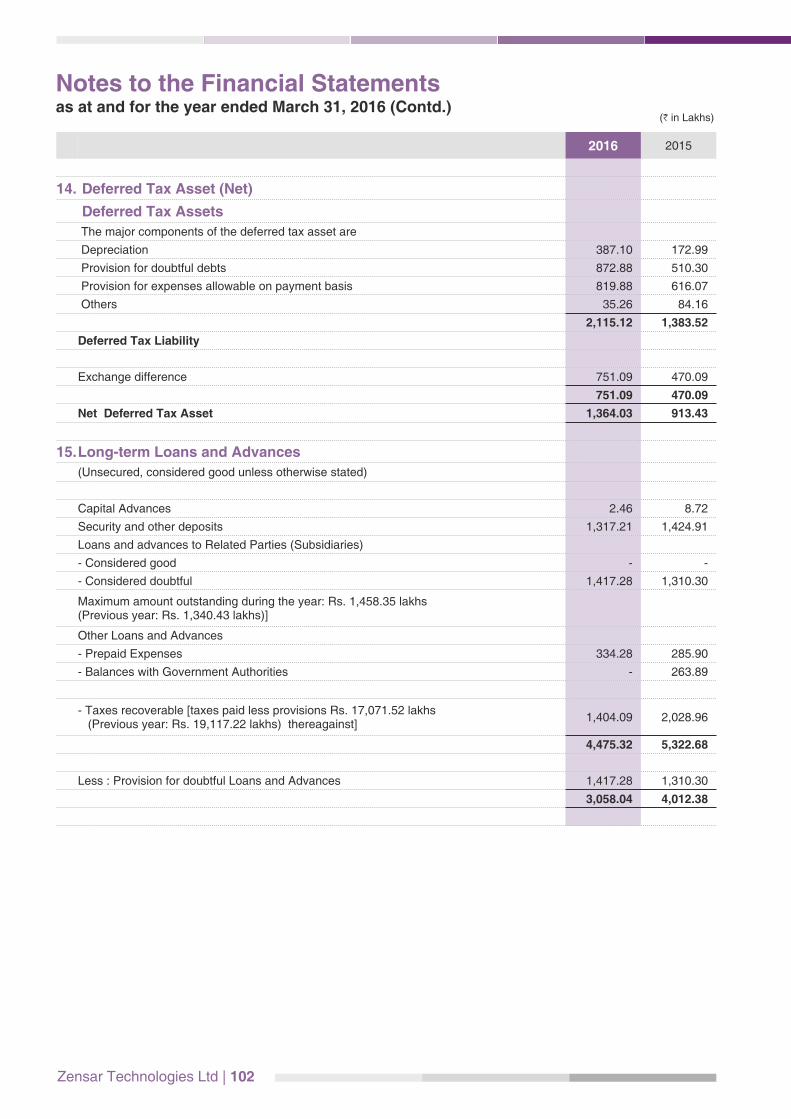
Zensar Technologies Ltd | 102
2016 2015
14. Deferred Tax Asset (Net)
Deferred Tax Assets
The major components of the deferred tax asset are
Depreciation 387.10 172.99
Provision for doubtful debts 872.88 510.30
Provision for expenses allowable on payment basis 819.88 616.07
Others 35.26 84.16
2,115.12 1,383.52
Deferred Tax Liability
Exchange difference 751.09 470.09
751.09 470.09
Net Deferred Tax Asset 1,364.03 913.43
15.Long-term Loans and Advances
(Unsecured, considered good unless otherwise stated)
Capital Advances 2.46 8.72
Security and other deposits 1,317.21 1,424.91
Loans and advances to Related Parties (Subsidiaries)
- Considered good - -
- Considered doubtful 1,417.28 1,310.30
Maximum amount outstanding during the year: Rs. 1,458.35 lakhs(Previous year: Rs. 1,340.43 lakhs)]
Other Loans and Advances
- Prepaid Expenses 334.28 285.90
- Balances with Government Authorities - 263.89
- Taxes recoverable [taxes paid less provisions Rs. 17,071.52 lakhs (Previous year: Rs. 19,117.22 lakhs) thereagainst]
1,404.09 2,028.96
4,475.32 5,322.68
Less : Provision for doubtful Loans and Advances 1,417.28 1,310.30
3,058.04 4,012.38
Notes to the Financial Statements as at and for the year ended March 31, 2016 (Contd.)
(H in Lakhs)
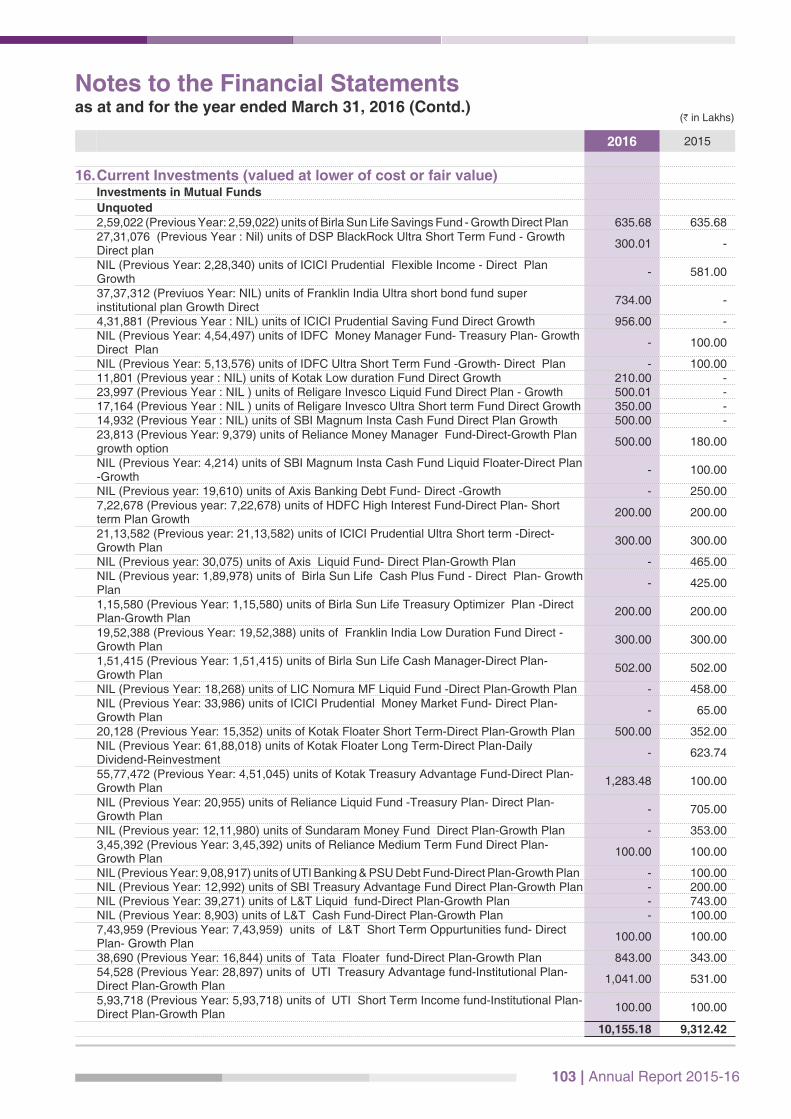
103 | Annual Report 2015-16
2016 2015
16.Current Investments (valued at lower of cost or fair value)Investments in Mutual Funds
Unquoted2,59,022 (Previous Year: 2,59,022) units of Birla Sun Life Savings Fund - Growth Direct Plan 635.68 635.68 27,31,076 (Previous Year : Nil) units of DSP BlackRock Ultra Short Term Fund - Growth Direct plan
300.01 -
NIL (Previous Year: 2,28,340) units of ICICI Prudential Flexible Income - Direct Plan Growth
- 581.00
37,37,312 (Previuos Year: NIL) units of Franklin India Ultra short bond fund super institutional plan Growth Direct
734.00 -
4,31,881 (Previous Year : NIL) units of ICICI Prudential Saving Fund Direct Growth 956.00 - NIL (Previous Year: 4,54,497) units of IDFC Money Manager Fund- Treasury Plan- Growth Direct Plan
- 100.00
NIL (Previous Year: 5,13,576) units of IDFC Ultra Short Term Fund -Growth- Direct Plan - 100.00 11,801 (Previous year : NIL) units of Kotak Low duration Fund Direct Growth 210.00 - 23,997 (Previous Year : NIL ) units of Religare Invesco Liquid Fund Direct Plan - Growth 500.01 - 17,164 (Previous Year : NIL ) units of Religare Invesco Ultra Short term Fund Direct Growth 350.00 - 14,932 (Previous Year : NIL) units of SBI Magnum Insta Cash Fund Direct Plan Growth 500.00 - 23,813 (Previous Year: 9,379) units of Reliance Money Manager Fund-Direct-Growth Plan growth option
500.00 180.00
NIL (Previous Year: 4,214) units of SBI Magnum Insta Cash Fund Liquid Floater-Direct Plan -Growth
- 100.00
NIL (Previous year: 19,610) units of Axis Banking Debt Fund- Direct -Growth - 250.00 7,22,678 (Previous year: 7,22,678) units of HDFC High Interest Fund-Direct Plan- Short term Plan Growth
200.00 200.00
21,13,582 (Previous year: 21,13,582) units of ICICI Prudential Ultra Short term -Direct- Growth Plan
300.00 300.00
NIL (Previous year: 30,075) units of Axis Liquid Fund- Direct Plan-Growth Plan - 465.00 NIL (Previous year: 1,89,978) units of Birla Sun Life Cash Plus Fund - Direct Plan- Growth Plan
- 425.00
1,15,580 (Previous Year: 1,15,580) units of Birla Sun Life Treasury Optimizer Plan -Direct Plan-Growth Plan
200.00 200.00
19,52,388 (Previous Year: 19,52,388) units of Franklin India Low Duration Fund Direct -Growth Plan
300.00 300.00
1,51,415 (Previous Year: 1,51,415) units of Birla Sun Life Cash Manager-Direct Plan-Growth Plan
502.00 502.00
NIL (Previous Year: 18,268) units of LIC Nomura MF Liquid Fund -Direct Plan-Growth Plan - 458.00 NIL (Previous Year: 33,986) units of ICICI Prudential Money Market Fund- Direct Plan-Growth Plan
- 65.00
20,128 (Previous Year: 15,352) units of Kotak Floater Short Term-Direct Plan-Growth Plan 500.00 352.00 NIL (Previous Year: 61,88,018) units of Kotak Floater Long Term-Direct Plan-Daily Dividend-Reinvestment
- 623.74
55,77,472 (Previous Year: 4,51,045) units of Kotak Treasury Advantage Fund-Direct Plan-Growth Plan
1,283.48 100.00
NIL (Previous Year: 20,955) units of Reliance Liquid Fund -Treasury Plan- Direct Plan-Growth Plan
- 705.00
NIL (Previous year: 12,11,980) units of Sundaram Money Fund Direct Plan-Growth Plan - 353.00 3,45,392 (Previous Year: 3,45,392) units of Reliance Medium Term Fund Direct Plan- Growth Plan
100.00 100.00
NIL (Previous Year: 9,08,917) units of UTI Banking & PSU Debt Fund-Direct Plan-Growth Plan - 100.00 NIL (Previous Year: 12,992) units of SBI Treasury Advantage Fund Direct Plan-Growth Plan - 200.00 NIL (Previous Year: 39,271) units of L&T Liquid fund-Direct Plan-Growth Plan - 743.00 NIL (Previous Year: 8,903) units of L&T Cash Fund-Direct Plan-Growth Plan - 100.00 7,43,959 (Previous Year: 7,43,959) units of L&T Short Term Oppurtunities fund- Direct Plan- Growth Plan
100.00 100.00
38,690 (Previous Year: 16,844) units of Tata Floater fund-Direct Plan-Growth Plan 843.00 343.00 54,528 (Previous Year: 28,897) units of UTI Treasury Advantage fund-Institutional Plan- Direct Plan-Growth Plan
1,041.00 531.00
5,93,718 (Previous Year: 5,93,718) units of UTI Short Term Income fund-Institutional Plan- Direct Plan-Growth Plan
100.00 100.00
10,155.18 9,312.42
Notes to the Financial Statements as at and for the year ended March 31, 2016 (Contd.)
(H in Lakhs)
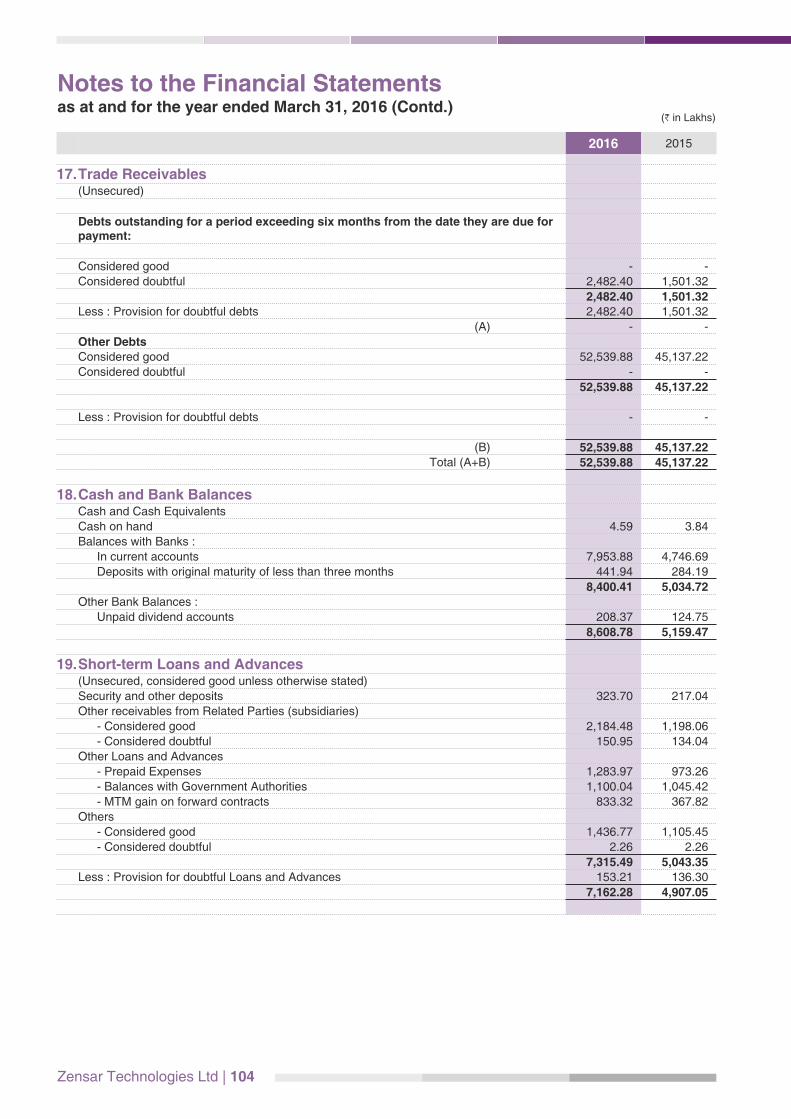
Zensar Technologies Ltd | 104
2016 2015
17.Trade Receivables(Unsecured)
Debts outstanding for a period exceeding six months from the date they are due for payment:
Considered good - -
Considered doubtful 2,482.40 1,501.32
2,482.40 1,501.32Less : Provision for doubtful debts 2,482.40 1,501.32
(A) - -
Other DebtsConsidered good 52,539.88 45,137.22
Considered doubtful - -
52,539.88 45,137.22
Less : Provision for doubtful debts - -
(B) 52,539.88 45,137.22Total (A+B) 52,539.88 45,137.22
18.Cash and Bank BalancesCash and Cash Equivalents
Cash on hand 4.59 3.84
Balances with Banks :
In current accounts 7,953.88 4,746.69
Deposits with original maturity of less than three months 441.94 284.19
8,400.41 5,034.72Other Bank Balances :
Unpaid dividend accounts 208.37 124.75
8,608.78 5,159.47
19.Short-term Loans and Advances(Unsecured, considered good unless otherwise stated)
Security and other deposits 323.70 217.04
Other receivables from Related Parties (subsidiaries)
- Considered good 2,184.48 1,198.06
- Considered doubtful 150.95 134.04
Other Loans and Advances
- Prepaid Expenses 1,283.97 973.26
- Balances with Government Authorities 1,100.04 1,045.42
- MTM gain on forward contracts 833.32 367.82
Others
- Considered good 1,436.77 1,105.45
- Considered doubtful 2.26 2.26
7,315.49 5,043.35Less : Provision for doubtful Loans and Advances 153.21 136.30
7,162.28 4,907.05
(H in Lakhs)
Notes to the Financial Statements as at and for the year ended March 31, 2016 (Contd.)

24.Other ExpensesTravelling and conveyance 5,342.97 4,227.00
Cost of manpower hired 3,029.85 2,672.81
Recruitment Expenses 379.39 294.63
Training Expenses 350.19 187.17
Electricity and Power 1,141.95 1,008.54
Rent 3,349.73 3,202.59
Repairs and Maintenance to :
-Plant and Machinery 318.34 251.22
-Building 1,402.99 1,412.34
-Others 119.51 96.08
1,840.84 1,759.64
105 | Annual Report 2015-16
Notes to the Financial Statements as at and for the year ended March 31, 2016 (Contd.)
2016 2015
20.Other Current AssetsAccrued Income (Unbilled Services) 16,880.51 10,994.07[Includes dues from subsidiary companies Rs. 13,426.58 lakhs (Previous year: Rs. 8,083 lakhs)]
Interest accrued on deposits 8.44 8.42
16,888.95 11,002.49
21. Other Operating Revenue - Finders' fees 837.62 862.68
- Provisions no longer required and credit balances written back (net) 240.39 1563.23
- Miscellaneous Income 204.13 321.97
1,282.14 2,747.88
22.Other IncomeGuarantee Commission 89.87 109.64
Dividend Income :
- From Subsidiaries 1,083.29 181.66
- On Current Investments 104.84 295.18
1,188.13 476.84
- Profit on sale of current investments - Non Trade (net) 306.93 347.66
- Profit on sale of fixed assets (net) 8.53 -
- Others 67.96 -
Interest Income :
-On Deposits with banks 126.38 127.88
-On Loans to subsidiaries 3.94 4.02
-On Income Tax refund 138.27 39.36
-On Others 76.57 9.12
345.16 180.38
Exchange gain (net) [See Note 2(l) and (m)] 2,672.44 964.92
4,679.02 2,079.44
23.Employee benefits expenseSalaries, Wages and Bonus 59,302.83 52,933.45
Contribution to Provident and other funds 3,378.62 3,352.04
Staff Welfare 1,550.23 1,412.34
Employee Stock Compensation Expense 17.40 17.04
64,249.08 57,714.87
(H in Lakhs)
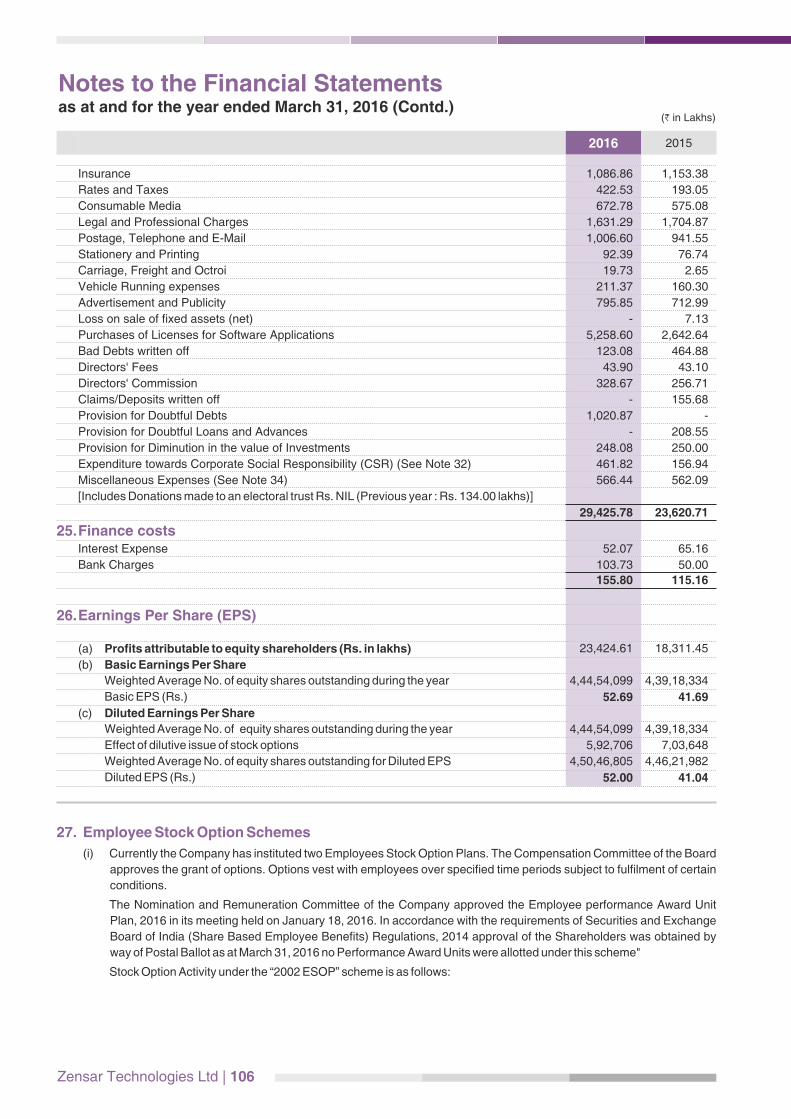
Zensar Technologies Ltd | 106
Notes to the Financial Statements as at and for the year ended March 31, 2016 (Contd.)
(H in Lakhs)
27. Employee Stock Option Schemes
(i) Currently the Company has instituted two Employees Stock Option Plans. The Compensation Committee of the Board
approves the grant of options. Options vest with employees over specified time periods subject to fulfilment of certain
conditions.
The Nomination and Remuneration Committee of the Company approved the Employee performance Award Unit
Plan, 2016 in its meeting held on January 18, 2016. In accordance with the requirements of Securities and Exchange
Board of India (Share Based Employee Benefits) Regulations, 2014 approval of the Shareholders was obtained by
way of Postal Ballot as at March 31, 2016 no Performance Award Units were allotted under this scheme"
Stock Option Activity under the “2002 ESOP” scheme is as follows:
2016 2015
Insurance 1,086.86 1,153.38
Rates and Taxes 422.53 193.05
Consumable Media 672.78 575.08
Legal and Professional Charges 1,631.29 1,704.87
Postage, Telephone and E-Mail 1,006.60 941.55
Stationery and Printing 92.39 76.74
Carriage, Freight and Octroi 19.73 2.65
Vehicle Running expenses 211.37 160.30
Advertisement and Publicity 795.85 712.99
Loss on sale of fixed assets (net) - 7.13
Purchases of Licenses for Software Applications 5,258.60 2,642.64
Bad Debts written off 123.08 464.88
Directors' Fees 43.90 43.10
Directors' Commission 328.67 256.71
Claims/Deposits written off - 155.68
Provision for Doubtful Debts 1,020.87 -
Provision for Doubtful Loans and Advances - 208.55
Provision for Diminution in the value of Investments 248.08 250.00
Expenditure towards Corporate Social Responsibility (CSR) (See Note 32) 461.82 156.94
Miscellaneous Expenses (See Note 34) 566.44 562.09
[Includes Donations made to an electoral trust Rs. NIL (Previous year : Rs. 134.00 lakhs)]
29,425.78 23,620.71
25.Finance costsInterest Expense 52.07 65.16
Bank Charges 103.73 50.00
155.80 115.16
26.Earnings Per Share (EPS)
(a) Profits attributable to equity shareholders (Rs. in lakhs) 23,424.61 18,311.45
(b) Basic Earnings Per Share
Weighted Average No. of equity shares outstanding during the year 4,44,54,099 4,39,18,334
Basic EPS (Rs.) 52.69 41.69
(c) Diluted Earnings Per Share
Weighted Average No. of equity shares outstanding during the year 4,44,54,099 4,39,18,334
Effect of dilutive issue of stock options 5,92,706 7,03,648
Weighted Average No. of equity shares outstanding for Diluted EPS 4,50,46,805 4,46,21,982
Diluted EPS (Rs.) 52.00 41.04
107 | Annual Report 2015-16
Notes to the Financial Statements as at and for the year ended March 31, 2016 (Contd.)
2015-16 2014-15
Number of options
Weighted average
exercise price in Rupees
Number of options
Weighted average
exercise price in Rupees
Opening Balance 1,24,690 76.08 1,94,718 77.68
Exercised during the year 63,412 72.61 63,854 83.18
Cancelled during the year 5,428 43.05 6,174 52.92
Balance unexercised options 55,850 83.24 1,24,690 76.08
Exercisable at end of year 55,850 83.24 1,24,690 76.08
Stock Option Activity under the “2006 ESOP” scheme is as follows:
2015-16 2014-15
Number of options
Weighted average
exercise price in Rupees
Number of options
Weighted average
exercise price in Rupees
Opening Balance 10,67,830 185.23 15,16,560 158.00
Granted during the year 3,01,000 812.43 2,45,000 478.24
Exercised during the year 2,41,242 161.02 4,95,426 113.93
Cancelled during the year 97,606 278.94 1,98,304 231.04
Balance unexercised options 10,29,982 420.39 10,67,830 238.35
Exercisable at end of year 5,35,642 216.82 3,27,081 185.23
(ii) Impact on the reported net profit and earnings per share by applying the fair value based method
Since the Company uses intrinsic value method as required by the Guidance Note on Accounting for Employee Share-
based Payments issued by Institute of Chartered Accountants of India, the impact on reported net profit and Earnings
Per Share by applying the fair value method is set out as follows:
Year ended31-Mar-16
Year ended31-Mar-15
(a) Profit after taxation (Rs. in lakhs) 23,424.61 18,311.45
(b) Add: Employee stock compensation under intrinsic value method (Rs. in lakhs) 17.40 17.04
(c ) Less: Employee stock compensation under fair value method (Rs. in lakhs) 274.50 212.66
(d ) Profit after taxation as per fair value method 23,167.51 18,115.83
(e ) Earnings Per Share
(i) Basic
-As reported 52.69 41.69
-Adjusted 52.12 41.25
(ii) Diluted
-As reported 52.00 41.04
-Adjusted 51.43 40.60
Year ended31-Mar-16
Year ended31-Mar-15
Risk-free interest rate (%) 7.59% - 7.99% 7.80% - 8.70%
Expected life of options 96 months 96 months
Expected volatility 36.18% - 42.28% 40.80% - 41.40%
Dividend yield 1.11% - 1.62% 1.60% - 2.30%
The following assumptions were used for calculation of fair value of grants:

Zensar Technologies Ltd | 108
28.Related Party Disclosures as per
Accounting Standard 18
List of Related Parties (as identified and certified by
the Management)
(i) Parties where control exists
Subsidiaries:
Zensar Technologies, Inc., USA
Zensar Technologies (UK) Limited
Zensar Technologies (Singapore) Pte. Limited
Zensar Technologies (Shanghai) Company Limited
PSI Holding Group Inc.
Zensar Technologies IM Inc.
Zensar Technologies IM BV
Aquila Technology Corp.
Zensar (Africa) Holdings Pty Limited
Zensar (South Africa) Pty Limited
Professional Access Limited
(ii) Key Management Personnel
Dr. Ganesh Natarajan
Mr. Sandeep Kishore (with effect from January 12, 2016)
Mr. S. Balasubramaniam
(iii) Entity with common Key Management Personnel
Zensar Foundation
Notes to the Financial Statements as at and for the year ended March 31, 2016 (Contd.)
Transactions with Related Parties
Sr no.
Description of the nature of the transactionsVolume of
transactions during Amount Outstanding as on 31st March
2015-16 2014-15 2016 2015
Receivable Payable Receivable Payable
A. Rendering of Software Services
1 Wholly owned subsidiaries:
(i) Zensar Technologies, Inc., USA 54,004.63 50,497.26 37,430.35 35,677.81
(ii) Zensar Technologies (UK) Limited 10,489.31 9,710.79 2,364.50 1,672.05
(iii) Professional Access Ltd.- USA 20,099.47 8,987.12 12,764.35 8,098.82
(iv) Zensar Technologies IM Inc 1,898.95 1,160.01 437.37 159.89
(v) Zensar (South Africa) Pty Limited 8,148.91 172.73 4,918.73 114.52
(vi) Others 896.27 841.40 ***517.82 ***182.95
Total of rendering of Software Services 95,537.54 71,369.31 58,433.12 45,906.04
B. Receipt of Software Services1 Wholly owned subsidiaries
(i) Zensar Technologies (Singapore) Pte. Limited 73.02 95.05 15.49 9.16
(ii)Zensar Technologies (Shanghai) Company Limited
140.61 160.43 36.80 21.88
(iii) Zensar Technologies IM Inc 35.35 35.35
Total of Receipt from Software Services 213.63 290.83 52.29 66.39
C. Rendering of Other Services
1 Wholly owned subsidiaries:
(i) Zensar Technologies, Inc., USA (Finders' Fee) 487.40 509.53 348.82 324.08
(ii) Zensar Technologies (UK) Limited (Finders' Fee) 311.54 301.96 101.48 117.57
(iii) Professional Access Ltd.- USA (Finders' Fee) 38.68 51.19 3.88 51.19
Total of rendering of Other Services 837.62 862.68 454.18 492.84
D. Reimbursement of expenses incurred1 Wholly owned subsidiaries:
(i) Zensar Technologies, Inc., USA 1,626.63 1,788.71 919.09 1,037.62
(ii) Zensar Technologies (UK) Limited 1,362.11 1,299.68 135.39 82.25
(iii) Zensar Technologies (Singapore) Pte. Limited 31.78 57.77 12.98 1.59
(iv) Zensar Advanced Technologies Limited - - *18.31 *15.97
(v) Zensar Technologies (Shanghai) Co. Ltd 18.54 25.09 *141.70 *120.93
(vi) Zensar Technologies IM Inc 385.28 203.55 101.29 26.30
(vii) Zensar (South Africa) Pty Limited 698.52 1.40 729.35 1.40
(viii) Professional Access Ltd.- USA (Net) (669.03) (129.90) 678.50 210.56
Total reimbursement of expenses incurred (Net)
3,453.83 3,246.30 2,058.11 678.50 1,286.06 210.56
(H in Lakhs)
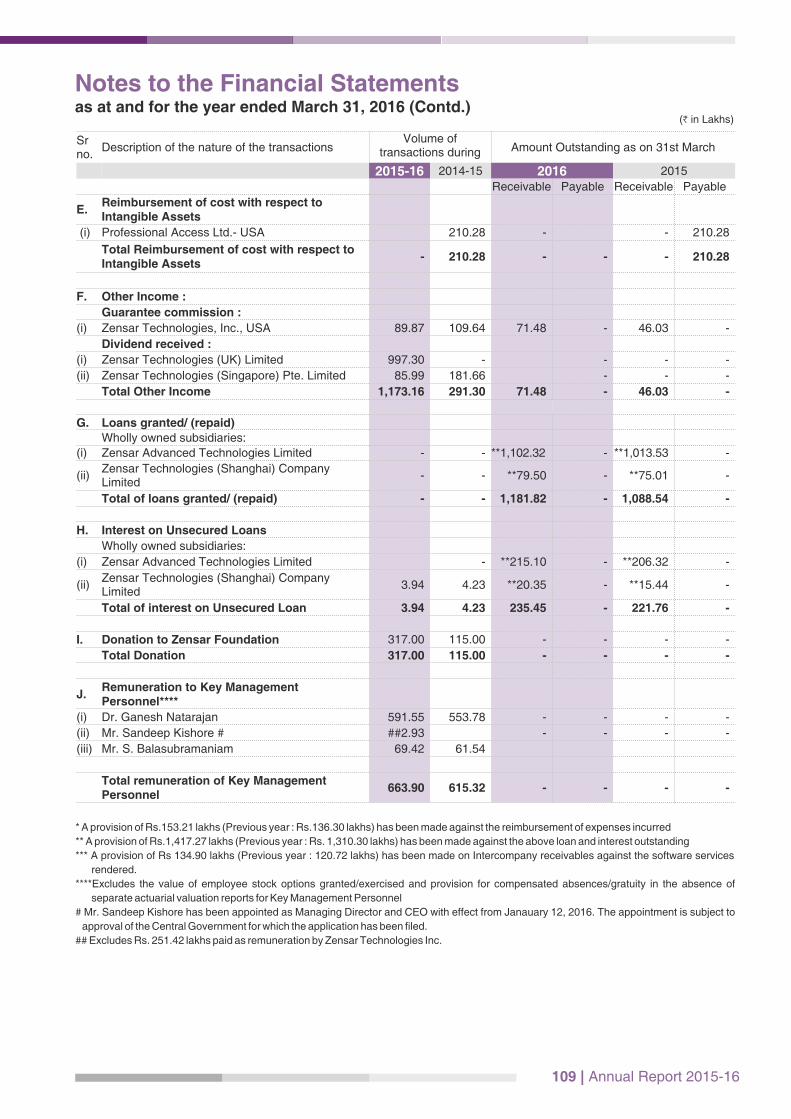
109 | Annual Report 2015-16
Notes to the Financial Statements as at and for the year ended March 31, 2016 (Contd.)
Sr no.
Description of the nature of the transactionsVolume of
transactions during Amount Outstanding as on 31st March
2015-16 2014-15 2016 2015
Receivable Payable Receivable Payable
E.Reimbursement of cost with respect to Intangible Assets
(i) Professional Access Ltd.- USA 210.28 - - 210.28
Total Reimbursement of cost with respect to Intangible Assets
- 210.28 - - - 210.28
F. Other Income :
Guarantee commission :
(i) Zensar Technologies, Inc., USA 89.87 109.64 71.48 - 46.03 -
Dividend received :
(i) Zensar Technologies (UK) Limited 997.30 - - - -
(ii) Zensar Technologies (Singapore) Pte. Limited 85.99 181.66 - - -
Total Other Income 1,173.16 291.30 71.48 - 46.03 -
G. Loans granted/ (repaid)Wholly owned subsidiaries:
(i) Zensar Advanced Technologies Limited - - **1,102.32 - **1,013.53 -
(ii)Zensar Technologies (Shanghai) Company Limited
- - **79.50 - **75.01 -
Total of loans granted/ (repaid) - - 1,181.82 - 1,088.54 -
H. Interest on Unsecured Loans
Wholly owned subsidiaries:
(i) Zensar Advanced Technologies Limited - **215.10 - **206.32 -
(ii)Zensar Technologies (Shanghai) Company Limited
3.94 4.23 **20.35 - **15.44 -
Total of interest on Unsecured Loan 3.94 4.23 235.45 - 221.76 -
I. Donation to Zensar Foundation 317.00 115.00 - - - -
Total Donation 317.00 115.00 - - - -
J.Remuneration to Key Management Personnel****
(i) Dr. Ganesh Natarajan 591.55 553.78 - - - -
(ii) Mr. Sandeep Kishore # ##2.93 - - - -
(iii) Mr. S. Balasubramaniam 69.42 61.54
Total remuneration of Key Management Personnel
663.90 615.32 - - - -
(H in Lakhs)
* A provision of Rs.153.21 lakhs (Previous year : Rs.136.30 lakhs) has been made against the reimbursement of expenses incurred
** A provision of Rs.1,417.27 lakhs (Previous year : Rs. 1,310.30 lakhs) has been made against the above loan and interest outstanding
*** A provision of Rs 134.90 lakhs (Previous year : 120.72 lakhs) has been made on Intercompany receivables against the software services
rendered.
****Excludes the value of employee stock options granted/exercised and provision for compensated absences/gratuity in the absence of
separate actuarial valuation reports for Key Management Personnel
# Mr. Sandeep Kishore has been appointed as Managing Director and CEO with effect from Janauary 12, 2016. The appointment is subject to
approval of the Central Government for which the application has been filed.
## Excludes Rs. 251.42 lakhs paid as remuneration by Zensar Technologies Inc.
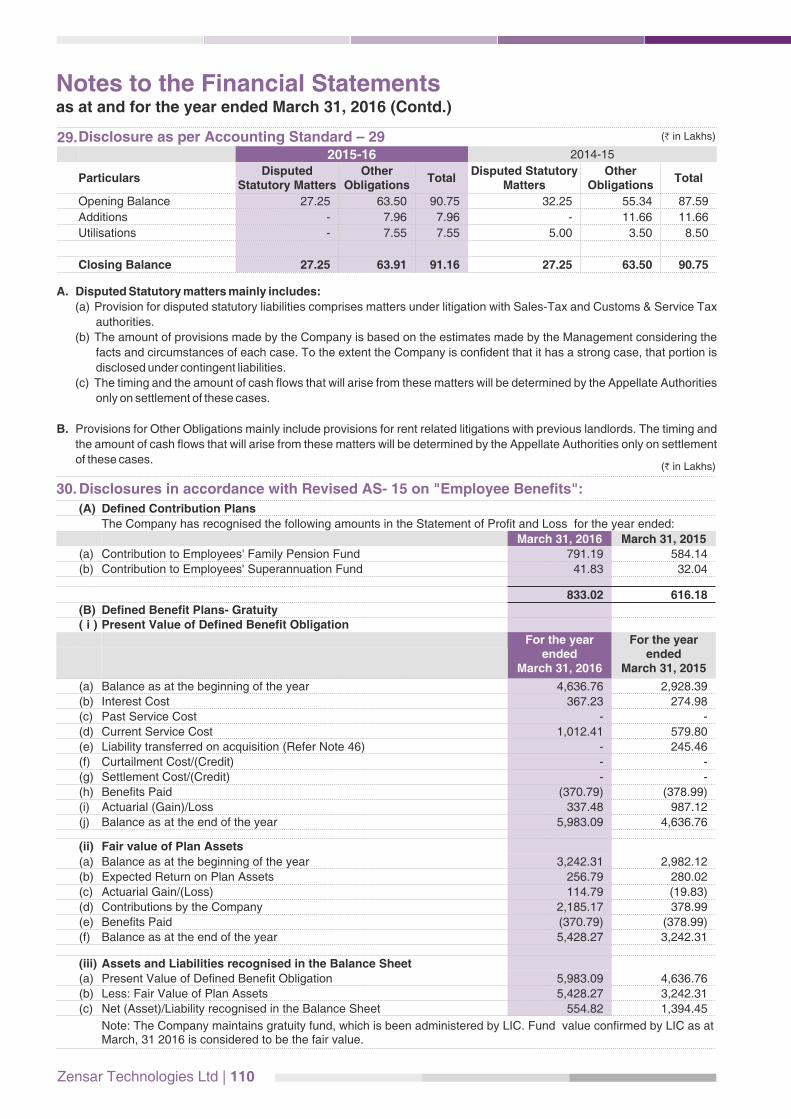
Zensar Technologies Ltd | 110
Notes to the Financial Statements as at and for the year ended March 31, 2016 (Contd.)
(H in Lakhs)
(H in Lakhs)
30. Disclosures in accordance with Revised AS- 15 on "Employee Benefits":
(A) Defined Contribution Plans
The Company has recognised the following amounts in the Statement of Profit and Loss for the year ended:
March 31, 2016 March 31, 2015(a) Contribution to Employees' Family Pension Fund 791.19 584.14
(b) Contribution to Employees' Superannuation Fund 41.83 32.04
833.02 616.18
(B) Defined Benefit Plans- Gratuity ( i ) Present Value of Defined Benefit Obligation
For the year ended
March 31, 2016
For the year ended
March 31, 2015
(a) Balance as at the beginning of the year 4,636.76 2,928.39
(b) Interest Cost 367.23 274.98
(c) Past Service Cost - -
(d) Current Service Cost 1,012.41 579.80
(e) Liability transferred on acquisition (Refer Note 46) - 245.46
(f) Curtailment Cost/(Credit) - -
(g) Settlement Cost/(Credit) - -
(h) Benefits Paid (370.79) (378.99)
(i) Actuarial (Gain)/Loss 337.48 987.12
(j) Balance as at the end of the year 5,983.09 4,636.76
(ii) Fair value of Plan Assets
(a) Balance as at the beginning of the year 3,242.31 2,982.12
(b) Expected Return on Plan Assets 256.79 280.02
(c) Actuarial Gain/(Loss) 114.79 (19.83)
(d) Contributions by the Company 2,185.17 378.99
(e) Benefits Paid (370.79) (378.99)
(f) Balance as at the end of the year 5,428.27 3,242.31
(iii) Assets and Liabilities recognised in the Balance Sheet(a) Present Value of Defined Benefit Obligation 5,983.09 4,636.76
(b) Less: Fair Value of Plan Assets 5,428.27 3,242.31
(c) Net (Asset)/Liability recognised in the Balance Sheet 554.82 1,394.45
Note: The Company maintains gratuity fund, which is been administered by LIC. Fund value confirmed by LIC as at March, 31 2016 is considered to be the fair value.
29.Disclosure as per Accounting Standard – 292015-16 2014-15
ParticularsDisputed
Statutory MattersOther
ObligationsTotal
Disputed Statutory Matters
Other Obligations
Total
Opening Balance 27.25 63.50 90.75 32.25 55.34 87.59
Additions - 7.96 7.96 - 11.66 11.66
Utilisations - 7.55 7.55 5.00 3.50 8.50
Closing Balance 27.25 63.91 91.16 27.25 63.50 90.75
A. Disputed Statutory matters mainly includes:
(a) Provision for disputed statutory liabilities comprises matters under litigation with Sales-Tax and Customs & Service Tax
authorities.
(b) The amount of provisions made by the Company is based on the estimates made by the Management considering the
facts and circumstances of each case. To the extent the Company is confident that it has a strong case, that portion is
disclosed under contingent liabilities.
(c) The timing and the amount of cash flows that will arise from these matters will be determined by the Appellate Authorities
only on settlement of these cases.
B. Provisions for Other Obligations mainly include provisions for rent related litigations with previous landlords. The timing and
the amount of cash flows that will arise from these matters will be determined by the Appellate Authorities only on settlement
of these cases.
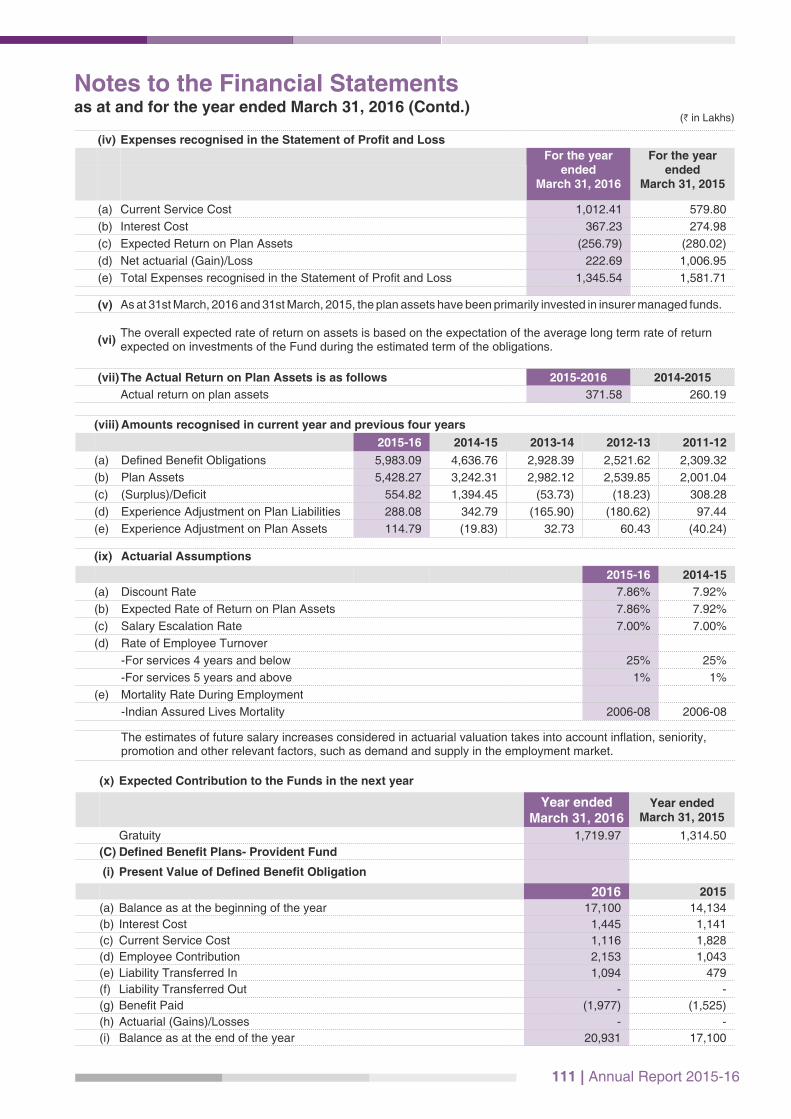
111 | Annual Report 2015-16
(iv) Expenses recognised in the Statement of Profit and Loss
For the year ended
March 31, 2016
For the year ended
March 31, 2015
(a) Current Service Cost 1,012.41 579.80
(b) Interest Cost 367.23 274.98
(c) Expected Return on Plan Assets (256.79) (280.02)
(d) Net actuarial (Gain)/Loss 222.69 1,006.95
(e) Total Expenses recognised in the Statement of Profit and Loss 1,345.54 1,581.71
(v) As at 31st March, 2016 and 31st March, 2015, the plan assets have been primarily invested in insurer managed funds.
(vi) The overall expected rate of return on assets is based on the expectation of the average long term rate of return expected on investments of the Fund during the estimated term of the obligations.
(vii) The Actual Return on Plan Assets is as follows 2015-2016 2014-2015
Actual return on plan assets 371.58 260.19
(viii) Amounts recognised in current year and previous four years
2015-16 2014-15 2013-14 2012-13 2011-12
(a) Defined Benefit Obligations 5,983.09 4,636.76 2,928.39 2,521.62 2,309.32
(b) Plan Assets 5,428.27 3,242.31 2,982.12 2,539.85 2,001.04
(c) (Surplus)/Deficit 554.82 1,394.45 (53.73) (18.23) 308.28
(d) Experience Adjustment on Plan Liabilities 288.08 342.79 (165.90) (180.62) 97.44
(e) Experience Adjustment on Plan Assets 114.79 (19.83) 32.73 60.43 (40.24)
(ix) Actuarial Assumptions
2015-16 2014-15
(a) Discount Rate 7.86% 7.92%
(b) Expected Rate of Return on Plan Assets 7.86% 7.92%
(c) Salary Escalation Rate 7.00% 7.00%
(d) Rate of Employee Turnover
-For services 4 years and below 25% 25%
-For services 5 years and above 1% 1%
(e) Mortality Rate During Employment
-Indian Assured Lives Mortality 2006-08 2006-08
The estimates of future salary increases considered in actuarial valuation takes into account inflation, seniority, promotion and other relevant factors, such as demand and supply in the employment market.
(H in Lakhs)
(x) Expected Contribution to the Funds in the next year
Year endedMarch 31, 2016
Year endedMarch 31, 2015
Gratuity 1,719.97 1,314.50
(C) Defined Benefit Plans- Provident Fund
(i) Present Value of Defined Benefit Obligation
2016 2015
(a) Balance as at the beginning of the year 17,100 14,134
(b) Interest Cost 1,445 1,141
(c) Current Service Cost 1,116 1,828
(d) Employee Contribution 2,153 1,043
(e) Liability Transferred In 1,094 479
(f) Liability Transferred Out - -
(g) Benefit Paid (1,977) (1,525)
(h) Actuarial (Gains)/Losses - -
(i) Balance as at the end of the year 20,931 17,100
Notes to the Financial Statements as at and for the year ended March 31, 2016 (Contd.)
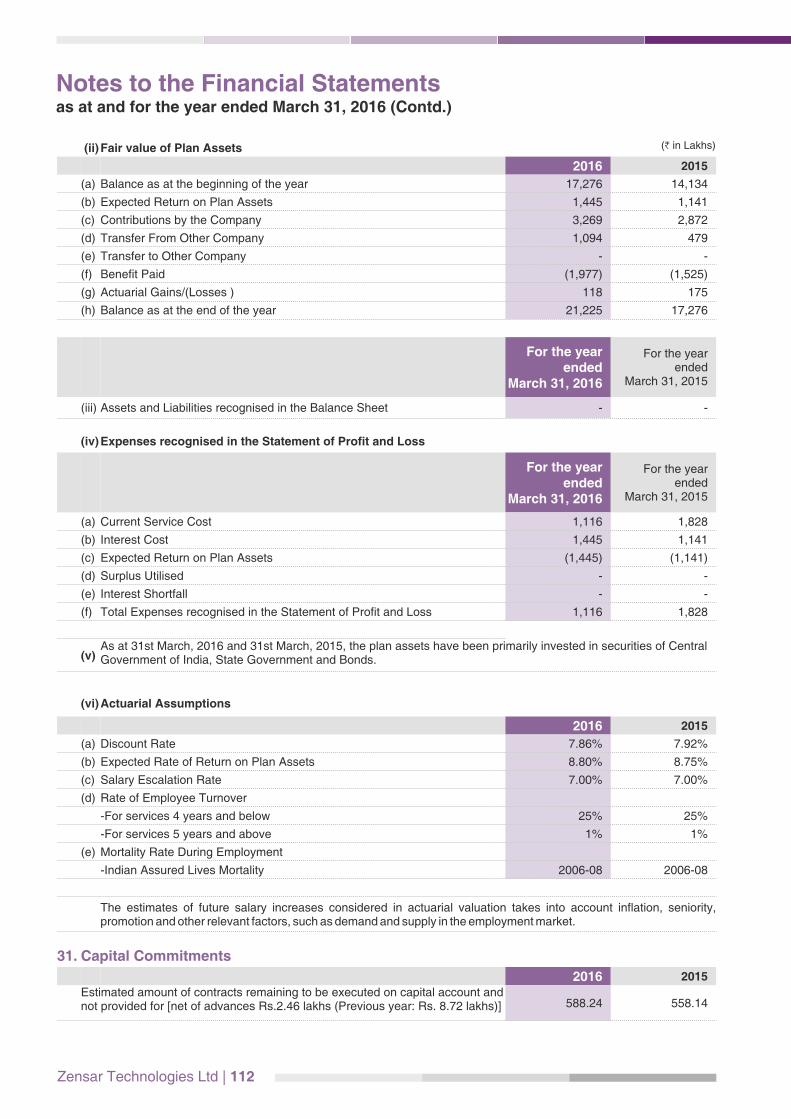
Zensar Technologies Ltd | 112
(ii)Fair value of Plan Assets
2016 2015
(a) Balance as at the beginning of the year 17,276 14,134
(b) Expected Return on Plan Assets 1,445 1,141
(c) Contributions by the Company 3,269 2,872
(d) Transfer From Other Company 1,094 479
(e) Transfer to Other Company - -
(f) Benefit Paid (1,977) (1,525)
(g) Actuarial Gains/(Losses ) 118 175
(h) Balance as at the end of the year 21,225 17,276
For the year ended
March 31, 2016
For the year ended
March 31, 2015
(iii) Assets and Liabilities recognised in the Balance Sheet - -
(iv) Expenses recognised in the Statement of Profit and Loss
For the year ended
March 31, 2016
For the year ended
March 31, 2015
(a) Current Service Cost 1,116 1,828
(b) Interest Cost 1,445 1,141
(c) Expected Return on Plan Assets (1,445) (1,141)
(d) Surplus Utilised - -
(e) Interest Shortfall - -
(f) Total Expenses recognised in the Statement of Profit and Loss 1,116 1,828
(v)As at 31st March, 2016 and 31st March, 2015, the plan assets have been primarily invested in securities of Central Government of India, State Government and Bonds.
(vi)Actuarial Assumptions
2016 2015
(a) Discount Rate 7.86% 7.92%
(b) Expected Rate of Return on Plan Assets 8.80% 8.75%
(c) Salary Escalation Rate 7.00% 7.00%
(d) Rate of Employee Turnover
-For services 4 years and below 25% 25%
-For services 5 years and above 1% 1%
(e) Mortality Rate During Employment
-Indian Assured Lives Mortality 2006-08 2006-08
The estimates of future salary increases considered in actuarial valuation takes into account inflation, seniority, promotion and other relevant factors, such as demand and supply in the employment market.
31. Capital Commitments
2016 2015
Estimated amount of contracts remaining to be executed on capital account and not provided for [net of advances Rs.2.46 lakhs (Previous year: Rs. 8.72 lakhs)] 588.24 558.14
(H in Lakhs)
Notes to the Financial Statements as at and for the year ended March 31, 2016 (Contd.)
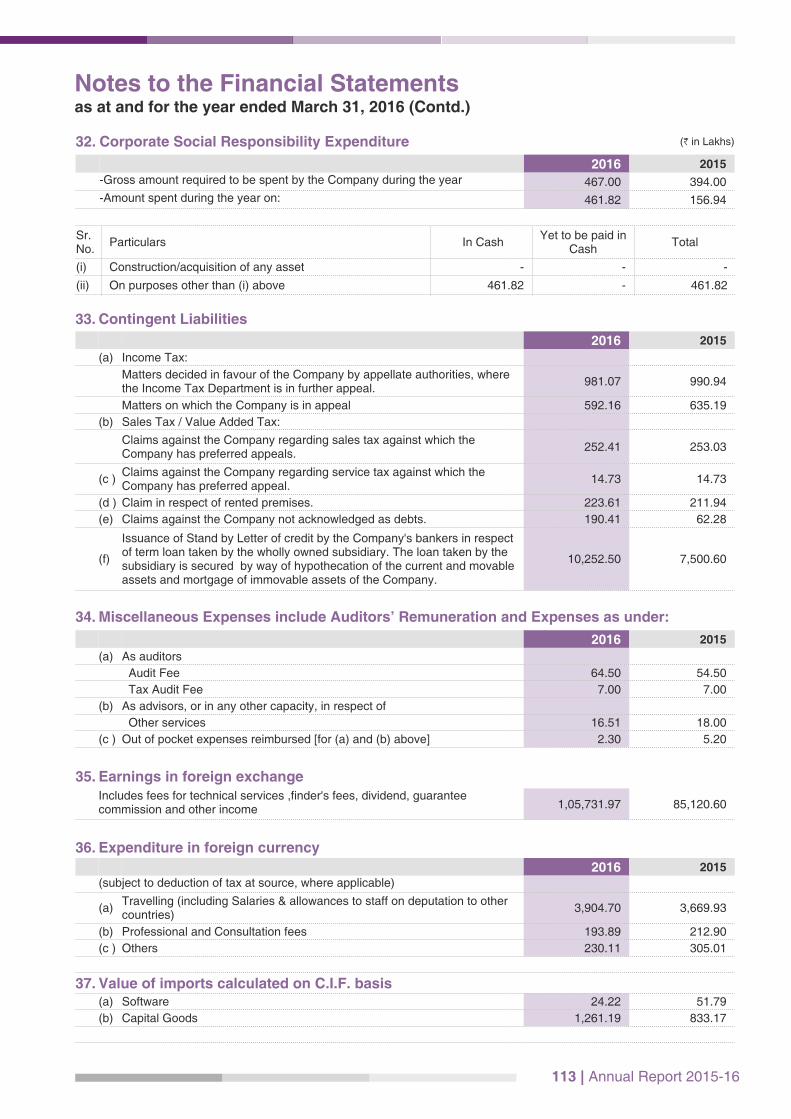
113 | Annual Report 2015-16
32. Corporate Social Responsibility Expenditure
2016 2015
-Gross amount required to be spent by the Company during the year 467.00 394.00
-Amount spent during the year on: 461.82 156.94
Sr. No.
Particulars In Cash Yet to be paid in
CashTotal
(i) Construction/acquisition of any asset - - -
(ii) On purposes other than (i) above 461.82 - 461.82
33. Contingent Liabilities
2016 2015
(a) Income Tax:
Matters decided in favour of the Company by appellate authorities, where the Income Tax Department is in further appeal.
981.07 990.94
Matters on which the Company is in appeal 592.16 635.19
(b) Sales Tax / Value Added Tax:
Claims against the Company regarding sales tax against which the Company has preferred appeals.
252.41 253.03
(c )Claims against the Company regarding service tax against which the Company has preferred appeal.
14.73 14.73
(d ) Claim in respect of rented premises. 223.61 211.94
(e) Claims against the Company not acknowledged as debts. 190.41 62.28
(f)
Issuance of Stand by Letter of credit by the Company's bankers in respect of term loan taken by the wholly owned subsidiary. The loan taken by the subsidiary is secured by way of hypothecation of the current and movable assets and mortgage of immovable assets of the Company.
10,252.50 7,500.60
34. Miscellaneous Expenses include Auditors’ Remuneration and Expenses as under:
2016 2015
(a) As auditors
Audit Fee 64.50 54.50
Tax Audit Fee 7.00 7.00
(b) As advisors, or in any other capacity, in respect of
Other services 16.51 18.00
(c ) Out of pocket expenses reimbursed [for (a) and (b) above] 2.30 5.20
35. Earnings in foreign exchange Includes fees for technical services ,finder's fees, dividend, guarantee commission and other income 1,05,731.97 85,120.60
36. Expenditure in foreign currency
2016 2015
(subject to deduction of tax at source, where applicable)
(a)Travelling (including Salaries & allowances to staff on deputation to other countries)
3,904.70 3,669.93
(b) Professional and Consultation fees 193.89 212.90
(c ) Others 230.11 305.01
37. Value of imports calculated on C.I.F. basis(a) Software 24.22 51.79
(b) Capital Goods 1,261.19 833.17
(H in Lakhs)
Notes to the Financial Statements as at and for the year ended March 31, 2016 (Contd.)
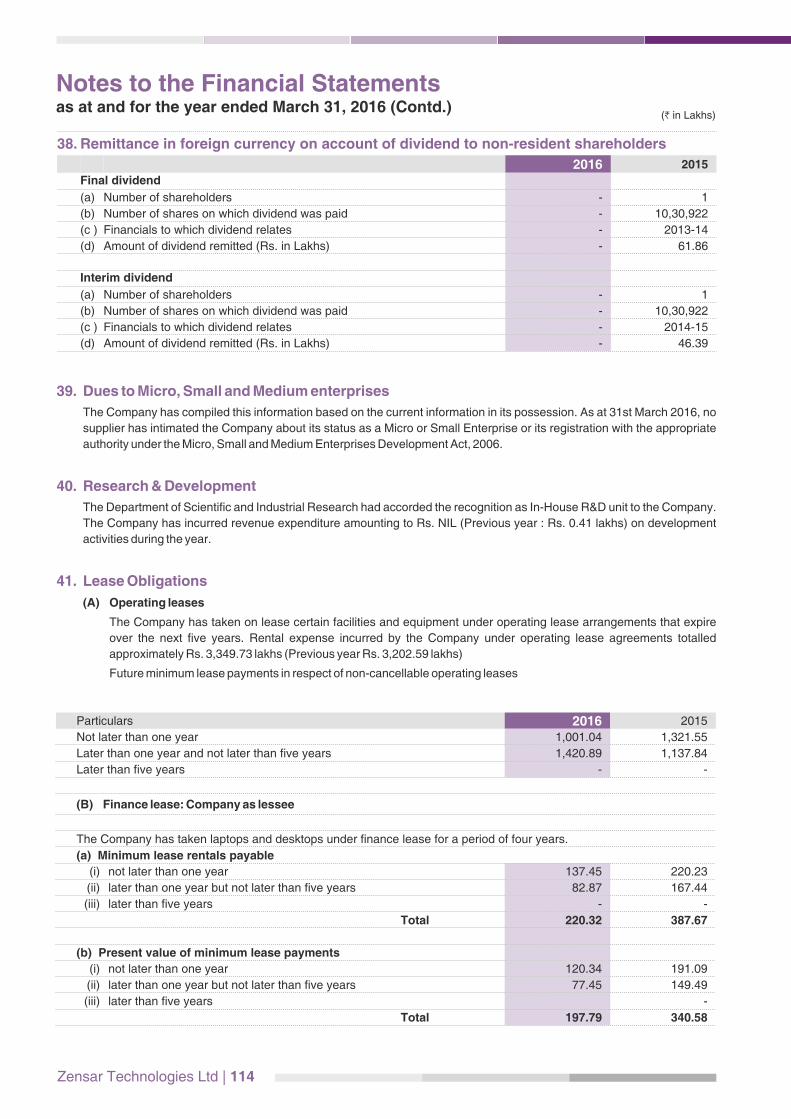
Zensar Technologies Ltd | 114
38. Remittance in foreign currency on account of dividend to non-resident shareholders
2016 2015
Final dividend
(a) Number of shareholders - 1
(b) Number of shares on which dividend was paid - 10,30,922
(c ) Financials to which dividend relates - 2013-14
(d) Amount of dividend remitted (Rs. in Lakhs) - 61.86
Interim dividend
(a) Number of shareholders - 1
(b) Number of shares on which dividend was paid - 10,30,922
(c ) Financials to which dividend relates - 2014-15
(d) Amount of dividend remitted (Rs. in Lakhs) - 46.39
39. Dues to Micro, Small and Medium enterprises
The Company has compiled this information based on the current information in its possession. As at 31st March 2016, no
supplier has intimated the Company about its status as a Micro or Small Enterprise or its registration with the appropriate
authority under the Micro, Small and Medium Enterprises Development Act, 2006.
40. Research & Development
The Department of Scientific and Industrial Research had accorded the recognition as In-House R&D unit to the Company.
The Company has incurred revenue expenditure amounting to Rs. NIL (Previous year : Rs. 0.41 lakhs) on development
activities during the year.
41. Lease Obligations
(A) Operating leases
The Company has taken on lease certain facilities and equipment under operating lease arrangements that expire
over the next five years. Rental expense incurred by the Company under operating lease agreements totalled
approximately Rs. 3,349.73 lakhs (Previous year Rs. 3,202.59 lakhs)
Future minimum lease payments in respect of non-cancellable operating leases
Notes to the Financial Statements as at and for the year ended March 31, 2016 (Contd.)
Particulars 2016 2015
Not later than one year 1,001.04 1,321.55
Later than one year and not later than five years 1,420.89 1,137.84
Later than five years - -
(B) Finance lease: Company as lessee
The Company has taken laptops and desktops under finance lease for a period of four years.
(a) Minimum lease rentals payable
(i) not later than one year 137.45 220.23
(ii) later than one year but not later than five years 82.87 167.44
(iii) later than five years - -
Total 220.32 387.67
(b) Present value of minimum lease payments
(i) not later than one year 120.34 191.09
(ii) later than one year but not later than five years 77.45 149.49
(iii) later than five years -
Total 197.79 340.58
(H in Lakhs)

115 | Annual Report 2015-16
Particulars 2016 2015
(c) Reconciliation of minimum lease payments and present value
Minimum lease rentals payable as per (a) above 220.32 387.67
Less: Finance charges to be recognized in subsequent periods 22.53 47.09
Present value of minimum lease payments payable as per (b) above 197.79 340.58
(d) Nature of Security:
Finance Lease Obligations are secured by hypothecation of assets underlying the leases.
(e) Terms of Repayment:
Monthly payment of Equated Monthly Instalments beginning from the month subsequent to taking the lease
42.Derivative instruments and unhedged foreign currency exposure
Particulars Purpose 2016 2015
(a)Derivatives outstanding as at the reporting date
In US $ Hedge highly probable forecast sale 4,51,00,000 3,85,00,000
(Equivalent approximate in Rs. lakhs) 30,807.28 24,970.67
In GBP £ Hedge highly probable forecast sale 18,00,000 -
(Equivalent approximate in Rs. lakhs) 1,776.10 -
In ZAR R Hedge highly probable forecast sale 50,00,000 -
(Equivalent approximate in Rs. lakhs) 224.82 -
(b) As of the Balance Sheet date, the Company’s net foreign currency exposure that is not hedged by derivative instruments or otherwise is Rs. 67,997.53 lakhs (Previous year: Rs. 53,197.18 lakhs)
Details of foreign currency exposures that are not hedged by a dervative instruments or otherwise.
Notes to the Financial Statements as at and for the year ended March 31, 2016 (Contd.) (H in Lakhs)
2015-16 2014-15
Amount in FC (in lakhs)
Amount inINR- (in lakhs)
Amount in FC (in lakhs)
Amount in INR- (in lakhs)
Trade and other receivables
AED 30.44 549.13 12.11 206.15
AUD 24.31 1,238.42 9.83 467.30
CHF 0.26 18.10 0.04 2.49
CNY 3.85 39.51 1.79 18.08
EUR 2.22 167.50 0.39 26.58
GBP 27.12 2,589.13 20.02 1,851.40
JPY 191.97 113.24 191.97 100.11
KES 4,091.67 2,623.70 2.65 1.76
SAR 0.49 8.57 - -
SGD 4.01 197.38 0.66 29.83
USD 833.72 55,235.44 767.86 47,994.79
ZAR 538.60 2,424.79 296.23 1,519.36
Loans - Granted to subsidiaries
USD 13.16 872.01 13.10 818.93
JPY 788.01 464.85 788.01 410.95

For Price Waterhouse For and on behalf of the Board of Directors of Firm Registration Number: 301112E Zensar Technologies Limited Chartered Accountants Amit Borkar H.V. Goenka Sandeep KishorePartner Chairman Managing Director & CEOMembership No. 109846 DIN: 00026726 DIN: 07393680 S. Balasubramaniam Nilesh Limaye Chief Financial Officer Company Secretary
Place: Pune Place: MumbaiDate: April 22, 2016 Date: April 22, 2016
Zensar Technologies Ltd | 116
2015-16 2014-15
Amount in FC (in lakhs)
Amount inINR- (in lakhs)
Amount in FC (in lakhs)
Amount in INR- (in lakhs)
Trade and other payables
AED 35.24 635.71 30.67 521.91
AUD 4.25 216.77 4.06 193.06
CHF 0.04 2.68 0.01 0.84
CNY 0.10 1.07 0.10 1.05
EUR 1.72 129.45 1.72 115.89
GBP 0.16 14.88 - -
JPY 3.69 2.18 3.69 1.93
KES 1,550.18 994.02 6.26 4.16
SGD 0.05 2.65 0.05 2.43
USD 24.67 1,634.44 10.60 662.60
ZAR 11.29 50.84 11.41 58.53
Cash and Bank balances
USD 56.25 3,726.66 8.29 518.39
GBP 5.01 478.58 - -
AED 29.64 534.68 20.61 350.75
AUD 6.30 321.06 8.73 415.09
KES 123.90 79.45 41.56 27.60
Notes to the Financial Statements as at and for the year ended March 31, 2016 (Contd.)
(H in Lakhs)
43. Segment Information
Where a financial report contains both consolidated financial statements and separate financial statements of the parent,
segment information needs to be presented only in case of consolidated financial statements. Accordingly, segment
information has been provided only in the consolidated financial statements.
44. The Company vide a Board resolution dated October 22, 2013 had resolved to liquidate its subsidiary company in Japan,
Zensar Advanced Technologies Limited (ZATL), with effect from March 31, 2014. Accordingly, the subsidiary had ceased
its operations effective March, 31 2014 and completed the liquidation as per the laws of Japan. The outstanding receivable
amounts from ZATL and the company’s investment in ZATL have been fully provided for. The Company has filed an
application with RBI and is awaiting it's approval for writing off the investments from the books of account.
45. Tax Expense for the year ended March 31, 2016 and March 31, 2015 is net of excess provision for earlier years written back
- Rs. 779 lakhs and Rs. 169 lakhs respectively.
46. Business Acquisition
On August 14, 2014, the Company had entered into a Business Undertaking Transfer Agreement for the purchase of
business from Professional Access Software Development Private Limited, an Oracle Platinum partner. The financial
statements for the year ended March 31, 2015 include the results of this acquired business for the period August, 14 2014
to March 31, 2015 (Income from Operations of Rs. 8,987.12 lakhs and Profit before taxation of Rs. 3,445.81 lakhs) and are
therefore not comparable.
47. Previous Year Figures
Previous Year Figures have been reclassified to conform to this year's classification.
Zensar Technologies Ltd | 117
FINANCIALSTATEMENTS
CONSOLIDATED

Zensar Technologies Ltd | 118

119 | Annual Report 2015-16
Independent Auditors’ Report
To the Members of Zensar Technologies
Limited
Report on the Consolidated Financial
Statements
1. We have audited the accompanying consolidated
financial statements of Zensar Technologies
Limited (“hereinafter referred to as the Holding
Company”) and its subsidiaries (the Holding
Company and its subsidiaries together referred to
as “the Group”) (refer Note 1(b) to the attached
consolidated financial statements), comprising of
the consolidated Balance Sheet as at March 31,
2016, the consolidated Statement of Profit and
Loss, the consolidated Cash Flow Statement for the
year then ended, and a summary of significant
accounting policies and other explanatory
information prepared based on the relevant records
(hereinafter referred to as “the Consolidated
Financial Statements”).
Management's Responsibility for the
Consolidated Financial Statements
2. The Holding Company's Board of Directors is
responsible for the preparat ion of these
consolidated financial statements in terms of the
requirements of the Companies Act, 2013
(hereinafter referred to as “the Act”) that give a true
and fair view of the consolidated financial position,
conso l ida ted financ ia l per fo rmance and
consolidated cash flows of the Group in accordance
with accounting principles generally accepted in
India including the Accounting Standards specified
under Section 133 of the Act read with Rule 7 of the
Companies (Accounts) Rules, 2014 and Accounting
Standard 30, Financial Instruments: Recognition
and Measurement issued by the Institute of
Chartered Accountants of India to the extent it does
not contradict any other accounting standard
referred to in Section 133 of the Act read with Rule 7
of Companies (Accounts) Rules, 2014. The Holding
Company's Board of Directors is also responsible
for ensuring accuracy of records including financial
information considered necessary for the
preparation of Consolidated Financial Statements.
The respective Board of Directors of the companies
included in the Group are responsible for
maintenance of adequate accounting records in
accordance with the provisions of the Act for
safeguarding the assets of the Group and for
preventing and detecting frauds and other
irregularities; the selection and application of
appropr ia te account ing po l ic ies ; making
judgements and estimates that are reasonable and
prudent; and the design, implementation and
maintenance of adequate internal financial controls,
that were operating effectively for ensuring the
accuracy and completeness of the accounting
records, relevant to the preparat ion and
presentation of the financial statements that give a
true and fair view and are free from material
misstatement, whether due to fraud or error, which
has been used for the purpose of preparation of the
consolidated financial statements by the Directors
of the Holding Company, as aforesaid.
Auditors' Responsibility
3. Our responsibility is to express an opinion on these
consolidated financial statements based on our
audit. While conducting the audit, we have taken
into account the provisions of the Act and the Rules
made thereunder including the accounting
standards and matters which are required to be
included in the audit report.
4. We conducted our audit in accordance with the
Standards on Auditing specified under Section
143(10) of the Act and other applicable authoritative
pronouncements issued by the Institute of
Chartered Accountants of India. Those Standards
and pronouncements require that we comply with
ethical requirements and plan and perform the audit
to obtain reasonable assurance about whether the
consolidated financial statements are free from
material misstatement.
5. An audit involves performing procedures to obtain
audit evidence about the amounts and disclosures
in the consolidated financial statements. The
procedures selected depend on the auditors'
judgement, including the assessment of the risks of
material misstatement of the consolidated financial
statements, whether due to fraud or error. In making
those risk assessments, the auditor considers
internal financial control relevant to the Holding
Company's preparation of the consolidated financial
statements that give a true and fair view, in order to
design audit procedures that are appropriate in the
circumstances. An audit also includes evaluating
the appropriateness of the accounting policies used
and the reasonableness of the accounting
estimates made by the Holding Company's Board of
Zensar Technologies Ltd | 120
Directors, as well as evaluating the overall
presentation of the consolidated financial
statements.
6. We believe that the audit evidence obtained by us
and the audit evidence obtained by the other
auditors in terms of their reports referred to in sub-
paragraph 8 of the Other Matter paragraph below, is
sufficient and appropriate to provide a basis for our
audit opinion on the consolidated financial
statements.
Opinion
7. In our opinion and to the best of our information and
according to the explanations given to us, the
aforesaid consolidated financial statements give the
information required by the Act in the manner so
required and give a true and fair view in conformity
with the accounting principles generally accepted in
India of the consolidated state of affairs of the Group
as at March 31, 2016, and their consolidated profit
and their consolidated cash flows for the year ended
on that date.
Other Matter
8. We did not audit the financial statements of 4
subsidiaries whose financial statements reflect total
assets of Rs 8,515 lakhs and net assets of Rs 1,666
lakhs as at March 31, 2016, total revenue of Rs.
13,126 lakhs, net profit of Rs 1,288 lakhs and net
cash flows amounting to Rs 2,544 lakhs for the year
ended on that date, as considered in the
consolidated financial statements. These financial
statements have been audited by other auditors
whose reports have been furnished to us by the
Management, and our opinion on the consolidated
financial statements insofar as it relates to the
amounts and disclosures included in respect of
these subsidiaries and our report in terms of sub-
section (3) of Section 143 of the Act insofar as it
relates to the aforesaid subsidiaries is based solely
on the reports of the other auditors.
Our opinion on the consolidated financial
statements and our report on Other Legal and
Regulatory Requirements below, is not modified in
respect of the above matter with respect to our
reliance on the work done and the reports of the
other auditors.
Report on Other Legal and Regulatory
Requirements
9. As required by Section 143(3) of the Act, we report,
to the extent applicable, that:
(a) We have sought and obtained all the information
and explanations which to the best of our knowledge
and belief were necessary for the purposes of our
audit of the aforesaid consolidated financial
statements.
(b) In our opinion, proper books of account as required
by law maintained by the Holding Company
including relevant records relating to preparation of
the aforesaid consolidated financial statements
have been kept so far as it appears from our
examination of those books and records.
(c) The Consolidated Balance Sheet, the Consolidated
Statement of Profit and Loss, and the Consolidated
Cash Flow Statement dealt with by this Report are in
agreement with the relevant books of account
maintained by the Holding Company including
relevant records relating to the preparation of the
consolidated financial statements.
(d) In our opinion, the aforesaid consolidated financial
statements comply with the Accounting Standards
specified under Section 133 of the Act, read with
Rule 7 of the Companies (Accounts)Rules, 2014
and Accoun t ing S tandard 30 , F inanc ia l
Instruments: Recognition and Measurement issued
by the Institute of Chartered Accountants of India to
the extent it does not contradict any other
accounting standard referred to in Section 133 of
the Act read with Rule 7 of Companies (Accounts)
Rules, 2014.
(e) On the basis of the written representations received
from the directors of the Holding Company as on
March 31, 2016 taken on record by the Board of
Directors of the Holding Company, none of the
directors of the Holding Company is disqualified as
on March 31, 2016 from being appointed as a
director in terms of Section 164 (2) of the Act.
(f) With respect to the adequacy of the internal financial
controls over financial reporting of the Holding
Company and the operating effectiveness of such
controls, refer to our separate Report in Annexure A
Independent Auditors’ Report (Contd.)
121 | Annual Report 2015-16
(g) With respect to the other matters to be included in
the Auditors' Report in accordance with Rule 11 of
the Companies (Audit and Auditors) Rules, 2014, in
our opinion and to the best of our information and
according to the explanations given to us:
i. The consolidated financial statements disclose the
impact, if any, of pending litigations as at March 31,
2016 on the consolidated financial position of the
Group. Refer Note 27 to the consolidated financial
statements.
ii. The Group had long-term contracts including
derivative contracts as at March 31, 2016 for which
there were no material foreseeable losses.
iii. There has been no delay in transferring amounts,
required to be transferred, to the Investor Education
and Protection Fund by the Holding Company
during the year ended March 31, 2016.
For Price Waterhouse
Firm Registration Number: 301112E
Chartered Accountants
Amit Borkar
Place: Pune Partner
Date: April 22, 2016 Membership No. 109846
Independent Auditors’ Report (Contd.)
Zensar Technologies Ltd | 122
Annexure A to Independent Auditors' ReportReferred to in paragraph 9(f) of the Independent Auditors' Report of even date to the members of Zensar Technologies Limited on the consolidated financial statements for the year ended March 31, 2016.
Report on the Internal Financial Controls
under Clause (i) of Sub-section 3 of
Section 143 of the Act
1. In conjunction with our audit of the consolidated
financial statements of the Company as of and for
the year ended March 31, 2016, we have audited
the internal financial controls over financial
reporting of Zensar Technologies Limited
(hereinafter referred to as “the Holding Company”)
as of that date. The Holding Company does not
have any subsidiaries incorporated in India.
Management's Responsibility for Internal
Financial Controls
2. The Board of Directors of the Holding Company are
responsible for establishing and maintaining
internal financial controls based on internal control
over financial reporting criteria established by the
Company considering the essential components of
internal control stated in the Guidance Note on Audit
of Internal Financial Controls Over Financial
Reporting issued by the Institute of Chartered
Accountants of India (ICAI). These responsibilities
inc lude the des ign, implementa t ion and
maintenance of adequate internal financial controls
that were operating effectively for ensuring the
orderly and efficient conduct of its business,
including adherence to the respective company's
policies, the safeguarding of its assets, the
prevention and detection of frauds and errors, the
accuracy and completeness of the accounting
records, and the timely preparation of reliable
financial information, as required under the Act.
Auditor's Responsibility
3. Our responsibility is to express an opinion on the
Company's internal financial controls over financial
reporting based on our audit. We conducted our
audit in accordance with the Guidance Note on
Audit of Internal Financial Controls Over Financial
Reporting (the “Guidance Note”) issued by the ICAI
and the Standards on Auditing deemed to be
prescribed under section 143(10) of the Companies
Act, 2013, to the extent applicable to an audit of
internal financial controls, both applicable to an
audit of internal financial controls and both issued by
the ICAI. Those Standards and the Guidance Note
require that we comply with ethical requirements
and plan and perform the audit to obtain reasonable
assurance about whether adequate internal
financial controls over financial reporting was
established and maintained and if such controls
operated effectively in all material respects.
4. Our audit involves performing procedures to obtain
audit evidence about the adequacy of the internal
financial controls system over financial reporting
and their operating effectiveness. Our audit of
internal financial controls over financial reporting
included obtaining an understanding of internal
financial controls over financial reporting, assessing
the risk that a material weakness exists, and testing
and evaluat ing the design and operat ing
effectiveness of internal control based on the
assessed risk. The procedures selected depend on
the auditor's judgement, including the assessment
of the risks of material misstatement of the financial
statements, whether due to fraud or error.
5. We believe that the audit evidence we have obtained,
is sufficient and appropriate to provide a basis for
our audit opinion on the Company's internal
financial controls system over financial reporting.
Meaning of Internal Financial Controls
Over Financial Reporting
6. A company's internal financial control over financial
reporting is a process designed to provide
reasonable assurance regarding the reliability of
financial reporting and the preparation of financial
statements for external purposes in accordance
with generally accepted accounting principles. A
company's internal financial control over financial
reporting includes those policies and procedures
that (1) pertain to the maintenance of records that, in
reasonable detail, accurately and fairly reflect the
transactions and dispositions of the assets of the
company; (2) provide reasonable assurance that
transactions are recorded as necessary to permit
preparation of financial statements in accordance
with generally accepted accounting principles, and
the receipts and expenditures of the company are
being made only in accordance with authorisations
of management and directors of the company; and
(3) provide reasonable assurance regarding
prevention or timely detection of unauthorised
acquisition, use, or disposition of the company's
assets that could have a material effect on the
financial statements.

123 | Annual Report 2015-16
Annexure A to Independent Auditors' Report (Contd.)
Referred to in paragraph 9(f) of the Independent Auditors' Report of even date to the members of Zensar Technologies Limited on the consolidated financial statements for the year ended March 31, 2016.
Inherent Limitations of Internal Financial
Controls Over Financial Reporting
7. Because of the inherent limitations of internal
financial controls over financial reporting, including
the possibility of collusion or improper management
override of controls, material misstatements due to
error or fraud may occur and not be detected. Also,
projections of any evaluation of the internal financial
controls over financial reporting to future periods are
subject to the risk that the internal financial control
over financial reporting may become inadequate
because of changes in conditions, or that the degree
of compliance with the policies or procedures may
deteriorate.
Opinion
8. In our opinion, the Holding Company has in all
material respects, an adequate internal financial
controls system over financial reporting and such
internal financial controls over financial reporting
were operating effectively as at March 31, 2016,
based on the internal control over financial reporting
criteria established by the Company considering the
essential components of internal control stated in
the Guidance Note on Audit of Internal Financial
Controls Over Financial Reporting issued by the
Institute of Chartered Accountants of India.
For Price Waterhouse
Firm Registration Number: 301112E
Chartered Accountants
Amit Borkar
Place: Pune Partner
Date: April 22, 2016 Membership No. 109846

Consolidated Balance Sheet As at 31st March, 2016
Zensar Technologies Ltd | 124
Note No. 2016 2015
EQUITY AND LIABILITIESShareholders' FundsShare Capital 2 4,463.14 4,432.68
Reserves and Surplus 3 1,38,116.16 1,11,268.57
1,42,579.30 1,15,701.25
Minority Interest 391.10 116.07
Non-Current LiabilitiesLong-term borrowings 4 77.45 149.49
Other Long-term liabilities 5 187.29 382.79
Long-term provisions 6 3,781.55 3,706.79
4,046.29 4,239.07
Current LiabilitiesShort-term borrowings 7 14,731.48 9,715.87
Trade Payables 8 16,429.21 13,046.96
Other current liabilities 9 21,177.08 24,257.84
Short-term provisions 10 2,928.61 6,373.31
55,266.38 53,393.98
Total 2,02,283.07 1,73,450.37
ASSETS
Non-Current AssetsFixed Assets
Tangible assets 11.a 9,362.93 8,720.82
Intangible assets 11.b 47,701.13 46,014.41
Capital work-in-progress 15.95 64.29
Intangible assets under development 150.82 78.99
57,230.83 54,878.51
Non-current investments 12 0.20 80.18
Deferred Tax Asset (Net) 13 1,130.90 1,423.00
Long-term loans and advances 14 4,034.07 4,666.87
62,396.00 61,048.56
Current AssetsCurrent Investments 15 10,155.17 9,312.42
Inventories 16 12,586.66 12,262.25
Trade Receivables 17 54,274.52 45,388.35
Cash and Bank Balances 18 28,440.93 19,724.59
Short-term loans and advances 19 10,715.86 8,672.96
Other current assets 20 23,713.93 17,041.24
1,39,887.07 1,12,401.81
Total 2,02,283.07 1,73,450.37
Summary of Significant Accounting Policies 1
The accompanying notes (1 to 40) are an integral part of consolidated financial statements
This is the Consolidated Balance Sheet referred to in our report of even date.
(All amounts in Rs. Lakhs, unless otherwise stated)
For Price Waterhouse For and on behalf of the Board of Directors of Firm Registration Number: 301112E Zensar Technologies Limited Chartered Accountants
Amit Borkar H.V. Goenka Sandeep KishorePartner Chairman Managing Director & CEOMembership No. 109846 DIN: 00026726 DIN: 07393680
S. Balasubramaniam Nilesh Limaye Chief Financial Officer Company Secretary
Place: Pune Place: MumbaiDate: April 22, 2016 Date: April 22, 2016
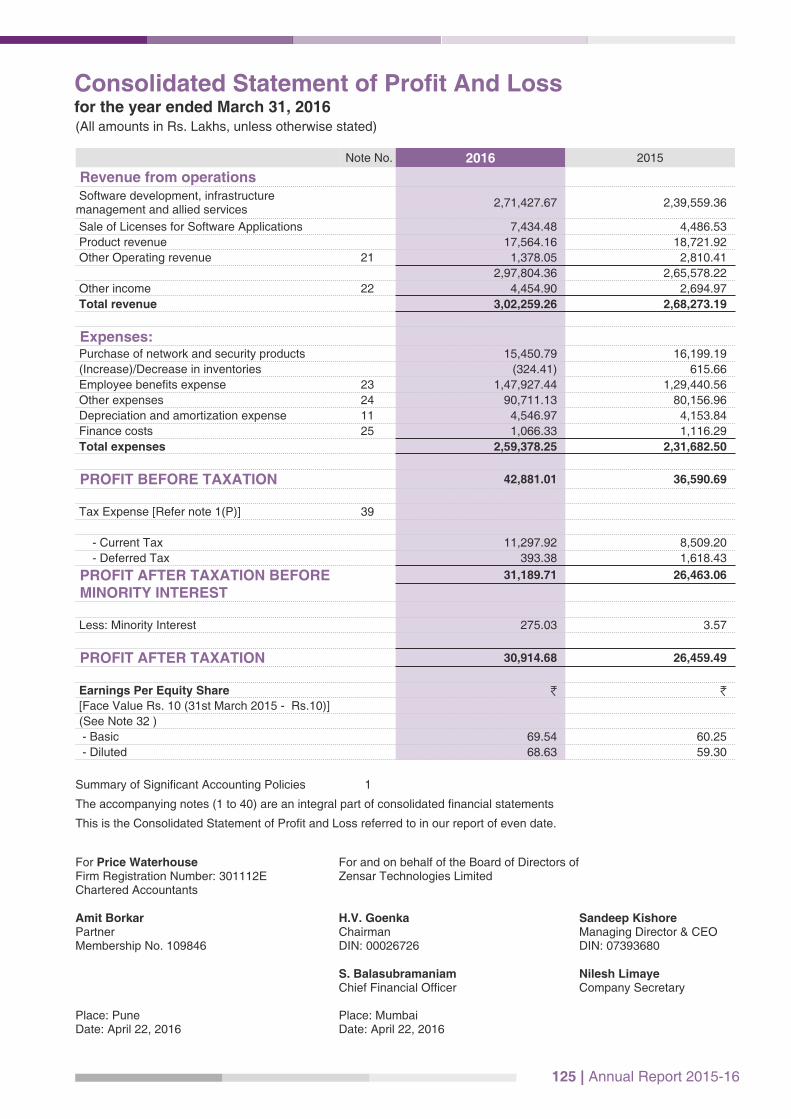
125 | Annual Report 2015-16
(All amounts in Rs. Lakhs, unless otherwise stated)
Note No. 2016 2015
Revenue from operations Software development, infrastructure management and allied services
2,71,427.67 2,39,559.36
Sale of Licenses for Software Applications 7,434.48 4,486.53
Product revenue 17,564.16 18,721.92
Other Operating revenue 21 1,378.05 2,810.41
2,97,804.36 2,65,578.22
Other income 22 4,454.90 2,694.97
Total revenue 3,02,259.26 2,68,273.19
Expenses: Purchase of network and security products 15,450.79 16,199.19
(Increase)/Decrease in inventories (324.41) 615.66
Employee benefits expense 23 1,47,927.44 1,29,440.56
Other expenses 24 90,711.13 80,156.96
Depreciation and amortization expense 11 4,546.97 4,153.84
Finance costs 25 1,066.33 1,116.29
Total expenses 2,59,378.25 2,31,682.50
PROFIT BEFORE TAXATION 42,881.01 36,590.69
Tax Expense [Refer note 1(P)] 39
- Current Tax 11,297.92 8,509.20
- Deferred Tax 393.38 1,618.43
PROFIT AFTER TAXATION BEFORE MINORITY INTEREST
31,189.71 26,463.06
Less: Minority Interest 275.03 3.57
PROFIT AFTER TAXATION 30,914.68 26,459.49
Earnings Per Equity Share H H [Face Value Rs. 10 (31st March 2015 - Rs.10)]
(See Note 32 )
- Basic 69.54 60.25
- Diluted 68.63 59.30
Summary of Significant Accounting Policies 1
The accompanying notes (1 to 40) are an integral part of consolidated financial statements
This is the Consolidated Statement of Profit and Loss referred to in our report of even date.
Consolidated Statement of Profit And Loss for the year ended March 31, 2016
For Price Waterhouse For and on behalf of the Board of Directors of Firm Registration Number: 301112E Zensar Technologies Limited Chartered Accountants Amit Borkar H.V. Goenka Sandeep KishorePartner Chairman Managing Director & CEOMembership No. 109846 DIN: 00026726 DIN: 07393680 S. Balasubramaniam Nilesh Limaye Chief Financial Officer Company Secretary
Place: Pune Place: MumbaiDate: April 22, 2016 Date: April 22, 2016
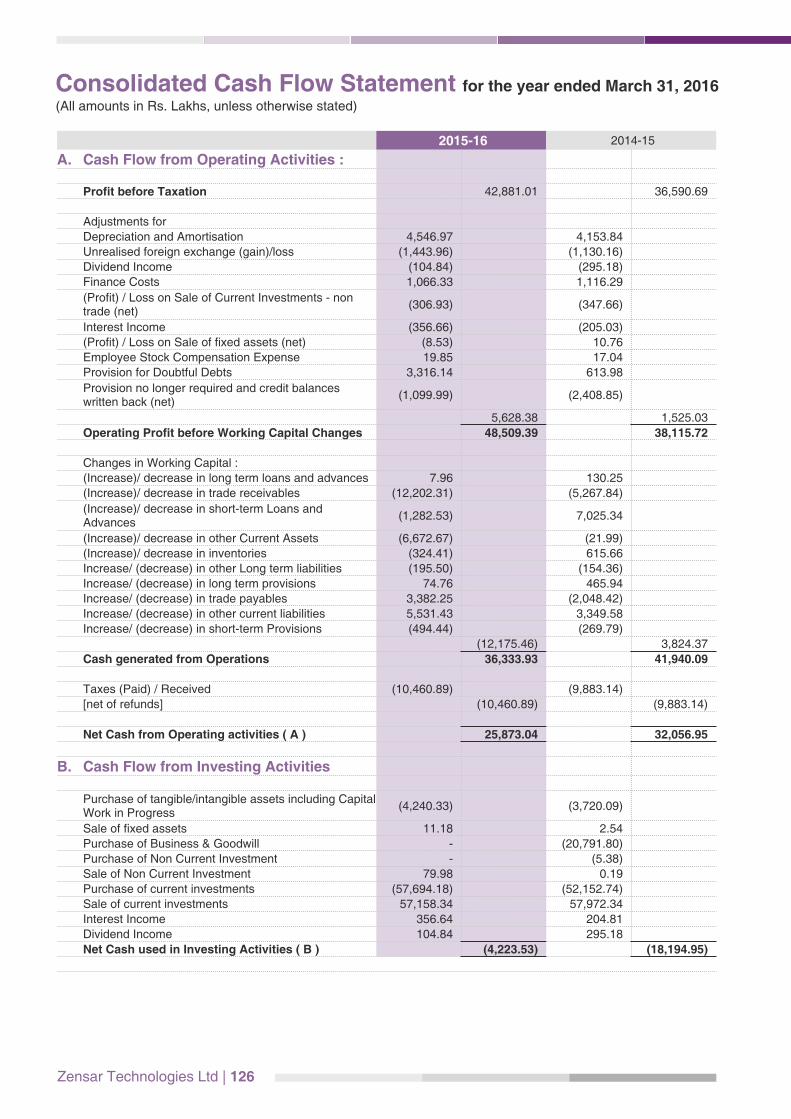
Zensar Technologies Ltd | 126
(All amounts in Rs. Lakhs, unless otherwise stated)
Consolidated Cash Flow Statement for the year ended March 31, 2016
2015-16 2014-15
A. Cash Flow from Operating Activities :
Profit before Taxation 42,881.01 36,590.69
Adjustments for
Depreciation and Amortisation 4,546.97 4,153.84
Unrealised foreign exchange (gain)/loss (1,443.96) (1,130.16)
Dividend Income (104.84) (295.18)
Finance Costs 1,066.33 1,116.29
(Profit) / Loss on Sale of Current Investments - non trade (net)
(306.93) (347.66)
Interest Income (356.66) (205.03)
(Profit) / Loss on Sale of fixed assets (net) (8.53) 10.76
Employee Stock Compensation Expense 19.85 17.04
Provision for Doubtful Debts 3,316.14 613.98
Provision no longer required and credit balances written back (net)
(1,099.99) (2,408.85)
5,628.38 1,525.03
Operating Profit before Working Capital Changes 48,509.39 38,115.72
Changes in Working Capital :
(Increase)/ decrease in long term loans and advances 7.96 130.25
(Increase)/ decrease in trade receivables (12,202.31) (5,267.84)
(Increase)/ decrease in short-term Loans and Advances
(1,282.53) 7,025.34
(Increase)/ decrease in other Current Assets (6,672.67) (21.99)
(Increase)/ decrease in inventories (324.41) 615.66
Increase/ (decrease) in other Long term liabilities (195.50) (154.36)
Increase/ (decrease) in long term provisions 74.76 465.94
Increase/ (decrease) in trade payables 3,382.25 (2,048.42)
Increase/ (decrease) in other current liabilities 5,531.43 3,349.58
Increase/ (decrease) in short-term Provisions (494.44) (269.79)
(12,175.46) 3,824.37
Cash generated from Operations 36,333.93 41,940.09
Taxes (Paid) / Received (10,460.89) (9,883.14)
[net of refunds] (10,460.89) (9,883.14)
Net Cash from Operating activities ( A ) 25,873.04 32,056.95
B. Cash Flow from Investing Activities
Purchase of tangible/intangible assets including CapitalWork in Progress
(4,240.33) (3,720.09)
Sale of fixed assets 11.18 2.54
Purchase of Business & Goodwill - (20,791.80)
Purchase of Non Current Investment - (5.38)
Sale of Non Current Investment 79.98 0.19
Purchase of current investments (57,694.18) (52,152.74)
Sale of current investments 57,158.34 57,972.34
Interest Income 356.64 204.81
Dividend Income 104.84 295.18
Net Cash used in Investing Activities ( B ) (4,223.53) (18,194.95)

127 | Annual Report 2015-16
(All amounts in Rs. Lakhs, unless otherwise stated)
2015-16 2014-15
C. Cash Flow from Financing Activities
Proceeds from share allotment under Employee Stock Option Schemes
424.82 617.55
Proceeds / (Repayment) of Short-term borrowings 4,984.57 4,838.86
Proceeds / (Repayment) of long-term borrowings (7,643.39) (7,544.07)
Interest and Structuring Fee payment (1,090.79) (1,241.14)
Dividend on Equity Shares and Tax Thereon (9,692.00) (5,415.51)
Net Cash used in Financing Activities ( C ) (13,016.79) (8,744.31)
D. Net Increase/(Decrease) in Cash and Cash Equivalents (A+B+C) 8,632.72 5,117.69
Opening Balance of Cash & Cash Equivalents 19,599.84 14,482.15
Closing Balance of Cash & Cash Equivalents 28,232.56 19,599.84
Consolidated Cash Flow Statement for the year ended March 31, 2016
Notes :
1 The above Consolidated Cash Flow Statement has been prepared under the "Indirect Method" set out in Accounting
Standard 3 on Cash Flow Statements.
2 Prior year comparatives have been reclassified to conform with current year's presentation, where applicable.
3 Cash and cash equivalents comprise of:
2015-16 2014-15 2013-14
Cash on Hand 7.96 7.00 6.20
Balances with Banks 28,224.60 19,592.84 14,475.95
Total 28,232.56 19,599.84 14,482.15
(H in lakhs)
The accompanying notes (1 to 40) are an integral part of the Consolidated Cash Flow Statement.
This is the Consolidated Cash Flow Statement referred to in our report of even date.
For Price Waterhouse For and on behalf of the Board of Directors of Firm Registration Number: 301112E Zensar Technologies Limited Chartered Accountants Amit Borkar H.V. Goenka Sandeep KishorePartner Chairman Managing Director & CEOMembership No. 109846 DIN: 00026726 DIN: 07393680 S. Balasubramaniam Nilesh Limaye Chief Financial Officer Company Secretary
Place: Pune Place: MumbaiDate: April 22, 2016 Date: April 22, 2016
Zensar Technologies Ltd | 128
Notes to the Consolidated Financial Statementsas at and for the year ended March 31, 2016
Company overview
Zensar Technologies Limited (the "Company") along
with its wholly owned and controlled subsidiaries
Zensar Technologies Inc., Zensar Technologies (UK)
Limited, Zensar Technologies (Singapore) Pte.
Limited, Zensar Technologies (Shanghai) Company
Limited, PSI Holding Group Inc., Zensar Technologies
IM Inc., Zensar Technologies IM B.V., Aquila
Technology Corp., Zensar (Africa) Holdings Pty
Limited, Zensar (South Africa) Pty Limited and
Professional Access Limited (effective from August 14,
2014) is engaged in providing a complete range of IT
Services and Solutions. The Company's industry
expertise spans across Manufacturing, Retail, Media,
Banking, Insurance, Healthcare and Utilities. The
Company is public limited company and is listed on the
Bombay Stock Exchange (BSE) and the National Stock
Exchange (NSE).
1. Summary of Significant Accounting
Policies
(a) Basis of preparation
The Financial Statements of the Company and
its subsidiaries have been prepared in
accordance with generally accepted accounting
principles in India under historical cost
convention as a going concern on accrual basis.
Pursuant to Section 133 of the Companies Act,
2013 read with rule 7 of the Companies
(Accounts) Rules, 2014, till the standards of
accounting or any addendum thereto are
prescr ibed by Cent ra l Government in
consultation and recommendation of the
National Financial Reporting Authority, the
existing Accounting Standards notified under the
Companies Act, 1956 shall continue to apply.
Consequently these Financial Statements have
been prepared to comply in all material aspects
with the Accounting Standards notified under
section 211(3C) [Companies (Accounting
Standard) Rules, 2006, as amended] and other
relevant provisions of the Companies Act, 2013.
The Ministry of Corporate Affairs (MCA) has
notified the Companies (Accounting Standards)
Amendment Rules, 2016 vide its notification
dated 30th March 2016. The said notification
read with Rule 3(2) of the Companies
(Accounting Standards) Rules, 2006 is
applicable to accounting period commencing on
or after the date of notification i.e. 1 April 2016
and has therefore not been considered for year
ended March 31, 2016.
All assets and liabilities have been classified as
current or non-current as per the Company's
normal operating cycle and other criteria set out
in the Schedule III of the Companies Act, 2013.
Based on the nature of products and services
and their realisation in cash and cash
equivalents, the Company has ascertained its
operating cycle as 12 months for the purpose of
current and non-current classification of assets
and liabilities.
(b) Principles of Consolidation
The Consolidated Financial Statements of
Zensar Technologies Limited and its foreign
subsidiaries are prepared in accordance with
generally accepted accounting principles
applicable in India and the existing Accounting
Standard 21 on Consolidated Financial
Statements notified under section 211 (3C)
[ C o m p a n i e s ( A c c o u n t i n g S t a n d a r d s )
Rules,2006, as amended] till the standards of
accounting or any addendum thereto are
prescr ibed by Cent ra l Government in
consultation and recommendation of the
National Financial Reporting Authority Pursuant
to Section 133 of the Companies Act, 2013 read
with rule 7 of the Companies (Accounts) Rules,
2014 and other relevant provisions of the
Companies Act, 2013 as applicable, in the same
format as that adopted by the parent Company
(Zensar Technologies Limited) for its separate
financial statements.
The Consolidated Financial Statements relate to
Zensar Technologies Limited ('the Company')
and its subsidiaries (collectively referred to as
'the Group'). The Consolidated financial
statements are prepared using uniform
accounting policies for similar transactions to the
extent in similar circumstances.
Subsidiaries: Subsidiaries are consolidated from
the date on which control is transferred to the
group and are not consolidated from the date
that control ceases. The financial statements of
the company and its subsidiaries have been
consolidated on a line-by-line basis by adding
together like items of assets, liabilities, income
and expenses. Intra group balances and intra
group transactions and resulting unrealised
profits have been eliminated.

129 | Annual Report 2015-16
Notes to the Consolidated Financial Statementsas at and for the year ended March 31, 2016 (Contd.)
List of foreign subsidiaries considered in the consolidated financial statements
Sr. No.
Name of the subsidiaryCountry of
IncorporationExtent of holding ason March 31, 2016
Extent of holding ason March 31, 2015
1 Zensar Technologies Inc. [ZTI] USA 100% 100%
Subsidiaries of Zensar Technologies Inc.
I) PSI Holding Group, Inc. USA 100% 100%
- Subsidiaries of PSI Holding Group Inc.
a Zensar Technologies IM, Inc USA 100% 100%
b Aquila Technology Corp. USA 100% 100%
c Zensar Technologies IM, B.V. Netherlands 100% 100%
II) Professional Access Ltd. USA 100%100% (w.e.f. 14August, 2014)
2 Zensar Technologies (Singapore) Pte Ltd Singapore 100% 100%
3Zensar Technology (Shanghai) Company Limited
People's Republic of China
100% 100%
4 Zensar Technologies (UK) Limited UK 100% 100%
5 Zensar (Africa) Holdings Pty Ltd. South Africa 100% 100%
- Subsidiary of Zensar (Africa) Holdings Pty Ltd.
a Zensar (South Africa) Pty Ltd. South Africa 75% 75%
6 Zensar Advance Technologies Limited Japan Refer Note 37 Refer Note 37
(c) Use of estimates
The preparation of financial statements in
conformity wi th Indian GAAP requires
Managemen t t o make es t ima tes and
assumptions that affect the reported amounts of
assets and liabilities, the disclosure of contingent
liabilities on the date of the financial statements
and the reported amounts of revenues and
expenses during the period. Actual results could
differ from these estimates. Any revision to
a c c o u n t i n g e s t i m a t e s i s r e c o g n i s e d
prospectively in the current and future periods.
(d) Revenue Recognition
i) Revenues from software maintenance,
development and allied services consist of
revenues earned from time-and-material,
fixed timeframe and fixed price contracts.
(a) Revenue from time and material contracts
are recognised as the related services are
performed.
(b) Revenues from fixed price contracts are
recognized using the proportionate
completion method. The cumulative
impact of any revision in estimates of the
stage of completion is reflected in the
period in which the change becomes
known. Provisions for estimated losses on
such engagements are made during the
period in which such losses becomes
probable and can be reasonably
estimated. However, where the ultimate
collection of the sale lacks reasonable
cer ta inty , revenue recogni t ion is
postponed to the extent of such
uncertainty. Amounts included in the
financial statements, which relate to
recoverable costs and accrued profits not
yet billed on contracts, are included in
other current assets as Accrued Income
(Unb i l l ed Se rv i ces ) . B i l l i ngs on
incomplete contracts in excess of accrued
costs and accrued profits are included in
other current liabilities as Deferred
Revenue.
(c) Revenue from the sale of user licenses for
software applications is recognised on
transfer of the title in the user license.
ii) IT Infrastructure services
Revenue from sale of products is recognized
when risk and reward of ownership have
been transferred to the customer, the sale
p r i ce i s fixed o r de te rminab le and
collectability is reasonably assured. Revenue
related to products with installation services
that are critical to the products is recognized
when installation of networking equipment at
customer site is completed and accepted by
the customer.

Zensar Technologies Ltd | 130
Revenue from IT hardware maintenance,
outsourcing and other support services for
data centers is typically billed in advance,
deferred and recognized ratably over the
service period. Contract period is generally
one year.
iii) Revenues from product sale are recognized
upon shipment as the Company has no future
obligation. The Company also enters into
multiple deliverable arrangements where
company provides telephone support in
addition to products and services of OEM, the
entire revenue is deferred and recognized
ratably over the telephone support service
period, generally one year, as the Company
has not established fair value of telephone
support services.
The Company accounts for volume discounts
to customers as a reduction of revenue based
on the ratable allocation of discount amount
to each o f the under ly ing revenue
transactions that result in progress by the
customer towards earning the discount. Also,
when the level of discount varies with
increases in levels of revenue transactions,
the Company recognises the liability based
on its estimate of the customer's future
purchases. If it is probable that the criteria for
the discount will not be met, or if the amount
thereof cannot be estimated reliably, then the
discount is not recognised until the payment
is probable and the amount can be estimated
reliably. The Company recognises changes
in the estimated amount of obligations for
discounts using a cumulative catch-up
approach. The discounts are passed on to
the customer or as a reduction of payments
due from the customer.
Amounts included in the financial statements,
which relate to recoverable costs and
accrued profits not yet billed on contracts, are
classified in current assets as Accrued
Income (Unbilled Services). Billings on
incomplete contracts in excess of accrued
costs and accrued profits are classified in
current liabilities as Deferred Revenue (Billed
in Advance).
(e) Other Income
(i) Profit on sale of investments is recorded
on transfer of title from the Company and
is determined as the difference between
the sale price and the then carrying
amount of the investment.
(ii) Dividend income is recognised when the
Company's right to receive dividend is
established.
(iii) Interest income on time deposits is
recognised using the time proportion
basis taking into account the amount
outstanding and applicable interest rates.
(f) Tangible Assets
Tangible assets are stated at acquisition cost
less accumulated depreciation. Cost of tangible
assets comprises purchase price, duties, levies
and any directly attributable costs of bringing the
asset to its working conditions for the intended
use, net of refundable taxes.
Subsequent expenditures related to an item of
fixed asset are added to its book value only if
they increase the future benefits from the
existing asset beyond its previously assessed
standard of performance.
Items of fixed assets that have been retired from
active use and are held for disposal are stated at
the lower of their net book value and net
realisable value and are shown separately in the
financial statements. Any expected loss is
recognised immediately in the Statement of
Profit and Loss.
Losses arising from the retirement of, and gains
or losses arising from disposal of fixed assets
which are carried at cost are recognised in the
Statement of Profit and Loss.
(g) Intangible Assets
Intangib le assets are recorded at the
consideration paid for acquisition. Internally
generated intangible asset arising from
development activity is recognised at cost on
demonstration of its technical feasibility, the
intention and ability of the Company to complete,
use or sell it, only if, it is probable that the asset
would generate future economic benefit and the
expenditure attributable to the said assets during
its development can be measured reliably.
Intangible assets are carried at cost less
accumulated amortization.
Goodwill arising on acquisition of business is
presented as an intangible asset. Goodwill
comprises the excess of purchase consideration
Notes to the Consolidated Financial Statementsas at and for the year ended March 31, 2016 (Contd.)

131 | Annual Report 2015-16
over the carrying value of the net assets of the
acquired business.
(h) Depreciation and Amortisation
Depreciation on fixed assets is computed on a
straight-line method as per the useful lives
prescribed under Schedule II of the Companies
Act, 2013 except in respect of the following
assets (based on technical evaluation) refer note
11:
Class of AssetsUseful Life as per prescribed in Schedule II
Useful Life as followed by the
Company
Server and Networking Equipment
6 Years 4 Years
Intangible assets are amortized on straight line basis
over their estimated useful lives:
Class of Assets Useful Life
Intangible Assets – Software (Acquired) 1-5 Years
Goodwill (Acquired) 5 Years
Technical Know-how (Internally generated) 3 Years
(i) Leases
Finance Lease
As a lessee:
Asse ts acqu i red under finance lease
agreements are capitalised at the inception of
lease, at lower of the fair value and present value
of minimum lease payments, and a liability is
created for an equivalent amount. Lease rentals
are allocated between the liability and the
Finance cost, so as to obtain a uniform periodic
rate of interest on the outstanding liability for
each period. The outstanding liability is included
in borrowings. The Finance cost is charged to the
Statement of Profit and Loss over the lease
period.
Operating Lease
As a lessee:
Lease arrangements under which all risks and
rewards of ownership are effectively retained by
the lessor are classified as operating lease.
Payments made under operating leases are
charged to the Statement of Profit and Loss on
straight line basis over the period of lease.
(j) Impairment
The assessment is done at each Balance Sheet
date as to whether there is any indication that an
asset (tangible and intangible) may be impaired.
For the purpose of assessing impairment, the
smallest identifiable group of assets that
generates cash inflows from continuing use that
are largely independent of the cash inflows from
other assets or groups of assets, is considered
as a cash generating unit. If any such indication
exists, an estimate of the recoverable amount of
the asset/cash generating unit is made. Assets
whose carrying value exceeds their recoverable
amount are written down to the recoverable
amount. Recoverable amount is higher of an
asset's or cash generating unit's net selling price
and its value in use. Value in use is the present
value of estimated future cash flows expected to
arise from the continuing use of an asset and
from its disposal at the end of its useful life.
(k) Investments
Investments that are readily realisable and are
intended to be held for not more than one year
from the date, on which such investments are
made, are classified as current investments. All
other investments are classified as long term
investments. Current investments are carried at
cost or fair value, whichever is lower. Long-term
investments are carried at cost. However,
provision for diminution is made to recognise a
decline, other than temporary, in the value of the
investments, such recognition being determined
and made for each investment individually.
(l) Employee Retirement Benefits
i) Prov ident Fund - P rov iden t Fund
con t r ibu t ions a re made to a T rus t
administered by the Company. The
Company's liability is actuarially determined
(using the Projected Unit Credit method) at
the end of the year. Actuarial losses/ gains
are recognised in the Statement of Profit and
Loss in the year in which they arise.
The contributions made to the trust are
recognised as plan assets. The defined
benefit obligation recognised in the balance
sheet represents the present value of the
defined benefit obligation as reduced by the
fair value of plan assets.
ii) Gratuity - The Company provides for
gratuity, a defined benefit plan (the “Gratuity
Plan”) covering eligible employees in
accordance with the Scheme. The Gratuity
Plan provides a lump sum payment to vested
Notes to the Consolidated Financial Statementsas at and for the year ended March 31, 2016 (Contd.)

Zensar Technologies Ltd | 132
e m p l o y e e s a t r e t i r e m e n t d e a t h ,
incapacitation or termination of employment,
of an amount based on the respective
employee's salary and the tenure of
employment. The Company's liability is
actuarially determined (using the Projected
Unit Credit method) at the end of each year.
Actuarial losses/ gains are recognised in the
Statement of Profit and Loss in the year in
which they arise.
The retirement benefit obligation recognised
in the Balance Sheet represents the present
value of the defined benefit obligation as
adjusted for unrecognised past service cost,
and as reduced by the fair value of scheme
assets. Any asset resulting from this
calculation is limited to the present value of
available refunds and reductions in future
contributions to the scheme.
iii) Superannuation - The Company has
Defined Contribution Plans for Post-
employment benefits for eligible employees
in the form of Superannuation Fund
administered by the L i fe Insurance
Corporation of India.
The Company has Defined Contribution
Plans for Post-employment benefits for all
employees in the form of Family Pension
Fund administered by Regional Provident
Fund Commissioner.
These funds are classified as defined
contribution plans as the Company has no
further obligation beyond making the
contributions. The Company's contributions
to Defined Contribution Plans are charged to
the Statement of Profit and Loss as and when
incurred.
iv) Compensated Absence - Accumulated
compensated absences, which are expected
to be availed or encashed within 12 months
from the end of the year end are treated as
short term employee benefits. The obligation
towards the same is measured at the
expected cost of accumulating compensated
absences as the additional amount expected
to be paid as a result of the unused
entitlement as at the year end. Accumulated
compensated absences, which are expected
to be availed or encashed beyond 12 months
from the end of the year are treated as other
long term employee benefits. The Company's
liability is actuarially determined (using the
Projected Unit Credit method) at the end of
each year. Actuarial losses/ gains are
recognised in the Statement of Profit and
Loss in the year in which they arise.
v) Social Security Fund – The Company has
Defined Contribution Plans for Post-
employment benefits (i) for all eligible
employees in the USA, governed by USA
laws in the form of 401(k) Fund and Social
Security Fund, ii) for all eligible employees in
the UK, governed by UK laws in the form of
NIC. These plans are classified as defined
contribution plans as the Company has no
further obligation beyond making the
contributions as per plan. The Company's
contributions to Defined Contribution Plans
are charged to the Statement of Profit and
Loss as and when incurred.
(m)Foreign Currency Translations
i) On initial recognition, all foreign currency
transactions are recorded by applying to the
foreign currency amount the exchange rate
between the reporting currency and the
foreign currency at the date of the
transaction.
ii) As at the reporting date, non-monetary items
which are carried in terms of historical cost
denominated in a foreign currency are
reported using the exchange rate at the date
of the transaction.
iii) Monetary assets and monetary liabilities
denominated in foreign currency at the year-
end are translated at the year-end exchange
rates, and the resulting exchange differences
are recognised in the Statement of Profit and
Loss, except for the exchange differences
arising on monetary items that, in substance,
form a part of the Company's net investment
in non-integral foreign operation, which are
accumulated in a Foreign Currency
Translation Reserve until the disposal of net
investment.
iv) Foreign operations are classified as either
'integral' or 'non-integral' operations.
Exchange differences arising on monetary
items that, in substance, form part of an
enterprise's net investment in a non-integral
foreign operation are accumulated in the
Notes to the Consolidated Financial Statementsas at and for the year ended March 31, 2016 (Contd.)
133 | Annual Report 2015-16
Foreign Currency Translation Reserve until
the disposal of the net investment, at which
time they are recognised as income or as
expenses. The Financial statements of an
integral foreign operation are translated
using the principles and procedures as if the
translations of the foreign operation are those
of the Company itself.
(n) Financial Instruments
The Company early adopted Accounting
Standard (AS) 30 “Financial Instruments:
Recognition and Measurement” issued by the
Institute of Chartered Accountants of India,
along with the consequent limited revisions to
other accounting standards, except so far as
they are in conflict with other mandatory
accounting standards and other regulatory
requirements.
Derivative Financial Instruments
The Company uses foreign exchange forward
contracts to hedge its exposure to movements in
foreign exchange rates. The use of these foreign
exchange forward contracts reduces the risk or
cost to the Company and the Company does not
use the foreign exchange forward contracts for
trading or speculation purposes.
Forward contracts are fair valued at each
reporting date. Changes in the fair values of
forward contracts designated as cash flow
hedges are recognized directly in the Hedging
Reserve Account and reclassified into the
Statement of Profit and Loss upon the
occurrence of the hedged transaction. Changes
in fair value relating to the ineffective portion of
the hedges and derivatives not designated as
hedges are recognised in the Statement of Profit
and Loss as they arise.
Non - Derivate Financial Instruments
A financial instrument is any contract that gives
rise to a financial asset of one entity and a
financial liability or equity instrument of another
entity. Financial assets of the Company mainly
include cash and bank balances, trade
receivables, accrued income (unbilled services),
employee travel and other advances, other loans
and advances and der ivat ive financial
instruments with a positive fair value. Financial
liabilities of the Company mainly comprise trade
payables, accrued expenses, bank borrowings
and derivative financial instruments with a
negative fair value. Financial assets / liabilities
are recognized on the Balance Sheet when the
Company becomes a party to the contractual
provisions of the instrument.
The Company assesses at each Balance Sheet
date whether there is any objective evidence that
a financial asset or group of financial assets is
impaired. If any such indication exists, the
Company estimates the amount of impairment
loss as the difference between the assets
carrying amount and undiscounted amount of
future cash flows, which is recognised in the
Statement of Profit and Loss.
The Company measures the short–term
payables with no stated rate of interest at original
invoice amount, if the effect of discounting is
immaterial.
(o) Employee Stock Option Schemes
Stock options granted to employees under
Employee Stock Option 2002 Scheme and
Employee Stock Option 2006 Scheme are
accounted as per the accounting treatment
prescribed by the guidance note on employee
share based payment issued by The Institute of
Chartered Accountant of India as required by the
Securities and Exchange Board of India (Share
based employee benefits) Regulations, 2014.
Accordingly, the intrinsic value of the option
being the excess of the market value of the stock
options as on the date of the grant over the
exercise price of the options is recognised as
deferred employee compensation and is
charged to Statement of Profit and Loss over the
vesting period. In the case of graded vesting, the
vesting period is determined separately for each
portion of the option. The unamortised portion of
the cost is shown under “Reserves and Surplus”.
(P) Taxation
Current Tax
Current tax is measured at the amount expected
to be paid to the tax authorities in accordance
with the taxation laws prevailing in the respective
jurisdictions.
Current tax assets and current tax liabilities are
offset when there is a legally enforceable right to
set off the recognised amounts and there is an
intention to settle the asset and the liability on a
net basis.
Notes to the Consolidated Financial Statementsas at and for the year ended March 31, 2016 (Contd.)
Zensar Technologies Ltd | 134
Deferred Tax
Deferred tax for timing differences between the
book profits and tax profits is accounted for using
the tax rates and laws that have been enacted or
substantively enacted as of the Balance Sheet
date. Deferred tax assets arising from the timing
differences are recognised to the extent there is
reasonable certainty that sufficient future taxable
income will be available against which such
deferred tax assets can be realised.
Deferred tax assets are recognised for tax loss
and depreciation carried forward to the extent
that the realisation of the related tax benefit
through the future taxable profits is virtually
certain and is supported by convincing evidence
that sufficient future taxable profits can be
realised.
Deferred tax assets and deferred tax liabilities
are offset when there is a legally enforceable
right to set off assets against liabilities
representing current tax and where the deferred
tax assets and the deferred tax liabilities relate to
taxes on income levied by the same governing
taxation laws.
Minimum Alternative Tax (MAT)
Minimum Alternative Tax (MAT) credit is
recognized as an asset only when and to the
extent there is convincing evidence that the
Company will pay income tax higher than that
computed under MAT, during the period that
MAT is permitted to be set off under the Income
Tax Act, 1961 (specified period). In the year, in
which the MAT credit comes eligible to be
recognized as an asset in accordance with the
recommendations contained in the guidance
note issued by the ICAI, the said asset is created
by way of a credit to the Statement of Profit and
Loss and shown as MAT credit entitlement. The
Company reviews the same at each Balance
Sheet date and writes down the carrying amount
of MAT credit entitlement to the extent there is no
longer convincing evidence to the effect that the
Company will pay income tax higher than MAT
during the specified period.
(q) Cash & Cash Equivalents
In the cash flow statement, cash and cash
equivalents includes cash in hand, demand
deposits with banks, other short-term highly
liquid investments with original maturities of
three months or less.
(r) Consolidated Cash Flow Statement
Cash flow are reported using the "Indirect
Method", whereby consolidated net profit before
tax is adjusted for the effects of transactions of
non-cash nature and any deferrals or accruals of
past or future cash receipts or payments. The
cash flow from operating, investing and financing
activities of the group are segregated.
(s) Earnings per share
The basic earnings per share is computed by
dividing the net profit for the period attributable to
equity shareholders by the weighted average
number of equity shares outstanding during the
period. The number of shares used in computing
diluted earnings per share comprises the
weighted average shares considered for
deriving basic earnings per share and also the
weighted average number of equity shares
which would have been issued on the conversion
of all dilutive potential equity shares. Dilutive
potential equity shares are deemed converted as
of the beginning of the period unless they have
been issued at a later date.
(t) Goodwill
The excess of cost to the Company of its
investments in the subsidiaries over its share in
the equity of the subsidiaries, at the dates on
which the investments in the subsidiaries are
made, is recognized as 'Goodwill' being an asset
in the consolidated financial statements.
Goodwill arising on consolidation is not
amortised. Goodwill arising on purchase of
business is recorded at the excess of the
purchase price over the net assets taken over of
the business and is amortised over five years.
Goodwill is reviewed for impairment whenever
events or changes in business circumstances
indicate that the carrying amount of the assets
may not be fully recoverable. If impairment is
indicated, the asset is written down to its fair
value.
(u) Inventories
Inventories are valued at lower of cost and net
realizable value including necessary provision
for obsolescence. Cost is determined using
weighted average method. Cost of inventories
comprises of all costs of purchase and other
costs incurred in bringing the inventories to their
present location and condition.
Notes to the Consolidated Financial Statementsas at and for the year ended March 31, 2016 (Contd.)
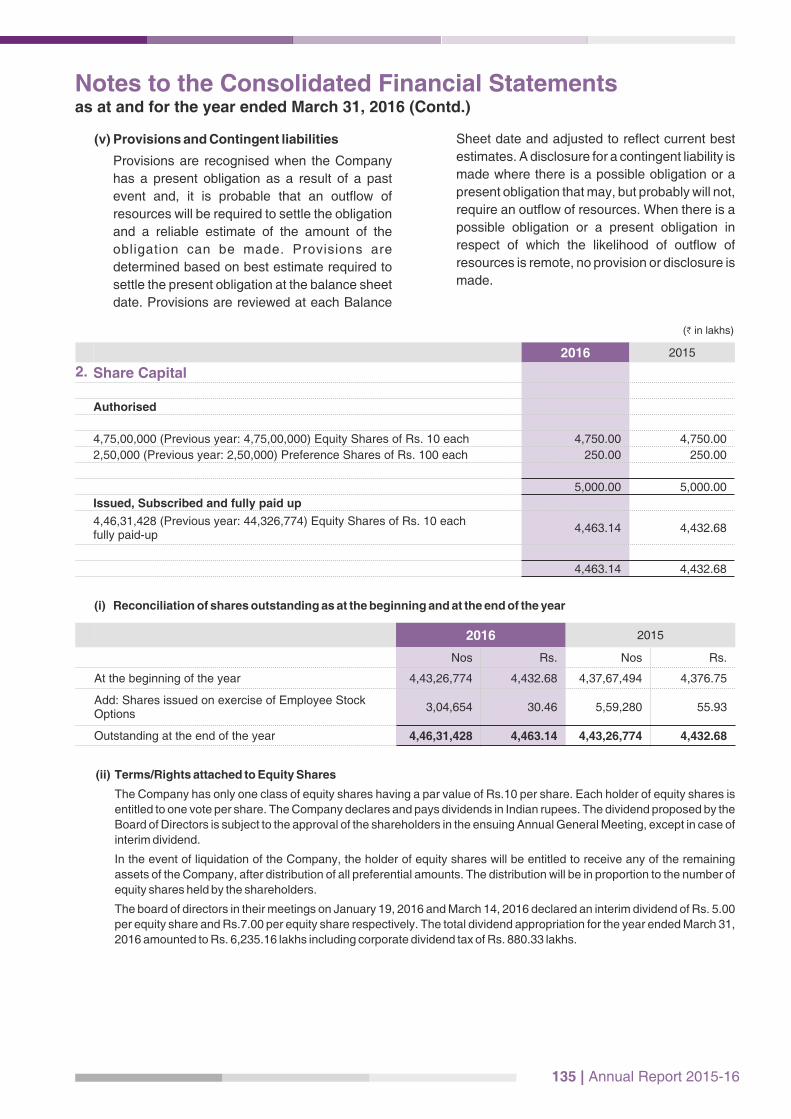
135 | Annual Report 2015-16
(v) Provisions and Contingent liabilities
Provisions are recognised when the Company
has a present obligation as a result of a past
event and, it is probable that an outflow of
resources will be required to settle the obligation
and a reliable estimate of the amount of the
obligation can be made. Provisions are
determined based on best estimate required to
settle the present obligation at the balance sheet
date. Provisions are reviewed at each Balance
Sheet date and adjusted to reflect current best
estimates. A disclosure for a contingent liability is
made where there is a possible obligation or a
present obligation that may, but probably will not,
require an outflow of resources. When there is a
possible obligation or a present obligation in
respect of which the likelihood of outflow of
resources is remote, no provision or disclosure is
made.
Notes to the Consolidated Financial Statementsas at and for the year ended March 31, 2016 (Contd.)
2016 2015
2. Share Capital
Authorised
4,75,00,000 (Previous year: 4,75,00,000) Equity Shares of Rs. 10 each 4,750.00 4,750.00
2,50,000 (Previous year: 2,50,000) Preference Shares of Rs. 100 each 250.00 250.00
5,000.00 5,000.00
Issued, Subscribed and fully paid up
4,46,31,428 (Previous year: 44,326,774) Equity Shares of Rs. 10 each fully paid-up
4,463.14 4,432.68
4,463.14 4,432.68
(H in lakhs)
(i) Reconciliation of shares outstanding as at the beginning and at the end of the year
2016 2015
Nos Rs. Nos Rs.
At the beginning of the year 4,43,26,774 4,432.68 4,37,67,494 4,376.75
Add: Shares issued on exercise of Employee Stock Options
3,04,654 30.46 5,59,280 55.93
Outstanding at the end of the year 4,46,31,428 4,463.14 4,43,26,774 4,432.68
(ii) Terms/Rights attached to Equity Shares
The Company has only one class of equity shares having a par value of Rs.10 per share. Each holder of equity shares is
entitled to one vote per share. The Company declares and pays dividends in Indian rupees. The dividend proposed by the
Board of Directors is subject to the approval of the shareholders in the ensuing Annual General Meeting, except in case of
interim dividend.
In the event of liquidation of the Company, the holder of equity shares will be entitled to receive any of the remaining
assets of the Company, after distribution of all preferential amounts. The distribution will be in proportion to the number of
equity shares held by the shareholders.
The board of directors in their meetings on January 19, 2016 and March 14, 2016 declared an interim dividend of Rs. 5.00
per equity share and Rs.7.00 per equity share respectively. The total dividend appropriation for the year ended March 31,
2016 amounted to Rs. 6,235.16 lakhs including corporate dividend tax of Rs. 880.33 lakhs.
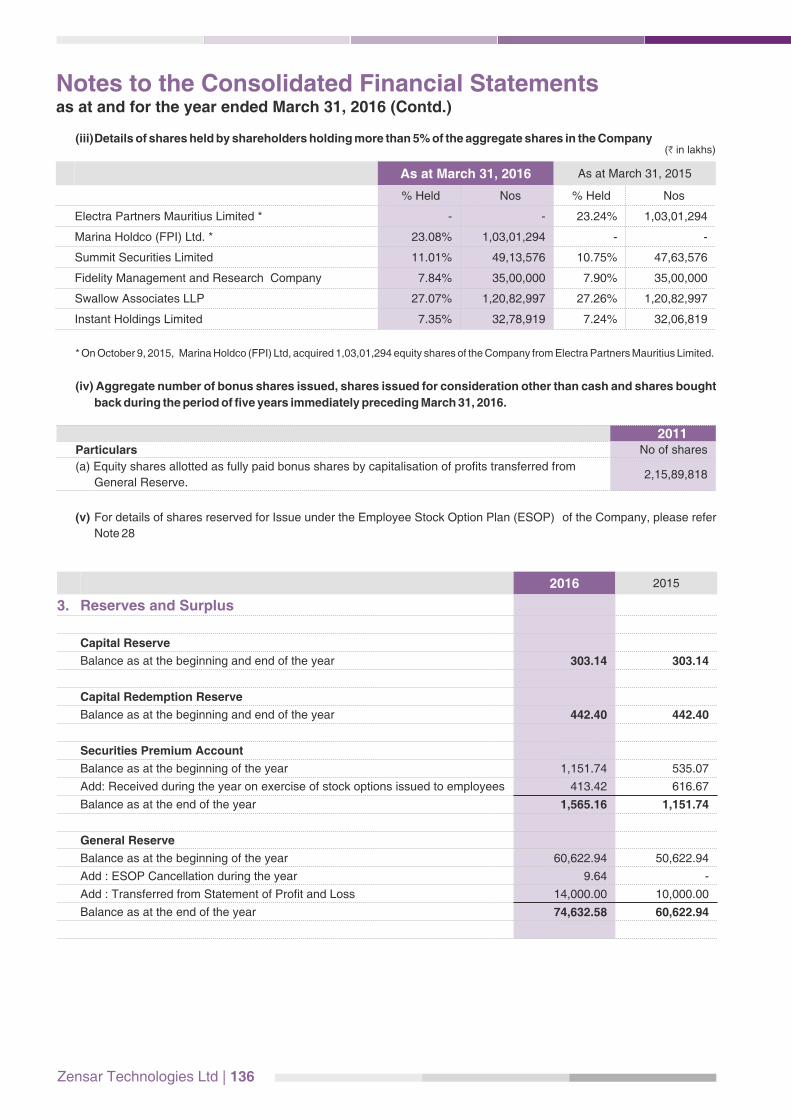
Zensar Technologies Ltd | 136
(iii) Details of shares held by shareholders holding more than 5% of the aggregate shares in the Company
As at March 31, 2016 As at March 31, 2015
% Held Nos % Held Nos
Electra Partners Mauritius Limited * - - 23.24% 1,03,01,294
Marina Holdco (FPI) Ltd. * 23.08% 1,03,01,294 - -
Summit Securities Limited 11.01% 49,13,576 10.75% 47,63,576
Fidelity Management and Research Company 7.84% 35,00,000 7.90% 35,00,000
Swallow Associates LLP 27.07% 1,20,82,997 27.26% 1,20,82,997
Instant Holdings Limited 7.35% 32,78,919 7.24% 32,06,819
(H in lakhs)
* On October 9, 2015, Marina Holdco (FPI) Ltd, acquired 1,03,01,294 equity shares of the Company from Electra Partners Mauritius Limited.
Notes to the Consolidated Financial Statementsas at and for the year ended March 31, 2016 (Contd.)
(iv) Aggregate number of bonus shares issued, shares issued for consideration other than cash and shares bought
back during the period of five years immediately preceding March 31, 2016.
2011Particulars No of shares
(a) Equity shares allotted as fully paid bonus shares by capitalisation of profits transferred from
General Reserve.2,15,89,818
(v) For details of shares reserved for Issue under the Employee Stock Option Plan (ESOP) of the Company, please refer
Note 28
2016 2015
3. Reserves and Surplus
Capital Reserve
Balance as at the beginning and end of the year 303.14 303.14
Capital Redemption Reserve
Balance as at the beginning and end of the year 442.40 442.40
Securities Premium Account
Balance as at the beginning of the year 1,151.74 535.07
Add: Received during the year on exercise of stock options issued to employees 413.42 616.67
Balance as at the end of the year 1,565.16 1,151.74
General Reserve
Balance as at the beginning of the year 60,622.94 50,622.94
Add : ESOP Cancellation during the year 9.64 -
Add : Transferred from Statement of Profit and Loss 14,000.00 10,000.00
Balance as at the end of the year 74,632.58 60,622.94
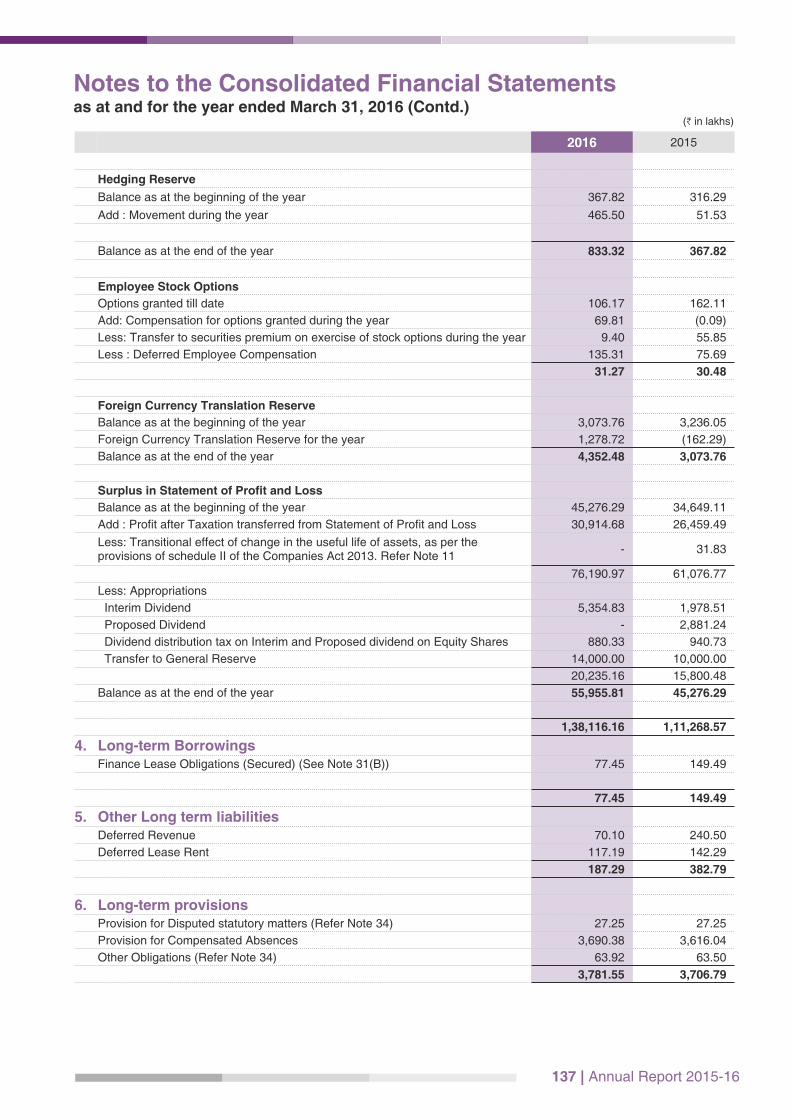
137 | Annual Report 2015-16
2016 2015
Hedging Reserve
Balance as at the beginning of the year 367.82 316.29
Add : Movement during the year 465.50 51.53
Balance as at the end of the year 833.32 367.82
Employee Stock Options
Options granted till date 106.17 162.11
Add: Compensation for options granted during the year 69.81 (0.09)
Less: Transfer to securities premium on exercise of stock options during the year 9.40 55.85
Less : Deferred Employee Compensation 135.31 75.69
31.27 30.48
Foreign Currency Translation Reserve
Balance as at the beginning of the year 3,073.76 3,236.05
Foreign Currency Translation Reserve for the year 1,278.72 (162.29)
Balance as at the end of the year 4,352.48 3,073.76
Surplus in Statement of Profit and Loss
Balance as at the beginning of the year 45,276.29 34,649.11
Add : Profit after Taxation transferred from Statement of Profit and Loss 30,914.68 26,459.49
Less: Transitional effect of change in the useful life of assets, as per the provisions of schedule II of the Companies Act 2013. Refer Note 11
- 31.83
76,190.97 61,076.77
Less: Appropriations
Interim Dividend 5,354.83 1,978.51
Proposed Dividend - 2,881.24
Dividend distribution tax on Interim and Proposed dividend on Equity Shares 880.33 940.73
Transfer to General Reserve 14,000.00 10,000.00
20,235.16 15,800.48
Balance as at the end of the year 55,955.81 45,276.29
1,38,116.16 1,11,268.57
4. Long-term BorrowingsFinance Lease Obligations (Secured) (See Note 31(B)) 77.45 149.49
77.45 149.49
5. Other Long term liabilitiesDeferred Revenue 70.10 240.50
Deferred Lease Rent 117.19 142.29
187.29 382.79
6. Long-term provisionsProvision for Disputed statutory matters (Refer Note 34) 27.25 27.25
Provision for Compensated Absences 3,690.38 3,616.04
Other Obligations (Refer Note 34) 63.92 63.50
3,781.55 3,706.79
Notes to the Consolidated Financial Statementsas at and for the year ended March 31, 2016 (Contd.)
(H in lakhs)

Zensar Technologies Ltd | 138
2016 2015
7. Short Term BorrowingFrom Banks:
Secured:
Term Loan [Refer Note a below] - 7,500.60
Credit Facility [Refer Note b and c below] 13,406.44 2,215.27
Unsecured:
Credit Facility [Refer Note d below] 1,325.04 -
14,731.48 9,715.87
Note : Nature of security and terms of repayment for secured borrowings
a) Last installment of Term Loan availed from Standard Chartered Bank, INR 7,500.60 lakhs was repaid during the year.
Balance NIL (March 31, 2015 : INR 7,500.60 lakhs)
b) During the year the Company has obtained SBLC facility from Citibank Bank with rate of interest at LIBOR + 130 basis points
p.a. This SBLC facility is secured by way of hypothecation of the current and movable assets and mortgage of immovable
assets of the Holding Company.
c) On June 26, 2007, the Company entered into a revolving credit facility with a Bank. The revolving credit facility was amended
time to time and as per amendment dated February 2, 2016, maturity was extended to May 31, 2016. Revolving credit facility
with the bank is secured by the assets of the Company.
d) The Company has availed export packing credit of $ 2 million for a tenor of 180 days. The Loan carries Interest rate of LIBOR +
30 basis points.
8. Trade PayablesDues to micro and small enterprises (Refer Note below) - -
Dues to other than micro and small enterprises 16,429.21 13,046.96
16,429.21 13,046.96
Note: The Company has compiled this information based on the current information in its possession. As at 31st March 2016, no supplier has intimated the Company about its status as a Micro or Small Enterprise or its registration with the appropriate authority under the Micro, Small and Medium Enterprises Development Act, 2006.
9. Other Current liabilitiesCurrent maturities of long term debt - 7,500.60
Current maturities of finance lease obligation; (See Note 31(B)) 120.34 191.09
Interest accrued but not due on borrowings 9.60 34.06
Deferred Revenue 8,390.97 7,486.50
Unpaid Dividend 208.37 124.76
Employee Benefits 8,661.94 5,673.03
Withholding and other taxes 893.16 737.12
Other Payables 2,892.70 2,510.68
21,177.08 24,257.84
10. Short-term provisionsTaxation less payments there against [(net of advance tax of Rs. 9,838.82 lakhs 1,147.21 640.15
(Previous year: Rs. 1,774.68 lakhs)]
Proposed Dividend on Equity Shares - 2,881.24
Tax on proposed dividend - 576.08
Provision for Gratuity 554.82 1,394.45
Provision for Compensated Absences 1,226.58 881.39
2,928.61 6,373.31
Notes to the Consolidated Financial Statementsas at and for the year ended March 31, 2016 (Contd.)
(H in lakhs)

Notes to the Consolidated Financial Statementsas at and for the year ended March 31, 2016 (Contd.)
139 | Annual Report 2015-16
11. a -
Tan
gib
le A
ssets
GR
OS
S B
LO
CK
DE
PR
EC
IAT
ION
/ A
MO
RT
ISA
TIO
NN
ET
BL
OC
K
Asse
ts
Co
st
as a
tM
arc
h 3
1,
2015
Ad
dit
ion
s/
Ad
justm
en
td
uri
ng
the y
ear
Dele
tio
ns
du
rin
gth
e y
ear
Co
st
as a
tM
arc
h 3
1,
2016
Accu
mu
late
d
Dep
recia
tio
n/
Am
ort
isati
on
as
at
Marc
h 3
1,
2015
Dep
recia
tio
n/
Am
ort
isati
on
for
the
the y
ear
Dep
recia
tio
n/
Am
ort
isati
on
w
ritt
en
back o
n
dele
tio
ns d
uri
ng
th
e y
ear
Accu
mu
late
d
Dep
recia
tio
n/
Am
ort
isati
on
as a
t M
arc
h 3
1,
2016
As a
tM
arc
h 3
1,
2016
As a
tM
arc
h 3
1,
2015
Tan
gib
le A
ssets
: L
and-
Lease
hold
264.2
5
-
-
264.2
5
36.3
5
2.7
7
-
39.1
2
225.1
3
227.9
0
Fre
ehold
0.4
9
-
-
0.4
9
-
-
-
-
0.4
9
0.4
9
Build
ings
5,3
69.7
8
24.2
7
-
5,3
94.0
5
1,4
57.2
7
178.9
4
-
1,6
36.2
1
3,7
57.8
4
3,9
12.5
1
Im
pro
vem
ent to
Lea
sehold
Pre
mis
es
3,2
11.0
9
48.3
5
-
3,2
59.4
4
2,5
77.9
4
308.5
9
-
2,8
86.5
3
372.9
1
633.1
5
Pla
nt and M
ach
inery
4,3
52.1
5
336.4
6
31.1
1
4,6
57.5
0
3,9
58.9
3
161.3
2
31.1
1
4,0
89.1
4
568.3
6
393.2
2
Furn
iture
and F
ixtu
res
3,3
06.4
4
349.6
7
17.1
0
3,6
39.0
1
2,4
29.6
8
240.0
0
17.1
0
2,6
52.5
8
986.4
3
876.7
6
Offic
e E
quip
ment
2,7
05.8
9
217.1
6
-
2,9
23.0
5
2,1
03.5
8
349.4
6
-
2,4
53.0
4
470.0
1
602.3
1
Moto
r V
ehic
les
343.3
6
39.9
1
6.3
2
376.9
5
191.5
1
63.9
3
4.1
4
251.3
0
125.6
5
151.8
5
Data
Pro
cess
ing E
quip
ment-
Ow
n u
se
10,3
73.1
2
1,8
57.9
3
107.0
6
12,1
23.9
9
8,9
39.9
0
1,0
55.1
4
107.0
6
9,8
87.9
8
2,2
36.0
1
1,4
33.2
2
Data
Pro
cess
ing E
quip
ments
take
n
on F
inance
Lease
989.3
1
111.9
7
300.7
7
800.5
1
759.1
0
224.5
6
300.3
0
683.3
6
117.1
5
230.2
1
Exc
hange F
luct
uatio
n o
n
Conso
lidatio
n
502.9
5
259.2
0
To
tal
30,9
15.8
8
2,9
85.7
2
462.3
6
33,4
39.2
4
22,4
54.2
6
2,5
84.7
1
459.7
1
24,5
79.2
6
9,3
62.9
3
8,7
20.8
2
Pre
vious
year
27,9
66.1
4
*3054.4
6
104.7
1
30,9
15.8
8
**1
9999.9
6
#2550.3
5
96.0
5
22,4
54.2
6
8,7
20.8
2
* Incl
udes
additi
ons
on a
cquis
ition o
f su
bsi
dia
ry in
the U
nite
d S
tate
s of A
merica
and b
usi
ness
acq
uis
ition in
India
- R
s. 9
63.3
8 la
khs
(Refe
r N
ote
36)
**
Incl
udes
additi
on
s on a
cquis
ition o
f su
bsi
dia
ry in
the U
nite
d S
tate
s of A
merica
and b
usi
ness
acq
uis
ition in
India
- R
s. 6
03.7
6 la
khs
(Refe
r N
ote
36)
# Incl
udes
Rs.
31.8
3 la
khs
reco
gnis
ed in
openin
g b
ala
nce
of re
tain
ed e
arn
ings,
base
d o
n tra
nsi
tional p
rovi
sion r
efe
rred to in
Sch
edule
II to
the C
om
panie
s A
ct , 2
013
11. b
- In
tan
gib
le A
ssets
GR
OS
S B
LO
CK
DE
PR
EC
IAT
ION
/ A
MO
RT
ISA
TIO
NN
ET
BL
OC
K
Asse
ts
Co
st
as a
tM
arc
h 3
1,
2015
Ad
dit
ion
s/
Ad
justm
en
td
uri
ng
the y
ear
Dele
tio
ns
du
rin
gth
e y
ear
Co
st
as a
tM
arc
h 3
1,
2016
Accu
mu
late
d
Dep
recia
tio
n/
Am
ort
isati
on
as
at
Marc
h 3
1,
2015
Dep
recia
tio
n/
Am
ort
isati
on
for
the
the y
ear
Dep
recia
tio
n/
Am
ort
isati
on
w
ritt
en
back o
n
dele
tio
ns d
uri
ng
th
e y
ear
Accu
mu
late
d
Dep
recia
tio
n/
Am
ort
isati
on
as a
t M
arc
h 3
1,
2016
As a
tM
arc
h 3
1,
2016
As a
tM
arc
h 3
1,
2015
In
tan
gib
le a
ssets
: A
cquired:
Goodw
ill o
n a
cquis
ition
1,2
76.2
9
-
-
1,2
76.2
9
158.8
1
255.2
6
-
414.0
7
862.2
2
1,1
17.4
8
Softw
are
5,7
43.6
6
1,2
31.1
2
-
6,9
74.7
8
4,8
13.9
7
1,5
12.1
0
-
6,3
26.0
7
648.7
1
929.6
9
Self
Genera
ted:
Tech
nic
al K
now
-ho
w
583.1
5
-
-
583.1
5
-
194.9
0
-
194.9
0
388.2
5
583.1
5
Goodw
ill o
n c
onso
lidatio
n
33,7
36.2
3
-
-
33,7
36.2
3
109.4
9
-
-
109.4
9
33,6
26.7
4
33,6
26.7
4
Exc
hange F
luct
uatio
n o
n
Co
nso
lidatio
n
12,1
75.2
1
9,7
57.3
5
To
tal
41,3
39.3
3
1,2
31.1
2
-
42,5
70.4
5
5,0
82.2
7
1,9
62.2
6
-
7,0
44.5
3
47,7
01.1
3
46,0
14.4
1
Pre
vious
year
29,0
16.5
6
*12
684.2
9
361.5
2
41,3
39.3
3
3,8
03.8
2
1,6
35.3
2
356.8
7
5,0
82.2
7
46,0
14.4
1
* Incl
udes
additi
ons
on a
cquis
ition o
f su
bsi
dia
ry in
the U
nite
d S
tate
s of A
merica
and b
usi
ness
acq
uis
ition in
India
- R
s. 1
0,9
60.6
9 la
khs
(Refe
r N
ote
36)
(H in
la
kh
s)
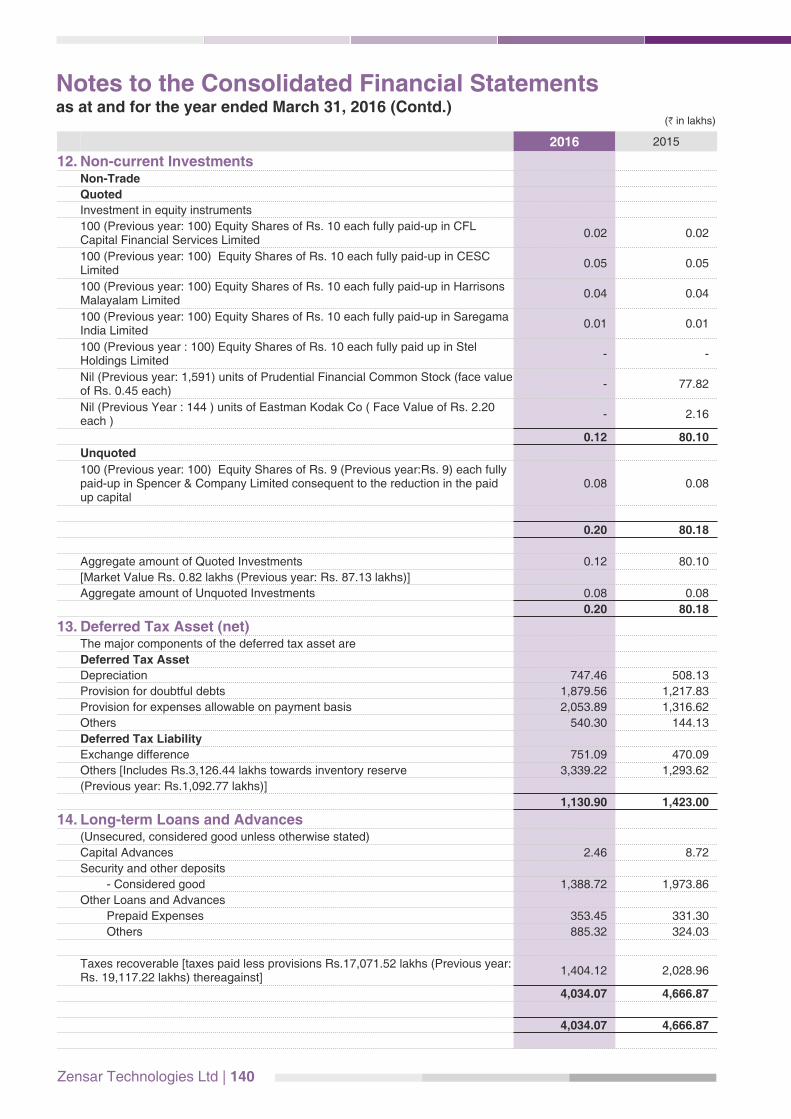
Zensar Technologies Ltd | 140
2016 2015
12. Non-current InvestmentsNon-Trade
Quoted
Investment in equity instruments
100 (Previous year: 100) Equity Shares of Rs. 10 each fully paid-up in CFL Capital Financial Services Limited
0.02 0.02
100 (Previous year: 100) Equity Shares of Rs. 10 each fully paid-up in CESC Limited
0.05 0.05
100 (Previous year: 100) Equity Shares of Rs. 10 each fully paid-up in Harrisons Malayalam Limited
0.04 0.04
100 (Previous year: 100) Equity Shares of Rs. 10 each fully paid-up in Saregama India Limited
0.01 0.01
100 (Previous year : 100) Equity Shares of Rs. 10 each fully paid up in Stel Holdings Limited
- -
Nil (Previous year: 1,591) units of Prudential Financial Common Stock (face value of Rs. 0.45 each)
- 77.82
Nil (Previous Year : 144 ) units of Eastman Kodak Co ( Face Value of Rs. 2.20 each )
- 2.16
0.12 80.10
Unquoted
100 (Previous year: 100) Equity Shares of Rs. 9 (Previous year:Rs. 9) each fully paid-up in Spencer & Company Limited consequent to the reduction in the paid up capital
0.08 0.08
0.20 80.18
Aggregate amount of Quoted Investments 0.12 80.10
[Market Value Rs. 0.82 lakhs (Previous year: Rs. 87.13 lakhs)]
Aggregate amount of Unquoted Investments 0.08 0.08
0.20 80.18
13. Deferred Tax Asset (net)The major components of the deferred tax asset are
Deferred Tax Asset
Depreciation 747.46 508.13
Provision for doubtful debts 1,879.56 1,217.83
Provision for expenses allowable on payment basis 2,053.89 1,316.62
Others 540.30 144.13
Deferred Tax Liability
Exchange difference 751.09 470.09
Others [Includes Rs.3,126.44 lakhs towards inventory reserve 3,339.22 1,293.62
(Previous year: Rs.1,092.77 lakhs)]
1,130.90 1,423.00
14. Long-term Loans and Advances(Unsecured, considered good unless otherwise stated)
Capital Advances 2.46 8.72
Security and other deposits
- Considered good 1,388.72 1,973.86
Other Loans and Advances
Prepaid Expenses 353.45 331.30
Others 885.32 324.03
Taxes recoverable [taxes paid less provisions Rs.17,071.52 lakhs (Previous year: Rs. 19,117.22 lakhs) thereagainst]
1,404.12 2,028.96
4,034.07 4,666.87
4,034.07 4,666.87
Notes to the Consolidated Financial Statementsas at and for the year ended March 31, 2016 (Contd.)
(H in lakhs)
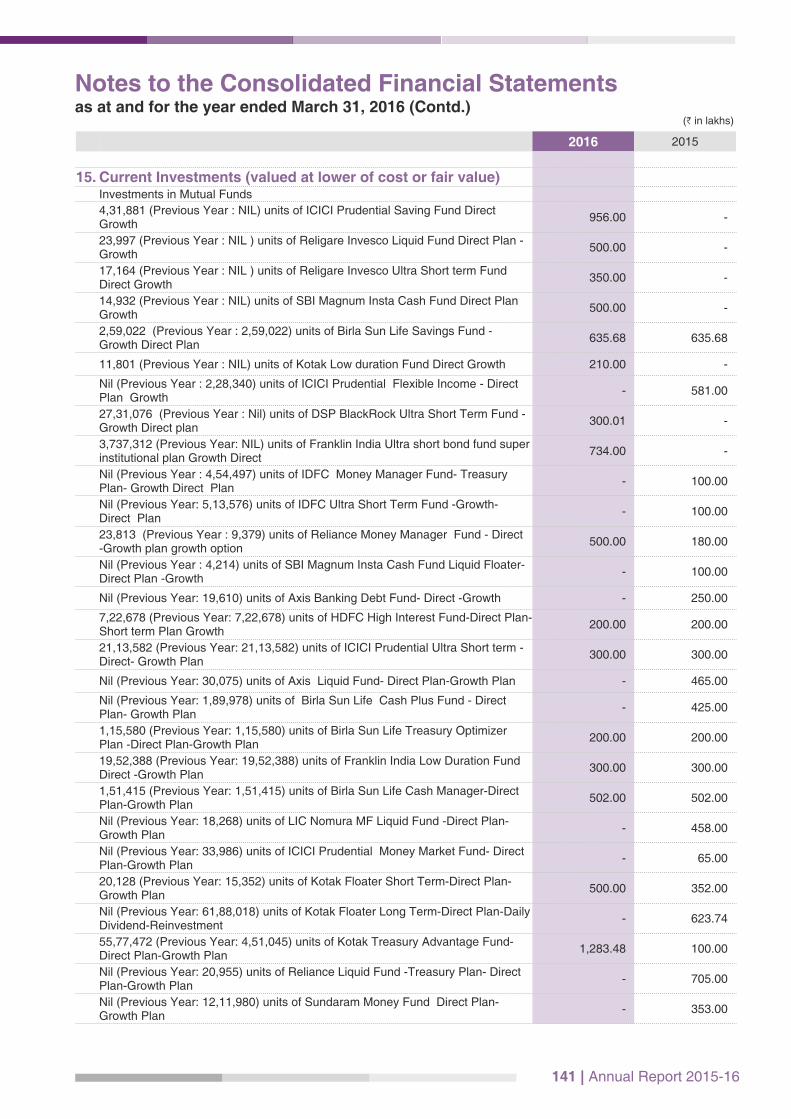
141 | Annual Report 2015-16
2016 2015
15. Current Investments (valued at lower of cost or fair value)Investments in Mutual Funds
4,31,881 (Previous Year : NIL) units of ICICI Prudential Saving Fund Direct Growth
956.00 -
23,997 (Previous Year : NIL ) units of Religare Invesco Liquid Fund Direct Plan - Growth
500.00 -
17,164 (Previous Year : NIL ) units of Religare Invesco Ultra Short term Fund Direct Growth
350.00 -
14,932 (Previous Year : NIL) units of SBI Magnum Insta Cash Fund Direct Plan Growth
500.00 -
2,59,022 (Previous Year : 2,59,022) units of Birla Sun Life Savings Fund - Growth Direct Plan
635.68 635.68
11,801 (Previous Year : NIL) units of Kotak Low duration Fund Direct Growth 210.00 -
Nil (Previous Year : 2,28,340) units of ICICI Prudential Flexible Income - Direct Plan Growth
- 581.00
27,31,076 (Previous Year : Nil) units of DSP BlackRock Ultra Short Term Fund - Growth Direct plan
300.01 -
3,737,312 (Previous Year: NIL) units of Franklin India Ultra short bond fund super institutional plan Growth Direct
734.00 -
Nil (Previous Year : 4,54,497) units of IDFC Money Manager Fund- Treasury Plan- Growth Direct Plan
- 100.00
Nil (Previous Year: 5,13,576) units of IDFC Ultra Short Term Fund -Growth- Direct Plan
- 100.00
23,813 (Previous Year : 9,379) units of Reliance Money Manager Fund - Direct -Growth plan growth option
500.00 180.00
Nil (Previous Year : 4,214) units of SBI Magnum Insta Cash Fund Liquid Floater-Direct Plan -Growth
- 100.00
Nil (Previous Year: 19,610) units of Axis Banking Debt Fund- Direct -Growth - 250.00
7,22,678 (Previous Year: 7,22,678) units of HDFC High Interest Fund-Direct Plan- Short term Plan Growth
200.00 200.00
21,13,582 (Previous Year: 21,13,582) units of ICICI Prudential Ultra Short term -Direct- Growth Plan
300.00 300.00
Nil (Previous Year: 30,075) units of Axis Liquid Fund- Direct Plan-Growth Plan - 465.00
Nil (Previous Year: 1,89,978) units of Birla Sun Life Cash Plus Fund - Direct Plan- Growth Plan
- 425.00
1,15,580 (Previous Year: 1,15,580) units of Birla Sun Life Treasury Optimizer Plan -Direct Plan-Growth Plan
200.00 200.00
19,52,388 (Previous Year: 19,52,388) units of Franklin India Low Duration Fund Direct -Growth Plan
300.00 300.00
1,51,415 (Previous Year: 1,51,415) units of Birla Sun Life Cash Manager-Direct Plan-Growth Plan
502.00 502.00
Nil (Previous Year: 18,268) units of LIC Nomura MF Liquid Fund -Direct Plan-Growth Plan
- 458.00
Nil (Previous Year: 33,986) units of ICICI Prudential Money Market Fund- Direct Plan-Growth Plan
- 65.00
20,128 (Previous Year: 15,352) units of Kotak Floater Short Term-Direct Plan-Growth Plan
500.00 352.00
Nil (Previous Year: 61,88,018) units of Kotak Floater Long Term-Direct Plan-Daily Dividend-Reinvestment
- 623.74
55,77,472 (Previous Year: 4,51,045) units of Kotak Treasury Advantage Fund-Direct Plan-Growth Plan
1,283.48 100.00
Nil (Previous Year: 20,955) units of Reliance Liquid Fund -Treasury Plan- Direct Plan-Growth Plan
- 705.00
Nil (Previous Year: 12,11,980) units of Sundaram Money Fund Direct Plan-Growth Plan
- 353.00
Notes to the Consolidated Financial Statementsas at and for the year ended March 31, 2016 (Contd.)
(H in lakhs)
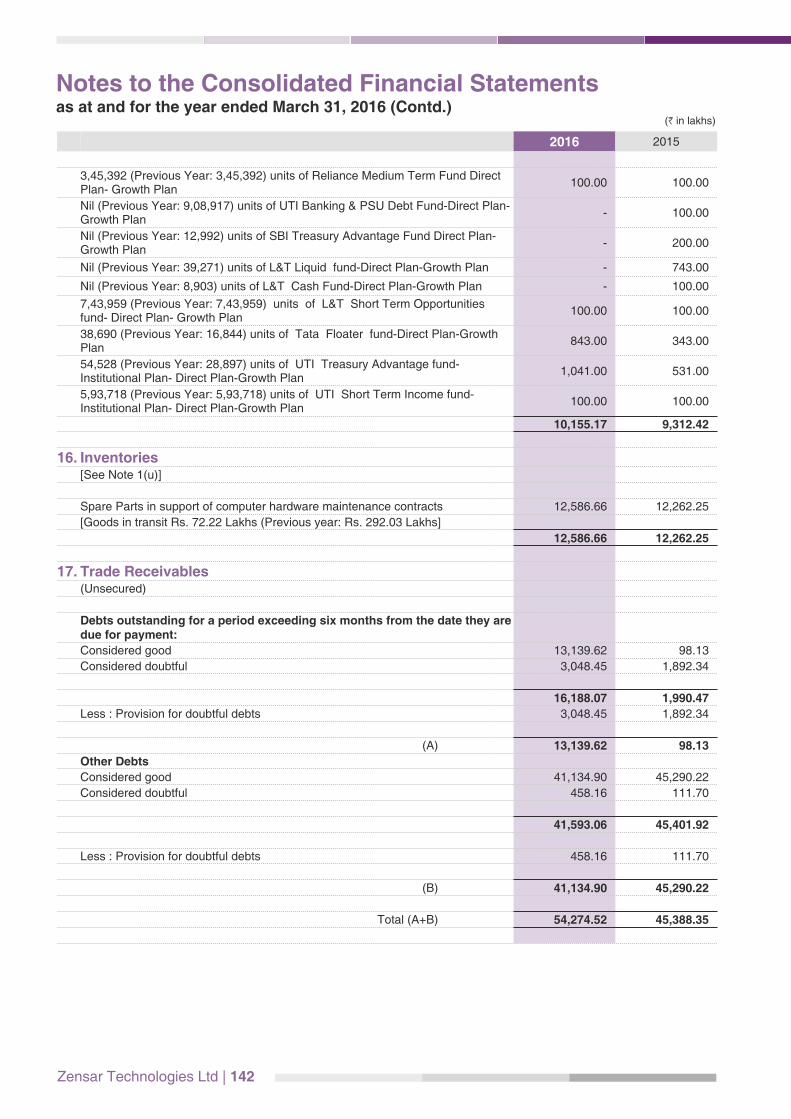
Zensar Technologies Ltd | 142
2016 2015
3,45,392 (Previous Year: 3,45,392) units of Reliance Medium Term Fund Direct Plan- Growth Plan
100.00 100.00
Nil (Previous Year: 9,08,917) units of UTI Banking & PSU Debt Fund-Direct Plan-Growth Plan
- 100.00
Nil (Previous Year: 12,992) units of SBI Treasury Advantage Fund Direct Plan-Growth Plan
- 200.00
Nil (Previous Year: 39,271) units of L&T Liquid fund-Direct Plan-Growth Plan - 743.00
Nil (Previous Year: 8,903) units of L&T Cash Fund-Direct Plan-Growth Plan - 100.00
7,43,959 (Previous Year: 7,43,959) units of L&T Short Term Opportunities fund- Direct Plan- Growth Plan
100.00 100.00
38,690 (Previous Year: 16,844) units of Tata Floater fund-Direct Plan-Growth Plan
843.00 343.00
54,528 (Previous Year: 28,897) units of UTI Treasury Advantage fund-Institutional Plan- Direct Plan-Growth Plan
1,041.00 531.00
5,93,718 (Previous Year: 5,93,718) units of UTI Short Term Income fund-Institutional Plan- Direct Plan-Growth Plan
100.00 100.00
10,155.17 9,312.42
16. Inventories[See Note 1(u)]
Spare Parts in support of computer hardware maintenance contracts 12,586.66 12,262.25
[Goods in transit Rs. 72.22 Lakhs (Previous year: Rs. 292.03 Lakhs]
12,586.66 12,262.25
17. Trade Receivables(Unsecured)
Debts outstanding for a period exceeding six months from the date they are due for payment:
Considered good 13,139.62 98.13
Considered doubtful 3,048.45 1,892.34
16,188.07 1,990.47
Less : Provision for doubtful debts 3,048.45 1,892.34
(A) 13,139.62 98.13
Other Debts
Considered good 41,134.90 45,290.22
Considered doubtful 458.16 111.70
41,593.06 45,401.92
Less : Provision for doubtful debts 458.16 111.70
(B) 41,134.90 45,290.22
Total (A+B) 54,274.52 45,388.35
Notes to the Consolidated Financial Statementsas at and for the year ended March 31, 2016 (Contd.)
(H in lakhs)
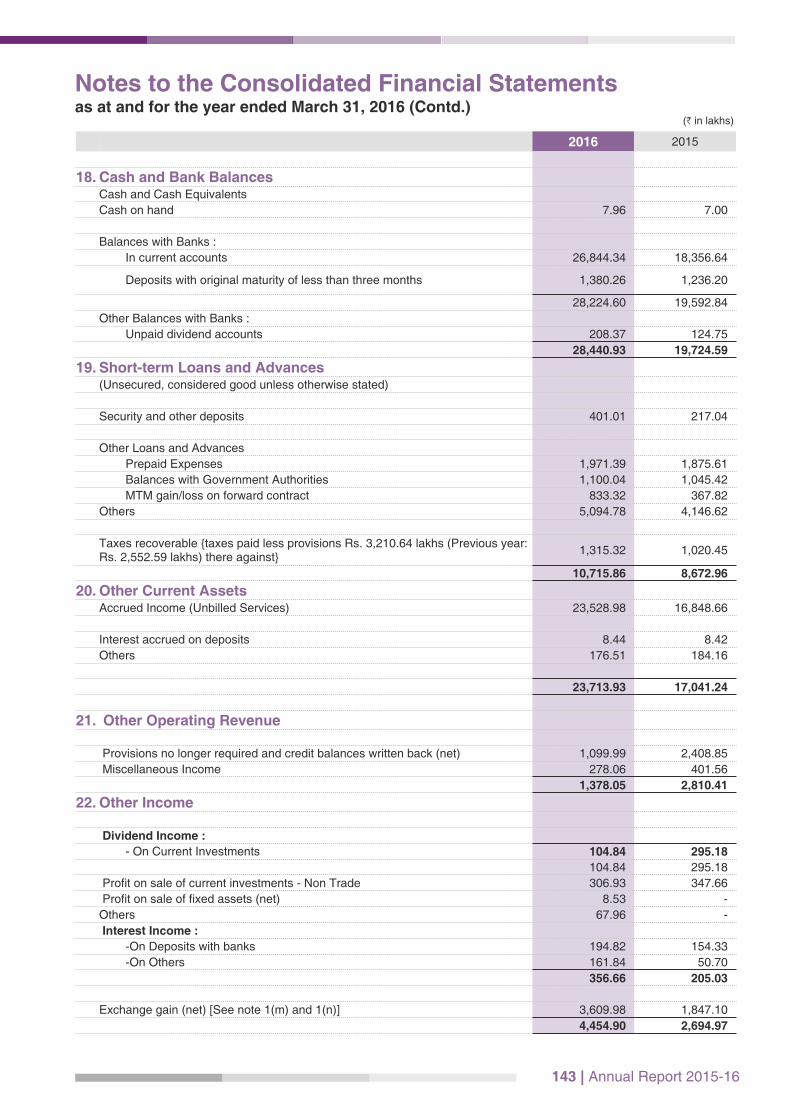
143 | Annual Report 2015-16
Notes to the Consolidated Financial Statementsas at and for the year ended March 31, 2016 (Contd.)
(H in lakhs)
2016 2015
18. Cash and Bank BalancesCash and Cash Equivalents
Cash on hand 7.96 7.00
Balances with Banks :
In current accounts 26,844.34 18,356.64
Deposits with original maturity of less than three months 1,380.26 1,236.20
28,224.60 19,592.84
Other Balances with Banks :
Unpaid dividend accounts 208.37 124.75
28,440.93 19,724.59
19. Short-term Loans and Advances(Unsecured, considered good unless otherwise stated)
Security and other deposits 401.01 217.04
Other Loans and Advances
Prepaid Expenses 1,971.39 1,875.61
Balances with Government Authorities 1,100.04 1,045.42
MTM gain/loss on forward contract 833.32 367.82
Others 5,094.78 4,146.62
Taxes recoverable {taxes paid less provisions Rs. 3,210.64 lakhs (Previous year: Rs. 2,552.59 lakhs) there against}
1,315.32 1,020.45
10,715.86 8,672.96
20. Other Current AssetsAccrued Income (Unbilled Services) 23,528.98 16,848.66
Interest accrued on deposits 8.44 8.42
Others 176.51 184.16
23,713.93 17,041.24
21. Other Operating Revenue
Provisions no longer required and credit balances written back (net) 1,099.99 2,408.85
Miscellaneous Income 278.06 401.56
1,378.05 2,810.41
22. Other Income
Dividend Income :
- On Current Investments 104.84 295.18
104.84 295.18
Profit on sale of current investments - Non Trade 306.93 347.66
Profit on sale of fixed assets (net) 8.53 -
Others 67.96 -
Interest Income :
-On Deposits with banks 194.82 154.33
-On Others 161.84 50.70
356.66 205.03
Exchange gain (net) [See note 1(m) and 1(n)] 3,609.98 1,847.10
4,454.90 2,694.97

Zensar Technologies Ltd | 144
2016 2015
23. Employee benefits expenses
Salaries, Wages and Bonus 1,31,382.97 1,14,847.45
Contribution to Provident and other funds 9,633.95 8,681.29
Staff Welfare 6,890.67 5,894.78
Employee Stock Compensation Expense 19.85 17.04
1,47,927.44 1,29,440.56
24. Other Expenses
Travelling and conveyance 10,906.02 7,959.46
Cost of spare parts and outsourced services in support of computer hardware 6,537.81 8,495.70
maintenance contracts
Cost of manpower hired 35,107.54 33,084.82
Recruitment Expenses 702.69 624.77
Training Expenses 497.33 254.52
Electricity and Power 1,371.86 1,307.76
Rent 6,271.35 6,085.21
Repairs and Maintenance to :
-Plant and Machinery 318.39 251.22
-Building 1,523.77 1,547.86
-Others 666.38 670.08
2,508.54 2,469.16
Insurance 1,402.78 1,419.07
Rates and Taxes 560.05 293.22
Consumable Media 851.24 618.66
Legal and Professional Charges 4,189.58 4,718.79
Postage, Telephone and E-Mail 2,400.85 1,975.96
Stationery and Printing 228.45 235.05
Carriage, Freight and Octroi 2,161.82 2,530.48
Vehicle Running expenses 276.08 234.26
Advertisement and Publicity 1,536.28 1,198.81
Purchases of Licenses for Software Applications 6,313.09 3,427.86
Loss on Disposal of Fixed Assets (net) - 10.76
Lease Rentals 295.66 271.86
Bad Debts written off 246.78 613.98
Directors' Fees 45.18 19.81
Directors' Commission 328.67 280.00
Provision for Doubtful Debts 3,316.14 -
Expenditure towards Corporate Social Responsibility (CSR) 461.82 156.94
Miscellaneous Expenses[Includes Donations made to an electoral trust Rs. Nil (Previous year : Rs. 134.00 lakhs)]
2,193.52 1,870.15
90,711.13 80,156.96
25. Finance costs
Interest Expense 107.27 120.83
Finance and other charges 959.06 995.46
1,066.33 1,116.29
Notes to the Consolidated Financial Statementsas at and for the year ended March 31, 2016 (Contd.)
(H in lakhs)

145 | Annual Report 2015-16
Notes to the Consolidated Financial Statementsas at and for the year ended March 31, 2016 (Contd.)
As at March 31, 2016
As at March 31, 2015
26 Capital CommitmentsEstimated amount of contracts remaining to be executed on capital account and not provided for [net of advances Rs. 2.46 lakhs (Previous year: Rs. 8.72 lakhs)] - Tangible Assets
588.24 558.14
27 Contingent Liabilities(a) Income Tax
Matters decided in favour of the Company by appellate authorities, where the
Income
Tax Department is in further appeal.
981.07 990.94
Matters on which the Company is in appeal 592.16 635.19
(b) Sales Tax / Value Added Tax:
Claims against the Company regarding sales tax against which the
Company has preferred appeals.
252.41 253.03
(c) Claims against the Company regarding service tax against which the
Company has preferred appeal. 14.73 14.73
(d) Claim in respect of rented premises. 223.61 211.94
(e) Claims against the Company not acknowledged as debts. 190.41 62.28
28 Employee Stock Option Schemes
i) Currently the Company has instituted two Employees Stock Option Plans. The Compensation Committee of the Board
approves the grant of options. Options vest with employees over specified time periods subject to fulfilment of certain
conditions.
The Nomination and Remuneration Committee of the Company approved the Employee performance Award Unit Plan,
2016 in its meeting held on January 18, 2016.
In accordance with the requirements of Securities and Exchange Board of India (Share Based Employee Benefits)
Regulations, 2014 approval of the Shareholders was obtained by way of Postal Ballot. As at March 31, 2016 no
Performance Award Units were allotted under this scheme.
Stock Option Activity under the “2002 ESOP” scheme is as follows:
2015-16 2014-15
ParticularsNumber of
options
Weighted average
exercise price in Rupees
Number of options
Weighted average
exercise price in Rupees
Opening Balance 1,24,690 76.08 1,94,718 77.68
Exercised during the year 63,412 72.61 63,854 83.18
Cancelled during the year 5,428 43.05 6,174 52.92
Balance unexercised options 55,850 83.24 1,24,690 76.08
Exercisable at end of year 55,850 83.24 1,24,690 76.08
Stock Option Activity under the “2006 ESOP” scheme is as follows:
2015-16 2014-15
ParticularsNumber of
options
Weighted average
exercise price in Rupees
Number of options
Weighted average
exercise price in Rupees
Opening Balance 10,67,830 185.23 15,16,560 158.00
Granted during the year 3,01,000 812.43 2,45,000 478.24
Exercised during the year 2,41,242 161.02 4,95,426 113.93
Cancelled during the year 97,606 278.94 1,98,304 231.04
Balance unexercised options 10,29,982 420.39 10,67,830 238.35
Exercisable at end of year 5,35,642 216.82 3,27,081 185.23
(H in lakhs)

Zensar Technologies Ltd | 146
ii) Impact on the reported net profit and earnings per share by applying the fair value based method
Since the Company uses intrinsic value method as required by the Guidance Note on Accounting for Employee Share-
based Payments issued by Institute of Chartered Accountants of India, the impact on reported net profit and Earnings Per
Share by applying the fair value method is set out as follows:
29 Segment Information
The Company recognises each of the SBUs as its primary segments. Secondary segmental reporting is done on the basis
of the geographical location of clients.
The accounting principles used in the preparation of financial statements are also consistently applied to record income and
expenditure in individual segments. These are as set out in the note on significant accounting policies.
Income and expenditure in relation to segments is categorised based on items that are individually identifiable to the
segment, marketing costs are allocated based on revenue and the remainder of the costs are allocated based on resources.
Certain expenses like depreciation are not specifically allocable to a segment as the underlying assets are used
interchangeably. The Company believes that it is not practical to provide segment disclosures relating to these expenses
and accordingly these expenses are separately disclosed as “unallocated” and directly charged against total income.
Fixed assets used in the Company’s business or liabilities contracted have not been identified to any segment as the fixed
assets and services are used interchangeably between segments. Accordingly no disclosure relating to total segment
assets and liabilities is made.
Notes to the Consolidated Financial Statementsas at and for the year ended March 31, 2016 (Contd.)
For year ended 31st March
2016
For year ended 31st March 2015
Profit after taxation and minority interest (Rs. in lakhs) 30,914.68 26,459.49
Add: Employee stock compensation under intrinsic value method (Rs. in lakhs) 19.85 17.04
Less: Employee stock compensation under fair value method (Rs. in lakhs) 274.50 212.66
Profit after taxation as per fair value method 30,660.03 26,263.87
Earnings Per Share Rs. Rs.
Basic
-As reported 69.54 60.25
-Adjusted 68.97 59.80
Diluted
-As reported 68.63 59.30
-Adjusted 68.06 58.86
For year ended 31st March
2016
For year ended 31st March 2015
The following assumptions were used for calculation of fair value of grants:
Risk-free interest rate (%) 7.59% - 7.99% 7.80% - 8.70%
Expected life of options (years) 96 months 96 months
Expected volatility 36.18% - 42.28% 40.80% - 41.40%
Dividend yield 1.11% - 1.62% 1.60% - 2.30%

2015-16 AMS IMProducts & Licenses
Unallocated Total
Sales to External Customers 2,17,961.01 53,467.36 24,997.94 - 2,96,426.31
Segment Result 41,764.69 2,997.20 712.25 - 45,474.14
Interest and Finance cost - - - 1,066.33 1,066.33
Unallocable Income(net) - - - 1,526.80 1,526.80
Profit before Tax 41,764.69 2,997.20 712.25 (2,593.13) 42,881.01
Tax - - - 11,691.30 11,691.30
Profit after Tax before Minority Interest 41,764.69 2,997.20 712.25 (14,284.43) 31,189.71
Profit after Tax 41,764.69 2,997.20 712.25 (14,559.46) 30,914.68
2014-15 AMS IMProducts & Licenses
Unallocated Total
Sales to External Customers 1,86,063.24 53,496.60 23,207.97 - 2,62,767.81
Segment Result 32,725.90 4,411.91 954.26 - 38,092.07
Interest and Finance cost - - - 1,116.29 1,116.29
Unallocable Income(net) - - - 385.09 385.09
Profit before Tax 32,725.90 4,411.91 954.26 (1,501.38) 36,590.69
Tax - - - 10,127.63 10,127.63
Profit after Tax before Minority Interest 32,725.90 4,411.91 954.26 (11,629.01) 26,463.06
Profit after Tax 32,725.90 4,411.91 954.26 (11,632.58) 26,459.49
Secondary Segment - Geographical Segment
Segment Revenue by Geographical Location 2015-16 2014-15
United States of America 2,28,653.31 2,00,052.23
United Kingdom 29,413.20 26,848.87
Rest of the World 38,359.80 35,866.71
Total 2,96,426.31 2,62,767.81
(H in lakhs)
147 | Annual Report 2015-16
30 Related Party disclosures as per Accounting Standard 18
(i) Key Management Personnel
Dr. Ganesh Natarajan
Mr. Sandeep Kishore (with effect from January 12, 2016)
Mr. S. Balasubramaniam
(ii) Entity with common Key Management Personnel
Zensar Foundation
Description of the nature of the transactionsVolume of transactions
duringAmount Outstanding as on 31st March
2015-16 2014-15 2016 2015
Receivable Payable Receivable Payable
a) Remuneration to Key Management
Personnel *
Dr. Ganesh Natarajan 591.55 553.78 - - - -
Mr. Sandeep Kishore # 254.35 -
Mr. S. Balasubramaniam 69.42 61.54 - - - - Total remuneration of Key Management
Personnel 915.32 615.32 - - - -
b) Donation to Zensar Foundation 317.00 115.00 -
Total Donation 317.00 115.00 - - - -
Notes to the Consolidated Financial Statementsas at and for the year ended March 31, 2016 (Contd.)
Primary Segments - Business Segment
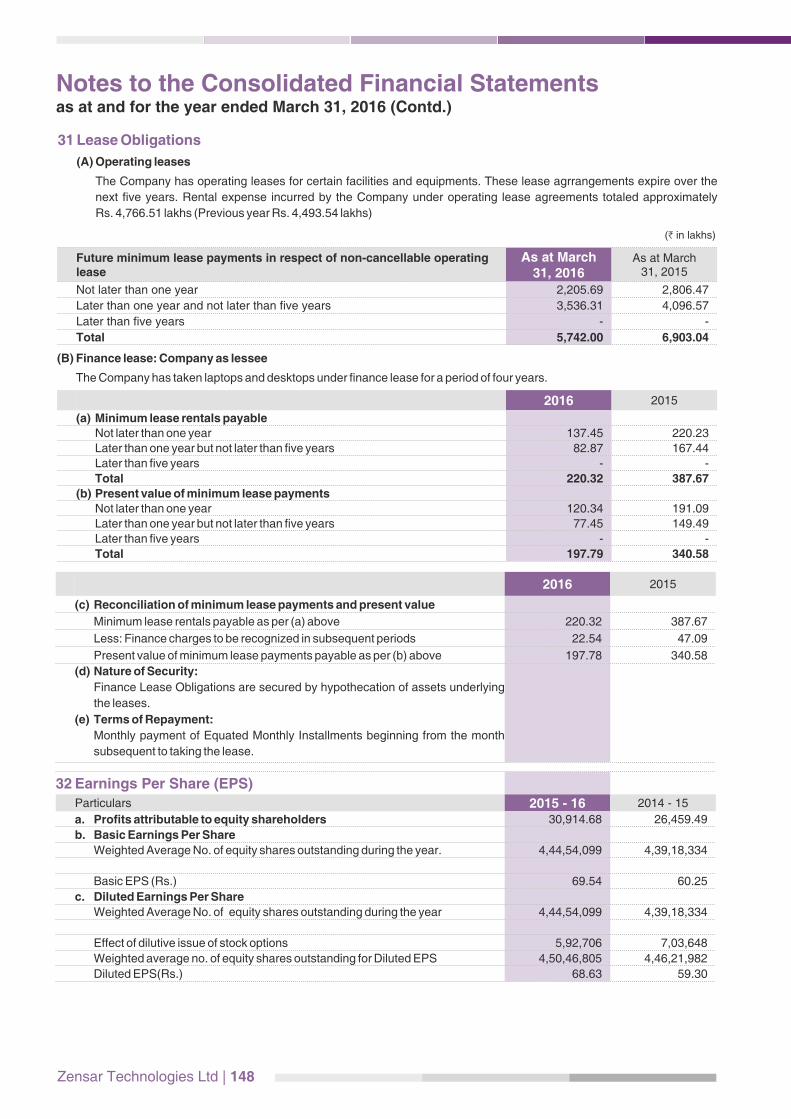
Zensar Technologies Ltd | 148
2016 2015
(c) Reconciliation of minimum lease payments and present value
Minimum lease rentals payable as per (a) above 220.32 387.67
Less: Finance charges to be recognized in subsequent periods 22.54 47.09
Present value of minimum lease payments payable as per (b) above 197.78 340.58
(d) Nature of Security:
Finance Lease Obligations are secured by hypothecation of assets underlying
the leases.
(e) Terms of Repayment:
Monthly payment of Equated Monthly Installments beginning from the month
subsequent to taking the lease.
32 Earnings Per Share (EPS)
Particulars 2015 - 16 2014 - 15
a. Profits attributable to equity shareholders 30,914.68 26,459.49
b. Basic Earnings Per Share
Weighted Average No. of equity shares outstanding during the year. 4,44,54,099 4,39,18,334
Basic EPS (Rs.) 69.54 60.25
c. Diluted Earnings Per Share
Weighted Average No. of equity shares outstanding during the year 4,44,54,099 4,39,18,334
Effect of dilutive issue of stock options 5,92,706 7,03,648
Weighted average no. of equity shares outstanding for Diluted EPS 4,50,46,805 4,46,21,982
Diluted EPS(Rs.) 68.63 59.30
(H in lakhs)
Notes to the Consolidated Financial Statementsas at and for the year ended March 31, 2016 (Contd.)
31 Lease Obligations
(A) Operating leases
The Company has operating leases for certain facilities and equipments. These lease agrrangements expire over the
next five years. Rental expense incurred by the Company under operating lease agreements totaled approximately
Rs. 4,766.51 lakhs (Previous year Rs. 4,493.54 lakhs)
Future minimum lease payments in respect of non-cancellable operating lease
As at March 31, 2016
As at March 31, 2015
Not later than one year 2,205.69 2,806.47
Later than one year and not later than five years 3,536.31 4,096.57
Later than five years - -
Total 5,742.00 6,903.04
(B) Finance lease: Company as lessee
The Company has taken laptops and desktops under finance lease for a period of four years.
2016 2015
(a) Minimum lease rentals payable Not later than one year 137.45 220.23
Later than one year but not later than five years 82.87 167.44
Later than five years - -
Total 220.32 387.67
(b) Present value of minimum lease paymentsNot later than one year 120.34 191.09
Later than one year but not later than five years 77.45 149.49
Later than five years - -
Total 197.79 340.58

33. Derivative instruments and unhedged foreign currency exposureDerivatives Outstanding as at the reporting date Purpose
As at March 31, 2016
As at March 31, 2015
In US $ Hedge highly probable forecast sale 4,51,00,000.00 3,85,00,000.00
(Equivalent approximate in Rs. lakhs) 30,807.28 24,970.67
In GBP £ Hedge highly probable forecast sale 18,00,000.00 -
(Equivalent approximate in Rs. lakhs) 1,776.10 -
In ZAR R Hedge highly probable forecast sale 50,00,000.00 -
(Equivalent approximate in Rs. lakhs) 224.82 -
As of the Balance Sheet date, the Company’s net foreign currency exposure that is not hedged by derivative instruments or otherwise is Rs. 67,997.53 lakhs (Previous year: Rs. 53,197.18 lakhs)
Details of foreign currency exposures that are not hedged by a derivative instruments or otherwise.
149 | Annual Report 2015-16
Notes to the Consolidated Financial Statementsas at and for the year ended March 31, 2016 (Contd.)
(H in lakhs)
As at March 31, 2016 As at March 31, 2015
Amount in FC (in lakhs)
Amount inINR- (in lakhs)
Amount in FC (in lakhs)
Amount in INR- (in lakhs)
Trade and other receivables
AED 30.44 549.13 12.11 206.15
AUD 24.31 1,238.42 9.83 467.30
CHF 0.26 18.10 0.04 2.49
CNY 3.85 39.51 1.79 18.08
EUR 2.22 167.50 0.39 26.58
GBP 27.12 2,589.13 20.02 1,851.40
JPY 191.97 113.24 191.97 100.11
KES 4,091.67 2,623.70 2.65 1.76
SAR 0.49 8.57 - -
SGD 4.01 197.38 0.66 29.83
USD 833.72 55,235.44 767.86 47,994.79
ZAR 538.60 2,424.79 296.23 1,519.36
Loans - Granted to subsidiaries
USD 13.16 872.01 13.10 818.93
JPY 788.01 464.85 788.01 410.95
Trade and other payables
AED 35.24 635.71 30.67 521.91
AUD 4.25 216.77 4.06 193.06
CHF 0.04 2.68 0.01 0.84
CNY 0.10 1.07 0.10 1.05
EUR 1.72 129.45 1.72 115.89
GBP 0.16 14.88 - -
JPY 3.69 2.18 3.69 1.93
KES 1,550.18 994.02 6.26 4.16
SGD 0.05 2.65 0.05 2.43
USD 24.67 1,634.44 10.60 662.60
ZAR 11.29 50.84 11.41 58.53
Cash and Bank balances
USD 56.25 3,726.66 8.29 518.39
GBP 5.01 478.58 - -
AED 29.64 534.68 20.61 350.75
AUD 6.30 321.06 8.73 415.09
KES 123.90 79.45 41.56 27.60
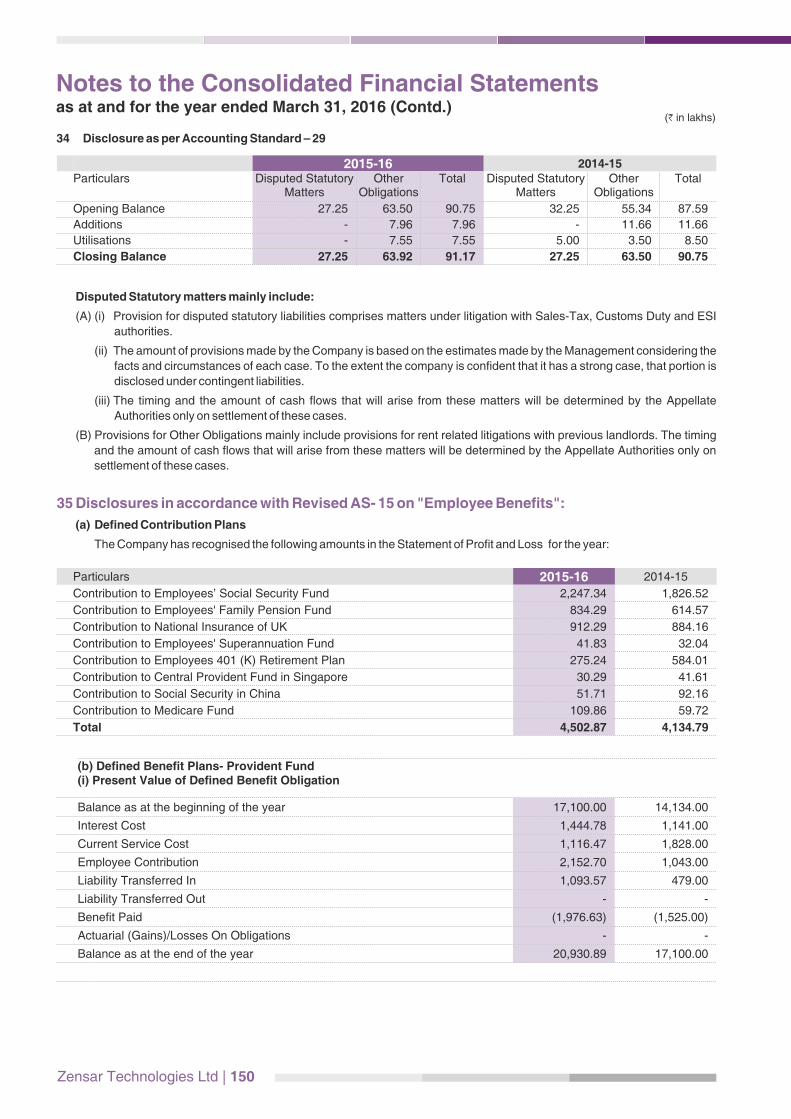
Zensar Technologies Ltd | 150
(b) Defined Benefit Plans- Provident Fund(i) Present Value of Defined Benefit Obligation
Balance as at the beginning of the year 17,100.00 14,134.00
Interest Cost 1,444.78 1,141.00
Current Service Cost 1,116.47 1,828.00
Employee Contribution 2,152.70 1,043.00
Liability Transferred In 1,093.57 479.00
Liability Transferred Out - -
Benefit Paid (1,976.63) (1,525.00)
Actuarial (Gains)/Losses On Obligations - -
Balance as at the end of the year 20,930.89 17,100.00
Notes to the Consolidated Financial Statementsas at and for the year ended March 31, 2016 (Contd.)
(H in lakhs)
Disputed Statutory matters mainly include:
(A) (i) Provision for disputed statutory liabilities comprises matters under litigation with Sales-Tax, Customs Duty and ESI
authorities.
(ii) The amount of provisions made by the Company is based on the estimates made by the Management considering the
facts and circumstances of each case. To the extent the company is confident that it has a strong case, that portion is
disclosed under contingent liabilities.
(iii) The timing and the amount of cash flows that will arise from these matters will be determined by the Appellate
Authorities only on settlement of these cases.
(B) Provisions for Other Obligations mainly include provisions for rent related litigations with previous landlords. The timing
and the amount of cash flows that will arise from these matters will be determined by the Appellate Authorities only on
settlement of these cases.
35 Disclosures in accordance with Revised AS- 15 on "Employee Benefits":
(a) Defined Contribution Plans
The Company has recognised the following amounts in the Statement of Profit and Loss for the year:
Particulars 2015-16 2014-15
Contribution to Employees’ Social Security Fund 2,247.34 1,826.52
Contribution to Employees' Family Pension Fund 834.29 614.57
Contribution to National Insurance of UK 912.29 884.16
Contribution to Employees' Superannuation Fund 41.83 32.04
Contribution to Employees 401 (K) Retirement Plan 275.24 584.01
Contribution to Central Provident Fund in Singapore 30.29 41.61
Contribution to Social Security in China 51.71 92.16
Contribution to Medicare Fund 109.86 59.72
Total 4,502.87 4,134.79
34 Disclosure as per Accounting Standard – 29
2015-16 2014-15Particulars Disputed Statutory
MattersOther
ObligationsTotal Disputed Statutory
MattersOther
ObligationsTotal
Opening Balance 27.25 63.50 90.75 32.25 55.34 87.59
Additions - 7.96 7.96 - 11.66 11.66
Utilisations - 7.55 7.55 5.00 3.50 8.50
Closing Balance 27.25 63.92 91.17 27.25 63.50 90.75
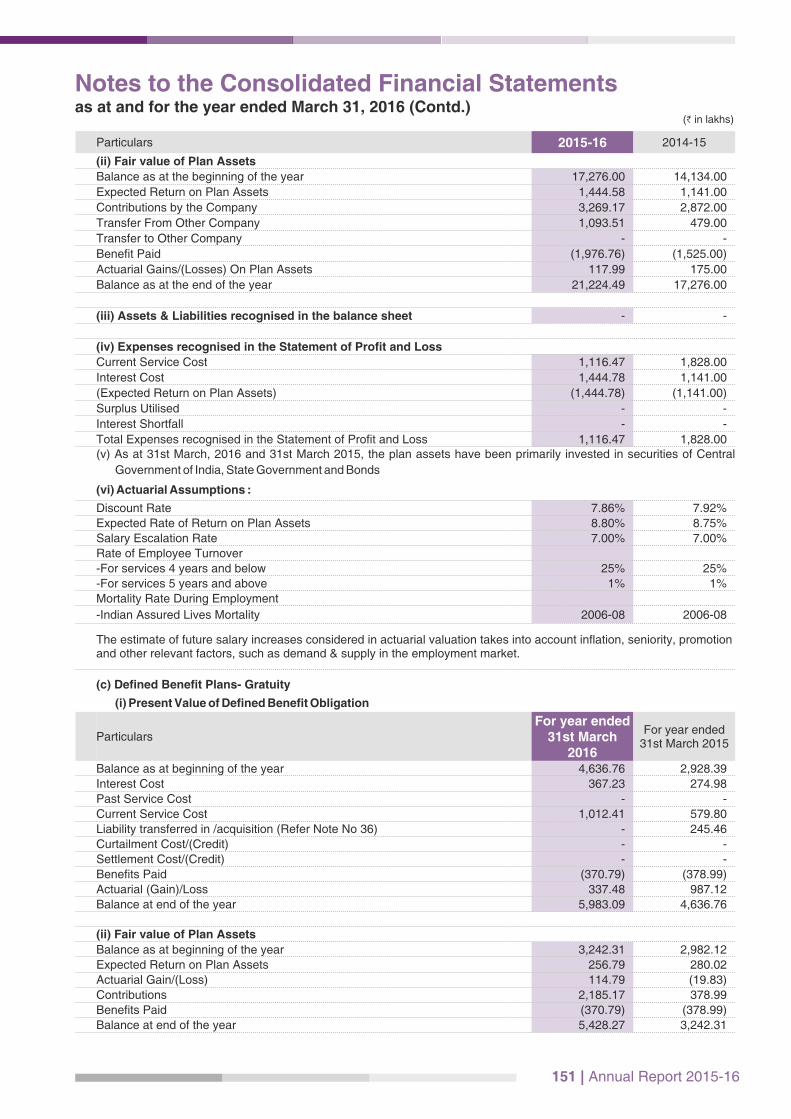
151 | Annual Report 2015-16
(c) Defined Benefit Plans- Gratuity
(i) Present Value of Defined Benefit Obligation
Particulars
For year ended 31st March
2016
For year ended 31st March 2015
Balance as at beginning of the year 4,636.76 2,928.39
Interest Cost 367.23 274.98
Past Service Cost - -
Current Service Cost 1,012.41 579.80
Liability transferred in /acquisition (Refer Note No 36) - 245.46
Curtailment Cost/(Credit) - -
Settlement Cost/(Credit) - -
Benefits Paid (370.79) (378.99)
Actuarial (Gain)/Loss 337.48 987.12
Balance at end of the year 5,983.09 4,636.76
(ii) Fair value of Plan Assets
Balance as at beginning of the year 3,242.31 2,982.12
Expected Return on Plan Assets 256.79 280.02
Actuarial Gain/(Loss) 114.79 (19.83)
Contributions 2,185.17 378.99
Benefits Paid (370.79) (378.99)
Balance at end of the year 5,428.27 3,242.31
Notes to the Consolidated Financial Statementsas at and for the year ended March 31, 2016 (Contd.)
(H in lakhs)
Particulars 2015-16 2014-15
(ii) Fair value of Plan Assets
Balance as at the beginning of the year 17,276.00 14,134.00
Expected Return on Plan Assets 1,444.58 1,141.00
Contributions by the Company 3,269.17 2,872.00
Transfer From Other Company 1,093.51 479.00
Transfer to Other Company - -
Benefit Paid (1,976.76) (1,525.00)
Actuarial Gains/(Losses) On Plan Assets 117.99 175.00
Balance as at the end of the year 21,224.49 17,276.00
(iii) Assets & Liabilities recognised in the balance sheet - -
(iv) Expenses recognised in the Statement of Profit and Loss
Current Service Cost 1,116.47 1,828.00
Interest Cost 1,444.78 1,141.00
(Expected Return on Plan Assets) (1,444.78) (1,141.00)
Surplus Utilised - -
Interest Shortfall - -
Total Expenses recognised in the Statement of Profit and Loss 1,116.47 1,828.00 (v) As at 31st March, 2016 and 31st March 2015, the plan assets have been primarily invested in securities of Central
Government of India, State Government and Bonds
(vi) Actuarial Assumptions :
Discount Rate 7.86% 7.92%
Expected Rate of Return on Plan Assets 8.80% 8.75%
Salary Escalation Rate 7.00% 7.00%
Rate of Employee Turnover
-For services 4 years and below 25% 25%
-For services 5 years and above 1% 1%
Mortality Rate During Employment
-Indian Assured Lives Mortality 2006-08 2006-08
The estimate of future salary increases considered in actuarial valuation takes into account inflation, seniority, promotion and other relevant factors, such as demand & supply in the employment market.
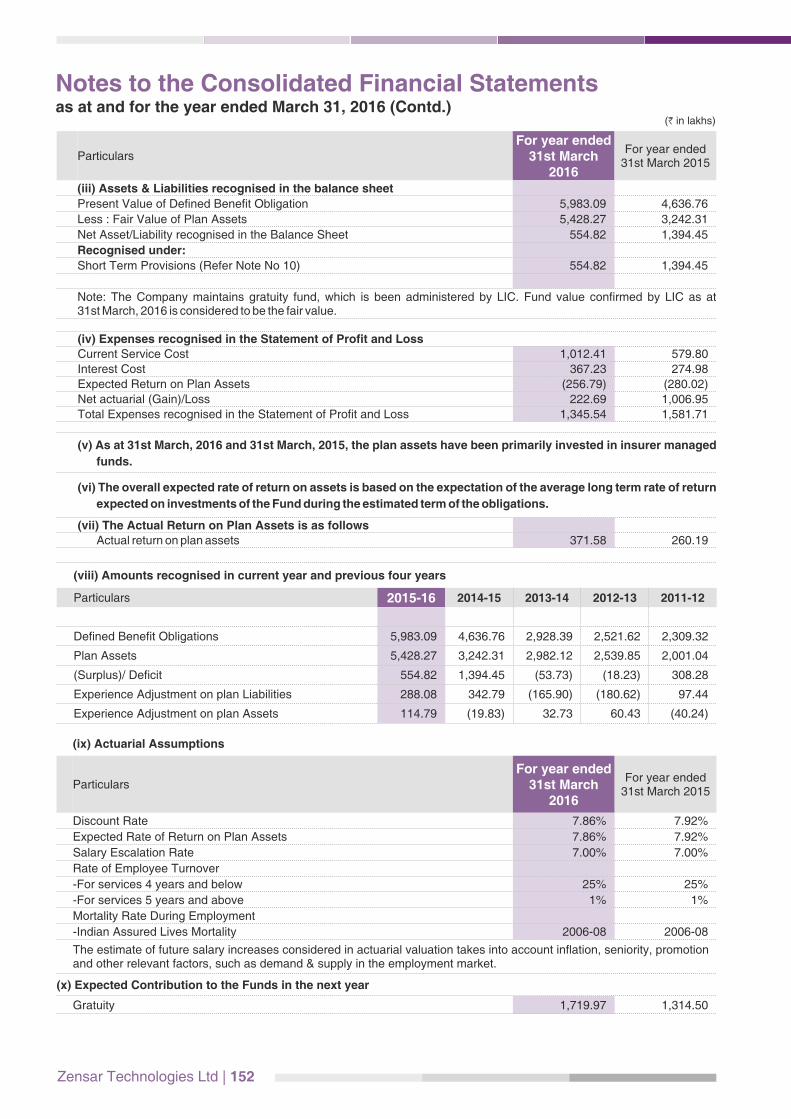
Zensar Technologies Ltd | 152
(viii) Amounts recognised in current year and previous four years
Particulars 2015-16 2014-15 2013-14 2012-13 2011-12
Defined Benefit Obligations 5,983.09 4,636.76 2,928.39 2,521.62 2,309.32
Plan Assets 5,428.27 3,242.31 2,982.12 2,539.85 2,001.04
(Surplus)/ Deficit 554.82 1,394.45 (53.73) (18.23) 308.28
Experience Adjustment on plan Liabilities 288.08 342.79 (165.90) (180.62) 97.44
Experience Adjustment on plan Assets 114.79 (19.83) 32.73 60.43 (40.24)
(ix) Actuarial Assumptions
Particulars
For year ended 31st March
2016
For year ended 31st March 2015
Discount Rate 7.86% 7.92%
Expected Rate of Return on Plan Assets 7.86% 7.92%
Salary Escalation Rate 7.00% 7.00%
Rate of Employee Turnover
-For services 4 years and below 25% 25%
-For services 5 years and above 1% 1%
Mortality Rate During Employment
-Indian Assured Lives Mortality 2006-08 2006-08
The estimate of future salary increases considered in actuarial valuation takes into account inflation, seniority, promotion and other relevant factors, such as demand & supply in the employment market.
(x) Expected Contribution to the Funds in the next year
Gratuity 1,719.97 1,314.50
(H in lakhs)
(iv) Expenses recognised in the Statement of Profit and LossCurrent Service Cost 1,012.41 579.80
Interest Cost 367.23 274.98
Expected Return on Plan Assets (256.79) (280.02)
Net actuarial (Gain)/Loss 222.69 1,006.95
Total Expenses recognised in the Statement of Profit and Loss 1,345.54 1,581.71
(v) As at 31st March, 2016 and 31st March, 2015, the plan assets have been primarily invested in insurer managed
funds.
(vi) The overall expected rate of return on assets is based on the expectation of the average long term rate of return
expected on investments of the Fund during the estimated term of the obligations.
(vii) The Actual Return on Plan Assets is as follows Actual return on plan assets 371.58 260.19
Notes to the Consolidated Financial Statementsas at and for the year ended March 31, 2016 (Contd.)
Particulars
For year ended 31st March
2016
For year ended 31st March 2015
(iii) Assets & Liabilities recognised in the balance sheet
Present Value of Defined Benefit Obligation 5,983.09 4,636.76
Less : Fair Value of Plan Assets 5,428.27 3,242.31
Net Asset/Liability recognised in the Balance Sheet 554.82 1,394.45
Recognised under:
Short Term Provisions (Refer Note No 10) 554.82 1,394.45
Note: The Company maintains gratuity fund, which is been administered by LIC. Fund value confirmed by LIC as at 31st March, 2016 is considered to be the fair value.

36 Acquisition of Subsidiary in the United States of America and Business Acquisition in India
During the Financial Year 2014-15, the Company, through its wholly owned subsidiary, Zensar Technologies, Inc. acquired
100% equity interest in Professional Access Limited vide agreement dated August 14, 2014 and also on August 14, 2014,
the Company entered into a Business Undertaking Transfer Agreement for the purchase of business from Professional
Access Software Development Private Limited, an Oracle Platinum partner.
The financial statements for the previous year ended March 31, 2015 include the results of this acquired subsidiary and
business for the period August 14, 2014 to March 31, 2015 (Revenue from Operations of Rs. 18,862 lakhs and Profit before
tax of Rs. 4,006.61 lakhs) and are therefore not comparable with figures of the current year.
153 | Annual Report 2015-16
Name of the Entity
Net Asset, i.e., total assets minus total liabilities
Share in profit or loss
As % of consolidated
net assets
Amount(Rs. in lakhs)
As % of consolidated profit or loss
Amount(Rs. in lakhs)
Foreign Subsidiaries
1. Zensar Technologies Inc. [ZTI] 20.6% 31,620.82 18.2% 5,690.98
-PSI Holding Group, Inc. 0.2% 353.38 -0.1% (19.13)
a. Zensar Technologies IM, Inc (formerly known as
Akibia, Inc.)8.5% 13,022.91 -4.2% (1,323.75)
b. Aquila Technology Corp. 0.6% 853.15 0.2% 70.77
c. Zensar Technologies IM, B.V. (formerly known as
Akibia B.V.)0.8% 1,248.53 0.2% 58.77
-Professional Access Ltd. 0.8% 1,177.23 0.8% 248.13
2. Zensar Technologies (Singapore) Pte Ltd 0.6% 906.57 0.6% 184.61
3. Zensar Technology (Shanghai) Company Limited -0.1% (117.96) 0.0% (13.95)
4. Zensar Technologies (UK) Limited [ZT (UK)] 5.9% 9,014.45 8.4% 2,610.85
5. Zensar (Africa) holdings (Pty) Ltd. 0.0% 52.40 0.0% (0.29)
- Zensar (South Africa) (Pty) Ltd. 0.9% 1,343.88 3.5% 1,100.13
Minority Interest in Foreign Subsidiaries
1. Zensar (South Africa) (Pty) Ltd 0.3% 391.10 0.9% 275.03
37 The Company vide a Board resolution dated October 22, 2013 had resolved to liquidate its subsidiary Company in Japan,
Zensar Advanced Technologies Limited, with effect from March 31, 2014. Accordingly, the subsidiary had ceased its
operations effective March, 31 2014 and had completed the liquidation as per the laws of Japan.
38 Additional information on subsidiaries as mandated by Schedule III - General Instruction for the preparation of Consolidated
Financial Statements of Companies Act, 2013
Notes to the Consolidated Financial Statementsas at and for the year ended March 31, 2016 (Contd.)
Zensar Technologies Ltd | 154
Notes to the Consolidated Financial Statementsas at and for the year ended March 31, 2016 (Contd.)
39 Tax Expense for the year ended March 31, 2016 and March 31, 2015 is net of excess provision for earlier years written back
- Rs. 1,120.31 lakhs and Rs. 174.05 lakhs respectively.
40 Reclassification
Previous Year Figures have been reclassified to conform to this year's classification.
For Price Waterhouse For and on behalf of the Board of Directors of Firm Registration Number: 301112E Zensar Technologies Limited Chartered Accountants Amit Borkar H.V. Goenka Sandeep KishorePartner Chairman Managing Director & CEOMembership No. 109846 DIN: 00026726 DIN: 07393680 S. Balasubramaniam Nilesh Limaye Chief Financial Officer Company Secretary
Place: Pune Place: MumbaiDate: April 22, 2016 Date: April 22, 2016

155 | Annual Report 2015-16
NOTES

Zensar Technologies Ltd | 156
NOTES

ZENSAR TECHNOLOGIES LIMITEDRegd. Off.: Zensar Knowledge Park, Kharadi, Plot # 4, MIDC, Off Nagar Road, Pune 411 014
(CIN L72200PN1963PLC012621)
NOTICE
NOTICE IS HEREBY GIVEN THAT THE 53RD ANNUAL GENERAL MEETING OF THE MEMBERS OF ZENSAR
TECHNOLOGIES LIMITED WILL BE HELD AT THE REGISTERED OFFICE OF THE COMPANY AT ZENSAR
KNOWLEDGE PARK, PLOT # 4, KHARADI MIDC, OFF NAGAR ROAD, PUNE 411014 ON WEDNESDAY, 20TH
DAY, OF JULY, 2016 AT 12.00 NOON TO TRANSACT THE FOLLOWING BUSINESS:
ORDINARY BUSINESS:
Item No. 1 – Adoption of Financial Statements.
To receive, consider and adopt the Audited Financial Statements of the Company for the financial year ended 31st
March, 2016 and the Auditors' Report thereon and the Report of the Directors along with the Audited Consolidated
Financial Statements of the Company for the financial year ended 31st March, 2016 and the Auditors' Report
thereon.
Item No. 2 – Approve the payment of Interim Dividend paid during the year 2015-16.
To confirm payment of First and Second Interim Dividends for the financial year ended 31st March, 2016.
Item No. 3 – Re - appointment of Mr. Arvind Agrawal.
To appoint a Director in place of Mr. Arvind Agrawal (DIN 00193566), who retires by rotation, and being eligible,
offers himself for re-appointment. Members are requested to consider and if thought fit, to pass with or without
modification(s), the following Resolution as an Ordinary Resolution.
RESOLVED THAT pursuant to provisions of Section 152 and other applicable provisions of the Companies Act
2013, the approval of the members of the Company be and is hereby accorded to the reappointment of Mr. Arvind
Agrawal as a Non-executive Director liable to retire by rotation.
Item No. 4 – Appointment of Auditors.
To appoint M/s Price Waterhouse, Chartered Accountants having ICAI Firm Registration No.301112E, as the
Auditors of the Company, to hold office from the conclusion of this Annual General Meeting until the conclusion of
the next Annual General Meeting and fix their remuneration. Members are requested to consider and if thought fit,
to pass with or without modification(s), the following Resolution as an Ordinary Resolution.
RESOLVED THAT pursuant to Section 139, 142 and other applicable provisions of the Companies Act, 2013, and
the Rules made thereunder as amended from time to time, pursuant to the recommendation of the Audit
Committee and the Board of Directors, approval of the Members of the Company be and is hereby accorded for
appointment of M/s Price Waterhouse, Chartered Accountants having ICAI Firm Registration No.301112E as
auditors of the company to hold the office from conclusion of this Annual General Meeting until the conclusion of
next Annual General Meeting for conducting audit of financial statements of the company for financial year
2016-17 and Board / Audit Committee is authorised to fix the remuneration in consultation with the Auditors.
(1)
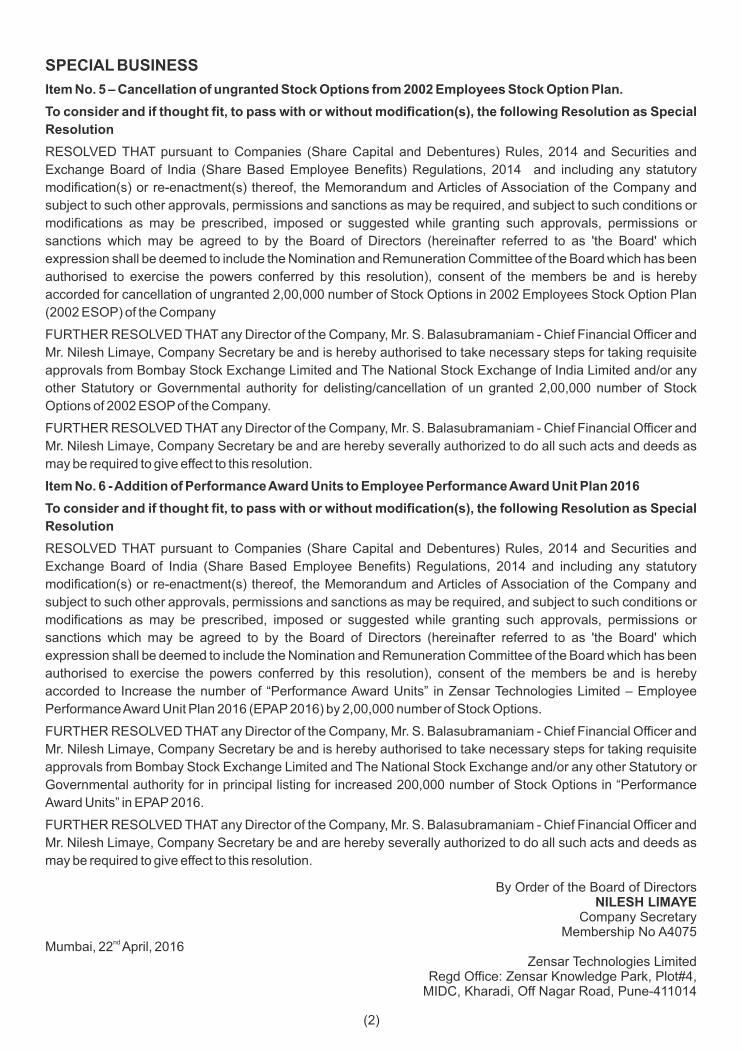
SPECIAL BUSINESS
Item No. 5 – Cancellation of ungranted Stock Options from 2002 Employees Stock Option Plan.
To consider and if thought fit, to pass with or without modification(s), the following Resolution as Special
Resolution
RESOLVED THAT pursuant to Companies (Share Capital and Debentures) Rules, 2014 and Securities and
Exchange Board of India (Share Based Employee Benefits) Regulations, 2014 and including any statutory
modification(s) or re-enactment(s) thereof, the Memorandum and Articles of Association of the Company and
subject to such other approvals, permissions and sanctions as may be required, and subject to such conditions or
modifications as may be prescribed, imposed or suggested while granting such approvals, permissions or
sanctions which may be agreed to by the Board of Directors (hereinafter referred to as 'the Board' which
expression shall be deemed to include the Nomination and Remuneration Committee of the Board which has been
authorised to exercise the powers conferred by this resolution), consent of the members be and is hereby
accorded for cancellation of ungranted 2,00,000 number of Stock Options in 2002 Employees Stock Option Plan
(2002 ESOP) of the Company
FURTHER RESOLVED THAT any Director of the Company, Mr. S. Balasubramaniam - Chief Financial Officer and
Mr. Nilesh Limaye, Company Secretary be and is hereby authorised to take necessary steps for taking requisite
approvals from Bombay Stock Exchange Limited and The National Stock Exchange of India Limited and/or any
other Statutory or Governmental authority for delisting/cancellation of un granted 2,00,000 number of Stock
Options of 2002 ESOP of the Company.
FURTHER RESOLVED THAT any Director of the Company, Mr. S. Balasubramaniam - Chief Financial Officer and
Mr. Nilesh Limaye, Company Secretary be and are hereby severally authorized to do all such acts and deeds as
may be required to give effect to this resolution.
Item No. 6 - Addition of Performance Award Units to Employee Performance Award Unit Plan 2016
To consider and if thought fit, to pass with or without modification(s), the following Resolution as Special
Resolution
RESOLVED THAT pursuant to Companies (Share Capital and Debentures) Rules, 2014 and Securities and
Exchange Board of India (Share Based Employee Benefits) Regulations, 2014 and including any statutory
modification(s) or re-enactment(s) thereof, the Memorandum and Articles of Association of the Company and
subject to such other approvals, permissions and sanctions as may be required, and subject to such conditions or
modifications as may be prescribed, imposed or suggested while granting such approvals, permissions or
sanctions which may be agreed to by the Board of Directors (hereinafter referred to as 'the Board' which
expression shall be deemed to include the Nomination and Remuneration Committee of the Board which has been
authorised to exercise the powers conferred by this resolution), consent of the members be and is hereby
accorded to Increase the number of “Performance Award Units” in Zensar Technologies Limited – Employee
Performance Award Unit Plan 2016 (EPAP 2016) by 2,00,000 number of Stock Options.
FURTHER RESOLVED THAT any Director of the Company, Mr. S. Balasubramaniam - Chief Financial Officer and
Mr. Nilesh Limaye, Company Secretary be and is hereby authorised to take necessary steps for taking requisite
approvals from Bombay Stock Exchange Limited and The National Stock Exchange and/or any other Statutory or
Governmental authority for in principal listing for increased 200,000 number of Stock Options in “Performance
Award Units” in EPAP 2016.
FURTHER RESOLVED THAT any Director of the Company, Mr. S. Balasubramaniam - Chief Financial Officer and
Mr. Nilesh Limaye, Company Secretary be and are hereby severally authorized to do all such acts and deeds as
may be required to give effect to this resolution.
By Order of the Board of DirectorsNILESH LIMAYE
Company SecretaryMembership No A4075
ndMumbai, 22 April, 2016Zensar Technologies Limited
Regd Office: Zensar Knowledge Park, Plot#4, MIDC, Kharadi, Off Nagar Road, Pune-411014
(2)

NOTES1. A MEMBER ENTITLED TO ATTEND AND VOTE AT THE MEETING IS ENTITLED TO APPOINT A PROXY
TO ATTEND AND VOTE IN HIS STEAD AND A PROXY NEED NOT BE A MEMBER. THE INSTRUMENT DULY COMPLETED APPOINTING THE PROXY SHALL BE DEPOSITED AT THE REGISTERED OFFICE OF THE COMPANY NOT LESS THAN 48 HOURS BEFORE THE COMMENCEMENT OF THE MEETING. A person can act as a proxy on behalf of not exceeding 50 (fifty) members and holding in aggregate not more than 10 (ten) percent of the total share capital of the Company. During the business hours of the Company , proxies are open for inspection for the period beginning before 24 (twenty four) hours from the commencement of the Meeting and ending with the conclusion of the meeting provided that an advance notice of not less than three days is given to the Company. .
2. Corporate Members intending to send their authorised representatives to attend the meeting are requested to send certified true copy of the Board resolution to the Company authorising their representative to attend and vote on their behalf at the Meeting.
3. SECURITIES AND EXCHANGE BOARD OF INDIA (SEBI) HAS THROUGH A CIRCULAR DIRECTED ALL THE COMPANIES TO PAY DIVIDEND THROUGH ELECTRONIC MODE. ACCORDINGLY ALL THE MEMBERS HOLDING SHARES IN DEMATERIALISED FORM ARE REQUESTED TO KINDLY UPDATE THEIR BANK ACCOUNT DETAILS WITH THEIR RESPECTIVE DEPOSITORY PARTICIPANTS (DP). MEMBERS HOLDING SHARES IN PHYSICAL FORM ARE REQUESTED TO KINDLY INFORM THEIR BANK ACCOUNT DETAILS TO THE COMPANY AND/OR THE REGISTRAR AND SHARE TRANSFER AGENTS VIZ. SHAREPRO SERVICES (INDIA) PRIVATE LIMITED.
4. Only registered Members carrying the attendance slip and the holders of valid proxies registered with the Company will be permitted to attend the Meeting. Corporate Members intending to send their representatives are requested to send a certified true copy of the Resolution authorizing the representative to attend and vote at the Annual General Meeting.
5. In terms of the Provisions of the Companies Act, 2013 and rules made thereunder and Articles of Association of the Company, Mr. Arvind Agrawal retire by rotation and being eligible offer himself for Re-appointment. A brief resume of Mr. Arvind Agrawal along with nature of his expertise are given herewith and forms part of the notice convening the Annual General Meeting.
6. Members are requested to notify any change in their addresses specifying full address in block letters with PIN code of the post office, to the Company's Registrar and Share Transfer Agents at the following address:
Sharepro Services (India) Pvt. Ltd.
13 AB Samhita Warehousing Complex, Off. Andheri Kurla Road,
Sakinaka Telephone Exchange LaneSakinaka, Andheri East, Mumbai 400 072
Tel : +91-22-67720300/400
7. Members are requested to bring their copy of the Annual Report with them to the Meeting.
8. Members desiring any information with regard to Accounts/Reports are requested to write to the Company Secretary at least ten days before the Meeting so as to enable the Management to keep the information ready.
9. The Company's Register of Members and Share Transfer Books will remain closed from 13th July, 2016 to 20th July, 2016 (both days inclusive).
10. Pursuant to the provisions of the Section 205A of the Companies Act, 1956, Company has transferred unpaid Dividend up to the year 2008 remaining unpaid for Seven years to Investors Education and Protection Fund (IEPF). Members who have not en-cashed their dividend warrants for the subsequent years are requested to send their Dividend Warrants for revalidation to the Company or it Registrar and Share Transfer Agents.
11. Investors may address their quer ies/communicat ions to [email protected] and/or [email protected].
12. The Annual Report 2015-16 is being sent through electronic mode only to the Members whose e mail addresses are registered with the Company/Depository Participant (s) unless any member has requested for physical copy of the Report. For Members who have not registered their e mail addresses, physical copies of the Annual Report 2015-16 are being sent by permitted mode.
13. To support the Green initiatives taken by Ministry of Corporate Affairs, Members are requested to register their Email Address with Depository Participant/Company so that all communications / documents can be sent in electronic mode.
14. The voting for the agenda item shall be done by casting of votes by using Remote e voting that is an electronic voting system from a place other than the venue of the Meeting (e-voting) and by Poll at the Meeting. Those who have exercised the option of e-voting shall be entitled to attend and participate in the Meeting but would not be entitled to vote at the Poll to be conducted at the venue of the AGM on the day of meeting
15. Mr. S. V. Deulkar, Partner, SVD & Associates, Company Secretaries has been appointed as the Scrutinizer to scrutinize the e-voting process and Poll in a fair and transparent manner.
(3)
16. The Scrutinizer shall within a period not exceeding three (3) working days from the conclusion of the e-voting period unblock the votes in the presence of at least two (2) witnesses not in the employment of the Company and make a consolidated Scrutinizer's Report of the votes cast in favour or against, if any, forthwith to the Chairman of the Company and/or authorised person of the Company who shall declare the results forthwith.
17. The Results declared along with the Scrutinizer's Report shall be placed on the Company's website www.zensar.com and on the CDSL's website www.cdslindia.com and communicated to the Stock Exchanges immediately after declaration
18. The information and instructions relating to e voting are as below :
I. In compliance with provisions of Section 108 of the Companies Act, 2013 and Companies (Management and Administration) Rules, 2014, the Company is pleased to provide members facility to exercise their right to vote by way of e voting at the 53rd Annual General Meeting (AGM) by electronic means and the business may be transacted through e-Voting Services provided by Central Depository Services Limited (CDSL)
II. The e-voting period commences on 17th July, 2016 (9:00 am) and ends on 19th July, 2016 (5:00 pm). During this period shareholders' of the Company, holding shares either in physical form or in dematerialized form, as on 13th July, 2016 that is the cut-off date, may cast their vote electronically. The e-voting module shall be disabled by CDSL for voting thereafter. Once the vote on a resolution is cast by the shareholder, the shareholder shall not be allowed to change it subsequently.
III. The Notice convening the Annual General Meeting along with Annual Report for the year 2015-16 is hosted on the Company's website www.zensar.com The Notice convening the Annual General Meeting has also been hosted on CDSL's website www.cdslindia.com
IV. Any person who becomes Member after dispatch of Notice of the meeting and holding shares as on cut-off date that is 13th July, 2016 and who have updated their PAN with the Company/Depository Participant have to follow instructions as per points (VI) to (XXIII) below to vote through e-voting during the e voting period that commences on 17th July, 2016 (9:00 am) and ends on 19th July, 2016 (5:00 pm).
V. Any person who becomes Member after dispatch of Notice of the meeting and holding shares as on cut-off date that is 13 th July, 2016 and who have not updated their PAN with the Company/Depository Participant can send an email to [email protected] and [email protected] to obtain sequence number and then they will have to follow instructions as per points (VI) to (XXIII) below to vote through e-voting during the e voting period that commences on 17th July, 2016 (9:00 am) and ends on 19th July, 2016 (5:00 pm).
VI. The shareholders should log on to the e-voting website www.evotingindia.com
VII. Click on Shareholders.
VIII. Now Enter your User ID
a. For CDSL: 16 digits beneficiary ID,
b. For NSDL: 8 Character DP ID followed by 8 Digits Client ID,
c. Members holding shares in Physical Form should enter complete Folio Number registered with the Company.
IX. Next enter the Image Verification as displayed and Click on Login.
X. If you are holding shares in demat form and had logged on to www.evotingindia.com and voted on an earlier voting of any company, then your existing password is to be used.
XI. If you are a first time user follow the steps given below:
(4)
For Members holding shares in Demat Form and Physical Form
PANl Enter your 10 digit alpha-numeric PAN issued by Income Tax Department (Applicable
for both demat shareholders as well as physical shareholders)
l Members who have not updated their PAN with the Company/Depository Participant are requested to use the first two letters of their name and the 8 digits of the sequence number (printed on attendance slip) in the PAN Field.
l In case the sequence number is less than 8 digits enter the applicable number of 0’s before the number after the first two characters of the name in CAPITAL letters. Eg. If your name is Ramesh Kumar with sequence number 1 then enter RA00000001 in the PAN Field.
Dividend Bank Details
Enter the Dividend Bank Details or Date of Birth (in dd/mm/yyyy format) as recorded in your demat account or in the company records in order to login.
OR Date of Birth (DOB)
If both the details are not recorded with the depository or company please enter the member id / folio number in the Dividend Bank details field as mentioned in instruction (viii).

(5)
XII. After entering these details appropriately, click on “SUBMIT” tab.
XIII. Members holding shares in physical form will then directly reach the Company selection screen. However, members holding shares in demat form will now reach 'Password Creation' menu wherein they are required to mandatorily enter their login password in the new password field. Kindly note that this password can also be used by the Members for voting for resolutions of any other company on which they are eligible to vote, provided that company opts for e-voting through CDSL platform. It is strongly recommended not to share your password with any other person and take utmost care to keep your password confidential.
XIV. For Members holding shares in physical form, the details can be used only for e-voting on the resolutions contained in this Notice.
XV. Click on the EVSN for <Zensar Technologies Limited> on which you choose to vote.
XVI. On the voting page, you will see “RESOLUTION DESCRIPTION” and against the same the option “YES/NO” for voting. Select the option YES or NO as desired. The option YES implies that you assent to the Resolution and option NO implies that you dissent to the Resolution.
XVII. Click on the “RESOLUTIONS FILE LINK” if you wish to view the entire Resolution details.
XVIII. After selecting the resolution you have decided to vote on, click on “SUBMIT”. A confirmation box will be displayed. If you wish to confirm your vote, click on “OK”, else to change your vote, click on “CANCEL” and accordingly modify your vote.
XIX. Once you “CONFIRM” your vote on the resolution, you will not be allowed to modify your vote.
XX. You can also take out print of the voting done by you by clicking on “Click here to print” option on the Voting page.
XXI. If Demat account holder has forgotten his/her changed password then enter the User ID and the image verification code and click on Forgot Password & enter the details as prompted by the system.
XXII. Note for Non – Individual Shareholders and Custodians.
l Non-Individual shareholders (i.e. other than Individuals, HUF, NRI etc.) and Custodian are required to log on to www.evotingindia.com and register themselves as Corporates.
l A scanned copy of the Registration Form bearing the stamp and sign of the entity should be emailed to [email protected].
l After receiving the login details a compliance user should be created using the admin login and password. The Compliance user would be able to link the account(s) for which they wish to vote on.
l The list of accounts should be mailed to [email protected] and on approval of the accounts they would be able to cast their vote.
l A scanned copy of the Board Resolution or Power of Attorney (POA) which they have issued in favour of the Custodian, if any, should be uploaded in PDF format in the system for the scrutinizer to verify the same.
XXIII. In case you have any queries or issues regarding e-voting, you may refer the Frequently Asked Questions (”FAQS”) e-voting Manual available at www.evotingindia.com, under help section or write an e-mail to [email protected].
EXPLANATORY STATEMENT PURSUANT TO SECTION 102 OF THE COMPANIES ACT, 2013
Item No. 5 & 6:
Company in which no new stock options have been granted after the year 2008.
The Company now has launched Zensar Technologies Limited – Employee Performance Award Unit Plan 2016
(EPAP 2016) for which approval of the Members was obtained by way of Postal Ballot in March 2016.
The Company does not intend to grant any further stock options under 2002 ESOP and hence, it is proposed to
cancel un granted 2,00,000 number of Stock Options in 2002 Employees Stock Option Plan (2002 ESOP) of the
Company and to Increase the number of Performance Award Units in Zensar Technologies Limited – Employee
Performance Award Unit Plan 2016 (EPAP 2016) by 2,00,000 and approval of the members is sought for the same.
The other terms and conditions with respect to 2002 ESOP and EPAP 2016 remains unchanged.
None of the Directors, KMPs and their relatives of the Company is concerned or interested in any way in this
Resolution except to the number of Performance Award Units that may be granted to them in future from EPAP
2016.

(6)
ADDITIONAL INFORMATION:
DETAILS OF DIRECTOR SEEKING RE-APPOINTMENT
BRIEF RESUME OF MR. ARVIND AGRAWAL
Currently serving as Non - executive Director on the Board of Zensar Technologies Limited and an IIM
(Ahmedabad) Alumnus. He has vast experience of 33 years in HR, TQM, Corporate Strategy and General
Management. He was awarded “National HRD Award” in 1992. He has been the “President” of the National HRD
network during 2000-02. He has worked with reputed organisations such as IBP, Escorts, Modi Xerox.
Mr. Arvind Agrawal does not hold any shares in the company.
Mr. Arvind Agrawal and his relatives may be deemed to be interested in the resolution pertaining to his
reappointment to the extent of their shareholding interest, if any, in the Company.
Save and except the above, none of the other Directors or Key Managerial Personnel of the Company or their
relatives is, in any way, concerned or interested, financially or otherwise, in the resolution.
Mr. Arvind Agrawal is currently Non-Executive Director on the board of the Company and Member of Nomination
and remuneration Committee, Banking Committee, Stakeholders Relationship Committee and CSR Committee
of the Board of Directors of the Company.
Mr. Arvind Agrawal holds Directorships in following Companies/Associations and does not hold position of
Chairman/Member of Committees other than those mentioned above.
By Order of the Board of DirectorsNILESH LIMAYE
Company SecretaryMembership No A4075
ndMumbai, 22 April, 2016Zensar Technologies Limited
Regd Office: Zensar Knowledge Park, Plot#4, MIDC, Kharadi, Off Nagar Road, Pune-411014
Name of the Company Designation
AFS Intercultural Programs of India Ltd Director
Withya HR Fund Pvt Ltd Director
Global HR Heads Partners LLP Partner
Withya HR Fund LLP Partner
Form No. MGT-11
Proxy Form[Pursuant to Section 105(6) of the Companies Act, 2013 and rule 19(3) of the
Companies (Management and Administration) Rules, 2014]
(CIN L72200PN1963PLC012621)
Name of the Company : Zensar Technologies Limited
Registered Office : Zensar Knowledge Park, Kharadi, Plot # 4, MIDC, Off Nagar Road, Pune 411 014
Name of the member(s) :
Registered address :
Email Id :
Folio No./Client Id :
DP ID :
I/We being the member(s) of ______________________ shares of the above named company, hereby appoint
1. Name : ____________________________________________
Address :
Email Id :
Signature : ______________________, or failing him
2. Name : ____________________________________________
Address :
Email Id :
Signature : ______________________, or failing him
3. Name : ____________________________________________
Address :
Email Id :
Signature : ______________________
rdas my / our proxy to attend and vote (on a poll) for me / us on my / our behalf at the 53 Annual General Meeting of the Company thto be held on the 20 day of July, 2016 at 12.00 noon at Zensar Knowledge Park, Kharadi, Plot # 4, MIDC, Off Nagar Road, Pune
411 014 and at any adjournment thereof in respect of such resolutions as are indicated below:
Resolution No.
1. Adoption of Financial Statements (Ordinary Resolution)
2. Approve the payment of Interim Dividend paid during the year 2016-16 (Ordinary Resolution)
3. Re - appointment of Mr. Arvind Agrawal (Ordinary Resolution)
4. Appointment of Auditors (Ordinary Resolution)
5. Cancellation of ungranted Stock Options from 2002 Employees Stock Option Plan (Special Resolution)
6. Addition of Performance Award Units to Employee Performance Award Unit Plan 2016 (Special Resolution)
Signed this ................................................................ day of ................................. 2016
Signature of shareholder : ______________________
Signature of Proxy holder(s) :______________________
Note : This form of proxy in order to be effective should be duly completed and deposited at the Registered Office of the Company not less than 48 hours before the commencement of the Meeting.
Affix Revenue
Stamp
TE
AR
HE
RE
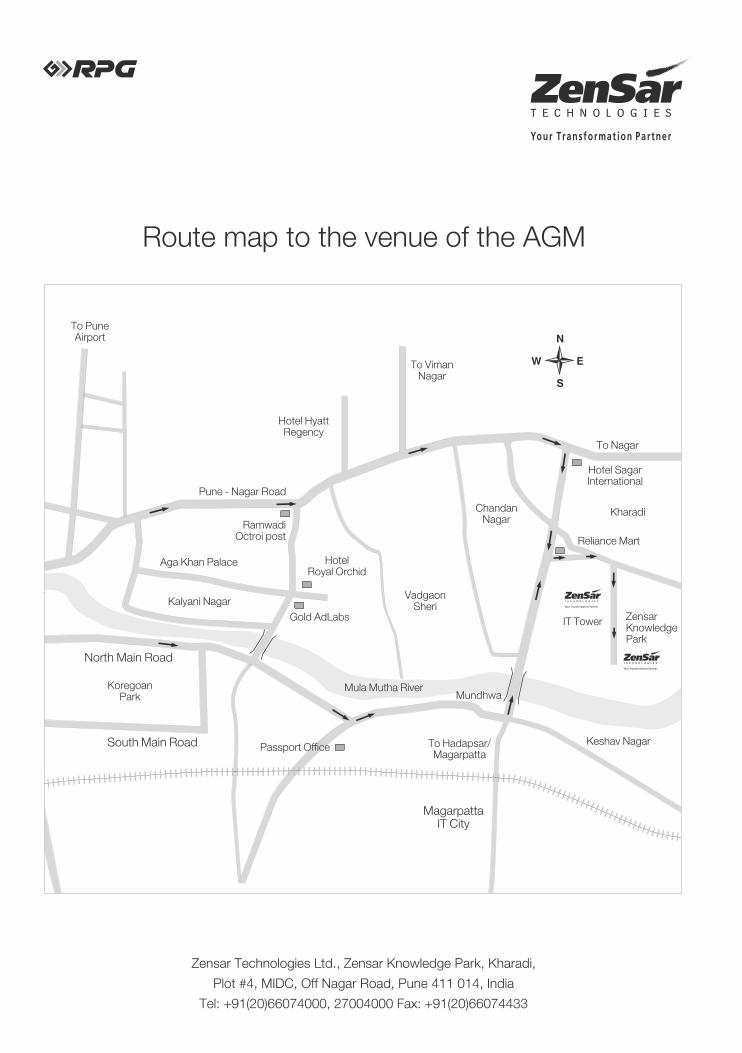

C O N T E N T S
01 R E T U R N O N D I G I TA L : T H E T H E M E 02 C O R P O R AT E S N A P S H O T
03 M I S S I O N R E P O R T 04 B O A R D O F D I R E C T O R S 05 L E A D E R S H I P T E A M
06-07 C H A I R M A N ’ S M E S S A G E 08-09 C E O ’ S N O T E
10-14 R E T U R N O N D I G I TA L : T H E Z E N S A R W AY
15-16 R E T U R N O N D I G I TA L : A D I F F E R E N T TA K E
17-78 D I R E C T O R S ’ R E P O R T A N D A N N E X U R E S
79-116 F I N A N C I A L S TAT E M E N T S
117-154 C O N S O L I D AT E D F I N A N C I A L S TAT E M E N T S

Zensar Technologies LimitedZensar Knowledge Park, Kharadi, Plot # 4, MIDC,
Off Nagar Road, Pune - 411014, Maharashtra, India
Tel: +91-20-6605 7500 | Fax: +91-20-6605 7888
[email protected] | www.zensar.com


![Zensar sharpens focus on ERP and Digital solutions [Company Update]](https://static.fdocuments.us/doc/165x107/577cb4b61a28aba7118ca088/zensar-sharpens-focus-on-erp-and-digital-solutions-company-update.jpg)