ZAMBIA Water Sector Performance Improvement …...vii Preface This Project Performance Assessment...
45
Report No. 111134 DECEMBER 19, 2016 ZAMBIA Water Sector Performance Improvement Project
Transcript of ZAMBIA Water Sector Performance Improvement …...vii Preface This Project Performance Assessment...

Report No. 111134
DECEMBER 19, 2016
ZAMBIA
Water Sector Performance Improvement Project

© 2016 International Bank for Reconstruction
and Development / The World Bank
1818 H Street NW
Washington DC 20433
Telephone: 202-473-1000
Internet: www.worldbank.org
This work is a product of the staff of The World
Bank with external contributions. The findings,
interpretations, and conclusions expressed in
this work do not necessarily reflect the views of
The World Bank, its Board of Executive
Directors, or the governments they represent.
The World Bank does not guarantee the
accuracy of the data included in this work. The
boundaries, colors, denominations, and other
information shown on any map in this work do
not imply any judgment on the part of The
World Bank concerning the legal status of any
territory or the endorsement or acceptance of
such boundaries.
RIGHTS AND PERMISSIONS
The material in this work is subject to copyright.
Because The World Bank encourages
dissemination of its knowledge, this work may be
reproduced, in whole or in part, for
noncommercial purposes as long as full
attribution to this work is given.
Any queries on rights and licenses, including
subsidiary rights, should be addressed to
World Bank Publications, The World Bank
Group, 1818 H Street NW, Washington, DC
20433, USA; fax: 202-522-2625; e-mail:

Report No.: 111134
PROJECT PERFORMANCE ASSESSMENT REPORT
REPUBLIC OF ZAMBIA
WATER SECTOR PERFORMANCE IMPROVEMENT PROJECT
(IDA-42330 AND IDA-45500)
December 19, 2016
Financial, Private Sector, and Sustainable Development
Independent Evaluation Group

ii
Currency Equivalents (annual averages)
Currency Unit =Zambian Kwacha ZKW
2007 US$1.00 ZMK4,413.95
2008 US$1.00 ZMK3,830.00
2009 US$1.00 ZMK4,785.00
2010 US$1.00 ZMK4,640.99
2011 US$1.00 ZMK4,780.00
2012 US$1.00 ZMK5,115.00
2013 US$1.00 ZMK5,207.82
Abbreviations and Acronyms
CAS Country Assistance Strategy
CP Cooperating Partners
FGD Focus Group Discussion
ICR Implementation Completion Report
IDA International Development Corporation
IEG Independent Evaluation Group
LCC Lusaka City Council
LWSC Lusaka Water and Sanitation Company
MCC Millennium Challenge Corporation of the United States of America
MLGH Ministry of Local Government and Housing
NWASCO National Water and Sanitation Council
PPAR Project Performance Assessment Report
PRSP Poverty Reduction Strategy Paper
WSS Water and Sanitation Services
Fiscal Year
Government: January 1 to December 31
Director-General, Independent Evaluation Group : Ms. Caroline Heider
Director, IEG Fin, PS & SD Department (Acting) : Mr. Stoyan Tenev
Manager, IEG Sustainable Development Unit : Ms. Midori Makino
Task Team Leader : Mr. Ramachandra Jammi

iii
Contents
Contents ............................................................................................................................. iii
Preface............................................................................................................................... vii
Summary .......................................................................................................................... viii
1. Background and Context................................................................................................. x
2. Objectives, Design, and their Relevance ........................................................................ 5
Relevance of Objectives ................................................................................................. 5
Design ............................................................................................................................. 6
Relevance of Design ....................................................................................................... 7
3. Implementation ............................................................................................................... 8
Project Costs ................................................................................................................... 8
Implementation Experience ............................................................................................ 8
Monitoring and Evaluation (M&E) ............................................................................ 9
Safeguards ................................................................................................................. 10
Fiduciary Compliance ............................................................................................... 11
4. Achievement of the Objectives ..................................................................................... 11
Outputs and Outcomes .............................................................................................. 11
5. Efficiency ...................................................................................................................... 16
6. Ratings .......................................................................................................................... 16
Outcome ........................................................................................................................ 16
Risk to Development Outcome ..................................................................................... 17
Bank Performance ......................................................................................................... 18
Borrower Performance .................................................................................................. 19
7. Lessons .......................................................................................................................... 20
References ......................................................................................................................... 21
Appendix A. Basic Data Sheet.......................................................................................... 22
Appendix B. Report on the Focus Group Discussions Conducted in May 2016 .............. 25
Appendix C. List of Persons Met ...................................................................................... 33
This report was prepared by Joseph Bredie, Consultant, who assessed the project in May, 2016.
Ramachandra Jammi was the task team leader. The report was peer reviewed by Vijay Jagannathan and
Oscar Alvarado and panel reviewed by Robert Lacey. Grace Ingrid Chilambo and Romayne Pereira
provided administrative support.

iv
Tables
Table 1. Key Performance Indicators: Original and Revised ............................................. 5
Table 2. Focus Group Discussion Locations ................................................................... 14
Table 3 List of Settlements by District and Type ............................................................ 25
Table 4 List of Metering Type by District and Settlement .............................................. 28
Table 5 Types of Sanitation Facilities by District Settlement ......................................... 31

v
Principal Ratings
ICR* ICR Review* PPAR
Outcome Moderately Satisfactory Moderately Satisfactory Moderately
Unsatisfactory
Risk to
Development
Outcome
Substantial Significant High
Bank Performance Moderately Satisfactory Moderately Satisfactory Moderately Satisfactory
Borrower
Performance
Moderately Satisfactory Moderately Satisfactory Moderately
Unsatisfactory
* The Implementation Completion Report (ICR) is a self-evaluation by the responsible Bank department. The ICR Review is an intermediate IEGWB product that seeks to independently verify the findings of the ICR.
Key Staff Responsible
Project Task Manager/Leader
Division Chief/
Sector Director Country Director
Appraisal Jane Walker Jaime M. Biderman Michael Baxter
Completion Michael John Webster R. Mukami Kariuki Kundhavi Kadiresan
vi
IEG Mission: Improving World Bank Group development results through excellence in independent evaluation.
About this Report
The Independent Evaluation Group assesses the programs and activities of the World Bank for two purposes: first, to ensure the integrity of the Bank’s self-evaluation process and to verify that the Bank’s work is producing the expected results, and second, to help develop improved directions, policies, and procedures through the dissemination of lessons drawn from experience. As part of this work, IEG annually assesses 20-25 percent of the Bank’s lending operations through field work. In selecting operations for assessment, preference is given to those that are innovative, large, or complex; those that are relevant to upcoming studies or country evaluations; those for which Executive Directors or Bank management have requested assessments; and those that are likely to generate important lessons.
To prepare a Project Performance Assessment Report (PPAR), IEG staff examine project files and other documents, visit the borrowing country to discuss the operation with the government, and other in-country stakeholders, interview Bank staff and other donor agency staff both at headquarters and in local offices as appropriate, and apply other evaluative methods as needed.
Each PPAR is subject to technical peer review, internal IEG Panel review, and management approval. Once cleared internally, the PPAR is commented on by the responsible Bank country management unit. The PPAR is also sent to the borrower for review. IEG incorporates both Bank and borrower comments as appropriate, and the borrowers' comments are attached to the document that is sent to the Bank's Board of Executive Directors. After an assessment report has been sent to the Board, it is disclosed to the public.
About the IEG Rating System for Public Sector Evaluations
IEG’s use of multiple evaluation methods offers both rigor and a necessary level of flexibility to adapt to lending instrument, project design, or sectoral approach. IEG evaluators all apply the same basic method to arrive at their project ratings. Following is the definition and rating scale used for each evaluation criterion (additional information is available on the IEG website: http://ieg.worldbankgroup.org).
Outcome: The extent to which the operation’s major relevant objectives were achieved, or are expected to be achieved, efficiently. The rating has three dimensions: relevance, efficacy, and efficiency. Relevance includes relevance of objectives and relevance of design. Relevance of objectives is the extent to which the project’s objectives are consistent with the country’s current development priorities and with current Bank country and sectoral assistance strategies and corporate goals (expressed in Poverty Reduction Strategy Papers, Country Assistance Strategies, Sector Strategy Papers, and Operational Policies). Relevance of design is the extent to which the project’s design is consistent with the stated objectives. Efficacy is the extent to which the project’s objectives were achieved, or are expected to be achieved, taking into account their relative importance. Efficiency is the extent to which the project achieved, or is expected to achieve, a return higher than the opportunity cost of capital and benefits at least cost compared to alternatives. The efficiency dimension is not applied to development policy operations, which provide general budget support. Possible ratings for Outcome: Highly Satisfactory, Satisfactory, Moderately Satisfactory, Moderately Unsatisfactory, Unsatisfactory, Highly Unsatisfactory.
Risk to Development Outcome: The risk, at the time of evaluation, that development outcomes (or expected outcomes) will not be maintained (or realized). Possible ratings for Risk to Development Outcome: High, Significant, Moderate, Negligible to Low, Not Evaluable.
Bank Performance: The extent to which services provided by the Bank ensured quality at entry of the operation and supported effective implementation through appropriate supervision (including ensuring adequate transition arrangements for regular operation of supported activities after loan/credit closing, toward the achievement of development outcomes. The rating has two dimensions: quality at entry and quality of supervision. Possible ratings for Bank Performance: Highly Satisfactory, Satisfactory, Moderately Satisfactory, Moderately Unsatisfactory, Unsatisfactory, Highly Unsatisfactory.
Borrower Performance: The extent to which the borrower (including the government and implementing agency or agencies) ensured quality of preparation and implementation, and complied with covenants and agreements, toward the achievement of development outcomes. The rating has two dimensions: government performance and implementing agency(ies) performance. Possible ratings for Borrower Performance: Highly Satisfactory, Satisfactory, Moderately Satisfactory, Moderately Unsatisfactory, Unsatisfactory, Highly Unsatisfactory.

vii
Preface
This Project Performance Assessment Report (PPAR), prepared by the Independent
Evaluation Group (IEG), evaluates the Water Sector Performance Improvement Project
(WSPIP) (2007-2013) in Zambia.
The project was approved on October 5, 2006 with an IDA Credit (IDA-42330) of US$23
million. On April 16, 2009, the Bank’s Board approved an IDA Grant (IDA-45500) of
US$10 million in Additional Financing to scale up the project. The Project closed on
June 30, 2013, thirty-six months after the planned completion date of June 30, 2010 (The
IDA Grant was also closed on June 30, 2013).
The Project supported the Government’s on-going commitment to the urban and rural
water sector by improving access and sustainability of water supply and sanitation
services for consumers in Lusaka city and by supporting a more comprehensive
institutional structure for sector-wide investments. IEG selected the project for
assessment because of potential lessons from the experience of improving access to water
and sanitation services (WSS) for urban consumers through a commercially oriented
utility. In addition, the findings and lessons from this assessment would be inputs to
IEG’s major sector study on the Evaluation of the World Bank Group’s Support for
Water Supply and Sanitation Services, FY2007-2016.
This report draws on documentation for relevant Bank-funded projects including the
Project Appraisal Document, Implementation Completion and Results Report, legal
agreement, project files and archives. The report also benefitted from eight Focus Group
Discussions (FGDs) with local consumers, conducted by the IEG field mission during
May 16-28, 2016 in Lusaka, Luangwa, Chongwe and Kafue. The mission had discussions
with Bank staff in Washington and Zambia. Interviews and discussions were also held
with government and utility officials and representatives of the group of Cooperating
Partners (CPs) that invest in the sector in Zambia. The mission visited three water
treatment plants in Luangwa, Chongwe and Kafue that had been rehabilitated under the
project.
The mission expresses its appreciation for the generous time and attention from the
Borrower and all concerned parties. A list of persons met by the mission is in Appendix
C.
Following IEG practice, copies of the draft report were sent to government officials and
implementing agencies but no comments were received.
viii
Summary
This Project Performance Assessment Report (PPAR) assesses the development
effectiveness of the Water Sector Performance Improvement Project (WSPIP) in Zambia.
The project’s original objectives were: (i) the improvement of access to, and
sustainability of, the water supply and sanitation services for consumers in Lusaka; and
(ii) development of a comprehensive institutional structure supporting a coordinated
approach to water supply and sanitation investments. In 2009, Additional Financing was
approved, and the objectives were revised to (i) improve the technical efficiency and
financial sustainability of Lusaka Water and Sanitation Company and improve access to
water supply and sanitation services for urban consumers in Lusaka, Kafue, Chongwe,
and Luangwa districts, and (ii) strengthen the effectiveness of national water supply and
sanitation planning.
Project performance and ratings
With regard to the first original objective – improving access and sustainability of water
supply and sanitation services in Lusaka – the project helped about 5,000 people obtain
access to safe water through 100 new kiosks in peri-urban areas. Water availability
increased from 210,000 to 230,000 cubic meters (per day); coverage of beneficiaries for
water supply (64 percent to 87 percent) and sanitation services (64 percent to 71 percent);
water supply duration in peri-urban areas (15 hours/day to 20 hours/day); and water
quality (bio-content from 17.7 to 2 percent). However, IEG’s PPAR mission found
deterioration in these outcomes since project closure. Water supply at 10 of the 100
water kiosks has decreased from earlier levels due to low pressure during most of the day.
The focus group discussions indicated reduced levels of satisfaction regarding the
adequacy, reliability, and quality of water supply and sanitation services. The efficacy of
this objective is rated modest.
Progress was made in achieving the second original objective of developing a
comprehensive institutional structure supporting a coordinated approach to water supply
and sanitation investments. MLGH prepared separate Water and Sanitation Policies and
coordinated sector investments with the Cooperating Partners (CPs) on a regular basis by
2013. In 2016, MLGH continued to conduct regular reviews of sector performance and
investments with the CPs to further improvements in the institutional structure and
investments. Overall, the efficacy of this objective is rated substantial.
The efficacy of the first revised objective – to improve the technical efficiency and
financial sustainability of Lusaka Water and Sanitation Company and improve access to
water supply and sanitation services, for urban consumers in Lusaka, Kafue, Chongwe,
and Luangwa districts – is rated modest. While LWSC’s technical and financial
efficiency parameters had improved by closure, they have deteriorated since. Non-
revenue water losses increased from 41 percent in 2013 to 47 percent in 2015. Water
service coverage dropped from 87 percent in 2013 to 82.9 percent in 2015, and hours of
water supply from 20 to 17. Staff cost in relation to billing and collection increased from
0.48 percent to 0.63 percent, and operation and maintenance costs coverage by collection
dropped from 123 percent to 88 percent. Access to water supply had improved by 11,800
m3/day in the three districts of Chongwe, Kafue and Luangwa by 2012/13, increasing

ix
provision to 4,150 households from less than eight hours to an average of 17 hours per
day. However, the number of additional people connected amounted to 9,000, which was
far short of the target of 40,000. Intake to the water treatment plant at the Chongwe
River is dry from June till November and water has to be brought in by tanker trucks.
Similarly in Luangwa, water supply is interrupted sometimes for days on end due to
electrical power cuts. Moreover, the output of the thirteen boreholes drilled under the
project had dropped by 35 percent in 2015 compared to 2012.
Efficacy of the second revised objective – strengthening the national water supply and
sanitation planning – is rated modest. The planning capacity of the sector ministry
remains weak. The ministry has no clear mechanism to coordinate with the City Councils
that own and manage the utilities nor does it have a clear role in enforcing regulations for
WSS with regard, for instance, to bore-hole drilling by public, commercial or private
consumers. The project provided technical assistance to strengthen policy and planning
capacity at the Ministry. While modest improvements in capacity had been made at
project closing in 2013, ministry staff informed the PPAR mission that there are no
specific plans to improve or expand the ministries capacity or role in the sector.
Efficiency is rated modest. At closure, the Economic Rate of Return (ERR) was
estimated at 19 percent and the Financial Rate of Return (FRR) at 24 percent. However,
this assessment takes into account the significant delays in project implementation and
shortcomings in administrative and operational efficiency that can be attributed to factors
that were reasonably under the control of the Government and implementing agency.
Overall Development outcome is rated moderately unsatisfactory. Relevance of
objectives is rated high and that of design substantial for both the original and revised
objectives. Efficacy of the first and second original objectives is rated modest and
substantial respectively, while both the revised objectives are rated modest. Given
modest efficiency and weighting by the 20 percent/80 percent split in disbursement under
the original and revised project objectives, the overall project outcome is rated as
moderately unsatisfactory.
Risk to development outcome is rated high due to a combination of institutional,
operational, sectoral and exogenous factors. While there are substantial financial
commitments from the Cooperating Partners (CP/Donors) to address pressing
infrastructure, rehabilitation and capacity issues, investment coordination by the sector
ministry is in need of improvement. The incentive to address shortcomings in M&E,
planning and enforcement of regulation, appears to be low due to a lack of sufficient
pressure from consumers on the utility and elected officials for improvement in water and
sanitation services. Insufficient training and motivation of LWSC's technical staff affects
the drive to repair broken meters, replace faulty parts and install sensors to monitor meter
performance. The national power crisis – for which there appears to be no immediate
solution – is strongly impacting utility operations. Drought is predicted to become more
serious in the near future, hence affecting the supply and quality of groundwater.
Macroeconomic difficulties are likely to persist until copper prices strongly recover.
Bank Performance is rated moderately satisfactory, while Borrower performance is
rated moderately unsatisfactory The Bank appropriately built in the use of incentivized

x
performance agreements into project design and secured buy-in from the Government
and the regulator. The Bank showed flexibility with additional financing half way
through implementation of the original investment loan to ensure that the development
objectives of the project would be achieved. Supervision missions repeatedly flagged
major weaknesses and threats to progress with implementation and discussed solutions
for improvement with the implementing entities. While the project was high in the
country’s priorities for the water and sanitation sector, there were governmental delays in
paying a lapsed loan soon after project effectiveness, and in meeting the conditions of
effectiveness for additional finance. Both implementing agencies (LWSC and MLGH)
exhibited constraints in procurement and financial management capacity during
implementation.
Lessons
Maintaining the financial viability of a service provider requires strategies to deal
with exogenous factors in addition to securing technical and commercial efficiency
of operations. The financial viability of utilities supported by the project faces pressure
from reduced availability and increased cost of energy (with the crisis in hydropower),
thus adding to the effects of shortcomings in operational and technical efficiency and a
reduction in annual budget allocation for utility operation, maintenance, rehabilitation
and expansion, making it difficult to maintain the quality of water and sanitation service
delivery.
Sustainable provision of water supply services in the face of growing population and
demand requires active coordination between the authorities responsible for long-
term water resource planning, and service providers. In the case of Zambia, the
growing urban and rural population and recurrent droughts have strained surface and
ground water resources. In the project area, unregulated drilling of bore holes by public
agencies and public and private organizations and businesses is putting pressure on the
utilities. It is necessary for the Ministry of Water Development which is responsible for
water resources and the Ministry of Local Government and Housing responsible for the
water supply to coordinate in developing further strategies to manage the extraction and
use of river and surface water for competing users.
Alternative approaches need to be actively explored and adopted for urban and
rural sanitation, especially when conventional sewerage may not be financially
feasible. In the project areas, reliance on existing on-site sanitation facilities poses
problems, especially in the rainy season when run-off rainwater floods these facilities
which are not emptied or properly managed. Zambia could learn from countries that have
similar geographic, economic and demographic patterns, and have developed more
effective approaches to improving and managing sanitation facilities.
Stoyan Tenev
Acting Director
Financial, Private Sector, and
Sustainable Development Evaluation
Independent Evaluation Group

1
1. Background and Context
1.1 After a decade of sustained economic growth - averaging 5.7 percent per year –
Zambia attained lower-middle income status by 2013 with a per capita income of
US$1,810. Growth in 2014 was 5.5 percent. On the political front, Zambia has
successfully held seven peaceful national elections since independence in 1964.
1.2 More recently, Zambia is faced with difficult economic challenges. Growth is
estimated to have dropped below 4 percent in 2015 for the first time since 1998 resulting
in only marginal growth of per capita income. External challenges include slower
regional and global growth (crucially in China which is a major consumer of copper
which accounts for a large share of Zambia’s economic activity), and the strengthening of
the US Dollar against the Zambian currency Kwacha (making imports including oil more
expensive). Domestic pressures include a power crisis impacting all sectors of the
economy, repeated fiscal deficits that have reduced investor confidence, and low and
poorly-timed rains that have reduced agricultural incomes of the 62 percent of the
population living in poverty.1
1.3 The high poverty levels and prevailing inequality (with a 0.52 Gini coefficient),
are a reflection of the high concentration of growth in the urban and mining sectors
coupled with persistent low productivity in the mostly subsistence-based agricultural
sector. Zambia’s rural poverty rate was as high as 78 percent in 2010. Moreover, 42
percent of the population was living in extreme poverty with insufficient consumption to
meet their daily minimum food requirements. Although the poverty rate has declined
marginally over time, the absolute number of poor has increased from approximately 6.0
million in 1991 to 7.9 million in 2010 due to population growth.
1.4 Key measures of human development are worse than in many low-income
countries. Under 5 mortality is 119 per 1000 live births, life expectancy is 49, and
malnutrition in children under five is 45 percent (compared to respective low-income
country averages of 108, 50 and 36 percent). Malnutrition closely tracks poor sanitation.
Zambia ranks 141 out of 187 countries in the UN’s Human Development Index in 2014.
The prevalence of HIV/AIDS has remained at about 15 percent for the 15-49 age cohort
for the last decade. Zambia is lagging on various Millennium Development Goal (MDG)
targets, including those for water and sanitation.
1.5 Sixty-three percent2 of Zambians had access to clean drinking water supply
compared to an MDG target of 75 percent by 2015 as defined by the United Nations
Children’s Program (UNICEF)/World Health Organization (WHO) Joint Monitoring
Program (JMP). There is a stark contrast in water supply between urban areas (about 90
percent access in 2010 according to the UN) and rural areas (46 percent access). In urban
1 in 2010 (using Purchasing Power Parity at US$1.25 per day)
2 Source: Calculated from ZDHS 2013/14 dataset. The statistical data in this report suffers from substantial
inconsistencies between the data from the Joint Monitoring Program (JMP), Zambia’s Central Statistics
Office (CSO), Bank reports and government agencies. Water and sanitation data is produced primarily by
consultants and university researchers since the sector ministry has no in house monitoring and evaluation
function.

2
areas, 41 percent have access to water connections in their house or yard and 49 percent
rely on water kiosks and standpipes. Water kiosks are operated by private individuals
who have an agreement with water utilities and community based organizations. Kiosk
operators buy piped water in bulk and sell it at a regulated price of about one US cent per
20 liters. There were about 270 water kiosks in Lusaka (100 constructed under the
project) in 2013. Water quality that year was good, according to the National Water and
Sanitation Council (Nwasco) - 97 percent of water samples collected in urban areas were
in compliance with drinking water standards. However, in the Copperbelt, pollution from
the mines affects the drinking water supply negatively, and in some cases the
concentration of manganese was beyond treatable limits and water had to be brought in
by tankers to several mining towns.
1.6 Water supply in urban areas is presently (2016) intermittent and worsening to an
average of 17 hours supply a day in recent years due to electrical power cuts and
dwindling water resources. Zambia is nonetheless rich in rivers and lakes and only an
estimated 1.5 percent of the annual renewable water resources are being used at present.
During the dry season water resources are scarce especially in the south of the country
(due to insufficient reservoirs and dams and competition between agricultural and
industrial users). Annual rainfall averages between 1,400 mm in the north and declines to
700 mm in the south (including in Lusaka province). As a result, groundwater resources
are unevenly distributed.
1.7 Forty-three percent of the population had access to adequate sanitation3, (56
percent in urban areas and 34 percent in rural areas) compared to an MDG target of 70
percent. Zambia loses 1.3 percent of GDP due to the public health impact of poor
sanitation (Water and Sanitation Program - 2012) which results in child malnutrition,
illness and premature death. The economic burden of inadequate sanitation falls most
heavily on the poor who are less likely to have adequate sanitation facilities and access to
health services.
1.8 The adverse impact of poor sanitation is most acute in Lusaka, Zambia’s capital
and largest city. The population of the city was estimated at 1.7 million in 2008. With a
population growth rate of 4.5 percent, one of the highest in Sub-Saharan Africa, the city’s
population was estimated at 2.3 million in 2015 and is estimated to grow to 5 million by
2035. Lusaka is suffering from a sanitation crisis that claims lives4 through regular
occurrence of cholera, typhoid and dysentery, and causes severe environmental pollution.
An estimated 70 percent of Lusaka’s urban residents live in 33 “peri-urban areas”, where
roughly 90 percent of the population relies on pit latrines, most of which are
“unimproved”5. One percent defecate in the open. 50 percent of Lusaka’s water supply
is derived from fairly shallow groundwater abstracted within the city, which is prone to
contamination through fissures in the underlying rock. Decreasing annual rainfall, poor
3 Adequate sanitation is defined as a sanitation facility used by only one household and separating fecal
waste from human contact.
4 In 2012 it was estimated that, approximately 87,000 Zambians, including 6,600 children die each year
from diarrhea. Nearly 90% of incidences are attributed to poor water, sanitation and hygiene.
5 That is, they do not comply with the Joint Monitoring Program definition of adequate sanitation.
3
management of solid waste and storm water drainage and the generally flat terrain further
compound these problems.
Sector Policies and Institutional Arrangements
1.9 In November 1994, the Government adopted the National Water Policy that
aimed at promoting a sustainable water resources development with a view to facilitating
equitable provision of adequate quantity and quality of water for all competing groups of
users at acceptable costs while ensuring security of supply under varying conditions. The
seven principles of this reform program laid out in the1994 National Water Policy called
for: (i) separation of water resources functions from water supply and sanitation; (ii) the
separation of regulatory and executive functions; (iii) the devolution of responsibilities
for water supply to local authorities and private enterprises; (iv) achievement of full cost
recovery for water supply and sanitation (WSS) services through user charges in the long
run; (v) human resources development for effective institutions; (vi) the adoption of
technology in line with local conditions (and ability to pay); and (vii) increased
Government priority and budget spending for the sector. The 1994 policy was revised in
2010 and split into separate policies for water supply and sanitation. These policies are
expected to be approved by Parliament in 2016.
1.10 A 1995 Strategy and Institutional Framework for the Water and Sanitation Sector
set out the institutional arrangements for providing water and sanitation services by local
authorities. The 1998 sanitation strategy promotes awareness of sanitation in basic social
services and outlines the strategy to provide sanitation services. The 2004 Peri-urban
Water Supply and Sanitation Strategy formulates recommendations for increasing access
to WSS services for peri-urban low-income communities. The 2004 National
Decentralization Policy aims at decentralizing government responsibilities and functions
to lower levels of government through “devolution”. It reaffirms that local authorities are
the institution responsible for water and sanitation services.
1.11 Zambia was one of the first countries in Africa to establish an independent
regulatory agency for the urban water sector (the National Water Supply and Sanitation
Council - Nwasco) under the 1997 Water Supply and Sanitation Act No. 28. The Act
devolved the authority for water service provision from central government to local
authorities which were instructed to form autonomous water and sanitation Commercial
Utilities that were expected to be financially self-sufficient with respect to operation and
maintenance costs. It gave Nwasco the authority to ensure that these utilities produce
sustainable water supply and sanitation service and safe drinking water for a specific
number of hours of supply per day at a fair price. Nwasco regulates eleven utilities,
established between 1989 and 2009, that provide water and sanitation services to urban
areas across the country.
1.12 While the creation of utilities serving the urban population has progressed over
the last two decades, the task of building an institutional structure for rural water supply
and sanitation provision lagged. Despite the fact that the 2006 revised institutional
framework for rural water supply and sanitation re-emphasized the role of local
authorities, and provided for strengthening of these functions at the provincial and district

4
levels including the establishment of regional program support units, rural areas continue
to lag behind in creating effective local water and sanitation institutions.
1.13 The 1994 National Water Policy also stipulated the separation of water resources
management from water supply and sanitation. The 1997 Act made the Ministry of
Energy and Water (MEW) responsible for the water sector and the Ministry of Local
Government and Housing (MLGH) responsible for water supply and sanitation. In
addition, the Act devolved responsibility for controlling environmental pollution to the
Zambian Environmental Management Agency.
Project Background
1.14 The Lusaka Water and Sewerage Company (LWSC) is responsible for the
provision of water and sanitation services in Lusaka. LWSC was established in 1988 and
started operating in 1990. The utility is wholly owned by the Lusaka City Council (LCC).
At appraisal, LWSC provided water services directly to about 45,880 connections (of
which 33,370 were domestic connections) for the 1.5 million residents of Lusaka with a
coverage rate of about 80 percent on the network. Less than 30 percent of LWSC’s
connections were metered and the rest were billed on assessed values. LSWC produced
210,000 m3/day of water, lost 50 percent of production (20 percent through technical
losses and 30 percent through commercial losses). The water supply service provided in
conventional areas was reasonable (most customers received a 16 to 24 hour supply).
The extent and quality of service provided to the unplanned peri-urban compounds where
most of the poor reside was limited to a few hours a day for about 50 percent of
compound dwellers.
1.15 LWSC also served about 20,000 sewer connections. The main domestic sewage
treatment plant was designed to receive 36,000m3/day, but received 65,000 m3/day.
Since the plant could only treat a small amount of this, the rest was discharged. The plant
was in need of major rehabilitation and expansion.
1.16 The project aimed to respond to the need to improve access to water supply and
sanitation in Lusaka, improve sector planning, develop the institutional structure for
investment in the sector, and improve the operational performance of the commercial
utility - LWSC. The Bank had been involved in the urban water and sanitation sector
through two operations - the Urban Restructuring and Water Supply Project (URWSP)
(1996-2000) and the Mine Township Services Project (MTSP) (200-2005). Both the
2002 Poverty Reduction Strategy Paper (PRSP) and the 2004 Country Assistance
Strategy (CAS) emphasized that water resources needed to be developed to contribute to
poverty reduction and that the provision of water supply was critical to improved quality
of life. In addition, Zambia was lagging behind in meeting the Millennium Development
Goals (MDG) in the water sector. The project was included in the 2003-2007 CAS and
sought to add to human capacity development and improvements in the quality of life
through sustainable access to clean water supply and improved sanitation that would
assist Zambia in meeting the water supply and sanitation MDG.

5
2. Objectives, Design, and their Relevance
2.1 The original objective of the project (as stated in the Financing Agreement) was
to support the Recipient's efforts towards the: (i) improvement of access to, and
sustainability of, the water supply and sanitation services for consumers in Lusaka; and
(ii) development of a comprehensive institutional structure supporting a coordinated
approach to water supply and sanitation investments. The wording in the Project
Appraisal Document is slightly different: “The project development objective is to
support the Government’s on-going commitment to urban and rural water sector reforms
by improving access and sustainability of WSS services for consumers in Lusaka and by
supporting a more comprehensive institutional structure which will lead to a sector wide
approach for WSS investments.”
2.2 The project development objective (PDO) and Key Performance Indicators were
revised when Additional Financing (AF) was approved by the Board on 16 April, 2009.
The revised PDO, according to the March 18, 2009 Project Paper for Additional
Financing, is to support the Recipient’s effort to (i) improve the technical efficiency and
financial sustainability of LWSC and improve access to water supply and sanitation
services, for urban consumers in Lusaka, Kafue, Chongwe, and Luangwa districts, and
(ii) strengthen the effectiveness of national water supply and sanitation planning.
2.3 This report assessed the project based on the original PDO in the Financing
Agreement, and on the revised PDO from the Project Paper in a split evaluation.
2.4 The original and revised Key Performance Indicators are listed in the table below.
Table 1. Key Performance Indicators: Original and Revised
Original Revised
1 LWSC achieves coverage of operational
costs through its operational revenues
LWSC achieves 100% coverage of
operational costs through its
operational revenues
2 Investment program for WSS agreed by
MLGH and contributing donors
An additional 40,000 people in the 3
districts - Kafue, Chongwe, and
Luangwa - have access to safe water
by end of project
3 A common WSS Financing mechanism
agreed by MLGH and contributing donors
Relevance of Objectives
2.5 The project objectives were in line with the strategic priority 2 of the 2004
Country Assistance Strategy (CAS) for Zambia which aimed to improve lives and protect
the vulnerable. Reliable provision of water supply is critical to improved quality of life.
The project would add to human capacity development and supported an improved
quality of life through sustainable access to clean water supply and improved sanitation.
The project would also assist in Zambia meeting the Millennium Development Goals
(MDGs) in the water sector.

6
2.6 The project was closely aligned with Zambia’s priorities laid out in the Poverty
Reduction Strategy Paper (PRSP), 2002. The PRSP emphasized the role of infrastructure
in growth and diversification. One of the major issues, identified in the PRSP, was to
ensure that water resources were effectively developed to contribute to poverty reduction.
Lack of effective development of these resources was evidenced by large populations in
poor urban communities not served adequately by water utilities.
2.7 The relevance of the original objective remains high some three years after
project closing. The Government Vision 2030 – Becoming a Prosperous Middle-Income
Nation - has as one of its socio-economic development objectives - to provide secure
access to safe potable water sources and improved sanitation facilities to 100 percent of
the population in both urban and rural areas. The Bank’s 2013-2016 Country Partnership
Strategy (CPS) mentions continued inadequate access to clean and safe water and
sanitation as one of the obstacles to reduce poverty and vulnerability and accelerating
human development. The CPS noted that despite progress, Zambia remains behind
schedule in meeting the clean water and sanitation MDG targets of 75 percent access to
water and 73 percent access to sanitation by 2015 (according to the Central Statistical
Office in 2015 access to both water and sanitation was 72%).
2.8 The revised objectives also remained highly relevant to the Government’s goal for
the water sector and the 2013-2016 CPS. At a time when the LWSC is facing difficulties
in maintaining the supply and quality of WSS services in the face of electrical power
cuts, persistent drought and population pressures, and the objective of improving
LWSC’s technical and financial capacity continue to be highly relevant.
Design
2.9 The original project included two components. Component A: Support to LWSC
– Appraisal Estimate US$18.50 million- Actual Estimate US$31.90 million. This
component aimed to improve access to water supply and sanitation services in Lusaka
and introduce performance improvements and modern management methods for LWSC
to become a financially sustainable and efficient utility and to be able to finance new
investments from its own cash flows in the longer term. It included emergency goods
and works to improve access and sustainability of water supply and sanitation services in
Lusaka. It also included: support for the introduction of the Development Financing
Agreement for Performance Enhancement (DFAPE) program; support for the Human
Resource strategy, training and performance payments; and, the preparation of designs,
feasibility studies, and an Environmental Impact Assessment (EIA) for capital works.
2.10 Component B: Institutional capacity building in MLGH- Appraisal Estimate
US$1.10 million – Actual Estimate US$1.10 million. This included capacity building in
the MLGH to manage their water and sanitation (WATSAN) responsibilities; and,
development of the sub-sector financing mechanism for rural water supply and sanitation.
2.11 The revised components were: Revised Component A: Support to LWSC, and
improve water supply and sanitation services in four district towns in Lusaka province -
Appraisal Estimate US$18.5 million - Actual Estimate US$ 31.9 million. This included:
the provision of consultants’ services, goods, works and Operating Costs, for the

7
implementation of the Development Financing Agreement for Performance Enhancement
(DFAPE); Rehabilitation works for bulk water production, repair of distribution systems,
repair of sewer networks and plants and boreholes, including related studies, design and
supervision services for the water supply in Lusaka province: Design and implementation
of a human resources strategy, through the provision of technical assistance and
Performance Payments; and, Support towards the restructuring of LWSC aimed at
integrating the management of the additional districts within the LWSC’s corporate
structure.
2.12 Revised Component B: support to MLGH – Appraisal Estimate US$1.1 million –
Actual Estimate US$1.1 million. Support for the preparation of a coordinating
mechanism for water supply and sanitation sector, including: Provision of technical
assistance for the development of a national water supply and sanitation policy; provision
of technical assistance for the development of a financing mechanism for the water
supply and sanitation sector; and development of the sanitation and hygiene component
of the National Rural Water Supply and Sanitation Program including strengthening the
capacity of staff.
Relevance of Design
2.13 The original project design was substantially relevant to achieve the original
PDO. The project was designed as a three year Sector Investment Loan to improve the
water supply and sanitation services delivery in Lusaka and simultaneously address the
underlying institutional weaknesses and financial viability of LWSC while providing
support to the parent ministry (MLGH) in addressing strategic sector issues. The
components were directly linked to the objective of improving the performance of LWSC
with the introduction of the Performance Enhancement Agreement between LWSC and
the Ministry of Finance represented by MLGH. They also supported additional access to
water supply in the poor peri-urban areas and improvements in water quality.
2.14 The revised project design was also substantially relevant to the revised objective
to strengthen the Lusaka utility further so that it could take over the water supply and
sanitation for the Kafue, Chongwe, and Luangwa districts; and, enhancing national water
supply and sanitation planning as part of the additional financing. The design included
technical assistance activities to up-date the customer database, and improve collections
and improve customer relations. Equipment to improve efficiency and operations in the
four satellite towns was provided including water testing, office equipment, vehicles and
Ssupervisory Control and Data Acquisition (SCADA) systems in the four satellite towns.
The project provided significant operational, management and technical training and
assistance to design a common WSS financing mechanisms for approval by the MLGH
and the Cooperating Partners (CPs/Donors). In addition, technical assistance was
provided to improve bill collection from government and public agencies which
(probably) had the single biggest impact on the financial turn-around of LWSC.
2.15 There were some moderate design shortcomings. The project was originally
designed as an Adjustable Program Loan with the first phase focused on institutional
reforms and the second phase on investments to improve service delivery. Late in the
preparation phase, the project was changed to a Sector Investment Loan (SIL), but some

8
key elements of the project design were not fully adjusted. There was no PDO indicator
for increased access, while the PDO included increased access and the intermediate
indicators focus on achievements that are not related to and do not add up to the key
performance indicators.
3. Implementation
Project Costs
3.1 The original estimated project cost was US$23 million, including approximately
US$3.4 million for physical and price contingencies. The additional financing increased
the project amount by US$10 million, for a total cost of US$33.0 million. The actual
project cost at closing was US$31.6 million. The project was fully funded by IDA. The
Government made no financial contribution to the project.
Implementation Experience
3.2 The project became effective in March 2007, but implementation did not begin till
November 2007, due to delays in payment of a lapsed World Bank Loan by the
Government which hampered flow of credit funds into the project designated accounts.
To make up for lost time, the Bank agreed to an extension of the Credit Closing Date by
one year, from June 30, 2010 to June 30, 2011.
3.3 In 2008, a ministerial directive that the districts of Kafue, Chongwe, Luangwa and
Lusaka (district) itself should fall under one regional utility – LWSC - posed an
unexpected challenge to the on-going project efforts to make LWSC financially
sustainable. Estimates showed that revenues from these new districts were well below
operating costs. The December 2007 supervision mission had projected that 2007 would
be the first year in which LWSC would record an operating profit, but incorporating the
new districts would reverse that. In order to further progress toward financial
sustainability, LWSC would need to continue to exercise strict limits on cost escalation.
The operating costs and revenue structure of the additional three districts would likely
result in LWSC not being able to reach its objective of financial sustainability. It became
clear that LWSC would no longer be able to achieve 100 percent cost coverage of
operations and maintenance (O&M) unless additional financial support to rehabilitate the
water infrastructure in the three districts was provided to lower operating costs.
3.4 The Government therefore requested Additional Financing (AF) on February 1,
2008. This was approved on April 16, 2009, and the project was restructured to include
the townships in the three additional districts (Kafue, Chongwe, and Luangwa). The AF
was to be used to finance infrastructure rehabilitation and expansion in the four
townships and strengthen the capacity of LWSC to shoulder the additional responsibility
through training and technical assistance. The PDO was revised along with the outcome
indicators to reflect the restructuring. In order to provide sufficient time to implement the
additional activities, the project closing date was extended to June 30, 2012. Up to the
time that the AF was approved implementation had been slow and only about 20 percent
of the total credit had been disbursed. However, the Government delayed in meeting the
effectiveness conditions (payment of outstanding arrears of water and sewerage services

9
owed to LWSC by ministries, departments and agencies), and the AF only became
effective on 29 March 2011, two years after approval. Implementation then accelerated,
although a further restructuring was necessary to extend the closing date to June 30, 2013
and to reallocate funds. At closure, almost all planned activities had been completed and
95 percent of the credit had been disbursed. Shortfalls were due to shortcomings in
technical specifications, cost estimates and preparation for works contracts related to the
provision of safe water to additional households. Delays were also caused by weak
contract management and late delivery of key materials and equipment.
3.5 Capacity building in MLGH suffered from high staff turnover. MLGH
procurement and contract management was also weak: consequently, the consultancy for
development of a National WSS Policy was only partially completed. However, MLGH
did develop a joint financing arrangement for both urban and rural water supply and
sanitation in part as the result of the capacity building activities.
MONITORING AND EVALUATION (M&E)
3.6 M&E Design. The project was monitored using two M&E tools: (i) the Results
Framework that was developed during project preparation for monitoring the
performance of the project in meeting the development objectives, and (ii) the
Development Financing Agreement for Performance Enhancement (DFAPE) that was
developed and signed between the Government (represented by MLGH) and LWSC as an
incentivized tool for monitoring the performance of LWSC. The Results Framework
included indicators to monitor the implementation of the DFAPE. The three PDO
indicators were: LWSC’s performance on cost coverage; and, on increasing access to safe
water; and, MLGHs performance on developing the financing mechanisms. There were
nineteen intermediate outcome indicators covering: water access and service
improvements in Lusaka, Kafue, Chongwe and Luangwa districts; financial and technical
performance of LWSC; and, policy and donor coordination performance of MLGH. The
performance audits of LWSC in meeting the targets in the DFAPE set for each year were
prepared by an independent auditor and were submitted to an autonomous Development
Financing Agreement Review Committee (DFARC) set up for this purpose. The Bank
also monitored LWSC’s performance under the DFAPE during implementation.
3.7 M&E Implementation and Utilization. Throughout implementation, DFAPE
proved to be a useful monitoring and management tool for LWSC. Four annual audits
were carried out. LWSC met the aggregated minimum performance targets in three years
and incentive bonuses were paid to participating staff. The Agreement set tangible goals
and targets for staff, monitored change in services over time and enabled the utility to
react to any negative forewarnings. The periodic quarterly reporting to IDA and the
annual independent audit with public disclosure created an effective evaluation
instrument that allowed for a dialogue between agencies and between the client and the
Bank. LWSC chose to continue using the Performance Agreement after its initial three
year period and continues to use it today. Nwasco, refined the DFARC in 2015 and it is
used to monitor the performance of the three district utilities managed by LWSC.
Monitoring of the indicators that were not part of DFAPE took place through the semi-
annual supervision missions by Bank staff. An M&E consultant worked at MLGH during
project implementation (MLGH continues to outsource periodic M&E exercises using

10
local consultants). The consultants used data from the National Census Bureau, the
Cooperating Partners and other agencies to produce periodic data on access, quality and
sustainability of WSS in the country.
3.8 Overall, M&E is rated Substantial.
SAFEGUARDS
3.9 At appraisal, the project was classified as Category B for environmental
assessment purposes. In addition to Environmental Assessment (OP/BP 4.01), the
Involuntary Resettlement (OP/BP 4.12) and International Waterways (OP/BP 7.50) were
triggered. According to project documents, the Borrower completed the Environmental
and Social Impact Assessment (ESIA) in compliance with the relevant Zambian and
World Bank standards. The Environmental and Social Management Framework,
including the Environment Management Plan (EMP) and Resettlement Policy
Framework were approved and disclosed in the Infoshop, as well as in Zambia in April
2006.
3.10 Since project works were not expected to adversely affect the quantity or quality
of water flows to other riparians, an exception to the notification requirement under the
OP/BP 7.50 was approved by the Bank on August19, 2008. The Borrower updated the
existing Environmental and Social Management Framework, Environment Management
Plan and Resettlement Policy Framework to include the four townships in the three new
districts that were brought under LWSC to be supported by the Additional Financing.
LWSC engaged an environmental specialist (consultant) to supervise and ensure
compliance with environmental standards and safeguards. The project documents
reported that LWSC ensured that upgrades, rehabilitation, and drilling of new boreholes
causes minimal impact on surrounding communities and their assets. A Bank safeguards
specialist conducted a dedicated safeguards mission in April 2013 and found the project
in compliance with all safeguard policies. Safeguard compliance was rated Satisfactory in
all Bank Implementation Status Reports and in the Implementation and Completion and
Results Report (ICR).
3.11 However, the PPAR mission found that the likely impacts of climate change
together with management weaknesses and equipment failures at the Chongwe and Kafue
plants had affected the quality of the intake and waste water at these plants. The
Environmental Management Plan (EMP) had not been updated by LWSC. Consumers in
these two cities complained about water quality and color, suggesting environmental
pollution. At Chongwe, the intake of the water treatment plant is at the Chongwe River.
However, climate change effects and droughts have resulted in the river drying up for
four months from August to November. Attempts to drill bore holes nearby to secure a
water supply during this period have not been successful till mid-2016. Water quality
deteriorates when the flow in the river diminishes because the concentration of the
impurities from upstream water treatment and sewerage plants and the run off from farms
along the river increases. The plant lacks the capacity and operational efficiency (sludge
removal and filter cleaning are inefficient) to treat the water adequately, resulting in the
complaints about quality, taste and color. In addition, electric power outages lead to plant
shut downs because there is insufficient fuel for the generator.

11
3.12 The mechanical grill at the (rehabilitated) intake of the Kafue water treatment
plant has broken down and the plant has problems with intake pumps, and difficulties
with sludge removal from the sedimentation and filtration tanks. Due to the efforts of the
technical staff, the plant has thus far been able to produce safe drinking water. However,
repairs and refurbishing are necessary. The Millennium Challenge Corporation Compact
of the United States includes a provision to address these matters.6
3.13 Once the issues at the Chongwe and Kafue plants have been addressed, it would
be necessary to undertake an environmental assessment to determine that OP/BP 4.01
standards are being met.
FIDUCIARY COMPLIANCE
3.14 Financial management was rated satisfactory in supervision reports and at
completion. The project financing system was computerized and staff trained to use the
system. Disbursement of the original and additional financing improved over time and
withdrawal applications submitted regularly. The project documents do not report on
external audits of project accounts.
3.15 Procurement improved during implementation, though issues such as inadequate
knowledge of the market and prevailing market prices by the LWSC engineering staff
persisted. Procurement problems continued after project closure, for instance, regarding
replacement parts for the pre-paid meters and equipment for the water treatment and
sewerage plants.
4. Achievement of the Objectives
4.1 This evaluation assesses the outputs and outcomes to achieve the original
objectives of: (i) improving access to and sustainability of WSS in Lusaka; and (ii)
develop a comprehensive institutional structure supporting a coordinated approach to
WSS investments. Next it assesses the outputs and outcomes to achieve the revised
objectives of: (i) improving the technical and financial sustainability of LWSC and
improve access to WSS for urban customers in Lusaka province; and (ii) strengthen the
effectiveness of national WSS planning.
OUTPUTS AND OUTCOMES
Outputs for the Original Objectives
4.2 For the first original objective of improving access and sustainability of water
supply and sanitation services to consumers in Lusaka, the project inputs included goods,
works, and operating costs. These inputs resulted in the following outputs: 100 new water
kiosks in Lusaka’s peri-urban areas; installation of 30,000 domestic meters and 180 bulk
meters; installation of 200 pre-paid meters at government agencies; rehabilitation of
Iolanda water works including power factor correction equipment at major pumps;
rehabilitation of the sewerage plant and network; drilling of 10 new bore holes;
6 https://www.mcc.gov/where-we-work/program/zambia-compact

12
rehabilitation of Lusaka Water Works plant including boosters, reservoir and distribution
systems; and, acquisition of laboratory equipment for assessing water quality.
4.3 For the second original objective of developing a comprehensive institutional
structure supporting a coordinated approach to WSS investments, the inputs included
technical assistance, training and equipment for MLGH. The outputs included two drafts
of the revised 1994 National Water and Sanitation Policy and a final version by end 2013,
and the national rural sanitation and hygiene program; and a financing mechanism for
water supply and sanitation services. Outputs delivered by the LWSC included: a
financial business enterprise resource planning program; a Geographic Information
System; and procuring Global Positioning System survey equipment. The LWSC also
instituted the Development Finance Agreement for Performance Enhancement
(DFPAPE) and paid deserving employees performance incentives. It prepared the design
for sewer network and treatment plants and conducted a study to improve efficiency of
the sedimentation and filtration systems at the Iolanda treatment plant at Kafue.
Outcomes of the Original Objectives
4.4 In respect of the first original objective, an estimated 5,000 people obtained
access to safe water at the 100 new kiosks in Lusaka’s peri-urban areas at project
completion in 2013. In terms of LWSC’s overall performance, water supply increased
from a pre-project amount of 210,000 cubic meters (m3) /day to 230,000 m3/day.
Coverage of water and sanitation services increased from 64 percent for either in 2007 to
87 percent and 71 percent respectively in 2013. Water supply duration increased in the
peri-urban areas from 15 hours/day in 2007 to 20 hours in 2013. Also, water quality had
improved by 2013, in that bio-content fell from 17.7 to 2 percent. However, the
mission’s findings indicate that these outcomes have deteriorated since project
completion. Significantly, water supply at 10 of the 100 water kiosks had decreased from
earlier levels due to low pressure during most of the day.
4.5 To get a structured understanding of the sustainability of service outcomes for
water supply as well as sanitation, the mission organized eight focus group discussions
(FGD) of project beneficiaries, with five FGDs in Lusaka, and one each in Chongwe,
Luangwa and Kafue (the last three districts being covered by additional financing and
under the revised objective), between May 17 and 27, 2016. The findings from the FGDs
are presented in detail in Appendix B. While the FGDs were not statistically
representative of all the customers that benefited from the project, they point to a
decrease in the level of satisfaction with adequacy, reliability, and quality of water supply
and sanitation services. This is discussed for Lusaka as well as other districts in the
following sections on outputs and outcomes of the revised objectives.
4.6 Achievement of the first original objective is rated modest
4.7 In respect of the second original objective, MLGH had prepared separate Water
and Sanitation Policies and coordinated sector investments with the Cooperating Partners
(CPs) on a regular basis by 2013. In addition, the MLGH and Nwasco had guided the
establishment of two additional commercial utilities in the Western and Luapula
provinces by 2009. In 2016, the MLGH continued to conduct regular reviews of sector
13
performance and investments with the CPs to further improvements in the institutional
structure and investments. There was a distinct improvement in important technical and
financial efficiency parameters of LWSC by project completion, but these indicators have
deteriorated somewhat since then, as discussed below in the context of the first revised
objective.
4.8 Achievement of the second original objective is rated substantial.
Outputs of the Revised Objectives
4.9 The inputs for the first revised objective of improving the technical and financial
sustainability of LWSC, and improving access to water and sanitation in Lusaka,
Chongwe, Kafue and Luangwa included works, consultant services, operating expenses
and technical assistance. The outputs at LWSC were the continued performance
incentive payments to staff for achieving work related goals and the installation of the
SCADA system to monitor the outputs of the Lusaka, Iolanda and Kafue water treatment
plants. The outputs also included improved access to water and sanitation in the
townships of Lusaka province, repairs of the water and sewer distributions systems,
repair of the sewerage plant, and installation of 6,143 pre-paid meters in Chilanga,
Chongwe, Kafue and Luangwa.
4.10 The inputs for the second revised objective of strengthening effectiveness of
national water supply and sanitation planning included further technical assistance to the
Ministry of Local Government and Housing. In accordance with the Performance
Enhancement Agreement, LSWC has instituted a Performance Enhancement and
Management Program (PEMP) throughout the company and implemented a financial and
business enterprise resource planning model. It constructed a customer service center for
Central Branch in Lusaka. A second version of the revised national water and sanitation
policy was completed at project closing in 2013.
Outcomes of the Revised Objectives
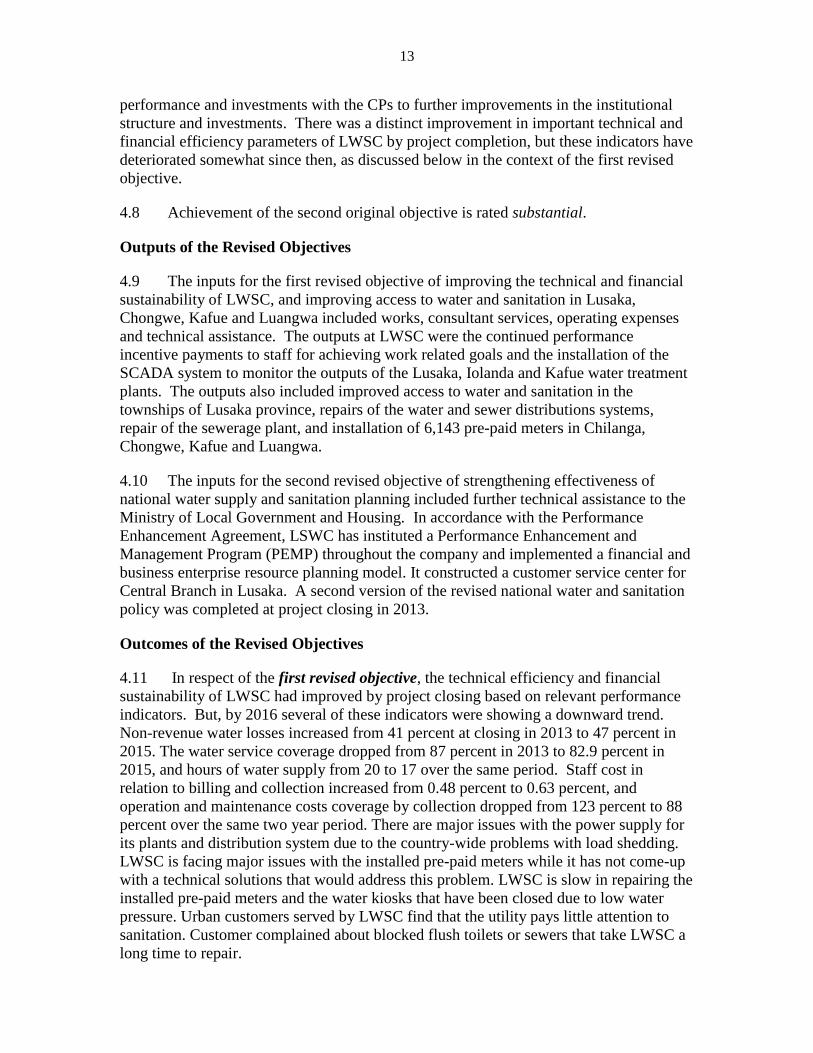
4.11 In respect of the first revised objective, the technical efficiency and financial
sustainability of LWSC had improved by project closing based on relevant performance
indicators. But, by 2016 several of these indicators were showing a downward trend.
Non-revenue water losses increased from 41 percent at closing in 2013 to 47 percent in
2015. The water service coverage dropped from 87 percent in 2013 to 82.9 percent in
2015, and hours of water supply from 20 to 17 over the same period. Staff cost in
relation to billing and collection increased from 0.48 percent to 0.63 percent, and
operation and maintenance costs coverage by collection dropped from 123 percent to 88
percent over the same two year period. There are major issues with the power supply for
its plants and distribution system due to the country-wide problems with load shedding.
LWSC is facing major issues with the installed pre-paid meters while it has not come-up
with a technical solutions that would address this problem. LWSC is slow in repairing the
installed pre-paid meters and the water kiosks that have been closed due to low water
pressure. Urban customers served by LWSC find that the utility pays little attention to
sanitation. Customer complained about blocked flush toilets or sewers that take LWSC a
long time to repair.

14
4.12 Access to water supply improved by 11,800 m3/day in the three districts of
Chongwe, Kafue and Luangwa by 2012/13 increasing water supply to 4,150 households
from less than eight to an average of 17 hours a day. However, the number of additional
people connected amounted to 9,000, which was far short of the target of 40,000. In
retrospect, this target was ambitious given that sufficient corresponding provision had not
been made for distribution and connections. Water quality showed improvement by 25
percent and water service and sanitation coverage by respectively 23 and nine percent.
4.13 However, it was indicated to the mission that the intake to the water treatment
plant at the Chongwe River is dry from June till November and water has to be brought in
by tanker truck. Similarly in Luangwa, water supply is interrupted sometimes for days on
end due to electrical power cuts. Moreover, the output of the thirteen boreholes drilled
under the project had dropped by 35 percent in 2015 compared to 2012.
4.14 The eight focus group discussions (FGD) organized by the mission comprised
five in Lusaka, and one each in Chongwe, Luangwa and Kafue, with 8-16 participants in
each group. The eight locations included a cross-section of peri-urban communities with
functional and non-functional water kiosks, and individual yard connections; and formal
communities with individual connections and prepaid meters. Three of the eight
settlements benefitted from the new kiosks and three from new metered house
connections. (Table 2.)
Table 2. Focus Group Discussion Locations
District Settlement Water Supply Type Toilet Type
PERI-URBAN COMMUNITIES
Lusaka John Laing fully functional water kiosk Pit latrines and pour
flush
Chawama non-functional water kiosk Pit latrines
Bauleni 1 fully functional water kiosk Pit Latrines
Bauleni 2 non-functional water kiosk Pit latrines
Kalingalinga individual yard connections and
condominial sewer system
External Flushing
toilets
FORMAL COMMUNITIES
Kafue Kafue Estates individual connections with
prepaid meters
Internal Flushing
toilets
Chongwe Town individual connections with
prepaid meters
Flushing toilets and pit
latrines
Luangwa Town individual connections with
prepaid meters
Pit Latrines
4.15 A detailed report on the FGDs is presented in Appendix B. While the FGDs were
not statistically representative of all the customers that benefitted from the project, they
do provide indications of the level of satisfaction with access, adequacy, reliability,
quality, and affordability of service. The participants in Lusaka and the townships in the
three districts expressed satisfaction with the provision of access and increased hours of
supply under the project relative their earlier situation. However, FGD participants in all
eight settlements complained about daily interruptions due to electrical power cuts. In
15
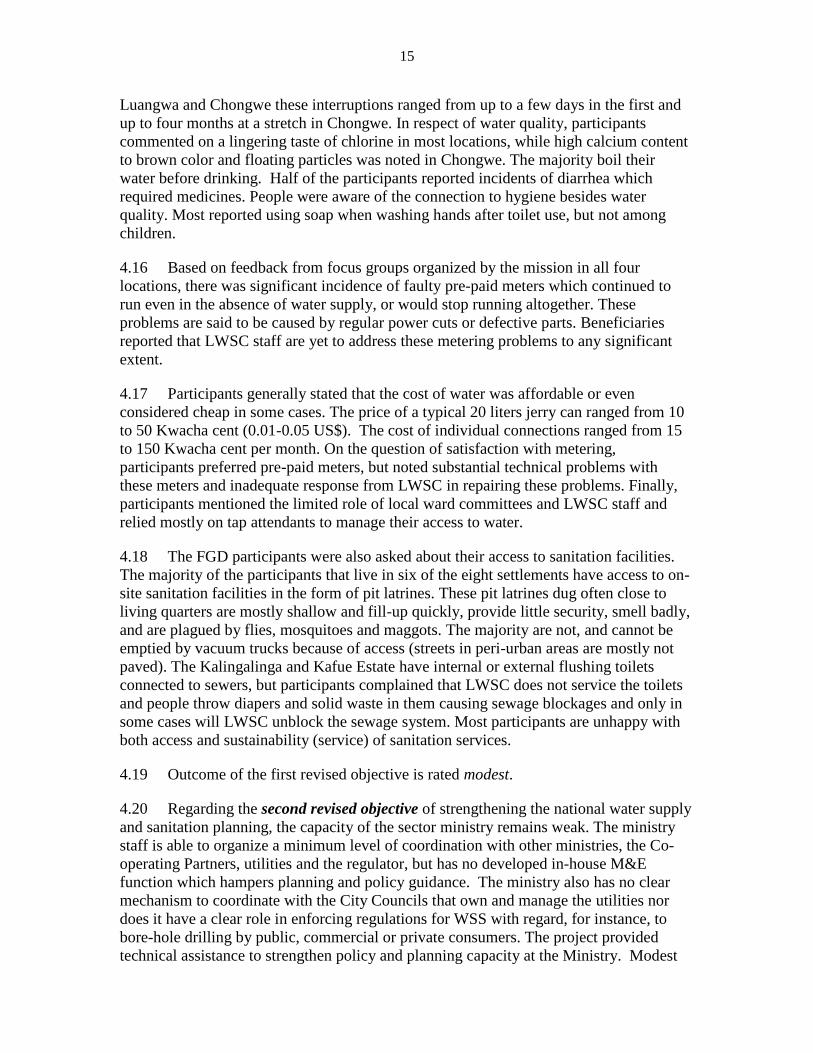
Luangwa and Chongwe these interruptions ranged from up to a few days in the first and
up to four months at a stretch in Chongwe. In respect of water quality, participants
commented on a lingering taste of chlorine in most locations, while high calcium content
to brown color and floating particles was noted in Chongwe. The majority boil their
water before drinking. Half of the participants reported incidents of diarrhea which
required medicines. People were aware of the connection to hygiene besides water
quality. Most reported using soap when washing hands after toilet use, but not among
children.
4.16 Based on feedback from focus groups organized by the mission in all four
locations, there was significant incidence of faulty pre-paid meters which continued to
run even in the absence of water supply, or would stop running altogether. These
problems are said to be caused by regular power cuts or defective parts. Beneficiaries
reported that LWSC staff are yet to address these metering problems to any significant
extent.
4.17 Participants generally stated that the cost of water was affordable or even
considered cheap in some cases. The price of a typical 20 liters jerry can ranged from 10
to 50 Kwacha cent (0.01-0.05 US$). The cost of individual connections ranged from 15
to 150 Kwacha cent per month. On the question of satisfaction with metering,
participants preferred pre-paid meters, but noted substantial technical problems with
these meters and inadequate response from LWSC in repairing these problems. Finally,
participants mentioned the limited role of local ward committees and LWSC staff and
relied mostly on tap attendants to manage their access to water.
4.18 The FGD participants were also asked about their access to sanitation facilities.
The majority of the participants that live in six of the eight settlements have access to on-
site sanitation facilities in the form of pit latrines. These pit latrines dug often close to
living quarters are mostly shallow and fill-up quickly, provide little security, smell badly,
and are plagued by flies, mosquitoes and maggots. The majority are not, and cannot be
emptied by vacuum trucks because of access (streets in peri-urban areas are mostly not
paved). The Kalingalinga and Kafue Estate have internal or external flushing toilets
connected to sewers, but participants complained that LWSC does not service the toilets
and people throw diapers and solid waste in them causing sewage blockages and only in
some cases will LWSC unblock the sewage system. Most participants are unhappy with
both access and sustainability (service) of sanitation services.
4.19 Outcome of the first revised objective is rated modest.
4.20 Regarding the second revised objective of strengthening the national water supply
and sanitation planning, the capacity of the sector ministry remains weak. The ministry
staff is able to organize a minimum level of coordination with other ministries, the Co-
operating Partners, utilities and the regulator, but has no developed in-house M&E
function which hampers planning and policy guidance. The ministry also has no clear
mechanism to coordinate with the City Councils that own and manage the utilities nor
does it have a clear role in enforcing regulations for WSS with regard, for instance, to
bore-hole drilling by public, commercial or private consumers. The project provided
technical assistance to strengthen policy and planning capacity at the Ministry. Modest

16
improvements in capacity had been made at project closing in 2013. Feedback from
officials to the PPAR mission suggests that there are no specific plans to improve or
expand the ministries capacity or role in the sector.
4.21 The achievement of the second revised objective is rated modest.
5. Efficiency
5.1 At project completion, the project had an estimated financial rate of return of 24
percent (against 17 percent at appraisal) and an Economic Rate of Return of 19 percent
(29 percent at appraisal). The economic analysis at completion followed a different
methodology from that used at appraisal. While it took into account the benefits from
time savings, it did not include consumer cost savings – which were not considered to be
significant factor – and also did not include the value of health benefits from improved
water quality, without assigning any specific reason.
5.2 However, this assessment takes into account the significant delays in project
implementation and shortcomings in administrative and operational efficiency. The
project took three years to prepare. During this time support was developed for the
PEAs, thereby ensuring that they would be in place at board presentation. However,
because the investment component was a late addition to the project, technical
specifications, cost estimates and preparations for works contracts were not adequately
prepared at the time of project effectiveness. Poor project management by LWSC
resulted in contract lapses and failure by consultants and contractors to adhere fully to
contract provisions, including deployment of staff and equipment specified in the
contract. These problems caused implementation delays, several changes orders and
addendum to implementation contracts and several standoffs between the consultant and
the contractors. Other inefficiencies were related to the high turnover of senior staff
assigned to the MLGH project component which affected timely decision making.
MLGH also lacked adequate capacity for procurement and contract management. Related
delays led to only partial completion of the consultancy for development of a National
WSS Policy.
5.3 Taking into account all these factors, the overall efficiency under the original
project objectives is modest. Since those delays affected the project from preparation
through to project implementation, overall efficiency under the revised project objectives
is also rated as modest.
6. Ratings
Outcome
6.1 Relevance of objectives is rated high for both the original and revised objectives
due to their alignment with national strategies for the sector as well as the Bank’s country

17
partnership strategy. Relevance of design is rated substantial for both the original and
revised objectives due to the logical link between inputs and outcomes while there were
moderate shortcomings in the M&E framework. Efficacy of the first original objectives
is rated modest, and that of the second substantial. Both the revised objectives are rated
modest. Efficiency remained modest under both the original and revised objectives.
Since under both sets of objectives outcome would be moderately unsatisfactory, this is
also the rating of overall outcome.
6.2 Overall Development outcome is rated moderately unsatisfactory.
Risk to Development Outcome
6.3 The overall risks to the development outcome of improved WSS access had
increased in 2016 compared to the situation at completion due to the national power
crisis, the effect of climate change on water supply, and the challenges to the economy.
The risk is rated as high in 2016 compared to substantial at completion. There appears to
be no immediate solution to the national power crisis7. Drought is predicted to become
more serious in the near future affecting rainfall and hence the supply and quality of
groundwater. Macroeconomic difficulties are likely to persist until copper princes
strongly recover. The increase in the overall risk rating in 2016 was also based on the
increased risks to the achievements with the improvements in the institutional structure
for investments and planning, and with the performance of the Lusaka utility. Although
some issues with investment coordination by the sector ministry remain, the financial
commitments of the Cooperating Partners (CP/Donors) for the near future are
considerable, and the CP coordinating committee is effective. Enforcement of
regulations and attention to consumer demands are still seriously deficient, although
beginning to improve in Chongwe.
6.4 The risks to the improvements in performance the Lusaka utility faced in 2016
call for technical and financial solutions. First, the utility has to address the concerns
from its customers for a more timely and efficient response to the problem with the pre-
paid meters. This would require better training and motivation of LWSC’s technical staff
to repair broken meters, replace faulty parts and install sensors to monitor meter
performance. LWSC management informed the PPAR mission that they were seized of
these issues. Power outages and water quality improvement require both financial and
technical solutions. These include adequate supply of fuel for power generators and
investments in O&M and in further replacement and rehabilitation of plants and
networks. Feedback to the mission suggests that the utility has plans to ensure fuel supply
and undertake priority O&M. The utility is working with the Millennium Challenge
Corporation to rehabilitate the Kafue treatment plant, ten distribution centers, and almost
300 km networks in Lusaka. LWSC acquired the capacity and tools to do the planning
and preparations for these investments under the project. Close coordination with the
7 The problems are with the hydro power situation including the repairs at the Kariba dam, and with the
exploitation of water resources which while they may be plenty require substantial investments to be
exploited.
18
MLGH and between MLGH and the City Councils that manage LWSC to ensure the
release of budget allocations is, however, needed to secure the required local funding.
6.5 The 2015 sector report from the regulator confirms the issues faced by the utilities
and the ministry. The report stated that “The year was indeed a challenging one owing to
extensive load shedding, dwindling water resources and generally the economic
downturn that was experienced particularly in the latter half of the year. These challenges
resulted in supply restrictions, escalated cost of doing business, low billing and revenue
collection”. These factors may be endogenous to the project objective and outcomes on
institutional strengthening at the ministry and the utility, but issues such as drought and
reduced rain were occurring before project closing. Also, inadequate budget allocations
to the sector for repair and rehabilitation of infrastructure to reduce, for instance, non-
revenue water, and low disbursement of budget allocations occurred well before closing.
6.6 The continued weaknesses at the sector ministry after project closing, especially
in 2015/16 with the economic downturn and hydropower crisis, poses a challenge to
sector management and investments. The on-going US$355 million MCC project eases
the challenge with sector investments till at least 2018, and supports LWSC with training,
technical assistance and rehabilitation works to improve management and operations.
However, there does not appear to be sufficient evidence to show that the Joint Water
Sector Reviews with the ministry and the Partners/Donors are yielding results in terms of
improvements that need to be made by the Government in the sector.
6.7 Overall, Risk to Development Outcome is rated high.
Bank Performance
6.8 The rating of Quality at Entry remains moderately satisfactory. The Bank
facilitated preparation and appraised the operation such that it was most likely to achieve
planned development outcomes and was consistent with the Bank’s fiduciary role. The
Quality Enhancement Review that was carried out by the Bank before project appraisal
found agreement on the use of incentivized performance agreements and secured the buy-
in from the Government and the regulator, and confirmed the implementation capacity of
the implementing agencies. The project was consistent with the Government’s
development priorities and the Bank demonstrated flexibility when the Government
requested a Specific Investment Loan (SIL) even though the project had been prepared as
a two phase Adjustable Program Loan. The Bank continued to show this flexibility with
additional financing half way through implementation of the original SIL to ensure that
the development objectives of the project would be achieved.
6.9 The rating of the quality of supervision is rated moderately satisfactory. Bank
staff ensured continuity in technical support and advice to the implementing agencies
even though the implementation of activities under the original credit was delayed due to
delayed payment by Government on settlement of the lapsed loan of completed projects.
The project had three Task Team Leaders (TTLs) which had an impact on continuity and
institutional memory. For instance, the last two TTLs had not been part of the
preparation of the technical studies which may have been an issue in that climate change
and drought were not taken into consideration when the decision was made to rehabilitate

19
the Chongwe plant in 2009. Supervision missions repeatedly flagged major weaknesses
and threats to progress with implementation and discussed solutions for improvement
with the implementing entities. These led to reorganization of the Project Implementation
Unit (PIU) and training and designation of dedicated staff to key sub-projects which in
turn resulted in improvements in implementation and completion of these sub-projects.
6.10 The overall Bank performance is rated moderately satisfactory based on the
moderately satisfactory rating in both quality at entry and quality of supervision.
Borrower Performance
6.11 The Government’s performance is rated moderately unsatisfactory. The project
was high in the country’s priorities for the water and sanitation sector and the
Government was committed to improve water and sanitation services in Lusaka during
preparation. However, once the original credit was approved and became effective, it
took the Government nine months to pay the lapsed loan payment of US$680,000, during
which project implementation virtually stalled. The Government requested an extension
of the closing date by one year to make up for the lost implementation time which was
subsequently approved by the Bank. The Government took 23 months to meet the
effectiveness condition for Additional Financing (payment of arrears of water and
sewerage services billed by the Lusaka utility to government ministries and departments).
Both these delays held up on-going efforts to improve access to water and sanitation
during project implementation.
6.12 Implementing agencies performance is rated moderately unsatisfactory. Both
implementing agencies (LWSC and MLGH) exhibited procurement, financial
management capacity and implementation constraints during implementation. As
discussed in the section on Efficacy, there was a decline in both operational and financial
performance of LWSC. Challenges during implementation included weak coordination
between technical and procurement staff as well as weak contract management capacity
and inability to maintain sufficient staff throughout the life of the project. Despite these
challenges, the implementing agencies displayed committed to the project and to
achieving the project objectives. The Lusaka utility embraced and implemented the
DFAPE instrument and brought about improved performance, both technical and
financial. With regard to the sector ministry, the high turn-over of higher management
staff had a negative impact on implementation of the capacity development activities to
the extent that the consultancy to draft a comprehensive sector policy could be completed
only partially during the project implementation period. As project implementation
advanced and the implementation agencies gained experience with Bank procedures, the
agencies performances improved enabling an improvement in implementation, nearly full
disbursement of the loan, and substantial achievement of the objectives.
6.13 The continued weaknesses at the sector ministry after project closing, especially
in 2015/16 with the economic downturn and hydropower crisis, poses a challenge to
sector management and investments. The on-going US$355 million Millennium
challenge corporation (MCC) project is, however, lessening the challenge with sector
investments till at least 2018. Also, the regular Joint Water Sector Reviews with the
ministry and the Partners/Donors focus on decisions that need to be made by the

20
Government to continue improvements in the sector. The reviews also discuss the
contributions the Partners bring to these efforts.
6.14 Overall Borrower performance is rated moderately unsatisfactory.
7. Lessons
7.1 Maintaining the financial viability of a service provider requires strategies to
deal with exogenous factors in addition to securing technical and commercial
efficiency of operations. The financial viability of utilities supported by the project
faces pressure from reduced availability and increased cost of energy (with the crisis in
hydropower), thus adding to the effects of shortcomings in operational and technical
efficiency and a reduction in annual budget allocation for utility operation, maintenance,
rehabilitation and expansion, making it difficult to maintain the quality of water and
sanitation service delivery.
7.2 Sustainable provision of water supply services in the face of growing
population and demand requires active coordination between the authorities
responsible for long-term water resource planning, and service providers. In the
case of Zambia, the growing urban and rural population and recurrent droughts have
strained surface and ground water resources. In the project area, unregulated drilling of
bore holes by public agencies and public and private organizations and businesses is
putting pressure on the utilities. It is necessary for the Ministry of Water Development
which is responsible for water resources and the Ministry of Local Government and
Housing responsible for the water supply to coordinate in developing further strategies to
manage the extraction and use of river and surface water for competing users.
7.3 Alternative approaches need to be actively explored and adopted for urban
and rural sanitation, especially when conventional sewerage may not be financially
feasible. In the project areas, reliance on existing on-site sanitation facilities poses
problems, especially in the rainy season when run-off rainwater floods these facilities
which are not emptied or properly managed. Zambia could learn from countries that have
similar geographic, economic and demographic patterns, and have developed more
effective approaches to improving and managing sanitation facilities.

21
References
Dagdeviren, Hulya. 2008. Waiting for Miracles: The Commercialization of Urban Water Services in
Zambia,. Development and Change 39 (1): 101-121 (2008) Institute of Social Studies 2008.
Published by Blackwell Publishing. 9600 Garsington Road, Oxford OX4 2DQ. UK and 350 Main
St. Malden, MA 02148, USA
Eberhard, Rolfe. 2011. Africa Target 5 Report, Strategic Financing Framework: 3Ts and Innovative
Financing Mechanisms in the Water Sector in African Countries, Case Study: Zambia, 6th World
Water Forum- 31 October 2011.
Eberhard, Rolfe, Rolfe Eberhard, Chris Heymans, David Ehrhard, and Shannon Riley. 2016. Providing
Water to Poor People in African Cities Effectively: Lessons from Utility Reforms. Main Report. ,
World Bank, Washington D.C.
Government of the Republic of Zambia. 2015. National Urban and Peri-Urban Sanitation Strategy (2015-
2030), Ministry of Local Government and Housing (MLGH), November 2015
Government of the Republic of Zambia. 2015. National Water Supply and Sanitation Capacity
Development Strategy (2015-2020), Ministry of Local Government and Housing (MLGH),
November, 2015
International Development Association 2015. Project Appraisal Document on a Proposed Credit in the
Amount of SDR 47.2 Million (US$65 Million Equivalent) to the Republic of Zambia for a Lusaka
Sanitation Project, May 1, 2015. Water Global Practice (GWADR), Africa Region, The World
Bank.
National Water Supply and Sanitation Council 2015. Annual Report 2015. NWASCO, Zambia
The Millennium Challenge Corporation and the Republic of Zambia, 2012. Millennium Challenge
Compact between The United States of America.
World Bank 2013. Zambia−Implementation and Completion and Results Report (IDA-42330 IDA-45500)
on a Credit in the Amount of SDR 22.7 Million (US$33.0 Million Equivalent) to the Republic of
Zambia for a Water Sector Improvement Project, December 20, 2013, Urban Development and
Services Unit 1 (AFTU1) Country Department AFCS3, Africa Region, World Bank, Washington
DC.
———. 2011. Zambia− Country Assistance Strategy Progress Report for the Republic of Zambia for the
Period 2008-2012, November 15, 2011. International Development Association, Country
Management Unit: AFC3, Africa Region.World Bank, Washington DC.
———.2006. Lusaka−(Water Sector Improvement Project) Project Agreement between International
Development Association and Lusaka Water and Sewerage Company, Dated December 22, 2006.
World Bank, Washington DC.
———.2013. Zambia−International Development Association International Finance Corporation and
Multilateral Investment Guarantee Agency Country Partnership Strategy for the Republic of
Zambia, for the Period FY13-FY16, February 15, 2013, Zambia Country Management Unit, Africa
Region, International Finance Corporation, Africa region, Multilateral Investment Guarantee
Agency,World Bank, Washington DC.
———.2015.Zambia−Economic Brief, Powering the Zambian Economy, World Bank Group, December
2015, Issue 6. World Bank, Washington DC.
———.2006. Zambia−Project Appraisal Document on a Proposed Credit in the Amount of SDR 15.7
Million (US$23.00 Million Equivalent) to the Republic of Zambia for a Water Sector Improvement
Project, August 30, 2006. Water and Urban Unit 1 (AFTU1), Zambia Country Department, Africa
Region. World Bank, Washington DC.
Grontmij 2011. Zambia Joint Annual Water Sector Review, Final Report, June 2011. Grontmij
Consultants, Netherlands.
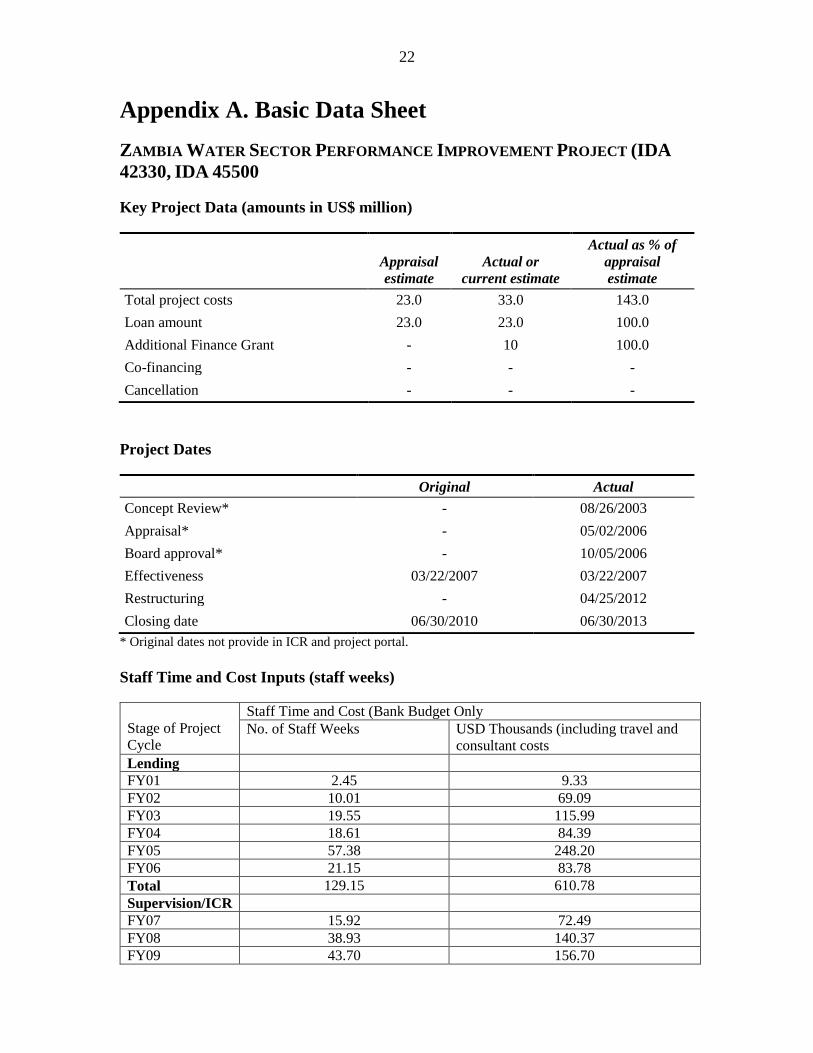
22
Appendix A. Basic Data Sheet
ZAMBIA WATER SECTOR PERFORMANCE IMPROVEMENT PROJECT (IDA
42330, IDA 45500
Key Project Data (amounts in US$ million)
Appraisal
estimate
Actual or
current estimate
Actual as % of
appraisal
estimate
Total project costs 23.0 33.0 143.0
Loan amount 23.0 23.0 100.0
Additional Finance Grant - 10 100.0
Co-financing - - -
Cancellation - - -
Project Dates
Original Actual
Concept Review* - 08/26/2003
Appraisal* - 05/02/2006
Board approval* - 10/05/2006
Effectiveness 03/22/2007 03/22/2007
Restructuring - 04/25/2012
Closing date 06/30/2010 06/30/2013
* Original dates not provide in ICR and project portal.
Staff Time and Cost Inputs (staff weeks)
Stage of Project
Cycle
Staff Time and Cost (Bank Budget Only
No. of Staff Weeks USD Thousands (including travel and
consultant costs
Lending
FY01 2.45 9.33
FY02 10.01 69.09
FY03 19.55 115.99
FY04 18.61 84.39
FY05 57.38 248.20
FY06 21.15 83.78
Total 129.15 610.78
Supervision/ICR
FY07 15.92 72.49
FY08 38.93 140.37
FY09 43.70 156.70
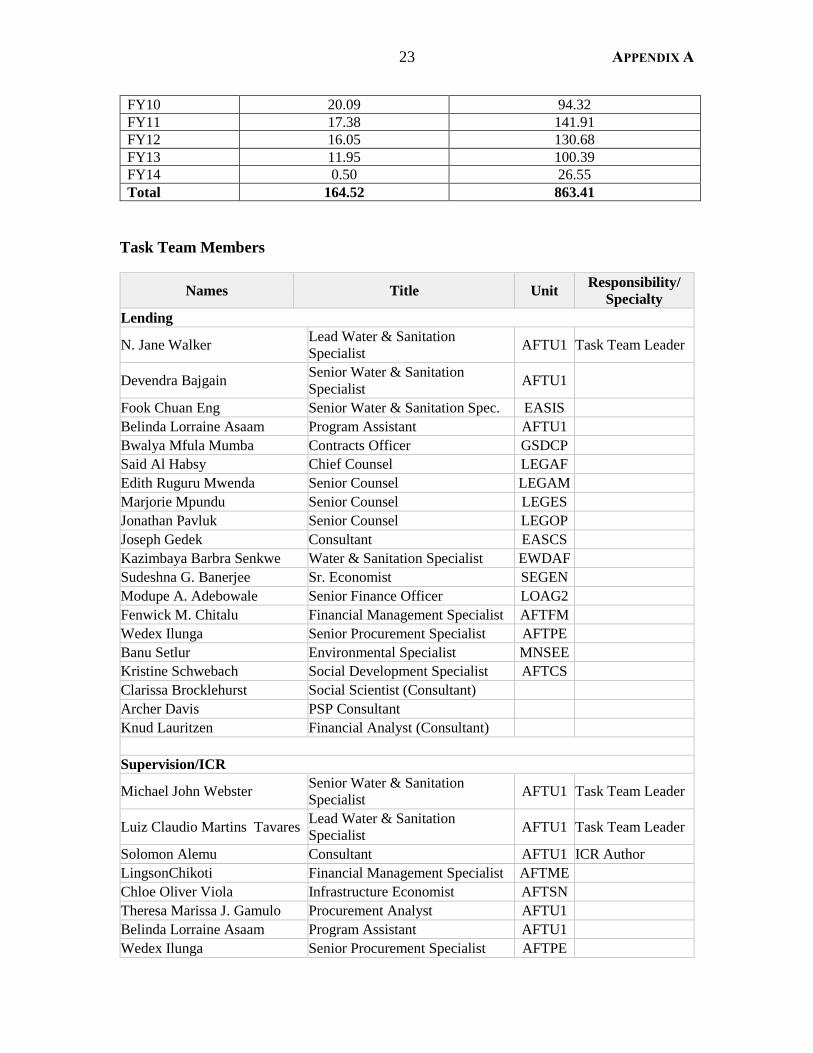
23 APPENDIX A
FY10 20.09 94.32
FY11 17.38 141.91
FY12 16.05 130.68
FY13 11.95 100.39
FY14 0.50 26.55
Total 164.52 863.41
Task Team Members
Names Title Unit Responsibility/
Specialty
Lending
N. Jane Walker Lead Water & Sanitation
Specialist AFTU1 Task Team Leader
Devendra Bajgain Senior Water & Sanitation
Specialist AFTU1
Fook Chuan Eng Senior Water & Sanitation Spec. EASIS
Belinda Lorraine Asaam Program Assistant AFTU1
Bwalya Mfula Mumba Contracts Officer GSDCP
Said Al Habsy Chief Counsel LEGAF
Edith Ruguru Mwenda Senior Counsel LEGAM
Marjorie Mpundu Senior Counsel LEGES
Jonathan Pavluk Senior Counsel LEGOP
Joseph Gedek Consultant EASCS
Kazimbaya Barbra Senkwe Water & Sanitation Specialist EWDAF
Sudeshna G. Banerjee Sr. Economist SEGEN
Modupe A. Adebowale Senior Finance Officer LOAG2
Fenwick M. Chitalu Financial Management Specialist AFTFM
Wedex Ilunga Senior Procurement Specialist AFTPE
Banu Setlur Environmental Specialist MNSEE
Kristine Schwebach Social Development Specialist AFTCS
Clarissa Brocklehurst Social Scientist (Consultant)
Archer Davis PSP Consultant
Knud Lauritzen Financial Analyst (Consultant)
Supervision/ICR
Michael John Webster Senior Water & Sanitation
Specialist AFTU1 Task Team Leader
Luiz Claudio Martins Tavares Lead Water & Sanitation
Specialist AFTU1 Task Team Leader
Solomon Alemu Consultant AFTU1 ICR Author
LingsonChikoti Financial Management Specialist AFTME
Chloe Oliver Viola Infrastructure Economist AFTSN
Theresa Marissa J. Gamulo Procurement Analyst AFTU1
Belinda Lorraine Asaam Program Assistant AFTU1
Wedex Ilunga Senior Procurement Specialist AFTPE

24
Mohammed Kumbakumba Consultant AFTN1
Midori Makino Lead Evaluation Officer IEGPS
Dennis Daniel Mwanza Senior Water & Sanitation
Specialist TWIAF
Kazimbaya Barbra Senkwe Water & Sanitation Specialist TWIAF
Elisabeth Sherwood Senior Financial Specialist AFTU1
Neta Mulenga Walima Program Assistant AFCS3
Zvikomborero Hoko Consultant AFTU1
William Muhairwe Consultant AFTU1

25
Appendix B. Report on the Focus Group Discussions
Conducted in May 2016
Methodology
1. A total of eight focus group discussions (FGD), five in Lusaka, and one each in
Chongwe, Luangwa and Kafue were held between May 17 and 27, 2016. The eight locations
included the seven settlement listed in Table 1 below.
Table 3. List of Settlements by District and Type
District Settlement Settlement Descriptors
Lusaka John Laing Peri-urban community served by fully functional water kiosk
Chawama Peri-urban community served by non-functional water kiosk
Bauleni 1 Peri-urban community served by fully functional water kiosk
Bauleni 2 Peri-urban community served by non-functional water kiosk
Kalingalinga Peri-urban community served by individual yard connections and
condominial sewer system
Kafue Kafue Estates Formal community served by individual connections with prepaid
meters
Chongwe Town Formal community served by individual connections with prepaid
meters
Luangwa Town Formal community served by individual connections with prepaid
meters
2. All settlements except Kalingalinga benefited from water supply improvements under
the project. Kalingalinga has been included because even though it was not directly
supported under WSPIP, it benefited from a related WSP-Africa activity linked to WSPIP
which had a particular emphasis on assisting LWSC to define a mechanism for providing
water borne sanitation in peri-urban areas.
3. The FGDs were based on a questionnaire administered mainly in vernacular with
some English and were recorded on tape. The questionnaire focused on three themes namely
health (incidence and response to diarrhoea), water supply and sanitation. The results of the
FGDs are structured around these three themes.
Key Findings
Access to Water
4. As indicated in Table 1 above, the sources of water supply were mainly kiosks in
John Laing, Chawama and Bauleni; yard taps in Kalingalinga; and house connections in
Kafue, Luangwa and Chongwe. For the participants in Chawama where the kiosk was non-
functional, their main water source was other kiosks in the settlement and other people’s yard
taps. In Bauleni 2 the main source was other people’s yard taps. All communities reported
interruptions in water supply with electrical power cuts being the most common reason.
There are however also regular interruptions due to maintenance works. In Kafue, some

APPENDIX B 26
participants reported daily interruptions, whilst in Chongwe and Luangwa, interruptions were
reported to occur over a number of days. Daily rationing was also reported in Chongwe. In
Chawama, the kiosk had been without water since 2014 whilst in Bauleni 2 they had no
water at the Kiosk since 2015. Participants in Luangwa stated that their main alternative
source of water during power cuts, is the back wash water released by LWSC from their
treatment plant. A major complaint from participants was that LWSC rarely notifies them of
water supply interruptions, although some said they occasionally receive SMS or radio
announcements.
5. Despite the interruptions, participants in Luangwa, Kalingalinga and Bauleni 1
reported that they have a constant water supply throughout the year. In the other settlements
however, there is either no water or there is reduced water pressure in the dry season between
August and November each year. The situation is worst in Chongwe where LWSC is
compelled to bring in a water bowser from Lusaka. The challenge with the bowser is that the
consumers do not seem to have information on when it will be in town and where it is
situated once in town.
6. Although all participants know that their water is treated by LWSC, it is however
common practice for households to treat the water again either by boiling or adding chlorine.
This is especially the case in the rainy season when the country anticipates cholera outbreaks
and the Ministry of Health distributes free chlorine to households.
7. Participants reported the taste of their water as generally good although there was a
complaint that sometimes there is too much residual chlorine and that there is a difference in
taste in some months of the year especially in Chongwe. Participants also complained of the
brown colour of water especially after major works and at the beginning of the rainy season.
High calcium content was also noted as problem. Participants in Kafue and Chongwe had the
most complain about dirty-brown water with a lot of particles. Generally participants felt the
water did not smell except in Chongwe where the smell is said to be very bad in some
months of the year. There was no complaint of water hardness at all. There was however a
complaint of the water having too much chlorine in Luangwa, Chongwe and Bauleni.
Participants in Kafue were not sure whether any chlorine is added to the water.
Satisfaction with Water Supply
8. All participants in Luangwa and John Laing reported that they liked their water
supply. Similarly in Bauleni 1 and Kalingalinga, participants were happy with their water
supply. Those who liked their water supply indicated good water quality, improved pressure,
constant supply, affordability and convenience as the main reasons for their satisfaction.
They further indicated that the water supply had improved their lives in that they could now
also do some gardening, had less disease burden and were safer. Safety was a particularly big
issue for women in John Laing who said they no longer had to wake up in the middle of the
night to look for water nor did they have to cross the dangerous Kafue road as they had done
prior to the kiosk. The water is now closer and cheaper than before.
9. The picture was mixed in Kafue with some participants happy and others not happy at
all. The few who were happy indicated improved supply and drop in cost as the major

27 APPENDIX B
reasons for satisfaction. Nonetheless, the majority were unsatisfied mainly due to poor
pressure, unreliable supply and disputed bills.
10. All participants in Chawama and in Bauleni 2 were very unhappy with their water
supply. The main reasons were the fact that the kiosks though constructed near their homes,
are no longer functional. This means they must get their water from alternative sources which
according to the discussions involve long walks of up to 15 minutes; long queues, and higher
expenses on water. In some cases, participants indicated that they have to beg for water or go
looking for water in the night.
11. Chongwe had the worst outcome on satisfaction with water supply. Almost all
participants highlighted inadequate supply especially between August and November when
the Chongwe River from which LWSC draws its water runs dry. They also cited poor water
quality due to the poor raw water, rationing of supply by LWSC, low pressure, leaking pipes
around the town, interruptions in supply for days, bad smell and poor colour of water as
major challenges. Whilst the participants indicated that LWSC does provide a bowser in the
dry season, they however also complained of the lack of a clear timetable, specific location
for the bowser and limited water in the bowser.
12. Regardless of how satisfied people were with their water supply, every FGD
indicated that there are some serious problems related to management and maintenance of the
water. For the kiosks this is partly due to the design in which the tap is elevated making it
difficult for the limited water in the system to reach the taps. Long waiting queues, including
consumers having to give each other turns when drawing water was also a common problem.
This also means that consumers must walk to and from the kiosks several times as they
cannot draw enough water in one visit. Other problems were related to the slow pace at
which LWSC attends to faults and repairs. In Chawama, the kiosk had been non-functional
for two years and similarly in Bauleni. In almost all cases, participants also complained of
the lack of materials at the LWSC branches for repairs as well as for new connections. The
challenge of power cuts by Zambia Electrical Supply Company (ZESCO) was also noted.
This problem seems to have much bigger impact in Luangwa where the town is not on the
national ZESCO grid and can therefore go for days without power and hence without water.
In the meantime, LWSC does not have a back-up power supply at the treatment plant. In
Kafue, participants were also concerned about the old infrastructure most of which has not
yet been revamped. In the case of Bauleni 1, whilst the water supply is good, the participants
were however concerned about the inability of the kiosk to generate sufficient revenues as
there are only about 10 families using the kiosk. According to the participants, this situation
has arisen due to the fact that many households have made illegal connections to their yards.
The long term viability of this kiosk and possibly others, could therefore be in jeopardy. At
the same time, if the households are indeed connection themselves illegally, then LWSC is
and stands to lose a lot of revenue through non-revenue water.

APPENDIX B 28
Satisfaction with Water Metering
13. As shown in Table 2 below, apart from the peri-urban areas served by kiosks and
Kalingalinga which is not yet metered, all other settlements were connected through prepaid
meters.
Table 4. List of Metering Type by District and Settlement
District Settlement Metering Type
Lusaka John Laing Bulk metered kiosk
Chawama Bulk metered kiosk
Bauleni 1 Bulk metered kiosk
Bauleni 2 Bulk metered kiosk
Kalingalinga Not metered
Kafue Kafue Estates Prepaid meters
Chongwe Town Prepaid meters
Luangwa Town Prepaid meters
14. Almost without exception, participants even those who are not yet metered prefer the
prepaid to the post-paid meter. The main reasons given were that these meters allow
consumers to control consumption and also that there is no dispute with LWSC over bills.
However, this satisfaction with the prepaid meters is tempered by a catalogue of problems
some technical and others administrative. There are obvious technical issues with the meters
which in all three towns were reported to be faulty - move too fast, sometimes do not give
water even when it has been paid for, the user interface (remote control) breaks down
meaning the consumer cannot get water unless LWSC comes to recharge the meter manually;
the user interfaces are also not easy to repair but must be replaced; give free water (continue
running even when the consumer has not paid). Participants also indicated that the meters can
easily be bypassed which apparently has been done before by LWSC to assist consumers
who have issues with the meters. Participants were also concerned about the large and
conspicuous nature of the meters which make them rather vulnerable to being kicked down
by playing children. A significant number of participants also observed that the LWSC staff
themselves generally are not sure what technical issues they are dealing with when it comes
to the meters. Thus, whilst the concept of prepaid metering is very much welcomed by the
communities, there is still a lot of technical and support services that LWSC needs to develop
for the sake of ensuring both access to water for the consumers and keeping the company
afloat.
Cost of Water
15. In all cases were LWSC is providing water, participants had no problem with the
price of water. In John Laing participants indicated they were happy with the 1 Ngwee per 20
litre jerry can of water that they are charged. In Bauleni 1, whilst participants knew that the
price should be 1 0ngwee, they however indicated that they did not mind paying the 2
0ngwee per 20 litre jerry can, as there were too few households using the kiosk. As would be
expected, price difference was very marked in the communities were the kiosks are not
functional. In Bauleni 2 and Chawama, the price of a 20 litre jerry can varied from 1 Ngwee
to 5 Ngwee, i.e. 5 times the price in areas served by LWSC. An important finding is that the

29 APPENDIX B
participants using the LWSC kiosks found the price affordable partly because they were
comparing to the situation prior to the improvements in water supply where they had to walk
long distances to get their water. For the individual connections in Luangwa, Kafue and
Chongwe, typical monthly bill was given as starting from a low of ZMW15 to a high of
ZMW 300. Reported average monthly bills were around ZMW 40 per month in Luangwa,
ZMW 60 in Kafue, and ZMW 150 in Kalingalinga and Chongwe. It is worth noting that in
these FGDs price of water was not seen as an issue. In John Laing, participants felt that
water was cheap, whilst those in Luangwa, Chongwe, Bauleni 1 and Kafue felt the price was
fair. The major complaint of the price being high was in the two peri-urban areas where the
kiosks were non-functional. There were also a few complaint from those on post-paid meters
about the high cost of water, mostly associated with the fact that they must pay regardless of
whether they have water or not. In general however, participants felt that their water bills had
reduced as a result of the prepaid meters.
16. The modes of payment for water are cash at the time of getting water at the kiosks, as
well as for those with pre-paid meters. Only the participants in Kalingalinga and those on
post-paid meters pay on a monthly basis.
Health
17. The highest incidences of diarrhoea in the month prior to the survey were reported in
Luangwa and Chongwe districts with more than half of the FGD participants reporting cases
at their households. This is not surprising given that Chongwe has the worst water supply
situation of the four districts. In the case of Luangwa, it could be related to the fact that
whilst the water is available, the town does tend to have water problems associated with
power cuts. LWSC has no generator in Luangwa meaning that if there is no power supply
from ZESCO, then the town also has no water supply. The FGDs seem to suggest a very low
incidence of diarrhoea cases in Lusaka including in the areas where water supply is not good
e.g. in Bauleni 2. Kafue was an interesting case in that even though only 2 participants
reported cases of diarrhoea, the disease, however, affected every member of the household.
The episodes of diarrhoea tended to last over a few days with the highest reported duration of
seven days in Bauleni. The FGDs suggest that the people generally understand that diarrhoea
is related to water supply although a few indicated food and weather as the main cause. Quite
a few participants thought diarrhoea is a normal/ good way of cleansing the body.
18. The response to diarrhoea is generally either self-medication with off the counter
medicine and Oral Rehydration Salts as well as going to the clinic. It was evident that the
concept of rehydration as a way to treat diarrhoea is quite well understood and appreciated.
So too was the idea that diarrhoea is a lethal and potentially fatal disease. Common methods
of preventing diarrhoea that were identified included boiling and chlorinating drinking water,
warming and covering food and general hygiene behaviours including washing hands and
keeping surroundings clean.
19. Most participants reported that their household members do wash their hand with
soap after using the toilet. However, further discussions showed that the practice may not
necessarily be widespread amongst children, whilst in some cases, the non-availability of
water makes it difficult.

APPENDIX B 30
20. The main source of information on health and hygiene is clearly the Ministry of
Health through their health extension officers as well as via media namely radio and
television. Other sources with potential included school children and the church. It was
however also clear that the ministry is normally very active during cholera outbreaks and not
as active in the dry season.
Stakeholder Roles
21. It is worth noting that none of the participants perceived the local authorities or the
ward development committees as playing any role in water supply and sanitation issues. In
places served by kiosks, the communities are sometimes involved in maintaining the area
around the kiosk including making contributions for repairs. They also report faults to LWSC
and play some role in securing the infrastructure, particularly the meters. Tap attendants play
the biggest role, managing the kiosks, reporting faults and collecting money and remitting to
LWSC. Participants were quite categorical about LWSC as the major actor responsible for
infrastructure maintenance and repairs. However, in general participants were not happy with
the service provided by LWSC in this regard. Major complaints included delays in
responding to faults and or requests, lack of materials for repairs or network extension, poor
customer relations especially amongst the young employees, manpower shortages at the
branches and poorly trained technical personnel.
Proposed Improvements
22. The major areas of improvement proposed by the participants focused on improving
or changing water sources in Chongwe, improving pressure at kiosks by lowering the taps,
expanding the water network to allow for yard connections in the peri-urban areas, provision
of an alternative or back up power source in Luangwa, improving customer experience by
increasing the number of point of sale for the prepaid meter units and also upgrading the
prepaid meter technology.
Access to Sanitation
23. WSPIP’s contributions to improving access to, and sustainability of sanitation
services in Lusaka are minor – limited to the replacement of 12 pumps at six sewage pump
stations. In general, LWSC involvement in sanitation has been limited to the operation and
maintenance of the 20,000 sewer connections the company serviced at the time of project
appraisal in 2007. However, the FGD included questions for participants on their views on
and issues with sanitation. Table 3 below summarizes the type of sanitation facilities the
participants in the eight locations have access to.

31 APPENDIX B
Table 5. Types of Sanitation Facilities by District Settlement
District Settlement Toilet Type
Lusaka John Laing Pit latrines and pour flush
Chawama Pit latrines
Bauleni 1 Pit Latrines
Bauleni 2 Pit latrines
Kalingalinga External Flushing toilets
Kafue Kafue Estates Internal Flushing toilets
Chongwe Town Flushing toilets and pit latrines
Luangwa Town Pit Latrines
Types of Sanitation Facilities and Role of Consumers
24. Pit latrines are the most common facility for sanitation. This is not surprising given
that the majority of the FGDs were held in peri-urban areas which are not connected to the
sewer system. The participants in Chongwe had the highest combination of pit latrines and
flushing toilets connected to septic tanks mainly because the inadequate water situation there
does not make it possible to install flushing toilets. Participants in Kalingalinga and Kafue
were the only ones connected to sewer systems. It is worth noting that almost all toilets there
have been paid for by the landlords except a few in Kalingalinga where consumers got help
from LWSC. All repairs done on toilets are undertaken by private individuals except in
Kalingalinga where the team working on the Bank’s Lusaka Sanitation Project is currently
providing support. For those who have pit latrines and want flushing toilets, the main reason
they do not have a flushing toilet was affordability. All participants except those in
Kalingalinga indicated that they do not receive any support from LWSC for their sanitation
issues. In almost all FGDs, participants indicated that under five children generally use a
chamber pot which is then emptied by the mother in the toilet. A few parents indicated that
the children use the ground and then the mothers collect and takes it to the toilet. Participants
in John Laing and Kafue indicated that baby diapers are a big problem for the sewer system
as they are thrown in the toilets together with other household solid waste.
Satisfaction with Sanitation facilities
25. All participants in John Laing and Chongwe said they like their toilets whilst those in
Kalingalinga liked them very much. For the participants in Kalingalinga, their main reason
for liking the toilets is that they were a big improvement from the pit latrines- they are
comfortable, flushable and do not need replacement as do pit latrines. Participants from
Chawama, Luangwa, Kafue and Bauleni were not happy with their sanitation facilities. For
those with pit latrines, the main reason is that they have to dig a new pit latrine every time
one gets full. Moreover, faecal matter is often visible due to shallow or full pits, and flies,
mosquitoes and maggots pester latrine users. In addition, participants complained about the
theft of manhole covers, the lack of security especially at night, bad smells, lack of roofs and
closeness to the living units. Pit latrines fill up quickly and most pit latrines cannot be
serviced by vacuum tankers to empty them due to lack of access roads, When pit latrines are
full, participants indicated that they either dig another pit or use chemicals to reduce the
volume of faecal matter in the pit. For participants with flushing toilets their main complaint

APPENDIX B 32
is that LWSC does not repair toilets even though LWSC charges sewer fees. Participants also
complained about poor use of toilets including dumping stuff that cause sewer blockages like
diapers and bottles. In addition, LWSC primary focus is on water with seemingly little
interest in sanitation. The participants in Kalingalinga expressed concern about the slow rate
of connections by LWSC as well as potential problems with blockages due to limited water
supply and lack of dedicated sewer teams in LWSC. The participants were, however, quite
happy with the team that is presently undertaking connections which also deals with
blockages as they arise. All participants in John Laing and in Bauleni were happy with the
location of their toilets whilst those in Chawama were not happy.
Improvements Required
26. Almost all participants with pit latrines indicated that the improvement they would
like to see is to get flushing toilets. Those with flushing toilets in the meantime want to see
improvements in water supply, including giving households individual house connections.
Conclusion on Sanitation
27. It is clear from the discussion that unlike water supply, sanitation remains very much
a household/ private responsibility with LWSC having little involvement. At one level this
fits within the national policy where sanitation is treated as the responsibility of private
individuals. On the other hand, the discussion also shows that there are major institutional
shortcomings affecting the (poor) quality of existing pit latrines and the absence of emptying
services. The impact of inadequate water supply on sanitation was also noted especially in
the case of Chongwe where consumers have had to dig pit latrines to cope with the lack of
water during part of the year. Whereas much progress has been made with water supply,
LWSC needs to utilise the funding provided under the Lusaka Sanitation Program to develop
effective mechanisms for delivery and maintenance of sanitation services across the city
including back up and public services for consumers of onsite sanitation.

33
Appendix C. List of Persons Met
NAME FUNCTION/ROLE ORGANISATION E-MAIL
Kunda Wycliff Manager IPD
Musaibaila
Mwiche
Senior Planner MLE
Ngoma Tamara Engineer – Peri Urban
Chiyombe Jilly Director Infrastructure
Planning and
Development
LWSC [email protected]
Phiri Wanzi Manager – Prepaid LWSC [email protected]
Shane Wilson Director Engineering LWSC [email protected]
Kambita Musole
R
Senior Eng. Urban Water
Supply & Sanitation
MLGH [email protected]
Singanga
Douglas
PEUWSS MLGH [email protected]
Chibamba
Marcel
Treasurer LWWG NWASCO [email protected]
Chitumbo Kelvin Director NWASCO [email protected]
Hara Kasenga Senior Inspector – Tech NWASCO [email protected]
Mutale Peter Chief Inspector NWASCO [email protected]
Mwendapole
Chanda
Member LWWG NWASCO [email protected]
Ndhlovu Mike Coordinator Lusaka
Water Group
NWASCO [email protected]


![PPAR and PPAR as Modulators of Neoplasia and Cell Fatedownloads.hindawi.com/journals/ppar/2008/247379.pdf · recent reviews have described the role of PPARs in metabolic disease [4–6],](https://static.fdocuments.us/doc/165x107/5e459b15cf716854423e89e6/ppar-and-ppar-as-modulators-of-neoplasia-and-cell-recent-reviews-have-described.jpg)


