z c s Big Fork River Watershed - Minnesota Pollution ... · Figure 6. The Big Fork River Watershed...
146
z c s Big Fork River Watershed Monitoring and Assessment Report December 2013
Transcript of z c s Big Fork River Watershed - Minnesota Pollution ... · Figure 6. The Big Fork River Watershed...
z c
s
Big Fork River Watershed Monitoring and Assessment Report
December 2013
Minnesota Pollution Control Agency 520 Lafayette Road North | Saint Paul, MN 55155-4194 | www.pca.state.mn.us | 651-296-6300 Toll free 800-657-3864 | TTY 651-282-5332 This report is available in alternative formats upon request, and online at www.pca.state.mn.us
Document number: wq-ws3-09030006b
Authors MPCA Big Fork River Watershed Report Team: April Lueck, Jesse Anderson, Mike Kennedy, Nolan Baratono, Dave Christopherson, David Duffey, Stacia Grayson, Jeff Jasperson, Benjamin Lundeen, Bruce Monson, Shawn Nelson, Kris Parson, Andrew Streitz.
Contributors / acknowledgements Citizen Stream Monitoring Program Volunteers
The MPCA is reducing printing and mailing costs by using the Internet to distribute reports and information to wider audience. Visit our website for more information.
MPCA reports are printed on 100 percent post-consumer recycled content paper manufactured without chlorine or chlorine derivatives.
Minnesota Department of Natural Resources Minnesota Department of Health Minnesota Department of Agriculture
Project dollars provided by the Clean Water Fund (from the Clean Water, Land and Legacy Amendment)
List of acronyms AUID Assessment Unit Identification Determination
CCSI Channel Condition and Stability Index
CD County Ditch
CI Confidence Interval
CLMP Citizen Lake Monitoring Program
CR County Road
CSAH County State Aid Highway
CSMP Citizen Stream Monitoring Program
CWA Clean Water Act
CWLA Clean Water Legacy Act
DOP Dissolved Orthophosphate
E Eutrophic
EQuIS Environmental Quality Information System
EX Exceeds Criteria (Bacteria)
EXP Exceeds Criteria, Potential Impairment
EXS Exceeds Criteria, Potential Severe Impairment
FS Full Support
FWMC Flow Weighted Mean Concentration
H Hypereutrophic
HUC Hydrologic Unit Code
IBI Index of Biotic Integrity
IF Insufficient Information
K Potassium
LRVW Limited Resource Value Water
M Mesotrophic
MCES Metropolitan Council Environmental Services
MDA Minnesota Department of Agriculture
MDH Minnesota Department of Health
MDNR Minnesota Department of Natural Resources
MINLEAP Minnesota Lake Eutrophication
Analysis Procedure
MPCA Minnesota Pollution Control Agency
MSHA Minnesota Stream Habitat Assessment
MTS Meets the Standard?
N Nitrogen
Nitrate-N Nitrate Plus Nitrite Nitrogen
NA Not Assessed
NHD National Hydrologic Dataset
NH3 Ammonia
NS Not Supporting
NT No Trend
OP Orthophosphate
P Phosphorous
PCB Poly Chlorinated Biphenyls
PWI Protected Waters Inventory
RNR River Nutrient Region
SWAG Surface Water Assessment Grant
SWCD Soil and Water Conservation District
SWUD State Water Use Database
TALU Tiered Aquatic Life Uses
TKN Total Kjeldahl Nitrogen
TMDL Total Maximum Daily Load
TP Total Phosphorous
TSS Total Suspended Solids
USGS United States Geological Survey
WPLMN Water Pollutant Load Monitoring Network
Contents Executive Summary ............................................................................................................................1 Introduction ......................................................................................................................................2
I. The Watershed Monitoring Approach .....................................................................................3 II. Assessment Methodology ......................................................................................................8 III. Watershed Overview ........................................................................................................... 12 IV. Watershed-Wide Data Collection Methodology .................................................................... 20 V. Individual Watershed Results ............................................................................................... 25
Upper Big Fork River Watershed HUC 9030006010 ................................................................ 29 Popple River WatershedHUC 09030006020 ........................................................................... 35 Upper Bowstring River Watershed HUC 09030006030 ........................................... 42 Bowstring River Watershed HUC 09030006040 ........................................... 48 Gale Brook Watershed HUC 09030006050 ........................................... 53 Middle Big Fork River Watershed HUC 09030006060 ........................................... 60 Caldwell Creek Watershed HUC 09030006070 ........................................... 66 Lower Middle Big Fork River Watershed HUC 09030006080 ........................................... 71 Dinner Creek Watershed HUC 09030006090 ........................................... 76 Sturgeon River Watershed HUC 09030006100 ........................................... 79 Lower Big Fork River Watershed HUC 09030006110 ........................................... 84 Bear River Watershed HUC 09030006120 ........................................... 88
VI. Watershed-wide Results and Discussion ............................................................................... 94 VII. Summaries and Recommendations ..................................................................................... 115
Literature Cited .............................................................................................................................. 116 Appendix 1 - Water chemistry definitions ................................................................................... 117 Appendix 2 - Intensive watershed monitoring water chemistry stations in the Big Fork River Watershed ........................................................................................................... 118 Appendix 3.1 - AUID table of stream assessment results (by parameter and beneficial use) ......... 119 Appendix 3.2 - Assessment results for lakes in the Big Fork River Watershed ............................... 123 Appendix 4.1 - Minnesota statewide IBI thresholds and confidence limits ................................... 129 Appendix 4.2 - Biological monitoring results – fish IBI (assessable reaches) .................................. 130 Appendix 4.3 - Biological monitoring results-macroinvertebrate IBI (assessable reaches) ............. 133 Appendix 5.1 - Good/fair/poor thresholds for biological stations on non-assessed channelized AUIDs 136 ...................................................................................................................................... Appendix 5.2 - Channelized stream reach and AUID IBI scores-FISH (non-assessed) ..................... 137 Appendix 5.3 - Channelized stream reach and AUID IBI scores-macrinverbrates (non-unassessed) ....................................................................................................................... 138 Appendix 6.1 - Minnesota’s ecoregion-based lake eutrophication standards ............................... 138 Appendix 6.2 - MINLEAP model estimates of phosphorus loads for lakes in the Big Fork River Watershed ........................................................................................................... 139
List of Figures Figure 1. Major watersheds within Minnesota (8-Digit HUC). ..............................................................3 Figure 2. Example of nested HUCs from the Whitewater River Watershed ...........................................4 Figure 3. Intensive watershed monitoring sites for streams in the Big Fork River Watershed ................5 Figure 4. Locations of local groups’, citizens’ and the MPCA’s lake monitoring in the Big Fork River Watershed ...................................................................................................................7 Figure 5. Flowchart of aquatic life use assessment process ................................................................ 10
Figure 6. The Big Fork River Watershed within the Northern Minnesota Wetlands and Northern Lakes and Forests ecoregions of northern Minnesota ......................................................... 12 Figure 7. Major land resource areas (MLRA) in the Big Fork River Watershed ..................................... 13 Figure 8. Land use in the Big Fork River Watershed ........................................................................... 15 Figure 9. Statewide precipitation levels during the 2012 water year .................................................. 17 Figure 10. Precipitation trends in north-central Minnesota 1990 – 2011, with five year running average ......................................................................................................... 17 Figure 11. Depiction of groundwater flow adjacent to a river, with relative time of transit ................ 18 Figure 12. Locations of permitted groundwater withdrawals in the Big Fork River Watershed ............ 19 Figure 13. Total annual groundwater and surface water withdrawals in the Big Fork River Watershed (1990-2010) .............................................................................................. 19 Figure 14. Hydrograph and annual runoff for the Big Fork River near Big Falls (2007-2010) ................. 20 Figure 15. Locations of area MDNR observation wells ....................................................................... 23 Figure 16. Locations of wells in the MPCA Ambient Groundwater Monitoring Program ...................... 24 Figure 17. Land use within each HUC 11 Watershed .......................................................................... 27 Figure 18. Currently listed impaired waters by parameter and land use characteristics in the Upper Big Fork River Watershed ....................................................................................................... 34 Figure 19. Annual average Round Lake TP, Chl-a, and Secchi data ...................................................... 40 Figure 20. Round Lake algae bloom, summer 2010; U.S. Department of Agriculture, Farm Service Agency. Water quality conditions in Round Lake likely have a significant effect in downstream water bodies, such as the adjacent Natures Lakes and lower reaches of the Popple River .................. 40 Figure 21. Currently listed impaired waters by parameter and land use characteristics in the Popple River Watershed .............................................................................................................................. 41 Figure 22. Currently listed impaired waters by parameter and land use characteristics in the Upper Bow String River subwatershed .............................................................................................. 47 Figure 23. Annual average Bowstring Lake TP, Chl-a, and Secchi data ................................................ 51 Figure 24. Currently listed impaired waters by parameter and land use characteristics in the Bowstring River subwatershed ......................................................................................................... 52 Figure 25. Currently listed impaired waters by parameter and land use characteristics in the Gale Brook subwatershed ................................................................................................................ 59 Figure 26. Currently listed impaired waters by parameter and land use characteristics in the Middle Big ForkWatershed ............................................................................................................... 65 Figure 27. Currently listed impaired waters by parameter and land use characteristics in the Caldwell Brook Watershed ............................................................................................................... 70 Figure 28. Currently listed impaired waters by parameter and land use characteristics in the Lower Middle Big Fork subwatershed ............................................................................................... 75 Figure 29. Currently listed impaired waters by parameter and land use characteristics in the Dinner Creek subwatershed ............................................................................................................. 78 Figure 30. Currently listed impaired waters by parameter and land use characteristics in the Sturgeon River subwatershed ........................................................................................................... 83 Figure 31. Currently listed impaired waters by parameter and land use characteristics in the Lower Big Fork River subwatershed .................................................................................................. 87 Figure 32. Currently listed impaired waters by parameter and land use characteristics in the Bear River subwatershed ................................................................................................................. 93 Figure 33. Total suspended solids (TSS) flow weighted mean concentrations in the Big Fork River Watershed ................................................................................................................. 95 Figure 34. Total phosphorus (TP) flow weighted mean concentrations for the Big Fork River Watershed ................................................................................................................. 97 Figure 35. Dissolved orthophosphate (DOP) flow weighted mean concentrations for the Big Fork River Watershed ................................................................................................................. 97
Figure 36. Nitrate + Nitrite Nitrogen (Nitrate-N) flow weighted mean concentrations for the Big Fork River Watershed ................................................................................................................. 98 Figure 37. Fully supporting waters by designated use in the Big Fork River Watershed ..................... 110 Figure 38. Impaired waters by designated use in the Big Fork River Watershed ............................... 111 Figure 39. Aquatic consumption use support in the Big Fork River Watershed ................................. 112 Figure 40. Aquatic life use support in the Big Fork River Watershed ................................................. 113 Figure 41. Aquatic recreation use support in the Big Fork River Watershed ...................................... 114 List of Tables Table 1. Big Fork River HUC-11 watersheds ....................................................................................... 27 Table 2. Eutrophication standards by ecoregion and lake type (Heiskary and Wilson, 2005) ............... 28 Table 3. Aquatic life and recreation assessments on stream reaches: Upper Big Fork River Watershed. ...................................................................................................................................... 29 Table 4. Non-assessed biological stations on channelized AUIDs: 9030006010 11-HUC. ...................... 30 Table 5. Minnesota Stream Habitat Assessment (MSHA): 9030006010 11-HUC. ................................. 30 Table 6. Outlet water chemistry results: 9030006010 11-HUC............................................................ 31 Table 7. Lake water aquatic recreation assessments: 9030006010 11-HUC. ........................................ 32 Table 8. Aquatic life and recreation assessments on stream reaches: Popple River Watershed.. ......... 35 Table 9. Minnesota Stream Habitat Assessment (MSHA): 09030006020 11-HUC. ............................... 36 Table 10. Outlet water chemistry results: 09030006020 11-HUC. ....................................................... 37 Table 11. Lake water aquatic recreation assessments: 09030006020 11-HUC. .................................... 38 Table 12. Aquatic life and recreation assessments on stream reaches: Upper Bowstring River Watershed.. ..................................................................................................................................... 42 Table 13. Minnesota Stream Habitat Assessment (MSHA): 09030006030 11-HUC............................... 43 Table 14. Outlet water chemistry results: 09030006030 11-HUC. ....................................................... 44 Table 15. Lake water aquatic recreation assessments: 09030006030 11-HUC. .................................... 45 Table 16. Aquatic life and recreation assessments on stream reaches: Bowstring Watershed. ........... 48 Table 18. Outlet water chemistry results: 09030006040 11-HUC. ....................................................... 49 Table 19. Lake water aquatic recreation assessments: 09030006040 11-HUC. .................................... 50 Table 20. Aquatic life and recreation assessments on stream reaches: Gale Brook Watershed.. ......... 53 Table 21. Minnesota Stream Habitat Assessment (MSHA): 09030006050 11-HUC .............................. 54 Table 22. Outlet water chemistry results: 09030006050 11-HUC. ....................................................... 55 Table 23. Lake water aquatic recreation assessments: 09030006050 11-HUC. .................................... 56 Table 24. Aquatic life and recreation assessments on stream reaches: Middle Big Fork River Watershed.. ..................................................................................................................................... 60 Table 25. Minnesota Stream Habitat Assessment (MSHA): 09030006060] 11-HUC. ............................ 61 Table 26. Outlet water chemistry results: 09030006060 11-HUC. ....................................................... 62 Table 27. Lake water aquatic recreation assessments: 09030006060 11-HUC. .................................... 63 Table 28. Aquatic life and recreation assessments on stream reaches: Caldwell Creek Watershed. ..... 66 Table 29. Non-assessed biological stations on channelized AUIDs: 09030006070 11-HUC. .................. 67 Table 30. Minnesota Stream Habitat Assessment (MSHA): 09030006070 11-HUC............................... 67 Table 31. Outlet water chemistry results: 09030006070 11-HUC. ....................................................... 68 Table 32. Aquatic life and recreation assessments on stream reaches: Lower Middle Big Fork River Watershed. Reaches are organized upstream to downstream in the table. ........................................ 71 Table 33. Minnesota Stream Habitat Assessment (MSHA): 09030006080 11-HUC............................... 72 Table 34. Outlet water chemistry results: 09030006080 11-HUC. ....................................................... 73 Table 35. Aquatic life and recreation assessments on stream reaches: Dinner Creek Watershed. ....... 76 Table 36. Minnesota Stream Habitat Assessment (MSHA): 09030006090 11-HUC............................... 76 Table 37. Aquatic life and recreation assessments on stream reaches: Sturgeon River Watershed.. .... 79
Table 38. Non-assessed biological stations on channelized AUIDs: 09030006100 11-HUC. .................. 80 Table 39. Minnesota Stream Habitat Assessment (MSHA): 09030006100 11-HUC............................... 80 Table 40. Outlet water chemistry results: 09030006100 11-HUC. ....................................................... 81 Table 41. Aquatic life and recreation assessments on stream reaches: Lower Big Fork River watershed.. ..................................................................................................................................... 84 Table 42. Minnesota Stream Habitat Assessment (MSHA): 09030006110 11-HUC............................... 85 Table 43. Outlet water chemistry results: 09030006110 11-HUC. ....................................................... 85 Table 44. Aquatic life and recreation assessments on stream reaches: Bear River watershed.. ........... 88 Table 45. Non-assessed biological stations on channelized AUIDs: 09030006120 11-HUC. .................. 89 Table 46. Minnesota Stream Habitat Assessment (MSHA): 09030006120 11-HUC............................... 89 Table 47. Outlet water chemistry results: 09030006120 11-HUC. ....................................................... 90 Table 48. Water Outlet water chemistry results: Big Fork River HUC 8 Pour Point .............................. 91 Table 49. Annual pollutant loads by parameter calculated for the Big Fork River. .............................. 96 Table 50. Assessment summary for stream water quality in the Big Fork River Watershed ................ 99 Table 51. Assessment summary for lake water chemistry in the Big Fork River Watershed. ................ 99 Table 52. Fish species captured within the Big Fork River Watershed between 2005 and 2011,. ....... 100 Table 53. Summary statistics of mercury, PCBs, and PFOS, by waterway-species-year ...................... 103 Table 54. Waterways having fish contaminant data, showing impairments caused by contaminants in fish tissue and number of fish tested by species .................................................... 104 Table 55. Summary statistics of mercury, PCBs, and PFOS, by waterway-species-year ...................... 105 Table 56. Trends in the Big Fork River Watershed. .......................................................................... 109 Table 57. Water clarity trends at Citizen Stream Monitoring sites. ................................................... 109
Big Fork River Watershed Monitoring and Assessment Report • December 2013 Minnesota Pollution Control Agency
1
Executive summary The Big Fork River Watershed is located in northern Minnesota, split between Itasca and Koochiching counties. The watershed drains over 1.3 million acres and contains many lakes, wetlands, and forests. Agricultural and urban land uses are not common; rather forestry and tourism are the dominant industries within the watershed. The major river in the watershed, the Big Fork River, starts at Dora Lake and winds its way north before flowing into the Rainy River. The river is an outstanding recreational resource offering fishing and canoeing opportunities for people seeking a northern Minnesota wilderness experience.
The Minnesota Pollution Control Agency (MPCA) began an Intensive Watershed Monitoring (IWM) program within the Big Fork River Watershed in 2010. The monitoring was comprehensive and included the collection of samples from lakes, streams and groundwater. Biological data was collected from rivers and streams to assess aquatic life and aquatic consumption. Water chemistry information was collected to assess surface waters for aquatic life and aquatic recreation as well as computing pollutant loads through the Major Watershed Load Monitoring Program (MWLMP). The work was carried out by staff from the MPCA as well as citizen volunteers. The results of this monitoring effort were used to assess the Big Fork River Watershed in 2012.
The assessment results for the Big Fork River Watershed indicate that the condition of the lakes and streams are good to very good, even though there were a few impairments found. The most widespread impairment found in both lakes and rivers is due to high mercury levels limiting the aquatic consumption of fish. The remaining impairments throughout the watershed consisted of low dissolved oxygen (DO), fish and macroinvertebrate, and nutrient impairments. Many of the aquatic life impairments were found to be the result of natural conditions within the Big Fork River Watershed.
Big Fork River Watershed Monitoring and Assessment Report • December 2013 Minnesota Pollution Control Agency
2
Introduction Water is one of Minnesota’s most abundant and precious resources. The MPCA is charged under both federal and state law with the responsibility of protecting the water quality of Minnesota’s water resources. MPCA’s water management efforts are tied to the 1972 Federal Clean Water Act (CWA) which requires states to adopt water quality standards to protect their water resources and the designated uses of those waters, such as for drinking water, recreation, fish consumption and aquatic life. States are required to provide a summary of the status of their surface waters and develop a list of water bodies that do not meet established standards. Such waters are referred to as “impaired waters” and the state must make appropriate plans to restore these waters, including the development of Total Maximum Daily Loads (TMDLs). A TMDL is a comprehensive study identifying all pollution sources causing or contributing to impairment and an estimation of the reductions needed to restore a water body so that it can once again support its designated use.
The MPCA currently conducts a variety of surface water monitoring activities that support our overall mission of helping Minnesotans protect the environment. To successfully prevent and address problems, decision makers need good information regarding the status of the resources, potential and actual threats, options for addressing the threats and data on the effectiveness of management actions. The MPCA’s monitoring efforts are focused on providing that critical information. Overall, the MPCA is striving to provide information to assess and ultimately to restore or protect the integrity of Minnesota’s waters.
The passage of Minnesota’s Clean Water Legacy Act (CWLA) in 2006 provided a policy framework and the initial resources for state and local governments to accelerate efforts to monitor, assess, restore and protect surface waters. This work is implemented with funding from the Clean Water Fund created by the passage of the Clean Water Land, and Legacy Amendment to the state constitution. To facilitate the best use of agency and local resources, the MPCA has developed a watershed monitoring strategy which uses an effective and efficient integration of agency and local water monitoring programs to assess the condition of Minnesota’s surface waters. This strategy provides an opportunity to more fully integrate MPCA water resource management efforts in cooperation with local government and stakeholders to allow for coordinated development and implementation of water quality restoration and improvement projects.
The strategy behind the watershed monitoring approach is to intensively monitor streams and lakes within a major watershed to determine the overall health of water resources, identify impaired waters, and to identify waters in need of additional protection. The benefit of the approach is the opportunity to begin to address most, if not all, impairments through a coordinated TMDL process at the watershed scale, rather than the reach-by-reach and parameter-by-parameter approach often historically employed. A watershed approach will more effectively address multiple impairments resulting from the cumulative effects of point and non-point sources of pollution and further the CWA goal of protecting and restoring the quality of Minnesota’s water resources.
This watershed-wide monitoring approach was implemented in the Big Fork River Watershed beginning in the summer of 2010. This report provides a summary of all water quality assessment results in the Big Fork River Watershed and incorporates all data available for the assessment process including watershed monitoring, volunteer monitoring and monitoring conducted by local government units.
Big Fork River Watershed Monitoring and Assessment Report • December 2013 Minnesota Pollution Control Agency
3
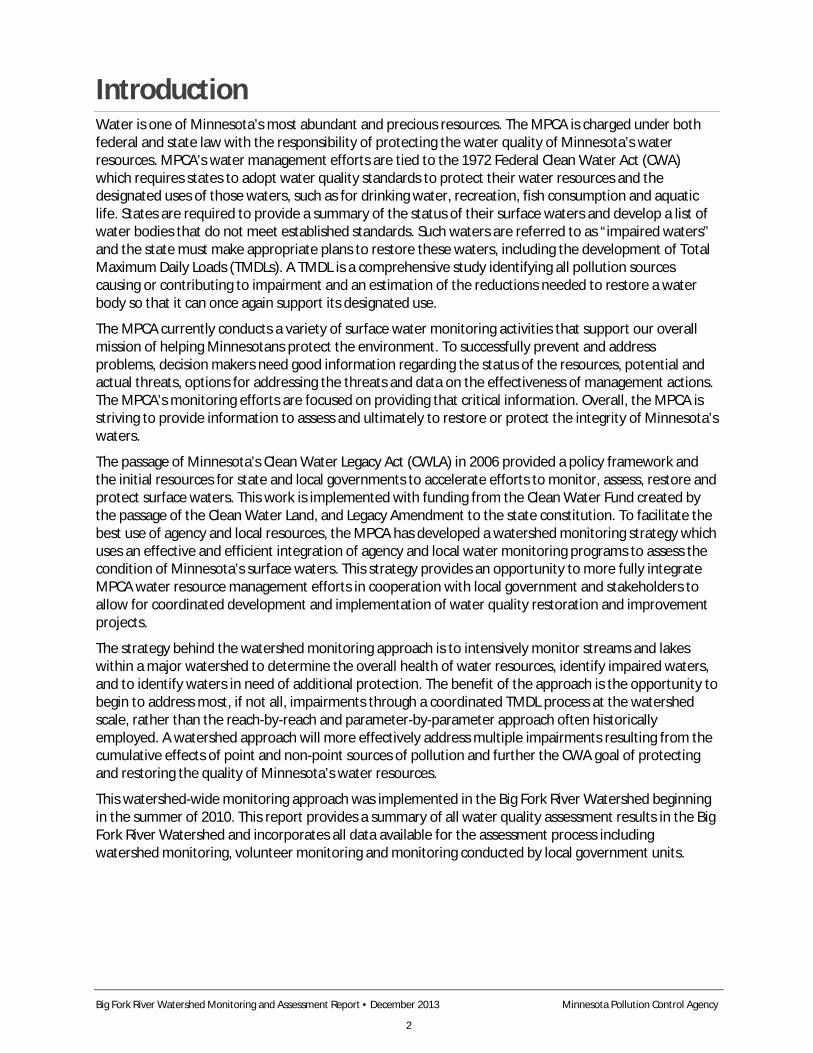
I. The watershed monitoring approach The watershed approach is a 10-year rotation for monitoring and assessing waters of the state on the level of Minnesota’s 81 major watersheds (Figure 1). The major benefit of this approach is the integration of monitoring resources to provide a more complete and systematic assessment of water quality at a geographic scale useful for the development and implementation of effective TMDLs, project planning, effectiveness monitoring and protection strategies. The following paragraphs provide details on each of the four principal monitoring components of the watershed approach. For additional information see: Watershed Approach to Condition Monitoring and Assessment (MPCA 2008) (http://www.pca.state.mn.us/publications/wq-s1-27.pdf).
Load monitoring network Funded with appropriations from Minnesota’s Clean Water Legacy Fund, the Major Watershed Load Monitoring Program (MWLMP) is a long-term program designed to measure and compare regional differences and long-term trends in water quality among Minnesota’s major rivers including the Red, Rainy, St. Croix, Mississippi, and Minnesota, and the outlets of the major tributaries (8 digit HUC scale) draining to these rivers. Since the program’s inception in 2007 the MWLMP has adopted a multi-agency monitoring design that combines site specific stream flow data from United States Geological Survey (USGS) and Minnesota Department of Natural Resources (MDNR) flow gaging stations with water quality data collected by the Metropolitan Council Environmental Services, local monitoring organizations, and MPCA major watershed load monitoring staff to compute annual pollutant loads at river monitoring sites across Minnesota. Data will also be used to assist with TMDL studies and implementation plans, watershed modeling efforts, and watershed research projects.
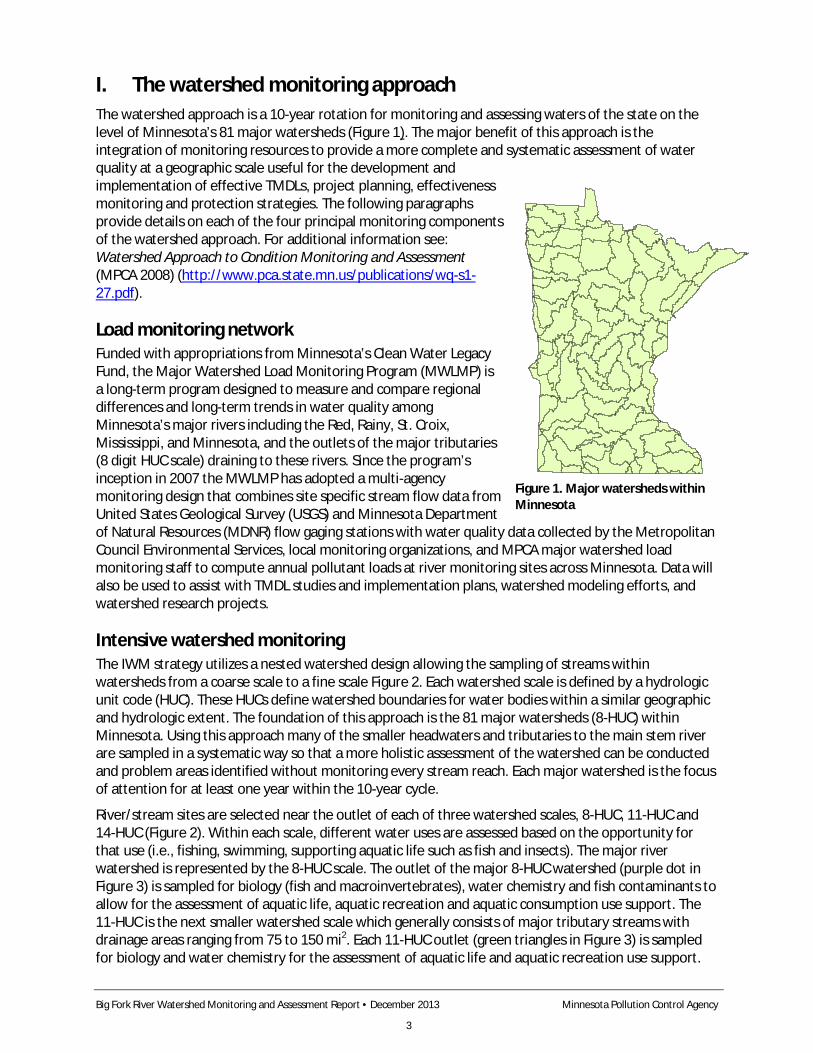
Intensive watershed monitoring The IWM strategy utilizes a nested watershed design allowing the sampling of streams within watersheds from a coarse scale to a fine scale Figure 2. Each watershed scale is defined by a hydrologic unit code (HUC). These HUCs define watershed boundaries for water bodies within a similar geographic and hydrologic extent. The foundation of this approach is the 81 major watersheds (8-HUC) within Minnesota. Using this approach many of the smaller headwaters and tributaries to the main stem river are sampled in a systematic way so that a more holistic assessment of the watershed can be conducted and problem areas identified without monitoring every stream reach. Each major watershed is the focus of attention for at least one year within the 10-year cycle.
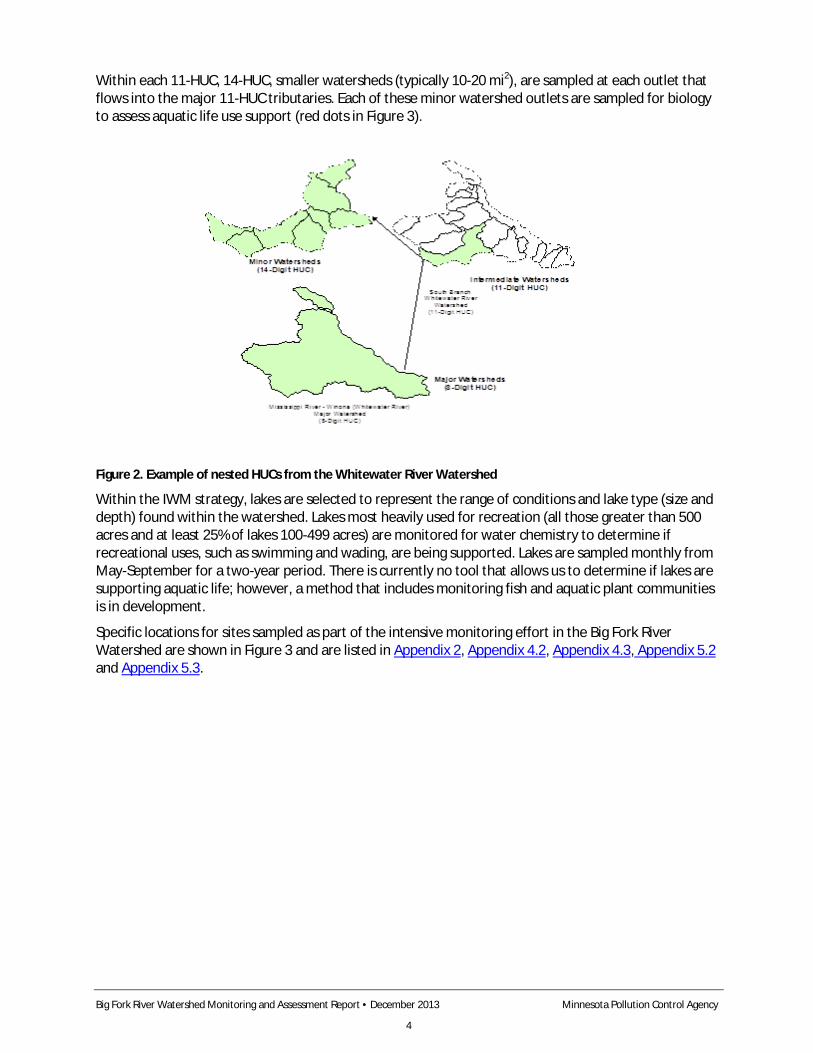
River/stream sites are selected near the outlet of each of three watershed scales, 8-HUC, 11-HUC and 14-HUC (Figure 2). Within each scale, different water uses are assessed based on the opportunity for that use (i.e., fishing, swimming, supporting aquatic life such as fish and insects). The major river watershed is represented by the 8-HUC scale. The outlet of the major 8-HUC watershed (purple dot in Figure 3) is sampled for biology (fish and macroinvertebrates), water chemistry and fish contaminants to allow for the assessment of aquatic life, aquatic recreation and aquatic consumption use support. The 11-HUC is the next smaller watershed scale which generally consists of major tributary streams with drainage areas ranging from 75 to 150 mi2. Each 11-HUC outlet (green triangles in Figure 3) is sampled for biology and water chemistry for the assessment of aquatic life and aquatic recreation use support.
Figure 1. Major watersheds within Minnesota
Big Fork River Watershed Monitoring and Assessment Report • December 2013 Minnesota Pollution Control Agency
4
Within each 11-HUC, 14-HUC, smaller watersheds (typically 10-20 mi2), are sampled at each outlet that flows into the major 11-HUC tributaries. Each of these minor watershed outlets are sampled for biology to assess aquatic life use support (red dots in Figure 3).
Figure 2. Example of nested HUCs from the Whitewater River Watershed
Within the IWM strategy, lakes are selected to represent the range of conditions and lake type (size and depth) found within the watershed. Lakes most heavily used for recreation (all those greater than 500 acres and at least 25% of lakes 100-499 acres) are monitored for water chemistry to determine if recreational uses, such as swimming and wading, are being supported. Lakes are sampled monthly from May-September for a two-year period. There is currently no tool that allows us to determine if lakes are supporting aquatic life; however, a method that includes monitoring fish and aquatic plant communities is in development.
Specific locations for sites sampled as part of the intensive monitoring effort in the Big Fork River Watershed are shown in Figure 3 and are listed in Appendix 2, Appendix 4.2, Appendix 4.3, Appendix 5.2 and Appendix 5.3.
Big Fork River Watershed Monitoring and Assessment Report • December 2013 Minnesota Pollution Control Agency
5
Figure 3. Intensive watershed monitoring sites for streams in the Big Fork River Watershed
Big Fork River Watershed Monitoring and Assessment Report • December 2013 Minnesota Pollution Control Agency
6
Citizen and local monitoring Citizen and local monitoring are important components of the watershed approach. The MPCA and its local partners jointly select the stream sites and lakes to be included in the IWM process. Funding passes from MPCA through Surface Water Assessment Grants (SWAGs) to local groups such as counties, soil and water conservation districts (SWCD), watershed districts, nonprofits, and educational institutions to support lake and stream water chemistry monitoring. Local partners use the same monitoring protocols as the MPCA, and all monitoring data from SWAG projects are combined with the MPCA’s data to assess the condition of Minnesota lakes and streams. Preplanning and coordination of sampling with local citizens and governments helps focus monitoring where it will be most effective for assessment and observing long-term trends. This allows citizens/governments the ability to see how their efforts are used to inform water quality decisions and track how management efforts affect change. Many SWAG grantees invite citizen participation in their monitoring projects and their combined participation greatly expand our overall capacity to conduct sampling.
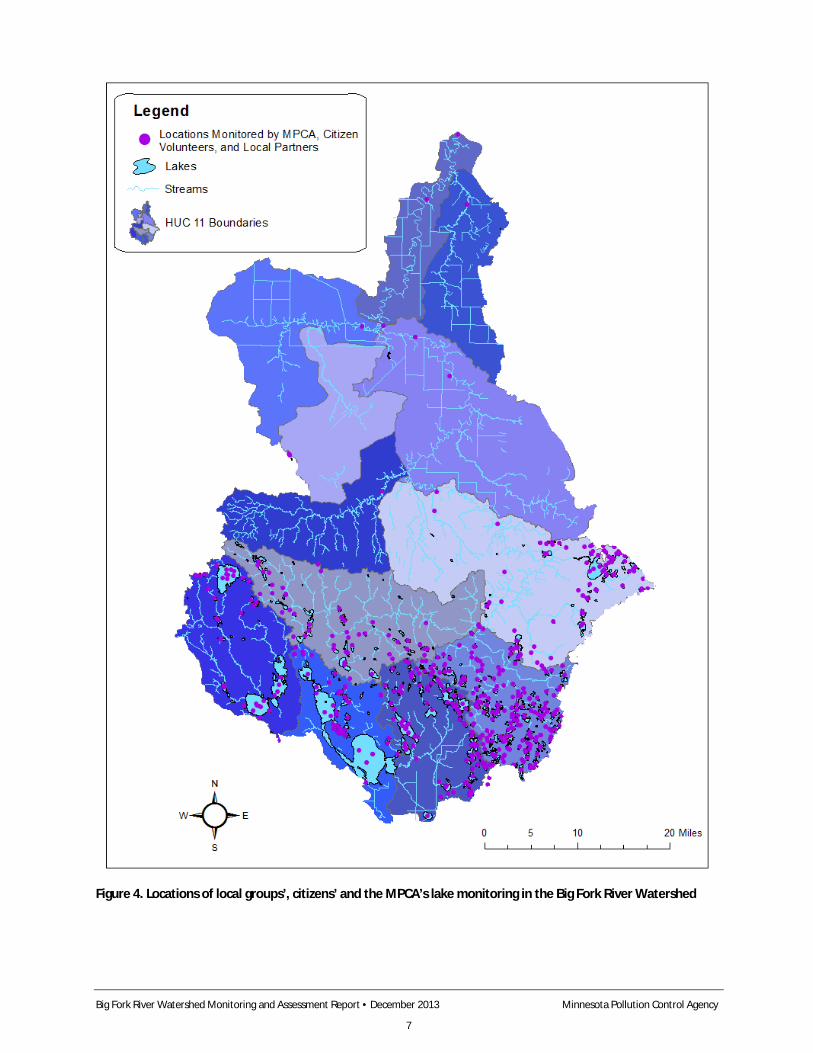
The MPCA also coordinates two programs aimed at encouraging long term citizen surface water monitoring: the Citizen Lake Monitoring Program (CLMP) and the Citizen Stream Monitoring Program (CSMP). Like the permanent load monitoring network, having citizen volunteers monitor a given lake or stream site monthly and from year to year can provide the long-term picture needed to help evaluate current status and trends. Citizen monitoring is especially effective at helping to track water quality changes that occur in the years between intensive monitoring years. Figure 4 provides an illustration of the locations where citizen monitoring data were used for assessment in the Big Fork River Watershed.
Big Fork River Watershed Monitoring and Assessment Report • December 2013 Minnesota Pollution Control Agency
7
Figure 4. Locations of local groups’, citizens’ and the MPCA’s lake monitoring in the Big Fork River Watershed
Big Fork River Watershed Monitoring and Assessment Report • December 2013 Minnesota Pollution Control Agency
8
II. Assessment methodology The CWA requires states to report on the condition of the waters of the state every two years. This biennial report to Congress contains an updated list of surface waters that are determined to be supporting or non-supporting of their designated uses as evaluated by the comparison of monitoring data to criteria specified by Minnesota Water Quality Standards (Minn. R. ch. 7050 2008; https://www.revisor.leg.state.mn.us/rules/?id=7050). The assessment and listing process involves dozens of MPCA staff, other state agencies and local partners. The goal of this effort is to use the best data and best science available to assess the condition of Minnesota’s water resources. For a thorough review of the assessment methodologies see: Guidance Manual for Assessing the Quality of Minnesota Surface Waters for the Determination of Impairment 305(b) Report and 303(d) List (MPCA 2012). http://www.pca.state.mn.us/index.php/view-document.html?gid=8601.
Water quality standards Water quality standards are the fundamental benchmarks by which the quality of surface waters are measured and used to determine impairment. These standards can be numeric or narrative in nature and define the concentrations or conditions of surface waters that allow them to meet their designated beneficial uses, such as for fishing (aquatic life), swimming (aquatic recreation) or human consumption (aquatic consumption). All surface waters in Minnesota, including lakes, rivers, streams and wetlands are protected for aquatic life and recreation where these uses are attainable. Numeric water quality standards represent concentrations of specific pollutants in water that protect a specific designated use. Narrative standards are statements of conditions in and on the water, such as biological condition, that protect their designated uses.
Protection of aquatic life means the maintenance of a healthy aquatic community, including fish, macroinvertebrates and plants. The sampling of aquatic organisms for assessment is called biological monitoring. Biological monitoring is a direct means to assess aquatic life use support, as the aquatic community tends to integrate the effects of all pollutants and stressors over time. Interpretations of narrative criteria for aquatic life in streams are based on multi-metric biological indices including the Fish Index of Biological Integrity (Fish IBI), which evaluates the health of the fish community, and the Macroinvertebrate Index of Biological Integrity (MIBI), which evaluates the health of the aquatic macroinvertebrate community. Additionally, chemical parameters are measured and assessed against numeric standards developed to be protective of aquatic life, including pH, DO, un-ionized ammonia nitrogen, chloride and turbidity.
Protection of aquatic recreation means the maintenance of conditions safe and suitable for swimming and other forms of water recreation. In streams, aquatic recreation is assessed by measuring the concentration of E. coli bacteria in the water. To determine if a lake supports aquatic recreational activities its trophic status is evaluated, using total phosphorus, Secchi depth and chlorophyll-a as indicators. Lakes that are enriched with nutrients and have abundant algal growth are eutrophic and do not support aquatic recreation.
Protection of consumption means protecting citizens who eat fish from Minnesota waters or receive their drinking water from waterbodies protected for this beneficial use. The concentrations of mercury and polychlorinated biphenyls (PCBs) in fish tissue are used to evaluate whether or not fish are safe to eat in a lake or stream and to issue recommendations regarding the frequency that fish from a particular water body can be safely consumed. For lakes, rivers and streams that are protected as a source of drinking water the MPCA primarily measures the concentration of nitrate in the water column to assess this designated use.
A small percentage of stream miles in the state (~1% of 92,000 miles) have been individually evaluated and re-classified as a Class 7 Limited Resource Value Water (LRVW). These streams have previously
Big Fork River Watershed Monitoring and Assessment Report • December 2013 Minnesota Pollution Control Agency
9
demonstrated that the existing and potential aquatic community is severely limited and cannot achieve aquatic life standards either by: a) natural conditions as exhibited by poor water quality characteristics, lack of habitat or lack of water; b) the quality of the resource has been significantly altered by human activity and the effect is essentially irreversible; or c) there are limited recreational opportunities (such as fishing, swimming, wading or boating) in and on the water resource. While not being protective of aquatic life, LRVWs are still protected for industrial, agricultural, navigation and other uses. Class 7 waters are also protected for aesthetic qualities (e.g., odor), secondary body contact, and groundwater for use as a potable water supply. To protect these uses, Class 7 waters have standards for bacteria, pH, DO and toxic pollutants.
Assessment units Assessments of use support in Minnesota are made for individual waterbodies. The waterbody unit used for river systems, lakes and wetlands is called the “assessment unit”. A stream or river assessment unit usually extends from one significant tributary stream to another or from the headwaters to the first tributary. A stream “reach” may be further divided into two or more assessment reaches when there is a change in use classification (as defined in Minn. R. ch. 7050) or when there is a significant morphological feature, such as a dam or lake, within the reach. Therefore, a stream or river is often segmented into multiple assessment units that are variable in length. The MPCA is using the 1:24,000 scale high resolution National Hydrologic Dataset (NHD) to define and index stream, lake and wetland assessment units. Each river or stream reach is identified by a unique waterbody identifier (known as its AUID), comprised of the USGS eight digit hydrologic unit code (8-HUC) plus a three character code that is unique within each HUC. Lake and wetland identifiers are assigned by the MDNR. The Protected Waters Inventory (PWI) provides the identification numbers for lake, reservoirs and wetlands. These identification numbers serve as the AUID and are composed of an eight digit number indicating county, lake, and bay for each basin.
It is for these specific stream reaches or lakes that the data are evaluated for potential use impairment. Therefore, any assessment of use support would be limited to the individual assessment unit. The major exception to this is the listing of rivers for contaminants in fish tissue (aquatic consumption). Over the course of time it takes fish, particularly game fish, to grow to “catchable” size and accumulate unacceptable levels of pollutants, there is a good chance they have traveled a considerable distance. The impaired reach is defined by the location of significant barriers to fish movement such as dams upstream and downstream of the sampled reach and thus often includes several assessment units.
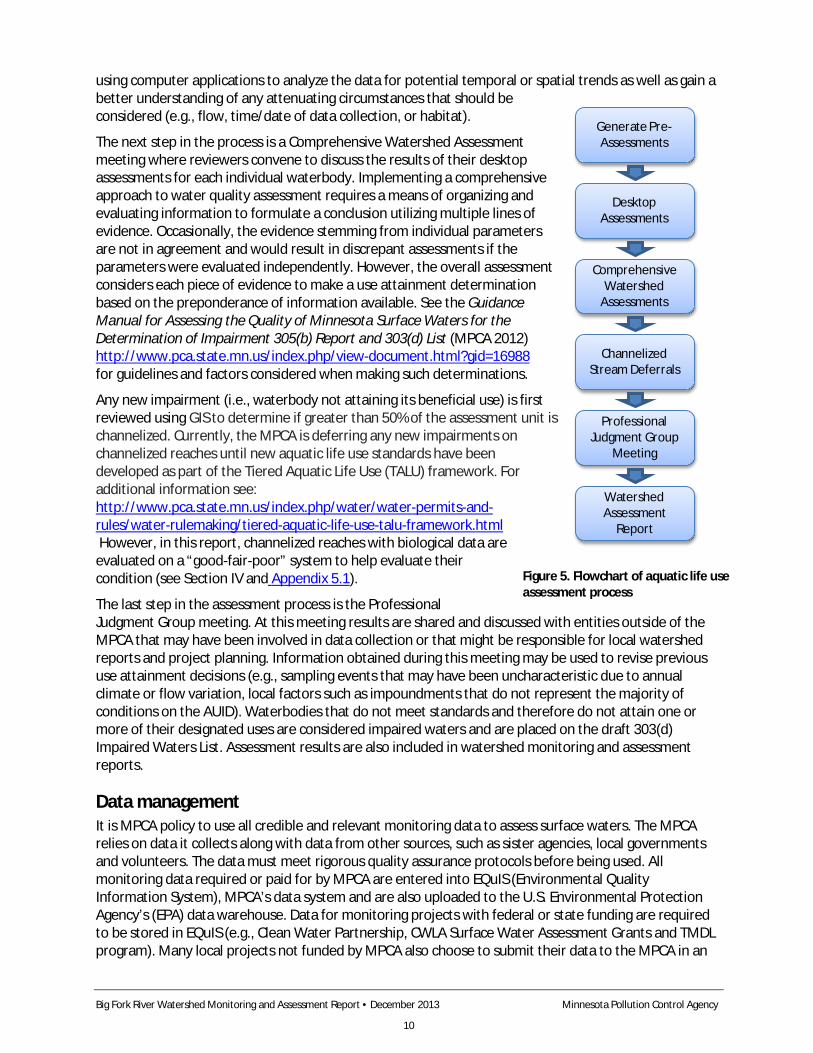
Determining use attainment For beneficial uses related to human health, such as drinking water or aquatic recreation, the relationship is well understood and thus the assessment process is a relatively simple comparison of monitoring data to numeric standards. In contrast, assessing whether a waterbody supports a healthy aquatic community is not as straightforward and often requires multiple lines of evidence to make use attainment decisions with a high degree of certainty. Incorporating a multiple lines of evidence approach into MPCA’s assessment process has been evolving over the past few years. The current process used to assess the aquatic life use of rivers and streams is outlined below and in Figure 5.
The first step in the aquatic life assessment process is a comparison of the monitoring data to water quality standards. This is largely an automated process performed by logic programmed into a database application and the results are referred to as ‘Pre-Assessments’. Pre-assessments are then reviewed by either a biologist or water quality professional, depending on whether the parameter is biological or chemical in nature. These reviews are conducted at the workstation of each reviewer (i.e., desktop)
Big Fork River Watershed Monitoring and Assessment Report • December 2013 Minnesota Pollution Control Agency
10
using computer applications to analyze the data for potential temporal or spatial trends as well as gain a better understanding of any attenuating circumstances that should be considered (e.g., flow, time/date of data collection, or habitat).
The next step in the process is a Comprehensive Watershed Assessment meeting where reviewers convene to discuss the results of their desktop assessments for each individual waterbody. Implementing a comprehensive approach to water quality assessment requires a means of organizing and evaluating information to formulate a conclusion utilizing multiple lines of evidence. Occasionally, the evidence stemming from individual parameters are not in agreement and would result in discrepant assessments if the parameters were evaluated independently. However, the overall assessment considers each piece of evidence to make a use attainment determination based on the preponderance of information available. See the Guidance Manual for Assessing the Quality of Minnesota Surface Waters for the Determination of Impairment 305(b) Report and 303(d) List (MPCA 2012) http://www.pca.state.mn.us/index.php/view-document.html?gid=16988 for guidelines and factors considered when making such determinations.
Any new impairment (i.e., waterbody not attaining its beneficial use) is first reviewed using GIS to determine if greater than 50% of the assessment unit is channelized. Currently, the MPCA is deferring any new impairments on channelized reaches until new aquatic life use standards have been developed as part of the Tiered Aquatic Life Use (TALU) framework. For additional information see: http://www.pca.state.mn.us/index.php/water/water-permits-and-rules/water-rulemaking/tiered-aquatic-life-use-talu-framework.html However, in this report, channelized reaches with biological data are evaluated on a “good-fair-poor” system to help evaluate their condition (see Section IV and Appendix 5.1).
The last step in the assessment process is the Professional Judgment Group meeting. At this meeting results are shared and discussed with entities outside of the MPCA that may have been involved in data collection or that might be responsible for local watershed reports and project planning. Information obtained during this meeting may be used to revise previous use attainment decisions (e.g., sampling events that may have been uncharacteristic due to annual climate or flow variation, local factors such as impoundments that do not represent the majority of conditions on the AUID). Waterbodies that do not meet standards and therefore do not attain one or more of their designated uses are considered impaired waters and are placed on the draft 303(d) Impaired Waters List. Assessment results are also included in watershed monitoring and assessment reports.
Data management It is MPCA policy to use all credible and relevant monitoring data to assess surface waters. The MPCA relies on data it collects along with data from other sources, such as sister agencies, local governments and volunteers. The data must meet rigorous quality assurance protocols before being used. All monitoring data required or paid for by MPCA are entered into EQuIS (Environmental Quality Information System), MPCA’s data system and are also uploaded to the U.S. Environmental Protection Agency’s (EPA) data warehouse. Data for monitoring projects with federal or state funding are required to be stored in EQuIS (e.g., Clean Water Partnership, CWLA Surface Water Assessment Grants and TMDL program). Many local projects not funded by MPCA also choose to submit their data to the MPCA in an
Generate Pre-Assessments
Desktop Assessments
Comprehensive Watershed
Assessments
Professional Judgment Group
Meeting
Channelized Stream Deferrals
Watershed Assessment
Report
Figure 5. Flowchart of aquatic life use assessment process
Big Fork River Watershed Monitoring and Assessment Report • December 2013 Minnesota Pollution Control Agency
11
EQuIS-ready format so that the monitoring data may be utilized in the assessment process. Prior to each assessment cycle, the MPCA sends out a request for monitoring data to local entities and partner organizations.
Period of record The MPCA uses data collected over the most recent 10 year period for all water quality assessments. This time-frame provides a reasonable assurance that data will have been collected over a range of weather and flow conditions and that all seasons will be adequately represented; however, data for the entire period is not required to make an assessment. The goal is to use data that best represents current water quality conditions. Therefore, recent data for pollutant categories such as toxics, lake eutrophication and fish contaminants may be given more weight during assessment.
Big Fork River Watershed Monitoring and Assessment Report • December 2013 Minnesota Pollution Control Agency
12
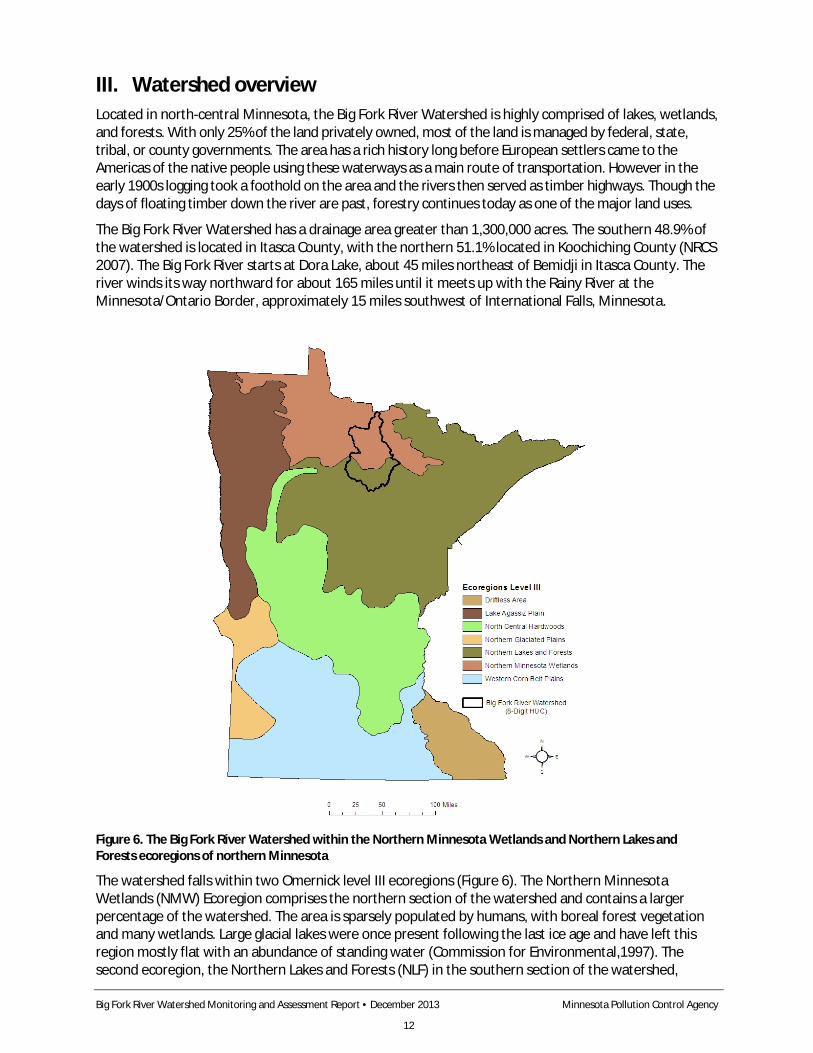
III. Watershed overview Located in north-central Minnesota, the Big Fork River Watershed is highly comprised of lakes, wetlands, and forests. With only 25% of the land privately owned, most of the land is managed by federal, state, tribal, or county governments. The area has a rich history long before European settlers came to the Americas of the native people using these waterways as a main route of transportation. However in the early 1900s logging took a foothold on the area and the rivers then served as timber highways. Though the days of floating timber down the river are past, forestry continues today as one of the major land uses.
The Big Fork River Watershed has a drainage area greater than 1,300,000 acres. The southern 48.9% of the watershed is located in Itasca County, with the northern 51.1% located in Koochiching County (NRCS 2007). The Big Fork River starts at Dora Lake, about 45 miles northeast of Bemidji in Itasca County. The river winds its way northward for about 165 miles until it meets up with the Rainy River at the Minnesota/Ontario Border, approximately 15 miles southwest of International Falls, Minnesota.
Figure 6. The Big Fork River Watershed within the Northern Minnesota Wetlands and Northern Lakes and Forests ecoregions of northern Minnesota
The watershed falls within two Omernick level III ecoregions (Figure 6). The Northern Minnesota Wetlands (NMW) Ecoregion comprises the northern section of the watershed and contains a larger percentage of the watershed. The area is sparsely populated by humans, with boreal forest vegetation and many wetlands. Large glacial lakes were once present following the last ice age and have left this region mostly flat with an abundance of standing water (Commission for Environmental,1997). The second ecoregion, the Northern Lakes and Forests (NLF) in the southern section of the watershed,
Big Fork River Watershed Monitoring and Assessment Report • December 2013 Minnesota Pollution Control Agency
13
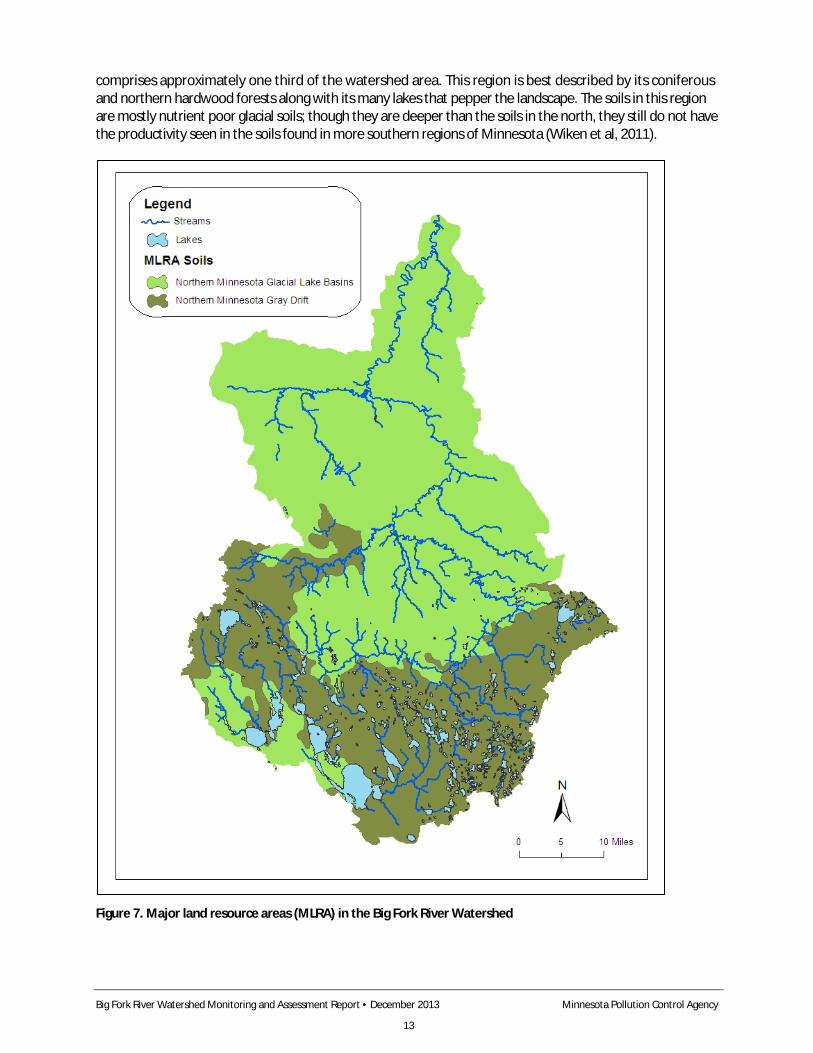
comprises approximately one third of the watershed area. This region is best described by its coniferous and northern hardwood forests along with its many lakes that pepper the landscape. The soils in this region are mostly nutrient poor glacial soils; though they are deeper than the soils in the north, they still do not have the productivity seen in the soils found in more southern regions of Minnesota (Wiken et al, 2011).
Figure 7. Major land resource areas (MLRA) in the Big Fork River Watershed
Big Fork River Watershed Monitoring and Assessment Report • December 2013 Minnesota Pollution Control Agency
14
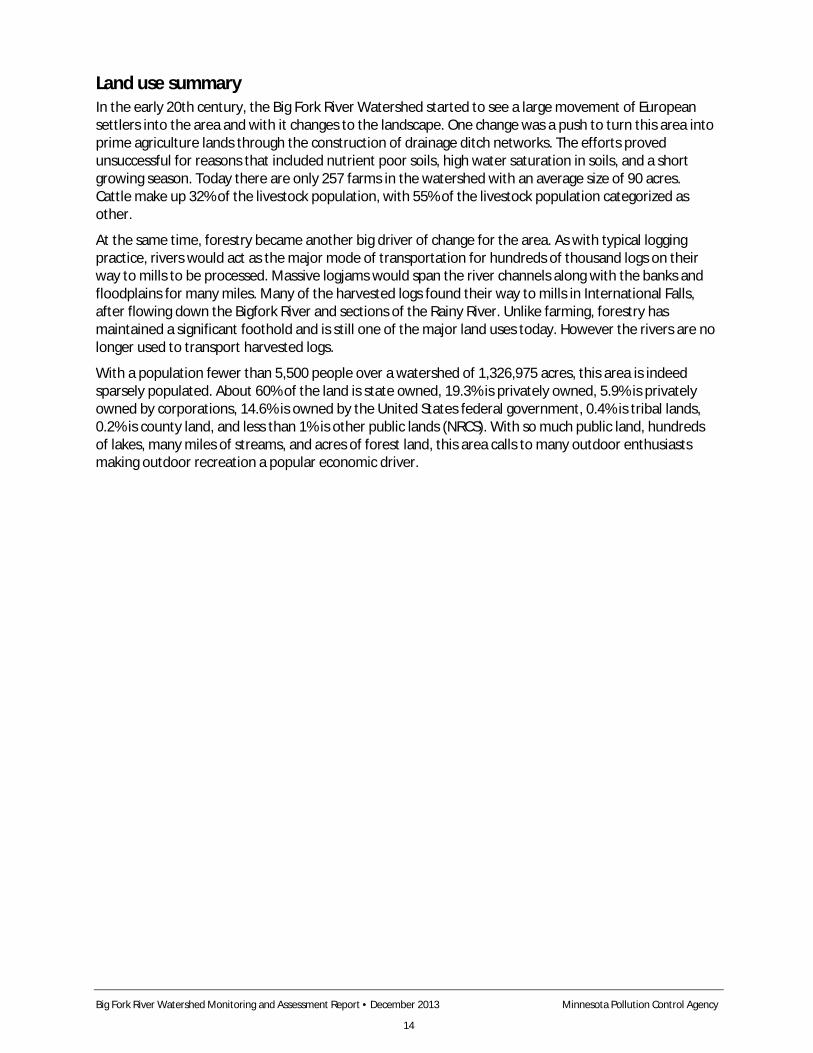
Land use summary In the early 20th century, the Big Fork River Watershed started to see a large movement of European settlers into the area and with it changes to the landscape. One change was a push to turn this area into prime agriculture lands through the construction of drainage ditch networks. The efforts proved unsuccessful for reasons that included nutrient poor soils, high water saturation in soils, and a short growing season. Today there are only 257 farms in the watershed with an average size of 90 acres. Cattle make up 32% of the livestock population, with 55% of the livestock population categorized as other.
At the same time, forestry became another big driver of change for the area. As with typical logging practice, rivers would act as the major mode of transportation for hundreds of thousand logs on their way to mills to be processed. Massive logjams would span the river channels along with the banks and floodplains for many miles. Many of the harvested logs found their way to mills in International Falls, after flowing down the Bigfork River and sections of the Rainy River. Unlike farming, forestry has maintained a significant foothold and is still one of the major land uses today. However the rivers are no longer used to transport harvested logs.
With a population fewer than 5,500 people over a watershed of 1,326,975 acres, this area is indeed sparsely populated. About 60% of the land is state owned, 19.3% is privately owned, 5.9% is privately owned by corporations, 14.6% is owned by the United States federal government, 0.4% is tribal lands, 0.2% is county land, and less than 1% is other public lands (NRCS). With so much public land, hundreds of lakes, many miles of streams, and acres of forest land, this area calls to many outdoor enthusiasts making outdoor recreation a popular economic driver.
Big Fork River Watershed Monitoring and Assessment Report • December 2013 Minnesota Pollution Control Agency
15
Figure 8. Land use in the Big Fork River Watershed
Big Fork River Watershed Monitoring and Assessment Report • December 2013 Minnesota Pollution Control Agency
16
Surface water hydrology Once the bottom of a portion of glacial Lake Agassiz, the land is now filled with forests, wetlands, lakes, and streams. Though many thousands of years have passed since the glaciers have melted away, this area’s glacial history still impacts the hydrology of today’s landscape. This area is flat and water rich, and due to these attributes the average stream gradient is 1.5 feet per mile. The gradient is so low that when the Rainy River is high enough the Big Fork River has been known to flow backwards for several miles. Lakes, bogs, and marshes which are all plentiful in this region are natural assets that tend to dampen hydrologic extremes, and slow water flow. However, the water emanating from wetlands is often low in DO leaving streams with naturally low DO.
The headwaters of the Big Fork River Watershed are northwest of Alvwood in the Popple River. The Popple River runs southeast into Round Lake and continues north through Natures Lake. It then runs 7 miles to the northeast where it enters Dora Lake. Both Moose Brook which flows southeast from Mizpah, and the Bowstring River which starts close to the city of Bowstring and hooks northwest through the Bowstring chain of lakes eventually flow into Dora Lake along with the Popple. The Big Fork River then flows out of the northern end of Dora Lake before going easterly until it reaches the city of Big Fork, where the Rice River and the Big Fork River converge before turning to the northeast. About 10 miles northeast of Big Fork and 6.5 miles east of Effie, the Deer River merges with the Big Fork River, and shortly after the Big Fork River then twists to the northwest. Caldwell Creek enters the Big Fork River 17 miles after Deer River, about 10 miles southeast of Margie. The Big Fork River makes another turn to the northeast before it hooks back to the west and runs through the city of Big Falls. The Big Fork River continues west 4 miles where it meets the Sturgeon River, flowing from the west. As the winding Big Fork River travels north it picks up flow from Bear Creek, and continues only 5 more miles until it reaches its final destination at the Rainy River, approximately 15 miles southwest of International Falls.
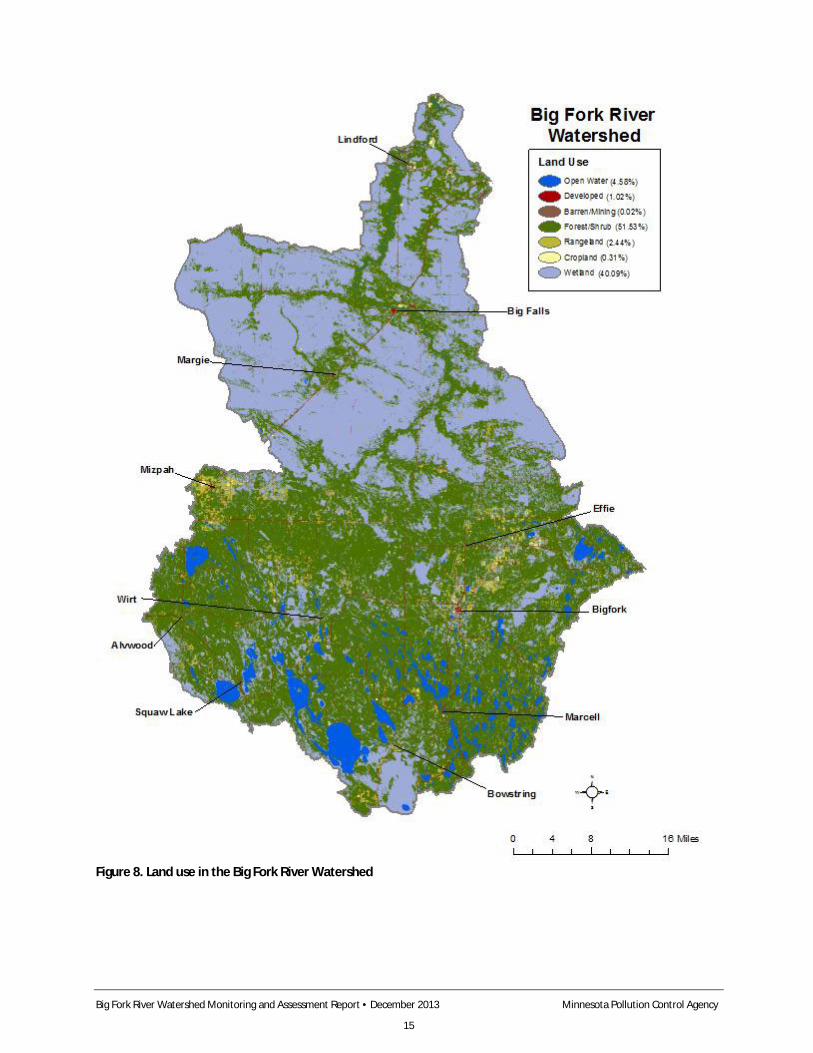
Climate and precipitation Precipitation is the source of almost all water inputs to a watershed. Figure 9 shows two representations of precipitation for water year 2012 (October – September). On the left is total precipitation, which shows that the watershed received between 20 and 28 inches. The display on the right shows the amount that the precipitation levels in water year 2012 departed from normal. Within the Big Fork River Watershed precipitation was approximately two inches below normal. Most of Minnesota shows the effect of persistent drought for this period.
Big Fork River Watershed Monitoring and Assessment Report • December 2013 Minnesota Pollution Control Agency
17
Figure 9. Statewide precipitation levels during the 2012 water year
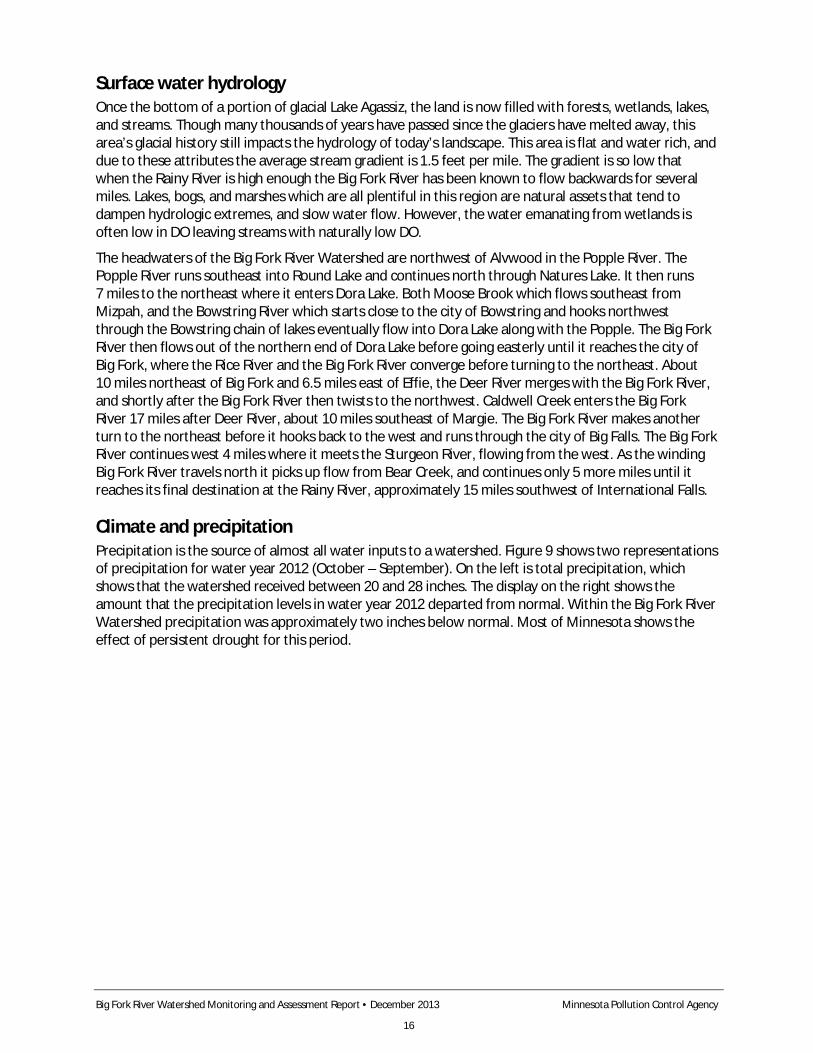
Figure 10 displays the areal average representation of precipitation in north central Minnesota. An areal average is a spatial average of all the precipitation data collected within a certain area presented as a single dataset. This data is taken from the Western Regional Climate Center: http://www.wrcc.dri.edu/spi/divplot1map.html.
Figure 10. Precipitation trends in north-central Minnesota 1990 – 2011, with five year running average
Average yearly precipitation in the north central region displays no statistically significant trend over the last 20 years. Though rainfall can vary in intensity and time of year, it would appear that north central Minnesota precipitation has not changed dramatically over this time period.
15
20
25
30
35
40
1990 1995 2000 2005 2010
Average precipitation
5 yr moving average
Prec
ipita
tion
(in)
Big Fork River Watershed Monitoring and Assessment Report • December 2013 Minnesota Pollution Control Agency
18
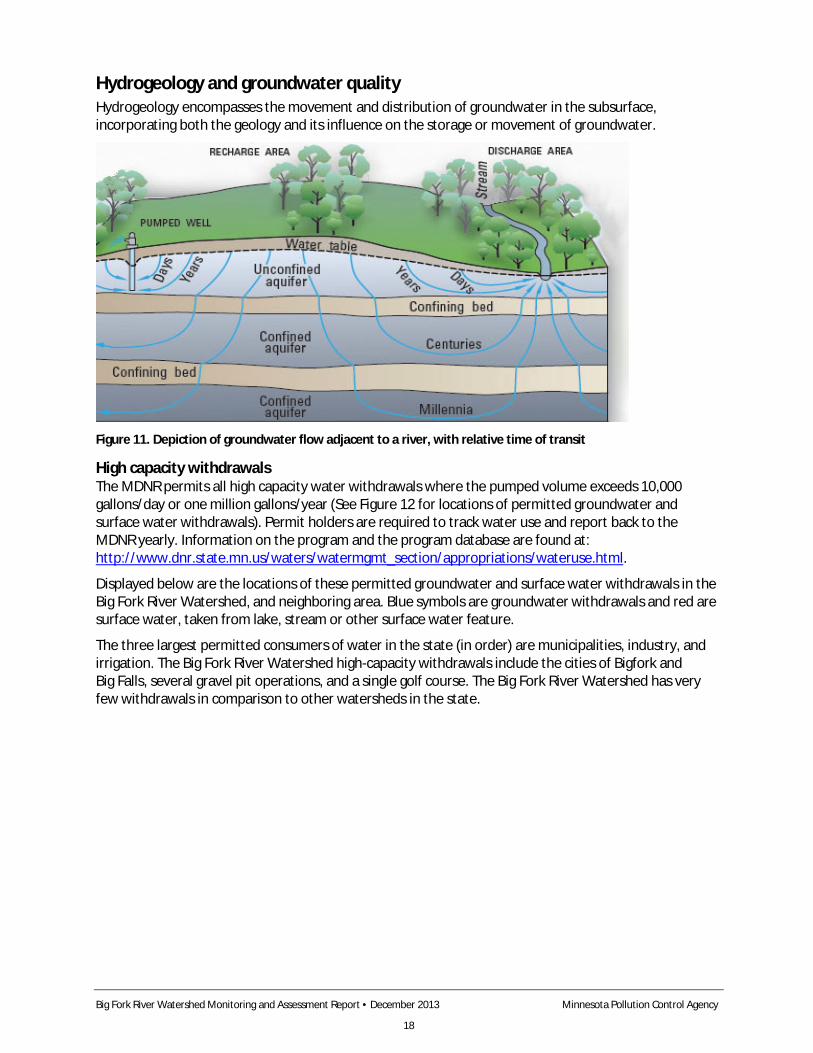
Hydrogeology and groundwater quality Hydrogeology encompasses the movement and distribution of groundwater in the subsurface, incorporating both the geology and its influence on the storage or movement of groundwater.
Figure 11. Depiction of groundwater flow adjacent to a river, with relative time of transit
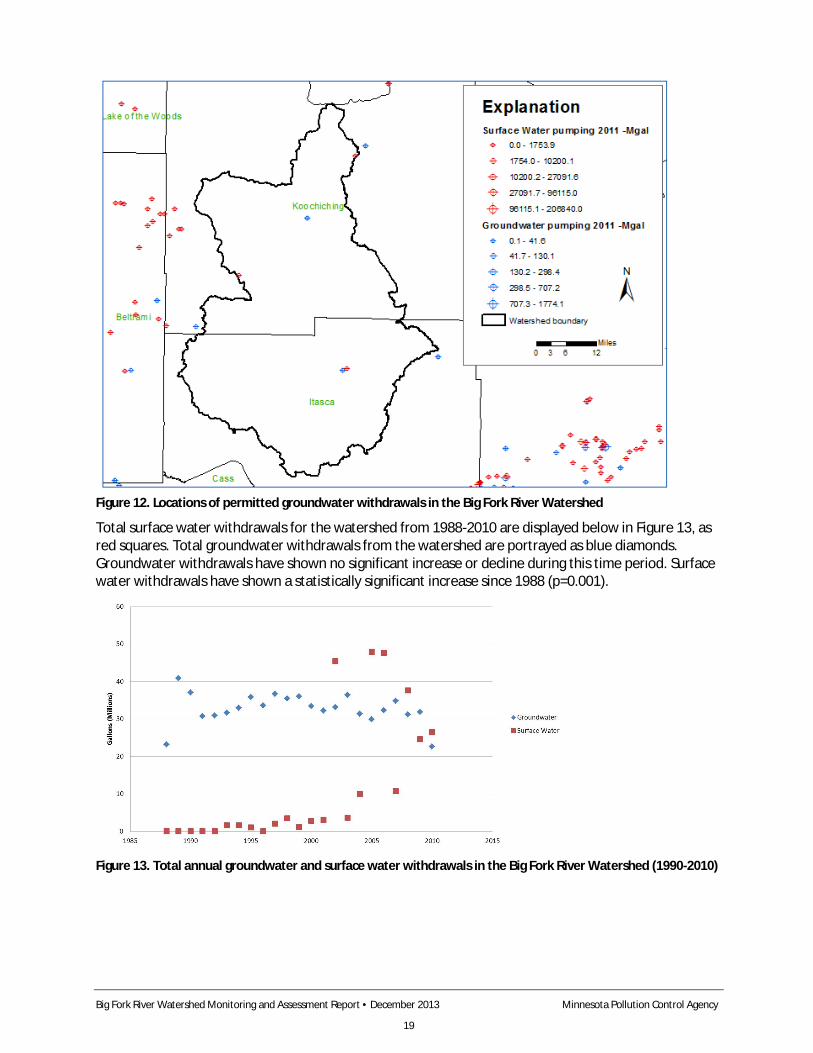
High capacity withdrawals The MDNR permits all high capacity water withdrawals where the pumped volume exceeds 10,000 gallons/day or one million gallons/year (See Figure 12 for locations of permitted groundwater and surface water withdrawals). Permit holders are required to track water use and report back to the MDNR yearly. Information on the program and the program database are found at: http://www.dnr.state.mn.us/waters/watermgmt_section/appropriations/wateruse.html.
Displayed below are the locations of these permitted groundwater and surface water withdrawals in the Big Fork River Watershed, and neighboring area. Blue symbols are groundwater withdrawals and red are surface water, taken from lake, stream or other surface water feature.
The three largest permitted consumers of water in the state (in order) are municipalities, industry, and irrigation. The Big Fork River Watershed high-capacity withdrawals include the cities of Bigfork and Big Falls, several gravel pit operations, and a single golf course. The Big Fork River Watershed has very few withdrawals in comparison to other watersheds in the state.
Big Fork River Watershed Monitoring and Assessment Report • December 2013 Minnesota Pollution Control Agency
19
Figure 12. Locations of permitted groundwater withdrawals in the Big Fork River Watershed
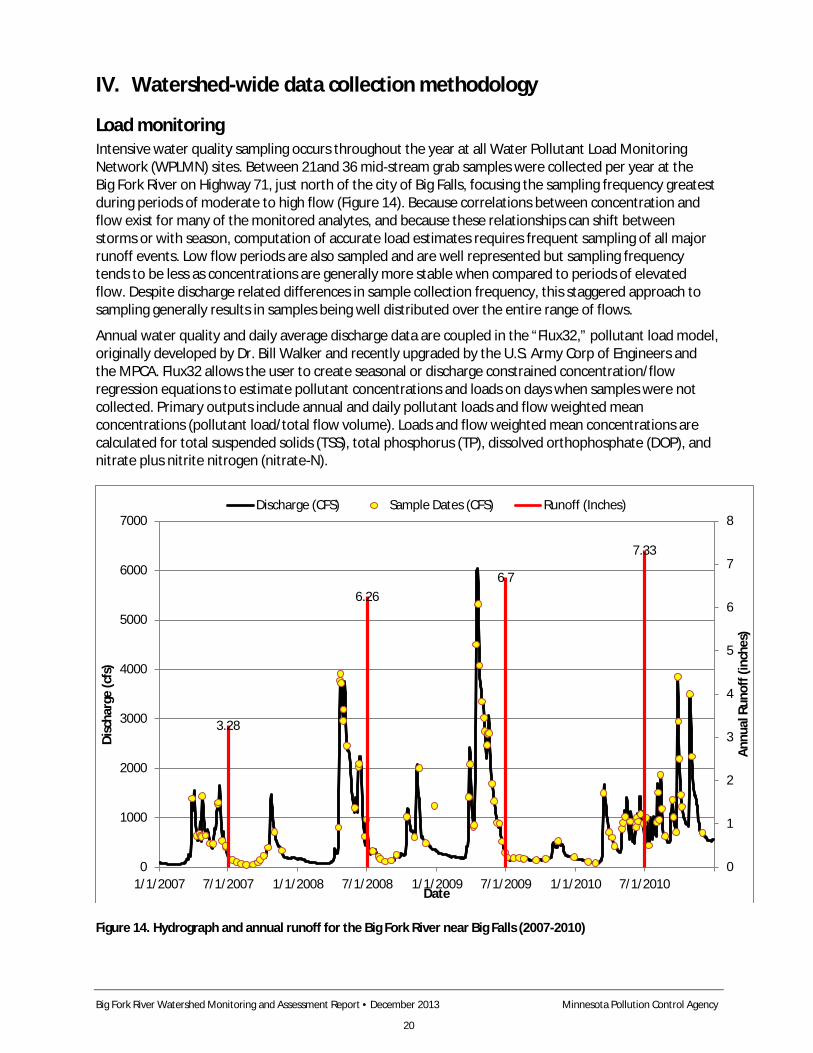
Total surface water withdrawals for the watershed from 1988-2010 are displayed below in Figure 13, as red squares. Total groundwater withdrawals from the watershed are portrayed as blue diamonds. Groundwater withdrawals have shown no significant increase or decline during this time period. Surface water withdrawals have shown a statistically significant increase since 1988 (p=0.001).
Figure 13. Total annual groundwater and surface water withdrawals in the Big Fork River Watershed (1990-2010)
Big Fork River Watershed Monitoring and Assessment Report • December 2013 Minnesota Pollution Control Agency
20
IV. Watershed-wide data collection methodology
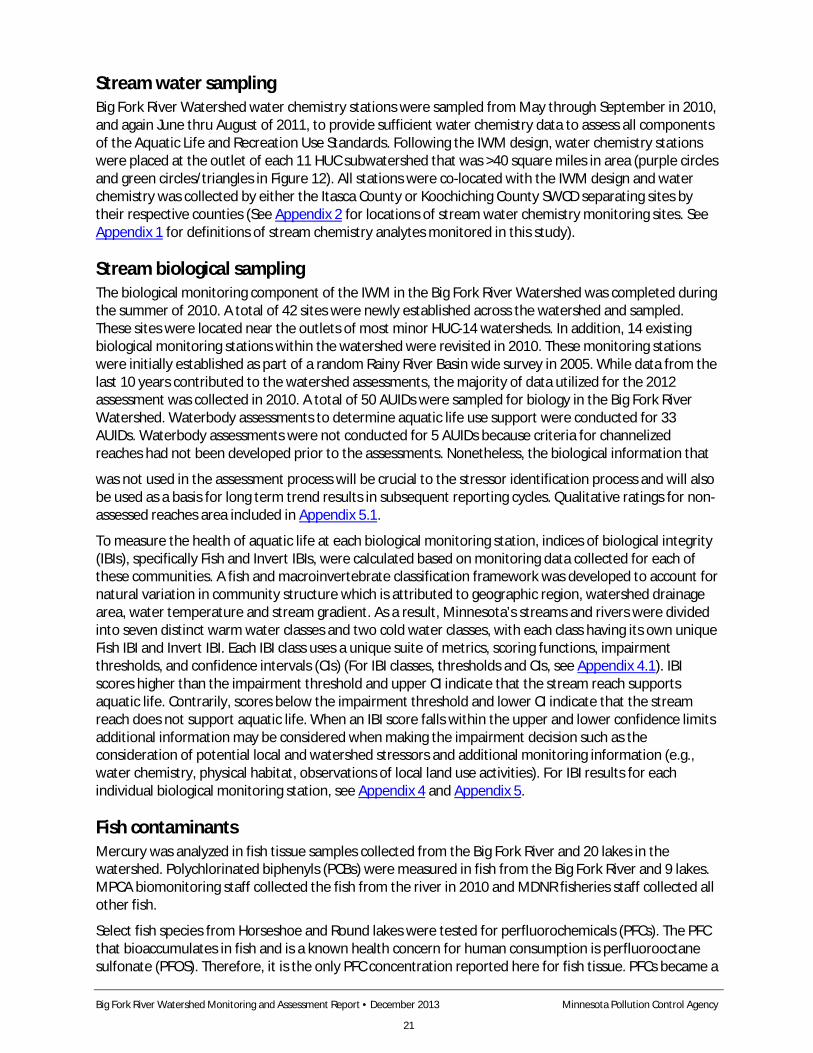
Load monitoring Intensive water quality sampling occurs throughout the year at all Water Pollutant Load Monitoring Network (WPLMN) sites. Between 21and 36 mid-stream grab samples were collected per year at the Big Fork River on Highway 71, just north of the city of Big Falls, focusing the sampling frequency greatest during periods of moderate to high flow (Figure 14). Because correlations between concentration and flow exist for many of the monitored analytes, and because these relationships can shift between storms or with season, computation of accurate load estimates requires frequent sampling of all major runoff events. Low flow periods are also sampled and are well represented but sampling frequency tends to be less as concentrations are generally more stable when compared to periods of elevated flow. Despite discharge related differences in sample collection frequency, this staggered approach to sampling generally results in samples being well distributed over the entire range of flows.
Annual water quality and daily average discharge data are coupled in the “Flux32,” pollutant load model, originally developed by Dr. Bill Walker and recently upgraded by the U.S. Army Corp of Engineers and the MPCA. Flux32 allows the user to create seasonal or discharge constrained concentration/flow regression equations to estimate pollutant concentrations and loads on days when samples were not collected. Primary outputs include annual and daily pollutant loads and flow weighted mean concentrations (pollutant load/total flow volume). Loads and flow weighted mean concentrations are calculated for total suspended solids (TSS), total phosphorus (TP), dissolved orthophosphate (DOP), and nitrate plus nitrite nitrogen (nitrate-N).
Figure 14. Hydrograph and annual runoff for the Big Fork River near Big Falls (2007-2010)
3.28
6.26 6.7
7.33
0
1
2
3
4
5
6
7
8
0
1000
2000
3000
4000
5000
6000
7000
1/1/2007 7/1/2007 1/1/2008 7/1/2008 1/1/2009 7/1/2009 1/1/2010 7/1/2010
Annu
al R
unof
f (in
ches
)
Disc
harg
e (c
fs)
Date
Discharge (CFS) Sample Dates (CFS) Runoff (Inches)
Big Fork River Watershed Monitoring and Assessment Report • December 2013 Minnesota Pollution Control Agency
21
Stream water sampling Big Fork River Watershed water chemistry stations were sampled from May through September in 2010, and again June thru August of 2011, to provide sufficient water chemistry data to assess all components of the Aquatic Life and Recreation Use Standards. Following the IWM design, water chemistry stations were placed at the outlet of each 11 HUC subwatershed that was >40 square miles in area (purple circles and green circles/triangles in Figure 12). All stations were co-located with the IWM design and water chemistry was collected by either the Itasca County or Koochiching County SWCD separating sites by their respective counties (See Appendix 2 for locations of stream water chemistry monitoring sites. See Appendix 1 for definitions of stream chemistry analytes monitored in this study).
Stream biological sampling The biological monitoring component of the IWM in the Big Fork River Watershed was completed during the summer of 2010. A total of 42 sites were newly established across the watershed and sampled. These sites were located near the outlets of most minor HUC-14 watersheds. In addition, 14 existing biological monitoring stations within the watershed were revisited in 2010. These monitoring stations were initially established as part of a random Rainy River Basin wide survey in 2005. While data from the last 10 years contributed to the watershed assessments, the majority of data utilized for the 2012 assessment was collected in 2010. A total of 50 AUIDs were sampled for biology in the Big Fork River Watershed. Waterbody assessments to determine aquatic life use support were conducted for 33 AUIDs. Waterbody assessments were not conducted for 5 AUIDs because criteria for channelized reaches had not been developed prior to the assessments. Nonetheless, the biological information that
was not used in the assessment process will be crucial to the stressor identification process and will also be used as a basis for long term trend results in subsequent reporting cycles. Qualitative ratings for non-assessed reaches area included in Appendix 5.1.
To measure the health of aquatic life at each biological monitoring station, indices of biological integrity (IBIs), specifically Fish and Invert IBIs, were calculated based on monitoring data collected for each of these communities. A fish and macroinvertebrate classification framework was developed to account for natural variation in community structure which is attributed to geographic region, watershed drainage area, water temperature and stream gradient. As a result, Minnesota’s streams and rivers were divided into seven distinct warm water classes and two cold water classes, with each class having its own unique Fish IBI and Invert IBI. Each IBI class uses a unique suite of metrics, scoring functions, impairment thresholds, and confidence intervals (CIs) (For IBI classes, thresholds and CIs, see Appendix 4.1). IBI scores higher than the impairment threshold and upper CI indicate that the stream reach supports aquatic life. Contrarily, scores below the impairment threshold and lower CI indicate that the stream reach does not support aquatic life. When an IBI score falls within the upper and lower confidence limits additional information may be considered when making the impairment decision such as the consideration of potential local and watershed stressors and additional monitoring information (e.g., water chemistry, physical habitat, observations of local land use activities). For IBI results for each individual biological monitoring station, see Appendix 4 and Appendix 5.
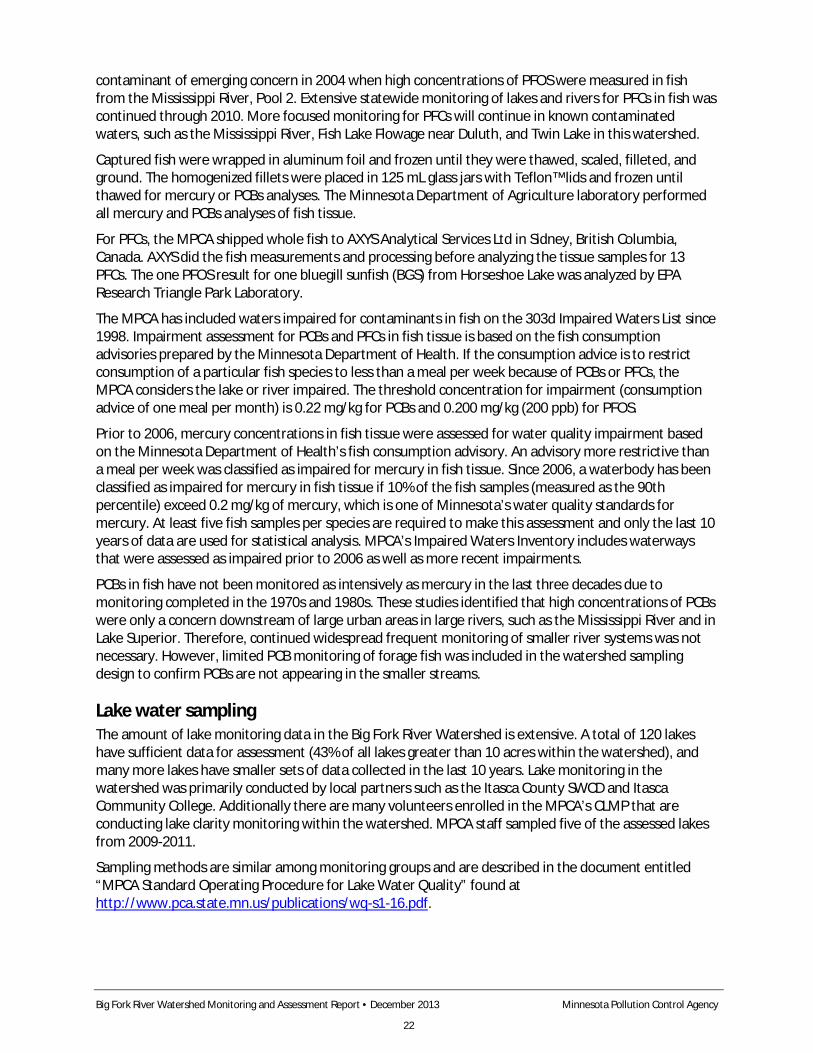
Fish contaminants Mercury was analyzed in fish tissue samples collected from the Big Fork River and 20 lakes in the watershed. Polychlorinated biphenyls (PCBs) were measured in fish from the Big Fork River and 9 lakes. MPCA biomonitoring staff collected the fish from the river in 2010 and MDNR fisheries staff collected all other fish.
Select fish species from Horseshoe and Round lakes were tested for perfluorochemicals (PFCs). The PFC that bioaccumulates in fish and is a known health concern for human consumption is perfluorooctane sulfonate (PFOS). Therefore, it is the only PFC concentration reported here for fish tissue. PFCs became a
Big Fork River Watershed Monitoring and Assessment Report • December 2013 Minnesota Pollution Control Agency
22
contaminant of emerging concern in 2004 when high concentrations of PFOS were measured in fish from the Mississippi River, Pool 2. Extensive statewide monitoring of lakes and rivers for PFCs in fish was continued through 2010. More focused monitoring for PFCs will continue in known contaminated waters, such as the Mississippi River, Fish Lake Flowage near Duluth, and Twin Lake in this watershed.
Captured fish were wrapped in aluminum foil and frozen until they were thawed, scaled, filleted, and ground. The homogenized fillets were placed in 125 mL glass jars with Teflon™ lids and frozen until thawed for mercury or PCBs analyses. The Minnesota Department of Agriculture laboratory performed all mercury and PCBs analyses of fish tissue.
For PFCs, the MPCA shipped whole fish to AXYS Analytical Services Ltd in Sidney, British Columbia, Canada. AXYS did the fish measurements and processing before analyzing the tissue samples for 13 PFCs. The one PFOS result for one bluegill sunfish (BGS) from Horseshoe Lake was analyzed by EPA Research Triangle Park Laboratory.
The MPCA has included waters impaired for contaminants in fish on the 303d Impaired Waters List since 1998. Impairment assessment for PCBs and PFCs in fish tissue is based on the fish consumption advisories prepared by the Minnesota Department of Health. If the consumption advice is to restrict consumption of a particular fish species to less than a meal per week because of PCBs or PFCs, the MPCA considers the lake or river impaired. The threshold concentration for impairment (consumption advice of one meal per month) is 0.22 mg/kg for PCBs and 0.200 mg/kg (200 ppb) for PFOS.
Prior to 2006, mercury concentrations in fish tissue were assessed for water quality impairment based on the Minnesota Department of Health’s fish consumption advisory. An advisory more restrictive than a meal per week was classified as impaired for mercury in fish tissue. Since 2006, a waterbody has been classified as impaired for mercury in fish tissue if 10% of the fish samples (measured as the 90th percentile) exceed 0.2 mg/kg of mercury, which is one of Minnesota’s water quality standards for mercury. At least five fish samples per species are required to make this assessment and only the last 10 years of data are used for statistical analysis. MPCA’s Impaired Waters Inventory includes waterways that were assessed as impaired prior to 2006 as well as more recent impairments.
PCBs in fish have not been monitored as intensively as mercury in the last three decades due to monitoring completed in the 1970s and 1980s. These studies identified that high concentrations of PCBs were only a concern downstream of large urban areas in large rivers, such as the Mississippi River and in Lake Superior. Therefore, continued widespread frequent monitoring of smaller river systems was not necessary. However, limited PCB monitoring of forage fish was included in the watershed sampling design to confirm PCBs are not appearing in the smaller streams.
Lake water sampling The amount of lake monitoring data in the Big Fork River Watershed is extensive. A total of 120 lakes have sufficient data for assessment (43% of all lakes greater than 10 acres within the watershed), and many more lakes have smaller sets of data collected in the last 10 years. Lake monitoring in the watershed was primarily conducted by local partners such as the Itasca County SWCD and Itasca Community College. Additionally there are many volunteers enrolled in the MPCA’s CLMP that are conducting lake clarity monitoring within the watershed. MPCA staff sampled five of the assessed lakes from 2009-2011.
Sampling methods are similar among monitoring groups and are described in the document entitled “MPCA Standard Operating Procedure for Lake Water Quality” found at http://www.pca.state.mn.us/publications/wq-s1-16.pdf.
Big Fork River Watershed Monitoring and Assessment Report • December 2013 Minnesota Pollution Control Agency
23
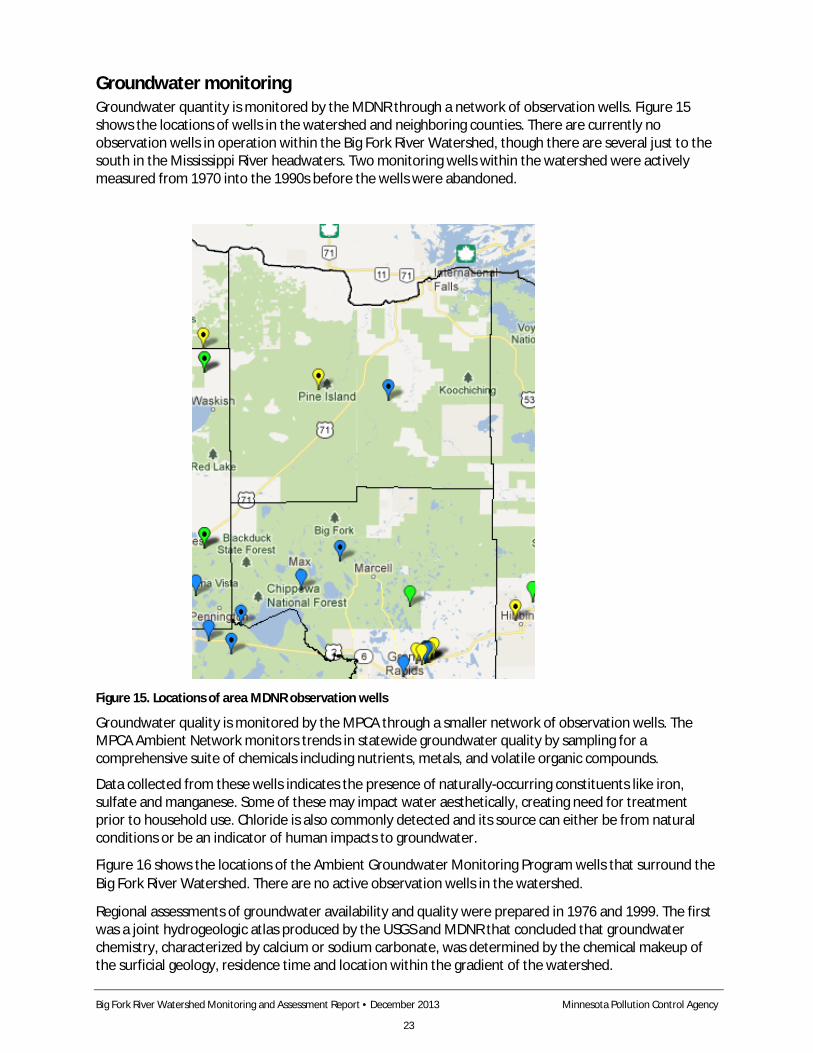
Groundwater monitoring Groundwater quantity is monitored by the MDNR through a network of observation wells. Figure 15 shows the locations of wells in the watershed and neighboring counties. There are currently no observation wells in operation within the Big Fork River Watershed, though there are several just to the south in the Mississippi River headwaters. Two monitoring wells within the watershed were actively measured from 1970 into the 1990s before the wells were abandoned.
Figure 15. Locations of area MDNR observation wells
Groundwater quality is monitored by the MPCA through a smaller network of observation wells. The MPCA Ambient Network monitors trends in statewide groundwater quality by sampling for a comprehensive suite of chemicals including nutrients, metals, and volatile organic compounds.
Data collected from these wells indicates the presence of naturally-occurring constituents like iron, sulfate and manganese. Some of these may impact water aesthetically, creating need for treatment prior to household use. Chloride is also commonly detected and its source can either be from natural conditions or be an indicator of human impacts to groundwater.
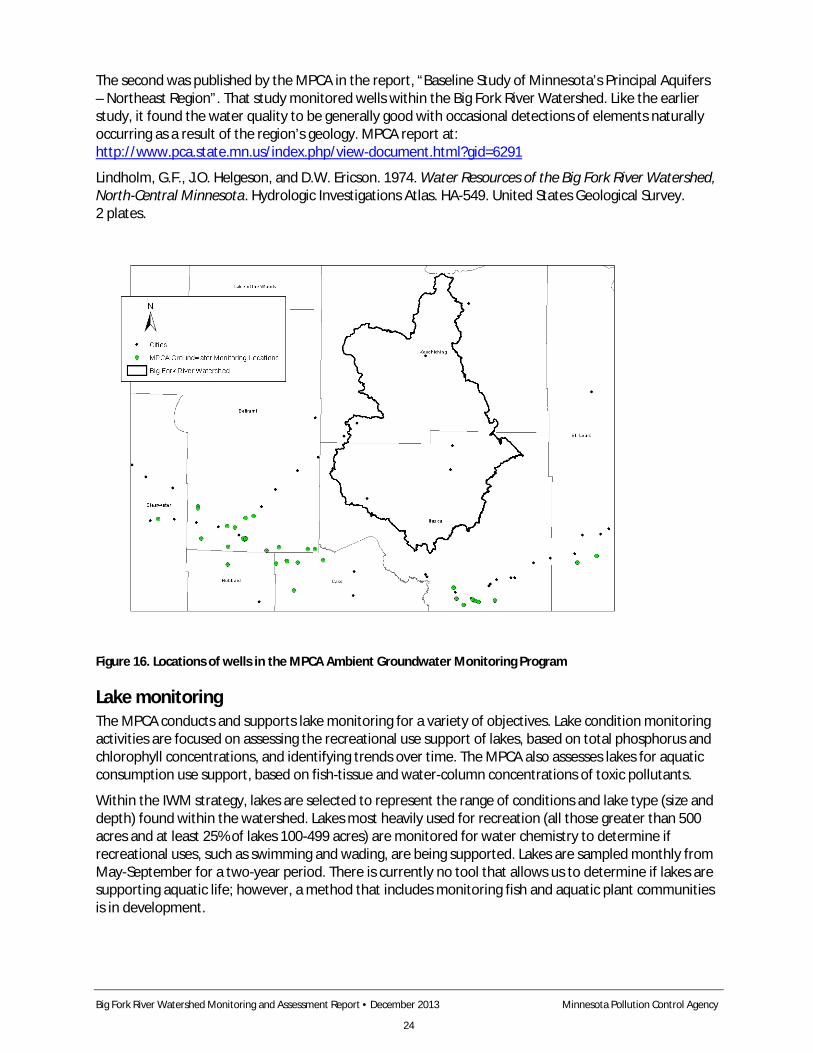
Figure 16 shows the locations of the Ambient Groundwater Monitoring Program wells that surround the Big Fork River Watershed. There are no active observation wells in the watershed.
Regional assessments of groundwater availability and quality were prepared in 1976 and 1999. The first was a joint hydrogeologic atlas produced by the USGS and MDNR that concluded that groundwater chemistry, characterized by calcium or sodium carbonate, was determined by the chemical makeup of the surficial geology, residence time and location within the gradient of the watershed.
Big Fork River Watershed Monitoring and Assessment Report • December 2013 Minnesota Pollution Control Agency
24
The second was published by the MPCA in the report, “Baseline Study of Minnesota’s Principal Aquifers – Northeast Region”. That study monitored wells within the Big Fork River Watershed. Like the earlier study, it found the water quality to be generally good with occasional detections of elements naturally occurring as a result of the region’s geology. MPCA report at: http://www.pca.state.mn.us/index.php/view-document.html?gid=6291
Lindholm, G.F., J.O. Helgeson, and D.W. Ericson. 1974. Water Resources of the Big Fork River Watershed, North-Central Minnesota. Hydrologic Investigations Atlas. HA-549. United States Geological Survey. 2 plates.
Figure 16. Locations of wells in the MPCA Ambient Groundwater Monitoring Program
Lake monitoring The MPCA conducts and supports lake monitoring for a variety of objectives. Lake condition monitoring activities are focused on assessing the recreational use support of lakes, based on total phosphorus and chlorophyll concentrations, and identifying trends over time. The MPCA also assesses lakes for aquatic consumption use support, based on fish-tissue and water-column concentrations of toxic pollutants.
Within the IWM strategy, lakes are selected to represent the range of conditions and lake type (size and depth) found within the watershed. Lakes most heavily used for recreation (all those greater than 500 acres and at least 25% of lakes 100-499 acres) are monitored for water chemistry to determine if recreational uses, such as swimming and wading, are being supported. Lakes are sampled monthly from May-September for a two-year period. There is currently no tool that allows us to determine if lakes are supporting aquatic life; however, a method that includes monitoring fish and aquatic plant communities is in development.
Big Fork River Watershed Monitoring and Assessment Report • December 2013 Minnesota Pollution Control Agency
25
V. Individual watershed results
HUC-11 watersheds Assessment results for aquatic life and recreation use are presented for each HUC-11 watershed within the Big Fork River Watershed. The primary objective is to portray all the full support and impairment listings within an 11-HUC watershed resulting from the complex and multi-step assessment and listing process. (A summary table of assessment results for the entire 8-HUC watershed including aquatic consumption, and drinking water assessments (where applicable) is included in Appendix 3.) This scale provides a robust assessment of water quality condition at a practical size for the development, management, and implementation of effective TMDLs and protection strategies. The graphics presented for each of the HUC-11 watersheds contain the assessment results from the 2012 Assessment Cycle as well as any impairment listings from previous assessment cycles. Discussion of assessment results focuses primarily on the 2010 IWM effort, but also considers available data from the last 10 years.
The following pages provide an account of each HUC-11 watershed. Each account includes a brief description of the subwatershed and summary tables of the results for each of the following: a) stream aquatic life and aquatic recreation assessments, b) biological condition of channelized streams and ditches, c) stream habitat quality d) channel stability, e) water chemistry for the HUC-11 outlet, and f) lake aquatic recreation assessments. Following the tables is a narrative summary of the assessment results and pertinent water quality projects completed or planned for the subwatershed. A brief description of each of the summary tables is provided below.
Stream assessments A table is provided in each section summarizing aquatic life and aquatic recreation assessments of all assessable stream reaches within the watershed (i.e., where sufficient information was available to make an assessment). Primarily, these tables reflect the results of the 2012 assessment process 2014 EPA reporting cycle; however, impairments from previous assessment cycles are also included and are distinguished from new impairments via cell shading (see footnote section of each table). These tables also denote the results of comparing each individual aquatic life and aquatic recreation indicator to their respective criteria (i.e., standards); these determinations were made during the desktop phase of the assessment process (see Figure 5). Assessment of aquatic life is derived from the analysis of biological (fish and macroinvertebrate IBIs), DO, turbidity, chloride, pH and un-ionized ammonia (NH3) data, while the assessment of aquatic recreation in streams is based solely on bacteria (Escherichia coli or fecal coliform) data. Included in each table is the specific aquatic life use classification for each stream reach: cold water community (2A); cool or warm water community (2B); or indigenous aquatic community (2C). Stream reaches that do not have sufficient information for either an aquatic life or aquatic recreation assessment (from current or previous assessment cycles) are not included in these tables, but are included in Appendix 5.2 and Appendix 5.3. Where applicable and sufficient data exists, assessments of other designated uses (e.g., class 7, drinking water, aquatic consumption) are discussed in the summary section of each HUC-11 as well as in the Watershed-Wide Results and Discussion section.
Channelized stream evaluations Biological criteria have not been developed yet for channelized streams and ditches, therefore, assessment of fish and macroinvertebrate community data for aquatic life use support was not possible at some monitoring stations. A separate table provides a narrative rating of the condition of fish and macroinvertebrate communities at such stations based on IBI results. Evaluation criteria are based on aquatic life use assessment thresholds for each individual IBI class (see Appendix 5.1). IBI scores above this threshold are given a “good” rating, scores falling below this threshold by less than ~15 points (i.e.,
Big Fork River Watershed Monitoring and Assessment Report • December 2013 Minnesota Pollution Control Agency
26
value varies slightly by IBI class) are given a “fair” rating, and scores falling below the threshold by more than ~15 points are given a “poor” rating. For more information regarding channelized stream evaluation criteria refer to Appendix 5.1.
Stream habitat results Habitat information documented during each fish sampling visit is provided in each HUC-11 section. These tables convey the results of the Minnesota Stream Habitat Assessment (MSHA) survey, which evaluates the section of stream sampled for biology and can provide an indication of potential stressors (e.g., siltation, eutrophication) impacting fish and macroinvertebrate communities. The MSHA score is comprised of five scoring categories including adjacent land use, riparian zone, substrate, fish cover and channel morphology, which are summed for a total possible score of 100 points. Scores for each
category, a summation of the total MSHA score, and a narrative habitat condition rating are provided in the tables for each biological monitoring station. Where multiple visits occur at the same station, the scores from each visit have been averaged. The final row in each table displays average MSHA scores and a rating for the HUC-11 watershed.
Stream stability results Stream channel stability information evaluated during each invert sampling visit is provided in each HUC-11 section. These tables display the results of the Channel Condition and Stability Index (CCSI) which rates the geomorphic stability of the stream reach sampled for biology. The CCSI rates three regions of the stream channel (upper banks, lower banks, and bottom) which may provide an indication of stream channel geomorphic changes and loss of habitat quality which may be related to changes in watershed hydrology, stream gradient, sediment supply, or sediment transport capacity. The CCSI was recently implemented in 2008, and is collected once at each biological station. Consequently, the CCSI ratings are only available for biological visits sampled in 2010 or later. The final row in each table displays the average CCSI scores and a rating for the HUC-11 watershed.
Watershed outlet water chemistry results These summary tables display the water chemistry results for the monitoring station representing the outlet of the HUC-11 watershed. Data were collected in 2010 and 2011 by local government partners in the Itasca and Koochiching County SWCDs. These data along with other data collected within the last 10 years can provide valuable insight on water quality characteristics and potential parameters of concern within the watershed. Parameters included in these tables are those most closely related to the standards, proposed standards, or expectations used for assessing aquatic life and recreation. While not all of the water chemistry parameters of interest have established water quality standards, McCollor and Heiskary (1993) developed ecoregion expectations for a number of parameters that provide a basis for evaluating stream water quality data and estimating attainable conditions for an ecoregion. For comparative purposes, water chemistry results for the Big Fork River Watershed are compared to these expectations that were based on the 75th percentile of a long-term dataset of least impacted streams within the NLF and NWM ecoregions - dependent on the dominate landscape within each HUC11 watershed.
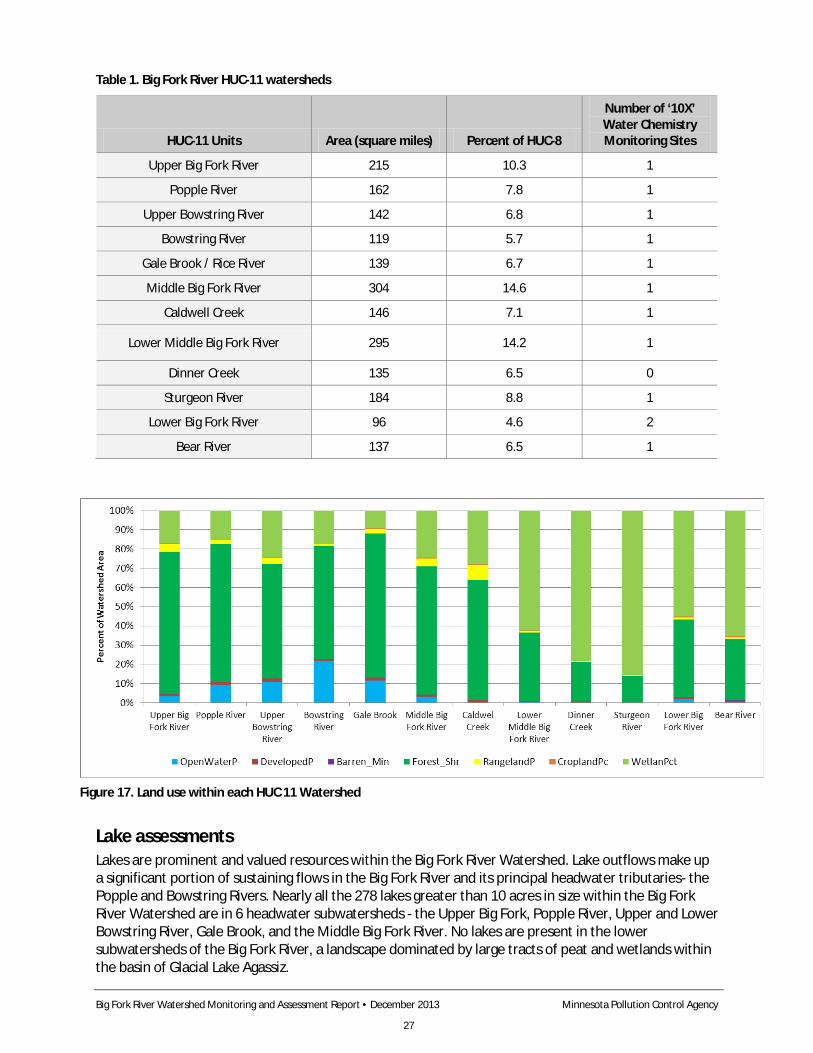
Big Fork River Watershed Monitoring and Assessment Report • December 2013 Minnesota Pollution Control Agency
27
Table 1. Big Fork River HUC-11 watersheds
HUC-11 Units Area (square miles) Percent of HUC-8
Number of ‘10X’ Water Chemistry Monitoring Sites
Upper Big Fork River 215 10.3 1
Popple River 162 7.8 1
Upper Bowstring River 142 6.8 1
Bowstring River 119 5.7 1
Gale Brook / Rice River 139 6.7 1
Middle Big Fork River 304 14.6 1
Caldwell Creek 146 7.1 1
Lower Middle Big Fork River 295 14.2 1
Dinner Creek 135 6.5 0
Sturgeon River 184 8.8 1
Lower Big Fork River 96 4.6 2
Bear River 137 6.5 1
Lake assessments Lakes are prominent and valued resources within the Big Fork River Watershed. Lake outflows make up a significant portion of sustaining flows in the Big Fork River and its principal headwater tributaries- the Popple and Bowstring Rivers. Nearly all the 278 lakes greater than 10 acres in size within the Big Fork River Watershed are in 6 headwater subwatersheds - the Upper Big Fork, Popple River, Upper and Lower Bowstring River, Gale Brook, and the Middle Big Fork River. No lakes are present in the lower subwatersheds of the Big Fork River, a landscape dominated by large tracts of peat and wetlands within the basin of Glacial Lake Agassiz.
Figure 17. Land use within each HUC 11 Watershed
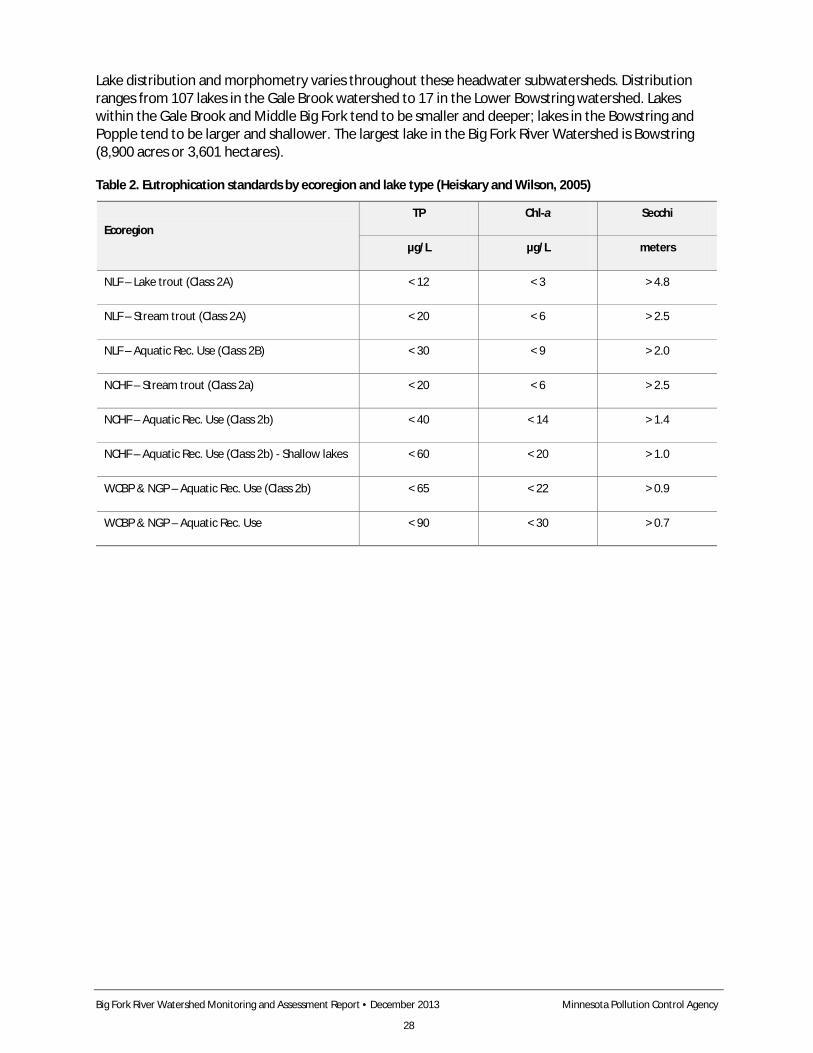
Big Fork River Watershed Monitoring and Assessment Report • December 2013 Minnesota Pollution Control Agency
28
Lake distribution and morphometry varies throughout these headwater subwatersheds. Distribution ranges from 107 lakes in the Gale Brook watershed to 17 in the Lower Bowstring watershed. Lakes within the Gale Brook and Middle Big Fork tend to be smaller and deeper; lakes in the Bowstring and Popple tend to be larger and shallower. The largest lake in the Big Fork River Watershed is Bowstring (8,900 acres or 3,601 hectares).
Table 2. Eutrophication standards by ecoregion and lake type (Heiskary and Wilson, 2005)
Ecoregion TP Chl-a Secchi
µg/L µg/L meters
NLF – Lake trout (Class 2A) < 12 < 3 > 4.8
NLF – Stream trout (Class 2A) < 20 < 6 > 2.5
NLF – Aquatic Rec. Use (Class 2B) < 30 < 9 > 2.0
NCHF – Stream trout (Class 2a) < 20 < 6 > 2.5
NCHF – Aquatic Rec. Use (Class 2b) < 40 < 14 > 1.4
NCHF – Aquatic Rec. Use (Class 2b) - Shallow lakes < 60 < 20 > 1.0
WCBP & NGP – Aquatic Rec. Use (Class 2b) < 65 < 22 > 0.9
WCBP & NGP – Aquatic Rec. Use < 90 < 30 > 0.7
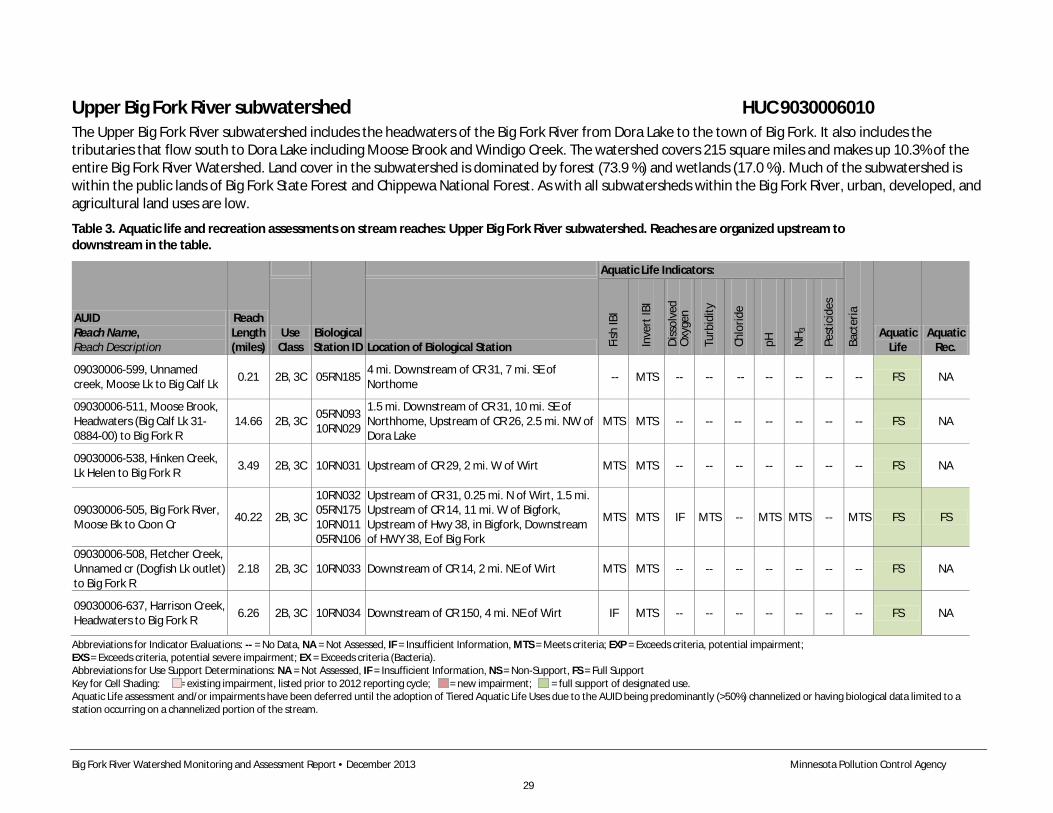
Big Fork River Watershed Monitoring and Assessment Report • December 2013 Minnesota Pollution Control Agency
29
Upper Big Fork River subwatershed HUC 9030006010 The Upper Big Fork River subwatershed includes the headwaters of the Big Fork River from Dora Lake to the town of Big Fork. It also includes the tributaries that flow south to Dora Lake including Moose Brook and Windigo Creek. The watershed covers 215 square miles and makes up 10.3% of the entire Big Fork River Watershed. Land cover in the subwatershed is dominated by forest (73.9 %) and wetlands (17.0 %). Much of the subwatershed is within the public lands of Big Fork State Forest and Chippewa National Forest. As with all subwatersheds within the Big Fork River, urban, developed, and agricultural land uses are low.
Table 3. Aquatic life and recreation assessments on stream reaches: Upper Big Fork River subwatershed. Reaches are organized upstream to downstream in the table.
AUID Reach Name, Reach Description
Reach Length (miles)
Biological Station ID
Aquatic Life Indicators:
Bact
eria
Aquatic Life
Aquatic Rec.
Use Class Location of Biological Station Fi
sh IB
I
Inve
rt IB
I
Diss
olve
d O
xyge
n
Turb
idity
Chlo
ride
pH
NH 3
Pest
icid
es
09030006-599, Unnamed creek, Moose Lk to Big Calf Lk 0.21 2B, 3C 05RN185 4 mi. Downstream of CR 31, 7 mi. SE of
Northome -- MTS -- -- -- -- -- -- -- FS NA
09030006-511, Moose Brook, Headwaters (Big Calf Lk 31-0884-00) to Big Fork R
14.66 2B, 3C 05RN093 10RN029
1.5 mi. Downstream of CR 31, 10 mi. SE of Northhome, Upstream of CR 26, 2.5 mi. NW of Dora Lake
MTS MTS -- -- -- -- -- -- -- FS NA
09030006-538, Hinken Creek, Lk Helen to Big Fork R 3.49 2B, 3C 10RN031 Upstream of CR 29, 2 mi. W of Wirt MTS MTS -- -- -- -- -- -- -- FS NA
09030006-505, Big Fork River, Moose Bk to Coon Cr 40.22 2B, 3C
10RN032 05RN175 10RN011 05RN106
Upstream of CR 31, 0.25 mi. N of Wirt, 1.5 mi. Upstream of CR 14, 11 mi. W of Bigfork, Upstream of Hwy 38, in Bigfork, Downstream of HWY 38, E of Big Fork
MTS MTS IF MTS -- MTS MTS -- MTS FS FS
09030006-508, Fletcher Creek, Unnamed cr (Dogfish Lk outlet) to Big Fork R
2.18 2B, 3C 10RN033 Downstream of CR 14, 2 mi. NE of Wirt MTS MTS -- -- -- -- -- -- -- FS NA
09030006-637, Harrison Creek, Headwaters to Big Fork R 6.26 2B, 3C 10RN034 Downstream of CR 150, 4 mi. NE of Wirt IF MTS -- -- -- -- -- -- -- FS NA
Abbreviations for Indicator Evaluations: -- = No Data, NA = Not Assessed, IF = Insufficient Information, MTS = Meets criteria; EXP = Exceeds criteria, potential impairment; EXS = Exceeds criteria, potential severe impairment; EX = Exceeds criteria (Bacteria). Abbreviations for Use Support Determinations: NA = Not Assessed, IF = Insufficient Information, NS = Non-Support, FS = Full Support Key for Cell Shading: = existing impairment, listed prior to 2012 reporting cycle; = new impairment; = full support of designated use. Aquatic Life assessment and/or impairments have been deferred until the adoption of Tiered Aquatic Life Uses due to the AUID being predominantly (>50%) channelized or having biological data limited to a station occurring on a channelized portion of the stream.
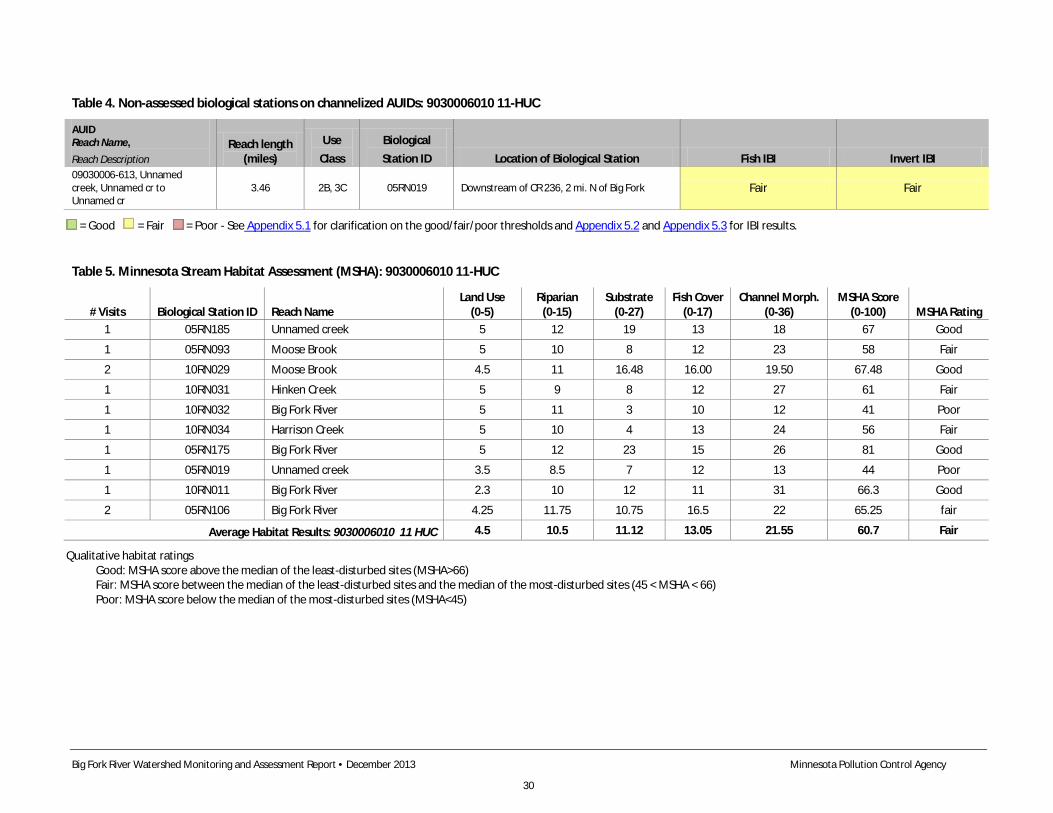
Big Fork River Watershed Monitoring and Assessment Report • December 2013 Minnesota Pollution Control Agency
30
Table 4. Non-assessed biological stations on channelized AUIDs: 9030006010 11-HUC
AUID Reach Name,
Reach Description Reach length
(miles) Use
Class Biological Station ID Location of Biological Station Fish IBI Invert IBI
09030006-613, Unnamed creek, Unnamed cr to Unnamed cr
3.46 2B, 3C 05RN019 Downstream of CR 236, 2 mi. N of Big Fork Fair Fair
= Good = Fair = Poor - See Appendix 5.1 for clarification on the good/fair/poor thresholds and Appendix 5.2 and Appendix 5.3 for IBI results.
Table 5. Minnesota Stream Habitat Assessment (MSHA): 9030006010 11-HUC
# Visits Biological Station ID Reach Name Land Use
(0-5) Riparian
(0-15) Substrate
(0-27) Fish Cover
(0-17) Channel Morph.
(0-36) MSHA Score
(0-100) MSHA Rating 1 05RN185 Unnamed creek 5 12 19 13 18 67 Good
1 05RN093 Moose Brook 5 10 8 12 23 58 Fair
2 10RN029 Moose Brook 4.5 11 16.48 16.00 19.50 67.48 Good
1 10RN031 Hinken Creek 5 9 8 12 27 61 Fair
1 10RN032 Big Fork River 5 11 3 10 12 41 Poor
1 10RN034 Harrison Creek 5 10 4 13 24 56 Fair
1 05RN175 Big Fork River 5 12 23 15 26 81 Good
1 05RN019 Unnamed creek 3.5 8.5 7 12 13 44 Poor
1 10RN011 Big Fork River 2.3 10 12 11 31 66.3 Good
2 05RN106 Big Fork River 4.25 11.75 10.75 16.5 22 65.25 fair
Average Habitat Results: 9030006010 11 HUC 4.5 10.5 11.12 13.05 21.55 60.7 Fair
Qualitative habitat ratings Good: MSHA score above the median of the least-disturbed sites (MSHA>66) Fair: MSHA score between the median of the least-disturbed sites and the median of the most-disturbed sites (45 < MSHA < 66) Poor: MSHA score below the median of the most-disturbed sites (MSHA<45)
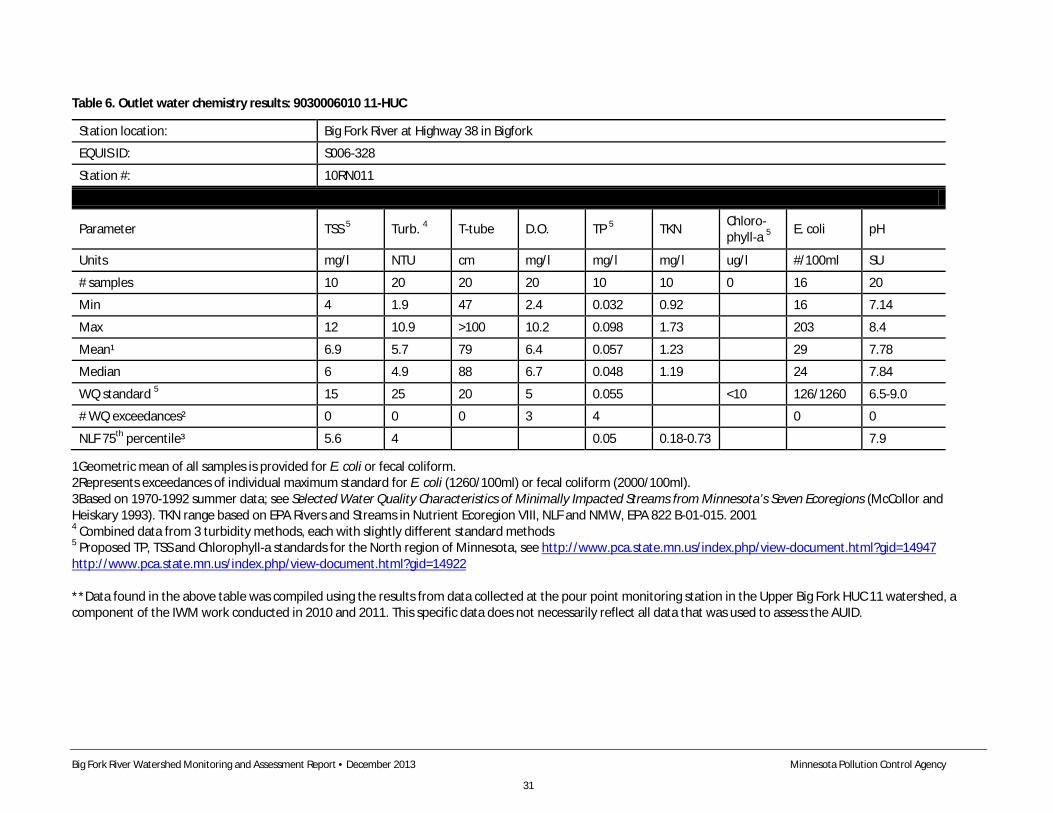
Big Fork River Watershed Monitoring and Assessment Report • December 2013 Minnesota Pollution Control Agency
31
Table 6. Outlet water chemistry results: 9030006010 11-HUC
Station location: Big Fork River at Highway 38 in Bigfork
EQUIS ID: S006-328
Station #: 10RN011
Parameter TSS 5 Turb. 4 T-tube D.O. TP 5 TKN Chloro-phyll-a 5 E. coli pH
Units mg/l NTU cm mg/l mg/l mg/l ug/l #/100ml SU
# samples 10 20 20 20 10 10 0 16 20
Min 4 1.9 47 2.4 0.032 0.92 16 7.14
Max 12 10.9 >100 10.2 0.098 1.73 203 8.4
Mean¹ 6.9 5.7 79 6.4 0.057 1.23 29 7.78
Median 6 4.9 88 6.7 0.048 1.19 24 7.84
WQ standard 5 15 25 20 5 0.055 <10 126/1260 6.5-9.0
# WQ exceedances² 0 0 0 3 4 0 0
NLF 75th percentile³ 5.6 4 0.05 0.18-0.73 7.9
1Geometric mean of all samples is provided for E. coli or fecal coliform. 2Represents exceedances of individual maximum standard for E. coli (1260/100ml) or fecal coliform (2000/100ml). 3Based on 1970-1992 summer data; see Selected Water Quality Characteristics of Minimally Impacted Streams from Minnesota’s Seven Ecoregions (McCollor and Heiskary 1993). TKN range based on EPA Rivers and Streams in Nutrient Ecoregion VIII, NLF and NMW, EPA 822 B-01-015. 2001 4 Combined data from 3 turbidity methods, each with slightly different standard methods 5 Proposed TP, TSS and Chlorophyll-a standards for the North region of Minnesota, see http://www.pca.state.mn.us/index.php/view-document.html?gid=14947 http://www.pca.state.mn.us/index.php/view-document.html?gid=14922 **Data found in the above table was compiled using the results from data collected at the pour point monitoring station in the Upper Big Fork HUC 11 watershed, a component of the IWM work conducted in 2010 and 2011. This specific data does not necessarily reflect all data that was used to assess the AUID.
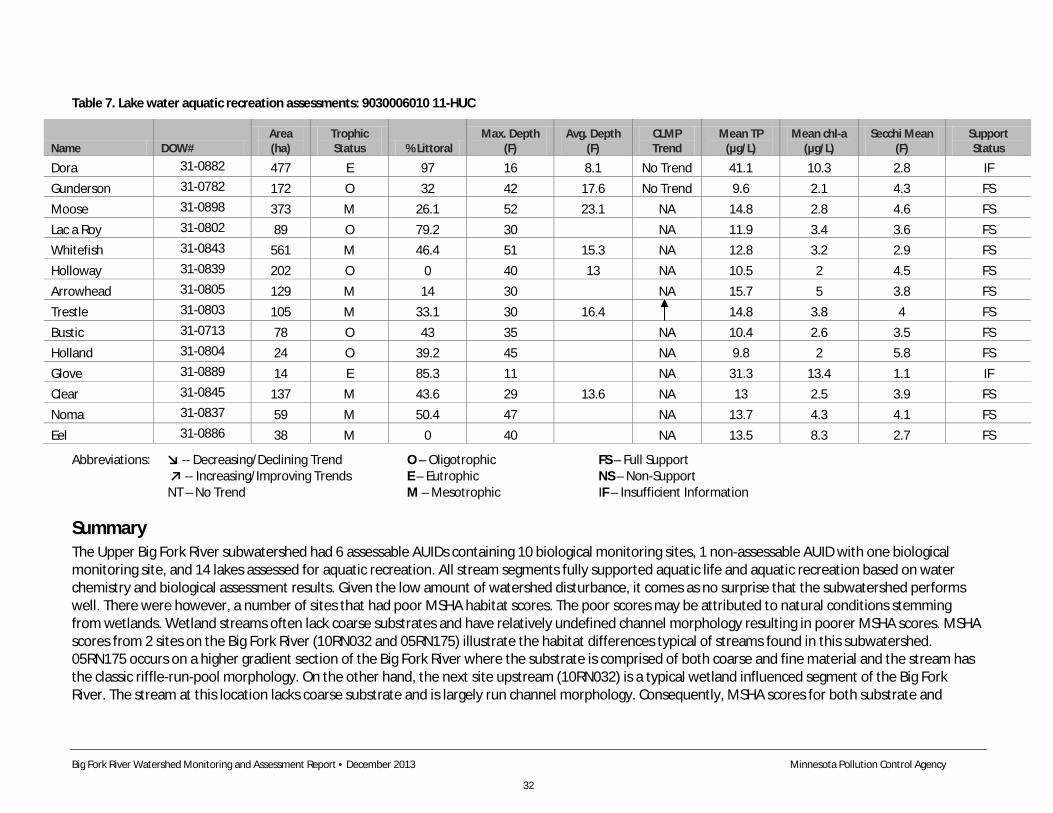
Big Fork River Watershed Monitoring and Assessment Report • December 2013 Minnesota Pollution Control Agency
32
Table 7. Lake water aquatic recreation assessments: 9030006010 11-HUC
Name DOW# Area (ha)
Trophic Status % Littoral
Max. Depth (F)
Avg. Depth (F)
CLMP Trend
Mean TP (µg/L)
Mean chl-a (µg/L)
Secchi Mean (F)
Support Status
Dora 31-0882 477 E 97 16 8.1 No Trend 41.1 10.3 2.8 IF Gunderson 31-0782 172 O 32 42 17.6 No Trend 9.6 2.1 4.3 FS Moose 31-0898 373 M 26.1 52 23.1 NA 14.8 2.8 4.6 FS Lac a Roy 31-0802 89 O 79.2 30 NA 11.9 3.4 3.6 FS Whitefish 31-0843 561 M 46.4 51 15.3 NA 12.8 3.2 2.9 FS Holloway 31-0839 202 O 0 40 13 NA 10.5 2 4.5 FS Arrowhead 31-0805 129 M 14 30 NA 15.7 5 3.8 FS Trestle 31-0803 105 M 33.1 30 16.4 14.8 3.8 4 FS Bustic 31-0713 78 O 43 35 NA 10.4 2.6 3.5 FS Holland 31-0804 24 O 39.2 45 NA 9.8 2 5.8 FS Glove 31-0889 14 E 85.3 11 NA 31.3 13.4 1.1 IF Clear 31-0845 137 M 43.6 29 13.6 NA 13 2.5 3.9 FS Noma 31-0837 59 M 50.4 47 NA 13.7 4.3 4.1 FS Eel 31-0886 38 M 0 40 NA 13.5 8.3 2.7 FS
Abbreviations: ↘ -- Decreasing/Declining Trend O – Oligotrophic FS – Full Support ↗ -- Increasing/Improving Trends E – Eutrophic NS – Non-Support NT – No Trend M – Mesotrophic IF – Insufficient Information
Summary The Upper Big Fork River subwatershed had 6 assessable AUIDs containing 10 biological monitoring sites, 1 non-assessable AUID with one biological monitoring site, and 14 lakes assessed for aquatic recreation. All stream segments fully supported aquatic life and aquatic recreation based on water chemistry and biological assessment results. Given the low amount of watershed disturbance, it comes as no surprise that the subwatershed performs well. There were however, a number of sites that had poor MSHA habitat scores. The poor scores may be attributed to natural conditions stemming from wetlands. Wetland streams often lack coarse substrates and have relatively undefined channel morphology resulting in poorer MSHA scores. MSHA scores from 2 sites on the Big Fork River (10RN032 and 05RN175) illustrate the habitat differences typical of streams found in this subwatershed. 05RN175 occurs on a higher gradient section of the Big Fork River where the substrate is comprised of both coarse and fine material and the stream has the classic riffle-run-pool morphology. On the other hand, the next site upstream (10RN032) is a typical wetland influenced segment of the Big Fork River. The stream at this location lacks coarse substrate and is largely run channel morphology. Consequently, MSHA scores for both substrate and
Big Fork River Watershed Monitoring and Assessment Report • December 2013 Minnesota Pollution Control Agency
33
channel morphology are very low. This pattern persists throughout the Big Fork River Watershed with poor habitat scores primarily driven by the influence of naturally occurring riparian wetlands. In this subwatershed streams with larger drainage areas tended to perform better than those with small drainage areas. The Big Fork River was no exception as it had the highest drainage area along with some of the highest biological scores. In addition to having high IBI scores, the three Big Fork River sites’ samples contained the lowest percentages of tolerant fish and macroinvertebrate species.
The one AUID that was non assessable due to channelization received a fair rating. The process of channelizing streams changes the physical structure of the stream bed as well as the hydrology of a river which can in turn influence substrate types, aquatic vegetation, habitat, and many other factors that influence biological communities. Channelized streams therefore often do not perform as well biologically as natural streams and so the expectations for these streams are lower. The MPCA does not currently compare altered streams to any IBI criteria, rather these streams are given a qualitative rating and are not assessed.
The water chemistry monitoring site for this subwatershed is station S006-328 on the Big Fork River at Minnesota Highway 38 in the town of Bigfork. Data indicate excellent water quality in this subwatershed, and full support for both aquatic life and aquatic recreational uses. Most parameters did not have any exceedances of water quality standards. Dissolved oxygen and phosphorus samples occasionally were not meeting standards, but these were collected during low flows when natural conditions, such as the decomposition of aquatic vegetation, can yield exceedances. The Big Fork River Board River Watch also collected data in this subwatershed. Their data, including fecal coliform bacteria data, corroborate the assessment-level data. In summary, concentrations of sediment, turbidity, nutrients, and bacteria were low and reflective of the forests and wetlands which dominate the land cover within the subwatershed.
The Upper Big Fork River subwatershed has a total of 35 lakes greater than 10 acres in size, including 14 lakes with sufficient data for assessment. In general, data indicate good water quality, reflective of the forests and wetland dominated landscape of Chippewa National Forest. Most lakes (12 of 14) are fully supporting recreational use (Table 7). On the remaining two lakes, Dora and Glove, it was determined that additional data were needed to make conclusive assessment decisions. These waters are very shallow, bog-stained, or drain large wetland dominated landscapes. Dora Lake covers 477 acres, and is located approximately five miles northeast of the community of Squaw Lake. The lake drains a very large watershed, (440 mi2) including the Bowstring and Popple River subwatersheds. Dora Lake is shallow, and much of its riparian area is dominated by stands of wild rice by mid-summer. Dora Lake is riverine in nature; its residence time was estimated at just 7 days during average inflow conditions, and approximately 20 days during a once in 10 year drought condition. Dora Lake is a productive lake and is classified as eutrophic; however, conditions in the lake are likely highly influenced by natural conditions, such as aquatic vegetation growing throughout much of the lake’s surface area. Long term Secchi monitoring data indicate stable transparencies, with no long term trends.
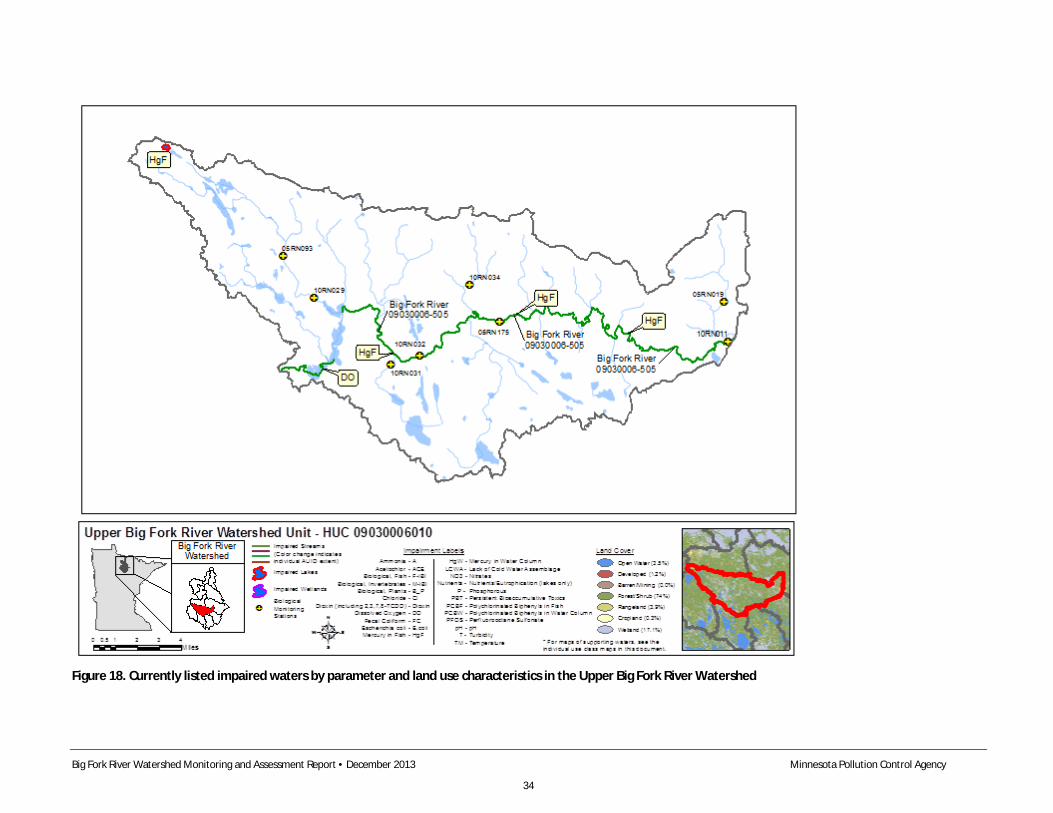
Big Fork River Watershed Monitoring and Assessment Report • December 2013 Minnesota Pollution Control Agency
34
Figure 18. Currently listed impaired waters by parameter and land use characteristics in the Upper Big Fork River Watershed
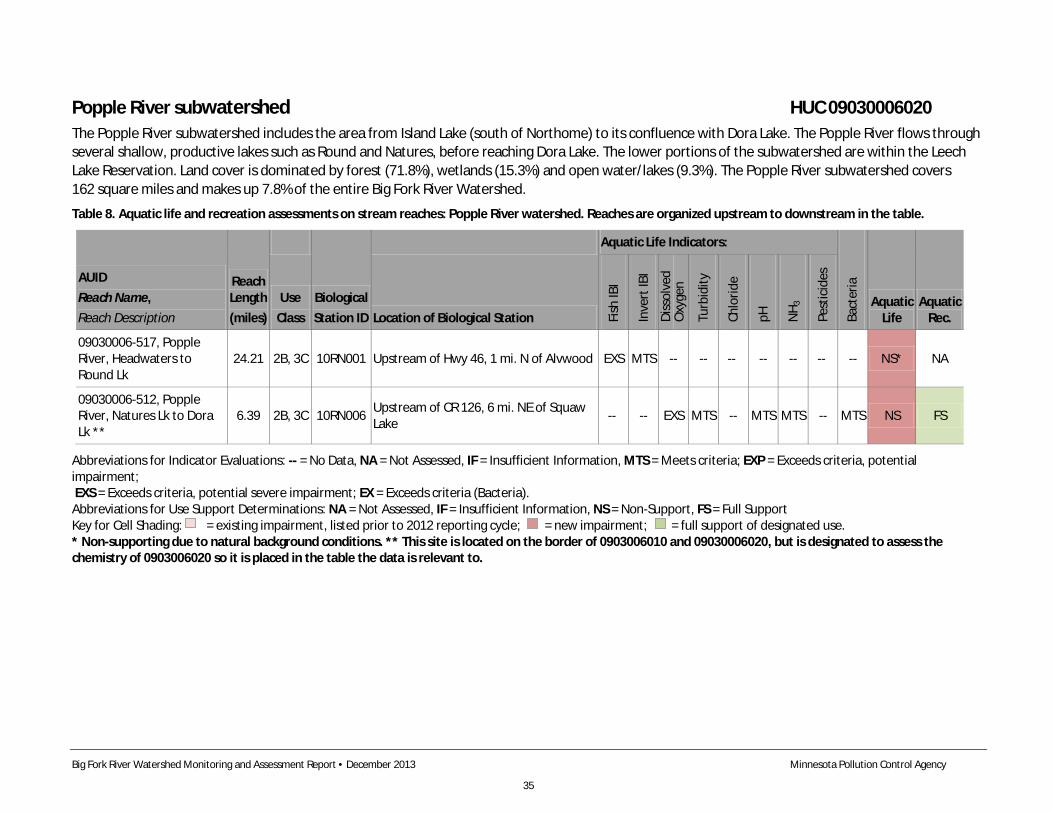
Big Fork River Watershed Monitoring and Assessment Report • December 2013 Minnesota Pollution Control Agency
35
Popple River subwatershed HUC 09030006020 The Popple River subwatershed includes the area from Island Lake (south of Northome) to its confluence with Dora Lake. The Popple River flows through several shallow, productive lakes such as Round and Natures, before reaching Dora Lake. The lower portions of the subwatershed are within the Leech Lake Reservation. Land cover is dominated by forest (71.8%), wetlands (15.3%) and open water/lakes (9.3%). The Popple River subwatershed covers 162 square miles and makes up 7.8% of the entire Big Fork River Watershed.
Table 8. Aquatic life and recreation assessments on stream reaches: Popple River watershed. Reaches are organized upstream to downstream in the table.
AUID Reach Name, Reach Description
Reach Length (miles)
Biological Station ID
Aquatic Life Indicators:
Bact
eria
Aquatic Life
Aquatic Rec.
Use Class Location of Biological Station Fi
sh IB
I
Inve
rt IB
I
Diss
olve
d O
xyge
n
Turb
idity
Chlo
ride
pH
NH 3
Pest
icid
es
09030006-517, Popple River, Headwaters to Round Lk
24.21 2B, 3C 10RN001 Upstream of Hwy 46, 1 mi. N of Alvwood EXS MTS -- -- -- -- -- -- -- NS* NA
09030006-512, Popple River, Natures Lk to Dora Lk **
6.39 2B, 3C 10RN006 Upstream of CR 126, 6 mi. NE of Squaw Lake -- -- EXS MTS -- MTS MTS -- MTS NS FS
Abbreviations for Indicator Evaluations: -- = No Data, NA = Not Assessed, IF = Insufficient Information, MTS = Meets criteria; EXP = Exceeds criteria, potential impairment; EXS = Exceeds criteria, potential severe impairment; EX = Exceeds criteria (Bacteria). Abbreviations for Use Support Determinations: NA = Not Assessed, IF = Insufficient Information, NS = Non-Support, FS = Full Support Key for Cell Shading: = existing impairment, listed prior to 2012 reporting cycle; = new impairment; = full support of designated use. * Non-supporting due to natural background conditions. ** This site is located on the border of 0903006010 and 09030006020, but is designated to assess the chemistry of 0903006020 so it is placed in the table the data is relevant to.
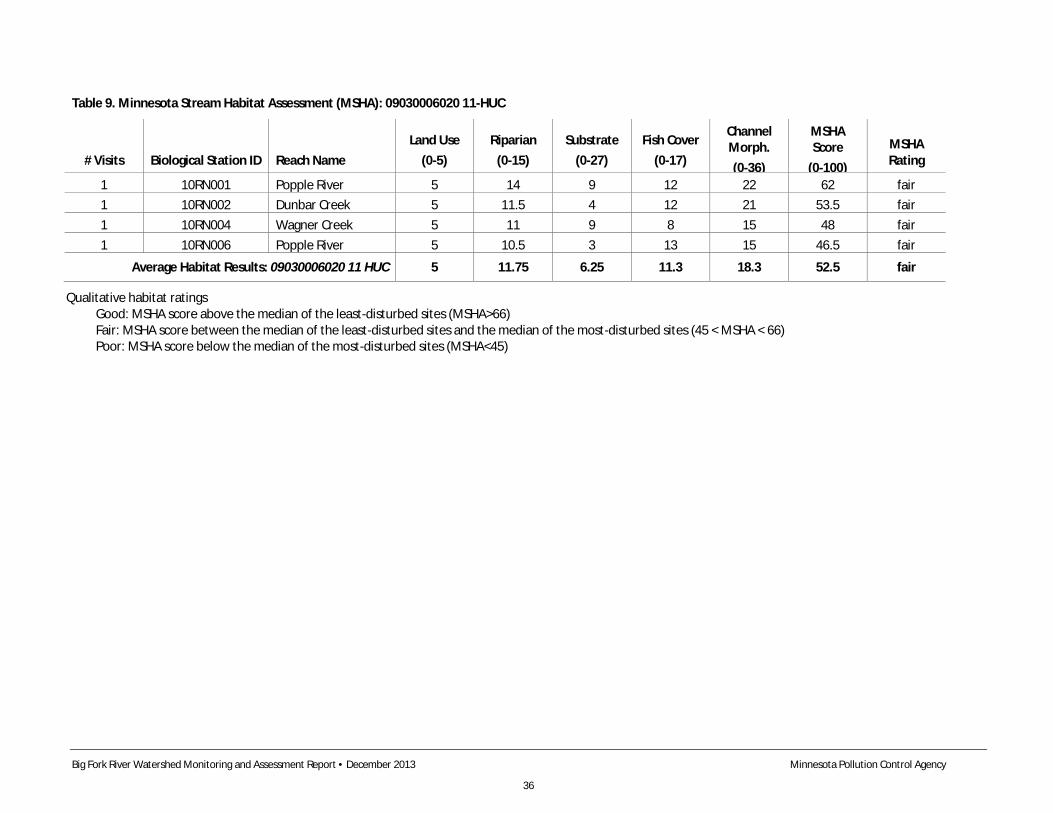
Big Fork River Watershed Monitoring and Assessment Report • December 2013 Minnesota Pollution Control Agency
36
Table 9. Minnesota Stream Habitat Assessment (MSHA): 09030006020 11-HUC
# Visits Biological Station ID Reach Name Land Use
(0-5) Riparian
(0-15) Substrate
(0-27) Fish Cover
(0-17)
Channel Morph. (0-36)
MSHA Score
(0-100)
MSHA Rating
1 10RN001 Popple River 5 14 9 12 22 62 fair 1 10RN002 Dunbar Creek 5 11.5 4 12 21 53.5 fair 1 10RN004 Wagner Creek 5 11 9 8 15 48 fair 1 10RN006 Popple River 5 10.5 3 13 15 46.5 fair
Average Habitat Results: 09030006020 11 HUC 5 11.75 6.25 11.3 18.3 52.5 fair
Qualitative habitat ratings Good: MSHA score above the median of the least-disturbed sites (MSHA>66) Fair: MSHA score between the median of the least-disturbed sites and the median of the most-disturbed sites (45 < MSHA < 66) Poor: MSHA score below the median of the most-disturbed sites (MSHA<45)
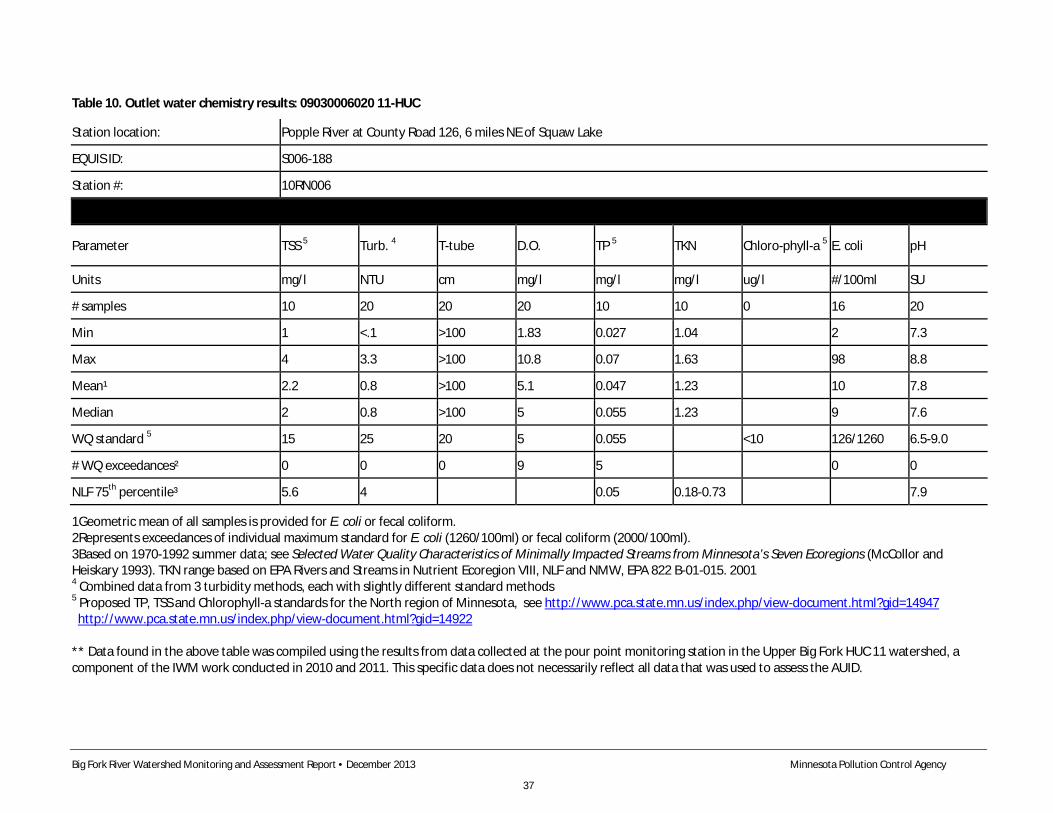
Big Fork River Watershed Monitoring and Assessment Report • December 2013 Minnesota Pollution Control Agency
37
Table 10. Outlet water chemistry results: 09030006020 11-HUC
Station location: Popple River at County Road 126, 6 miles NE of Squaw Lake
EQUIS ID: S006-188
Station #: 10RN006
Parameter TSS 5 Turb. 4 T-tube D.O. TP 5 TKN Chloro-phyll-a 5 E. coli pH
Units mg/l NTU cm mg/l mg/l mg/l ug/l #/100ml SU
# samples 10 20 20 20 10 10 0 16 20
Min 1 <.1 >100 1.83 0.027 1.04
2 7.3
Max 4 3.3 >100 10.8 0.07 1.63
98 8.8
Mean¹ 2.2 0.8 >100 5.1 0.047 1.23
10 7.8
Median 2 0.8 >100 5 0.055 1.23
9 7.6
WQ standard 5 15 25 20 5 0.055
<10 126/1260 6.5-9.0
# WQ exceedances² 0 0 0 9 5
0 0
NLF 75th percentile³ 5.6 4
0.05 0.18-0.73
7.9
1Geometric mean of all samples is provided for E. coli or fecal coliform. 2Represents exceedances of individual maximum standard for E. coli (1260/100ml) or fecal coliform (2000/100ml). 3Based on 1970-1992 summer data; see Selected Water Quality Characteristics of Minimally Impacted Streams from Minnesota’s Seven Ecoregions (McCollor and Heiskary 1993). TKN range based on EPA Rivers and Streams in Nutrient Ecoregion VIII, NLF and NMW, EPA 822 B-01-015. 2001 4 Combined data from 3 turbidity methods, each with slightly different standard methods 5 Proposed TP, TSS and Chlorophyll-a standards for the North region of Minnesota, see http://www.pca.state.mn.us/index.php/view-document.html?gid=14947 http://www.pca.state.mn.us/index.php/view-document.html?gid=14922 ** Data found in the above table was compiled using the results from data collected at the pour point monitoring station in the Upper Big Fork HUC 11 watershed, a component of the IWM work conducted in 2010 and 2011. This specific data does not necessarily reflect all data that was used to assess the AUID.
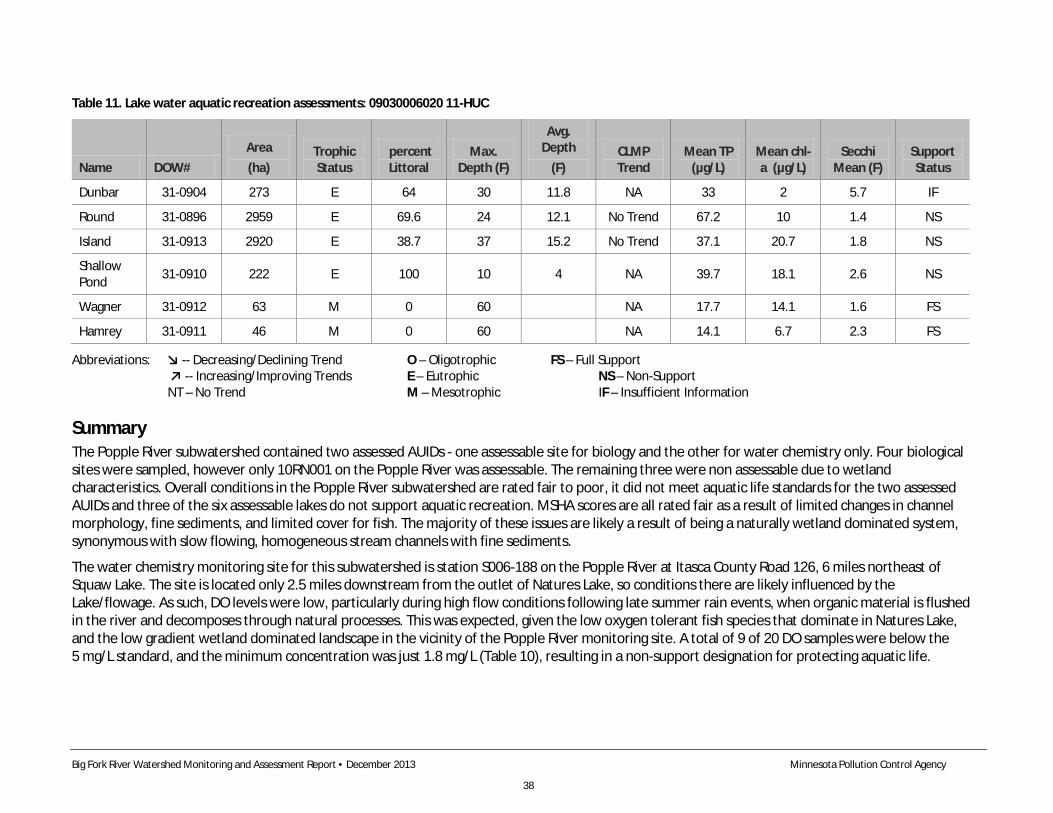
Big Fork River Watershed Monitoring and Assessment Report • December 2013 Minnesota Pollution Control Agency
38
Table 11. Lake water aquatic recreation assessments: 09030006020 11-HUC
Name DOW# Area (ha)
Trophic Status
percent Littoral
Max. Depth (F)
Avg. Depth
(F) CLMP Trend
Mean TP (µg/L)
Mean chl-a (µg/L)
Secchi Mean (F)
Support Status
Dunbar 31-0904 273 E 64 30 11.8 NA 33 2 5.7 IF
Round 31-0896 2959 E 69.6 24 12.1 No Trend 67.2 10 1.4 NS
Island 31-0913 2920 E 38.7 37 15.2 No Trend 37.1 20.7 1.8 NS
Shallow Pond 31-0910 222 E 100 10 4 NA 39.7 18.1 2.6 NS
Wagner 31-0912 63 M 0 60 NA 17.7 14.1 1.6 FS
Hamrey 31-0911 46 M 0 60 NA 14.1 6.7 2.3 FS
Abbreviations: ↘ -- Decreasing/Declining Trend O – Oligotrophic FS – Full Support ↗ -- Increasing/Improving Trends E – Eutrophic NS – Non-Support NT – No Trend M – Mesotrophic IF – Insufficient Information
Summary The Popple River subwatershed contained two assessed AUIDs - one assessable site for biology and the other for water chemistry only. Four biological sites were sampled, however only 10RN001 on the Popple River was assessable. The remaining three were non assessable due to wetland characteristics. Overall conditions in the Popple River subwatershed are rated fair to poor, it did not meet aquatic life standards for the two assessed AUIDs and three of the six assessable lakes do not support aquatic recreation. MSHA scores are all rated fair as a result of limited changes in channel morphology, fine sediments, and limited cover for fish. The majority of these issues are likely a result of being a naturally wetland dominated system, synonymous with slow flowing, homogeneous stream channels with fine sediments.
The water chemistry monitoring site for this subwatershed is station S006-188 on the Popple River at Itasca County Road 126, 6 miles northeast of Squaw Lake. The site is located only 2.5 miles downstream from the outlet of Natures Lake, so conditions there are likely influenced by the Lake/flowage. As such, DO levels were low, particularly during high flow conditions following late summer rain events, when organic material is flushed in the river and decomposes through natural processes. This was expected, given the low oxygen tolerant fish species that dominate in Natures Lake, and the low gradient wetland dominated landscape in the vicinity of the Popple River monitoring site. A total of 9 of 20 DO samples were below the 5 mg/L standard, and the minimum concentration was just 1.8 mg/L (Table 10), resulting in a non-support designation for protecting aquatic life.
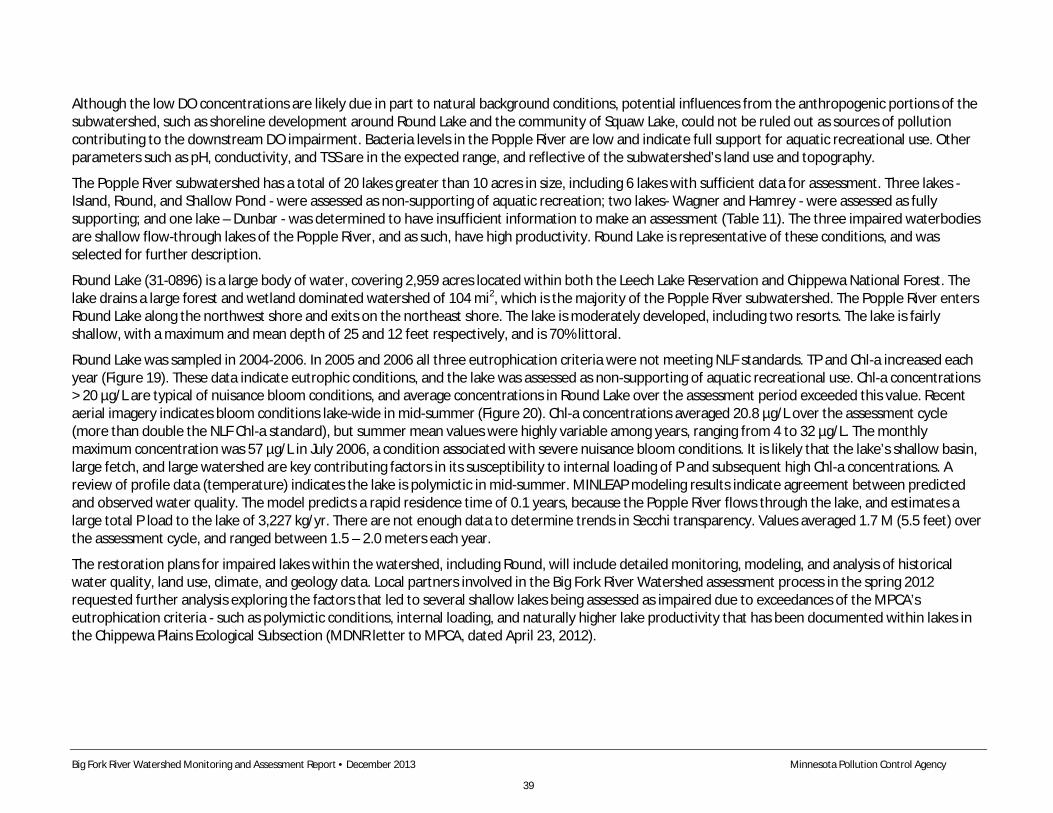
Big Fork River Watershed Monitoring and Assessment Report • December 2013 Minnesota Pollution Control Agency
39
Although the low DO concentrations are likely due in part to natural background conditions, potential influences from the anthropogenic portions of the subwatershed, such as shoreline development around Round Lake and the community of Squaw Lake, could not be ruled out as sources of pollution contributing to the downstream DO impairment. Bacteria levels in the Popple River are low and indicate full support for aquatic recreational use. Other parameters such as pH, conductivity, and TSS are in the expected range, and reflective of the subwatershed’s land use and topography.
The Popple River subwatershed has a total of 20 lakes greater than 10 acres in size, including 6 lakes with sufficient data for assessment. Three lakes - Island, Round, and Shallow Pond - were assessed as non-supporting of aquatic recreation; two lakes- Wagner and Hamrey - were assessed as fully supporting; and one lake – Dunbar - was determined to have insufficient information to make an assessment (Table 11). The three impaired waterbodies are shallow flow-through lakes of the Popple River, and as such, have high productivity. Round Lake is representative of these conditions, and was selected for further description.
Round Lake (31-0896) is a large body of water, covering 2,959 acres located within both the Leech Lake Reservation and Chippewa National Forest. The lake drains a large forest and wetland dominated watershed of 104 mi2, which is the majority of the Popple River subwatershed. The Popple River enters Round Lake along the northwest shore and exits on the northeast shore. The lake is moderately developed, including two resorts. The lake is fairly shallow, with a maximum and mean depth of 25 and 12 feet respectively, and is 70% littoral.
Round Lake was sampled in 2004-2006. In 2005 and 2006 all three eutrophication criteria were not meeting NLF standards. TP and Chl-a increased each year (Figure 19). These data indicate eutrophic conditions, and the lake was assessed as non-supporting of aquatic recreational use. Chl-a concentrations > 20 µg/L are typical of nuisance bloom conditions, and average concentrations in Round Lake over the assessment period exceeded this value. Recent aerial imagery indicates bloom conditions lake-wide in mid-summer (Figure 20). Chl-a concentrations averaged 20.8 µg/L over the assessment cycle (more than double the NLF Chl-a standard), but summer mean values were highly variable among years, ranging from 4 to 32 µg/L. The monthly maximum concentration was 57 µg/L in July 2006, a condition associated with severe nuisance bloom conditions. It is likely that the lake’s shallow basin, large fetch, and large watershed are key contributing factors in its susceptibility to internal loading of P and subsequent high Chl-a concentrations. A review of profile data (temperature) indicates the lake is polymictic in mid-summer. MINLEAP modeling results indicate agreement between predicted and observed water quality. The model predicts a rapid residence time of 0.1 years, because the Popple River flows through the lake, and estimates a large total P load to the lake of 3,227 kg/yr. There are not enough data to determine trends in Secchi transparency. Values averaged 1.7 M (5.5 feet) over the assessment cycle, and ranged between 1.5 – 2.0 meters each year.
The restoration plans for impaired lakes within the watershed, including Round, will include detailed monitoring, modeling, and analysis of historical water quality, land use, climate, and geology data. Local partners involved in the Big Fork River Watershed assessment process in the spring 2012 requested further analysis exploring the factors that led to several shallow lakes being assessed as impaired due to exceedances of the MPCA’s eutrophication criteria - such as polymictic conditions, internal loading, and naturally higher lake productivity that has been documented within lakes in the Chippewa Plains Ecological Subsection (MDNR letter to MPCA, dated April 23, 2012).
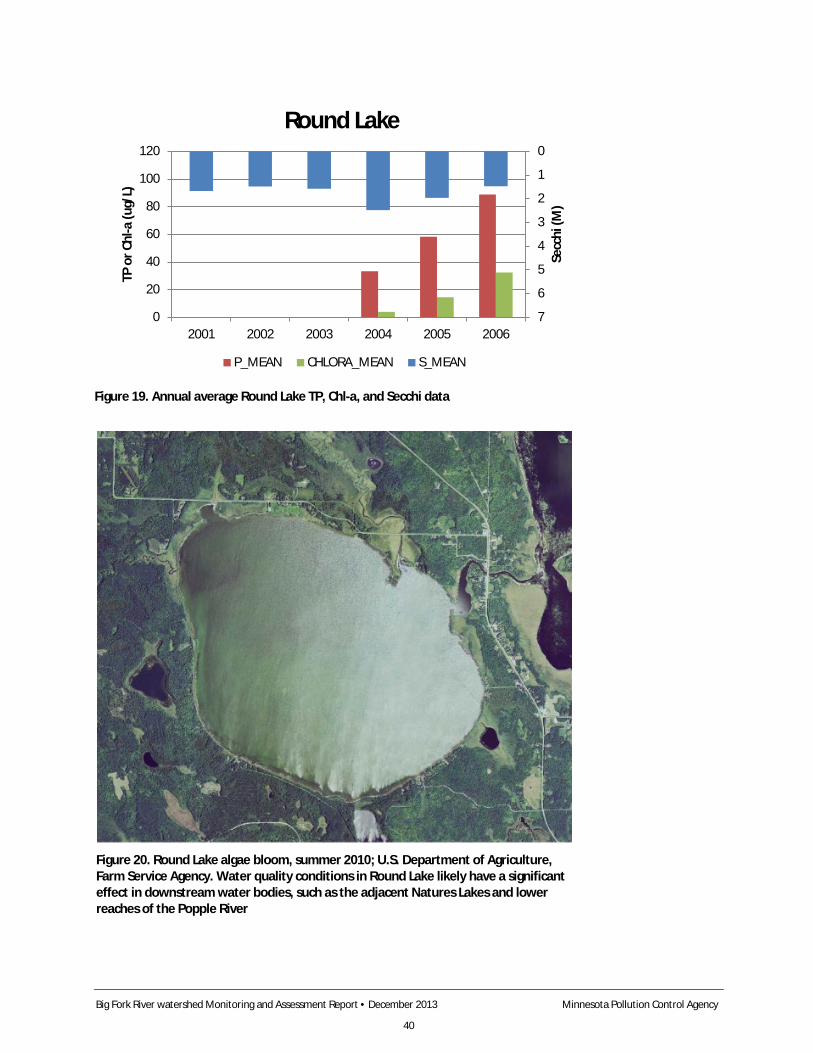
Big Fork River watershed Monitoring and Assessment Report • December 2013 Minnesota Pollution Control Agency
40
0
1
2
3
4
5
6
70
20
40
60
80
100
120
2001 2002 2003 2004 2005 2006
Secc
hi (M
)
TP o
r Chl
-a (u
g/L)
Round Lake
P_MEAN CHLORA_MEAN S_MEAN
Figure 19. Annual average Round Lake TP, Chl-a, and Secchi data
Figure 20. Round Lake algae bloom, summer 2010; U.S. Department of Agriculture, Farm Service Agency. Water quality conditions in Round Lake likely have a significant effect in downstream water bodies, such as the adjacent Natures Lakes and lower reaches of the Popple River
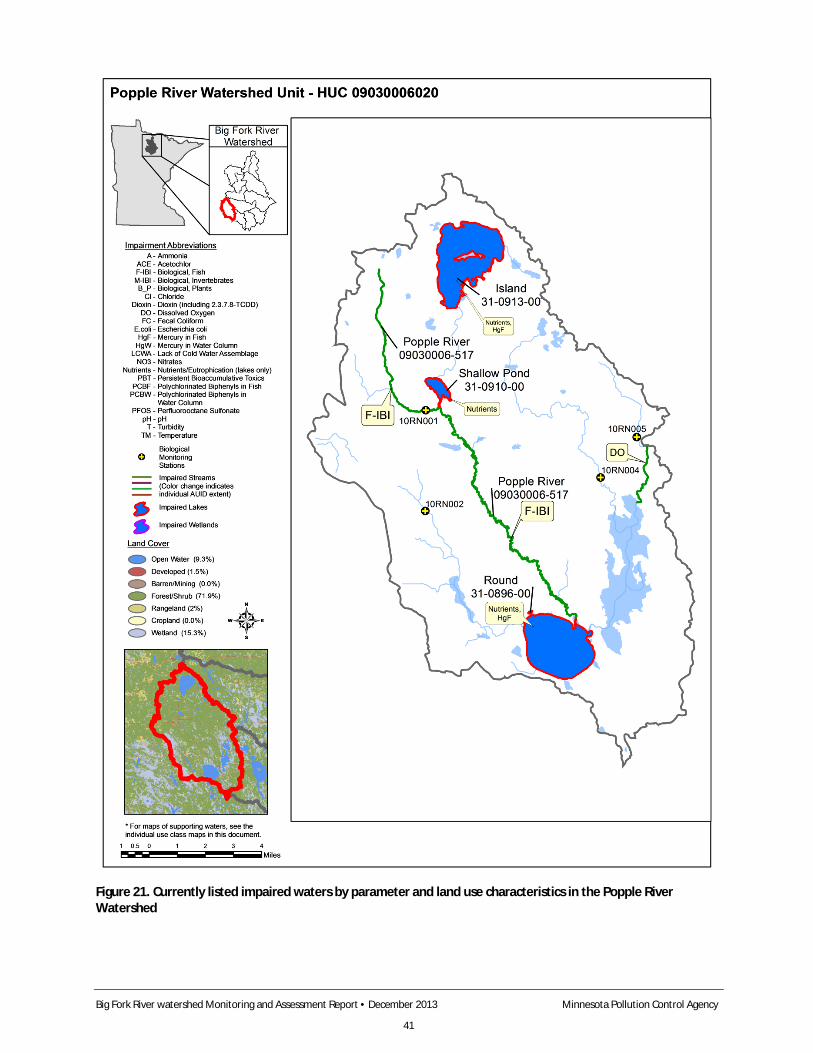
Big Fork River watershed Monitoring and Assessment Report • December 2013 Minnesota Pollution Control Agency
41
Figure 21. Currently listed impaired waters by parameter and land use characteristics in the Popple River Watershed
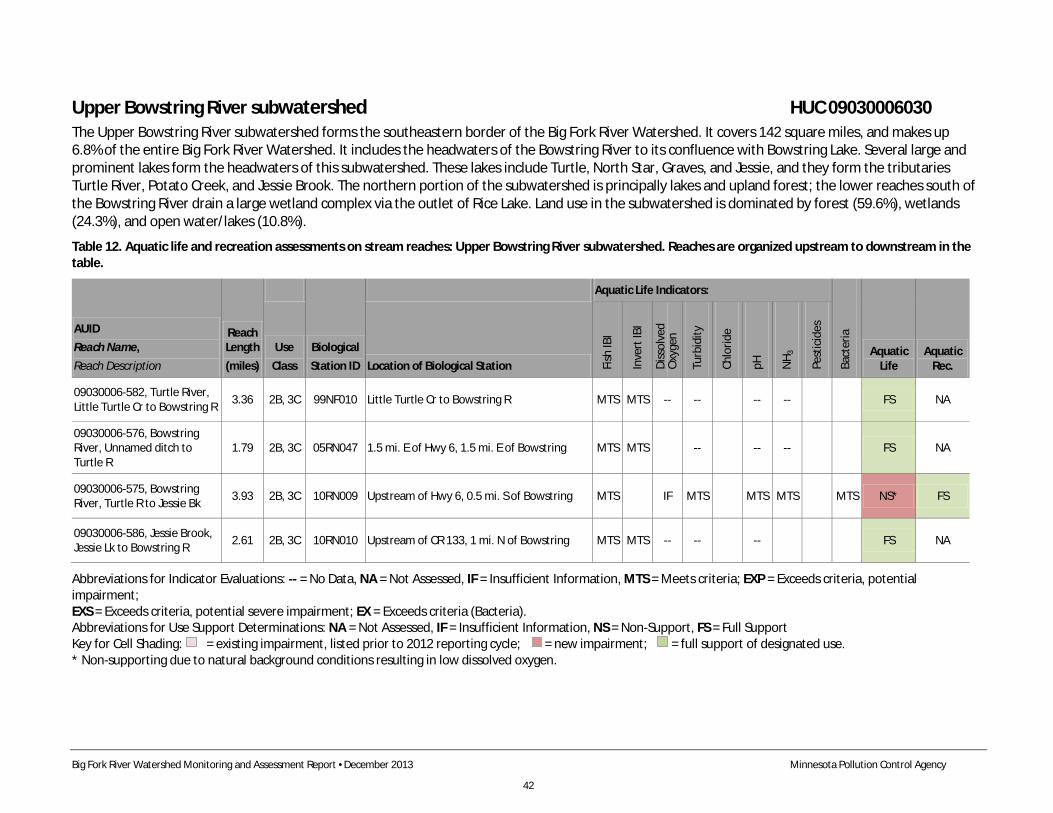
Big Fork River Watershed Monitoring and Assessment Report •December 2013 Minnesota Pollution Control Agency
42
Upper Bowstring River subwatershed HUC 09030006030 The Upper Bowstring River subwatershed forms the southeastern border of the Big Fork River Watershed. It covers 142 square miles, and makes up 6.8% of the entire Big Fork River Watershed. It includes the headwaters of the Bowstring River to its confluence with Bowstring Lake. Several large and prominent lakes form the headwaters of this subwatershed. These lakes include Turtle, North Star, Graves, and Jessie, and they form the tributaries Turtle River, Potato Creek, and Jessie Brook. The northern portion of the subwatershed is principally lakes and upland forest; the lower reaches south of the Bowstring River drain a large wetland complex via the outlet of Rice Lake. Land use in the subwatershed is dominated by forest (59.6%), wetlands (24.3%), and open water/lakes (10.8%).
Table 12. Aquatic life and recreation assessments on stream reaches: Upper Bowstring River subwatershed. Reaches are organized upstream to downstream in the table.
AUID Reach Name, Reach Description
Reach Length (miles)
Biological Station ID
Aquatic Life Indicators:
Bact
eria
Aquatic Life
Aquatic Rec.
Use Class Location of Biological Station Fi
sh IB
I
Inve
rt IB
I
Diss
olve
d O
xyge
n
Turb
idity
Chlo
ride
pH
NH 3
Pest
icid
es
09030006-582, Turtle River, Little Turtle Cr to Bowstring R 3.36 2B, 3C 99NF010 Little Turtle Cr to Bowstring R MTS MTS -- -- -- -- FS NA
09030006-576, Bowstring River, Unnamed ditch to Turtle R
1.79 2B, 3C 05RN047 1.5 mi. E of Hwy 6, 1.5 mi. E of Bowstring MTS MTS -- -- -- FS NA
09030006-575, Bowstring River, Turtle R to Jessie Bk 3.93 2B, 3C 10RN009 Upstream of Hwy 6, 0.5 mi. S of Bowstring MTS IF MTS MTS MTS MTS NS* FS
09030006-586, Jessie Brook, Jessie Lk to Bowstring R 2.61 2B, 3C 10RN010 Upstream of CR 133, 1 mi. N of Bowstring MTS MTS -- -- -- FS NA
Abbreviations for Indicator Evaluations: -- = No Data, NA = Not Assessed, IF = Insufficient Information, MTS = Meets criteria; EXP = Exceeds criteria, potential impairment; EXS = Exceeds criteria, potential severe impairment; EX = Exceeds criteria (Bacteria). Abbreviations for Use Support Determinations: NA = Not Assessed, IF = Insufficient Information, NS = Non-Support, FS = Full Support Key for Cell Shading: = existing impairment, listed prior to 2012 reporting cycle; = new impairment; = full support of designated use. * Non-supporting due to natural background conditions resulting in low dissolved oxygen.
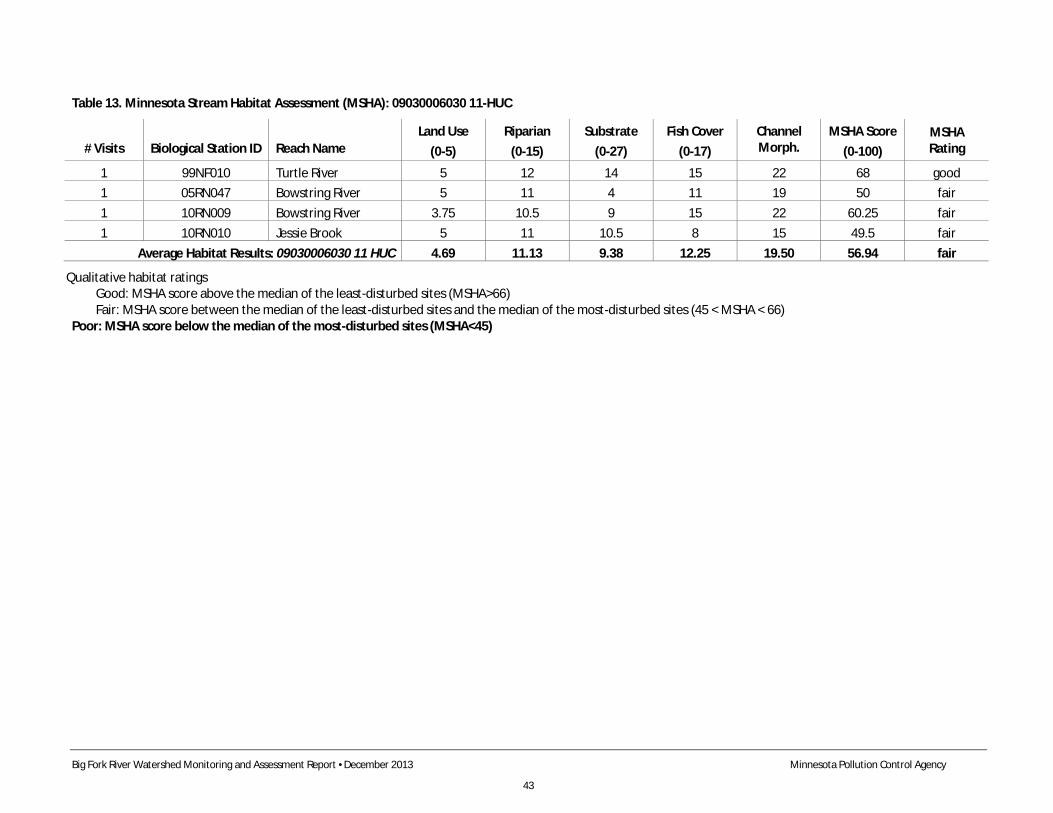
Big Fork River Watershed Monitoring and Assessment Report •December 2013 Minnesota Pollution Control Agency
43
Table 13. Minnesota Stream Habitat Assessment (MSHA): 09030006030 11-HUC
# Visits Biological Station ID Reach Name Land Use
(0-5) Riparian
(0-15) Substrate
(0-27) Fish Cover
(0-17) Channel Morph.
MSHA Score (0-100)
MSHA Rating
1 99NF010 Turtle River 5 12 14 15 22 68 good 1 05RN047 Bowstring River 5 11 4 11 19 50 fair 1 10RN009 Bowstring River 3.75 10.5 9 15 22 60.25 fair 1 10RN010 Jessie Brook 5 11 10.5 8 15 49.5 fair
Average Habitat Results: 09030006030 11 HUC 4.69 11.13 9.38 12.25 19.50 56.94 fair
Qualitative habitat ratings Good: MSHA score above the median of the least-disturbed sites (MSHA>66) Fair: MSHA score between the median of the least-disturbed sites and the median of the most-disturbed sites (45 < MSHA < 66)
Poor: MSHA score below the median of the most-disturbed sites (MSHA<45)
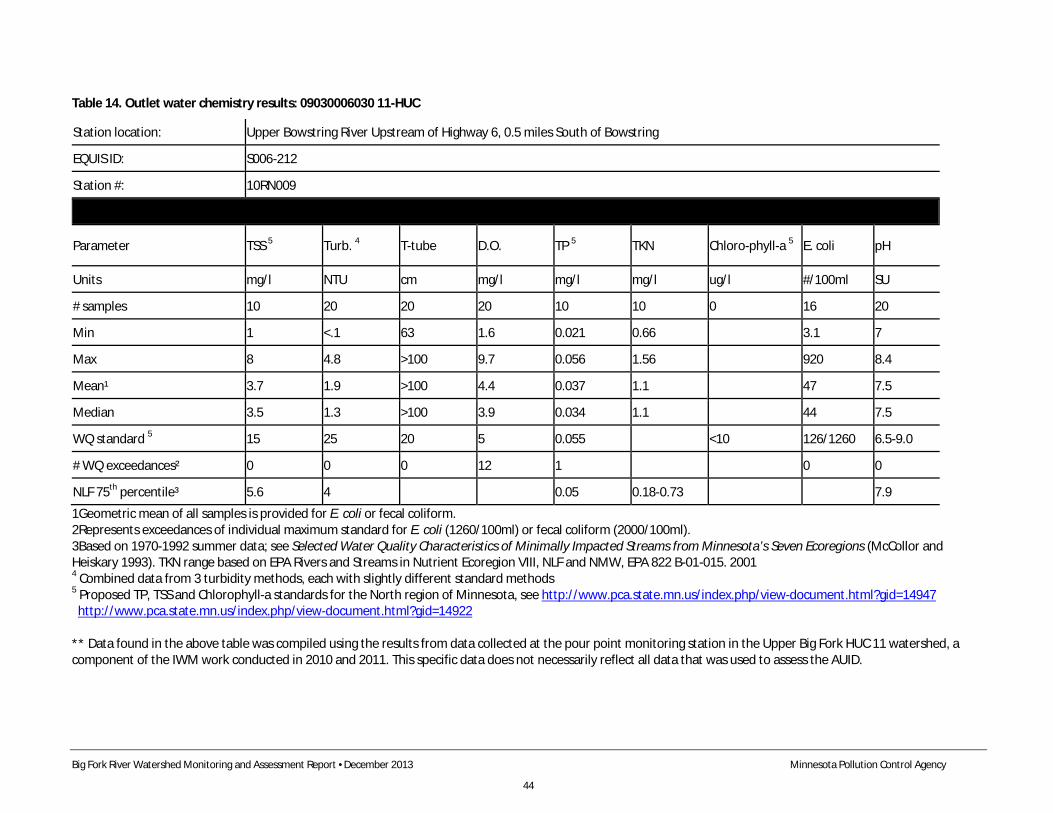
Big Fork River Watershed Monitoring and Assessment Report •December 2013 Minnesota Pollution Control Agency
44
Table 14. Outlet water chemistry results: 09030006030 11-HUC
Station location: Upper Bowstring River Upstream of Highway 6, 0.5 miles South of Bowstring
EQUIS ID: S006-212
Station #: 10RN009
Parameter TSS 5 Turb. 4 T-tube D.O. TP 5 TKN Chloro-phyll-a 5 E. coli pH
Units mg/l NTU cm mg/l mg/l mg/l ug/l #/100ml SU
# samples 10 20 20 20 10 10 0 16 20
Min 1 <.1 63 1.6 0.021 0.66 3.1 7
Max 8 4.8 >100 9.7 0.056 1.56 920 8.4
Mean¹ 3.7 1.9 >100 4.4 0.037 1.1 47 7.5
Median 3.5 1.3 >100 3.9 0.034 1.1 44 7.5
WQ standard 5 15 25 20 5 0.055 <10 126/1260 6.5-9.0
# WQ exceedances² 0 0 0 12 1 0 0
NLF 75th percentile³ 5.6 4 0.05 0.18-0.73 7.9
1Geometric mean of all samples is provided for E. coli or fecal coliform. 2Represents exceedances of individual maximum standard for E. coli (1260/100ml) or fecal coliform (2000/100ml). 3Based on 1970-1992 summer data; see Selected Water Quality Characteristics of Minimally Impacted Streams from Minnesota’s Seven Ecoregions (McCollor and Heiskary 1993). TKN range based on EPA Rivers and Streams in Nutrient Ecoregion VIII, NLF and NMW, EPA 822 B-01-015. 2001 4 Combined data from 3 turbidity methods, each with slightly different standard methods 5 Proposed TP, TSS and Chlorophyll-a standards for the North region of Minnesota, see http://www.pca.state.mn.us/index.php/view-document.html?gid=14947 http://www.pca.state.mn.us/index.php/view-document.html?gid=14922 ** Data found in the above table was compiled using the results from data collected at the pour point monitoring station in the Upper Big Fork HUC 11 watershed, a component of the IWM work conducted in 2010 and 2011. This specific data does not necessarily reflect all data that was used to assess the AUID.
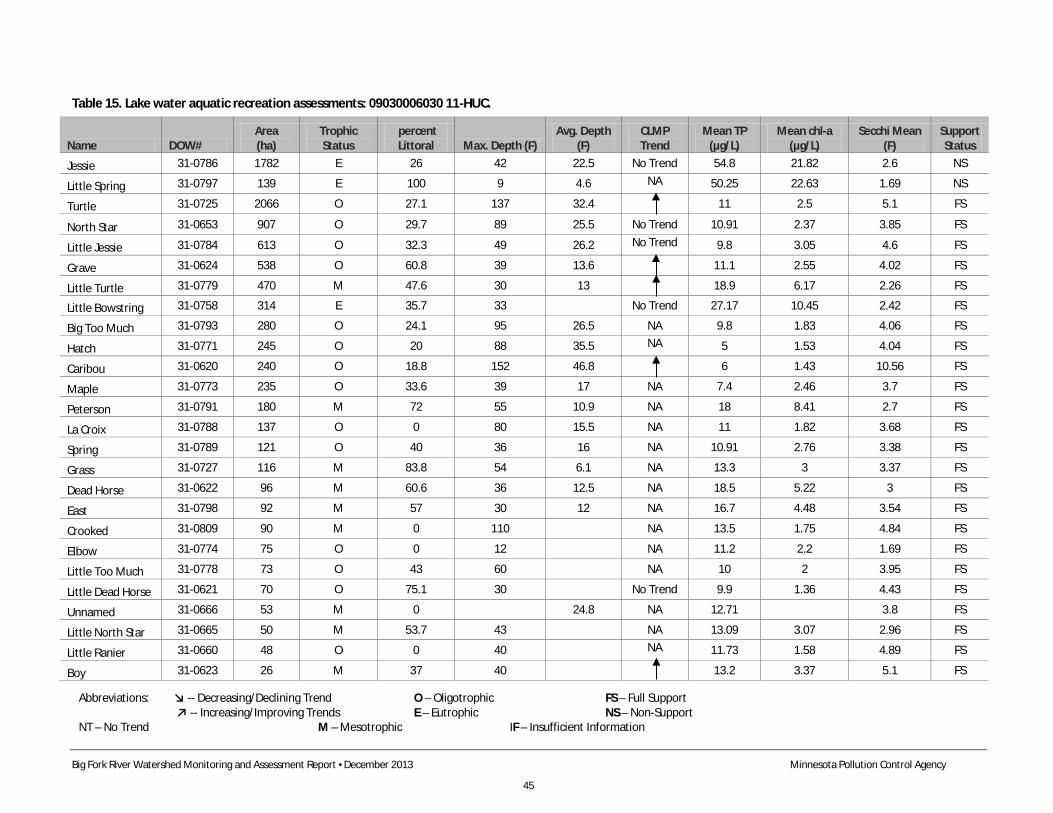
Big Fork River Watershed Monitoring and Assessment Report •December 2013 Minnesota Pollution Control Agency
45
Table 15. Lake water aquatic recreation assessments: 09030006030 11-HUC.
Name DOW# Area (ha)
Trophic Status
percent Littoral Max. Depth (F)
Avg. Depth (F)
CLMP Trend
Mean TP (µg/L)
Mean chl-a (µg/L)
Secchi Mean (F)
Support Status
Jessie 31-0786 1782 E 26 42 22.5 No Trend 54.8 21.82 2.6 NS
Little Spring 31-0797 139 E 100 9 4.6 NA 50.25 22.63 1.69 NS
Turtle 31-0725 2066 O 27.1 137 32.4 11 2.5 5.1 FS
North Star 31-0653 907 O 29.7 89 25.5 No Trend 10.91 2.37 3.85 FS
Little Jessie 31-0784 613 O 32.3 49 26.2 No Trend 9.8 3.05 4.6 FS
Grave 31-0624 538 O 60.8 39 13.6 11.1 2.55 4.02 FS
Little Turtle 31-0779 470 M 47.6 30 13 18.9 6.17 2.26 FS
Little Bowstring 31-0758 314 E 35.7 33 No Trend 27.17 10.45 2.42 FS
Big Too Much 31-0793 280 O 24.1 95 26.5 NA 9.8 1.83 4.06 FS
Hatch 31-0771 245 O 20 88 35.5 NA 5 1.53 4.04 FS
Caribou 31-0620 240 O 18.8 152 46.8 6 1.43 10.56 FS
Maple 31-0773 235 O 33.6 39 17 NA 7.4 2.46 3.7 FS
Peterson 31-0791 180 M 72 55 10.9 NA 18 8.41 2.7 FS
La Croix 31-0788 137 O 0 80 15.5 NA 11 1.82 3.68 FS
Spring 31-0789 121 O 40 36 16 NA 10.91 2.76 3.38 FS
Grass 31-0727 116 M 83.8 54 6.1 NA 13.3 3 3.37 FS
Dead Horse 31-0622 96 M 60.6 36 12.5 NA 18.5 5.22 3 FS
East 31-0798 92 M 57 30 12 NA 16.7 4.48 3.54 FS
Crooked 31-0809 90 M 0 110 NA 13.5 1.75 4.84 FS
Elbow 31-0774 75 O 0 12 NA 11.2 2.2 1.69 FS
Little Too Much 31-0778 73 O 43 60 NA 10 2 3.95 FS
Little Dead Horse 31-0621 70 O 75.1 30 No Trend 9.9 1.36 4.43 FS
Unnamed 31-0666 53 M 0 24.8 NA 12.71 3.8 FS
Little North Star 31-0665 50 M 53.7 43 NA 13.09 3.07 2.96 FS
Little Ranier 31-0660 48 O 0 40 NA 11.73 1.58 4.89 FS
Boy 31-0623 26 M 37 40 13.2 3.37 5.1 FS Abbreviations: ↘ -- Decreasing/Declining Trend O – Oligotrophic FS – Full Support
↗ -- Increasing/Improving Trends E – Eutrophic NS – Non-Support NT – No Trend M – Mesotrophic IF – Insufficient Information
Big Fork River Watershed Monitoring and Assessment Report •December 2013 Minnesota Pollution Control Agency
46
Summary The Upper Bowstring River subwatershed contained four assessable AUIDs and 26 assessable lakes. Conditions in this watershed are fair. Nearly all of the streams and lakes are rated as meeting criteria and fully support aquatic life and aquatic recreation with the exception of the 10RN009 located on the Bowstring River. At this location, aquatic life is listed as non-supporting because of the borderline DO levels that were later determined to be due to natural background conditions. MSHA scores are rated as fair overall; sediment type and channel morphology are again the leading categories that drove scores down, similar to the Upper Big Fork River subwatershed.
The water chemistry monitoring site for this subwatershed is station S006-212 on the Bowstring River at Minnesota Highway 6, 0.5 miles south of the community of Bowstring. For most parameters, data indicated excellent water quality with minimal to no water quality exceedances. The exception was DO, with 12 of 20 samples below the 5 mg/L standard. The low DO conditions at the site are likely due to natural wetland characteristics at the site and in the low-gradient upstream watershed. The subwatershed has been classified as 5% disturbed; correspondingly 95% of the subwatershed’s land-cover is classified as forest, wetland, and open water. Several samples that fell below the standard were collected during high flows, when water from surrounding wetlands can be released into the stream channel. Recent DO monitoring downstream of the river site, in Bowstring Lake, indicate DO levels are above the 5 mg/L standard. Bacteria levels, on average, are low in the subwatershed, and indicate full support for aquatic recreational use.
The Upper Bowstring River subwatershed has 46 lakes greater than 10 acres in size, including 26 lakes with sufficient data for assessment. A total of 24 lakes were assessed as fully supporting aquatic recreation, and two lakes (Jessie and Little Spring) were assessed as non-supporting (Table 15). In general, lake conditions in the subwatershed indicate good to excellent water quality. Most of the assessed lakes have low concentrations of phosphorus and chlorophyll-a, and high Secchi transparency. Conditions were reflective of the forest dominated landscape of the Chippewa National Forest. Headwater lakes such as Turtle and North Star, are deep, groundwater-dominated, and provide base flow to the Bowstring River. They also are popular recreational resources. The two impaired lakes, Jessie and Little Spring, are located along the western border of the subwatershed, and are relatively shallow. Jessie lake was assessed as non-supporting for aquatic recreation in 2004 due to high concentrations of TP and Chl-a, after completion of a Clean Water Partnership project in 2002. A TMDL study was initiated soon after this date, and was approved by the EPA in 2011. The TMDL study, completed by the Itasca County SWCD, private contractors, and the MPCA, provides much more detail on the lake, its watershed, water quality models, and restoration options. Further information can be found on these websites: http://www.itascaswcd.org/Programs/Jessie%20TMDL.html and http://www.pca.state.mn.us/tchy9dd
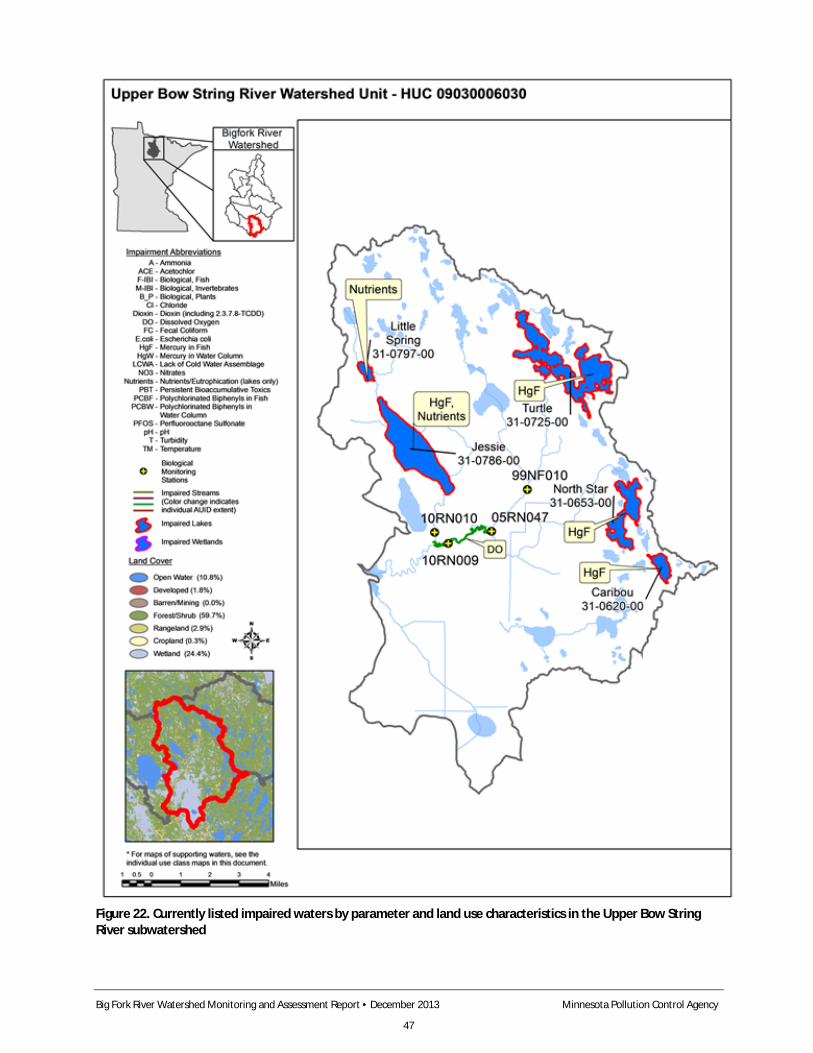
Big Fork River Watershed Monitoring and Assessment Report • December 2013 Minnesota Pollution Control Agency
47
Figure 22. Currently listed impaired waters by parameter and land use characteristics in the Upper Bow String River subwatershed
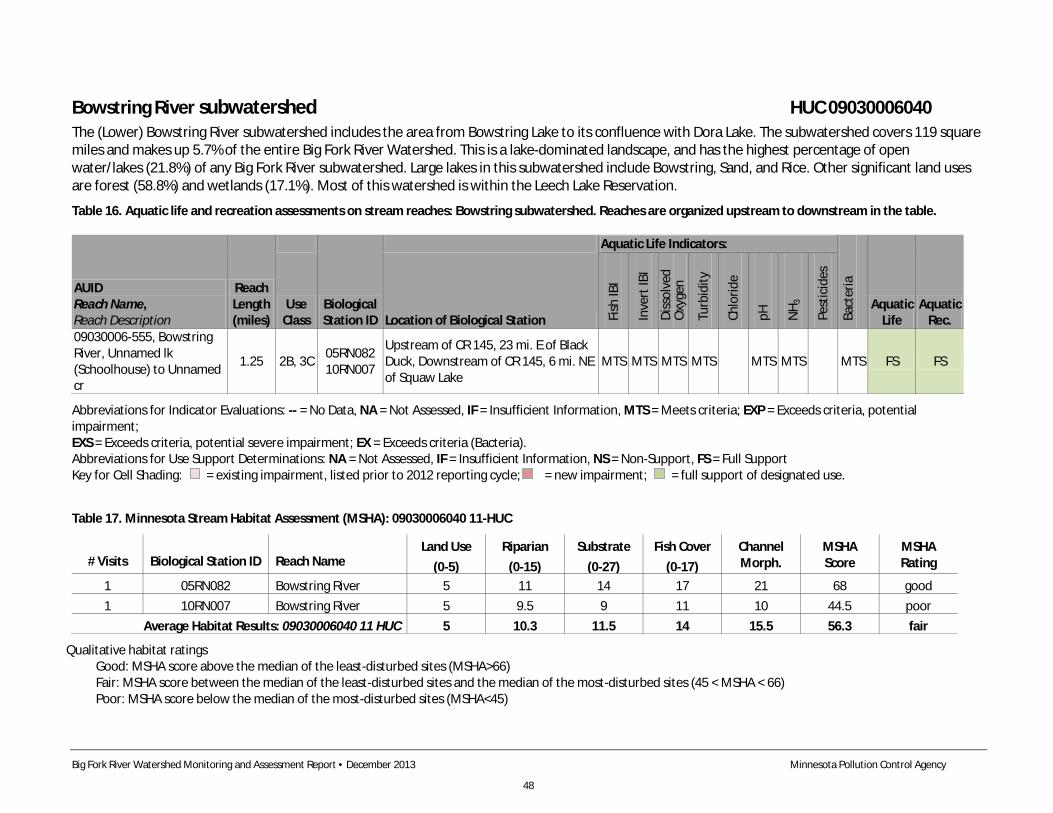
Big Fork River Watershed Monitoring and Assessment Report • December 2013 Minnesota Pollution Control Agency
48
Bowstring River subwatershed HUC 09030006040 The (Lower) Bowstring River subwatershed includes the area from Bowstring Lake to its confluence with Dora Lake. The subwatershed covers 119 square miles and makes up 5.7% of the entire Big Fork River Watershed. This is a lake-dominated landscape, and has the highest percentage of open water/lakes (21.8%) of any Big Fork River subwatershed. Large lakes in this subwatershed include Bowstring, Sand, and Rice. Other significant land uses are forest (58.8%) and wetlands (17.1%). Most of this watershed is within the Leech Lake Reservation.
Table 16. Aquatic life and recreation assessments on stream reaches: Bowstring subwatershed. Reaches are organized upstream to downstream in the table.
AUID Reach Name, Reach Description
Reach Length (miles)
Biological Station ID
Aquatic Life Indicators:
Bact
eria
Aquatic Life
Aquatic Rec.
Use Class Location of Biological Station Fi
sh IB
I
Inve
rt IB
I
Diss
olve
d O
xyge
n
Turb
idity
Chlo
ride
pH
NH 3
Pest
icid
es
09030006-555, Bowstring River, Unnamed lk (Schoolhouse) to Unnamed cr
1.25 2B, 3C 05RN082 10RN007
Upstream of CR 145, 23 mi. E of Black Duck, Downstream of CR 145, 6 mi. NE of Squaw Lake
MTS MTS MTS MTS MTS MTS MTS FS FS
Abbreviations for Indicator Evaluations: -- = No Data, NA = Not Assessed, IF = Insufficient Information, MTS = Meets criteria; EXP = Exceeds criteria, potential impairment; EXS = Exceeds criteria, potential severe impairment; EX = Exceeds criteria (Bacteria). Abbreviations for Use Support Determinations: NA = Not Assessed, IF = Insufficient Information, NS = Non-Support, FS = Full Support Key for Cell Shading: = existing impairment, listed prior to 2012 reporting cycle; = new impairment; = full support of designated use.
Table 17. Minnesota Stream Habitat Assessment (MSHA): 09030006040 11-HUC
# Visits Biological Station ID Reach Name Land Use
(0-5) Riparian
(0-15) Substrate
(0-27) Fish Cover
(0-17) Channel Morph.
MSHA Score
MSHA Rating
1 05RN082 Bowstring River 5 11 14 17 21 68 good 1 10RN007 Bowstring River 5 9.5 9 11 10 44.5 poor
Average Habitat Results: 09030006040 11 HUC 5 10.3 11.5 14 15.5 56.3 fair
Qualitative habitat ratings Good: MSHA score above the median of the least-disturbed sites (MSHA>66) Fair: MSHA score between the median of the least-disturbed sites and the median of the most-disturbed sites (45 < MSHA < 66) Poor: MSHA score below the median of the most-disturbed sites (MSHA<45)
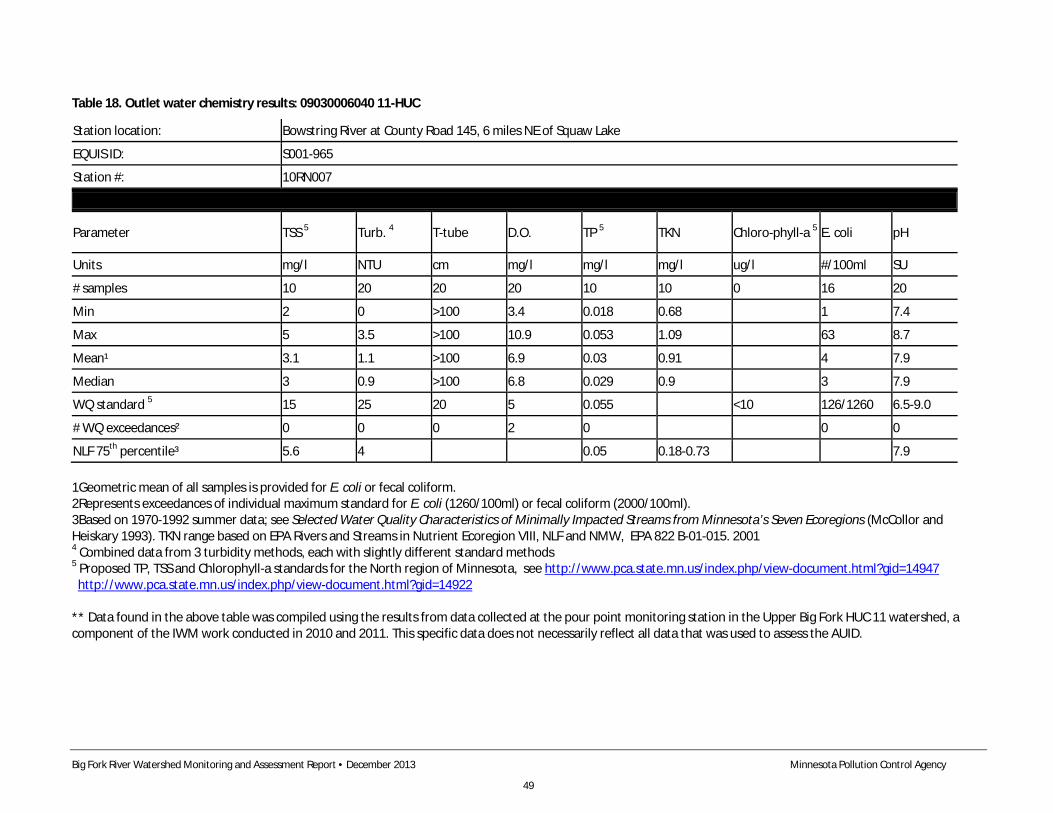
Big Fork River Watershed Monitoring and Assessment Report • December 2013 Minnesota Pollution Control Agency
49
Table 18. Outlet water chemistry results: 09030006040 11-HUC
Station location: Bowstring River at County Road 145, 6 miles NE of Squaw Lake
EQUIS ID: S001-965
Station #: 10RN007
Parameter TSS 5 Turb. 4 T-tube D.O. TP 5 TKN Chloro-phyll-a 5 E. coli pH
Units mg/l NTU cm mg/l mg/l mg/l ug/l #/100ml SU
# samples 10 20 20 20 10 10 0 16 20
Min 2 0 >100 3.4 0.018 0.68 1 7.4
Max 5 3.5 >100 10.9 0.053 1.09 63 8.7
Mean¹ 3.1 1.1 >100 6.9 0.03 0.91 4 7.9
Median 3 0.9 >100 6.8 0.029 0.9 3 7.9
WQ standard 5 15 25 20 5 0.055 <10 126/1260 6.5-9.0
# WQ exceedances² 0 0 0 2 0 0 0
NLF 75th percentile³ 5.6 4 0.05 0.18-0.73 7.9 1Geometric mean of all samples is provided for E. coli or fecal coliform. 2Represents exceedances of individual maximum standard for E. coli (1260/100ml) or fecal coliform (2000/100ml). 3Based on 1970-1992 summer data; see Selected Water Quality Characteristics of Minimally Impacted Streams from Minnesota’s Seven Ecoregions (McCollor and Heiskary 1993). TKN range based on EPA Rivers and Streams in Nutrient Ecoregion VIII, NLF and NMW, EPA 822 B-01-015. 2001 4 Combined data from 3 turbidity methods, each with slightly different standard methods 5 Proposed TP, TSS and Chlorophyll-a standards for the North region of Minnesota, see http://www.pca.state.mn.us/index.php/view-document.html?gid=14947 http://www.pca.state.mn.us/index.php/view-document.html?gid=14922 ** Data found in the above table was compiled using the results from data collected at the pour point monitoring station in the Upper Big Fork HUC 11 watershed, a component of the IWM work conducted in 2010 and 2011. This specific data does not necessarily reflect all data that was used to assess the AUID.
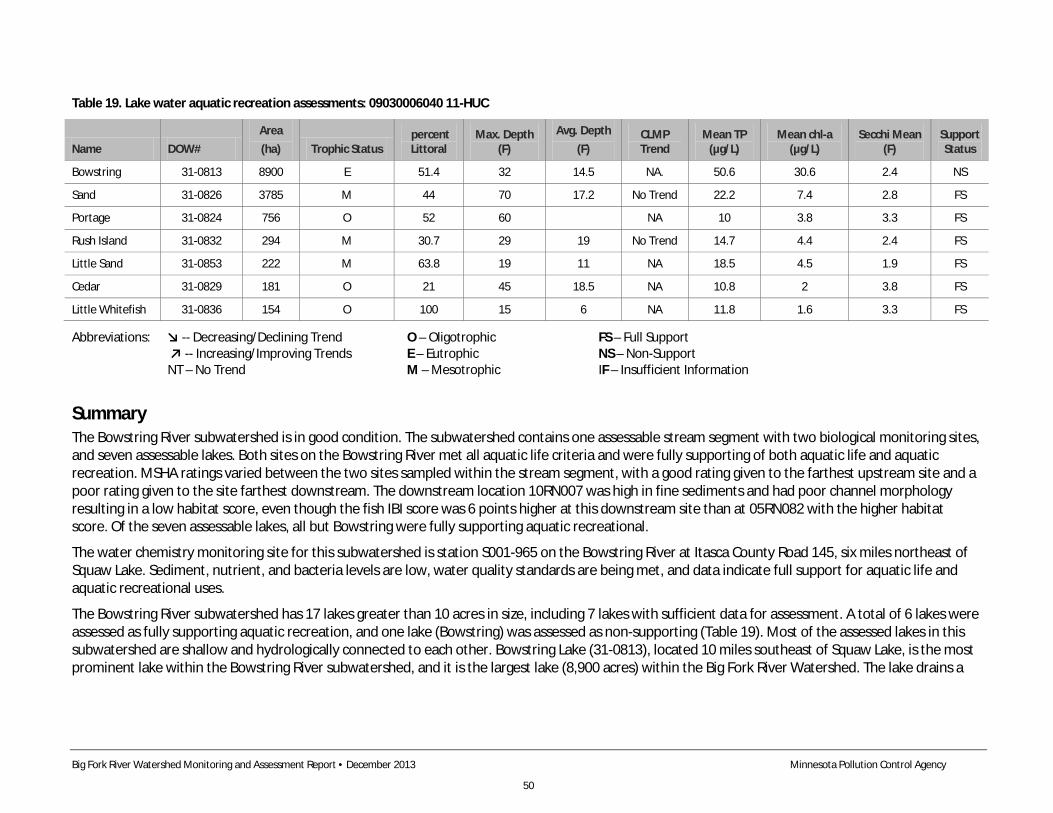
Big Fork River Watershed Monitoring and Assessment Report • December 2013 Minnesota Pollution Control Agency
50
Table 19. Lake water aquatic recreation assessments: 09030006040 11-HUC
Name DOW# Area (ha) Trophic Status
percent Littoral
Max. Depth (F)
Avg. Depth (F)
CLMP Trend
Mean TP (µg/L)
Mean chl-a (µg/L)
Secchi Mean (F)
Support Status
Bowstring 31-0813 8900 E 51.4 32 14.5 NA. 50.6 30.6 2.4 NS
Sand 31-0826 3785 M 44 70 17.2 No Trend 22.2 7.4 2.8 FS
Portage 31-0824 756 O 52 60 NA 10 3.8 3.3 FS
Rush Island 31-0832 294 M 30.7 29 19 No Trend 14.7 4.4 2.4 FS
Little Sand 31-0853 222 M 63.8 19 11 NA 18.5 4.5 1.9 FS
Cedar 31-0829 181 O 21 45 18.5 NA 10.8 2 3.8 FS
Little Whitefish 31-0836 154 O 100 15 6 NA 11.8 1.6 3.3 FS
Abbreviations: ↘ -- Decreasing/Declining Trend O – Oligotrophic FS – Full Support ↗ -- Increasing/Improving Trends E – Eutrophic NS – Non-Support NT – No Trend M – Mesotrophic IF – Insufficient Information
Summary The Bowstring River subwatershed is in good condition. The subwatershed contains one assessable stream segment with two biological monitoring sites, and seven assessable lakes. Both sites on the Bowstring River met all aquatic life criteria and were fully supporting of both aquatic life and aquatic recreation. MSHA ratings varied between the two sites sampled within the stream segment, with a good rating given to the farthest upstream site and a poor rating given to the site farthest downstream. The downstream location 10RN007 was high in fine sediments and had poor channel morphology resulting in a low habitat score, even though the fish IBI score was 6 points higher at this downstream site than at 05RN082 with the higher habitat score. Of the seven assessable lakes, all but Bowstring were fully supporting aquatic recreational.
The water chemistry monitoring site for this subwatershed is station S001-965 on the Bowstring River at Itasca County Road 145, six miles northeast of Squaw Lake. Sediment, nutrient, and bacteria levels are low, water quality standards are being met, and data indicate full support for aquatic life and aquatic recreational uses.
The Bowstring River subwatershed has 17 lakes greater than 10 acres in size, including 7 lakes with sufficient data for assessment. A total of 6 lakes were assessed as fully supporting aquatic recreation, and one lake (Bowstring) was assessed as non-supporting (Table 19). Most of the assessed lakes in this subwatershed are shallow and hydrologically connected to each other. Bowstring Lake (31-0813), located 10 miles southeast of Squaw Lake, is the most prominent lake within the Bowstring River subwatershed, and it is the largest lake (8,900 acres) within the Big Fork River Watershed. The lake drains a
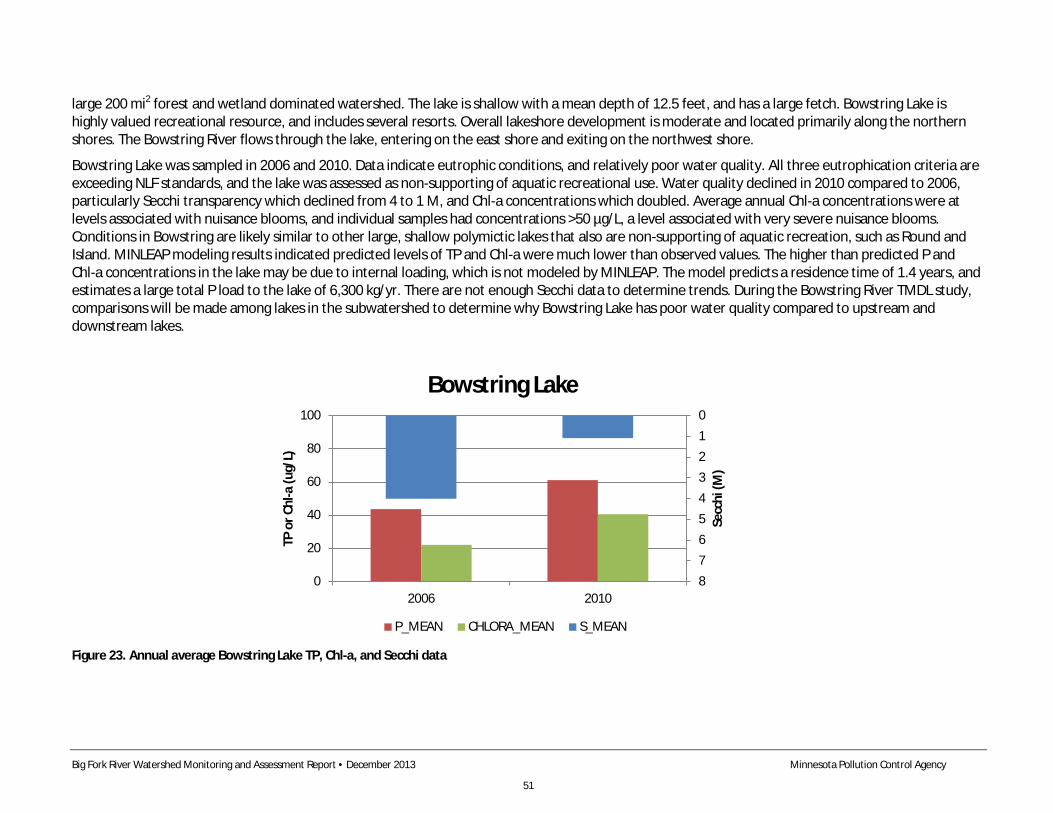
Big Fork River Watershed Monitoring and Assessment Report • December 2013 Minnesota Pollution Control Agency
51
large 200 mi2 forest and wetland dominated watershed. The lake is shallow with a mean depth of 12.5 feet, and has a large fetch. Bowstring Lake is highly valued recreational resource, and includes several resorts. Overall lakeshore development is moderate and located primarily along the northern shores. The Bowstring River flows through the lake, entering on the east shore and exiting on the northwest shore.
Bowstring Lake was sampled in 2006 and 2010. Data indicate eutrophic conditions, and relatively poor water quality. All three eutrophication criteria are exceeding NLF standards, and the lake was assessed as non-supporting of aquatic recreational use. Water quality declined in 2010 compared to 2006, particularly Secchi transparency which declined from 4 to 1 M, and Chl-a concentrations which doubled. Average annual Chl-a concentrations were at levels associated with nuisance blooms, and individual samples had concentrations >50 µg/L, a level associated with very severe nuisance blooms. Conditions in Bowstring are likely similar to other large, shallow polymictic lakes that also are non-supporting of aquatic recreation, such as Round and Island. MINLEAP modeling results indicated predicted levels of TP and Chl-a were much lower than observed values. The higher than predicted P and Chl-a concentrations in the lake may be due to internal loading, which is not modeled by MINLEAP. The model predicts a residence time of 1.4 years, and estimates a large total P load to the lake of 6,300 kg/yr. There are not enough Secchi data to determine trends. During the Bowstring River TMDL study, comparisons will be made among lakes in the subwatershed to determine why Bowstring Lake has poor water quality compared to upstream and downstream lakes.
Figure 23. Annual average Bowstring Lake TP, Chl-a, and Secchi data
0123456780
20
40
60
80
100
2006 2010
Secc
hi (M
)
TP o
r Chl
-a (u
g/L)
Bowstring Lake
P_MEAN CHLORA_MEAN S_MEAN
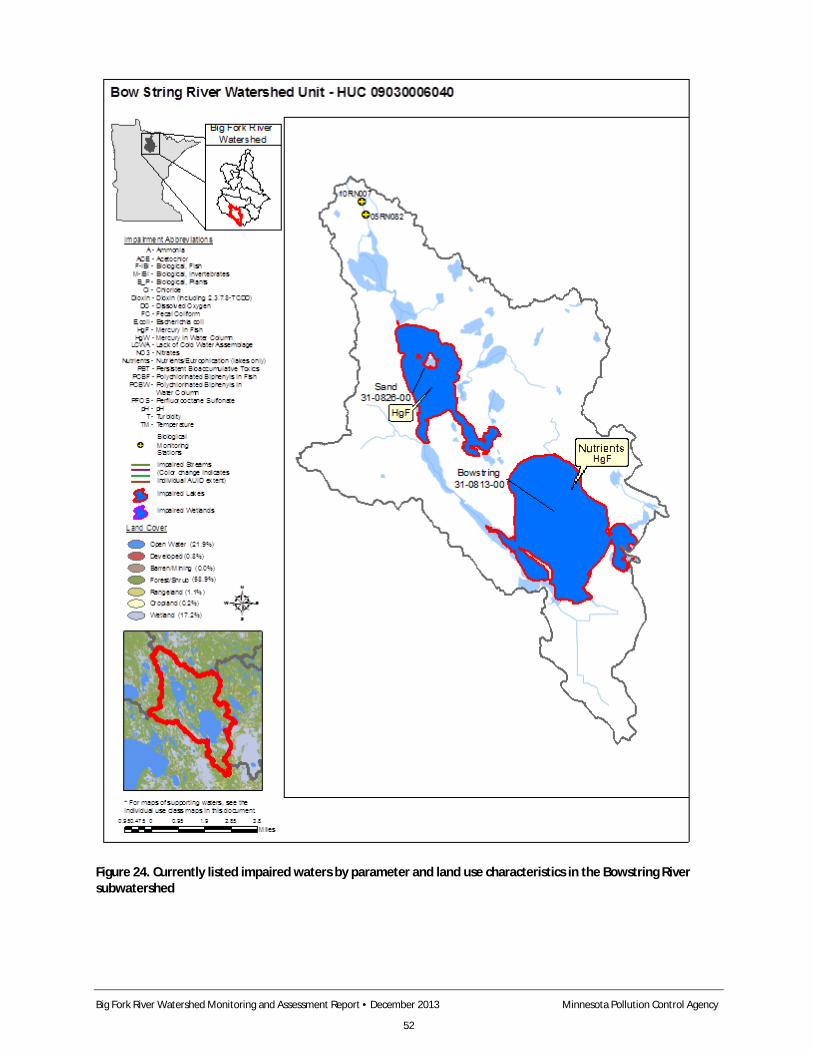
Big Fork River Watershed Monitoring and Assessment Report • December 2013 Minnesota Pollution Control Agency
52
Figure 24. Currently listed impaired waters by parameter and land use characteristics in the Bowstring River subwatershed
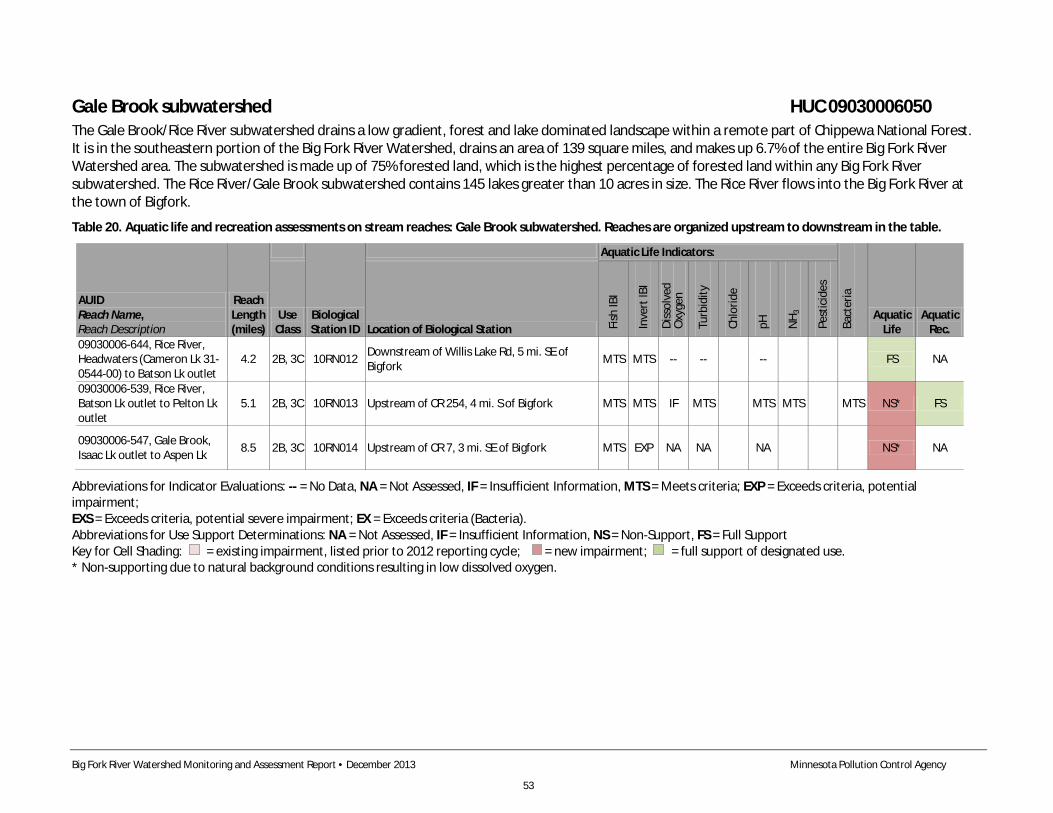
Big Fork River Watershed Monitoring and Assessment Report • December 2013 Minnesota Pollution Control Agency
53
Gale Brook subwatershed HUC 09030006050 The Gale Brook/Rice River subwatershed drains a low gradient, forest and lake dominated landscape within a remote part of Chippewa National Forest. It is in the southeastern portion of the Big Fork River Watershed, drains an area of 139 square miles, and makes up 6.7% of the entire Big Fork River Watershed area. The subwatershed is made up of 75% forested land, which is the highest percentage of forested land within any Big Fork River subwatershed. The Rice River/Gale Brook subwatershed contains 145 lakes greater than 10 acres in size. The Rice River flows into the Big Fork River at the town of Bigfork.
Table 20. Aquatic life and recreation assessments on stream reaches: Gale Brook subwatershed. Reaches are organized upstream to downstream in the table.
AUID Reach Name, Reach Description
Reach Length (miles)
Biological Station ID
Aquatic Life Indicators:
Bact
eria
Aquatic Life
Aquatic Rec.
Use Class Location of Biological Station Fi
sh IB
I
Inve
rt IB
I
Diss
olve
d O
xyge
n
Turb
idity
Chlo
ride
pH
NH 3
Pest
icid
es
09030006-644, Rice River, Headwaters (Cameron Lk 31-0544-00) to Batson Lk outlet
4.2 2B, 3C 10RN012 Downstream of Willis Lake Rd, 5 mi. SE of Bigfork MTS MTS -- -- -- FS NA
09030006-539, Rice River, Batson Lk outlet to Pelton Lk outlet
5.1 2B, 3C 10RN013 Upstream of CR 254, 4 mi. S of Bigfork MTS MTS IF MTS MTS MTS MTS NS* FS
09030006-547, Gale Brook, Isaac Lk outlet to Aspen Lk 8.5 2B, 3C 10RN014 Upstream of CR 7, 3 mi. SE of Bigfork MTS EXP NA NA NA NS* NA
Abbreviations for Indicator Evaluations: -- = No Data, NA = Not Assessed, IF = Insufficient Information, MTS = Meets criteria; EXP = Exceeds criteria, potential impairment; EXS = Exceeds criteria, potential severe impairment; EX = Exceeds criteria (Bacteria). Abbreviations for Use Support Determinations: NA = Not Assessed, IF = Insufficient Information, NS = Non-Support, FS = Full Support Key for Cell Shading: = existing impairment, listed prior to 2012 reporting cycle; = new impairment; = full support of designated use. * Non-supporting due to natural background conditions resulting in low dissolved oxygen.
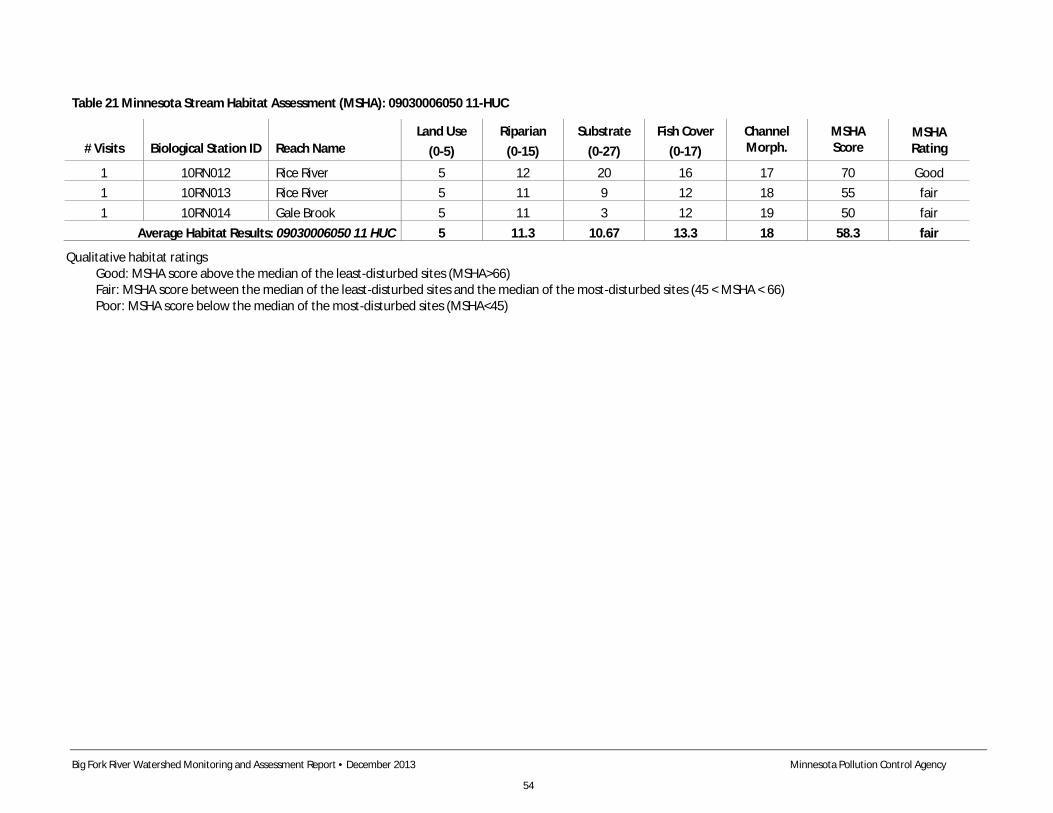
Big Fork River Watershed Monitoring and Assessment Report • December 2013 Minnesota Pollution Control Agency
54
Table 21 Minnesota Stream Habitat Assessment (MSHA): 09030006050 11-HUC
# Visits Biological Station ID Reach Name Land Use
(0-5) Riparian
(0-15) Substrate
(0-27) Fish Cover
(0-17) Channel Morph.
MSHA Score
MSHA Rating
1 10RN012 Rice River 5 12 20 16 17 70 Good 1 10RN013 Rice River 5 11 9 12 18 55 fair 1 10RN014 Gale Brook 5 11 3 12 19 50 fair
Average Habitat Results: 09030006050 11 HUC 5 11.3
10.67 13.3 18 58.3 fair
Qualitative habitat ratings Good: MSHA score above the median of the least-disturbed sites (MSHA>66) Fair: MSHA score between the median of the least-disturbed sites and the median of the most-disturbed sites (45 < MSHA < 66) Poor: MSHA score below the median of the most-disturbed sites (MSHA<45)
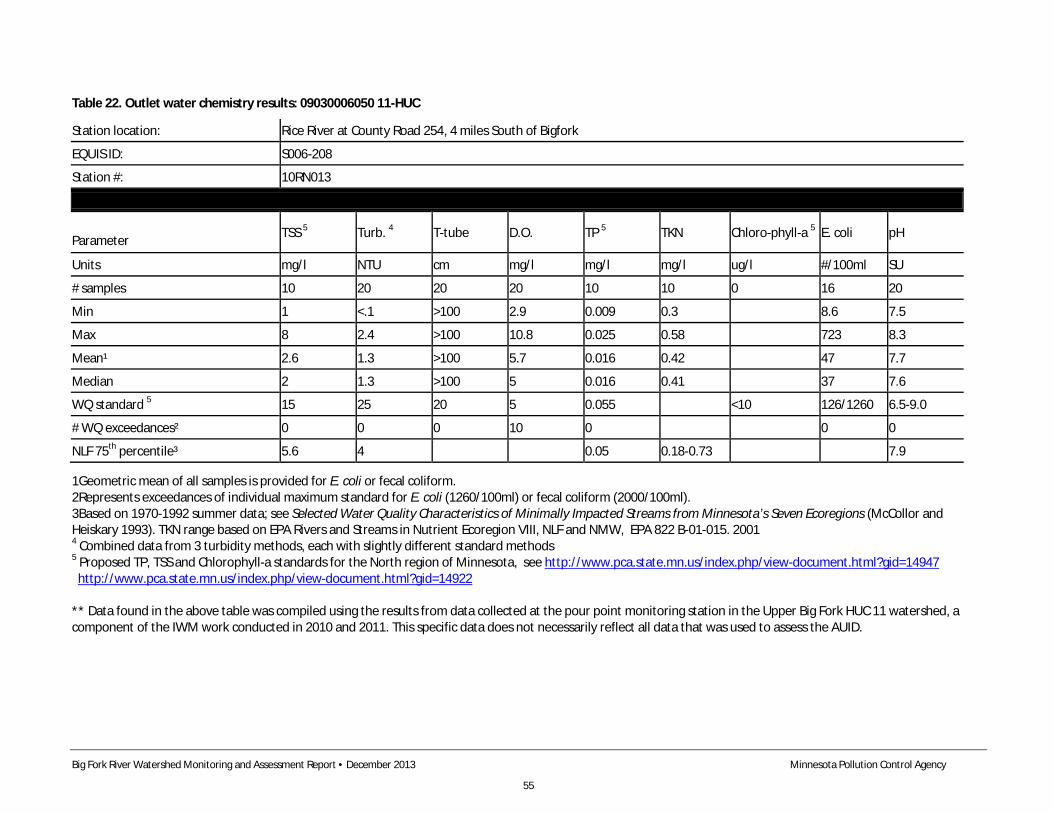
Big Fork River Watershed Monitoring and Assessment Report • December 2013 Minnesota Pollution Control Agency
55
Table 22. Outlet water chemistry results: 09030006050 11-HUC
Station location: Rice River at County Road 254, 4 miles South of Bigfork
EQUIS ID: S006-208
Station #: 10RN013
Parameter TSS 5 Turb. 4 T-tube D.O. TP 5 TKN Chloro-phyll-a 5 E. coli pH
Units mg/l NTU cm mg/l mg/l mg/l ug/l #/100ml SU
# samples 10 20 20 20 10 10 0 16 20
Min 1 <.1 >100 2.9 0.009 0.3 8.6 7.5
Max 8 2.4 >100 10.8 0.025 0.58 723 8.3
Mean¹ 2.6 1.3 >100 5.7 0.016 0.42 47 7.7
Median 2 1.3 >100 5 0.016 0.41 37 7.6
WQ standard 5 15 25 20 5 0.055 <10 126/1260 6.5-9.0
# WQ exceedances² 0 0 0 10 0 0 0
NLF 75th percentile³ 5.6 4 0.05 0.18-0.73 7.9
1Geometric mean of all samples is provided for E. coli or fecal coliform. 2Represents exceedances of individual maximum standard for E. coli (1260/100ml) or fecal coliform (2000/100ml). 3Based on 1970-1992 summer data; see Selected Water Quality Characteristics of Minimally Impacted Streams from Minnesota’s Seven Ecoregions (McCollor and Heiskary 1993). TKN range based on EPA Rivers and Streams in Nutrient Ecoregion VIII, NLF and NMW, EPA 822 B-01-015. 2001 4 Combined data from 3 turbidity methods, each with slightly different standard methods 5 Proposed TP, TSS and Chlorophyll-a standards for the North region of Minnesota, see http://www.pca.state.mn.us/index.php/view-document.html?gid=14947 http://www.pca.state.mn.us/index.php/view-document.html?gid=14922 ** Data found in the above table was compiled using the results from data collected at the pour point monitoring station in the Upper Big Fork HUC 11 watershed, a component of the IWM work conducted in 2010 and 2011. This specific data does not necessarily reflect all data that was used to assess the AUID.
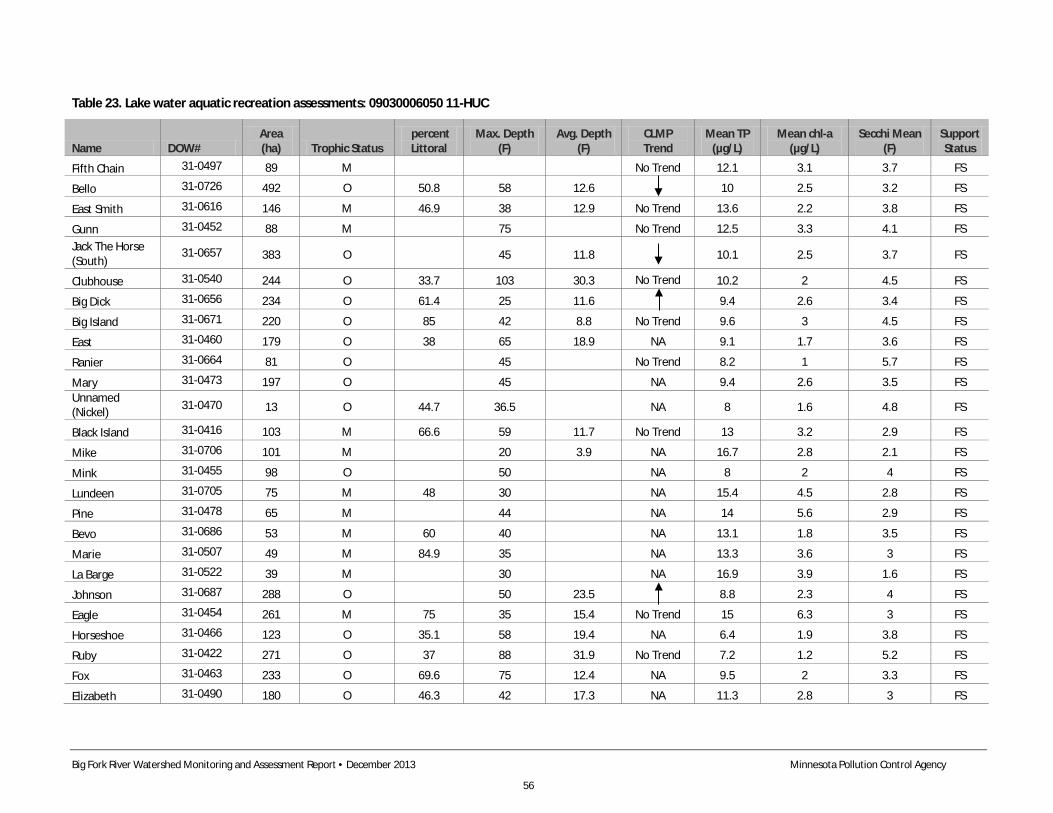
Big Fork River Watershed Monitoring and Assessment Report • December 2013 Minnesota Pollution Control Agency
56
Table 23. Lake water aquatic recreation assessments: 09030006050 11-HUC
Name DOW# Area (ha) Trophic Status
percent Littoral
Max. Depth (F)
Avg. Depth (F)
CLMP Trend
Mean TP (µg/L)
Mean chl-a (µg/L)
Secchi Mean (F)
Support Status
Fifth Chain 31-0497 89 M No Trend 12.1 3.1 3.7 FS
Bello 31-0726 492 O 50.8 58 12.6 10 2.5 3.2 FS
East Smith 31-0616 146 M 46.9 38 12.9 No Trend 13.6 2.2 3.8 FS
Gunn 31-0452 88 M 75 No Trend 12.5 3.3 4.1 FS Jack The Horse (South)
31-0657 383 O 45 11.8 10.1 2.5 3.7 FS
Clubhouse 31-0540 244 O 33.7 103 30.3 No Trend 10.2 2 4.5 FS
Big Dick 31-0656 234 O 61.4 25 11.6 9.4 2.6 3.4 FS
Big Island 31-0671 220 O 85 42 8.8 No Trend 9.6 3 4.5 FS
East 31-0460 179 O 38 65 18.9 NA 9.1 1.7 3.6 FS
Ranier 31-0664 81 O 45 No Trend 8.2 1 5.7 FS
Mary 31-0473 197 O 45 NA 9.4 2.6 3.5 FS Unnamed (Nickel) 31-0470 13 O 44.7 36.5 NA 8 1.6 4.8 FS
Black Island 31-0416 103 M 66.6 59 11.7 No Trend 13 3.2 2.9 FS
Mike 31-0706 101 M 20 3.9 NA 16.7 2.8 2.1 FS
Mink 31-0455 98 O 50 NA 8 2 4 FS
Lundeen 31-0705 75 M 48 30 NA 15.4 4.5 2.8 FS
Pine 31-0478 65 M 44 NA 14 5.6 2.9 FS
Bevo 31-0686 53 M 60 40 NA 13.1 1.8 3.5 FS
Marie 31-0507 49 M 84.9 35 NA 13.3 3.6 3 FS
La Barge 31-0522 39 M 30 NA 16.9 3.9 1.6 FS
Johnson 31-0687 288 O 50 23.5 8.8 2.3 4 FS
Eagle 31-0454 261 M 75 35 15.4 No Trend 15 6.3 3 FS
Horseshoe 31-0466 123 O 35.1 58 19.4 NA 6.4 1.9 3.8 FS
Ruby 31-0422 271 O 37 88 31.9 No Trend 7.2 1.2 5.2 FS
Fox 31-0463 233 O 69.6 75 12.4 NA 9.5 2 3.3 FS
Elizabeth 31-0490 180 O 46.3 42 17.3 NA 11.3 2.8 3 FS
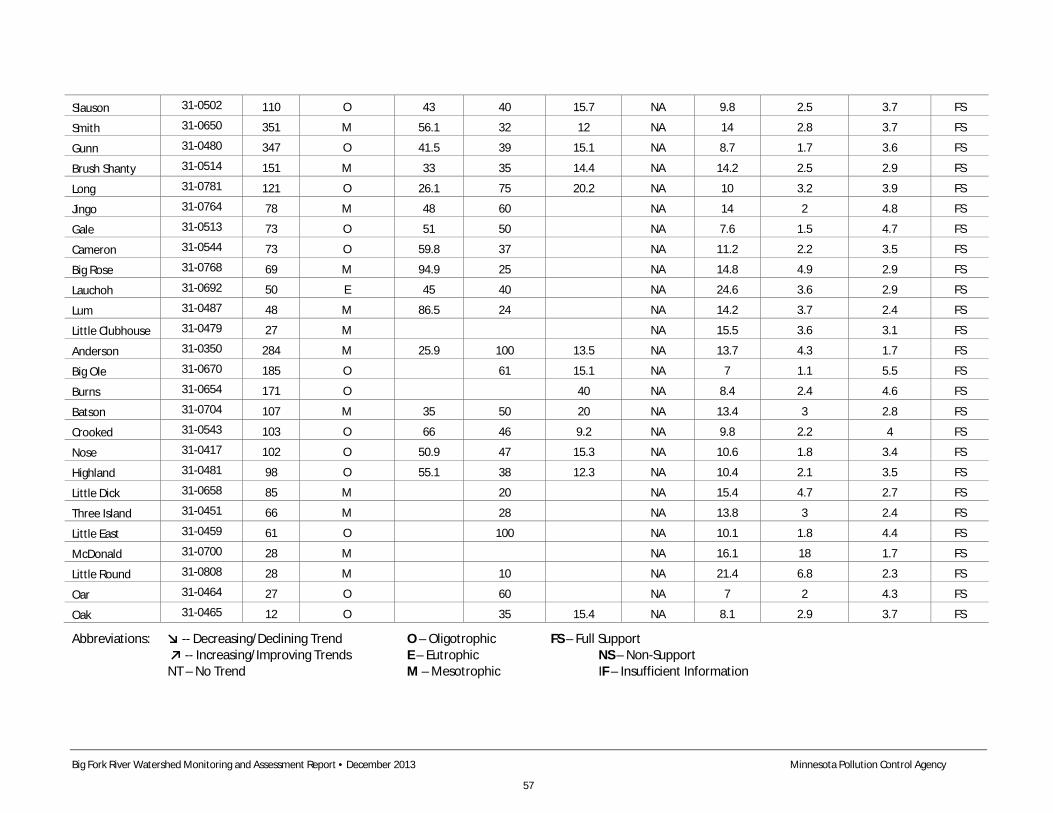
Big Fork River Watershed Monitoring and Assessment Report • December 2013 Minnesota Pollution Control Agency
57
Slauson 31-0502 110 O 43 40 15.7 NA 9.8 2.5 3.7 FS
Smith 31-0650 351 M 56.1 32 12 NA 14 2.8 3.7 FS
Gunn 31-0480 347 O 41.5 39 15.1 NA 8.7 1.7 3.6 FS
Brush Shanty 31-0514 151 M 33 35 14.4 NA 14.2 2.5 2.9 FS
Long 31-0781 121 O 26.1 75 20.2 NA 10 3.2 3.9 FS
Jingo 31-0764 78 M 48 60 NA 14 2 4.8 FS
Gale 31-0513 73 O 51 50 NA 7.6 1.5 4.7 FS
Cameron 31-0544 73 O 59.8 37 NA 11.2 2.2 3.5 FS
Big Rose 31-0768 69 M 94.9 25 NA 14.8 4.9 2.9 FS
Lauchoh 31-0692 50 E 45 40 NA 24.6 3.6 2.9 FS
Lum 31-0487 48 M 86.5 24 NA 14.2 3.7 2.4 FS
Little Clubhouse 31-0479 27 M NA 15.5 3.6 3.1 FS
Anderson 31-0350 284 M 25.9 100 13.5 NA 13.7 4.3 1.7 FS
Big Ole 31-0670 185 O 61 15.1 NA 7 1.1 5.5 FS
Burns 31-0654 171 O 40 NA 8.4 2.4 4.6 FS
Batson 31-0704 107 M 35 50 20 NA 13.4 3 2.8 FS
Crooked 31-0543 103 O 66 46 9.2 NA 9.8 2.2 4 FS
Nose 31-0417 102 O 50.9 47 15.3 NA 10.6 1.8 3.4 FS
Highland 31-0481 98 O 55.1 38 12.3 NA 10.4 2.1 3.5 FS
Little Dick 31-0658 85 M 20 NA 15.4 4.7 2.7 FS
Three Island 31-0451 66 M 28 NA 13.8 3 2.4 FS
Little East 31-0459 61 O 100 NA 10.1 1.8 4.4 FS
McDonald 31-0700 28 M NA 16.1 18 1.7 FS
Little Round 31-0808 28 M 10 NA 21.4 6.8 2.3 FS
Oar 31-0464 27 O 60 NA 7 2 4.3 FS
Oak 31-0465 12 O 35 15.4 NA 8.1 2.9 3.7 FS
Abbreviations: ↘ -- Decreasing/Declining Trend O – Oligotrophic FS – Full Support ↗ -- Increasing/Improving Trends E – Eutrophic NS – Non-Support NT – No Trend M – Mesotrophic IF – Insufficient Information
Big Fork River Watershed Monitoring and Assessment Report • December 2013 Minnesota Pollution Control Agency
58
Summary The Gale Brook subwatershed contains three assessable stream segments and 52 assessable lakes. All three stream segments were found to meet fish indicator criteria, and all but Gale Brook met macroinvertebrate criteria. The stream segment on the Rice River associated with 10RN013 was listed as not meeting aquatic life standards because 10 of the 20 DO samples fell below the 5 mg/L standard. The lone Gale Brook AUID was listed as not meeting aquatic life criteria because it did not meet macroinvertebrate criteria. For both of these stream segments the failure to meet aquatic life standards was deemed natural due to wetland conditions. Anthropogenic impact is minimal in this remote portion of Chippewa National Forest, and there is a strong wetland influence in the stream and the adjacent riparian zone. The data and watershed characteristics strongly support a natural background cause for the aquatic life impairments. Similar to the biology and chemistry results, habitat is also strongly influenced by adjacent wetlands. The overall habitat conditions were fair to good. Fine substrates related to the prevailing wetland conditions of this subwatershed contributed to the lower scores at some sites.
The water chemistry monitoring site for this watershed is station S006-208 on the Rice River at Itasca County Road 254, 4 miles south of Bigfork. Gale Brook comes in downstream of the monitoring site but water chemistry samples were not taken from Gale Brook during IWM. The concentrations of water quality parameters such as nutrients, sediment, and turbidity and bacteria were low, with zero exceedances. In general, data indicate excellent water quality in the Rice River subwatershed, reflective of the forest and wetland dominated landscape.
The Gale Brook watershed is a lake-rich landscape within Chippewa National Forest, with 107 lakes greater than 10 acres. A total of 52 lakes have sufficient data for assessment, and all fully support aquatic recreational use. As expected, lake water quality is very good throughout the subwatershed. Most assessed lakes have seepage hydrology and as such, drain very small forested watersheds within isolated basins.
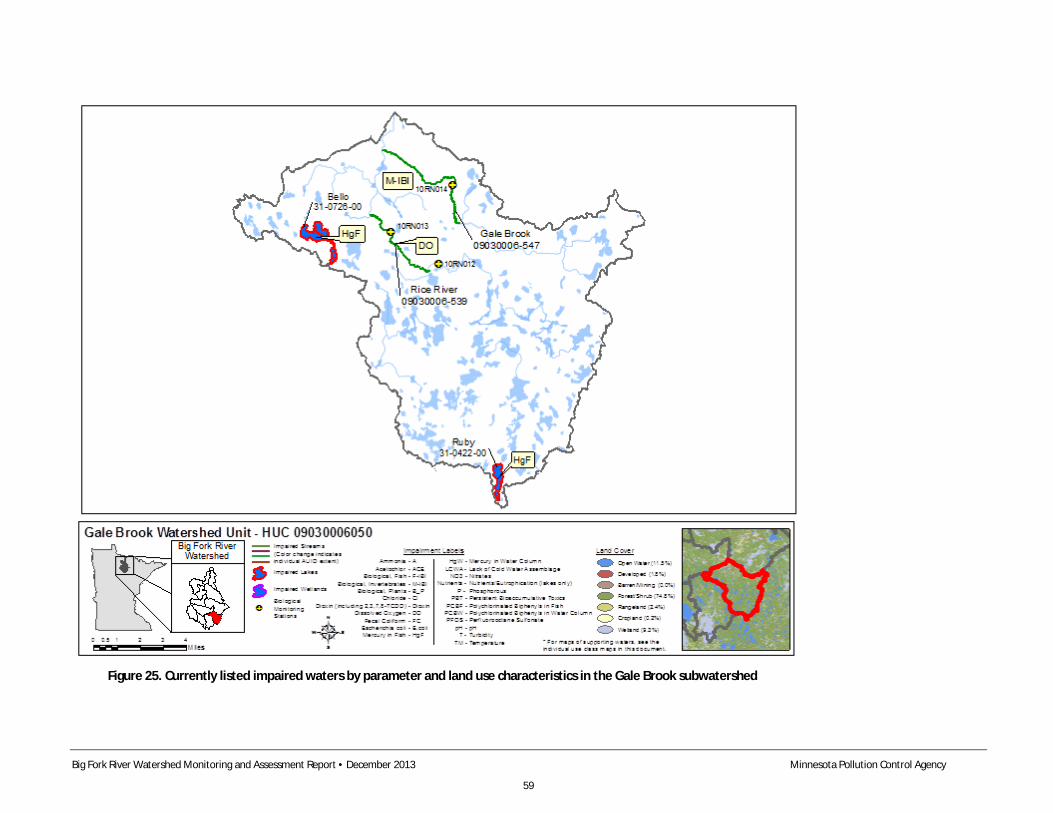
Big Fork River Watershed Monitoring and Assessment Report • December 2013 Minnesota Pollution Control Agency
59
Figure 25. Currently listed impaired waters by parameter and land use characteristics in the Gale Brook subwatershed
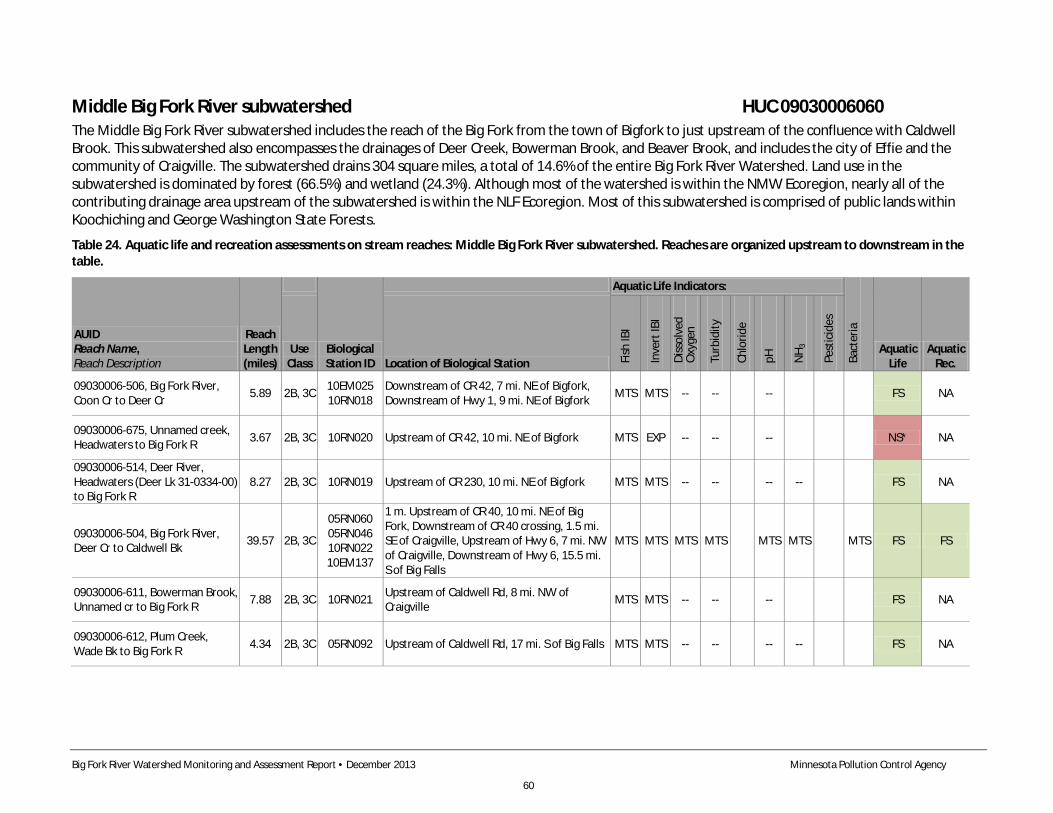
Big Fork River Watershed Monitoring and Assessment Report • December 2013 Minnesota Pollution Control Agency
60
Middle Big Fork River subwatershed HUC 09030006060 The Middle Big Fork River subwatershed includes the reach of the Big Fork from the town of Bigfork to just upstream of the confluence with Caldwell Brook. This subwatershed also encompasses the drainages of Deer Creek, Bowerman Brook, and Beaver Brook, and includes the city of Effie and the community of Craigville. The subwatershed drains 304 square miles, a total of 14.6% of the entire Big Fork River Watershed. Land use in the subwatershed is dominated by forest (66.5%) and wetland (24.3%). Although most of the watershed is within the NMW Ecoregion, nearly all of the contributing drainage area upstream of the subwatershed is within the NLF Ecoregion. Most of this subwatershed is comprised of public lands within Koochiching and George Washington State Forests.
Table 24. Aquatic life and recreation assessments on stream reaches: Middle Big Fork River subwatershed. Reaches are organized upstream to downstream in the table.
AUID Reach Name, Reach Description
Reach Length (miles)
Biological Station ID
Aquatic Life Indicators:
Bact
eria
Aquatic Life
Aquatic Rec.
Use Class Location of Biological Station Fi
sh IB
I
Inve
rt IB
I
Diss
olve
d O
xyge
n
Turb
idity
Chlo
ride
pH
NH 3
Pest
icid
es
09030006-506, Big Fork River, Coon Cr to Deer Cr 5.89 2B, 3C 10EM025
10RN018 Downstream of CR 42, 7 mi. NE of Bigfork, Downstream of Hwy 1, 9 mi. NE of Bigfork MTS MTS -- -- -- FS NA
09030006-675, Unnamed creek, Headwaters to Big Fork R 3.67 2B, 3C 10RN020 Upstream of CR 42, 10 mi. NE of Bigfork MTS EXP -- -- -- NS* NA
09030006-514, Deer River, Headwaters (Deer Lk 31-0334-00) to Big Fork R
8.27 2B, 3C 10RN019 Upstream of CR 230, 10 mi. NE of Bigfork MTS MTS -- -- -- -- FS NA
09030006-504, Big Fork River, Deer Cr to Caldwell Bk 39.57 2B, 3C
05RN060 05RN046 10RN022 10EM137
1 m. Upstream of CR 40, 10 mi. NE of Big Fork, Downstream of CR 40 crossing, 1.5 mi. SE of Craigville, Upstream of Hwy 6, 7 mi. NW of Craigville, Downstream of Hwy 6, 15.5 mi. S of Big Falls
MTS MTS MTS MTS MTS MTS MTS FS FS
09030006-611, Bowerman Brook, Unnamed cr to Big Fork R 7.88 2B, 3C 10RN021 Upstream of Caldwell Rd, 8 mi. NW of
Craigville MTS MTS -- -- -- FS NA
09030006-612, Plum Creek, Wade Bk to Big Fork R 4.34 2B, 3C 05RN092 Upstream of Caldwell Rd, 17 mi. S of Big Falls MTS MTS -- -- -- -- FS NA
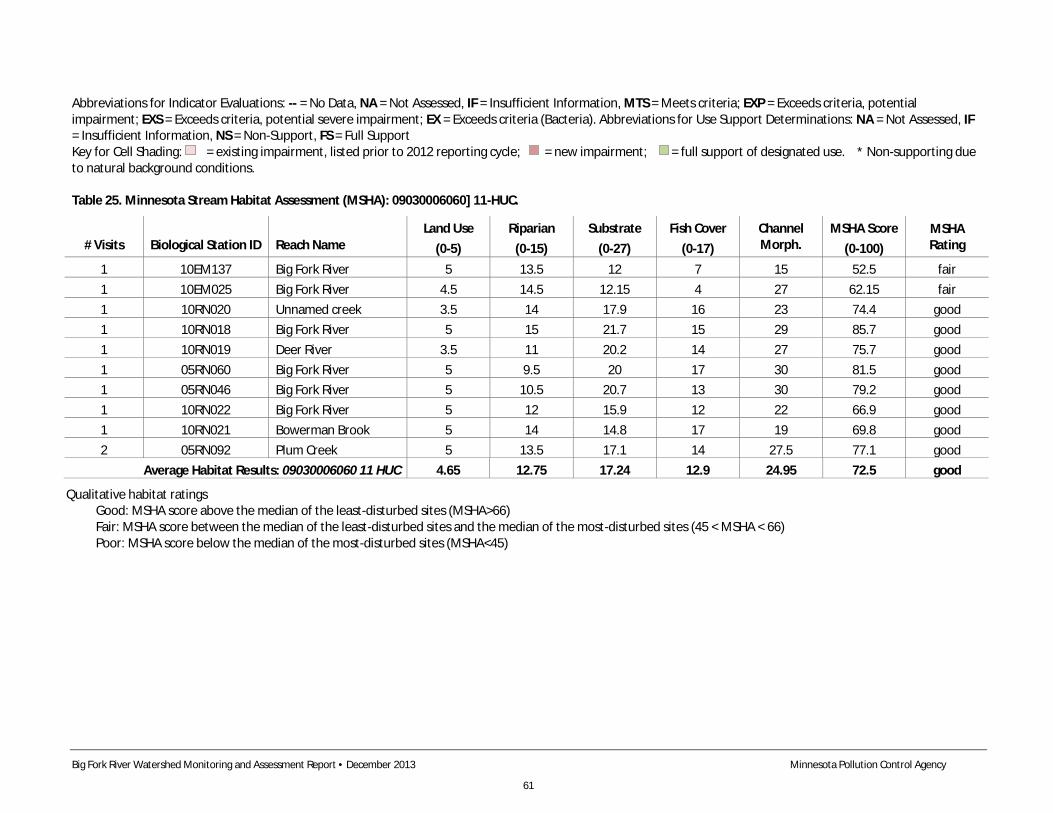
Big Fork River Watershed Monitoring and Assessment Report • December 2013 Minnesota Pollution Control Agency
61
Abbreviations for Indicator Evaluations: -- = No Data, NA = Not Assessed, IF = Insufficient Information, MTS = Meets criteria; EXP = Exceeds criteria, potential impairment; EXS = Exceeds criteria, potential severe impairment; EX = Exceeds criteria (Bacteria). Abbreviations for Use Support Determinations: NA = Not Assessed, IF = Insufficient Information, NS = Non-Support, FS = Full Support Key for Cell Shading: = existing impairment, listed prior to 2012 reporting cycle; = new impairment; = full support of designated use. * Non-supporting due to natural background conditions.
Table 25. Minnesota Stream Habitat Assessment (MSHA): 09030006060] 11-HUC.
# Visits Biological Station ID Reach Name Land Use
(0-5) Riparian
(0-15) Substrate
(0-27) Fish Cover
(0-17) Channel Morph.
MSHA Score (0-100)
MSHA Rating
1 10EM137 Big Fork River 5 13.5 12 7 15 52.5 fair 1 10EM025 Big Fork River 4.5 14.5 12.15 4 27 62.15 fair 1 10RN020 Unnamed creek 3.5 14 17.9 16 23 74.4 good 1 10RN018 Big Fork River 5 15 21.7 15 29 85.7 good 1 10RN019 Deer River 3.5 11 20.2 14 27 75.7 good 1 05RN060 Big Fork River 5 9.5 20 17 30 81.5 good 1 05RN046 Big Fork River 5 10.5 20.7 13 30 79.2 good 1 10RN022 Big Fork River 5 12 15.9 12 22 66.9 good 1 10RN021 Bowerman Brook 5 14 14.8 17 19 69.8 good 2 05RN092 Plum Creek 5 13.5 17.1 14 27.5 77.1 good
Average Habitat Results: 09030006060 11 HUC 4.65 12.75 17.24 12.9 24.95 72.5 good
Qualitative habitat ratings Good: MSHA score above the median of the least-disturbed sites (MSHA>66) Fair: MSHA score between the median of the least-disturbed sites and the median of the most-disturbed sites (45 < MSHA < 66) Poor: MSHA score below the median of the most-disturbed sites (MSHA<45)
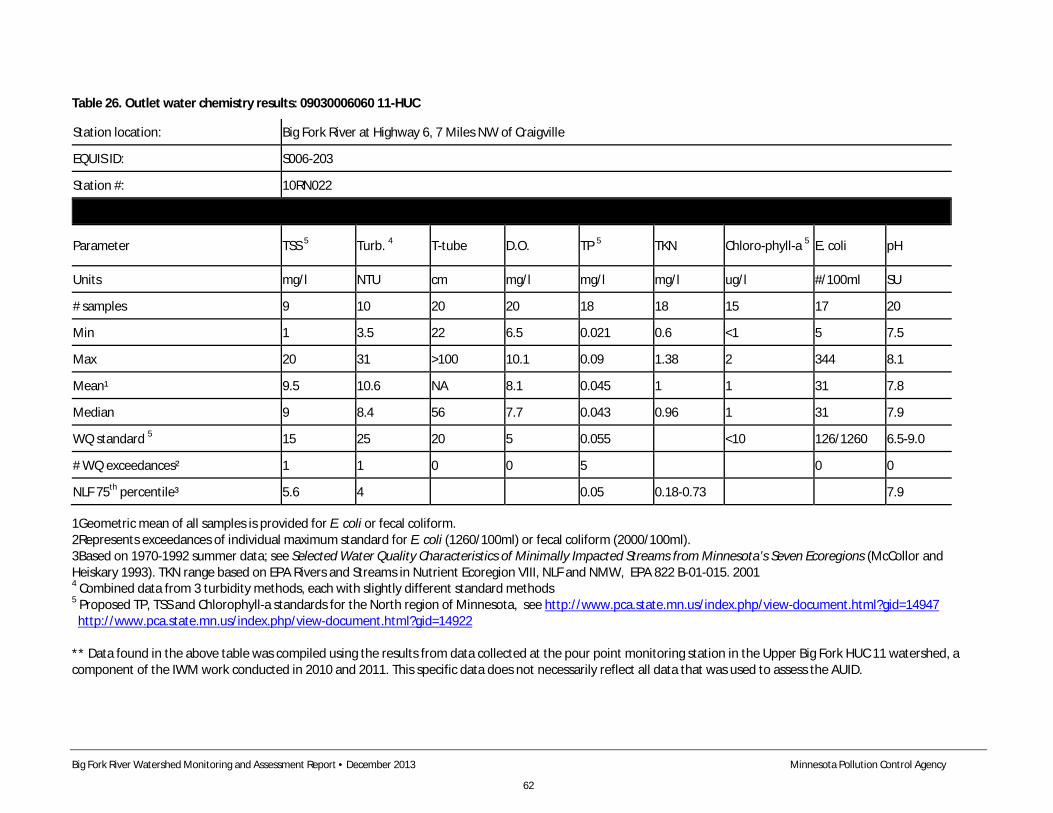
Big Fork River Watershed Monitoring and Assessment Report • December 2013 Minnesota Pollution Control Agency
62
Table 26. Outlet water chemistry results: 09030006060 11-HUC
Station location: Big Fork River at Highway 6, 7 Miles NW of Craigville
EQUIS ID: S006-203
Station #: 10RN022
Parameter TSS 5 Turb. 4 T-tube D.O. TP 5 TKN Chloro-phyll-a 5 E. coli pH
Units mg/l NTU cm mg/l mg/l mg/l ug/l #/100ml SU
# samples 9 10 20 20 18 18 15 17 20
Min 1 3.5 22 6.5 0.021 0.6 <1 5 7.5
Max 20 31 >100 10.1 0.09 1.38 2 344 8.1
Mean¹ 9.5 10.6 NA 8.1 0.045 1 1 31 7.8
Median 9 8.4 56 7.7 0.043 0.96 1 31 7.9
WQ standard 5 15 25 20 5 0.055 <10 126/1260 6.5-9.0
# WQ exceedances² 1 1 0 0 5 0 0
NLF 75th percentile³ 5.6 4 0.05 0.18-0.73 7.9
1Geometric mean of all samples is provided for E. coli or fecal coliform. 2Represents exceedances of individual maximum standard for E. coli (1260/100ml) or fecal coliform (2000/100ml). 3Based on 1970-1992 summer data; see Selected Water Quality Characteristics of Minimally Impacted Streams from Minnesota’s Seven Ecoregions (McCollor and Heiskary 1993). TKN range based on EPA Rivers and Streams in Nutrient Ecoregion VIII, NLF and NMW, EPA 822 B-01-015. 2001 4 Combined data from 3 turbidity methods, each with slightly different standard methods 5 Proposed TP, TSS and Chlorophyll-a standards for the North region of Minnesota, see http://www.pca.state.mn.us/index.php/view-document.html?gid=14947 http://www.pca.state.mn.us/index.php/view-document.html?gid=14922 ** Data found in the above table was compiled using the results from data collected at the pour point monitoring station in the Upper Big Fork HUC 11 watershed, a component of the IWM work conducted in 2010 and 2011. This specific data does not necessarily reflect all data that was used to assess the AUID.
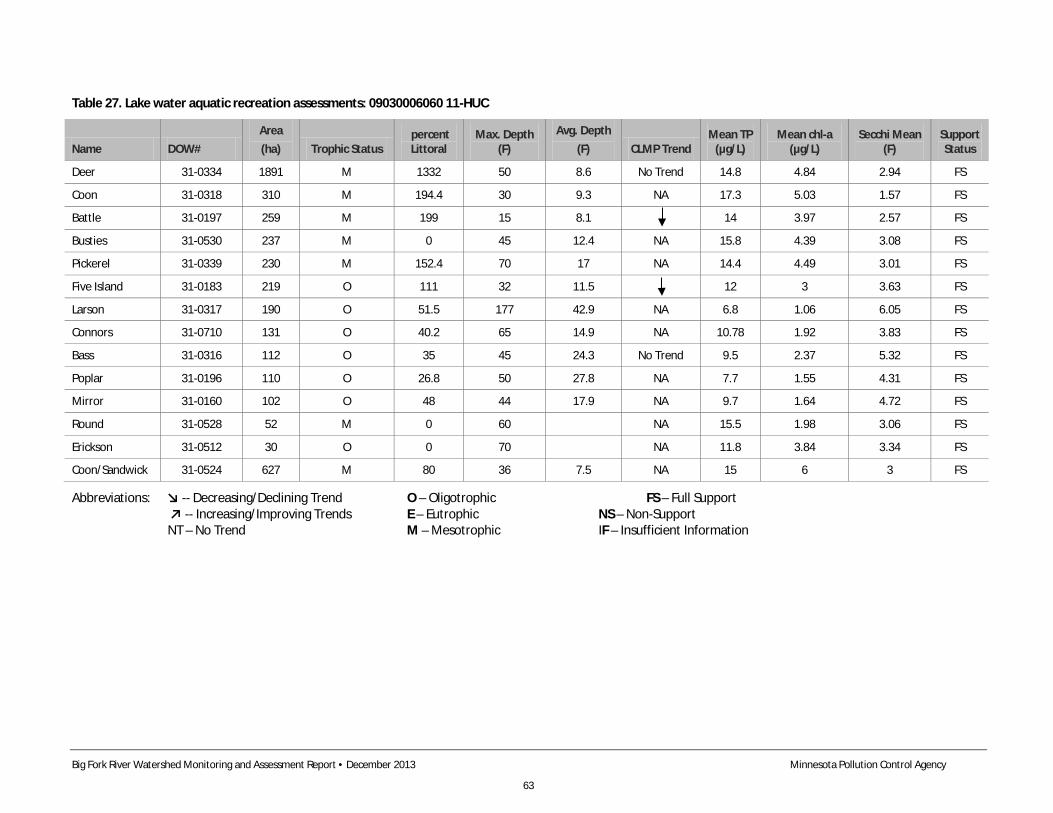
Big Fork River Watershed Monitoring and Assessment Report • December 2013 Minnesota Pollution Control Agency
63
Table 27. Lake water aquatic recreation assessments: 09030006060 11-HUC
Name DOW# Area (ha) Trophic Status
percent Littoral
Max. Depth (F)
Avg. Depth (F) CLMP Trend
Mean TP (µg/L)
Mean chl-a (µg/L)
Secchi Mean (F)
Support Status
Deer 31-0334 1891 M 1332 50 8.6 No Trend 14.8 4.84 2.94 FS
Coon 31-0318 310 M 194.4 30 9.3 NA 17.3 5.03 1.57 FS
Battle 31-0197 259 M 199 15 8.1 14 3.97 2.57 FS
Busties 31-0530 237 M 0 45 12.4 NA 15.8 4.39 3.08 FS
Pickerel 31-0339 230 M 152.4 70 17 NA 14.4 4.49 3.01 FS
Five Island 31-0183 219 O 111 32 11.5 12 3 3.63 FS
Larson 31-0317 190 O 51.5 177 42.9 NA 6.8 1.06 6.05 FS
Connors 31-0710 131 O 40.2 65 14.9 NA 10.78 1.92 3.83 FS
Bass 31-0316 112 O 35 45 24.3 No Trend 9.5 2.37 5.32 FS
Poplar 31-0196 110 O 26.8 50 27.8 NA 7.7 1.55 4.31 FS
Mirror 31-0160 102 O 48 44 17.9 NA 9.7 1.64 4.72 FS
Round 31-0528 52 M 0 60 NA 15.5 1.98 3.06 FS
Erickson 31-0512 30 O 0 70 NA 11.8 3.84 3.34 FS
Coon/Sandwick 31-0524 627 M 80 36 7.5 NA 15 6 3 FS
Abbreviations: ↘ -- Decreasing/Declining Trend O – Oligotrophic FS – Full Support ↗ -- Increasing/Improving Trends E – Eutrophic NS – Non-Support NT – No Trend M – Mesotrophic IF – Insufficient Information
Big Fork River Watershed Monitoring and Assessment Report • December 2013 Minnesota Pollution Control Agency
64
Summary The Middle Big Fork River subwatershed has 10 assessable sites on 6 assessable AUIDs. Nearly all of the sites met the biological expectations indicating good water quality. One exception to this pattern was at site 10RN020, an unnamed creek on a small tributary to the Big Fork River where the macroinvertebrate assemblage was impaired. The impairment was likely due natural conditions created from vast amounts of wetlands and beaver dams upstream of the site. Within this subwatershed the Big Fork River contained the highest IBI scores for macroinvertebrates and fish. Smaller tributary sites had slightly lower scores but they still met the biological criteria. Habitat was uniformly in good condition except for two sites that rated fair, both on the Big Fork River. These sites scored lower due to more homogenous substrates and channel morphology, as well as poor fish cover.
The water chemistry monitoring site for this watershed is station S006-203 on the Big Fork River at Minnesota Highway 6, 7 miles northwest of Craigville. Data indicate good water quality. Sediment, nutrient, and bacteria levels are low and reflective of the forest and wetland dominated landscape. A total of 5 of 18 samples exceeded the proposed phosphorus standard for northern Minnesota (0.055 mg/L); however, most exceedances were minor, and were within the expected range of samples from streams within the NMW Ecoregion. Bacteria data collected by the Big Fork River Board River Watch program indicated support for aquatic recreation and corroborate the assessment-level data collected at the Highway 6 site.
The Middle Big Fork River subwatershed contains 52 lakes greater than 10 acres, and 15 of these lakes have sufficient data for assessment. All 15 lakes fully support aquatic recreational use. Most assessed lakes are located in a forested landscape within the public lands of George Washington State Forest. As such, lake resources in this subwatershed are of high quality. Most of the assessed lakes drain the Deer Creek subwatershed. Two additional high quality waters are Coon and Sandwick Lakes within Scenic State Park.
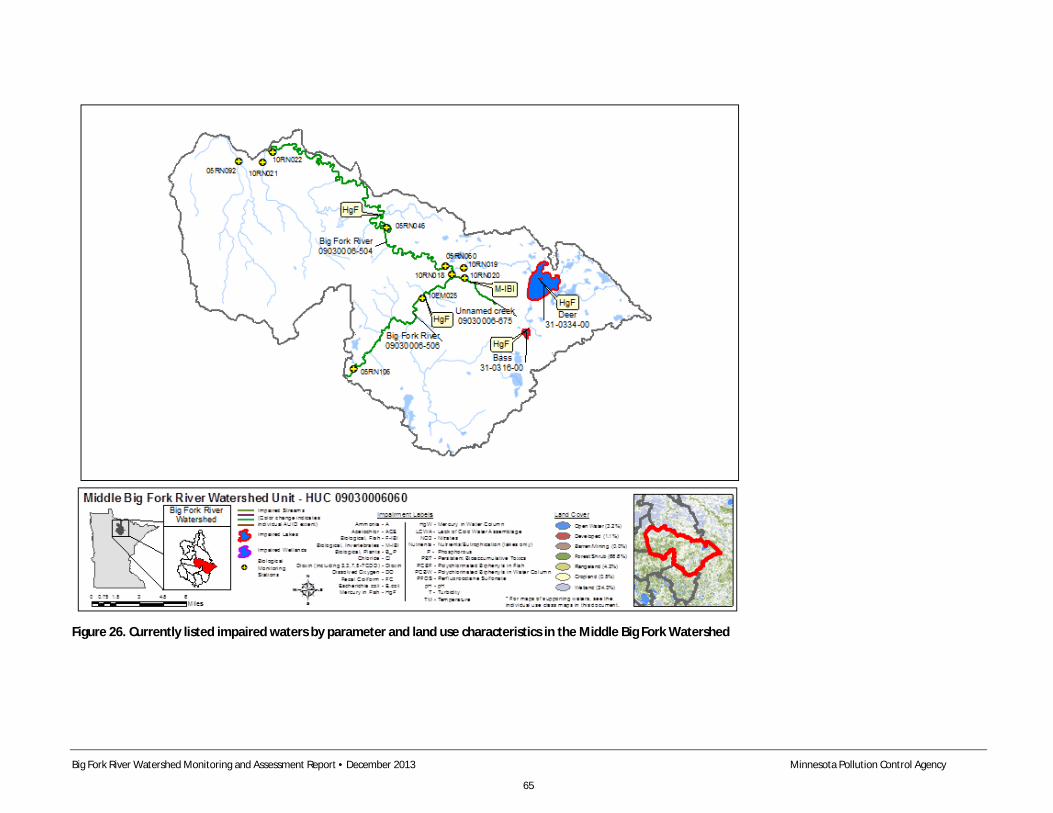
Big Fork River Watershed Monitoring and Assessment Report • December 2013 Minnesota Pollution Control Agency
65
Figure 26. Currently listed impaired waters by parameter and land use characteristics in the Middle Big Fork Watershed
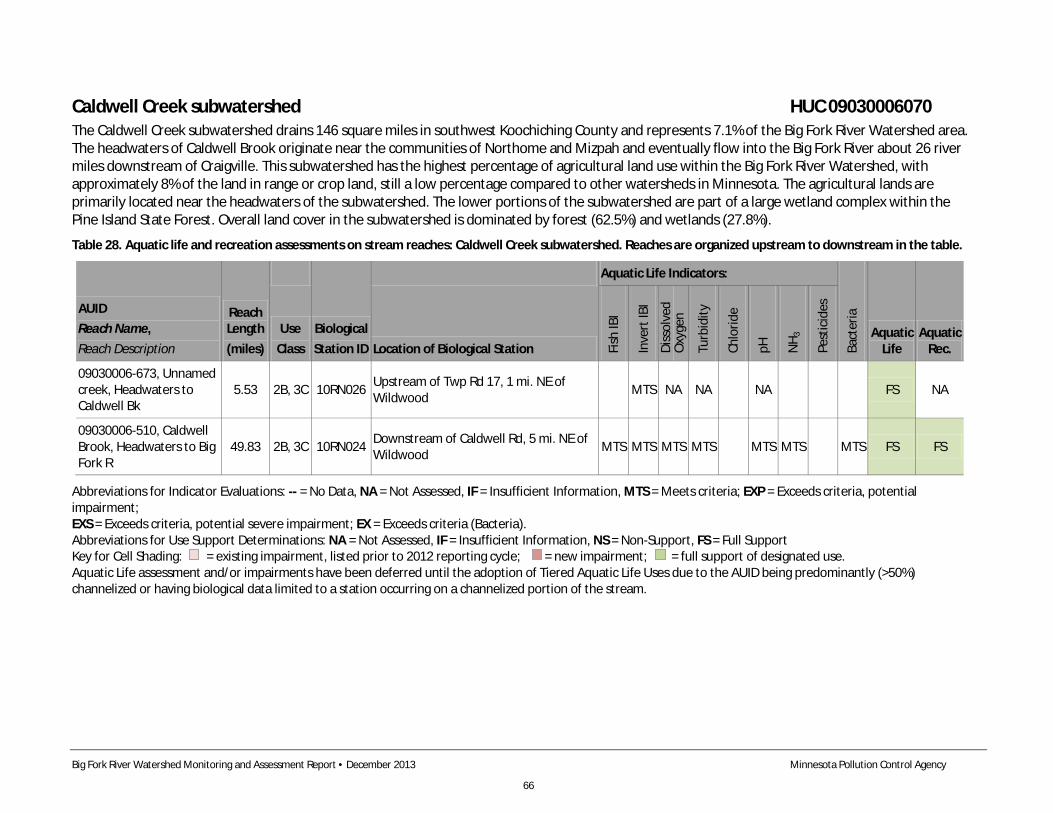
Big Fork River Watershed Monitoring and Assessment Report • December 2013 Minnesota Pollution Control Agency
66
Caldwell Creek subwatershed HUC 09030006070 The Caldwell Creek subwatershed drains 146 square miles in southwest Koochiching County and represents 7.1% of the Big Fork River Watershed area. The headwaters of Caldwell Brook originate near the communities of Northome and Mizpah and eventually flow into the Big Fork River about 26 river miles downstream of Craigville. This subwatershed has the highest percentage of agricultural land use within the Big Fork River Watershed, with approximately 8% of the land in range or crop land, still a low percentage compared to other watersheds in Minnesota. The agricultural lands are primarily located near the headwaters of the subwatershed. The lower portions of the subwatershed are part of a large wetland complex within the Pine Island State Forest. Overall land cover in the subwatershed is dominated by forest (62.5%) and wetlands (27.8%).
Table 28. Aquatic life and recreation assessments on stream reaches: Caldwell Creek subwatershed. Reaches are organized upstream to downstream in the table.
AUID Reach Name, Reach Description
Reach Length (miles)
Biological Station ID
Aquatic Life Indicators:
Bact
eria
Aquatic Life
Aquatic Rec.
Use Class Location of Biological Station Fi
sh IB
I
Inve
rt IB
I
Diss
olve
d O
xyge
n
Turb
idity
Chlo
ride
pH
NH 3
Pest
icid
es
09030006-673, Unnamed creek, Headwaters to Caldwell Bk
5.53 2B, 3C 10RN026 Upstream of Twp Rd 17, 1 mi. NE of Wildwood MTS NA NA NA FS NA
09030006-510, Caldwell Brook, Headwaters to Big Fork R
49.83 2B, 3C 10RN024 Downstream of Caldwell Rd, 5 mi. NE of Wildwood MTS MTS MTS MTS MTS MTS MTS FS FS
Abbreviations for Indicator Evaluations: -- = No Data, NA = Not Assessed, IF = Insufficient Information, MTS = Meets criteria; EXP = Exceeds criteria, potential impairment; EXS = Exceeds criteria, potential severe impairment; EX = Exceeds criteria (Bacteria). Abbreviations for Use Support Determinations: NA = Not Assessed, IF = Insufficient Information, NS = Non-Support, FS = Full Support Key for Cell Shading: = existing impairment, listed prior to 2012 reporting cycle; = new impairment; = full support of designated use. Aquatic Life assessment and/or impairments have been deferred until the adoption of Tiered Aquatic Life Uses due to the AUID being predominantly (>50%) channelized or having biological data limited to a station occurring on a channelized portion of the stream.
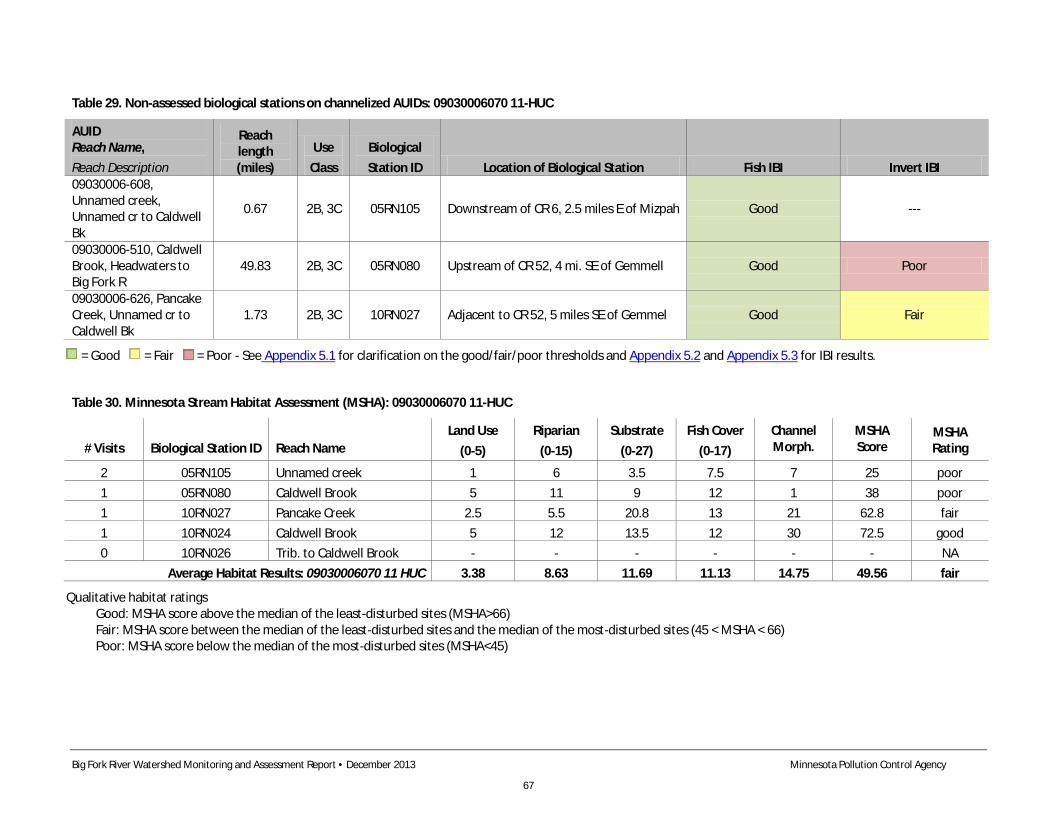
Big Fork River Watershed Monitoring and Assessment Report • December 2013 Minnesota Pollution Control Agency
67
Table 29. Non-assessed biological stations on channelized AUIDs: 09030006070 11-HUC
AUID Reach Name, Reach Description
Reach length (miles)
Use Class
Biological Station ID Location of Biological Station Fish IBI Invert IBI
09030006-608, Unnamed creek, Unnamed cr to Caldwell Bk
0.67 2B, 3C 05RN105 Downstream of CR 6, 2.5 miles E of Mizpah Good ---
09030006-510, Caldwell Brook, Headwaters to Big Fork R
49.83 2B, 3C 05RN080 Upstream of CR 52, 4 mi. SE of Gemmell Good Poor
09030006-626, Pancake Creek, Unnamed cr to Caldwell Bk
1.73 2B, 3C 10RN027 Adjacent to CR 52, 5 miles SE of Gemmel Good Fair
= Good = Fair = Poor - See Appendix 5.1 for clarification on the good/fair/poor thresholds and Appendix 5.2 and Appendix 5.3 for IBI results.
Table 30. Minnesota Stream Habitat Assessment (MSHA): 09030006070 11-HUC
# Visits Biological Station ID Reach Name Land Use
(0-5) Riparian
(0-15) Substrate
(0-27) Fish Cover
(0-17) Channel Morph.
MSHA Score
MSHA Rating
2 05RN105 Unnamed creek 1 6 3.5 7.5 7 25 poor 1 05RN080 Caldwell Brook 5 11 9 12 1 38 poor 1 10RN027 Pancake Creek 2.5 5.5 20.8 13 21 62.8 fair 1 10RN024 Caldwell Brook 5 12 13.5 12 30 72.5 good 0 10RN026 Trib. to Caldwell Brook - - - - - - NA
Average Habitat Results: 09030006070 11 HUC 3.38 8.63 11.69 11.13 14.75 49.56 fair
Qualitative habitat ratings Good: MSHA score above the median of the least-disturbed sites (MSHA>66) Fair: MSHA score between the median of the least-disturbed sites and the median of the most-disturbed sites (45 < MSHA < 66) Poor: MSHA score below the median of the most-disturbed sites (MSHA<45)
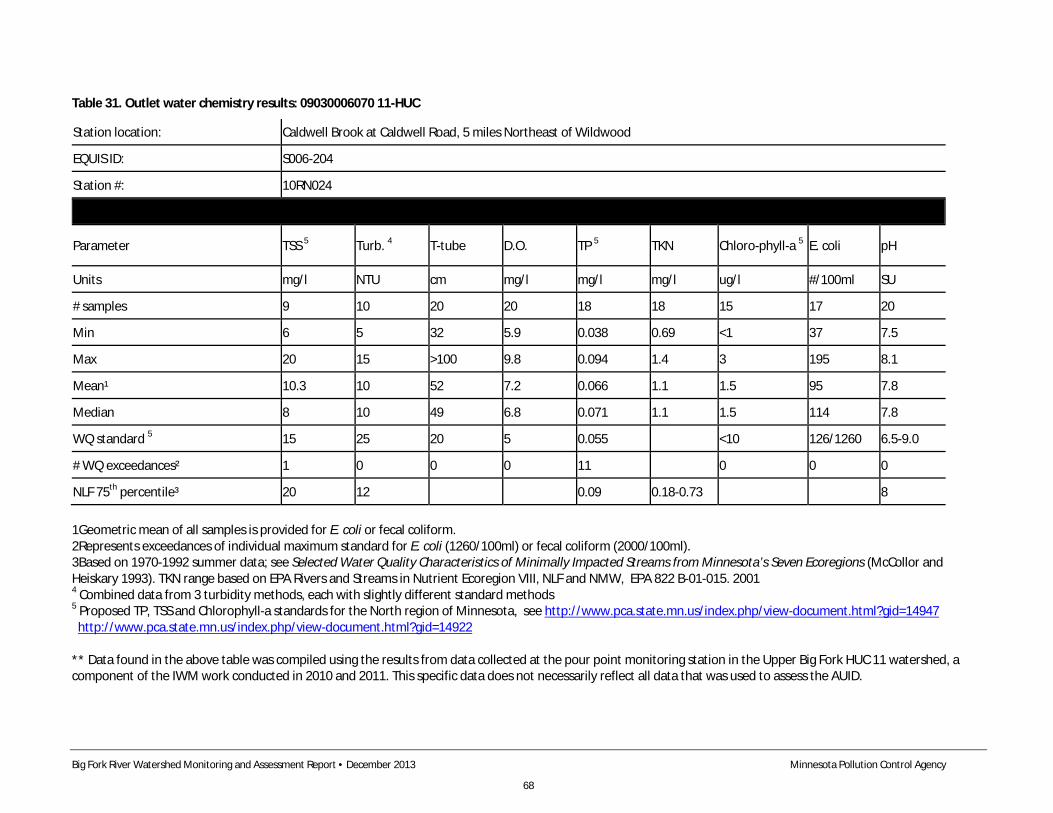
Big Fork River Watershed Monitoring and Assessment Report • December 2013 Minnesota Pollution Control Agency
68
Table 31. Outlet water chemistry results: 09030006070 11-HUC
Station location: Caldwell Brook at Caldwell Road, 5 miles Northeast of Wildwood
EQUIS ID: S006-204
Station #: 10RN024
Parameter TSS 5 Turb. 4 T-tube D.O. TP 5 TKN Chloro-phyll-a 5 E. coli pH
Units mg/l NTU cm mg/l mg/l mg/l ug/l #/100ml SU
# samples 9 10 20 20 18 18 15 17 20
Min 6 5 32 5.9 0.038 0.69 <1 37 7.5
Max 20 15 >100 9.8 0.094 1.4 3 195 8.1
Mean¹ 10.3 10 52 7.2 0.066 1.1 1.5 95 7.8
Median 8 10 49 6.8 0.071 1.1 1.5 114 7.8
WQ standard 5 15 25 20 5 0.055 <10 126/1260 6.5-9.0
# WQ exceedances² 1 0 0 0 11 0 0 0
NLF 75th percentile³ 20 12 0.09 0.18-0.73 8
1Geometric mean of all samples is provided for E. coli or fecal coliform. 2Represents exceedances of individual maximum standard for E. coli (1260/100ml) or fecal coliform (2000/100ml). 3Based on 1970-1992 summer data; see Selected Water Quality Characteristics of Minimally Impacted Streams from Minnesota’s Seven Ecoregions (McCollor and Heiskary 1993). TKN range based on EPA Rivers and Streams in Nutrient Ecoregion VIII, NLF and NMW, EPA 822 B-01-015. 2001 4 Combined data from 3 turbidity methods, each with slightly different standard methods 5 Proposed TP, TSS and Chlorophyll-a standards for the North region of Minnesota, see http://www.pca.state.mn.us/index.php/view-document.html?gid=14947 http://www.pca.state.mn.us/index.php/view-document.html?gid=14922 ** Data found in the above table was compiled using the results from data collected at the pour point monitoring station in the Upper Big Fork HUC 11 watershed, a component of the IWM work conducted in 2010 and 2011. This specific data does not necessarily reflect all data that was used to assess the AUID.
Big Fork River Watershed Monitoring and Assessment Report • December 2013 Minnesota Pollution Control Agency
69
Summary There were two assessable stream segments and three non-assessable stream segments in the Caldwell Brook subwatershed. The two natural reaches on Caldwell Brook and a tributary to Caldwell Brook both meet fish and macroinvertebrate thresholds. Also, all of the fish samples from the channelized streams were rated good in spite of generally poor habitat conditions at the channelized sites. In contrast to the fish results, macroinvertebrate communities at channelized sites were not good, with one receiving a fair and the other a poor rating. Channelized reaches had lower MSHA scores due to poor land use, riparian condition, substrate types, and channel morphology conditions.
The water chemistry monitoring site for this subwatershed is station S006-204 on Caldwell Brook at Caldwell Road, five miles northeast of Wildwood. Overall data indicate good water quality. Nutrient concentrations were higher here compared to most other subwatersheds, and most samples exceeded the draft phosphorus standard of 0.055 mg/L. However, exceedances were minor, and did not result high algal productivity (chlorophyll a concentrations were very low; Table 31), and conditions appeared representative of the wetland dominated landscape. The geometric mean of all bacteria samples was high relative to other subwatersheds, but within standards. Overall, data indicate full support for both aquatic life and aquatic recreational use.
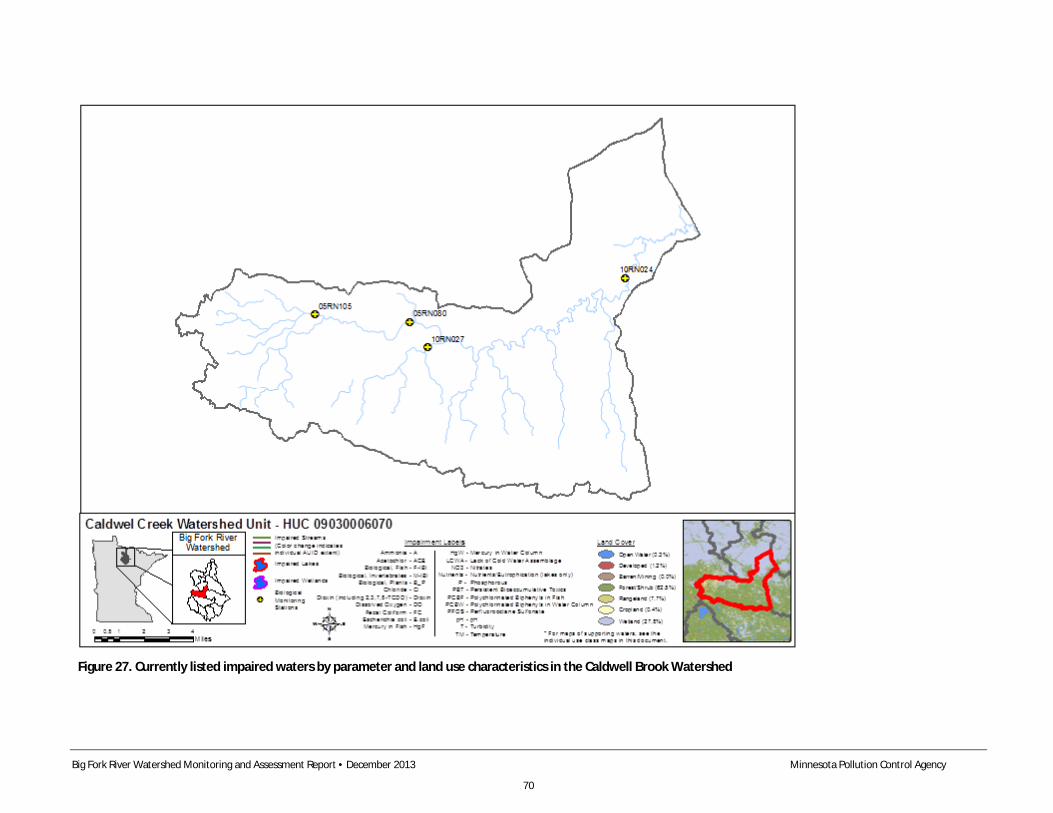
Big Fork River Watershed Monitoring and Assessment Report • December 2013 Minnesota Pollution Control Agency
70
Figure 27. Currently listed impaired waters by parameter and land use characteristics in the Caldwell Brook Watershed
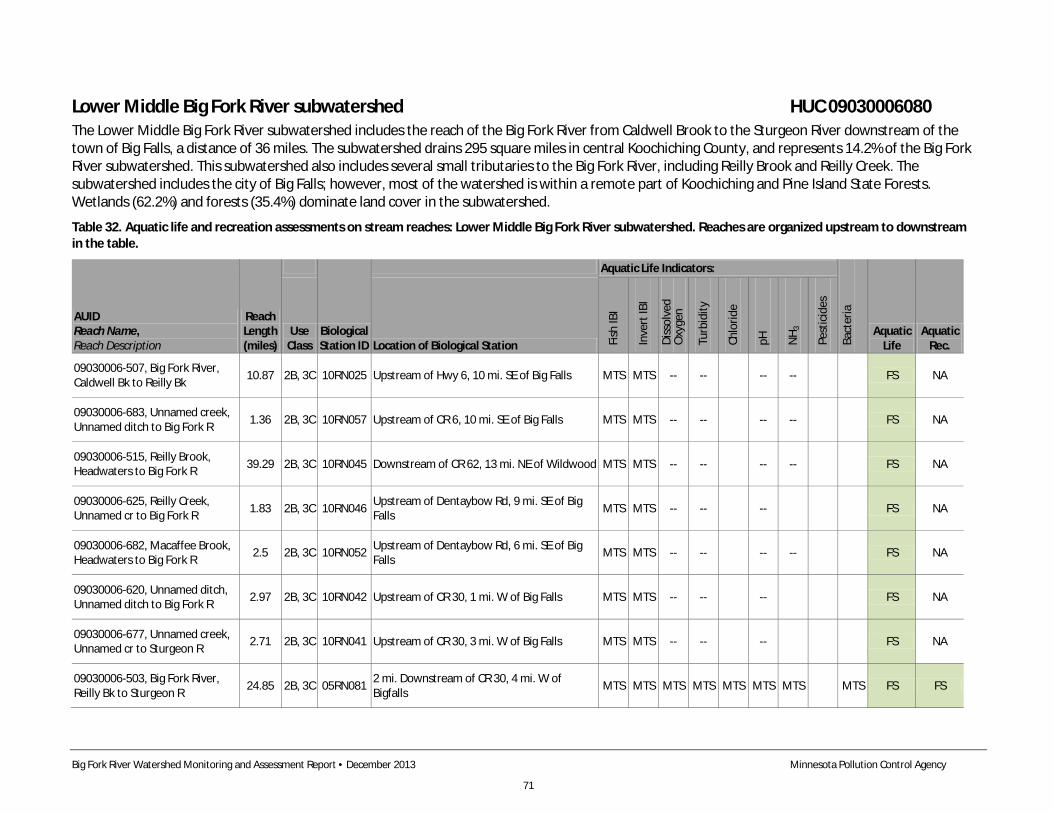
Big Fork River Watershed Monitoring and Assessment Report • December 2013 Minnesota Pollution Control Agency
71
Lower Middle Big Fork River subwatershed HUC 09030006080 The Lower Middle Big Fork River subwatershed includes the reach of the Big Fork River from Caldwell Brook to the Sturgeon River downstream of the town of Big Falls, a distance of 36 miles. The subwatershed drains 295 square miles in central Koochiching County, and represents 14.2% of the Big Fork River subwatershed. This subwatershed also includes several small tributaries to the Big Fork River, including Reilly Brook and Reilly Creek. The subwatershed includes the city of Big Falls; however, most of the watershed is within a remote part of Koochiching and Pine Island State Forests. Wetlands (62.2%) and forests (35.4%) dominate land cover in the subwatershed.
Table 32. Aquatic life and recreation assessments on stream reaches: Lower Middle Big Fork River subwatershed. Reaches are organized upstream to downstream in the table.
AUID Reach Name, Reach Description
Reach Length (miles)
Biological Station ID
Aquatic Life Indicators:
Bact
eria
Aquatic Life
Aquatic Rec.
Use Class Location of Biological Station Fi
sh IB
I
Inve
rt IB
I
Diss
olve
d O
xyge
n
Turb
idity
Chlo
ride
pH
NH 3
Pest
icid
es
09030006-507, Big Fork River, Caldwell Bk to Reilly Bk 10.87 2B, 3C 10RN025 Upstream of Hwy 6, 10 mi. SE of Big Falls MTS MTS -- -- -- -- FS NA
09030006-683, Unnamed creek, Unnamed ditch to Big Fork R 1.36 2B, 3C 10RN057 Upstream of CR 6, 10 mi. SE of Big Falls MTS MTS -- -- -- -- FS NA
09030006-515, Reilly Brook, Headwaters to Big Fork R 39.29 2B, 3C 10RN045 Downstream of CR 62, 13 mi. NE of Wildwood MTS MTS -- -- -- -- FS NA
09030006-625, Reilly Creek, Unnamed cr to Big Fork R 1.83 2B, 3C 10RN046 Upstream of Dentaybow Rd, 9 mi. SE of Big
Falls MTS MTS -- -- -- FS NA
09030006-682, Macaffee Brook, Headwaters to Big Fork R 2.5 2B, 3C 10RN052 Upstream of Dentaybow Rd, 6 mi. SE of Big
Falls MTS MTS -- -- -- -- FS NA
09030006-620, Unnamed ditch, Unnamed ditch to Big Fork R 2.97 2B, 3C 10RN042 Upstream of CR 30, 1 mi. W of Big Falls MTS MTS -- -- -- FS NA
09030006-677, Unnamed creek, Unnamed cr to Sturgeon R 2.71 2B, 3C 10RN041 Upstream of CR 30, 3 mi. W of Big Falls MTS MTS -- -- -- FS NA
09030006-503, Big Fork River, Reilly Bk to Sturgeon R 24.85 2B, 3C 05RN081 2 mi. Downstream of CR 30, 4 mi. W of
Bigfalls MTS MTS MTS MTS MTS MTS MTS MTS FS FS
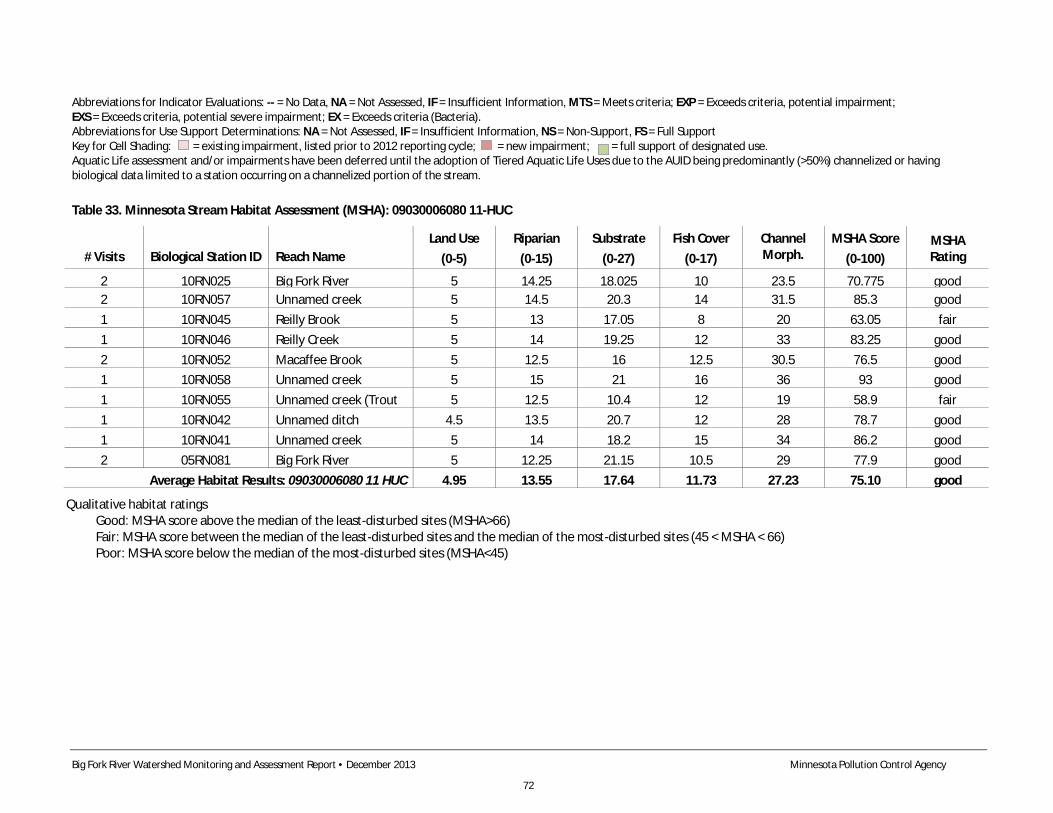
Big Fork River Watershed Monitoring and Assessment Report • December 2013 Minnesota Pollution Control Agency
72
Abbreviations for Indicator Evaluations: -- = No Data, NA = Not Assessed, IF = Insufficient Information, MTS = Meets criteria; EXP = Exceeds criteria, potential impairment; EXS = Exceeds criteria, potential severe impairment; EX = Exceeds criteria (Bacteria). Abbreviations for Use Support Determinations: NA = Not Assessed, IF = Insufficient Information, NS = Non-Support, FS = Full Support Key for Cell Shading: = existing impairment, listed prior to 2012 reporting cycle; = new impairment; = full support of designated use. Aquatic Life assessment and/or impairments have been deferred until the adoption of Tiered Aquatic Life Uses due to the AUID being predominantly (>50%) channelized or having biological data limited to a station occurring on a channelized portion of the stream. Table 33. Minnesota Stream Habitat Assessment (MSHA): 09030006080 11-HUC
# Visits Biological Station ID Reach Name Land Use
(0-5) Riparian
(0-15) Substrate
(0-27) Fish Cover
(0-17) Channel Morph.
MSHA Score (0-100)
MSHA Rating
2 10RN025 Big Fork River 5 14.25 18.025 10 23.5 70.775 good 2 10RN057 Unnamed creek 5 14.5 20.3 14 31.5 85.3 good 1 10RN045 Reilly Brook 5 13 17.05 8 20 63.05 fair 1 10RN046 Reilly Creek 5 14 19.25 12 33 83.25 good 2 10RN052 Macaffee Brook 5 12.5 16 12.5 30.5 76.5 good 1 10RN058 Unnamed creek 5 15 21 16 36 93 good 1 10RN055 Unnamed creek (Trout
5 12.5 10.4 12 19 58.9 fair
1 10RN042 Unnamed ditch 4.5 13.5 20.7 12 28 78.7 good 1 10RN041 Unnamed creek 5 14 18.2 15 34 86.2 good 2 05RN081 Big Fork River 5 12.25 21.15 10.5 29 77.9 good
Average Habitat Results: 09030006080 11 HUC 4.95 13.55 17.64 11.73 27.23 75.10 good
Qualitative habitat ratings Good: MSHA score above the median of the least-disturbed sites (MSHA>66) Fair: MSHA score between the median of the least-disturbed sites and the median of the most-disturbed sites (45 < MSHA < 66) Poor: MSHA score below the median of the most-disturbed sites (MSHA<45)
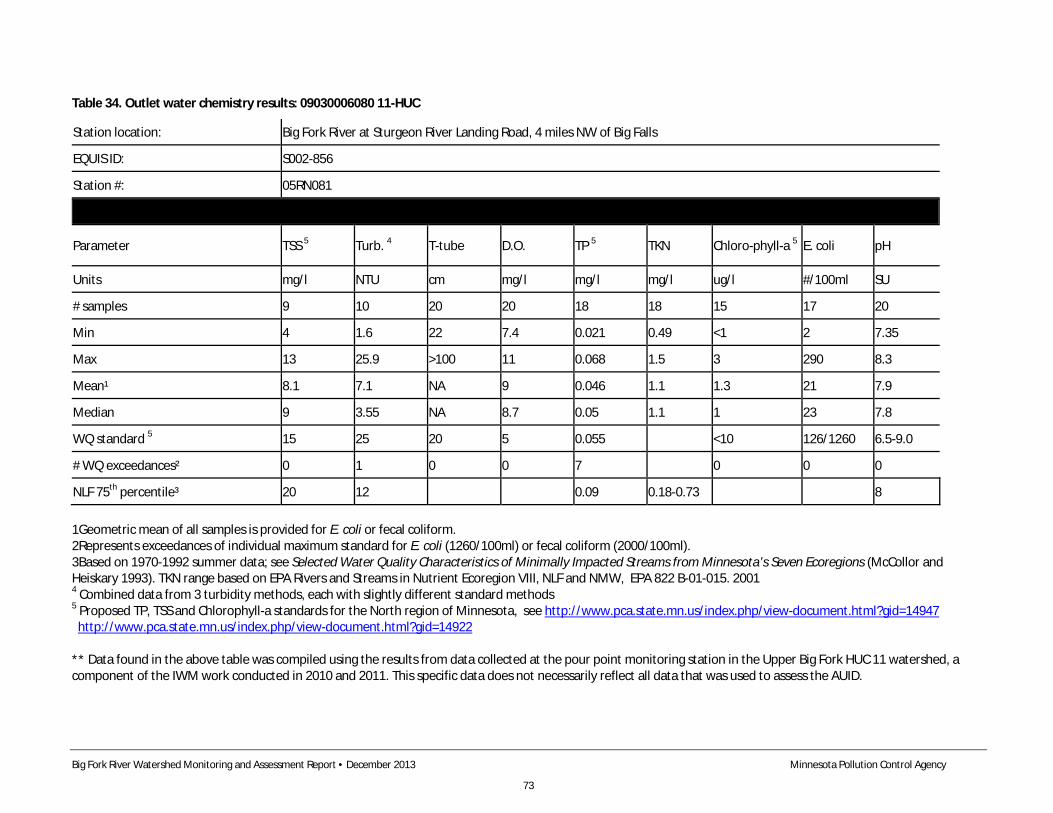
Big Fork River Watershed Monitoring and Assessment Report • December 2013 Minnesota Pollution Control Agency
73
Table 34. Outlet water chemistry results: 09030006080 11-HUC
Station location: Big Fork River at Sturgeon River Landing Road, 4 miles NW of Big Falls
EQUIS ID: S002-856
Station #: 05RN081
Parameter TSS 5 Turb. 4 T-tube D.O. TP 5 TKN Chloro-phyll-a 5 E. coli pH
Units mg/l NTU cm mg/l mg/l mg/l ug/l #/100ml SU
# samples 9 10 20 20 18 18 15 17 20
Min 4 1.6 22 7.4 0.021 0.49 <1 2 7.35
Max 13 25.9 >100 11 0.068 1.5 3 290 8.3
Mean¹ 8.1 7.1 NA 9 0.046 1.1 1.3 21 7.9
Median 9 3.55 NA 8.7 0.05 1.1 1 23 7.8
WQ standard 5 15 25 20 5 0.055 <10 126/1260 6.5-9.0
# WQ exceedances² 0 1 0 0 7 0 0 0
NLF 75th percentile³ 20 12 0.09 0.18-0.73 8
1Geometric mean of all samples is provided for E. coli or fecal coliform. 2Represents exceedances of individual maximum standard for E. coli (1260/100ml) or fecal coliform (2000/100ml). 3Based on 1970-1992 summer data; see Selected Water Quality Characteristics of Minimally Impacted Streams from Minnesota’s Seven Ecoregions (McCollor and Heiskary 1993). TKN range based on EPA Rivers and Streams in Nutrient Ecoregion VIII, NLF and NMW, EPA 822 B-01-015. 2001 4 Combined data from 3 turbidity methods, each with slightly different standard methods 5 Proposed TP, TSS and Chlorophyll-a standards for the North region of Minnesota, see http://www.pca.state.mn.us/index.php/view-document.html?gid=14947 http://www.pca.state.mn.us/index.php/view-document.html?gid=14922 ** Data found in the above table was compiled using the results from data collected at the pour point monitoring station in the Upper Big Fork HUC 11 watershed, a component of the IWM work conducted in 2010 and 2011. This specific data does not necessarily reflect all data that was used to assess the AUID.
Big Fork River Watershed Monitoring and Assessment Report • December 2013 Minnesota Pollution Control Agency
74
Summary The Lower Middle Big Fork River subwatershed encompasses eight assessable AUIDs and eight assessable sites. All eight met designated thresholds for both macroinvertebrates and fish indicating good water quality for these two biological indicators. Overall habitat scores were generally good indicating habitat conditions in this subwatershed are adequate to support healthy fish and macroinvertebrate communities. Habitat metrics related to land use, riparian condition, and channel morphology were particularly good in this subwatershed.
The water chemistry monitoring site for this subwatershed is station S002-856 on the Big Fork River at Sturgeon Landing Road, four miles northwest of Big Falls. The water quality in this subwatershed is excellent. Sediment, nutrient, and turbidity levels were low and indicative of the forest and wetland dominated landscape. Bacteria levels were also low and at expected levels given the overall lack of disturbance in the subwatershed. As seen in some upstream subwatersheds, periodic exceedances of the draft phosphorus standard occurred, a total 7 of 18 samples. These exceedances were minor and within the expected range of streams within the NMW Ecoregion. Overall, the data indicate full support for both aquatic life and aquatic recreational use. The Big Fork River Board River Watch program also collected data from this subwatershed. Their data, including fecal coliform bacteria data, corroborate assessment-level data collected at the Sturgeon Landing site.
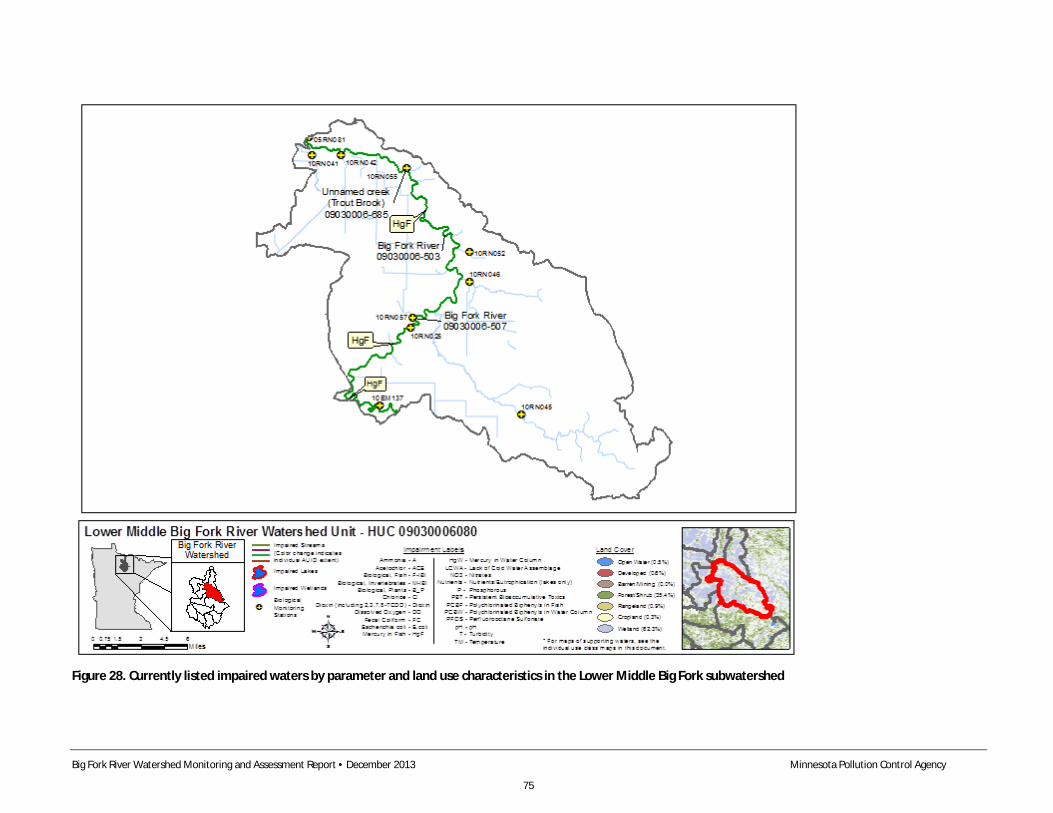
Big Fork River Watershed Monitoring and Assessment Report • December 2013 Minnesota Pollution Control Agency
75
Figure 28. Currently listed impaired waters by parameter and land use characteristics in the Lower Middle Big Fork subwatershed
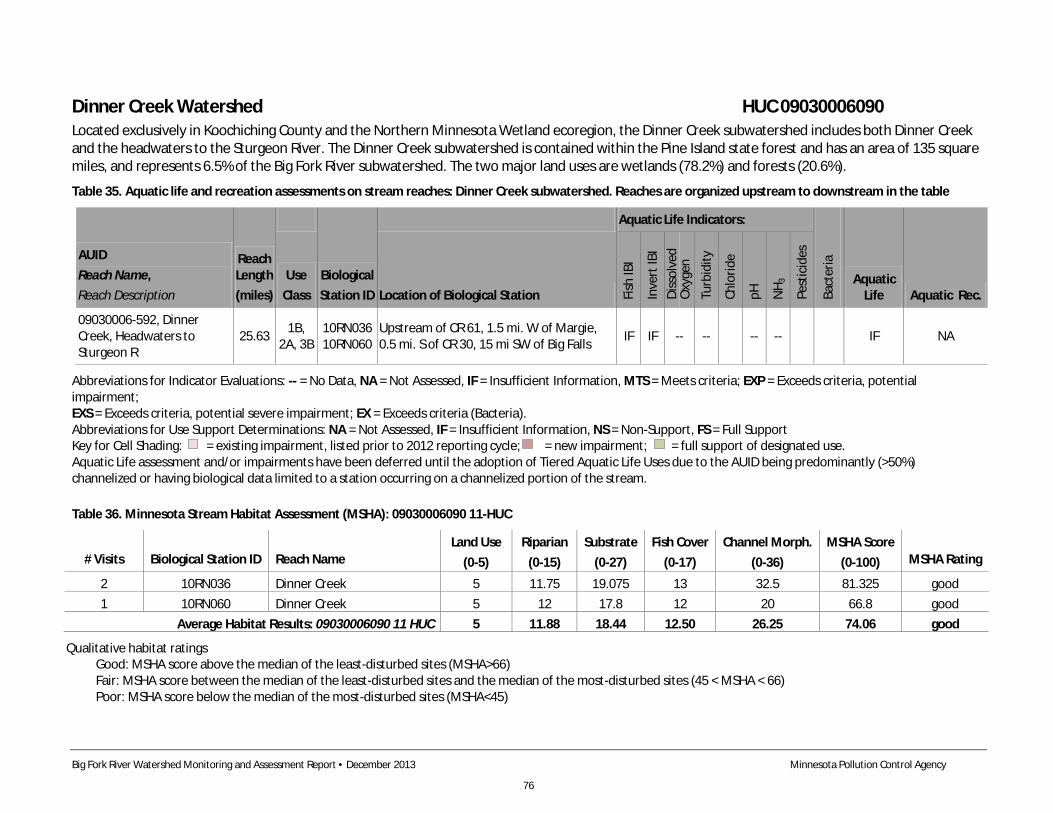
Big Fork River Watershed Monitoring and Assessment Report • December 2013 Minnesota Pollution Control Agency
76
Dinner Creek Watershed HUC 09030006090 Located exclusively in Koochiching County and the Northern Minnesota Wetland ecoregion, the Dinner Creek subwatershed includes both Dinner Creek and the headwaters to the Sturgeon River. The Dinner Creek subwatershed is contained within the Pine Island state forest and has an area of 135 square miles, and represents 6.5% of the Big Fork River subwatershed. The two major land uses are wetlands (78.2%) and forests (20.6%).
Table 35. Aquatic life and recreation assessments on stream reaches: Dinner Creek subwatershed. Reaches are organized upstream to downstream in the table
AUID Reach Name, Reach Description
Reach Length (miles)
Biological Station ID
Aquatic Life Indicators:
Bact
eria
Aquatic Life Aquatic Rec.
Use Class Location of Biological Station Fi
sh IB
I
Inve
rt IB
I Di
ssol
ved
Oxy
gen
Turb
idity
Chlo
ride
pH
NH 3
Pest
icid
es
09030006-592, Dinner Creek, Headwaters to Sturgeon R
25.63 1B, 2A, 3B
10RN036 10RN060
Upstream of CR 61, 1.5 mi. W of Margie, 0.5 mi. S of CR 30, 15 mi SW of Big Falls IF IF -- -- -- -- IF NA
Abbreviations for Indicator Evaluations: -- = No Data, NA = Not Assessed, IF = Insufficient Information, MTS = Meets criteria; EXP = Exceeds criteria, potential impairment; EXS = Exceeds criteria, potential severe impairment; EX = Exceeds criteria (Bacteria). Abbreviations for Use Support Determinations: NA = Not Assessed, IF = Insufficient Information, NS = Non-Support, FS = Full Support Key for Cell Shading: = existing impairment, listed prior to 2012 reporting cycle; = new impairment; = full support of designated use. Aquatic Life assessment and/or impairments have been deferred until the adoption of Tiered Aquatic Life Uses due to the AUID being predominantly (>50%) channelized or having biological data limited to a station occurring on a channelized portion of the stream. Table 36. Minnesota Stream Habitat Assessment (MSHA): 09030006090 11-HUC
# Visits Biological Station ID Reach Name Land Use
(0-5) Riparian
(0-15) Substrate
(0-27) Fish Cover
(0-17) Channel Morph.
(0-36) MSHA Score
(0-100) MSHA Rating
2 10RN036 Dinner Creek 5 11.75 19.075 13 32.5 81.325 good 1 10RN060 Dinner Creek 5 12 17.8 12 20 66.8 good
Average Habitat Results: 09030006090 11 HUC 5 11.88 18.44 12.50 26.25 74.06 good
Qualitative habitat ratings Good: MSHA score above the median of the least-disturbed sites (MSHA>66) Fair: MSHA score between the median of the least-disturbed sites and the median of the most-disturbed sites (45 < MSHA < 66) Poor: MSHA score below the median of the most-disturbed sites (MSHA<45)
Big Fork River Watershed Monitoring and Assessment Report • December 2013 Minnesota Pollution Control Agency
77
Summary The Dinner Creek subwatershed had one assessable AUID with two biological sampling sites. Both macroinvertebrate and fish surveys were deemed to have inadequate information to accurately assign use classes, due to conflicting information on designation the creek as cold or warm water. The appropriate IBI threshold cannot be assigned until more data confirms the correct stream classification. Therefore aquatic life was not assessed in this subwatershed. MSHA scores indicated good habitat conditions at both sampling locations.
There was not a 10X stream chemistry monitoring site in this subwatershed due to limited access near the outlet.
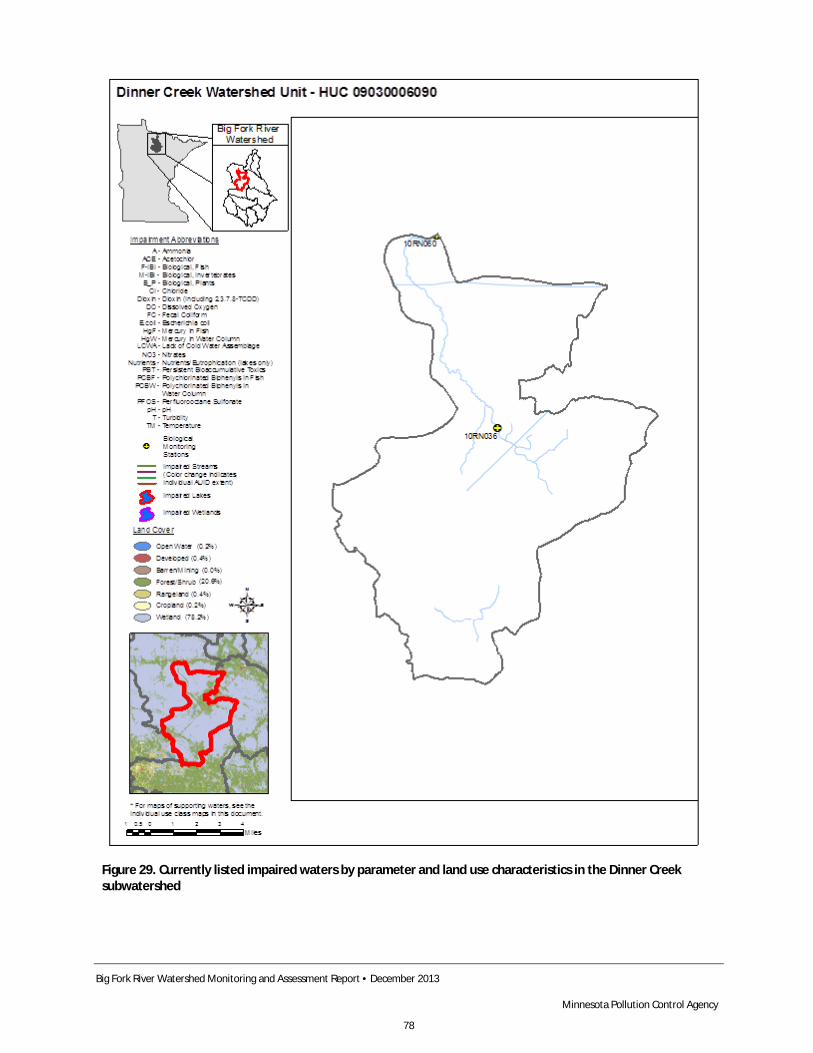
Big Fork River Watershed Monitoring and Assessment Report • December 2013 Minnesota Pollution Control Agency
78
Figure 29. Currently listed impaired waters by parameter and land use characteristics in the Dinner Creek subwatershed
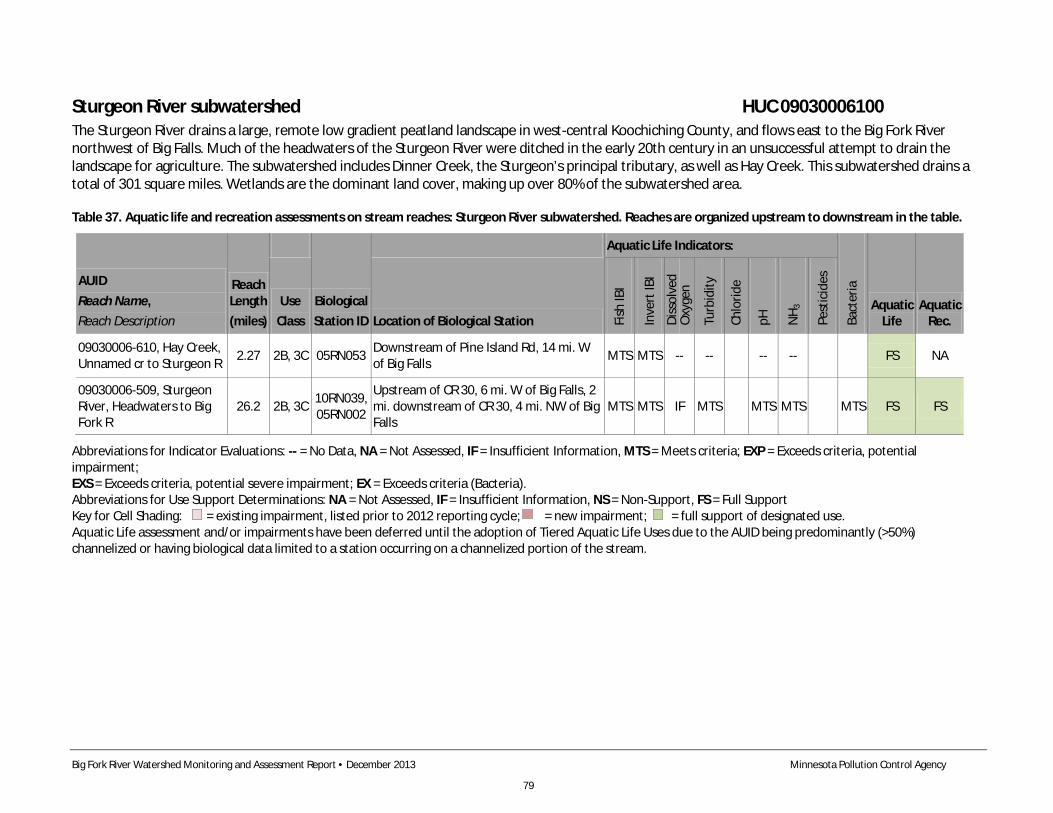
Big Fork River Watershed Monitoring and Assessment Report • December 2013 Minnesota Pollution Control Agency
79
Sturgeon River subwatershed HUC 09030006100 The Sturgeon River drains a large, remote low gradient peatland landscape in west-central Koochiching County, and flows east to the Big Fork River northwest of Big Falls. Much of the headwaters of the Sturgeon River were ditched in the early 20th century in an unsuccessful attempt to drain the landscape for agriculture. The subwatershed includes Dinner Creek, the Sturgeon’s principal tributary, as well as Hay Creek. This subwatershed drains a total of 301 square miles. Wetlands are the dominant land cover, making up over 80% of the subwatershed area.
Table 37. Aquatic life and recreation assessments on stream reaches: Sturgeon River subwatershed. Reaches are organized upstream to downstream in the table.
AUID Reach Name, Reach Description
Reach Length (miles)
Biological Station ID
Aquatic Life Indicators:
Bact
eria
Aquatic Life
Aquatic Rec.
Use Class Location of Biological Station Fi
sh IB
I
Inve
rt IB
I
Diss
olve
d O
xyge
n
Turb
idity
Chlo
ride
pH
NH 3
Pest
icid
es
09030006-610, Hay Creek, Unnamed cr to Sturgeon R 2.27 2B, 3C 05RN053 Downstream of Pine Island Rd, 14 mi. W
of Big Falls MTS MTS -- -- -- -- FS NA
09030006-509, Sturgeon River, Headwaters to Big Fork R
26.2 2B, 3C 10RN039, 05RN002
Upstream of CR 30, 6 mi. W of Big Falls, 2 mi. downstream of CR 30, 4 mi. NW of Big Falls
MTS MTS IF MTS MTS MTS MTS FS FS
Abbreviations for Indicator Evaluations: -- = No Data, NA = Not Assessed, IF = Insufficient Information, MTS = Meets criteria; EXP = Exceeds criteria, potential impairment; EXS = Exceeds criteria, potential severe impairment; EX = Exceeds criteria (Bacteria). Abbreviations for Use Support Determinations: NA = Not Assessed, IF = Insufficient Information, NS = Non-Support, FS = Full Support Key for Cell Shading: = existing impairment, listed prior to 2012 reporting cycle; = new impairment; = full support of designated use. Aquatic Life assessment and/or impairments have been deferred until the adoption of Tiered Aquatic Life Uses due to the AUID being predominantly (>50%) channelized or having biological data limited to a station occurring on a channelized portion of the stream.
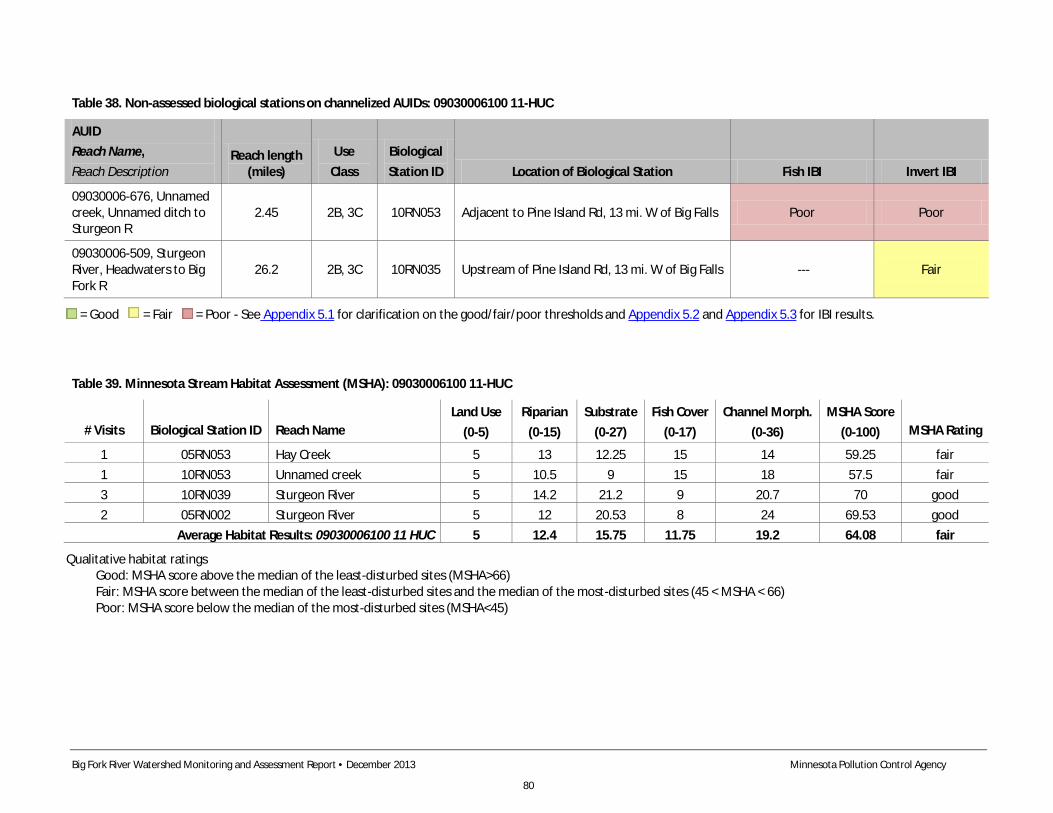
Big Fork River Watershed Monitoring and Assessment Report • December 2013 Minnesota Pollution Control Agency
80
Table 38. Non-assessed biological stations on channelized AUIDs: 09030006100 11-HUC
AUID Reach Name, Reach Description
Reach length (miles)
Use Class
Biological Station ID Location of Biological Station Fish IBI Invert IBI
09030006-676, Unnamed creek, Unnamed ditch to Sturgeon R
2.45 2B, 3C 10RN053 Adjacent to Pine Island Rd, 13 mi. W of Big Falls Poor Poor
09030006-509, Sturgeon River, Headwaters to Big Fork R
26.2 2B, 3C 10RN035 Upstream of Pine Island Rd, 13 mi. W of Big Falls --- Fair
= Good = Fair = Poor - See Appendix 5.1 for clarification on the good/fair/poor thresholds and Appendix 5.2 and Appendix 5.3 for IBI results.
Table 39. Minnesota Stream Habitat Assessment (MSHA): 09030006100 11-HUC
# Visits Biological Station ID Reach Name Land Use
(0-5) Riparian
(0-15) Substrate
(0-27) Fish Cover
(0-17) Channel Morph.
(0-36) MSHA Score
(0-100) MSHA Rating
1 05RN053 Hay Creek 5 13 12.25 15 14 59.25 fair 1 10RN053 Unnamed creek 5 10.5 9 15 18 57.5 fair 3 10RN039 Sturgeon River 5 14.2 21.2 9 20.7 70 good 2 05RN002 Sturgeon River 5 12 20.53 8 24 69.53 good
Average Habitat Results: 09030006100 11 HUC 5 12.4 15.75 11.75 19.2 64.08 fair
Qualitative habitat ratings Good: MSHA score above the median of the least-disturbed sites (MSHA>66) Fair: MSHA score between the median of the least-disturbed sites and the median of the most-disturbed sites (45 < MSHA < 66) Poor: MSHA score below the median of the most-disturbed sites (MSHA<45)
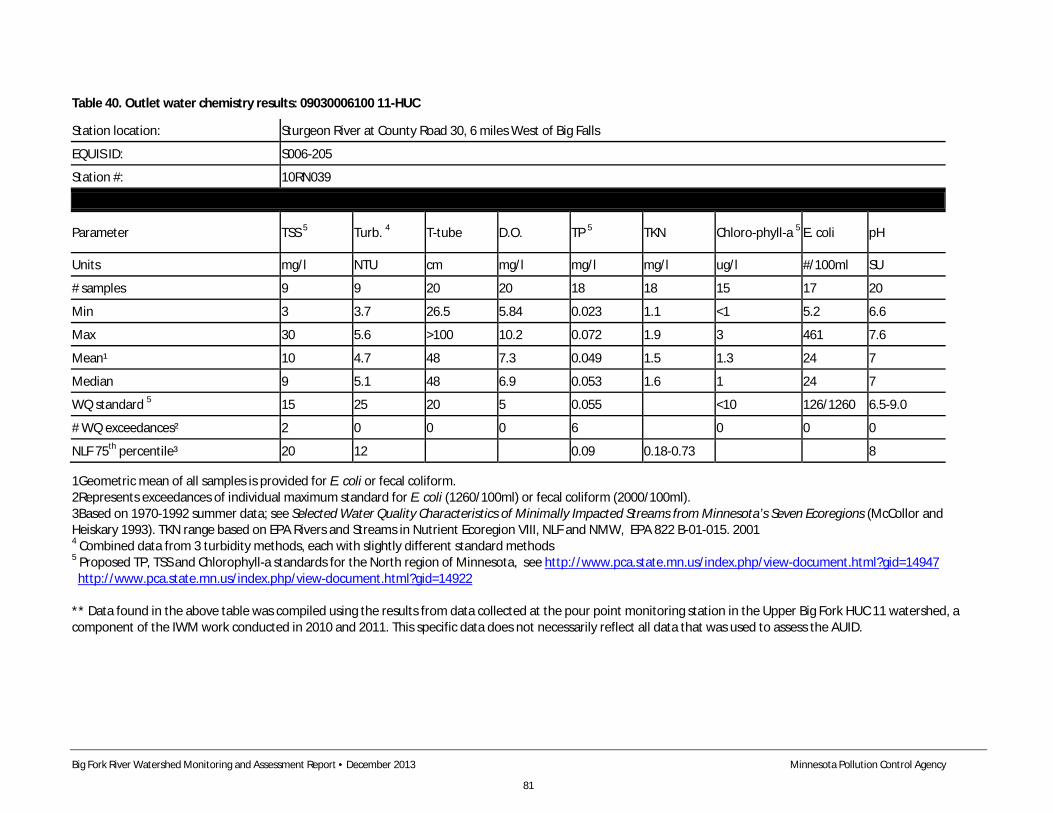
Big Fork River Watershed Monitoring and Assessment Report • December 2013 Minnesota Pollution Control Agency
81
Table 40. Outlet water chemistry results: 09030006100 11-HUC
Station location: Sturgeon River at County Road 30, 6 miles West of Big Falls
EQUIS ID: S006-205
Station #: 10RN039
Parameter TSS 5 Turb. 4 T-tube D.O. TP 5 TKN Chloro-phyll-a 5 E. coli pH
Units mg/l NTU cm mg/l mg/l mg/l ug/l #/100ml SU
# samples 9 9 20 20 18 18 15 17 20
Min 3 3.7 26.5 5.84 0.023 1.1 <1 5.2 6.6
Max 30 5.6 >100 10.2 0.072 1.9 3 461 7.6
Mean¹ 10 4.7 48 7.3 0.049 1.5 1.3 24 7
Median 9 5.1 48 6.9 0.053 1.6 1 24 7
WQ standard 5 15 25 20 5 0.055 <10 126/1260 6.5-9.0
# WQ exceedances² 2 0 0 0 6 0 0 0
NLF 75th percentile³ 20 12 0.09 0.18-0.73 8
1Geometric mean of all samples is provided for E. coli or fecal coliform. 2Represents exceedances of individual maximum standard for E. coli (1260/100ml) or fecal coliform (2000/100ml). 3Based on 1970-1992 summer data; see Selected Water Quality Characteristics of Minimally Impacted Streams from Minnesota’s Seven Ecoregions (McCollor and Heiskary 1993). TKN range based on EPA Rivers and Streams in Nutrient Ecoregion VIII, NLF and NMW, EPA 822 B-01-015. 2001 4 Combined data from 3 turbidity methods, each with slightly different standard methods 5 Proposed TP, TSS and Chlorophyll-a standards for the North region of Minnesota, see http://www.pca.state.mn.us/index.php/view-document.html?gid=14947 http://www.pca.state.mn.us/index.php/view-document.html?gid=14922 ** Data found in the above table was compiled using the results from data collected at the pour point monitoring station in the Upper Big Fork HUC 11 watershed, a component of the IWM work conducted in 2010 and 2011. This specific data does not necessarily reflect all data that was used to assess the AUID.
Big Fork River Watershed Monitoring and Assessment Report • December 2013 Minnesota Pollution Control Agency
82
Summary The Sturgeon River subwatershed contains two assessable stream segments and two non-assessable stream segments. Assessable reaches were above the impairment thresholds for both macroinvertebrates and fish, indicating aquatic life use support. Non-assessable channelized sites ranged from fair to poor. Only the Macroinvertebrates were sampled from the Sturgeon River (10RN035), receiving a fair rating. The other channelized site (10RN053) received poor ratings for both fish and macroinvertebrates and had the lowest MSHA score within the Sturgeon River subwatershed. However, the overall MSHA rating for the site and for the subwatershed was still in the fair range.
The water chemistry monitoring site for this subwatershed is station S006-205 on the Sturgeon River at Koochiching County Road 30, 6 miles west of Big Falls. Data indicate good water quality, reflective of the low gradient, peatland landscape. Turbidity, bacteria, and nutrient levels are low and are at expected levels given the subwatershed’s relatively remote location. Overall, data indicate full support for both aquatic life and aquatic recreational use.
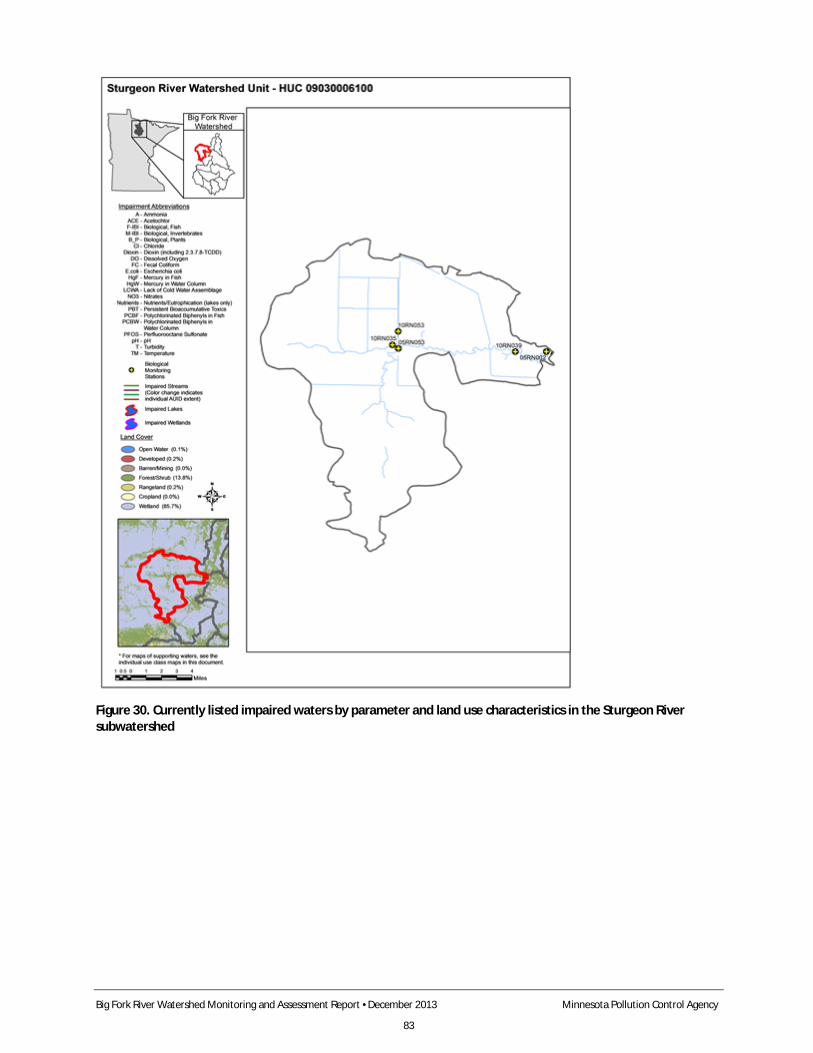
Big Fork River Watershed Monitoring and Assessment Report •December 2013 Minnesota Pollution Control Agency
83
Figure 30. Currently listed impaired waters by parameter and land use characteristics in the Sturgeon River subwatershed
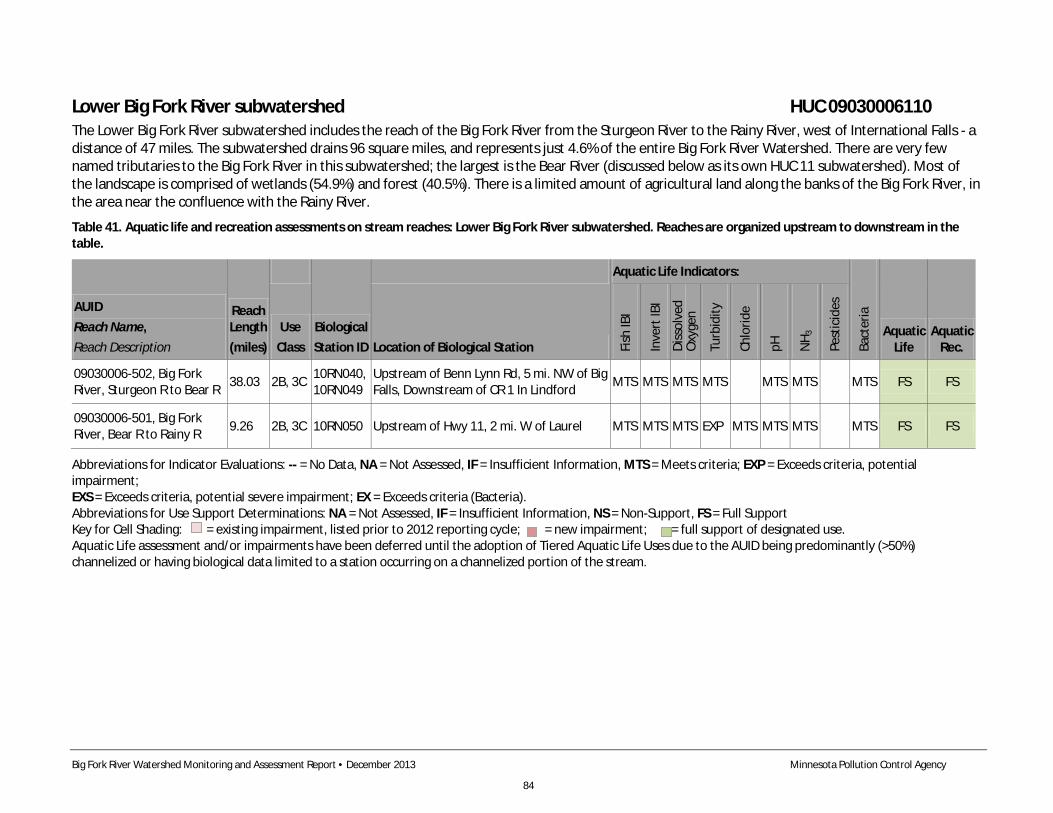
Big Fork River Watershed Monitoring and Assessment Report • December 2013 Minnesota Pollution Control Agency
84
Lower Big Fork River subwatershed HUC 09030006110 The Lower Big Fork River subwatershed includes the reach of the Big Fork River from the Sturgeon River to the Rainy River, west of International Falls - a distance of 47 miles. The subwatershed drains 96 square miles, and represents just 4.6% of the entire Big Fork River Watershed. There are very few named tributaries to the Big Fork River in this subwatershed; the largest is the Bear River (discussed below as its own HUC 11 subwatershed). Most of the landscape is comprised of wetlands (54.9%) and forest (40.5%). There is a limited amount of agricultural land along the banks of the Big Fork River, in the area near the confluence with the Rainy River.
Table 41. Aquatic life and recreation assessments on stream reaches: Lower Big Fork River subwatershed. Reaches are organized upstream to downstream in the table.
AUID Reach Name, Reach Description
Reach Length (miles)
Biological Station ID
Aquatic Life Indicators:
Bact
eria
Aquatic Life
Aquatic Rec.
Use Class Location of Biological Station Fi
sh IB
I
Inve
rt IB
I
Diss
olve
d O
xyge
n
Turb
idity
Chlo
ride
pH
NH 3
Pest
icid
es
09030006-502, Big Fork River, Sturgeon R to Bear R 38.03 2B, 3C 10RN040,
10RN049 Upstream of Benn Lynn Rd, 5 mi. NW of Big Falls, Downstream of CR 1 In Lindford MTS MTS MTS MTS MTS MTS MTS FS FS
09030006-501, Big Fork River, Bear R to Rainy R 9.26 2B, 3C 10RN050 Upstream of Hwy 11, 2 mi. W of Laurel MTS MTS MTS EXP MTS MTS MTS MTS FS FS
Abbreviations for Indicator Evaluations: -- = No Data, NA = Not Assessed, IF = Insufficient Information, MTS = Meets criteria; EXP = Exceeds criteria, potential impairment; EXS = Exceeds criteria, potential severe impairment; EX = Exceeds criteria (Bacteria). Abbreviations for Use Support Determinations: NA = Not Assessed, IF = Insufficient Information, NS = Non-Support, FS = Full Support Key for Cell Shading: = existing impairment, listed prior to 2012 reporting cycle; = new impairment; = full support of designated use. Aquatic Life assessment and/or impairments have been deferred until the adoption of Tiered Aquatic Life Uses due to the AUID being predominantly (>50%) channelized or having biological data limited to a station occurring on a channelized portion of the stream.
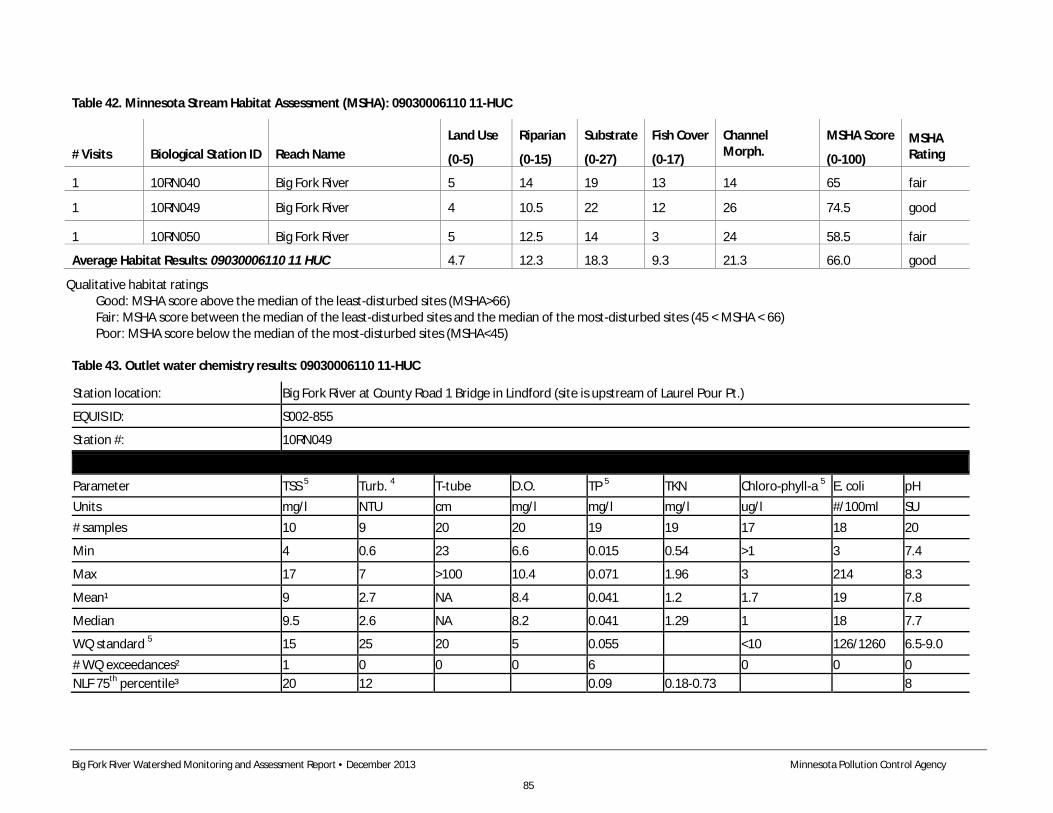
Big Fork River Watershed Monitoring and Assessment Report • December 2013 Minnesota Pollution Control Agency
85
Table 42. Minnesota Stream Habitat Assessment (MSHA): 09030006110 11-HUC
# Visits Biological Station ID Reach Name Land Use
(0-5)
Riparian
(0-15)
Substrate
(0-27)
Fish Cover
(0-17)
Channel Morph.
MSHA Score
(0-100)
MSHA Rating
1 10RN040 Big Fork River 5 14 19 13 14 65 fair
1 10RN049 Big Fork River 4 10.5 22 12 26 74.5 good
1 10RN050 Big Fork River 5 12.5 14 3 24 58.5 fair
Average Habitat Results: 09030006110 11 HUC 4.7 12.3 18.3 9.3 21.3 66.0 good
Qualitative habitat ratings Good: MSHA score above the median of the least-disturbed sites (MSHA>66) Fair: MSHA score between the median of the least-disturbed sites and the median of the most-disturbed sites (45 < MSHA < 66) Poor: MSHA score below the median of the most-disturbed sites (MSHA<45)
Table 43. Outlet water chemistry results: 09030006110 11-HUC
Station location: Big Fork River at County Road 1 Bridge in Lindford (site is upstream of Laurel Pour Pt.)
EQUIS ID: S002-855
Station #: 10RN049
Parameter TSS 5 Turb. 4 T-tube D.O. TP 5 TKN Chloro-phyll-a 5 E. coli pH Units mg/l NTU cm mg/l mg/l mg/l ug/l #/100ml SU # samples 10 9 20 20 19 19 17 18 20
Min 4 0.6 23 6.6 0.015 0.54 >1 3 7.4
Max 17 7 >100 10.4 0.071 1.96 3 214 8.3
Mean¹ 9 2.7 NA 8.4 0.041 1.2 1.7 19 7.8
Median 9.5 2.6 NA 8.2 0.041 1.29 1 18 7.7
WQ standard 5 15 25 20 5 0.055 <10 126/1260 6.5-9.0 # WQ exceedances² 1 0 0 0 6 0 0 0 NLF 75th percentile³ 20 12 0.09 0.18-0.73 8
Big Fork River Watershed Monitoring and Assessment Report • December 2013 Minnesota Pollution Control Agency
86
1Geometric mean of all samples is provided for E. coli or fecal coliform. 2Represents exceedances of individual maximum standard for E. coli (1260/100ml) or fecal coliform (2000/100ml). 3Based on 1970-1992 summer data; see Selected Water Quality Characteristics of Minimally Impacted Streams from Minnesota’s Seven Ecoregions (McCollor and Heiskary 1993). TKN range based on EPA Rivers and Streams in Nutrient Ecoregion VIII, NLF and NMW, EPA 822 B-01-015. 2001 4 Combined data from 3 turbidity methods, each with slightly different standard methods 5 Proposed TP, TSS and Chlorophyll-a standards for the North region of Minnesota, see http://www.pca.state.mn.us/index.php/view-document.html?gid=14947 http://www.pca.state.mn.us/index.php/view-document.html?gid=14922 ** Data found in the above table was compiled using the results from data collected at the pour point monitoring station in the Upper Big Fork HUC 11 watershed, a component of the IWM work conducted in 2010 and 2011. This specific data does not necessarily reflect all data that was used to assess the AUID.
Summary The Lower Big Fork River subwatershed has two assessable stream segments on the Big Fork River, both of which had good water quality. Fish IBI scores improved in a downstream direction. This subwatershed had some of the highest percentages of sensitive fish species ranging from 17.5 to 66.5% of the species found. The overall habitat quality rating was good. Contrary to the fish results, the lowest MSHA score was located at the farthest downstream reach. The lower MSHA score was due primarily to a lack of fish cover, receiving only 3 out of 17 possible points for the fish cover subcategory.
The water chemistry monitoring site for this subwatershed was on the Big Fork River at the County Road 1 Bridge in Lindford. The subwatershed’s outlet location (the Big Fork’s confluence with the Rainy River at the Minnesota Highway 11 Bridge) was not selected as the representative monitoring site because backwater effects from the Rainy River influence water quality conditions in the Big Fork. These conditions occur when there are low flows in the Big Fork and stagnant conditions are common, or when flow in the Rainy River are higher than those in the Big Fork.
Data at the Lindford site indicate excellent water quality; this site integrates conditions in nearly the entire watershed, draining 93% of the Big Fork subwatershed (except the Bear River). Turbidity, bacteria, and nutrient levels are low and are at expected levels given the watershed’s characteristics. Phosphorus concentrations were occasionally above the draft standard, but still within the expected range for the NMW Ecoregion. Overall, the data indicate full support of both aquatic life and aquatic recreational use. Big Fork River Board River Watch data were also collected in this subwatershed. Their data, including fecal coliform bacteria data, corroborate assessment-level data collected at the Lindford site.
Data at the Lindford site were also compared to data collected from the Highway 11 confluence site. In general, data were similar among sites, except that higher turbidity and TSS levels were observed at Highway 11. This may indicate an influence from the Rainy River and its principal tributary, the Little Fork River which has a turbidity impairment.
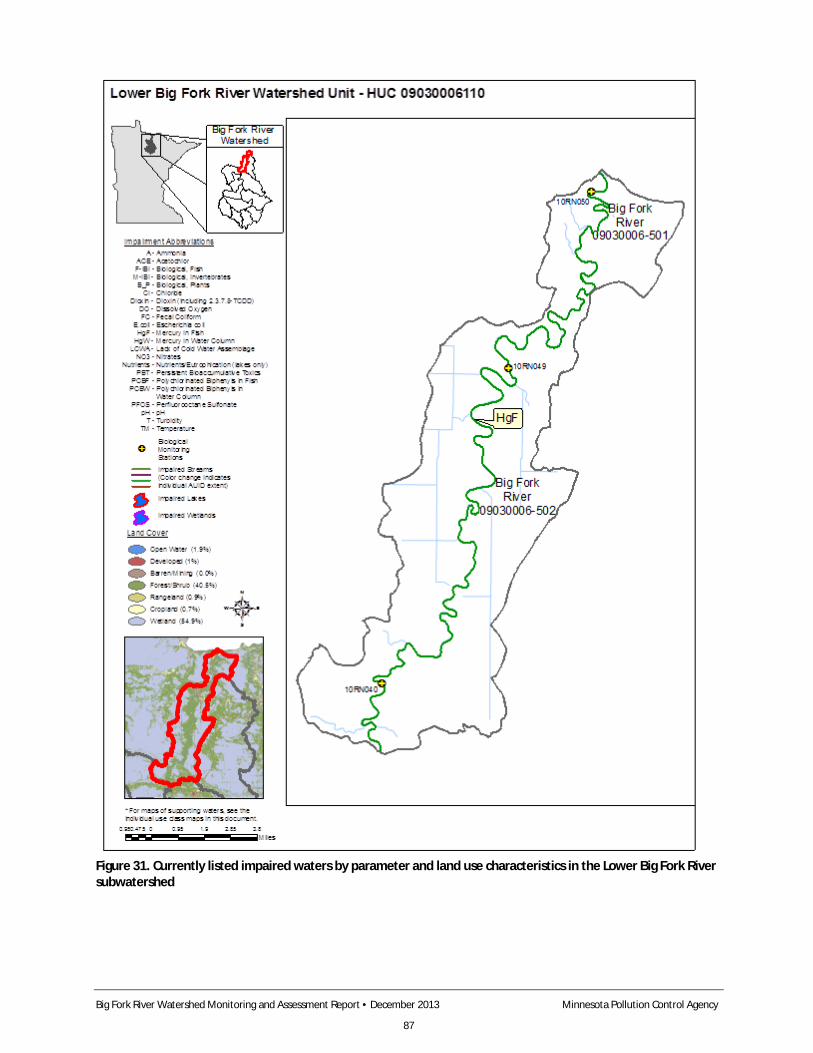
Big Fork River Watershed Monitoring and Assessment Report • December 2013 Minnesota Pollution Control Agency
87
Figure 31. Currently listed impaired waters by parameter and land use characteristics in the Lower Big Fork River subwatershed
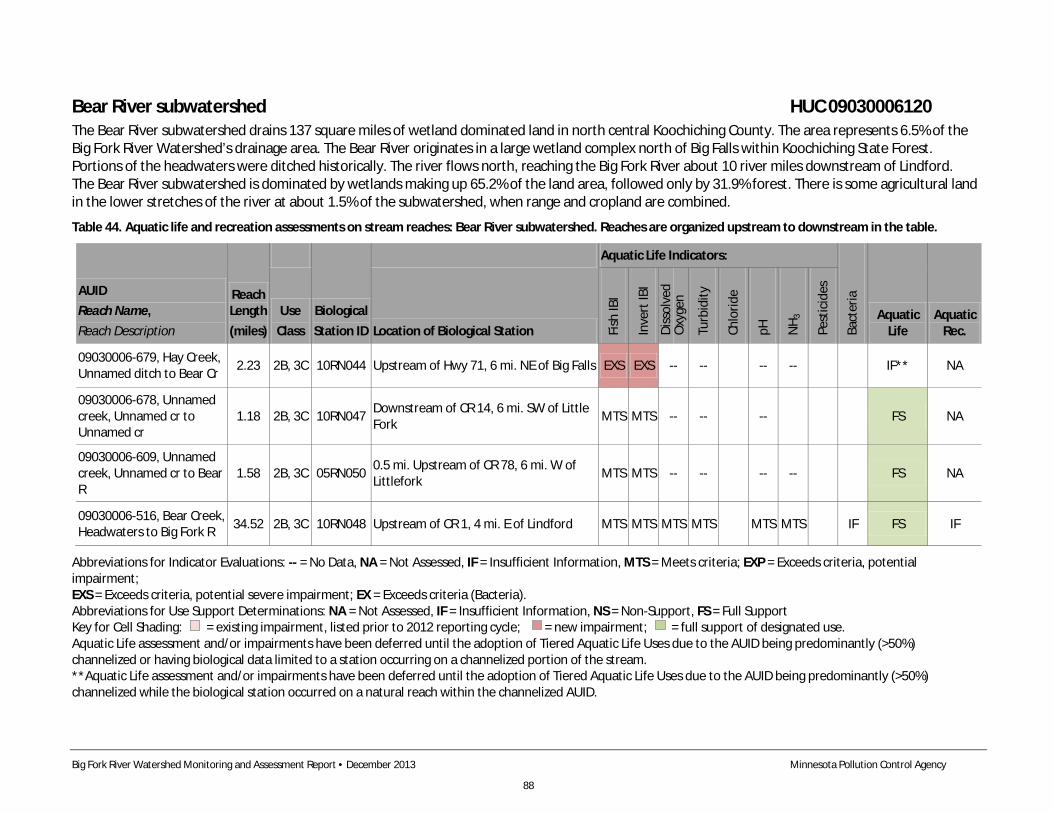
Big Fork River Watershed Monitoring and Assessment Report • December 2013 Minnesota Pollution Control Agency
88
Bear River subwatershed HUC 09030006120 The Bear River subwatershed drains 137 square miles of wetland dominated land in north central Koochiching County. The area represents 6.5% of the Big Fork River Watershed’s drainage area. The Bear River originates in a large wetland complex north of Big Falls within Koochiching State Forest. Portions of the headwaters were ditched historically. The river flows north, reaching the Big Fork River about 10 river miles downstream of Lindford. The Bear River subwatershed is dominated by wetlands making up 65.2% of the land area, followed only by 31.9% forest. There is some agricultural land in the lower stretches of the river at about 1.5% of the subwatershed, when range and cropland are combined.
Table 44. Aquatic life and recreation assessments on stream reaches: Bear River subwatershed. Reaches are organized upstream to downstream in the table.
AUID Reach Name, Reach Description
Reach Length (miles)
Biological Station ID
Aquatic Life Indicators:
Bact
eria
Aquatic Life
Aquatic Rec.
Use Class Location of Biological Station Fi
sh IB
I
Inve
rt IB
I
Diss
olve
d O
xyge
n
Turb
idity
Chlo
ride
pH
NH 3
Pest
icid
es
09030006-679, Hay Creek, Unnamed ditch to Bear Cr 2.23 2B, 3C 10RN044 Upstream of Hwy 71, 6 mi. NE of Big Falls EXS EXS -- -- -- -- IF** NA
09030006-678, Unnamed creek, Unnamed cr to Unnamed cr
1.18 2B, 3C 10RN047 Downstream of CR 14, 6 mi. SW of Little Fork MTS MTS -- -- -- FS NA
09030006-609, Unnamed creek, Unnamed cr to Bear R
1.58 2B, 3C 05RN050 0.5 mi. Upstream of CR 78, 6 mi. W of Littlefork MTS MTS -- -- -- -- FS NA
09030006-516, Bear Creek, Headwaters to Big Fork R 34.52 2B, 3C 10RN048 Upstream of CR 1, 4 mi. E of Lindford MTS MTS MTS MTS MTS MTS IF FS IF
Abbreviations for Indicator Evaluations: -- = No Data, NA = Not Assessed, IF = Insufficient Information, MTS = Meets criteria; EXP = Exceeds criteria, potential impairment; EXS = Exceeds criteria, potential severe impairment; EX = Exceeds criteria (Bacteria). Abbreviations for Use Support Determinations: NA = Not Assessed, IF = Insufficient Information, NS = Non-Support, FS = Full Support Key for Cell Shading: = existing impairment, listed prior to 2012 reporting cycle; = new impairment; = full support of designated use. Aquatic Life assessment and/or impairments have been deferred until the adoption of Tiered Aquatic Life Uses due to the AUID being predominantly (>50%) channelized or having biological data limited to a station occurring on a channelized portion of the stream. **Aquatic Life assessment and/or impairments have been deferred until the adoption of Tiered Aquatic Life Uses due to the AUID being predominantly (>50%) channelized while the biological station occurred on a natural reach within the channelized AUID.
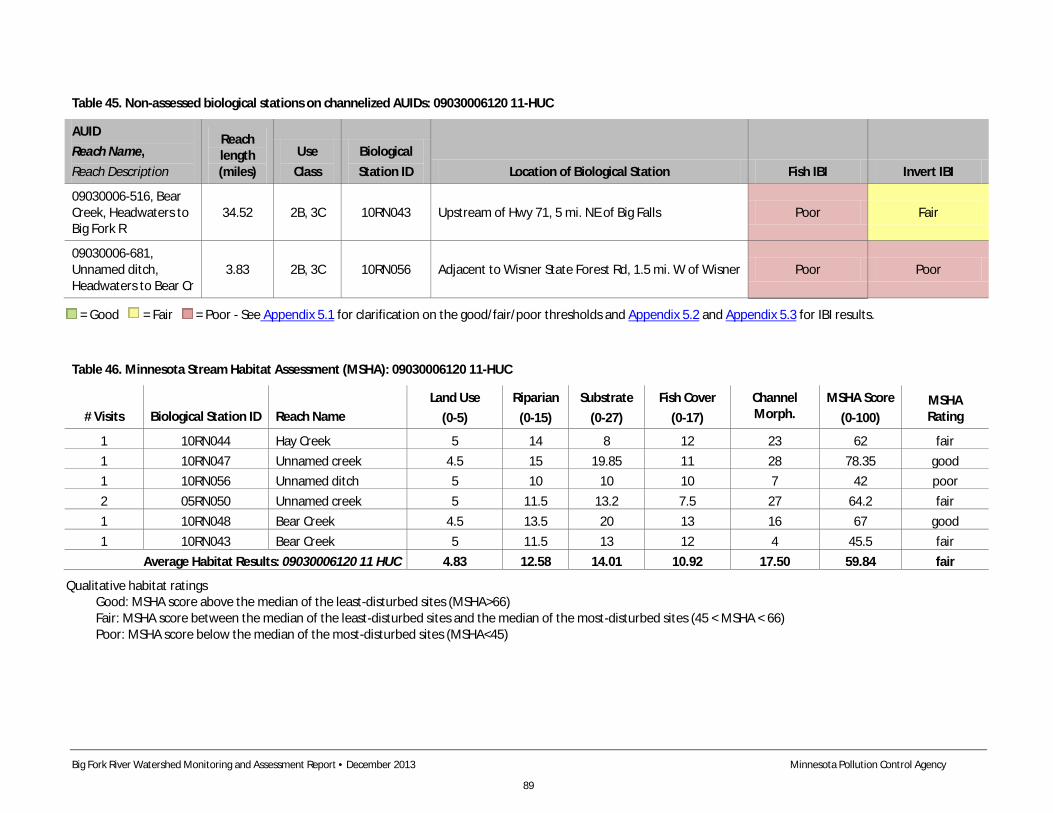
Big Fork River Watershed Monitoring and Assessment Report • December 2013 Minnesota Pollution Control Agency
89
Table 45. Non-assessed biological stations on channelized AUIDs: 09030006120 11-HUC
AUID Reach Name, Reach Description
Reach length (miles)
Use Class
Biological Station ID Location of Biological Station Fish IBI Invert IBI
09030006-516, Bear Creek, Headwaters to Big Fork R
34.52 2B, 3C 10RN043 Upstream of Hwy 71, 5 mi. NE of Big Falls Poor Fair
09030006-681, Unnamed ditch, Headwaters to Bear Cr
3.83 2B, 3C 10RN056 Adjacent to Wisner State Forest Rd, 1.5 mi. W of Wisner Poor Poor
= Good = Fair = Poor - See Appendix 5.1 for clarification on the good/fair/poor thresholds and Appendix 5.2 and Appendix 5.3 for IBI results.
Table 46. Minnesota Stream Habitat Assessment (MSHA): 09030006120 11-HUC
# Visits Biological Station ID Reach Name Land Use
(0-5) Riparian
(0-15) Substrate
(0-27) Fish Cover
(0-17) Channel Morph.
MSHA Score (0-100)
MSHA Rating
1 10RN044 Hay Creek 5 14 8 12 23 62 fair 1 10RN047 Unnamed creek 4.5 15 19.85 11 28 78.35 good 1 10RN056 Unnamed ditch 5 10 10 10 7 42 poor 2 05RN050 Unnamed creek 5 11.5 13.2 7.5 27 64.2 fair 1 10RN048 Bear Creek 4.5 13.5 20 13 16 67 good 1 10RN043 Bear Creek 5 11.5 13 12 4 45.5 fair
Average Habitat Results: 09030006120 11 HUC 4.83 12.58 14.01 10.92 17.50 59.84 fair
Qualitative habitat ratings Good: MSHA score above the median of the least-disturbed sites (MSHA>66) Fair: MSHA score between the median of the least-disturbed sites and the median of the most-disturbed sites (45 < MSHA < 66) Poor: MSHA score below the median of the most-disturbed sites (MSHA<45)
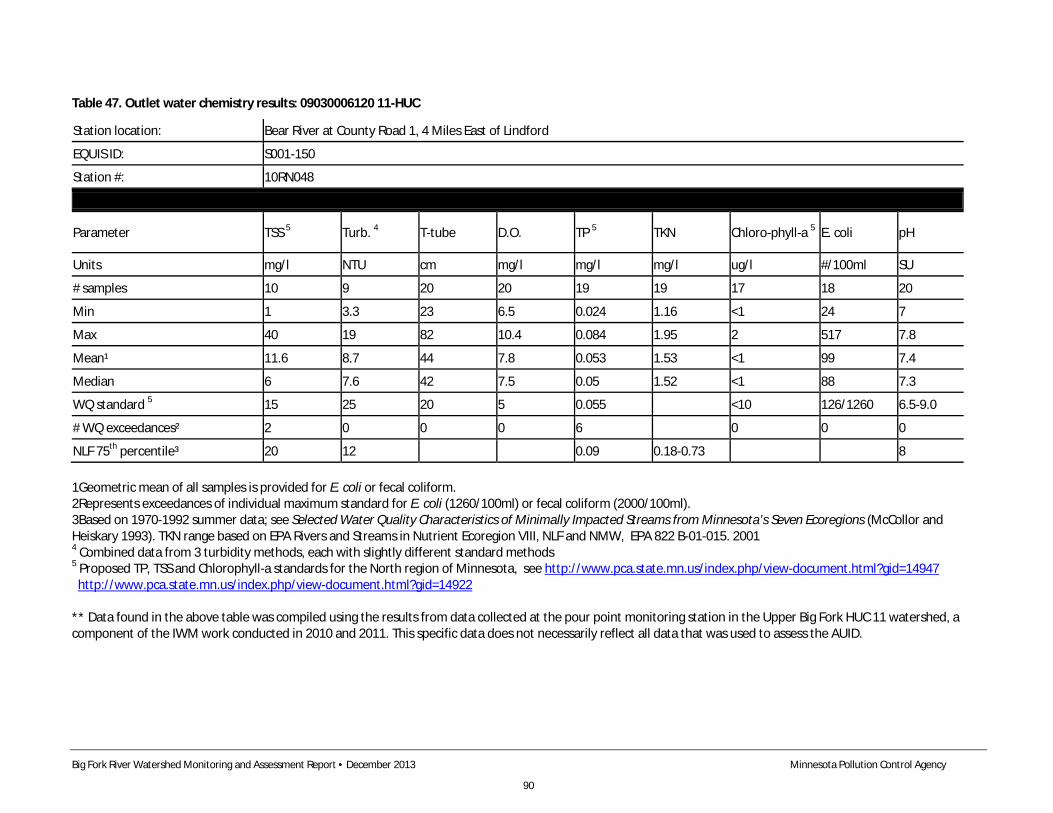
Big Fork River Watershed Monitoring and Assessment Report • December 2013 Minnesota Pollution Control Agency
90
Table 47. Outlet water chemistry results: 09030006120 11-HUC
Station location: Bear River at County Road 1, 4 Miles East of Lindford
EQUIS ID: S001-150
Station #: 10RN048
Parameter TSS 5 Turb. 4 T-tube D.O. TP 5 TKN Chloro-phyll-a 5 E. coli pH
Units mg/l NTU cm mg/l mg/l mg/l ug/l #/100ml SU
# samples 10 9 20 20 19 19 17 18 20
Min 1 3.3 23 6.5 0.024 1.16 <1 24 7
Max 40 19 82 10.4 0.084 1.95 2 517 7.8
Mean¹ 11.6 8.7 44 7.8 0.053 1.53 <1 99 7.4
Median 6 7.6 42 7.5 0.05 1.52 <1 88 7.3
WQ standard 5 15 25 20 5 0.055 <10 126/1260 6.5-9.0
# WQ exceedances² 2 0 0 0 6 0 0 0
NLF 75th percentile³ 20 12 0.09 0.18-0.73 8 1Geometric mean of all samples is provided for E. coli or fecal coliform. 2Represents exceedances of individual maximum standard for E. coli (1260/100ml) or fecal coliform (2000/100ml). 3Based on 1970-1992 summer data; see Selected Water Quality Characteristics of Minimally Impacted Streams from Minnesota’s Seven Ecoregions (McCollor and Heiskary 1993). TKN range based on EPA Rivers and Streams in Nutrient Ecoregion VIII, NLF and NMW, EPA 822 B-01-015. 2001 4 Combined data from 3 turbidity methods, each with slightly different standard methods 5 Proposed TP, TSS and Chlorophyll-a standards for the North region of Minnesota, see http://www.pca.state.mn.us/index.php/view-document.html?gid=14947 http://www.pca.state.mn.us/index.php/view-document.html?gid=14922 ** Data found in the above table was compiled using the results from data collected at the pour point monitoring station in the Upper Big Fork HUC 11 watershed, a component of the IWM work conducted in 2010 and 2011. This specific data does not necessarily reflect all data that was used to assess the AUID.
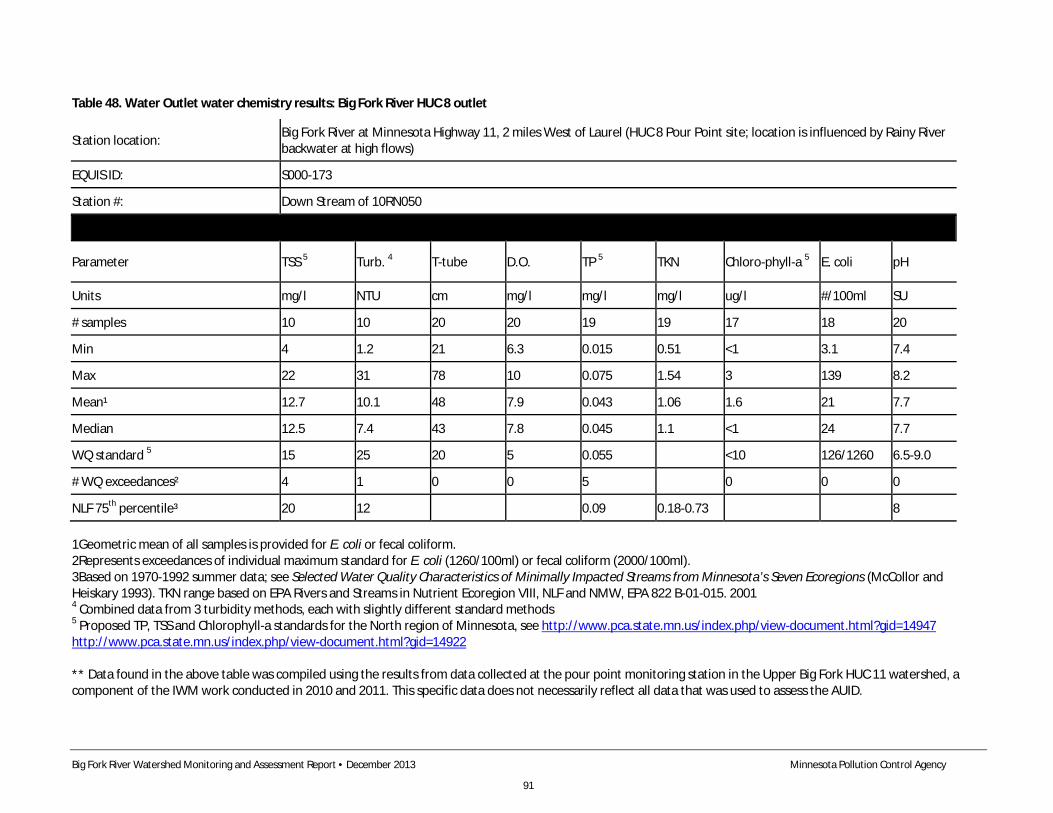
Big Fork River Watershed Monitoring and Assessment Report • December 2013 Minnesota Pollution Control Agency
91
Table 48. Water Outlet water chemistry results: Big Fork River HUC 8 outlet
Station location: Big Fork River at Minnesota Highway 11, 2 miles West of Laurel (HUC 8 Pour Point site; location is influenced by Rainy River backwater at high flows)
EQUIS ID: S000-173
Station #: Down Stream of 10RN050
Parameter TSS 5 Turb. 4 T-tube D.O. TP 5 TKN Chloro-phyll-a 5 E. coli pH
Units mg/l NTU cm mg/l mg/l mg/l ug/l #/100ml SU
# samples 10 10 20 20 19 19 17 18 20
Min 4 1.2 21 6.3 0.015 0.51 <1 3.1 7.4
Max 22 31 78 10 0.075 1.54 3 139 8.2
Mean¹ 12.7 10.1 48 7.9 0.043 1.06 1.6 21 7.7
Median 12.5 7.4 43 7.8 0.045 1.1 <1 24 7.7
WQ standard 5 15 25 20 5 0.055 <10 126/1260 6.5-9.0
# WQ exceedances² 4 1 0 0 5 0 0 0
NLF 75th percentile³ 20 12 0.09 0.18-0.73 8 1Geometric mean of all samples is provided for E. coli or fecal coliform. 2Represents exceedances of individual maximum standard for E. coli (1260/100ml) or fecal coliform (2000/100ml). 3Based on 1970-1992 summer data; see Selected Water Quality Characteristics of Minimally Impacted Streams from Minnesota’s Seven Ecoregions (McCollor and Heiskary 1993). TKN range based on EPA Rivers and Streams in Nutrient Ecoregion VIII, NLF and NMW, EPA 822 B-01-015. 2001 4 Combined data from 3 turbidity methods, each with slightly different standard methods 5 Proposed TP, TSS and Chlorophyll-a standards for the North region of Minnesota, see http://www.pca.state.mn.us/index.php/view-document.html?gid=14947 http://www.pca.state.mn.us/index.php/view-document.html?gid=14922 ** Data found in the above table was compiled using the results from data collected at the pour point monitoring station in the Upper Big Fork HUC 11 watershed, a component of the IWM work conducted in 2010 and 2011. This specific data does not necessarily reflect all data that was used to assess the AUID.
Big Fork River Watershed Monitoring and Assessment Report • December 2013 Minnesota Pollution Control Agency
92
Summary There were three stream segments assessed in the Bear River subwatershed and one that was not assessed due to channelization. A largely channelized segment of Hay Creek (10RN044) did not meet either the fish or macroinvertebrate impairment thresholds. However, due to extensive channelization throughout the reach an overall assessment was not made. The remaining three assessable stream segments met biological standards for both fish and macroinvertebrates as well as the chemical standards. The two channelized AUIDs rated poorly for biology and had the lowest MSHA scores. Overall, the MSHA rating was fair, but had only natural channels been included in the average the overall MSHA rating would have been good.
The water chemistry monitoring site for this subwatershed was on the Bear River at the Koochiching County Highway 1 Bridge, four miles east of Lindford. In general, results indicate good water quality. Sediment and turbidity levels are low. Nutrient concentrations are within expected ranges, although they occasionally exceeded the draft standards during low or high flow conditions. The data indicated full support of aquatic life use, based on DO and turbidity data. Bacteria concentrations were higher here than most other upstream subwatersheds. One monthly geometric mean value exceeded the standard, but no individual samples exceeded the maximum standard of 1,260 counts/100 mL. Because the results were not conclusive there was not sufficient information to make an assessment decision regarding aquatic recreational use. Additional bacteria monitoring is suggested at this location to collect a more robust dataset.
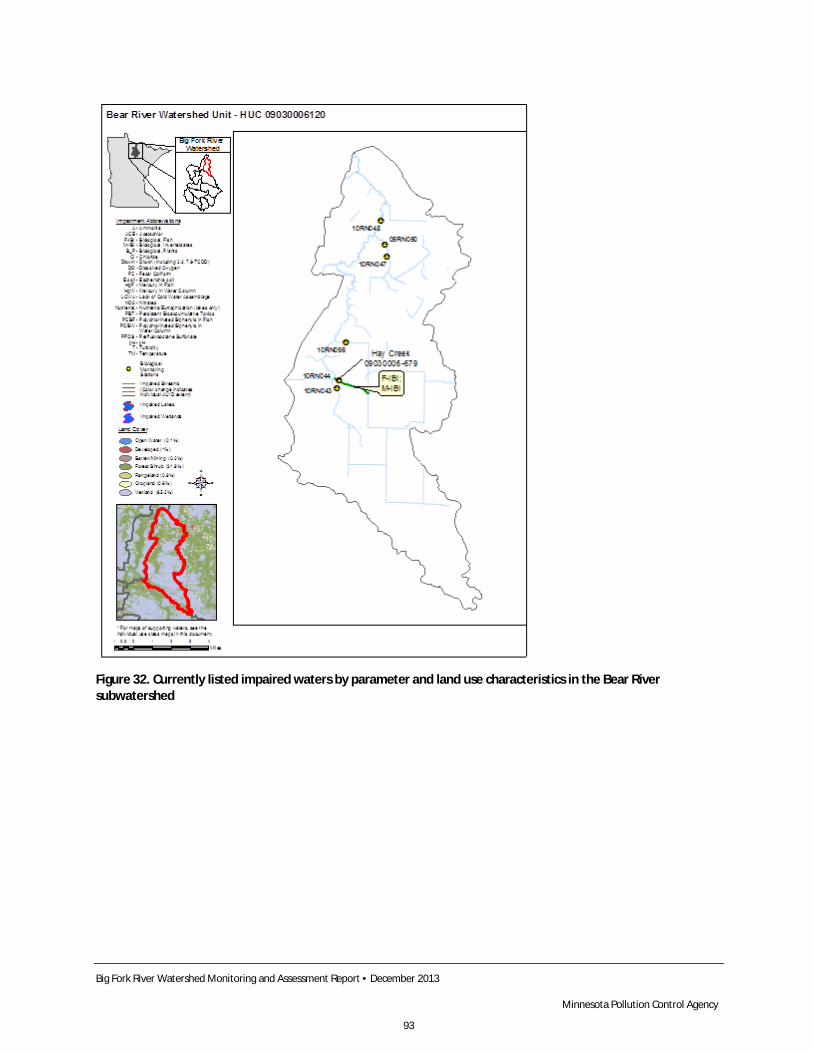
Big Fork River Watershed Monitoring and Assessment Report • December 2013 Minnesota Pollution Control Agency
93
Figure 32. Currently listed impaired waters by parameter and land use characteristics in the Bear River subwatershed
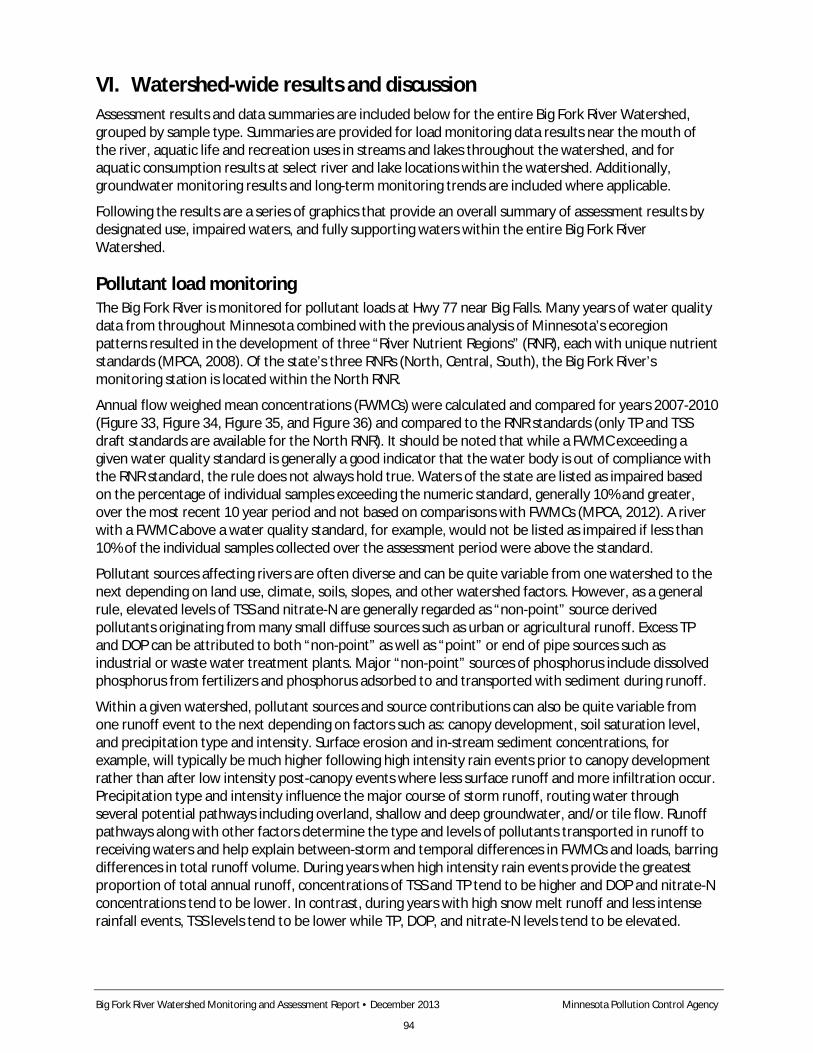
Big Fork River Watershed Monitoring and Assessment Report • December 2013 Minnesota Pollution Control Agency
94
VI. Watershed-wide results and discussion Assessment results and data summaries are included below for the entire Big Fork River Watershed, grouped by sample type. Summaries are provided for load monitoring data results near the mouth of the river, aquatic life and recreation uses in streams and lakes throughout the watershed, and for aquatic consumption results at select river and lake locations within the watershed. Additionally, groundwater monitoring results and long-term monitoring trends are included where applicable.
Following the results are a series of graphics that provide an overall summary of assessment results by designated use, impaired waters, and fully supporting waters within the entire Big Fork River Watershed.
Pollutant load monitoring The Big Fork River is monitored for pollutant loads at Hwy 77 near Big Falls. Many years of water quality data from throughout Minnesota combined with the previous analysis of Minnesota’s ecoregion patterns resulted in the development of three “River Nutrient Regions” (RNR), each with unique nutrient standards (MPCA, 2008). Of the state’s three RNRs (North, Central, South), the Big Fork River’s monitoring station is located within the North RNR.
Annual flow weighed mean concentrations (FWMCs) were calculated and compared for years 2007-2010 (Figure 33, Figure 34, Figure 35, and Figure 36) and compared to the RNR standards (only TP and TSS draft standards are available for the North RNR). It should be noted that while a FWMC exceeding a given water quality standard is generally a good indicator that the water body is out of compliance with the RNR standard, the rule does not always hold true. Waters of the state are listed as impaired based on the percentage of individual samples exceeding the numeric standard, generally 10% and greater, over the most recent 10 year period and not based on comparisons with FWMCs (MPCA, 2012). A river with a FWMC above a water quality standard, for example, would not be listed as impaired if less than 10% of the individual samples collected over the assessment period were above the standard.
Pollutant sources affecting rivers are often diverse and can be quite variable from one watershed to the next depending on land use, climate, soils, slopes, and other watershed factors. However, as a general rule, elevated levels of TSS and nitrate-N are generally regarded as “non-point” source derived pollutants originating from many small diffuse sources such as urban or agricultural runoff. Excess TP and DOP can be attributed to both “non-point” as well as “point” or end of pipe sources such as industrial or waste water treatment plants. Major “non-point” sources of phosphorus include dissolved phosphorus from fertilizers and phosphorus adsorbed to and transported with sediment during runoff.
Within a given watershed, pollutant sources and source contributions can also be quite variable from one runoff event to the next depending on factors such as: canopy development, soil saturation level, and precipitation type and intensity. Surface erosion and in-stream sediment concentrations, for example, will typically be much higher following high intensity rain events prior to canopy development rather than after low intensity post-canopy events where less surface runoff and more infiltration occur. Precipitation type and intensity influence the major course of storm runoff, routing water through several potential pathways including overland, shallow and deep groundwater, and/or tile flow. Runoff pathways along with other factors determine the type and levels of pollutants transported in runoff to receiving waters and help explain between-storm and temporal differences in FWMCs and loads, barring differences in total runoff volume. During years when high intensity rain events provide the greatest proportion of total annual runoff, concentrations of TSS and TP tend to be higher and DOP and nitrate-N concentrations tend to be lower. In contrast, during years with high snow melt runoff and less intense rainfall events, TSS levels tend to be lower while TP, DOP, and nitrate-N levels tend to be elevated.
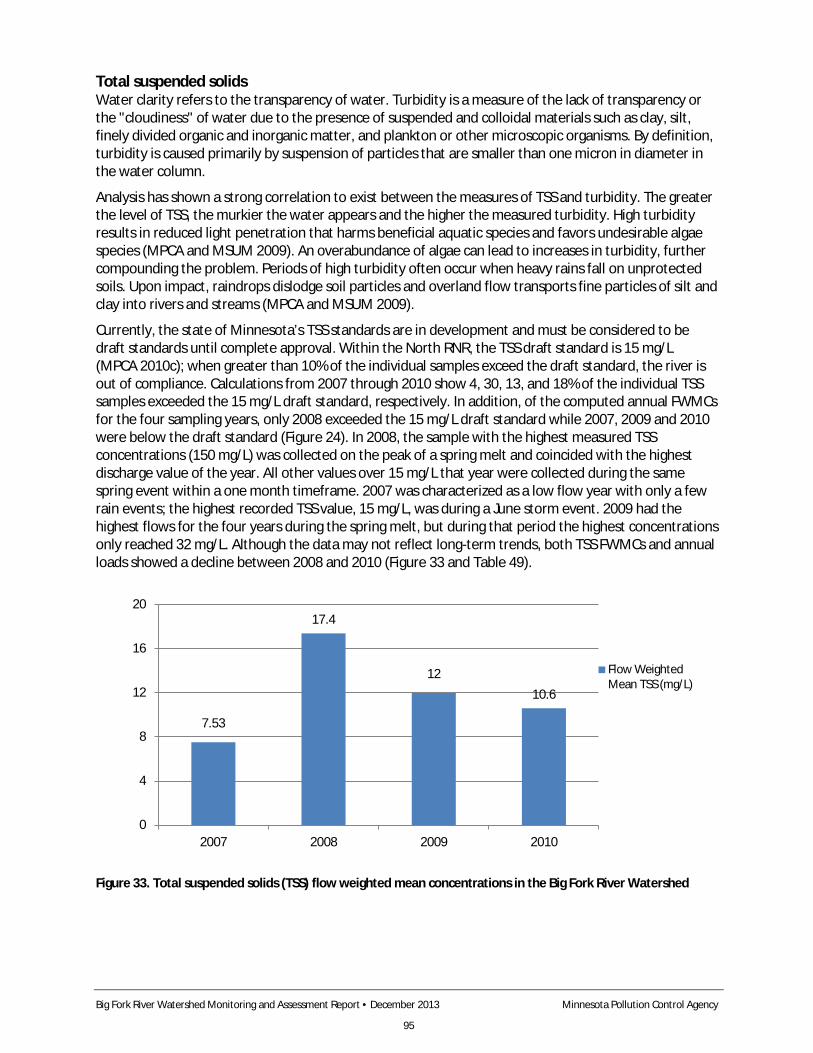
Big Fork River Watershed Monitoring and Assessment Report • December 2013 Minnesota Pollution Control Agency
95
Total suspended solids Water clarity refers to the transparency of water. Turbidity is a measure of the lack of transparency or the "cloudiness" of water due to the presence of suspended and colloidal materials such as clay, silt, finely divided organic and inorganic matter, and plankton or other microscopic organisms. By definition, turbidity is caused primarily by suspension of particles that are smaller than one micron in diameter in the water column.
Analysis has shown a strong correlation to exist between the measures of TSS and turbidity. The greater the level of TSS, the murkier the water appears and the higher the measured turbidity. High turbidity results in reduced light penetration that harms beneficial aquatic species and favors undesirable algae species (MPCA and MSUM 2009). An overabundance of algae can lead to increases in turbidity, further compounding the problem. Periods of high turbidity often occur when heavy rains fall on unprotected soils. Upon impact, raindrops dislodge soil particles and overland flow transports fine particles of silt and clay into rivers and streams (MPCA and MSUM 2009).
Currently, the state of Minnesota’s TSS standards are in development and must be considered to be draft standards until complete approval. Within the North RNR, the TSS draft standard is 15 mg/L (MPCA 2010c); when greater than 10% of the individual samples exceed the draft standard, the river is out of compliance. Calculations from 2007 through 2010 show 4, 30, 13, and 18% of the individual TSS samples exceeded the 15 mg/L draft standard, respectively. In addition, of the computed annual FWMCs for the four sampling years, only 2008 exceeded the 15 mg/L draft standard while 2007, 2009 and 2010 were below the draft standard (Figure 24). In 2008, the sample with the highest measured TSS concentrations (150 mg/L) was collected on the peak of a spring melt and coincided with the highest discharge value of the year. All other values over 15 mg/L that year were collected during the same spring event within a one month timeframe. 2007 was characterized as a low flow year with only a few rain events; the highest recorded TSS value, 15 mg/L, was during a June storm event. 2009 had the highest flows for the four years during the spring melt, but during that period the highest concentrations only reached 32 mg/L. Although the data may not reflect long-term trends, both TSS FWMCs and annual loads showed a decline between 2008 and 2010 (Figure 33 and Table 49).
Figure 33. Total suspended solids (TSS) flow weighted mean concentrations in the Big Fork River Watershed
7.53
17.4
12 10.6
0
4
8
12
16
20
2007 2008 2009 2010
Flow WeightedMean TSS (mg/L)
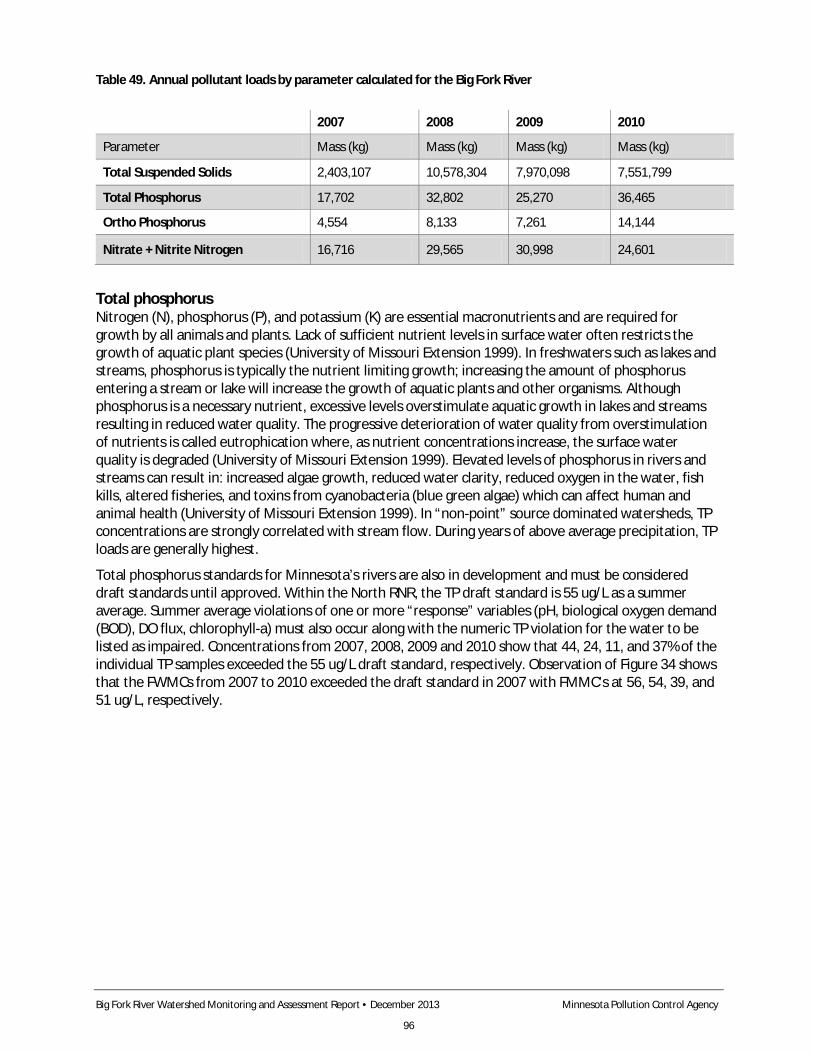
Big Fork River Watershed Monitoring and Assessment Report • December 2013 Minnesota Pollution Control Agency
96
Table 49. Annual pollutant loads by parameter calculated for the Big Fork River
Total phosphorus Nitrogen (N), phosphorus (P), and potassium (K) are essential macronutrients and are required for growth by all animals and plants. Lack of sufficient nutrient levels in surface water often restricts the growth of aquatic plant species (University of Missouri Extension 1999). In freshwaters such as lakes and streams, phosphorus is typically the nutrient limiting growth; increasing the amount of phosphorus entering a stream or lake will increase the growth of aquatic plants and other organisms. Although phosphorus is a necessary nutrient, excessive levels overstimulate aquatic growth in lakes and streams resulting in reduced water quality. The progressive deterioration of water quality from overstimulation of nutrients is called eutrophication where, as nutrient concentrations increase, the surface water quality is degraded (University of Missouri Extension 1999). Elevated levels of phosphorus in rivers and streams can result in: increased algae growth, reduced water clarity, reduced oxygen in the water, fish kills, altered fisheries, and toxins from cyanobacteria (blue green algae) which can affect human and animal health (University of Missouri Extension 1999). In “non-point” source dominated watersheds, TP concentrations are strongly correlated with stream flow. During years of above average precipitation, TP loads are generally highest.
Total phosphorus standards for Minnesota’s rivers are also in development and must be considered draft standards until approved. Within the North RNR, the TP draft standard is 55 ug/L as a summer average. Summer average violations of one or more “response” variables (pH, biological oxygen demand (BOD), DO flux, chlorophyll-a) must also occur along with the numeric TP violation for the water to be listed as impaired. Concentrations from 2007, 2008, 2009 and 2010 show that 44, 24, 11, and 37% of the individual TP samples exceeded the 55 ug/L draft standard, respectively. Observation of Figure 34 shows that the FWMCs from 2007 to 2010 exceeded the draft standard in 2007 with FMMC’s at 56, 54, 39, and 51 ug/L, respectively.
2007 2008 2009 2010
Parameter Mass (kg) Mass (kg) Mass (kg) Mass (kg)
Total Suspended Solids 2,403,107 10,578,304 7,970,098 7,551,799
Total Phosphorus 17,702 32,802 25,270 36,465
Ortho Phosphorus 4,554 8,133 7,261 14,144
Nitrate + Nitrite Nitrogen 16,716 29,565 30,998 24,601
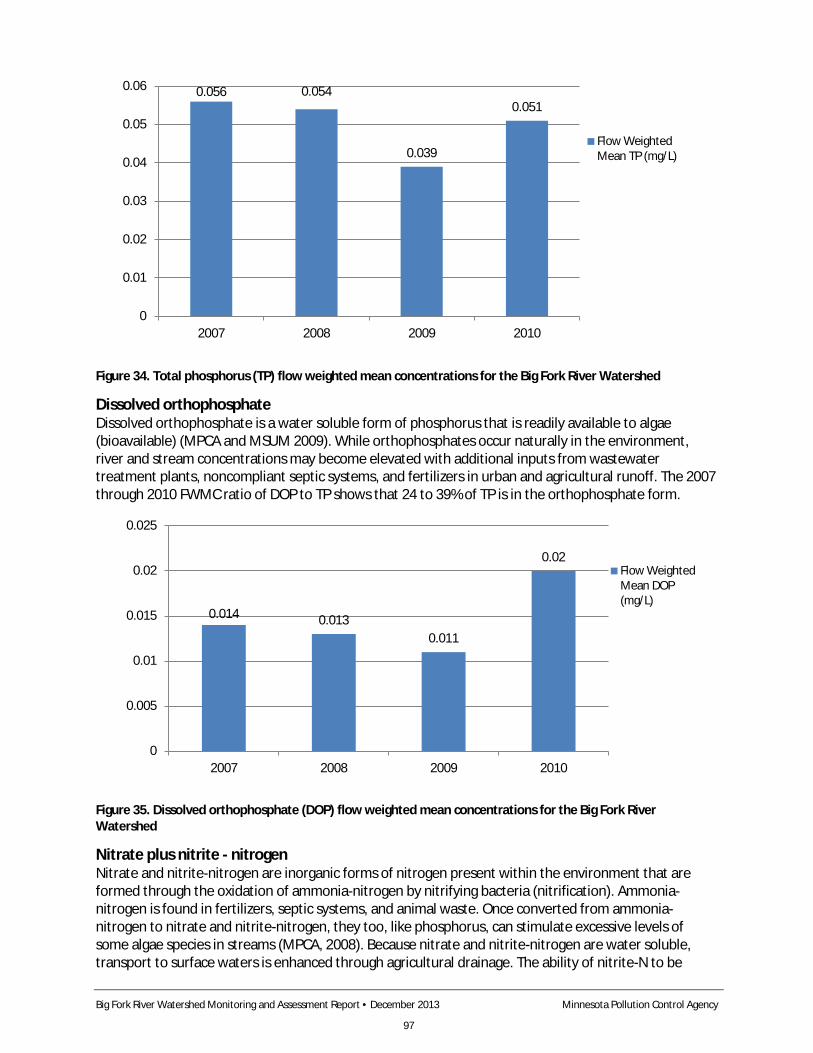
Big Fork River Watershed Monitoring and Assessment Report • December 2013 Minnesota Pollution Control Agency
97
Figure 34. Total phosphorus (TP) flow weighted mean concentrations for the Big Fork River Watershed
Dissolved orthophosphate Dissolved orthophosphate is a water soluble form of phosphorus that is readily available to algae (bioavailable) (MPCA and MSUM 2009). While orthophosphates occur naturally in the environment, river and stream concentrations may become elevated with additional inputs from wastewater treatment plants, noncompliant septic systems, and fertilizers in urban and agricultural runoff. The 2007 through 2010 FWMC ratio of DOP to TP shows that 24 to 39% of TP is in the orthophosphate form.
Figure 35. Dissolved orthophosphate (DOP) flow weighted mean concentrations for the Big Fork River Watershed
Nitrate plus nitrite - nitrogen Nitrate and nitrite-nitrogen are inorganic forms of nitrogen present within the environment that are formed through the oxidation of ammonia-nitrogen by nitrifying bacteria (nitrification). Ammonia-nitrogen is found in fertilizers, septic systems, and animal waste. Once converted from ammonia-nitrogen to nitrate and nitrite-nitrogen, they too, like phosphorus, can stimulate excessive levels of some algae species in streams (MPCA, 2008). Because nitrate and nitrite-nitrogen are water soluble, transport to surface waters is enhanced through agricultural drainage. The ability of nitrite-N to be
0.056 0.054
0.039
0.051
0
0.01
0.02
0.03
0.04
0.05
0.06
2007 2008 2009 2010
Flow WeightedMean TP (mg/L)
0.014 0.013 0.011
0.02
0
0.005
0.01
0.015
0.02
0.025
2007 2008 2009 2010
Flow WeightedMean DOP(mg/L)
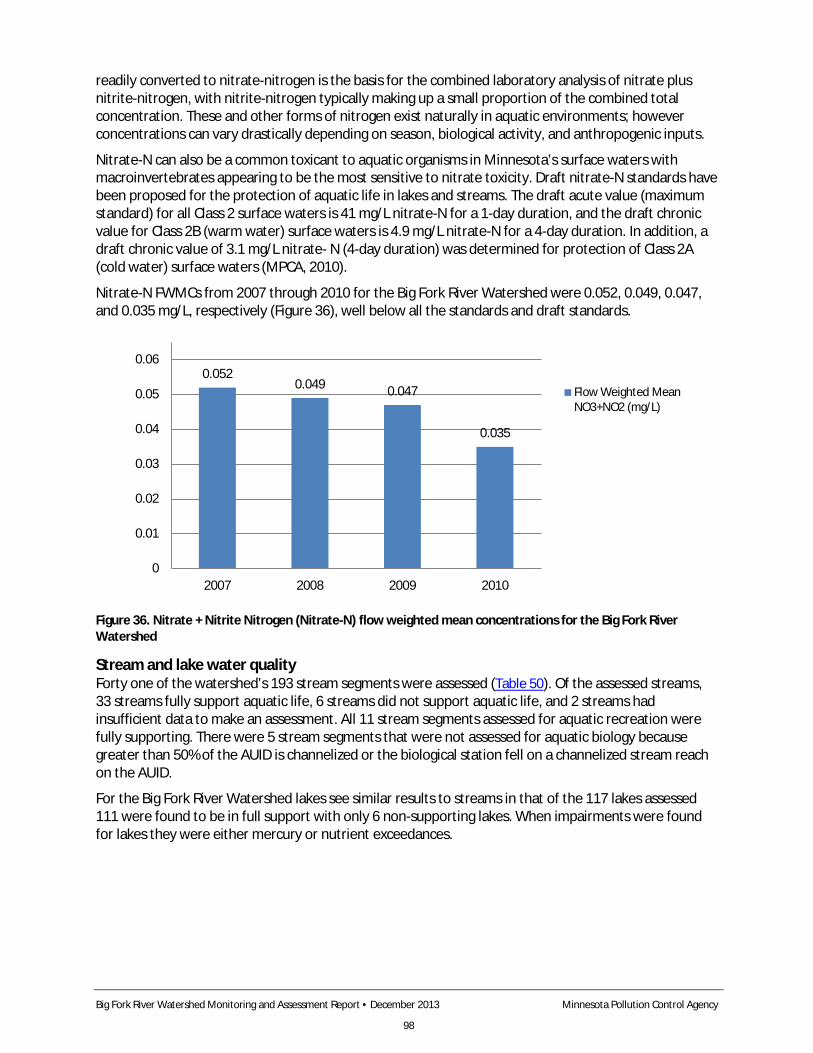
Big Fork River Watershed Monitoring and Assessment Report • December 2013 Minnesota Pollution Control Agency
98
readily converted to nitrate-nitrogen is the basis for the combined laboratory analysis of nitrate plus nitrite-nitrogen, with nitrite-nitrogen typically making up a small proportion of the combined total concentration. These and other forms of nitrogen exist naturally in aquatic environments; however concentrations can vary drastically depending on season, biological activity, and anthropogenic inputs.
Nitrate-N can also be a common toxicant to aquatic organisms in Minnesota’s surface waters with macroinvertebrates appearing to be the most sensitive to nitrate toxicity. Draft nitrate-N standards have been proposed for the protection of aquatic life in lakes and streams. The draft acute value (maximum standard) for all Class 2 surface waters is 41 mg/L nitrate-N for a 1-day duration, and the draft chronic value for Class 2B (warm water) surface waters is 4.9 mg/L nitrate-N for a 4-day duration. In addition, a draft chronic value of 3.1 mg/L nitrate- N (4-day duration) was determined for protection of Class 2A (cold water) surface waters (MPCA, 2010).
Nitrate-N FWMCs from 2007 through 2010 for the Big Fork River Watershed were 0.052, 0.049, 0.047, and 0.035 mg/L, respectively (Figure 36), well below all the standards and draft standards.
Figure 36. Nitrate + Nitrite Nitrogen (Nitrate-N) flow weighted mean concentrations for the Big Fork River Watershed
Stream and lake water quality Forty one of the watershed’s 193 stream segments were assessed (Table 50). Of the assessed streams, 33 streams fully support aquatic life, 6 streams did not support aquatic life, and 2 streams had insufficient data to make an assessment. All 11 stream segments assessed for aquatic recreation were fully supporting. There were 5 stream segments that were not assessed for aquatic biology because greater than 50% of the AUID is channelized or the biological station fell on a channelized stream reach on the AUID.
For the Big Fork River Watershed lakes see similar results to streams in that of the 117 lakes assessed 111 were found to be in full support with only 6 non-supporting lakes. When impairments were found for lakes they were either mercury or nutrient exceedances.
0.052 0.049 0.047
0.035
0
0.01
0.02
0.03
0.04
0.05
0.06
2007 2008 2009 2010
Flow Weighted MeanNO3+NO2 (mg/L)
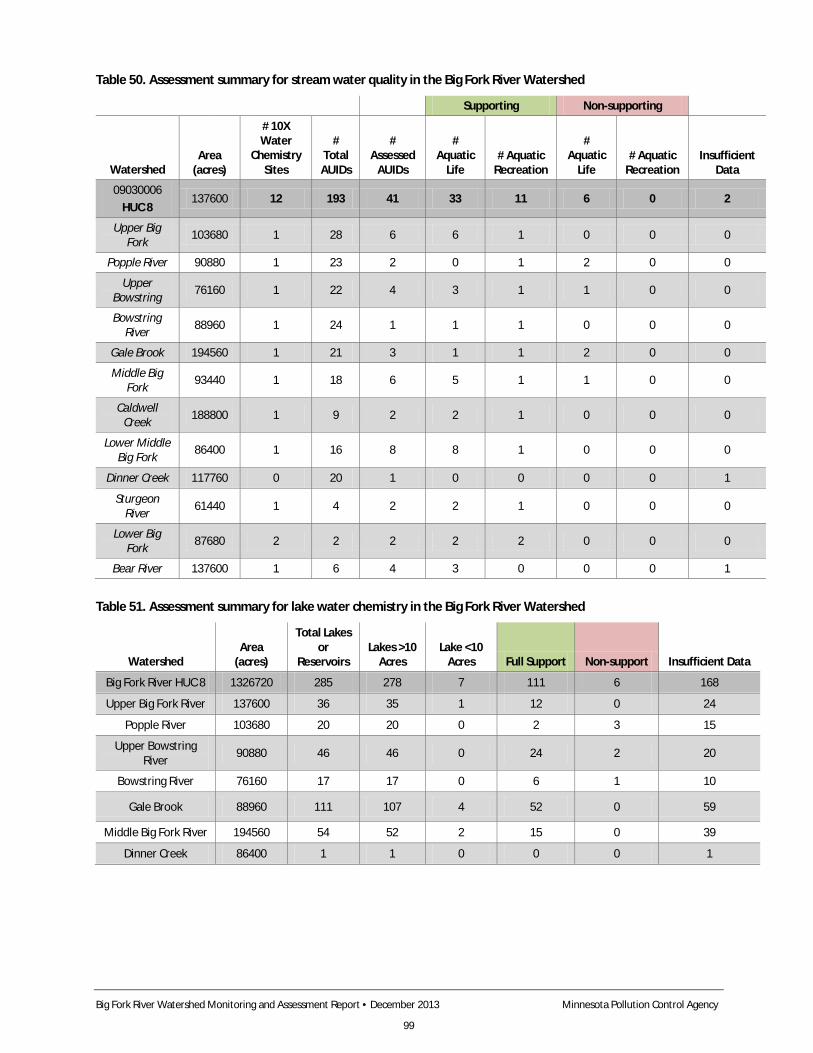
Big Fork River Watershed Monitoring and Assessment Report • December 2013 Minnesota Pollution Control Agency
99
Table 50. Assessment summary for stream water quality in the Big Fork River Watershed
Supporting Non-supporting
Watershed Area
(acres)
# 10X Water
Chemistry Sites
# Total
AUIDs
# Assessed
AUIDs
# Aquatic
Life # Aquatic
Recreation
# Aquatic
Life # Aquatic
Recreation Insufficient
Data
09030006 HUC 8
137600 12 193 41 33 11 6 0 2
Upper Big Fork 103680 1 28 6 6 1 0 0 0
Popple River 90880 1 23 2 0 1 2 0 0
Upper Bowstring 76160 1 22 4 3 1 1 0 0
Bowstring River 88960 1 24 1 1 1 0 0 0
Gale Brook 194560 1 21 3 1 1 2 0 0
Middle Big Fork 93440 1 18 6 5 1 1 0 0
Caldwell Creek 188800 1 9 2 2 1 0 0 0
Lower Middle Big Fork 86400 1 16 8 8 1 0 0 0
Dinner Creek 117760 0 20 1 0 0 0 0 1
Sturgeon River 61440 1 4 2 2 1 0 0 0
Lower Big Fork 87680 2 2 2 2 2 0 0 0
Bear River 137600 1 6 4 3 0 0 0 1
Table 51. Assessment summary for lake water chemistry in the Big Fork River Watershed
Watershed Area
(acres)
Total Lakes or
Reservoirs Lakes >10
Acres Lake <10
Acres Full Support Non-support Insufficient Data
Big Fork River HUC 8 1326720 285 278 7 111 6 168
Upper Big Fork River 137600 36 35 1 12 0 24
Popple River 103680 20 20 0 2 3 15
Upper Bowstring River 90880 46 46 0 24 2 20
Bowstring River 76160 17 17 0 6 1 10
Gale Brook 88960 111 107 4 52 0 59
Middle Big Fork River 194560 54 52 2 15 0 39
Dinner Creek 86400 1 1 0 0 0 1
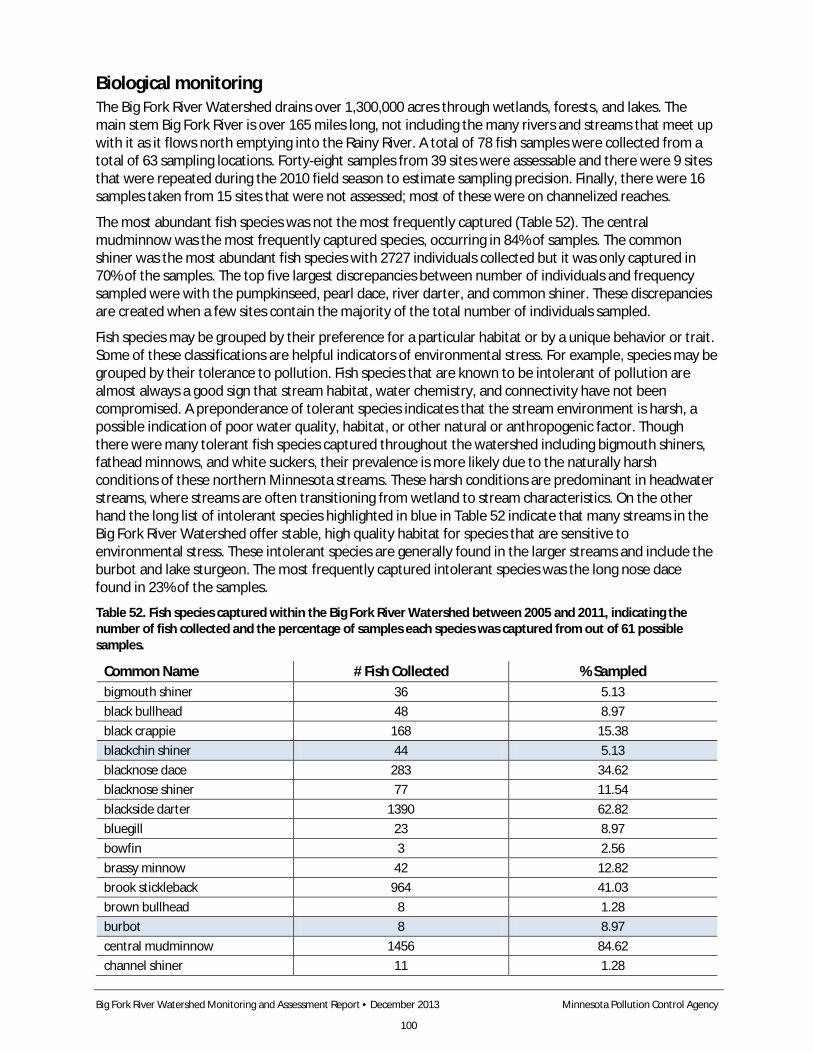
Big Fork River Watershed Monitoring and Assessment Report • December 2013 Minnesota Pollution Control Agency
100
Biological monitoring The Big Fork River Watershed drains over 1,300,000 acres through wetlands, forests, and lakes. The main stem Big Fork River is over 165 miles long, not including the many rivers and streams that meet up with it as it flows north emptying into the Rainy River. A total of 78 fish samples were collected from a total of 63 sampling locations. Forty-eight samples from 39 sites were assessable and there were 9 sites that were repeated during the 2010 field season to estimate sampling precision. Finally, there were 16 samples taken from 15 sites that were not assessed; most of these were on channelized reaches.
The most abundant fish species was not the most frequently captured (Table 52). The central mudminnow was the most frequently captured species, occurring in 84% of samples. The common shiner was the most abundant fish species with 2727 individuals collected but it was only captured in 70% of the samples. The top five largest discrepancies between number of individuals and frequency sampled were with the pumpkinseed, pearl dace, river darter, and common shiner. These discrepancies are created when a few sites contain the majority of the total number of individuals sampled.
Fish species may be grouped by their preference for a particular habitat or by a unique behavior or trait. Some of these classifications are helpful indicators of environmental stress. For example, species may be grouped by their tolerance to pollution. Fish species that are known to be intolerant of pollution are almost always a good sign that stream habitat, water chemistry, and connectivity have not been compromised. A preponderance of tolerant species indicates that the stream environment is harsh, a possible indication of poor water quality, habitat, or other natural or anthropogenic factor. Though there were many tolerant fish species captured throughout the watershed including bigmouth shiners, fathead minnows, and white suckers, their prevalence is more likely due to the naturally harsh conditions of these northern Minnesota streams. These harsh conditions are predominant in headwater streams, where streams are often transitioning from wetland to stream characteristics. On the other hand the long list of intolerant species highlighted in blue in Table 52 indicate that many streams in the Big Fork River Watershed offer stable, high quality habitat for species that are sensitive to environmental stress. These intolerant species are generally found in the larger streams and include the burbot and lake sturgeon. The most frequently captured intolerant species was the long nose dace found in 23% of the samples.
Table 52. Fish species captured within the Big Fork River Watershed between 2005 and 2011, indicating the number of fish collected and the percentage of samples each species was captured from out of 61 possible samples.
Common Name # Fish Collected % Sampled bigmouth shiner 36 5.13 black bullhead 48 8.97 black crappie 168 15.38 blackchin shiner 44 5.13 blacknose dace 283 34.62 blacknose shiner 77 11.54 blackside darter 1390 62.82 bluegill 23 8.97 bowfin 3 2.56 brassy minnow 42 12.82 brook stickleback 964 41.03 brown bullhead 8 1.28 burbot 8 8.97 central mudminnow 1456 84.62 channel shiner 11 1.28
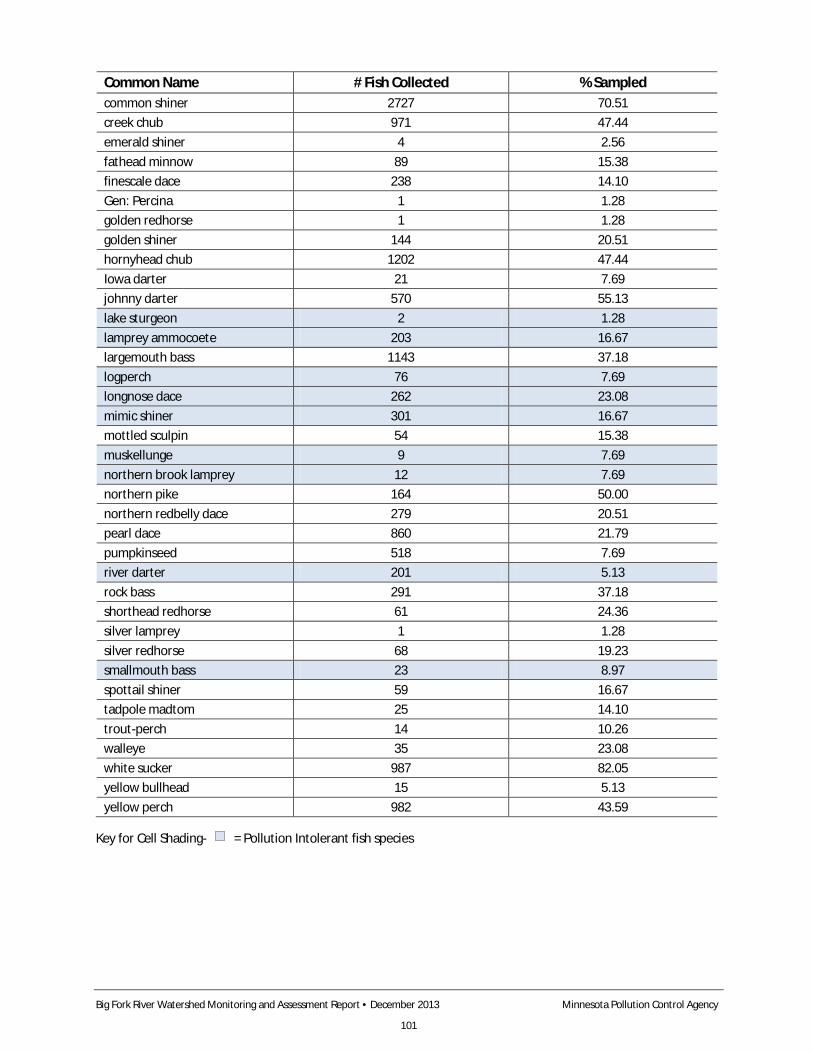
Big Fork River Watershed Monitoring and Assessment Report • December 2013 Minnesota Pollution Control Agency
101
Common Name # Fish Collected % Sampled common shiner 2727 70.51 creek chub 971 47.44 emerald shiner 4 2.56 fathead minnow 89 15.38 finescale dace 238 14.10 Gen: Percina 1 1.28 golden redhorse 1 1.28 golden shiner 144 20.51 hornyhead chub 1202 47.44 Iowa darter 21 7.69 johnny darter 570 55.13 lake sturgeon 2 1.28 lamprey ammocoete 203 16.67 largemouth bass 1143 37.18 logperch 76 7.69 longnose dace 262 23.08 mimic shiner 301 16.67 mottled sculpin 54 15.38 muskellunge 9 7.69 northern brook lamprey 12 7.69 northern pike 164 50.00 northern redbelly dace 279 20.51 pearl dace 860 21.79 pumpkinseed 518 7.69 river darter 201 5.13 rock bass 291 37.18 shorthead redhorse 61 24.36 silver lamprey 1 1.28 silver redhorse 68 19.23 smallmouth bass 23 8.97 spottail shiner 59 16.67 tadpole madtom 25 14.10 trout-perch 14 10.26 walleye 35 23.08 white sucker 987 82.05 yellow bullhead 15 5.13 yellow perch 982 43.59
Key for Cell Shading- = Pollution Intolerant fish species
Big Fork River Watershed Monitoring and Assessment Report • December 2013 Minnesota Pollution Control Agency
102
Fish contaminant results Fish species are identified by codes that are defined by their common and scientific names in Table 53. In this watershed, mercury has been measured in six fish species, PCBs in eight species, and PFCs in three species. A total of 780 fish were analyzed from the Big Fork River and 20 lakes in the watershed.
Table 54 shows which waterways are impaired for aquatic consumption (i.e., fish contaminants). Big Fork River and 12 (60%) of the lakes are impaired due to elevated levels of mercury (Hg) in fish tissue. Table 54 also shows the number of fish tested by waterway and species. Northern pike (NP) was the most commonly tested fish, followed by walleye (WE). Together they represent 57% of the tested fish.
Table 55 is a summary of contaminant concentrations by waterway, fish species, and year. The table shows which contaminants, species, and years were sampled within a given waterway. “Total Fish” and “Samples” are shown because most of the samples before 1990, and many of the panfish since then, were composite samples—multiple fish homogenized into a single sample. Sample years ranged from 1981 to 2011. Most of the samples were skin-on fillets (FILSK) or for fish without scales (catfish and bullheads), skin-off fillets (FILET). Yellow perch were homogenized as whole fish (WHORG) because of their small size.
Mercury was measured in 362 samples. All of the lakes (and the river) had at least one fish species with mean mercury concentrations exceeding the 0.2 mg/kg threshold, including those lakes not listed as impaired. The lakes not on the Impaired Waters List either have old data (before 1990) or the sample sizes for a given fish species were less than five. The highest mercury concentration was in a WE collected in 1985 from Big Fork River. No WE were collected from the river in 2010; NP collected from the river in 2010 had mercury concentrations ranging from 0.381 to 0.918 mg/kg, which are still quite high levels.
PCBs were measured in 35 fish samples. Total PCB concentrations were generally below the detection limit. The maximum total PCBs concentration was 0.067mg/kg in a WE collected in 1992 from Caribou Lake (31062000). The impairment threshold for PCBs is 0.22 mg/kg.
PFOS was measured in six fish from Round Lake (31089600) and one bluegill sunfish (BGS) from Horseshoe Lake (31069600). All PFOS concentrations were below the detection limit.
Overall, mercury in fish tissue remains a major concern in this watershed. PCBs and PFOS concentrations were mostly below the detection limits or at very low concentrations. Therefore, they are not a concern for the watershed.
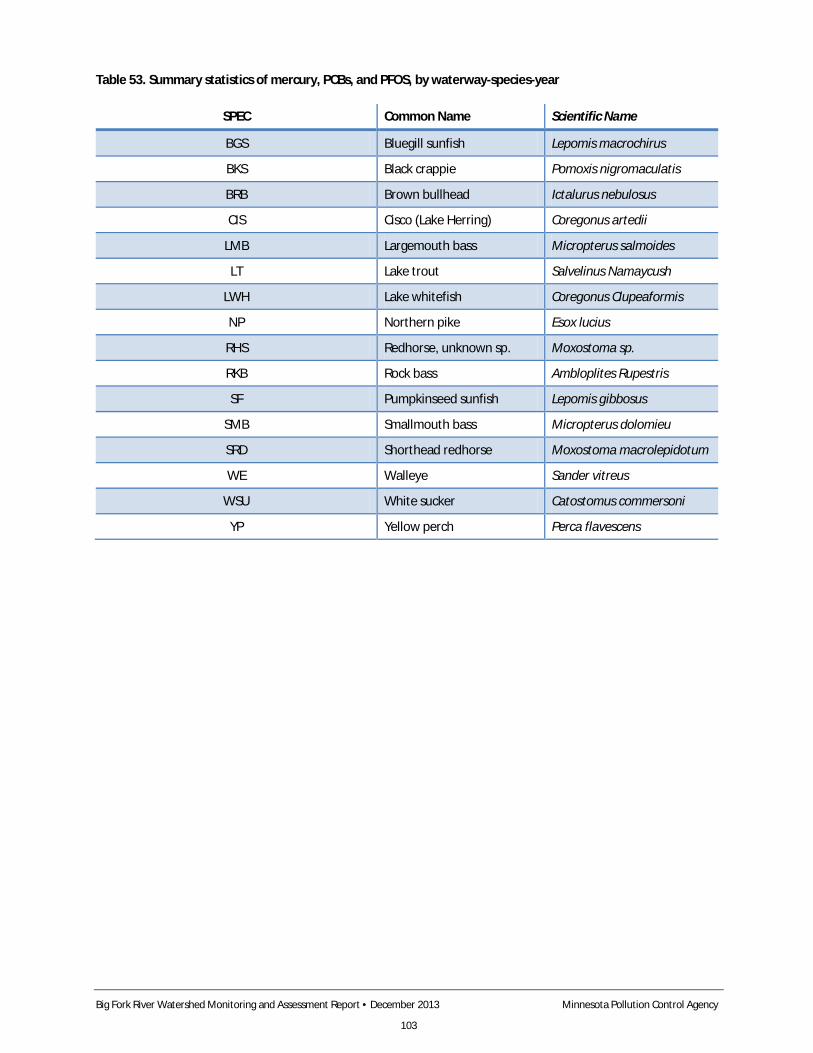
Big Fork River Watershed Monitoring and Assessment Report • December 2013 Minnesota Pollution Control Agency
103
Table 53. Summary statistics of mercury, PCBs, and PFOS, by waterway-species-year
SPEC Common Name Scientific Name
BGS Bluegill sunfish Lepomis macrochirus
BKS Black crappie Pomoxis nigromaculatis
BRB Brown bullhead Ictalurus nebulosus
CIS Cisco (Lake Herring) Coregonus artedii
LMB Largemouth bass Micropterus salmoides
LT Lake trout Salvelinus Namaycush
LWH Lake whitefish Coregonus Clupeaformis
NP Northern pike Esox lucius
RHS Redhorse, unknown sp. Moxostoma sp.
RKB Rock bass Ambloplites Rupestris
SF Pumpkinseed sunfish Lepomis gibbosus
SMB Smallmouth bass Micropterus dolomieu
SRD Shorthead redhorse Moxostoma macrolepidotum
WE Walleye Sander vitreus
WSU White sucker Catostomus commersoni
YP Yellow perch Perca flavescens
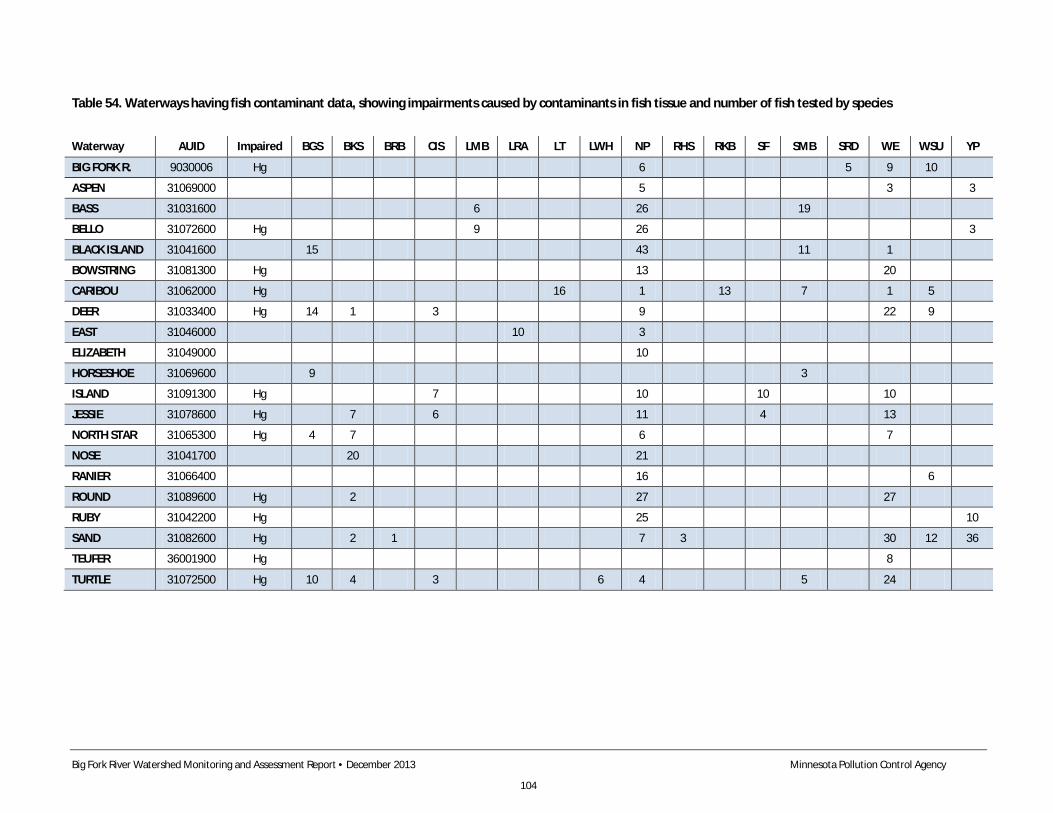
Big Fork River Watershed Monitoring and Assessment Report • December 2013 Minnesota Pollution Control Agency
104
Table 54. Waterways having fish contaminant data, showing impairments caused by contaminants in fish tissue and number of fish tested by species
Waterway AUID Impaired BGS BKS BRB CIS LMB LRA LT LWH NP RHS RKB SF SMB SRD WE WSU YP
BIG FORK R. 9030006 Hg 6 5 9 10
ASPEN 31069000 5 3 3
BASS 31031600 6 26 19
BELLO 31072600 Hg 9 26 3
BLACK ISLAND 31041600 15 43 11 1
BOWSTRING 31081300 Hg 13 20
CARIBOU 31062000 Hg 16 1 13 7 1 5
DEER 31033400 Hg 14 1 3 9 22 9
EAST 31046000 10 3
ELIZABETH 31049000 10
HORSESHOE 31069600 9 3
ISLAND 31091300 Hg 7 10 10 10
JESSIE 31078600 Hg 7 6 11 4 13
NORTH STAR 31065300 Hg 4 7 6 7
NOSE 31041700 20 21
RANIER 31066400 16 6
ROUND 31089600 Hg 2 27 27
RUBY 31042200 Hg 25 10
SAND 31082600 Hg 2 1 7 3 30 12 36
TEUFER 36001900 Hg 8
TURTLE 31072500 Hg 10 4 3 6 4 5 24
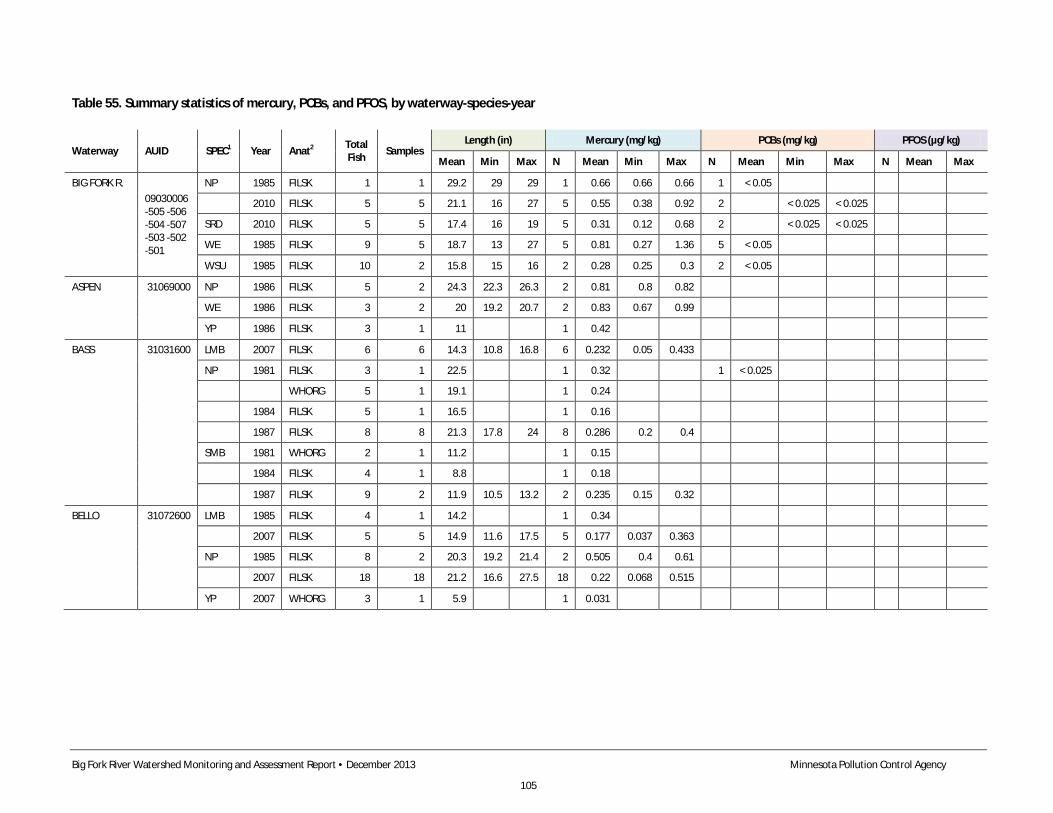
Big Fork River Watershed Monitoring and Assessment Report • December 2013 Minnesota Pollution Control Agency
105
Table 55. Summary statistics of mercury, PCBs, and PFOS, by waterway-species-year
Waterway AUID SPEC1 Year Anat2 Total Fish Samples
Length (in) Mercury (mg/kg) PCBs (mg/kg) PFOS (µg/kg)
Mean Min Max N Mean Min Max N Mean Min Max N Mean Max
BIG FORK R. 09030006 -505 -506 -504 -507 -503 -502 -501
NP 1985 FILSK 1 1 29.2 29 29 1 0.66 0.66 0.66 1 < 0.05
2010 FILSK 5 5 21.1 16 27 5 0.55 0.38 0.92 2
< 0.025 < 0.025
SRD 2010 FILSK 5 5 17.4 16 19 5 0.31 0.12 0.68 2
< 0.025 < 0.025
WE 1985 FILSK 9 5 18.7 13 27 5 0.81 0.27 1.36 5 < 0.05
WSU 1985 FILSK 10 2 15.8 15 16 2 0.28 0.25 0.3 2 < 0.05
ASPEN 31069000 NP 1986 FILSK 5 2 24.3 22.3 26.3 2 0.81 0.8 0.82
WE 1986 FILSK 3 2 20 19.2 20.7 2 0.83 0.67 0.99
YP 1986 FILSK 3 1 11 1 0.42
BASS 31031600 LMB 2007 FILSK 6 6 14.3 10.8 16.8 6 0.232 0.05 0.433
NP 1981 FILSK 3 1 22.5
1 0.32
1 < 0.025
WHORG 5 1 19.1
1 0.24
1984 FILSK 5 1 16.5
1 0.16
1987 FILSK 8 8 21.3 17.8 24 8 0.286 0.2 0.4
SMB 1981 WHORG 2 1 11.2
1 0.15
1984 FILSK 4 1 8.8
1 0.18
1987 FILSK 9 2 11.9 10.5 13.2 2 0.235 0.15 0.32
BELLO 31072600 LMB 1985 FILSK 4 1 14.2 1 0.34
2007 FILSK 5 5 14.9 11.6 17.5 5 0.177 0.037 0.363
NP 1985 FILSK 8 2 20.3 19.2 21.4 2 0.505 0.4 0.61
2007 FILSK 18 18 21.2 16.6 27.5 18 0.22 0.068 0.515
YP 2007 WHORG 3 1 5.9 1 0.031
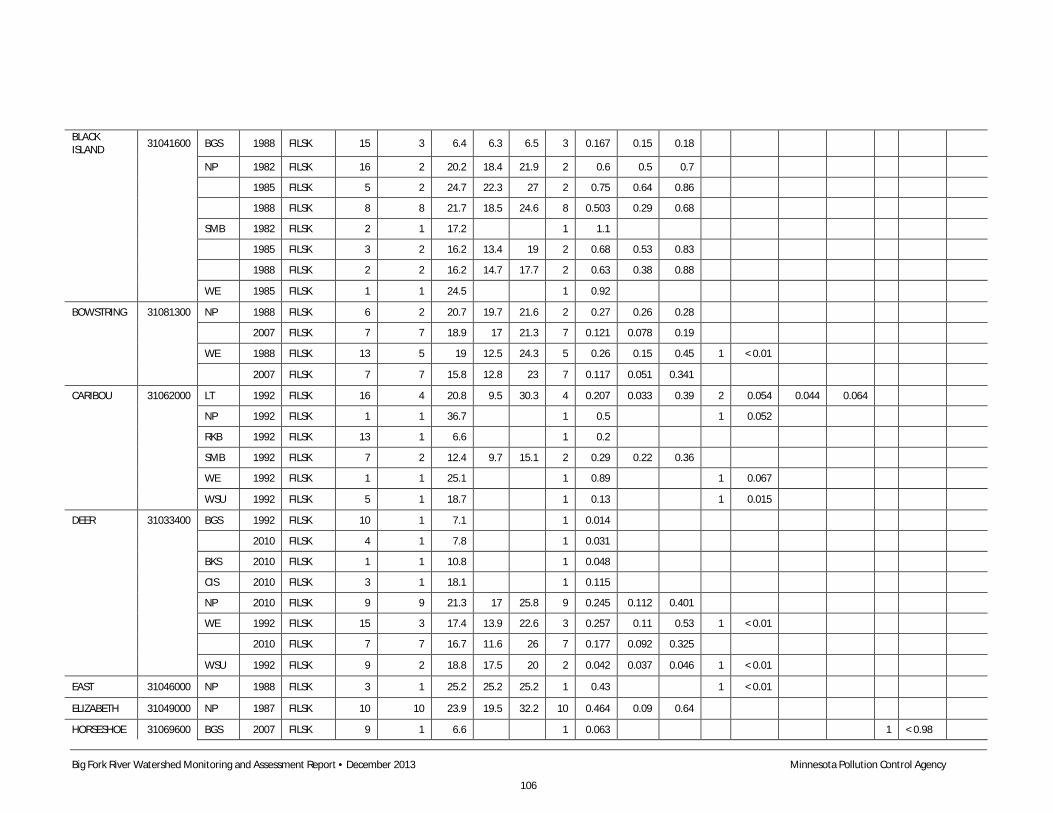
Big Fork River Watershed Monitoring and Assessment Report • December 2013 Minnesota Pollution Control Agency
106
BLACK ISLAND 31041600 BGS 1988 FILSK 15 3 6.4 6.3 6.5 3 0.167 0.15 0.18
NP 1982 FILSK 16 2 20.2 18.4 21.9 2 0.6 0.5 0.7
1985 FILSK 5 2 24.7 22.3 27 2 0.75 0.64 0.86
1988 FILSK 8 8 21.7 18.5 24.6 8 0.503 0.29 0.68
SMB 1982 FILSK 2 1 17.2
1 1.1
1985 FILSK 3 2 16.2 13.4 19 2 0.68 0.53 0.83
1988 FILSK 2 2 16.2 14.7 17.7 2 0.63 0.38 0.88
WE 1985 FILSK 1 1 24.5
1 0.92
BOWSTRING 31081300 NP 1988 FILSK 6 2 20.7 19.7 21.6 2 0.27 0.26 0.28
2007 FILSK 7 7 18.9 17 21.3 7 0.121 0.078 0.19
WE 1988 FILSK 13 5 19 12.5 24.3 5 0.26 0.15 0.45 1 < 0.01
2007 FILSK 7 7 15.8 12.8 23 7 0.117 0.051 0.341
CARIBOU 31062000 LT 1992 FILSK 16 4 20.8 9.5 30.3 4 0.207 0.033 0.39 2 0.054 0.044 0.064
NP 1992 FILSK 1 1 36.7
1 0.5
1 0.052
RKB 1992 FILSK 13 1 6.6
1 0.2
SMB 1992 FILSK 7 2 12.4 9.7 15.1 2 0.29 0.22 0.36
WE 1992 FILSK 1 1 25.1
1 0.89
1 0.067
WSU 1992 FILSK 5 1 18.7
1 0.13
1 0.015
DEER 31033400 BGS 1992 FILSK 10 1 7.1 1 0.014
2010 FILSK 4 1 7.8
1 0.031
BKS 2010 FILSK 1 1 10.8
1 0.048
CIS 2010 FILSK 3 1 18.1
1 0.115
NP 2010 FILSK 9 9 21.3 17 25.8 9 0.245 0.112 0.401
WE 1992 FILSK 15 3 17.4 13.9 22.6 3 0.257 0.11 0.53 1 < 0.01
2010 FILSK 7 7 16.7 11.6 26 7 0.177 0.092 0.325
WSU 1992 FILSK 9 2 18.8 17.5 20 2 0.042 0.037 0.046 1 < 0.01
EAST 31046000 NP 1988 FILSK 3 1 25.2 25.2 25.2 1 0.43
1 < 0.01
ELIZABETH 31049000 NP 1987 FILSK 10 10 23.9 19.5 32.2 10 0.464 0.09 0.64
HORSESHOE 31069600 BGS 2007 FILSK 9 1 6.6
1 0.063
1 < 0.98
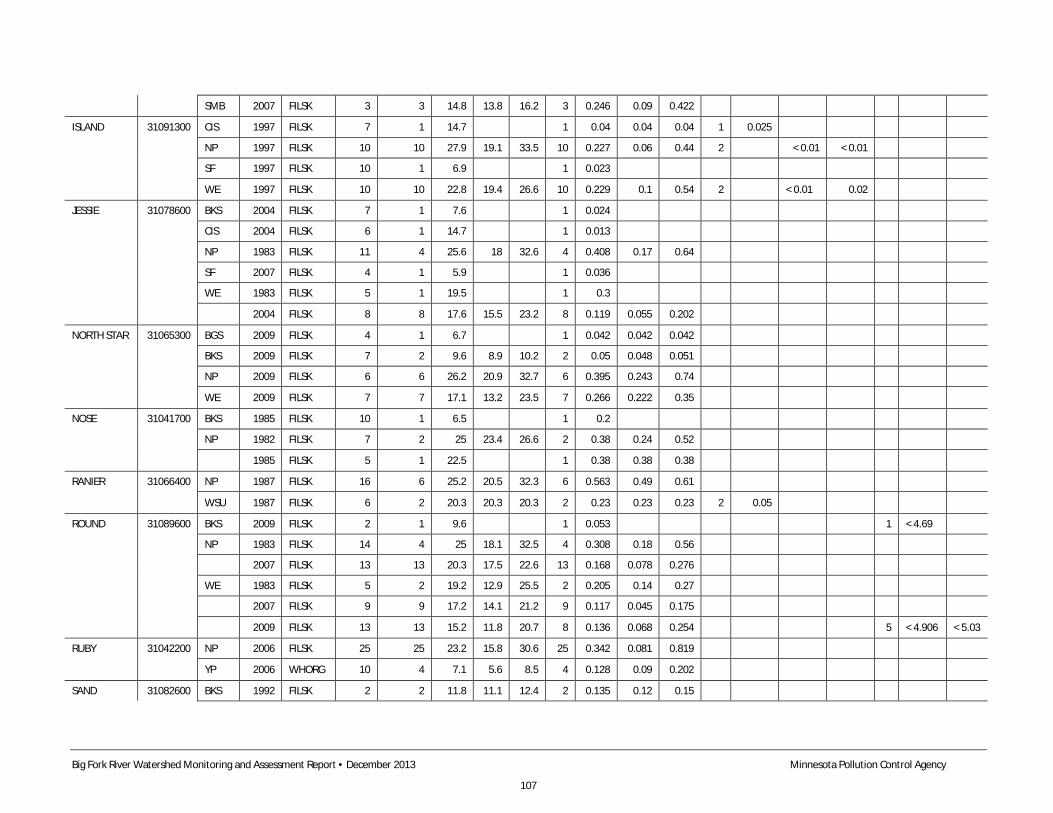
Big Fork River Watershed Monitoring and Assessment Report • December 2013 Minnesota Pollution Control Agency
107
SMB 2007 FILSK 3 3 14.8 13.8 16.2 3 0.246 0.09 0.422
ISLAND 31091300 CIS 1997 FILSK 7 1 14.7 1 0.04 0.04 0.04 1 0.025
NP 1997 FILSK 10 10 27.9 19.1 33.5 10 0.227 0.06 0.44 2
< 0.01 < 0.01
SF 1997 FILSK 10 1 6.9
1 0.023
WE 1997 FILSK 10 10 22.8 19.4 26.6 10 0.229 0.1 0.54 2 < 0.01 0.02
JESSIE 31078600 BKS 2004 FILSK 7 1 7.6
1 0.024
CIS 2004 FILSK 6 1 14.7
1 0.013
NP 1983 FILSK 11 4 25.6 18 32.6 4 0.408 0.17 0.64
SF 2007 FILSK 4 1 5.9
1 0.036
WE 1983 FILSK 5 1 19.5
1 0.3
2004 FILSK 8 8 17.6 15.5 23.2 8 0.119 0.055 0.202
NORTH STAR 31065300 BGS 2009 FILSK 4 1 6.7 1 0.042 0.042 0.042
BKS 2009 FILSK 7 2 9.6 8.9 10.2 2 0.05 0.048 0.051
NP 2009 FILSK 6 6 26.2 20.9 32.7 6 0.395 0.243 0.74
WE 2009 FILSK 7 7 17.1 13.2 23.5 7 0.266 0.222 0.35
NOSE 31041700 BKS 1985 FILSK 10 1 6.5
1 0.2
NP 1982 FILSK 7 2 25 23.4 26.6 2 0.38 0.24 0.52
1985 FILSK 5 1 22.5
1 0.38 0.38 0.38
RANIER 31066400 NP 1987 FILSK 16 6 25.2 20.5 32.3 6 0.563 0.49 0.61
WSU 1987 FILSK 6 2 20.3 20.3 20.3 2 0.23 0.23 0.23 2 0.05
ROUND 31089600 BKS 2009 FILSK 2 1 9.6
1 0.053
1 < 4.69
NP 1983 FILSK 14 4 25 18.1 32.5 4 0.308 0.18 0.56
2007 FILSK 13 13 20.3 17.5 22.6 13 0.168 0.078 0.276
WE 1983 FILSK 5 2 19.2 12.9 25.5 2 0.205 0.14 0.27
2007 FILSK 9 9 17.2 14.1 21.2 9 0.117 0.045 0.175
2009 FILSK 13 13 15.2 11.8 20.7 8 0.136 0.068 0.254
5 < 4.906 < 5.03
RUBY 31042200 NP 2006 FILSK 25 25 23.2 15.8 30.6 25 0.342 0.081 0.819
YP 2006 WHORG 10 4 7.1 5.6 8.5 4 0.128 0.09 0.202
SAND 31082600 BKS 1992 FILSK 2 2 11.8 11.1 12.4 2 0.135 0.12 0.15
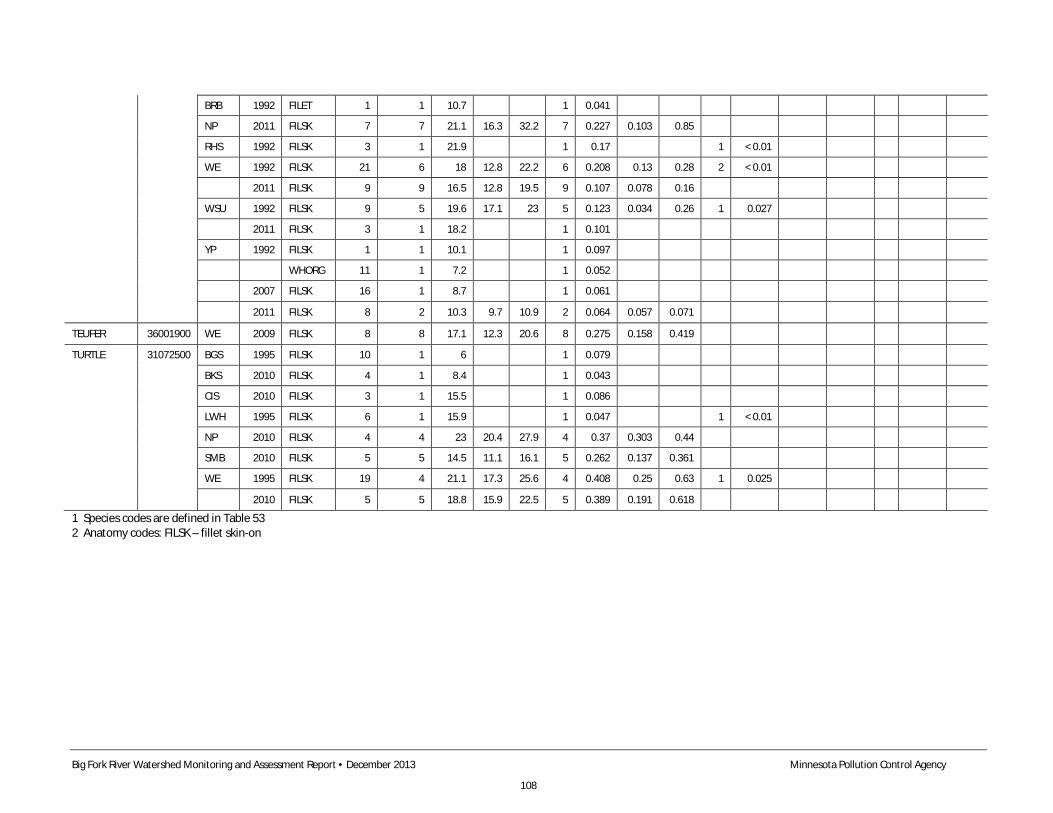
Big Fork River Watershed Monitoring and Assessment Report • December 2013 Minnesota Pollution Control Agency
108
1 Species codes are defined in Table 53 2 Anatomy codes: FILSK – fillet skin-on
BRB 1992 FILET 1 1 10.7
1 0.041
NP 2011 FILSK 7 7 21.1 16.3 32.2 7 0.227 0.103 0.85
RHS 1992 FILSK 3 1 21.9
1 0.17
1 < 0.01
WE 1992 FILSK 21 6 18 12.8 22.2 6 0.208 0.13 0.28 2 < 0.01
2011 FILSK 9 9 16.5 12.8 19.5 9 0.107 0.078 0.16
WSU 1992 FILSK 9 5 19.6 17.1 23 5 0.123 0.034 0.26 1 0.027
2011 FILSK 3 1 18.2
1 0.101
YP 1992 FILSK 1 1 10.1
1 0.097
WHORG 11 1 7.2
1 0.052
2007 FILSK 16 1 8.7
1 0.061
2011 FILSK 8 2 10.3 9.7 10.9 2 0.064 0.057 0.071
TEUFER 36001900 WE 2009 FILSK 8 8 17.1 12.3 20.6 8 0.275 0.158 0.419
TURTLE 31072500 BGS 1995 FILSK 10 1 6 1 0.079
BKS 2010 FILSK 4 1 8.4
1 0.043
CIS 2010 FILSK 3 1 15.5
1 0.086
LWH 1995 FILSK 6 1 15.9
1 0.047
1 < 0.01
NP 2010 FILSK 4 4 23 20.4 27.9 4 0.37 0.303 0.44
SMB 2010 FILSK 5 5 14.5 11.1 16.1 5 0.262 0.137 0.361
WE 1995 FILSK 19 4 21.1 17.3 25.6 4 0.408 0.25 0.63 1 0.025
2010 FILSK 5 5 18.8 15.9 22.5 5 0.389 0.191 0.618
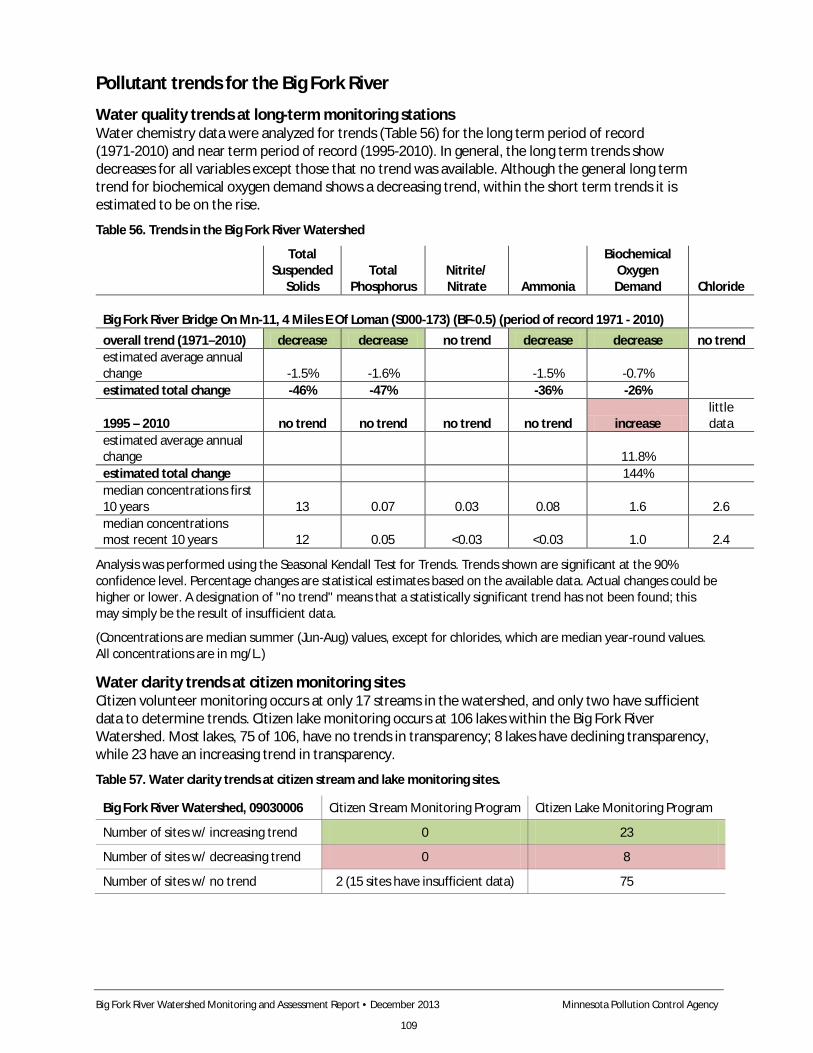
Big Fork River Watershed Monitoring and Assessment Report • December 2013 Minnesota Pollution Control Agency
109
Pollutant trends for the Big Fork River
Water quality trends at long-term monitoring stations Water chemistry data were analyzed for trends (Table 56) for the long term period of record (1971-2010) and near term period of record (1995-2010). In general, the long term trends show decreases for all variables except those that no trend was available. Although the general long term trend for biochemical oxygen demand shows a decreasing trend, within the short term trends it is estimated to be on the rise.
Table 56. Trends in the Big Fork River Watershed
Total Suspended
Solids Total
Phosphorus Nitrite/ Nitrate Ammonia
Biochemical Oxygen Demand Chloride
Big Fork River Bridge On Mn-11, 4 Miles E Of Loman (S000-173) (BF-0.5) (period of record 1971 - 2010)
overall trend (1971–2010) decrease decrease no trend decrease decrease no trend estimated average annual change -1.5% -1.6%
-1.5% -0.7%
estimated total change -46% -47%
-36% -26%
1995 – 2010 no trend no trend no trend no trend increase little data
estimated average annual change
11.8%
estimated total change
144% median concentrations first
10 years 13 0.07 0.03 0.08 1.6 2.6 median concentrations most recent 10 years 12 0.05 <0.03 <0.03 1.0 2.4
Analysis was performed using the Seasonal Kendall Test for Trends. Trends shown are significant at the 90% confidence level. Percentage changes are statistical estimates based on the available data. Actual changes could be higher or lower. A designation of "no trend" means that a statistically significant trend has not been found; this may simply be the result of insufficient data.
(Concentrations are median summer (Jun-Aug) values, except for chlorides, which are median year-round values. All concentrations are in mg/L.)
Water clarity trends at citizen monitoring sites Citizen volunteer monitoring occurs at only 17 streams in the watershed, and only two have sufficient data to determine trends. Citizen lake monitoring occurs at 106 lakes within the Big Fork River Watershed. Most lakes, 75 of 106, have no trends in transparency; 8 lakes have declining transparency, while 23 have an increasing trend in transparency.
Table 57. Water clarity trends at citizen stream and lake monitoring sites.
Big Fork River Watershed, 09030006 Citizen Stream Monitoring Program Citizen Lake Monitoring Program
Number of sites w/ increasing trend 0 23
Number of sites w/ decreasing trend 0 8
Number of sites w/ no trend 2 (15 sites have insufficient data) 75
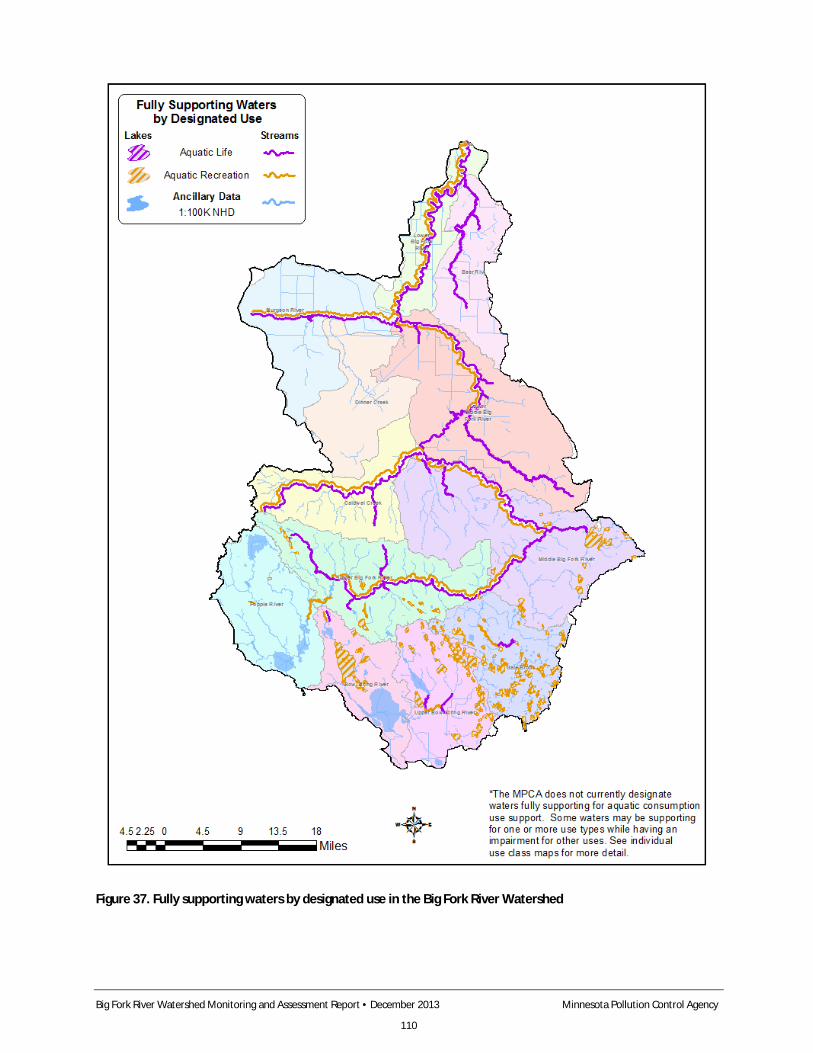
Big Fork River Watershed Monitoring and Assessment Report • December 2013 Minnesota Pollution Control Agency
110
Figure 37. Fully supporting waters by designated use in the Big Fork River Watershed
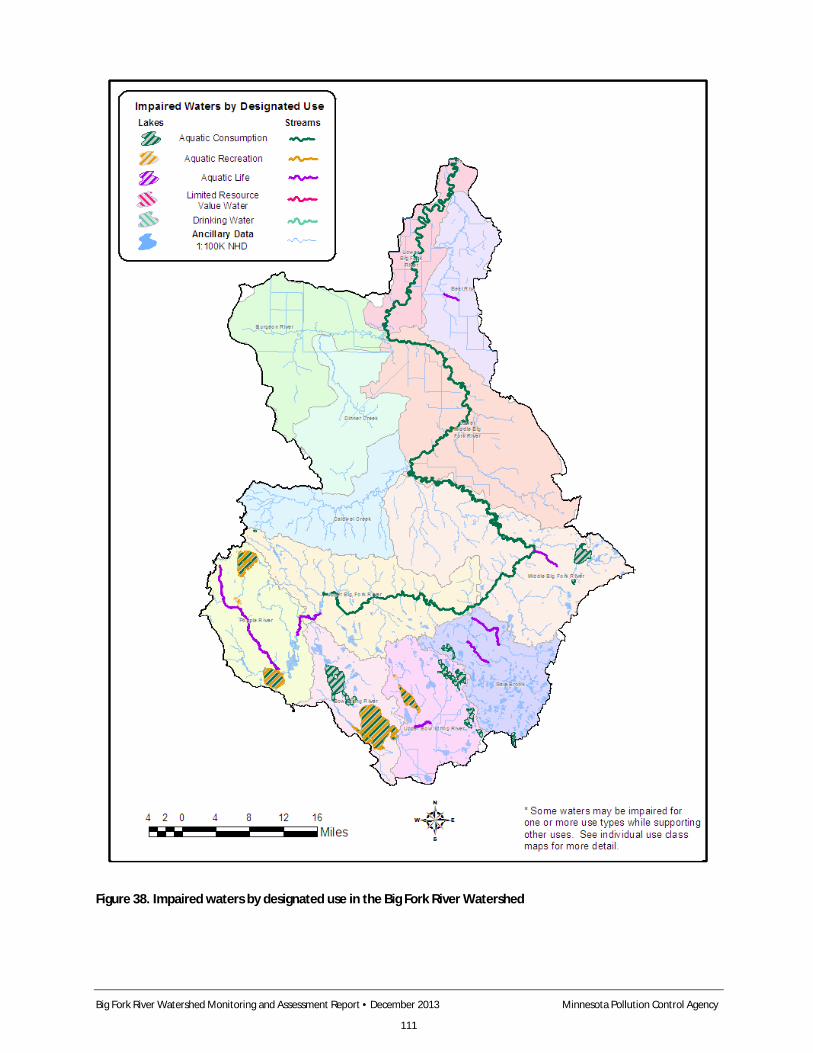
Big Fork River Watershed Monitoring and Assessment Report • December 2013 Minnesota Pollution Control Agency
111
Figure 38. Impaired waters by designated use in the Big Fork River Watershed
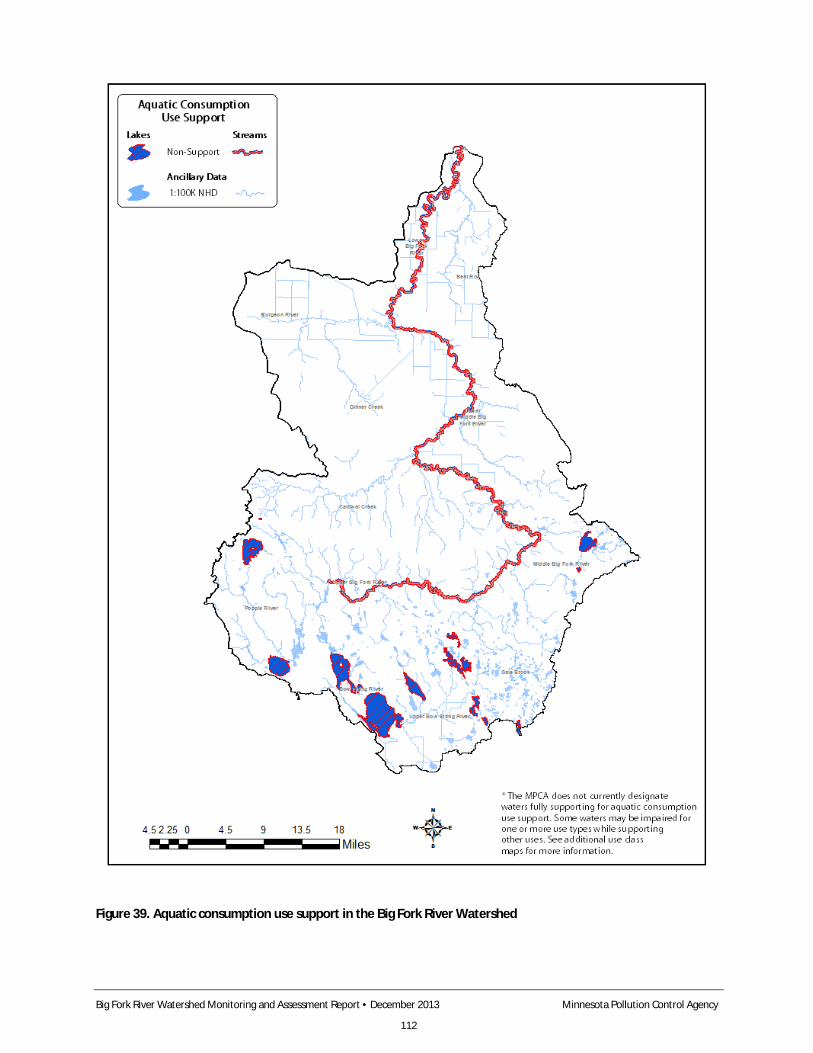
Big Fork River Watershed Monitoring and Assessment Report • December 2013 Minnesota Pollution Control Agency
112
Figure 39. Aquatic consumption use support in the Big Fork River Watershed
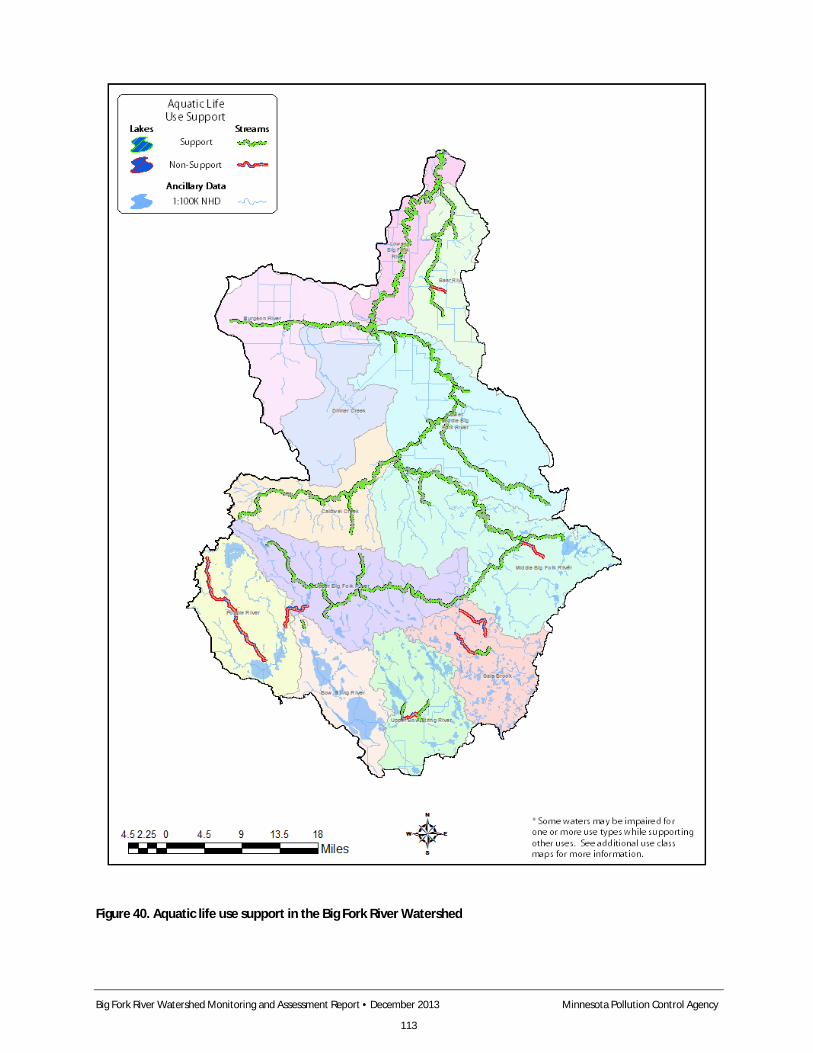
Big Fork River Watershed Monitoring and Assessment Report • December 2013 Minnesota Pollution Control Agency
113
Figure 40. Aquatic life use support in the Big Fork River Watershed
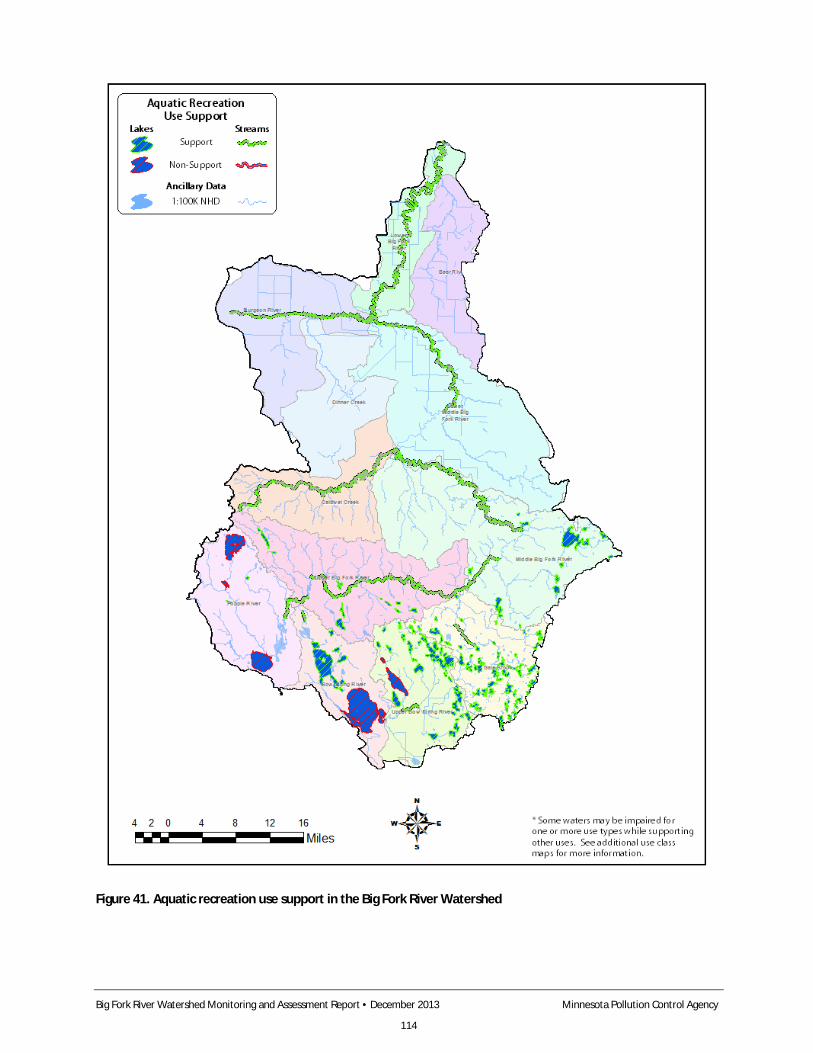
Big Fork River Watershed Monitoring and Assessment Report • December 2013 Minnesota Pollution Control Agency
114
Figure 41. Aquatic recreation use support in the Big Fork River Watershed
Big Fork River Watershed Monitoring and Assessment Report • December 2013 Minnesota Pollution Control Agency
115
VII. Summaries and recommendations The Big Fork River Watershed is comprised of vast acreages of wetlands and forests. The forested landscape with its many lakes and streams are well defined characteristics that come to mind when people envision the classic north woods of Minnesota. This scenic watershed is only 25% privately owned leaving the majority of the land undeveloped. The undeveloped nature of this watershed is undoubtedly a key reason for the high water quality found throughout the Big Fork River Watershed.
Biological monitoring results identified a number of sensitive fish species within the Big Fork River Watershed. The majority of assessable stream segments met the biological criteria for both fish and macroinvertebrates. Though many of the natural reaches were found to be in good biological standing, the channelized reaches did not score as well. The fish communities were poor for four of the eight channelized reaches and only two were considered good. Channelized reaches scored marginally better for macroinvertebrates with the majority being in fair condition. Habitat as indicated by the MSHA scores, ranged from fair to good, except once again for channelized streams where habitat scores were generally poor.
Lake water quality is generally good. Of the 120 assessable lakes only six did not meet the eutrophication standards.
Big Fork River Watershed impairments found in lakes and streams are likely a function of both natural and anthropogenic causes. Streams flowing through wetland areas often have low DO and buildup of fine sediments. These conditions are natural but may result in stressful condition for biota. Aquatic consumption mercury impairments, caused primarily by atmospheric deposition of mercury from the global burning of fossil fuels, are one of the widest spread impairments in the watershed, including many lakes and the Big Fork River. Nutrient impairments are infrequent and commonly found in shallow lakes with frequent summer mixing intensified by their larger fetch. Often these lakes have development on shore. Even with these impairments, overall conditions are good throughout the watershed.
The Big Fork River system has the benefit of little developmental pressure, but like many northern Minnesota aquatic systems the streams and lakes in the watershed are highly sensitive to even small anthropogenic sources of stress. For this reason continued vigilance is necessary to monitor in areas where developmental pressures are, or will be expected to occur. With few point sources present within the watershed, an emphasis on maintaining a natural vegetative buffer area along shore lines to prevent overland runoff and reduce erosion potential should be considered a key protection strategy to maintain the existing high quality of lakes, rivers and streams in this watershed.
Big Fork River Watershed Monitoring and Assessment Report • December 2013 Minnesota Pollution Control Agency
116
Literature cited Commission for Environmental Cooperation. Ecological Regions of North America: Toward a Common Perspective. Montréal: Commission for Environmental Cooperation 1997.
McCollor, S., and S. Heiskary. 1993. Selected Water Quality Characteristics of Minimally Impacted Streams from Minnesota’s Seven Ecoregions. Addendum to Fandrei, G., S. Heiskary, and S. McCollor. 1988. Descriptive Characteristics of the Seven Ecoregions in Minnesota. Division of Water Quality, Program Development Section, Minnesota Pollution Control Agency, St. Paul, Minnesota. 140 p.
Minnesota Conservation Department (MCD). 1959. Hydrologic Atlas of Minnesota. Division of Waters, Minnesota Conservation Department, St. Paul, Minnesota.
Minnesota Pollution Control Agency (MPCA). 2007a. Guidance Manual for Assessing the Quality of Minnesota Surface Waters for the Determination of Impairment 305(b) Report and 303(d) List. Environmental Outcomes Division, Minnesota Pollution Control Agency, St. Paul, Minnesota.
Minnesota Pollution Control Agency (MPCA). 2007b. Minnesota Statewide Mercury Total Maximum Daily Load. Minnesota Pollution Control Agency, St. Paul, Minnesota.
Minnesota Pollution Control Agency (MPCA). 2008a. Watershed Approach to Condition Monitoring and Assessment. Appendix 7 in Biennial Report of the Clean Water Council. Minnesota Pollution Control Agency, St. Paul, Minnesota.
Minnesota Pollution Control Agency (MPCA). 2010a. Aquatic Life Water Quality Standards Draft Technical Support Document for Total Suspended Solids (Turbidity). http://www.pca.state.mn.us/index.php/view-document.html?gid=14922.
Minnesota Pollution Control Agency (MPCA). 2010c. Guidance Manual for Assessing the Quality of Minnesota Surface Water for the Determination of Impairment: 305(b) Report and 303(d) List. Environmental Outcomes Division, Minnesota Pollution Control Agency, St. Paul, Minnesota.
Minnesota Pollution Control Agency (MPCA). 2010d. Minnesota Milestone River Monitoring Report. http://www.pca.state.mn.us/index.php/water/water-types-and-programs/surface-water/streams-and-rivers/minnesota-milestone-river-monitoring-program.html.
Minnesota Pollution Control Agency (MPCA). 2010e. Regionalization of Minnesota’s Rivers for Application of River Nutrient Criteria. http://www.pca.state.mn.us/index.php/view-document.html?gid=6072.
Minnesota Rules Chapter 7050. 2008. Standards for the Protection of the Quality and Purity of the Waters of the State. Revisor of Statutes and Minnesota Pollution Control Agency, St. Paul, Minnesota.
National Resource Conservation Service (NRCS). 2007. Rapid Watershed Assessment: Big Fork (MN) HUC: 09030006. NRCS. USDA. http://www.nrcs.usda.gov/Internet/FSE_DOCUMENTS/nrcs142p2_022518.pdf.
Omernik, J.M. and A.L. Gallant. 1988. Ecoregions of the Upper Midwest States. EPA/600/3-88/037. Corvallis, OR: United States Environmental Protection Agency. 56 p.
State Climatology Office- MDNR Division of Ecological and Water Resources. 2010. http://www.climate.umn.edu/doc/hydro_yr_pre_maps.htm.
Waters, T.F. 1977. The Rivers and Streams of Minnesota. University of Minnesota Press, Minneapolis, Minnesota.
Wiken, Ed, Francisco Jiménez Nava, and Glenn Griffith. 2011. North American Terrestrial Ecoregions—Level III. Commission for Environmental Cooperation, Montreal, Canada. University of Missouri Extension. 1999. Agricultural Phosphorus and Water Quality. Pub. G9181. http://extension.missouri.edu/publications/DisplayPub.aspx?P=G9181.
Big Fork River Watershed Monitoring and Assessment Report • December 2013 Minnesota Pollution Control Agency
117
Appendix 1 - Water chemistry definitions Dissolved oxygen (DO) - Oxygen dissolved in water required by aquatic life for metabolism. Dissolved oxygen enters into water from the atmosphere by diffusion and from algae and aquatic plants when they photosynthesize. Dissolved oxygen is removed from the water when organisms metabolize or breathe. Low DO often occurs when organic matter or nutrient inputs are high, and light inputs are low.
Escherichia coli (E. coli) - A type of fecal coliform bacteria that comes from human and animal waste. E. coli levels aid in the determination of whether or not fresh water is safe for recreation. Disease-causing bacteria, viruses and protozoans may be present in water that has elevated levels of E. coli.
Nitrate plus Nitrite – Nitrogen (Nitrate-N) - Nitrate and nitrite-nitrogen are inorganic forms of nitrogen present within the environment that are formed through the oxidation of ammonia-nitrogen by nitrifying bacteria (nitrification). Ammonia-nitrogen is found in fertilizers, septic systems and animal waste. Once converted from ammonia-nitrogen to nitrate and nitrite-nitrogen, these species can stimulate excessive levels of algae in streams. Because nitrate and nitrite-nitrogen are water soluble, transport to surface waters is enhanced through agricultural drainage. The ability of nitrite-nitrogen to be readily converted to nitrate-nitrogen is the basis for the combined laboratory analysis of nitrate-N, with nitrite-nitrogen typically making up a small proportion of the combined total concentration. These and other forms of nitrogen exist naturally in aquatic environments; however concentrations can vary drastically depending on season, biological activity, and anthropogenic inputs.
Orthophosphate (OP) - Orthophosphate is a water soluble form of phosphorus that is readily available to algae (bioavailable). While OPs occur naturally in the environment, river and stream concentrations may become elevated with additional inputs from waste water treatment plants, noncompliant septic systems and fertilizers in urban and agricultural runoff.
pH - A measure of the level of acidity in water. Rainfall is naturally acidic, but fossil fuel combustion has made rain more acid. The acidity of rainfall is often reduced by other elements in the soil. As such, water running into streams is often neutralized to a level acceptable for most aquatic life. Only when neutralizing elements in soils are depleted, or if rain enters streams directly, does stream acidity increase.
Specific conductance - The amount of ionic material dissolved in water. Specific conductance is influenced by the conductivity of rainwater, evaporation and by road salt and fertilizer application.
Temperature - Water temperature in streams varies over the course of the day similar to diurnal air temperature variation. Daily maximum temperature is typically several hours after noon, and the minimum is near sunrise. Water temperature also varies by season as does air temperature.
Total Kjehldahl nitrogen (TKN) - The combination of organically bound nitrogen and ammonia in wastewater. TKN is usually much higher in untreated waste samples then in effluent samples.
Total phosphorus (TP) - Nitrogen (N), phosphorus (P) and potassium (K) are essential macronutrients and are required for growth by all animals and plants. Increasing the amount of phosphorus entering the system therefore increases the growth of aquatic plants and other organisms. Excessive levels of phosphorous over stimulate aquatic growth and resulting in the progressive deterioration of water quality from overstimulation of nutrients, called eutrophication. Elevated levels of phosphorus can result in: increased algae growth, reduced water clarity, reduced oxygen in the water, fish kills, altered fisheries, and toxins from cyanobacteria (blue green algae) which can affect human and animal health.
Total suspended solids (TSS) – TSS and turbidity are highly correlated. Turbidity is a measure of the lack of transparency or "cloudiness" of water due to the presence of suspended and colloidal materials such as clay, silt, finely divided organic and inorganic matter and plankton or other microscopic organisms. The greater the level of TSS, the murkier the water appears and the higher the measured turbidity.
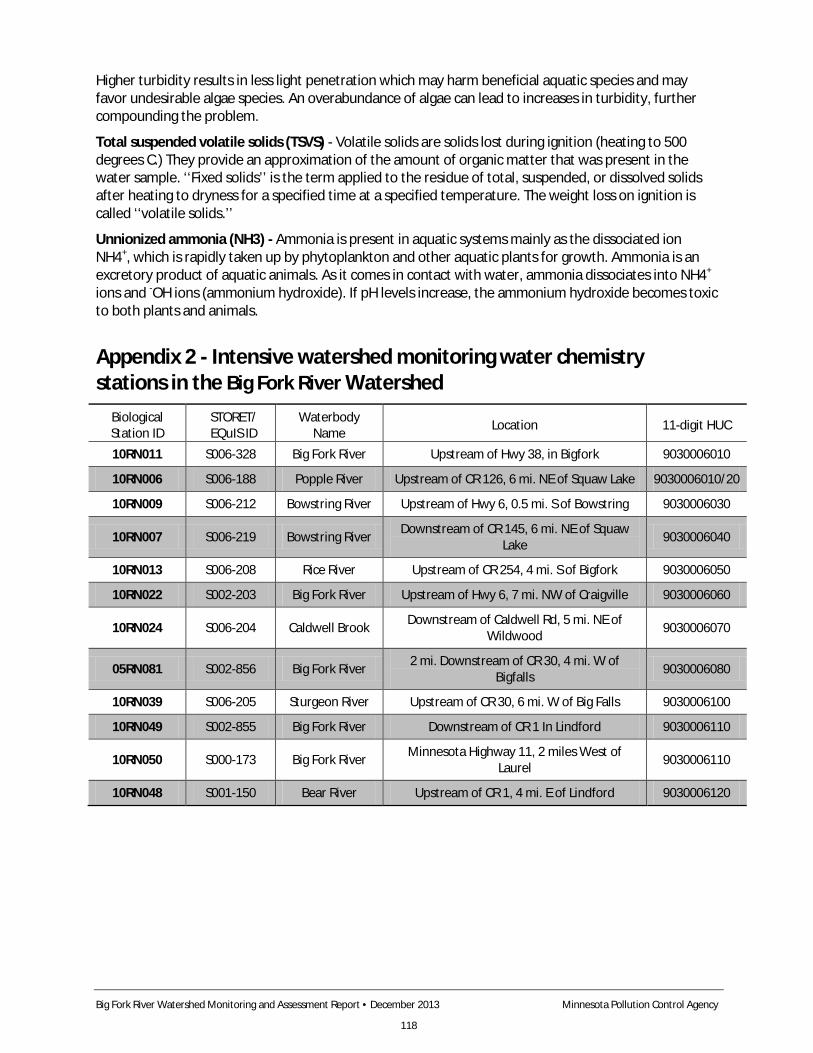
Big Fork River Watershed Monitoring and Assessment Report • December 2013 Minnesota Pollution Control Agency
118
Higher turbidity results in less light penetration which may harm beneficial aquatic species and may favor undesirable algae species. An overabundance of algae can lead to increases in turbidity, further compounding the problem.
Total suspended volatile solids (TSVS) - Volatile solids are solids lost during ignition (heating to 500 degrees C.) They provide an approximation of the amount of organic matter that was present in the water sample. ‘‘Fixed solids’’ is the term applied to the residue of total, suspended, or dissolved solids after heating to dryness for a specified time at a specified temperature. The weight loss on ignition is called ‘‘volatile solids.’’
Unnionized ammonia (NH3) - Ammonia is present in aquatic systems mainly as the dissociated ion NH4+, which is rapidly taken up by phytoplankton and other aquatic plants for growth. Ammonia is an excretory product of aquatic animals. As it comes in contact with water, ammonia dissociates into NH4+ ions and -OH ions (ammonium hydroxide). If pH levels increase, the ammonium hydroxide becomes toxic to both plants and animals.
Appendix 2 - Intensive watershed monitoring water chemistry stations in the Big Fork River Watershed
Biological Station ID
STORET/ EQuIS ID
Waterbody Name Location 11-digit HUC
10RN011 S006-328 Big Fork River Upstream of Hwy 38, in Bigfork 9030006010
10RN006 S006-188 Popple River Upstream of CR 126, 6 mi. NE of Squaw Lake 9030006010/20
10RN009 S006-212 Bowstring River Upstream of Hwy 6, 0.5 mi. S of Bowstring 9030006030
10RN007 S006-219 Bowstring River Downstream of CR 145, 6 mi. NE of Squaw Lake 9030006040
10RN013 S006-208 Rice River Upstream of CR 254, 4 mi. S of Bigfork 9030006050
10RN022 S002-203 Big Fork River Upstream of Hwy 6, 7 mi. NW of Craigville 9030006060
10RN024 S006-204 Caldwell Brook Downstream of Caldwell Rd, 5 mi. NE of Wildwood 9030006070
05RN081 S002-856 Big Fork River 2 mi. Downstream of CR 30, 4 mi. W of Bigfalls 9030006080
10RN039 S006-205 Sturgeon River Upstream of CR 30, 6 mi. W of Big Falls 9030006100
10RN049 S002-855 Big Fork River Downstream of CR 1 In Lindford 9030006110
10RN050 S000-173 Big Fork River Minnesota Highway 11, 2 miles West of Laurel 9030006110
10RN048 S001-150 Bear River Upstream of CR 1, 4 mi. E of Lindford 9030006120
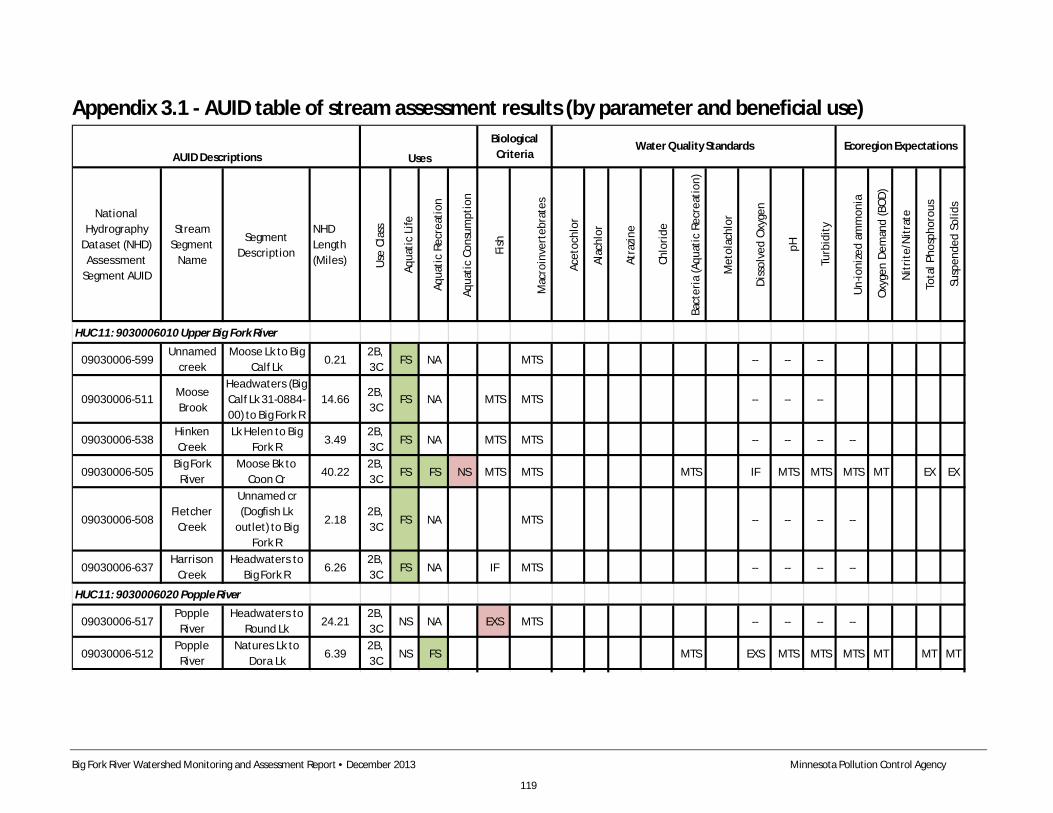
Big Fork River Watershed Monitoring and Assessment Report • December 2013 Minnesota Pollution Control Agency
119
Appendix 3.1 - AUID table of stream assessment results (by parameter and beneficial use)
National Hydrography
Dataset (NHD) Assessment
Segment AUID
Stream Segment
Name
Segment Description
NHD Length (Miles) Us
e Cl
ass
Aqua
tic L
ife
Aqua
tic R
ecre
atio
n
Aqua
tic C
onsu
mpt
ion
Fish
Mac
roin
vert
ebra
tes
Acet
ochl
or
Alac
hlor
Atra
zine
Chlo
ride
Bact
eria
(Aqu
atic
Rec
reat
ion)
Met
olac
hlor
Diss
olve
d Ox
ygen
pH
Turb
idity
Un-io
nize
d am
mon
ia
Oxyg
en D
eman
d (B
OD)
Nitr
ite/N
itrat
e
Tota
l Pho
spho
rous
Susp
ende
d So
lids
HUC 11: 9030006010 Upper Big Fork River
09030006-599Unnamed
creekMoose Lk to Big
Calf Lk0.21
2B, 3C
FS NA MTS -- -- --
09030006-511Moose Brook
Headwaters (Big Calf Lk 31-0884-00) to Big Fork R
14.662B, 3C
FS NA MTS MTS -- -- --
09030006-538Hinken Creek
Lk Helen to Big Fork R
3.492B, 3C
FS NA MTS MTS -- -- -- --
09030006-505Big Fork
RiverMoose Bk to
Coon Cr40.22
2B, 3C
FS FS NS MTS MTS MTS IF MTS MTS MTS MT EX EX
09030006-508Fletcher
Creek
Unnamed cr (Dogfish Lk
outlet) to Big Fork R
2.182B, 3C
FS NA MTS -- -- -- --
09030006-637Harrison
CreekHeadwaters to
Big Fork R6.26
2B, 3C
FS NA IF MTS -- -- -- --
HUC 11: 9030006020 Popple River
09030006-517Popple
RiverHeadwaters to
Round Lk24.21
2B, 3C
NS NA EXS MTS -- -- -- --
09030006-512Popple
RiverNatures Lk to
Dora Lk6.39
2B, 3C
NS FS MTS EXS MTS MTS MTS MT MT MT
Ecoregion ExpectationsBiological
CriteriaUsesAUID DescriptionsWater Quality Standards
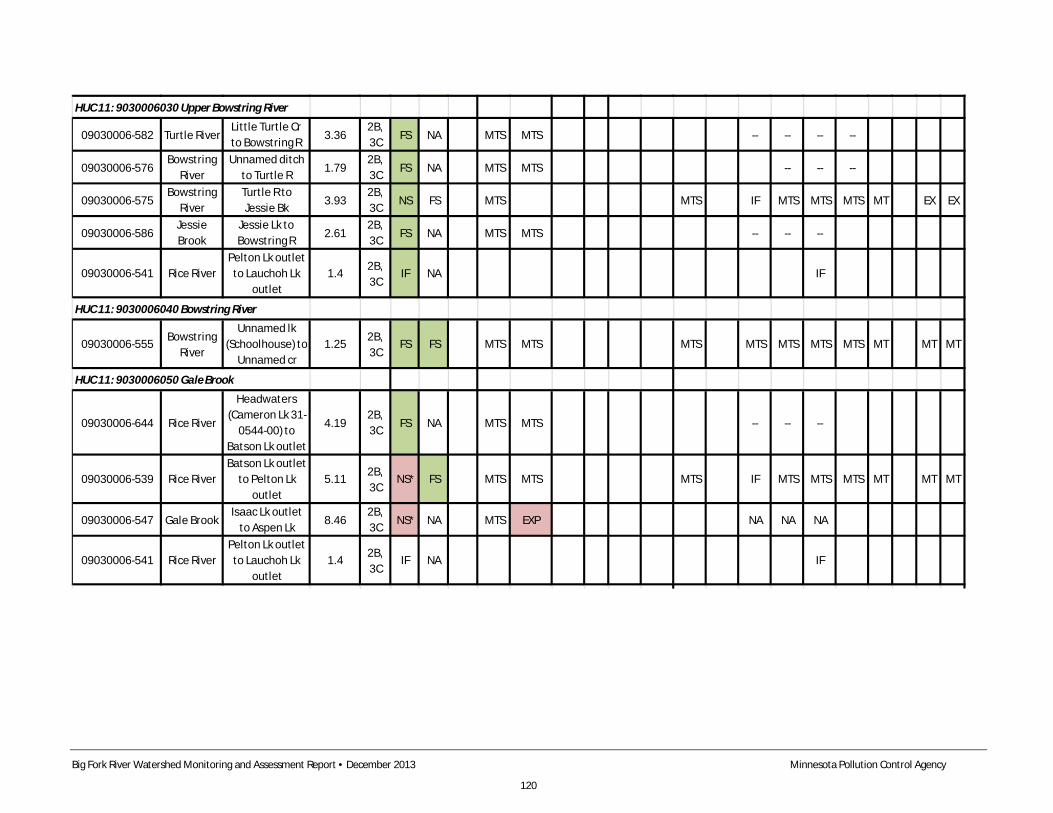
Big Fork River Watershed Monitoring and Assessment Report • December 2013 Minnesota Pollution Control Agency
120
HUC 11: 9030006030 Upper Bowstring River
09030006-582 Turtle RiverLittle Turtle Cr to Bowstring R
3.362B, 3C
FS NA MTS MTS -- -- -- --
09030006-576Bowstring
RiverUnnamed ditch
to Turtle R1.79
2B, 3C
FS NA MTS MTS -- -- --
09030006-575Bowstring
RiverTurtle R to Jessie Bk
3.932B, 3C
NS FS MTS MTS IF MTS MTS MTS MT EX EX
09030006-586Jessie Brook
Jessie Lk to Bowstring R
2.612B, 3C
FS NA MTS MTS -- -- --
09030006-541 Rice RiverPelton Lk outlet
to Lauchoh Lk outlet
1.42B, 3C
IF NA IF
HUC 11: 9030006040 Bowstring River
09030006-555Bowstring
River
Unnamed lk (Schoolhouse) to
Unnamed cr1.25
2B, 3C
FS FS MTS MTS MTS MTS MTS MTS MTS MT MT MT
HUC 11: 9030006050 Gale Brook
09030006-644 Rice River
Headwaters (Cameron Lk 31-
0544-00) to Batson Lk outlet
4.192B, 3C
FS NA MTS MTS -- -- --
09030006-539 Rice RiverBatson Lk outlet
to Pelton Lk outlet
5.112B, 3C
NS* FS MTS MTS MTS IF MTS MTS MTS MT MT MT
09030006-547 Gale BrookIsaac Lk outlet
to Aspen Lk8.46
2B, 3C
NS* NA MTS EXP NA NA NA
09030006-541 Rice RiverPelton Lk outlet
to Lauchoh Lk outlet
1.42B, 3C
IF NA IF
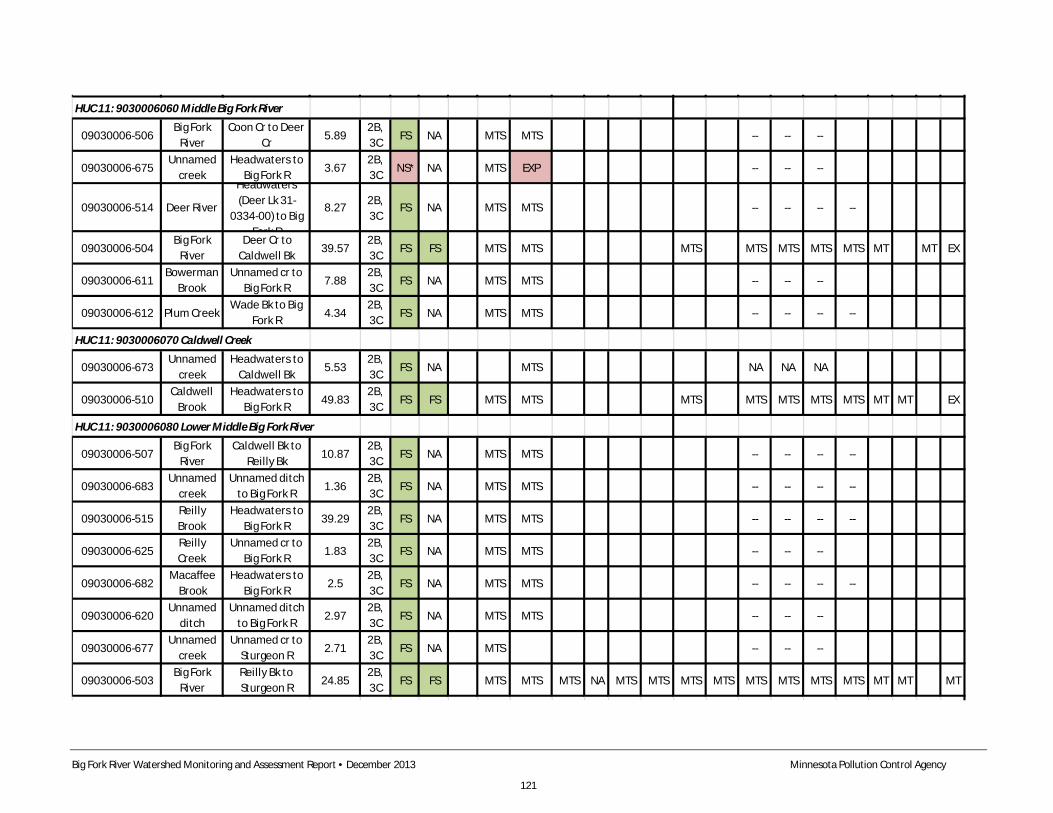
Big Fork River Watershed Monitoring and Assessment Report • December 2013 Minnesota Pollution Control Agency
121
HUC 11: 9030006060 Middle Big Fork River
09030006-506Big Fork
RiverCoon Cr to Deer
Cr5.89
2B, 3C
FS NA MTS MTS -- -- --
09030006-675Unnamed
creekHeadwaters to
Big Fork R3.67
2B, 3C
NS* NA MTS EXP -- -- --
09030006-514 Deer River
Headwaters (Deer Lk 31-
0334-00) to Big Fork R
8.272B, 3C
FS NA MTS MTS -- -- -- --
09030006-504Big Fork
RiverDeer Cr to
Caldwell Bk39.57
2B, 3C
FS FS MTS MTS MTS MTS MTS MTS MTS MT MT EX
09030006-611Bowerman
BrookUnnamed cr to
Big Fork R7.88
2B, 3C
FS NA MTS MTS -- -- --
09030006-612 Plum CreekWade Bk to Big
Fork R4.34
2B, 3C
FS NA MTS MTS -- -- -- --
HUC 11: 9030006070 Caldwell Creek
09030006-673Unnamed
creekHeadwaters to
Caldwell Bk5.53
2B, 3C
FS NA MTS NA NA NA
09030006-510Caldwell
BrookHeadwaters to
Big Fork R49.83
2B, 3C
FS FS MTS MTS MTS MTS MTS MTS MTS MT MT EX
HUC 11: 9030006080 Lower Middle Big Fork River
09030006-507Big Fork
RiverCaldwell Bk to
Reilly Bk10.87
2B, 3C
FS NA MTS MTS -- -- -- --
09030006-683Unnamed
creekUnnamed ditch
to Big Fork R1.36
2B, 3C
FS NA MTS MTS -- -- -- --
09030006-515Reilly Brook
Headwaters to Big Fork R
39.292B, 3C
FS NA MTS MTS -- -- -- --
09030006-625Reilly Creek
Unnamed cr to Big Fork R
1.832B, 3C
FS NA MTS MTS -- -- --
09030006-682Macaffee
BrookHeadwaters to
Big Fork R2.5
2B, 3C
FS NA MTS MTS -- -- -- --
09030006-620Unnamed
ditchUnnamed ditch
to Big Fork R2.97
2B, 3C
FS NA MTS MTS -- -- --
09030006-677Unnamed
creekUnnamed cr to
Sturgeon R2.71
2B, 3C
FS NA MTS -- -- --
09030006-503Big Fork
RiverReilly Bk to Sturgeon R
24.852B, 3C
FS FS MTS MTS MTS NA MTS MTS MTS MTS MTS MTS MTS MTS MT MT MT
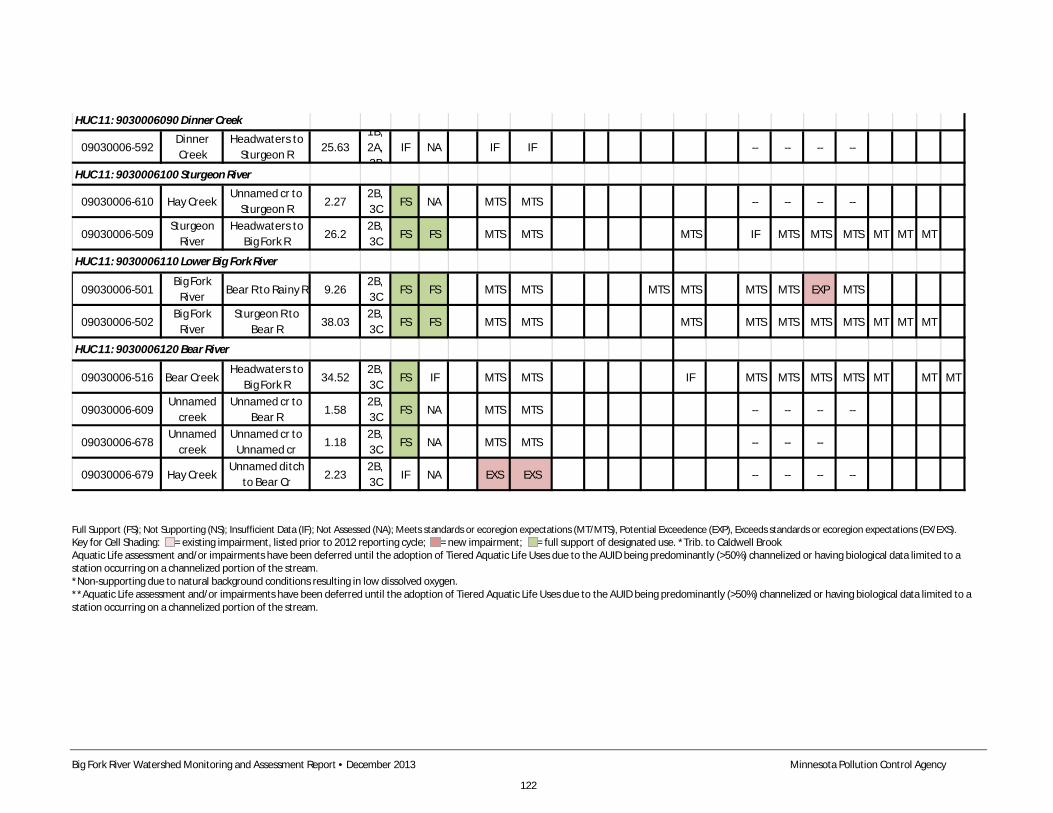
Big Fork River Watershed Monitoring and Assessment Report • December 2013 Minnesota Pollution Control Agency
122
Full Support (FS); Not Supporting (NS); Insufficient Data (IF); Not Assessed (NA); Meets standards or ecoregion expectations (MT/MTS), Potential Exceedence (EXP), Exceeds standards or ecoregion expectations (EX/EXS). Key for Cell Shading: = existing impairment, listed prior to 2012 reporting cycle; = new impairment; = full support of designated use. *Trib. to Caldwell Brook Aquatic Life assessment and/or impairments have been deferred until the adoption of Tiered Aquatic Life Uses due to the AUID being predominantly (>50%) channelized or having biological data limited to a station occurring on a channelized portion of the stream. *Non-supporting due to natural background conditions resulting in low dissolved oxygen. **Aquatic Life assessment and/or impairments have been deferred until the adoption of Tiered Aquatic Life Uses due to the AUID being predominantly (>50%) channelized or having biological data limited to a station occurring on a channelized portion of the stream.
HUC 11: 9030006090 Dinner Creek
09030006-592Dinner Creek
Headwaters to Sturgeon R
25.631B, 2A, 3B
IF NA IF IF -- -- -- --
HUC 11: 9030006100 Sturgeon River
09030006-610 Hay CreekUnnamed cr to
Sturgeon R2.27
2B, 3C
FS NA MTS MTS -- -- -- --
09030006-509Sturgeon
RiverHeadwaters to
Big Fork R26.2
2B, 3C
FS FS MTS MTS MTS IF MTS MTS MTS MT MT MT
HUC 11: 9030006110 Lower Big Fork River
09030006-501Big Fork
RiverBear R to Rainy R 9.26
2B, 3C
FS FS MTS MTS MTS MTS MTS MTS EXP MTS
09030006-502Big Fork
RiverSturgeon R to
Bear R38.03
2B, 3C
FS FS MTS MTS MTS MTS MTS MTS MTS MT MT MT
HUC 11: 9030006120 Bear River
09030006-516 Bear CreekHeadwaters to
Big Fork R34.52
2B, 3C
FS IF MTS MTS IF MTS MTS MTS MTS MT MT MT
09030006-609Unnamed
creekUnnamed cr to
Bear R1.58
2B, 3C
FS NA MTS MTS -- -- -- --
09030006-678Unnamed
creekUnnamed cr to
Unnamed cr1.18
2B, 3C
FS NA MTS MTS -- -- --
09030006-679 Hay CreekUnnamed ditch
to Bear Cr2.23
2B, 3C
IF NA EXS EXS -- -- -- --
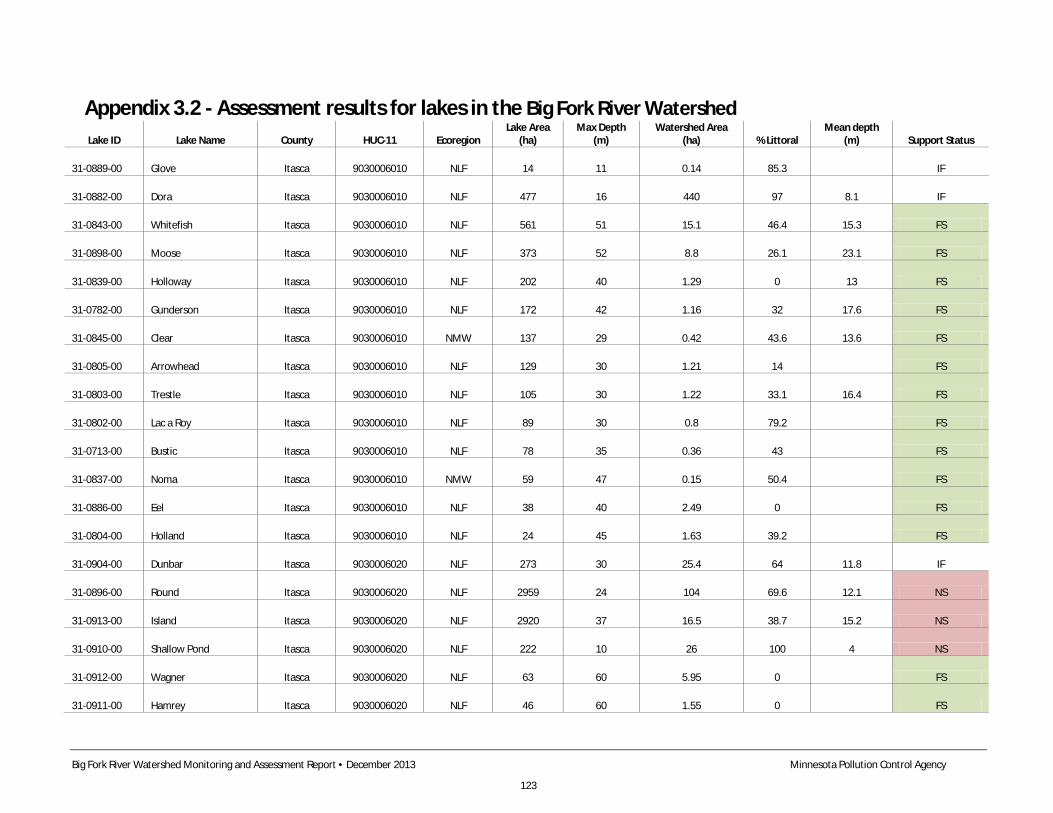
Big Fork River Watershed Monitoring and Assessment Report • December 2013 Minnesota Pollution Control Agency
123
Appendix 3.2 - Assessment results for lakes in the Big Fork River Watershed Lake ID Lake Name County HUC-11 Ecoregion
Lake Area (ha)
Max Depth (m)
Watershed Area (ha) % Littoral
Mean depth (m) Support Status
31-0889-00 Glove Itasca 9030006010 NLF 14 11 0.14 85.3 IF
31-0882-00 Dora Itasca 9030006010 NLF 477 16 440 97 8.1 IF
31-0843-00 Whitefish Itasca 9030006010 NLF 561 51 15.1 46.4 15.3 FS
31-0898-00 Moose Itasca 9030006010 NLF 373 52 8.8 26.1 23.1 FS
31-0839-00 Holloway Itasca 9030006010 NLF 202 40 1.29 0 13 FS
31-0782-00 Gunderson Itasca 9030006010 NLF 172 42 1.16 32 17.6 FS
31-0845-00 Clear Itasca 9030006010 NMW 137 29 0.42 43.6 13.6 FS
31-0805-00 Arrowhead Itasca 9030006010 NLF 129 30 1.21 14 FS
31-0803-00 Trestle Itasca 9030006010 NLF 105 30 1.22 33.1 16.4 FS
31-0802-00 Lac a Roy Itasca 9030006010 NLF 89 30 0.8 79.2 FS
31-0713-00 Bustic Itasca 9030006010 NLF 78 35 0.36 43 FS
31-0837-00 Noma Itasca 9030006010 NMW 59 47 0.15 50.4 FS
31-0886-00 Eel Itasca 9030006010 NLF 38 40 2.49 0 FS
31-0804-00 Holland Itasca 9030006010 NLF 24 45 1.63 39.2 FS
31-0904-00 Dunbar Itasca 9030006020 NLF 273 30 25.4 64 11.8 IF
31-0896-00 Round Itasca 9030006020 NLF 2959 24 104 69.6 12.1 NS
31-0913-00 Island Itasca 9030006020 NLF 2920 37 16.5 38.7 15.2 NS
31-0910-00 Shallow Pond Itasca 9030006020 NLF 222 10 26 100 4 NS
31-0912-00 Wagner Itasca 9030006020 NLF 63 60 5.95 0 FS
31-0911-00 Hamrey Itasca 9030006020 NLF 46 60 1.55 0 FS
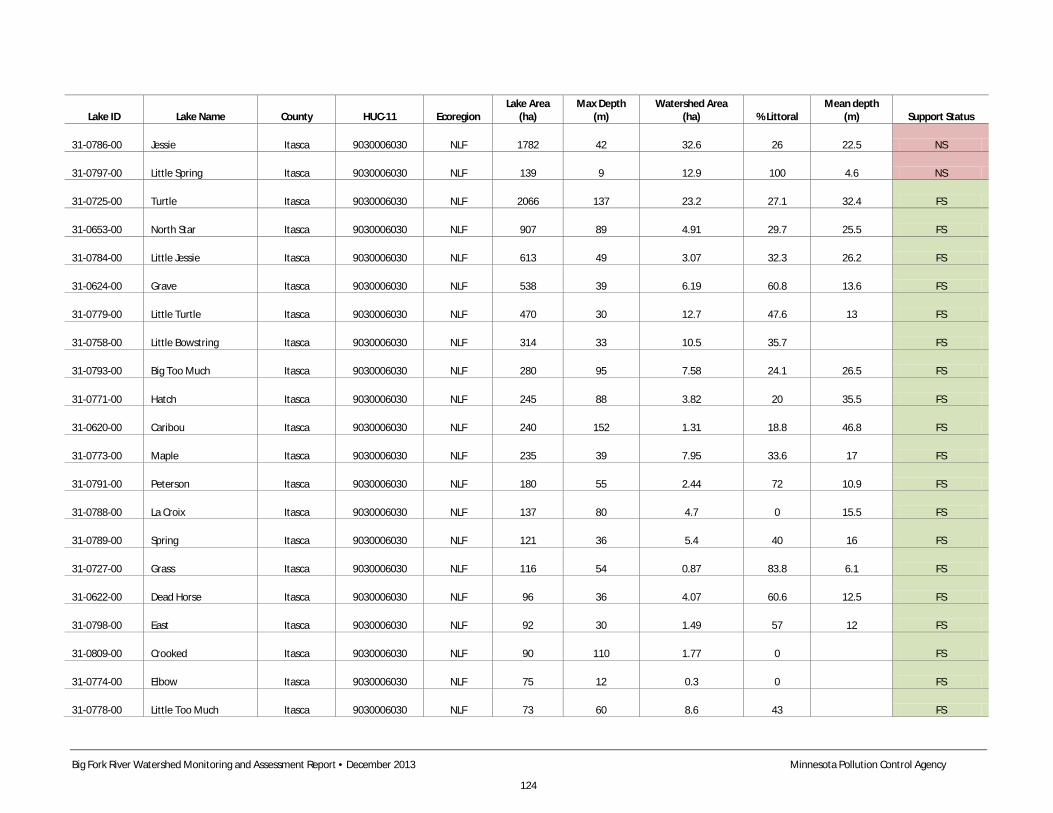
Big Fork River Watershed Monitoring and Assessment Report • December 2013 Minnesota Pollution Control Agency
124
Lake ID Lake Name County HUC-11 Ecoregion Lake Area
(ha) Max Depth
(m) Watershed Area
(ha) % Littoral Mean depth
(m) Support Status
31-0786-00 Jessie Itasca 9030006030 NLF 1782 42 32.6 26 22.5 NS
31-0797-00 Little Spring Itasca 9030006030 NLF 139 9 12.9 100 4.6 NS
31-0725-00 Turtle Itasca 9030006030 NLF 2066 137 23.2 27.1 32.4 FS
31-0653-00 North Star Itasca 9030006030 NLF 907 89 4.91 29.7 25.5 FS
31-0784-00 Little Jessie Itasca 9030006030 NLF 613 49 3.07 32.3 26.2 FS
31-0624-00 Grave Itasca 9030006030 NLF 538 39 6.19 60.8 13.6 FS
31-0779-00 Little Turtle Itasca 9030006030 NLF 470 30 12.7 47.6 13 FS
31-0758-00 Little Bowstring Itasca 9030006030 NLF 314 33 10.5 35.7 FS
31-0793-00 Big Too Much Itasca 9030006030 NLF 280 95 7.58 24.1 26.5 FS
31-0771-00 Hatch Itasca 9030006030 NLF 245 88 3.82 20 35.5 FS
31-0620-00 Caribou Itasca 9030006030 NLF 240 152 1.31 18.8 46.8 FS
31-0773-00 Maple Itasca 9030006030 NLF 235 39 7.95 33.6 17 FS
31-0791-00 Peterson Itasca 9030006030 NLF 180 55 2.44 72 10.9 FS
31-0788-00 La Croix Itasca 9030006030 NLF 137 80 4.7 0 15.5 FS
31-0789-00 Spring Itasca 9030006030 NLF 121 36 5.4 40 16 FS
31-0727-00 Grass Itasca 9030006030 NLF 116 54 0.87 83.8 6.1 FS
31-0622-00 Dead Horse Itasca 9030006030 NLF 96 36 4.07 60.6 12.5 FS
31-0798-00 East Itasca 9030006030 NLF 92 30 1.49 57 12 FS
31-0809-00 Crooked Itasca 9030006030 NLF 90 110 1.77 0 FS
31-0774-00 Elbow Itasca 9030006030 NLF 75 12 0.3 0 FS
31-0778-00 Little Too Much Itasca 9030006030 NLF 73 60 8.6 43 FS
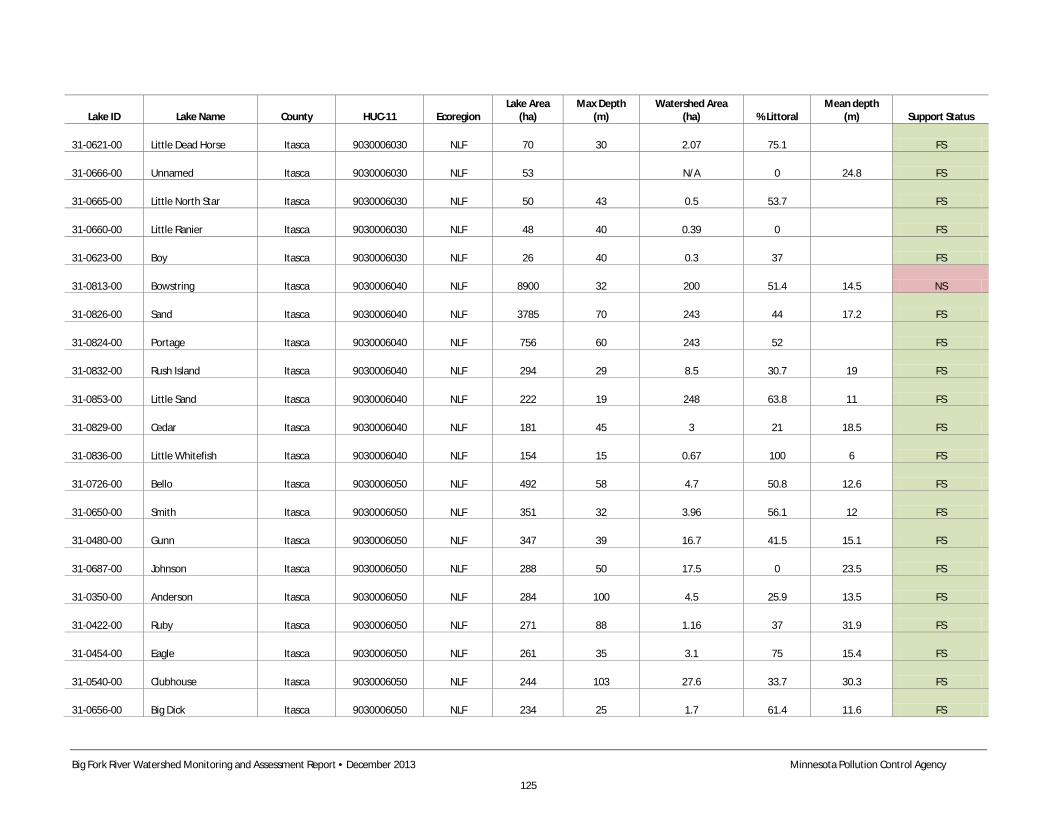
Big Fork River Watershed Monitoring and Assessment Report • December 2013 Minnesota Pollution Control Agency
125
Lake ID Lake Name County HUC-11 Ecoregion Lake Area
(ha) Max Depth
(m) Watershed Area
(ha) % Littoral Mean depth
(m) Support Status
31-0621-00 Little Dead Horse Itasca 9030006030 NLF 70 30 2.07 75.1 FS
31-0666-00 Unnamed Itasca 9030006030 NLF 53 N/A 0 24.8 FS
31-0665-00 Little North Star Itasca 9030006030 NLF 50 43 0.5 53.7 FS
31-0660-00 Little Ranier Itasca 9030006030 NLF 48 40 0.39 0 FS
31-0623-00 Boy Itasca 9030006030 NLF 26 40 0.3 37 FS
31-0813-00 Bowstring Itasca 9030006040 NLF 8900 32 200 51.4 14.5 NS
31-0826-00 Sand Itasca 9030006040 NLF 3785 70 243 44 17.2 FS
31-0824-00 Portage Itasca 9030006040 NLF 756 60 243 52 FS
31-0832-00 Rush Island Itasca 9030006040 NLF 294 29 8.5 30.7 19 FS
31-0853-00 Little Sand Itasca 9030006040 NLF 222 19 248 63.8 11 FS
31-0829-00 Cedar Itasca 9030006040 NLF 181 45 3 21 18.5 FS
31-0836-00 Little Whitefish Itasca 9030006040 NLF 154 15 0.67 100 6 FS
31-0726-00 Bello Itasca 9030006050 NLF 492 58 4.7 50.8 12.6 FS
31-0650-00 Smith Itasca 9030006050 NLF 351 32 3.96 56.1 12 FS
31-0480-00 Gunn Itasca 9030006050 NLF 347 39 16.7 41.5 15.1 FS
31-0687-00 Johnson Itasca 9030006050 NLF 288 50 17.5 0 23.5 FS
31-0350-00 Anderson Itasca 9030006050 NLF 284 100 4.5 25.9 13.5 FS
31-0422-00 Ruby Itasca 9030006050 NLF 271 88 1.16 37 31.9 FS
31-0454-00 Eagle Itasca 9030006050 NLF 261 35 3.1 75 15.4 FS
31-0540-00 Clubhouse Itasca 9030006050 NLF 244 103 27.6 33.7 30.3 FS
31-0656-00 Big Dick Itasca 9030006050 NLF 234 25 1.7 61.4 11.6 FS
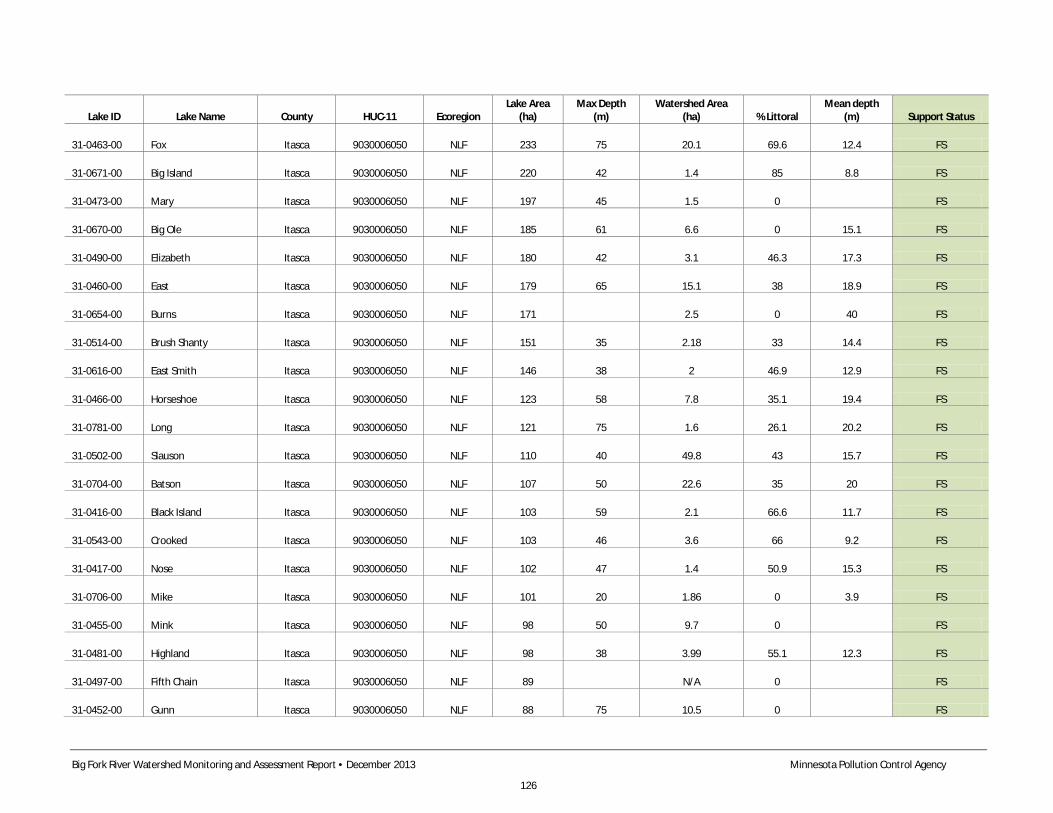
Big Fork River Watershed Monitoring and Assessment Report • December 2013 Minnesota Pollution Control Agency
126
Lake ID Lake Name County HUC-11 Ecoregion Lake Area
(ha) Max Depth
(m) Watershed Area
(ha) % Littoral Mean depth
(m) Support Status
31-0463-00 Fox Itasca 9030006050 NLF 233 75 20.1 69.6 12.4 FS
31-0671-00 Big Island Itasca 9030006050 NLF 220 42 1.4 85 8.8 FS
31-0473-00 Mary Itasca 9030006050 NLF 197 45 1.5 0 FS
31-0670-00 Big Ole Itasca 9030006050 NLF 185 61 6.6 0 15.1 FS
31-0490-00 Elizabeth Itasca 9030006050 NLF 180 42 3.1 46.3 17.3 FS
31-0460-00 East Itasca 9030006050 NLF 179 65 15.1 38 18.9 FS
31-0654-00 Burns Itasca 9030006050 NLF 171 2.5 0 40 FS
31-0514-00 Brush Shanty Itasca 9030006050 NLF 151 35 2.18 33 14.4 FS
31-0616-00 East Smith Itasca 9030006050 NLF 146 38 2 46.9 12.9 FS
31-0466-00 Horseshoe Itasca 9030006050 NLF 123 58 7.8 35.1 19.4 FS
31-0781-00 Long Itasca 9030006050 NLF 121 75 1.6 26.1 20.2 FS
31-0502-00 Slauson Itasca 9030006050 NLF 110 40 49.8 43 15.7 FS
31-0704-00 Batson Itasca 9030006050 NLF 107 50 22.6 35 20 FS
31-0416-00 Black Island Itasca 9030006050 NLF 103 59 2.1 66.6 11.7 FS
31-0543-00 Crooked Itasca 9030006050 NLF 103 46 3.6 66 9.2 FS
31-0417-00 Nose Itasca 9030006050 NLF 102 47 1.4 50.9 15.3 FS
31-0706-00 Mike Itasca 9030006050 NLF 101 20 1.86 0 3.9 FS
31-0455-00 Mink Itasca 9030006050 NLF 98 50 9.7 0 FS
31-0481-00 Highland Itasca 9030006050 NLF 98 38 3.99 55.1 12.3 FS
31-0497-00 Fifth Chain Itasca 9030006050 NLF 89 N/A 0 FS
31-0452-00 Gunn Itasca 9030006050 NLF 88 75 10.5 0 FS
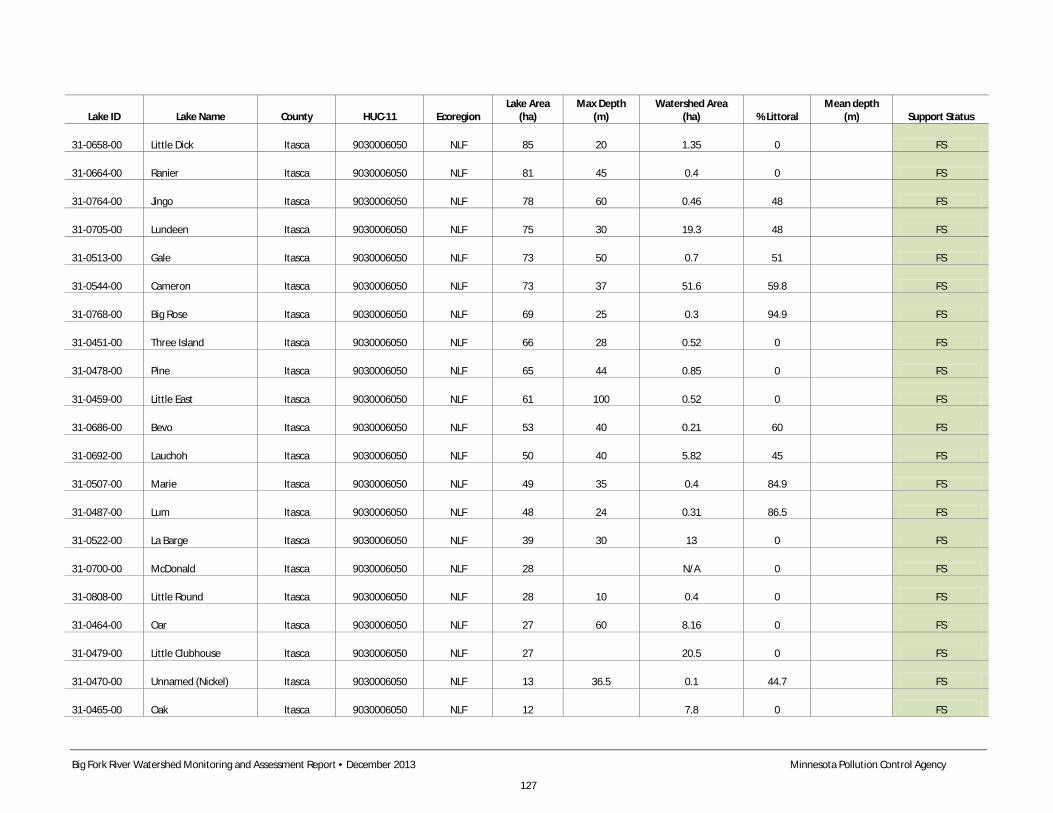
Big Fork River Watershed Monitoring and Assessment Report • December 2013 Minnesota Pollution Control Agency
127
Lake ID Lake Name County HUC-11 Ecoregion Lake Area
(ha) Max Depth
(m) Watershed Area
(ha) % Littoral Mean depth
(m) Support Status
31-0658-00 Little Dick Itasca 9030006050 NLF 85 20 1.35 0 FS
31-0664-00 Ranier Itasca 9030006050 NLF 81 45 0.4 0 FS
31-0764-00 Jingo Itasca 9030006050 NLF 78 60 0.46 48 FS
31-0705-00 Lundeen Itasca 9030006050 NLF 75 30 19.3 48 FS
31-0513-00 Gale Itasca 9030006050 NLF 73 50 0.7 51 FS
31-0544-00 Cameron Itasca 9030006050 NLF 73 37 51.6 59.8 FS
31-0768-00 Big Rose Itasca 9030006050 NLF 69 25 0.3 94.9 FS
31-0451-00 Three Island Itasca 9030006050 NLF 66 28 0.52 0 FS
31-0478-00 Pine Itasca 9030006050 NLF 65 44 0.85 0 FS
31-0459-00 Little East Itasca 9030006050 NLF 61 100 0.52 0 FS
31-0686-00 Bevo Itasca 9030006050 NLF 53 40 0.21 60 FS
31-0692-00 Lauchoh Itasca 9030006050 NLF 50 40 5.82 45 FS
31-0507-00 Marie Itasca 9030006050 NLF 49 35 0.4 84.9 FS
31-0487-00 Lum Itasca 9030006050 NLF 48 24 0.31 86.5 FS
31-0522-00 La Barge Itasca 9030006050 NLF 39 30 13 0 FS
31-0700-00 McDonald Itasca 9030006050 NLF 28 N/A 0 FS
31-0808-00 Little Round Itasca 9030006050 NLF 28 10 0.4 0 FS
31-0464-00 Oar Itasca 9030006050 NLF 27 60 8.16 0 FS
31-0479-00 Little Clubhouse Itasca 9030006050 NLF 27 20.5 0 FS
31-0470-00 Unnamed (Nickel) Itasca 9030006050 NLF 13 36.5 0.1 44.7 FS
31-0465-00 Oak Itasca 9030006050 NLF 12 7.8 0 FS
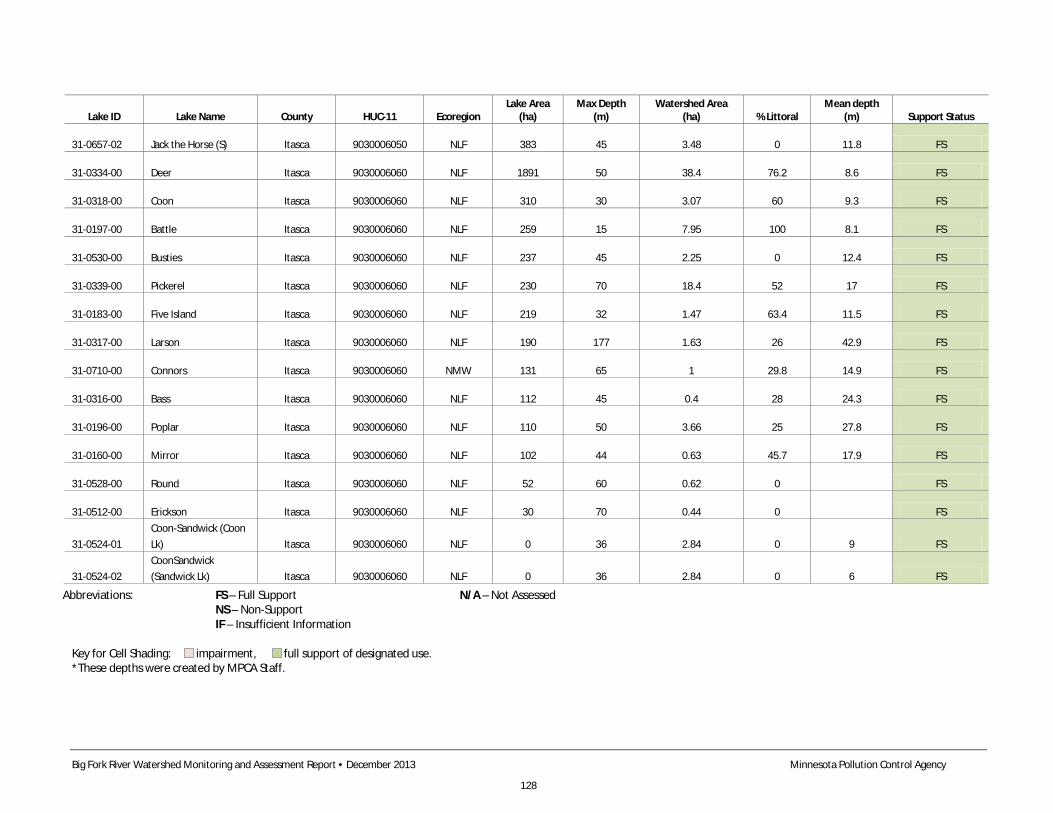
Big Fork River Watershed Monitoring and Assessment Report • December 2013 Minnesota Pollution Control Agency
128
Lake ID Lake Name County HUC-11 Ecoregion Lake Area
(ha) Max Depth
(m) Watershed Area
(ha) % Littoral Mean depth
(m) Support Status
31-0657-02 Jack the Horse (S) Itasca 9030006050 NLF 383 45 3.48 0 11.8 FS
31-0334-00 Deer Itasca 9030006060 NLF 1891 50 38.4 76.2 8.6 FS
31-0318-00 Coon Itasca 9030006060 NLF 310 30 3.07 60 9.3 FS
31-0197-00 Battle Itasca 9030006060 NLF 259 15 7.95 100 8.1 FS
31-0530-00 Busties Itasca 9030006060 NLF 237 45 2.25 0 12.4 FS
31-0339-00 Pickerel Itasca 9030006060 NLF 230 70 18.4 52 17 FS
31-0183-00 Five Island Itasca 9030006060 NLF 219 32 1.47 63.4 11.5 FS
31-0317-00 Larson Itasca 9030006060 NLF 190 177 1.63 26 42.9 FS
31-0710-00 Connors Itasca 9030006060 NMW 131 65 1 29.8 14.9 FS
31-0316-00 Bass Itasca 9030006060 NLF 112 45 0.4 28 24.3 FS
31-0196-00 Poplar Itasca 9030006060 NLF 110 50 3.66 25 27.8 FS
31-0160-00 Mirror Itasca 9030006060 NLF 102 44 0.63 45.7 17.9 FS
31-0528-00 Round Itasca 9030006060 NLF 52 60 0.62 0 FS
31-0512-00 Erickson Itasca 9030006060 NLF 30 70 0.44 0 FS
31-0524-01 Coon-Sandwick (Coon Lk) Itasca 9030006060 NLF 0 36 2.84 0 9 FS
31-0524-02 CoonSandwick (Sandwick Lk) Itasca 9030006060 NLF 0 36 2.84 0 6 FS
Abbreviations: FS – Full Support N/A – Not Assessed NS – Non-Support IF – Insufficient Information Key for Cell Shading: = impairment, = full support of designated use. *These depths were created by MPCA Staff.
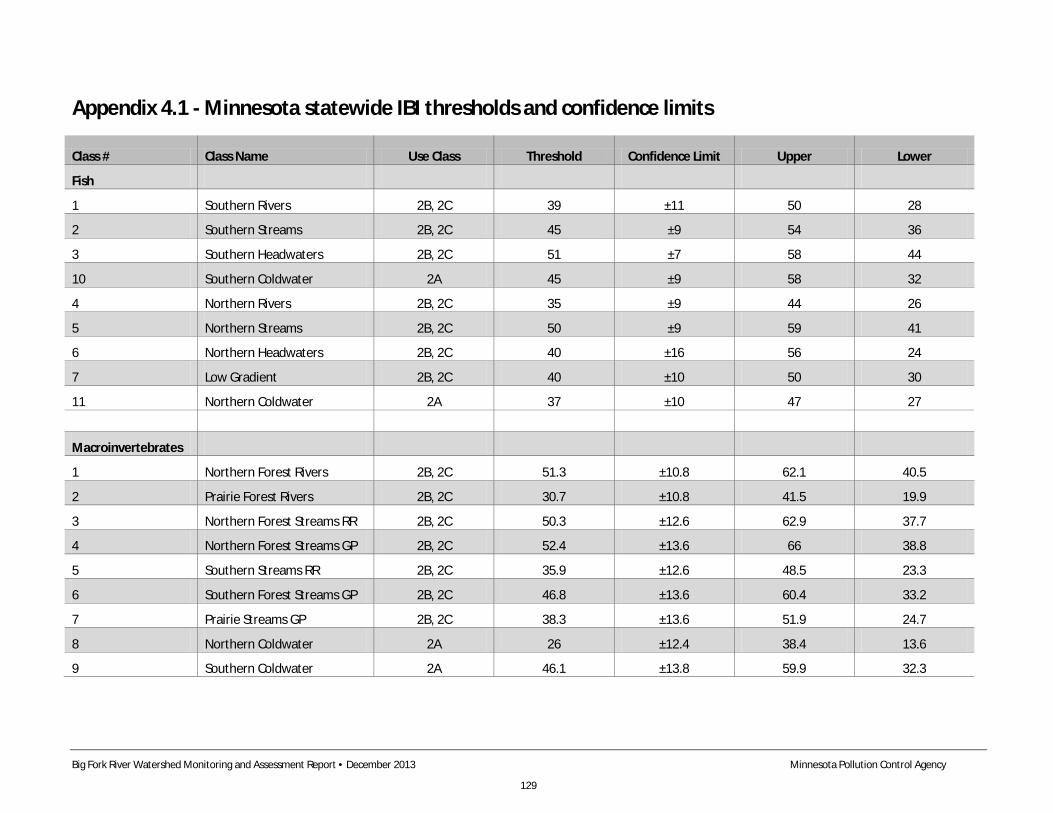
Big Fork River Watershed Monitoring and Assessment Report • December 2013 Minnesota Pollution Control Agency
129
Appendix 4.1 - Minnesota statewide IBI thresholds and confidence limits
Class # Class Name Use Class Threshold Confidence Limit Upper Lower
Fish
1 Southern Rivers 2B, 2C 39 ±11 50 28
2 Southern Streams 2B, 2C 45 ±9 54 36
3 Southern Headwaters 2B, 2C 51 ±7 58 44
10 Southern Coldwater 2A 45 ±9 58 32
4 Northern Rivers 2B, 2C 35 ±9 44 26
5 Northern Streams 2B, 2C 50 ±9 59 41
6 Northern Headwaters 2B, 2C 40 ±16 56 24
7 Low Gradient 2B, 2C 40 ±10 50 30
11 Northern Coldwater 2A 37 ±10 47 27
Macroinvertebrates
1 Northern Forest Rivers 2B, 2C 51.3 ±10.8 62.1 40.5
2 Prairie Forest Rivers 2B, 2C 30.7 ±10.8 41.5 19.9
3 Northern Forest Streams RR 2B, 2C 50.3 ±12.6 62.9 37.7
4 Northern Forest Streams GP 2B, 2C 52.4 ±13.6 66 38.8
5 Southern Streams RR 2B, 2C 35.9 ±12.6 48.5 23.3
6 Southern Forest Streams GP 2B, 2C 46.8 ±13.6 60.4 33.2
7 Prairie Streams GP 2B, 2C 38.3 ±13.6 51.9 24.7
8 Northern Coldwater 2A 26 ±12.4 38.4 13.6
9 Southern Coldwater 2A 46.1 ±13.8 59.9 32.3
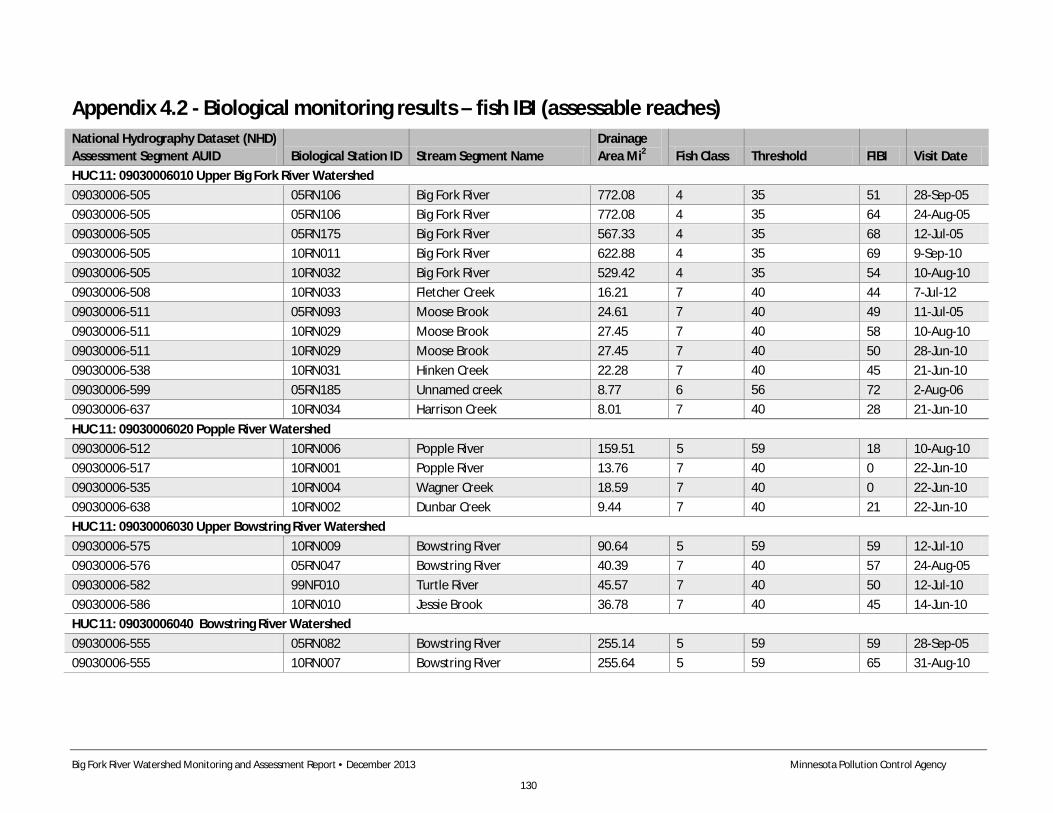
Big Fork River Watershed Monitoring and Assessment Report • December 2013 Minnesota Pollution Control Agency
130
Appendix 4.2 - Biological monitoring results – fish IBI (assessable reaches) National Hydrography Dataset (NHD) Assessment Segment AUID Biological Station ID Stream Segment Name
Drainage Area Mi2 Fish Class Threshold FIBI Visit Date
HUC 11: 09030006010 Upper Big Fork River Watershed 09030006-505 05RN106 Big Fork River 772.08 4 35 51 28-Sep-05 09030006-505 05RN106 Big Fork River 772.08 4 35 64 24-Aug-05 09030006-505 05RN175 Big Fork River 567.33 4 35 68 12-Jul-05 09030006-505 10RN011 Big Fork River 622.88 4 35 69 9-Sep-10 09030006-505 10RN032 Big Fork River 529.42 4 35 54 10-Aug-10 09030006-508 10RN033 Fletcher Creek 16.21 7 40 44 7-Jul-12 09030006-511 05RN093 Moose Brook 24.61 7 40 49 11-Jul-05 09030006-511 10RN029 Moose Brook 27.45 7 40 58 10-Aug-10 09030006-511 10RN029 Moose Brook 27.45 7 40 50 28-Jun-10 09030006-538 10RN031 Hinken Creek 22.28 7 40 45 21-Jun-10 09030006-599 05RN185 Unnamed creek 8.77 6 56 72 2-Aug-06 09030006-637 10RN034 Harrison Creek 8.01 7 40 28 21-Jun-10 HUC 11: 09030006020 Popple River Watershed
09030006-512 10RN006 Popple River 159.51 5 59 18 10-Aug-10
09030006-517 10RN001 Popple River 13.76 7 40 0 22-Jun-10 09030006-535 10RN004 Wagner Creek 18.59 7 40 0 22-Jun-10 09030006-638 10RN002 Dunbar Creek 9.44 7 40 21 22-Jun-10 HUC 11: 09030006030 Upper Bowstring River Watershed 09030006-575 10RN009 Bowstring River 90.64 5 59 59 12-Jul-10 09030006-576 05RN047 Bowstring River 40.39 7 40 57 24-Aug-05 09030006-582 99NF010 Turtle River 45.57 7 40 50 12-Jul-10 09030006-586 10RN010 Jessie Brook 36.78 7 40 45 14-Jun-10 HUC 11: 09030006040 Bowstring River Watershed 09030006-555 05RN082 Bowstring River 255.14 5 59 59 28-Sep-05 09030006-555 10RN007 Bowstring River 255.64 5 59 65 31-Aug-10
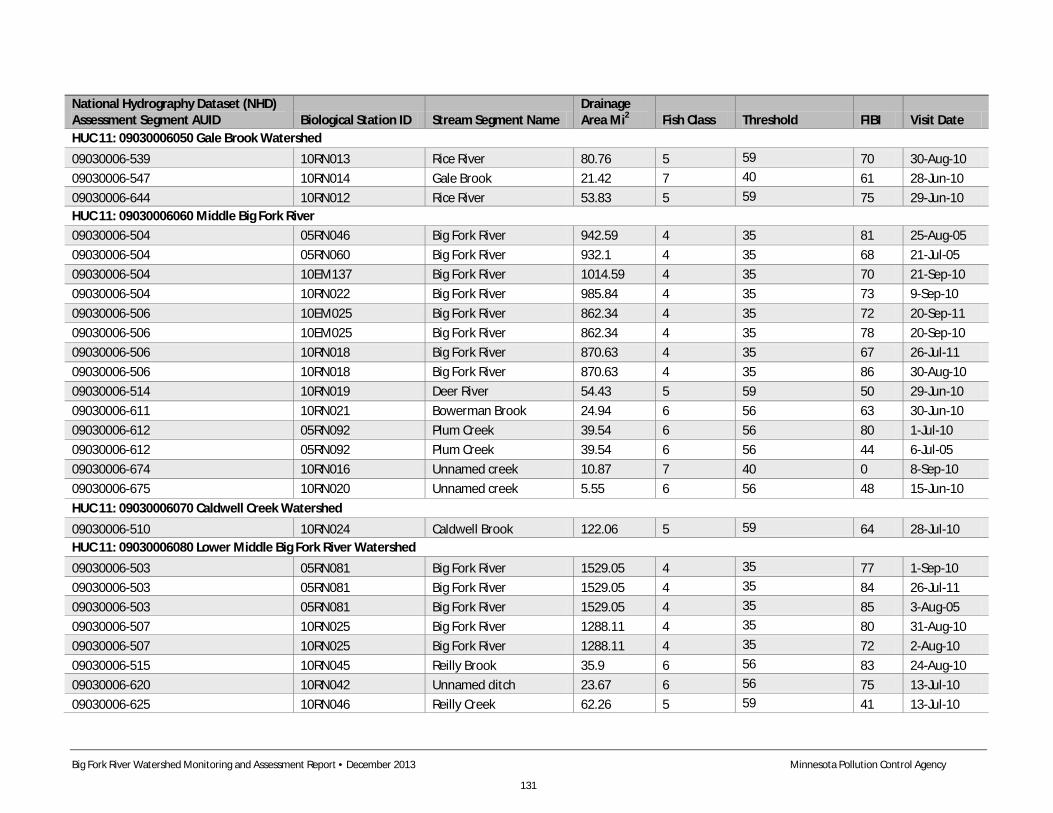
Big Fork River Watershed Monitoring and Assessment Report • December 2013 Minnesota Pollution Control Agency
131
National Hydrography Dataset (NHD) Assessment Segment AUID Biological Station ID Stream Segment Name
Drainage Area Mi2 Fish Class Threshold FIBI Visit Date
HUC 11: 09030006050 Gale Brook Watershed 09030006-539 10RN013 Rice River 80.76 5 59 70 30-Aug-10 09030006-547 10RN014 Gale Brook 21.42 7 40 61 28-Jun-10 09030006-644 10RN012 Rice River 53.83 5 59 75 29-Jun-10 HUC 11: 09030006060 Middle Big Fork River 09030006-504 05RN046 Big Fork River 942.59 4 35 81 25-Aug-05 09030006-504 05RN060 Big Fork River 932.1 4 35 68 21-Jul-05 09030006-504 10EM137 Big Fork River 1014.59 4 35 70 21-Sep-10 09030006-504 10RN022 Big Fork River 985.84 4 35 73 9-Sep-10 09030006-506 10EM025 Big Fork River 862.34 4 35 72 20-Sep-11 09030006-506 10EM025 Big Fork River 862.34 4 35 78 20-Sep-10 09030006-506 10RN018 Big Fork River 870.63 4 35 67 26-Jul-11 09030006-506 10RN018 Big Fork River 870.63 4 35 86 30-Aug-10 09030006-514 10RN019 Deer River 54.43 5 59 50 29-Jun-10 09030006-611 10RN021 Bowerman Brook 24.94 6 56 63 30-Jun-10 09030006-612 05RN092 Plum Creek 39.54 6 56 80 1-Jul-10 09030006-612 05RN092 Plum Creek 39.54 6 56 44 6-Jul-05 09030006-674 10RN016 Unnamed creek 10.87 7 40 0 8-Sep-10 09030006-675 10RN020 Unnamed creek 5.55 6 56 48 15-Jun-10 HUC 11: 09030006070 Caldwell Creek Watershed
09030006-510 10RN024 Caldwell Brook 122.06 5 59 64 28-Jul-10 HUC 11: 09030006080 Lower Middle Big Fork River Watershed 09030006-503 05RN081 Big Fork River 1529.05 4 35 77 1-Sep-10 09030006-503 05RN081 Big Fork River 1529.05 4 35 84 26-Jul-11 09030006-503 05RN081 Big Fork River 1529.05 4 35 85 3-Aug-05 09030006-507 10RN025 Big Fork River 1288.11 4 35 80 31-Aug-10 09030006-507 10RN025 Big Fork River 1288.11 4 35 72 2-Aug-10 09030006-515 10RN045 Reilly Brook 35.9 6 56 83 24-Aug-10 09030006-620 10RN042 Unnamed ditch 23.67 6 56 75 13-Jul-10 09030006-625 10RN046 Reilly Creek 62.26 5 59 41 13-Jul-10
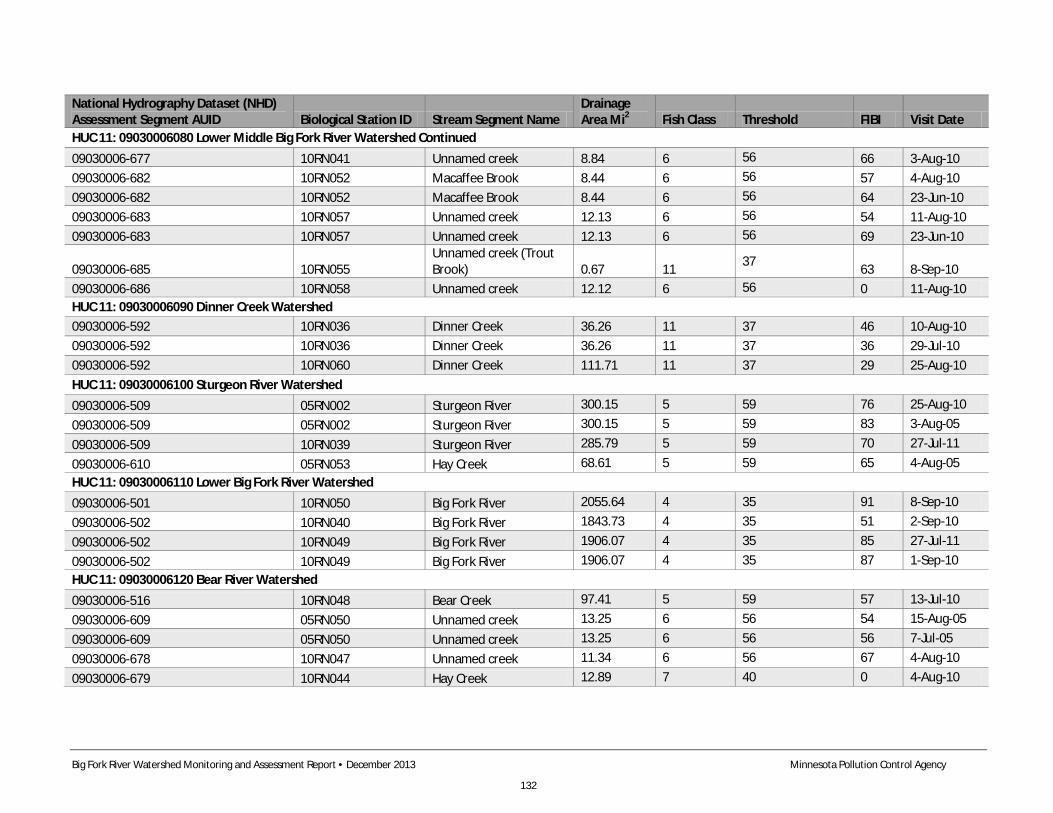
Big Fork River Watershed Monitoring and Assessment Report • December 2013 Minnesota Pollution Control Agency
132
National Hydrography Dataset (NHD) Assessment Segment AUID Biological Station ID Stream Segment Name
Drainage Area Mi2 Fish Class Threshold FIBI Visit Date
HUC 11: 09030006080 Lower Middle Big Fork River Watershed Continued 09030006-677 10RN041 Unnamed creek 8.84 6 56 66 3-Aug-10 09030006-682 10RN052 Macaffee Brook 8.44 6 56 57 4-Aug-10 09030006-682 10RN052 Macaffee Brook 8.44 6 56 64 23-Jun-10 09030006-683 10RN057 Unnamed creek 12.13 6 56 54 11-Aug-10 09030006-683 10RN057 Unnamed creek 12.13 6 56 69 23-Jun-10
09030006-685 10RN055 Unnamed creek (Trout Brook) 0.67 11 37 63 8-Sep-10
09030006-686 10RN058 Unnamed creek 12.12 6 56 0 11-Aug-10 HUC 11: 09030006090 Dinner Creek Watershed 09030006-592 10RN036 Dinner Creek 36.26 11 37 46 10-Aug-10 09030006-592 10RN036 Dinner Creek 36.26 11 37 36 29-Jul-10 09030006-592 10RN060 Dinner Creek 111.71 11 37 29 25-Aug-10 HUC 11: 09030006100 Sturgeon River Watershed 09030006-509 05RN002 Sturgeon River 300.15 5 59 76 25-Aug-10 09030006-509 05RN002 Sturgeon River 300.15 5 59 83 3-Aug-05
09030006-509 10RN039 Sturgeon River 285.79 5 59 70 27-Jul-11
09030006-610 05RN053 Hay Creek 68.61 5 59 65 4-Aug-05 HUC 11: 09030006110 Lower Big Fork River Watershed 09030006-501 10RN050 Big Fork River 2055.64 4 35 91 8-Sep-10 09030006-502 10RN040 Big Fork River 1843.73 4 35 51 2-Sep-10 09030006-502 10RN049 Big Fork River 1906.07 4 35 85 27-Jul-11 09030006-502 10RN049 Big Fork River 1906.07 4 35 87 1-Sep-10 HUC 11: 09030006120 Bear River Watershed 09030006-516 10RN048 Bear Creek 97.41 5 59 57 13-Jul-10 09030006-609 05RN050 Unnamed creek 13.25 6 56 54 15-Aug-05 09030006-609 05RN050 Unnamed creek 13.25 6 56 56 7-Jul-05 09030006-678 10RN047 Unnamed creek 11.34 6 56 67 4-Aug-10
09030006-679 10RN044 Hay Creek 12.89 7 40 0 4-Aug-10
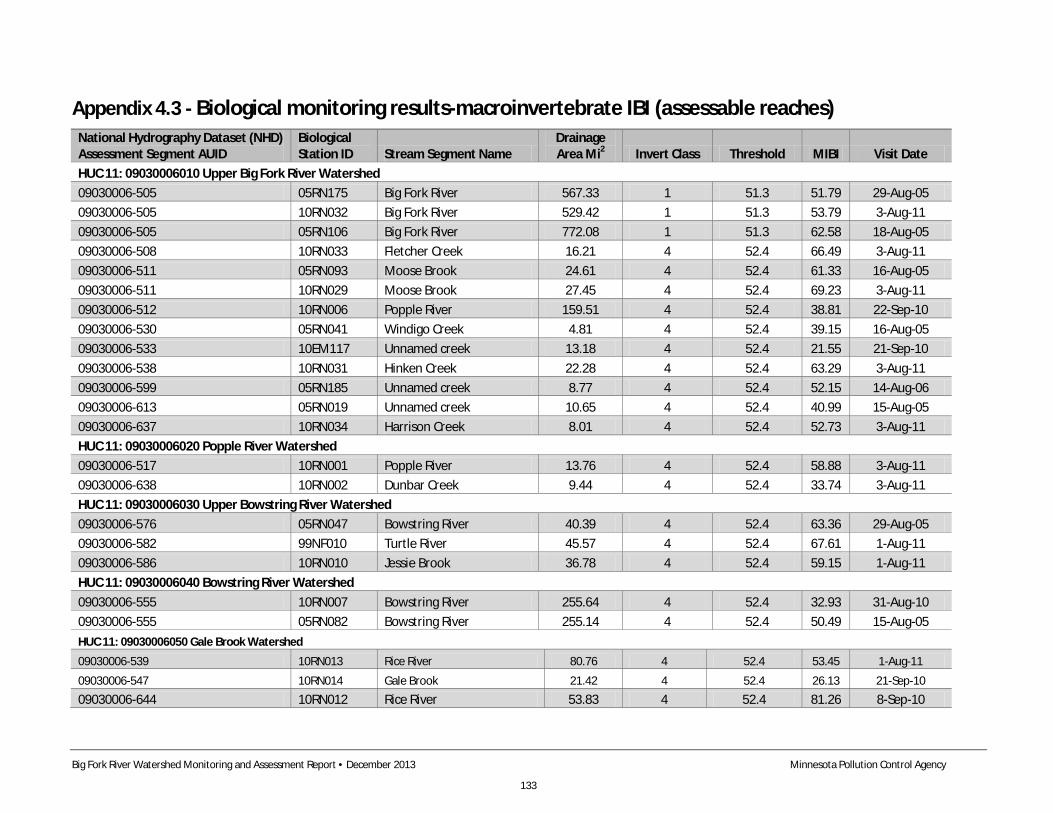
Big Fork River Watershed Monitoring and Assessment Report • December 2013 Minnesota Pollution Control Agency
133
Appendix 4.3 - Biological monitoring results-macroinvertebrate IBI (assessable reaches) National Hydrography Dataset (NHD) Assessment Segment AUID
Biological Station ID Stream Segment Name
Drainage Area Mi2 Invert Class Threshold MIBI Visit Date
HUC 11: 09030006010 Upper Big Fork River Watershed 09030006-505 05RN175 Big Fork River 567.33 1 51.3 51.79 29-Aug-05 09030006-505 10RN032 Big Fork River 529.42 1 51.3 53.79 3-Aug-11 09030006-505 05RN106 Big Fork River 772.08 1 51.3 62.58 18-Aug-05 09030006-508 10RN033 Fletcher Creek 16.21 4 52.4 66.49 3-Aug-11 09030006-511 05RN093 Moose Brook 24.61 4 52.4 61.33 16-Aug-05 09030006-511 10RN029 Moose Brook 27.45 4 52.4 69.23 3-Aug-11 09030006-512 10RN006 Popple River 159.51 4 52.4 38.81 22-Sep-10 09030006-530 05RN041 Windigo Creek 4.81 4 52.4 39.15 16-Aug-05 09030006-533 10EM117 Unnamed creek 13.18 4 52.4 21.55 21-Sep-10 09030006-538 10RN031 Hinken Creek 22.28 4 52.4 63.29 3-Aug-11 09030006-599 05RN185 Unnamed creek 8.77 4 52.4 52.15 14-Aug-06 09030006-613 05RN019 Unnamed creek 10.65 4 52.4 40.99 15-Aug-05 09030006-637 10RN034 Harrison Creek 8.01 4 52.4 52.73 3-Aug-11 HUC 11: 09030006020 Popple River Watershed 09030006-517 10RN001 Popple River 13.76 4 52.4 58.88 3-Aug-11 09030006-638 10RN002 Dunbar Creek 9.44 4 52.4 33.74 3-Aug-11 HUC 11: 09030006030 Upper Bowstring River Watershed 09030006-576 05RN047 Bowstring River 40.39 4 52.4 63.36 29-Aug-05 09030006-582 99NF010 Turtle River 45.57 4 52.4 67.61 1-Aug-11 09030006-586 10RN010 Jessie Brook 36.78 4 52.4 59.15 1-Aug-11 HUC 11: 09030006040 Bowstring River Watershed 09030006-555 10RN007 Bowstring River 255.64 4 52.4 32.93 31-Aug-10 09030006-555 05RN082 Bowstring River 255.14 4 52.4 50.49 15-Aug-05 HUC 11: 09030006050 Gale Brook Watershed
09030006-539 10RN013 Rice River 80.76 4 52.4 53.45 1-Aug-11
09030006-547 10RN014 Gale Brook 21.42 4 52.4 26.13 21-Sep-10
09030006-644 10RN012 Rice River 53.83 4 52.4 81.26 8-Sep-10
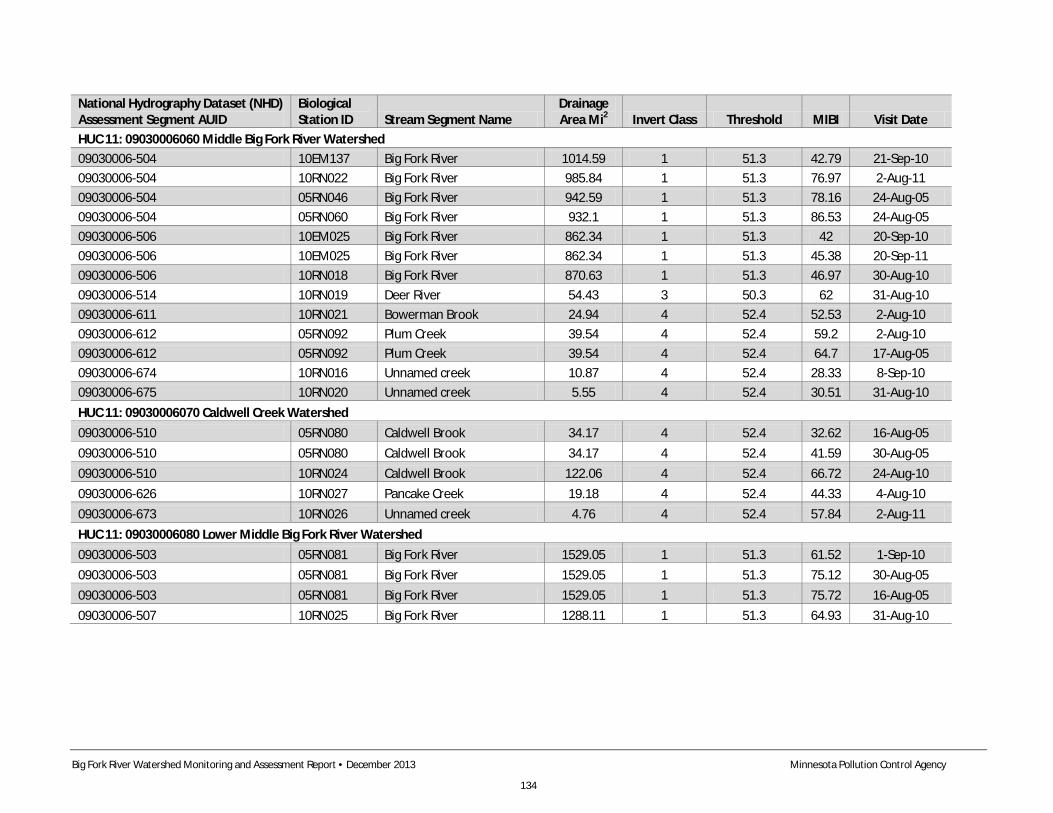
Big Fork River Watershed Monitoring and Assessment Report • December 2013 Minnesota Pollution Control Agency
134
National Hydrography Dataset (NHD) Assessment Segment AUID
Biological Station ID Stream Segment Name
Drainage Area Mi2 Invert Class Threshold MIBI Visit Date
HUC 11: 09030006060 Middle Big Fork River Watershed 09030006-504 10EM137 Big Fork River 1014.59 1 51.3 42.79 21-Sep-10 09030006-504 10RN022 Big Fork River 985.84 1 51.3 76.97 2-Aug-11 09030006-504 05RN046 Big Fork River 942.59 1 51.3 78.16 24-Aug-05 09030006-504 05RN060 Big Fork River 932.1 1 51.3 86.53 24-Aug-05 09030006-506 10EM025 Big Fork River 862.34 1 51.3 42 20-Sep-10 09030006-506 10EM025 Big Fork River 862.34 1 51.3 45.38 20-Sep-11 09030006-506 10RN018 Big Fork River 870.63 1 51.3 46.97 30-Aug-10 09030006-514 10RN019 Deer River 54.43 3 50.3 62 31-Aug-10 09030006-611 10RN021 Bowerman Brook 24.94 4 52.4 52.53 2-Aug-10 09030006-612 05RN092 Plum Creek 39.54 4 52.4 59.2 2-Aug-10 09030006-612 05RN092 Plum Creek 39.54 4 52.4 64.7 17-Aug-05 09030006-674 10RN016 Unnamed creek 10.87 4 52.4 28.33 8-Sep-10 09030006-675 10RN020 Unnamed creek 5.55 4 52.4 30.51 31-Aug-10 HUC 11: 09030006070 Caldwell Creek Watershed 09030006-510 05RN080 Caldwell Brook 34.17 4 52.4 32.62 16-Aug-05 09030006-510 05RN080 Caldwell Brook 34.17 4 52.4 41.59 30-Aug-05 09030006-510 10RN024 Caldwell Brook 122.06 4 52.4 66.72 24-Aug-10 09030006-626 10RN027 Pancake Creek 19.18 4 52.4 44.33 4-Aug-10 09030006-673 10RN026 Unnamed creek 4.76 4 52.4 57.84 2-Aug-11 HUC 11: 09030006080 Lower Middle Big Fork River Watershed 09030006-503 05RN081 Big Fork River 1529.05 1 51.3 61.52 1-Sep-10 09030006-503 05RN081 Big Fork River 1529.05 1 51.3 75.12 30-Aug-05 09030006-503 05RN081 Big Fork River 1529.05 1 51.3 75.72 16-Aug-05 09030006-507 10RN025 Big Fork River 1288.11 1 51.3 64.93 31-Aug-10
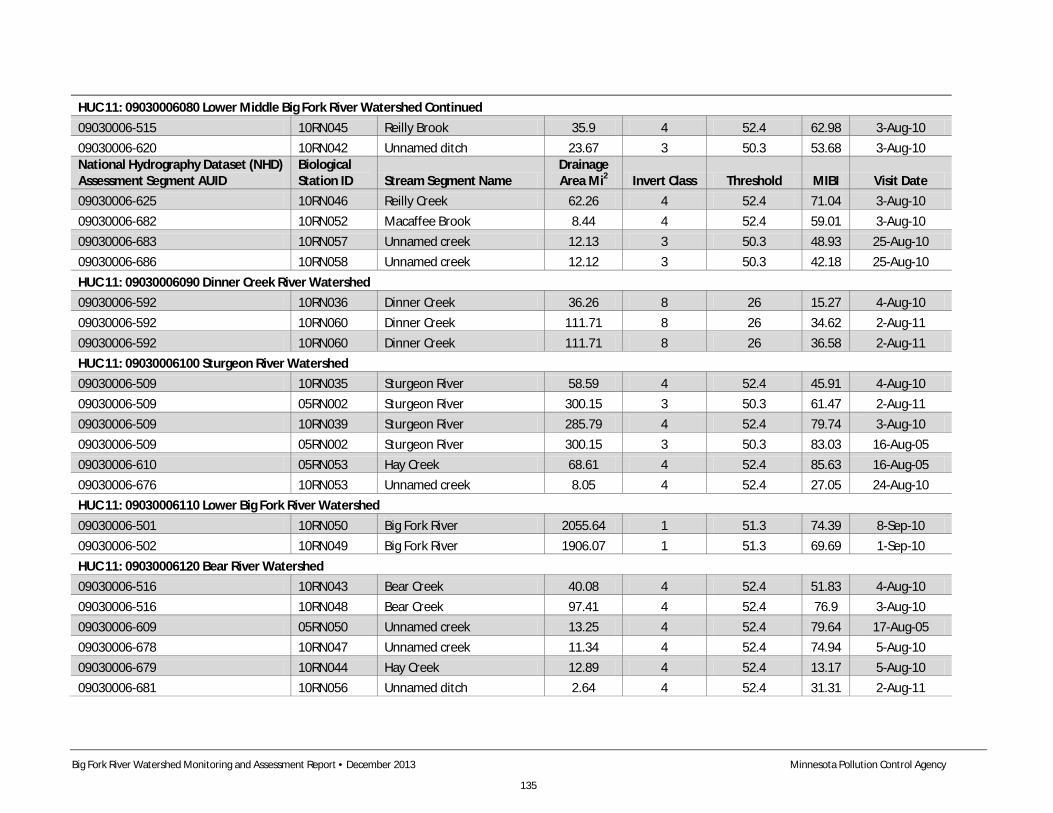
Big Fork River Watershed Monitoring and Assessment Report • December 2013 Minnesota Pollution Control Agency
135
HUC 11: 09030006080 Lower Middle Big Fork River Watershed Continued 09030006-515 10RN045 Reilly Brook 35.9 4 52.4 62.98 3-Aug-10 09030006-620 10RN042 Unnamed ditch 23.67 3 50.3 53.68 3-Aug-10 National Hydrography Dataset (NHD) Assessment Segment AUID
Biological Station ID Stream Segment Name
Drainage Area Mi2 Invert Class Threshold MIBI Visit Date
09030006-625 10RN046 Reilly Creek 62.26 4 52.4 71.04 3-Aug-10 09030006-682 10RN052 Macaffee Brook 8.44 4 52.4 59.01 3-Aug-10 09030006-683 10RN057 Unnamed creek 12.13 3 50.3 48.93 25-Aug-10 09030006-686 10RN058 Unnamed creek 12.12 3 50.3 42.18 25-Aug-10 HUC 11: 09030006090 Dinner Creek River Watershed 09030006-592 10RN036 Dinner Creek 36.26 8 26 15.27 4-Aug-10 09030006-592 10RN060 Dinner Creek 111.71 8 26 34.62 2-Aug-11 09030006-592 10RN060 Dinner Creek 111.71 8 26 36.58 2-Aug-11 HUC 11: 09030006100 Sturgeon River Watershed 09030006-509 10RN035 Sturgeon River 58.59 4 52.4 45.91 4-Aug-10 09030006-509 05RN002 Sturgeon River 300.15 3 50.3 61.47 2-Aug-11 09030006-509 10RN039 Sturgeon River 285.79 4 52.4 79.74 3-Aug-10 09030006-509 05RN002 Sturgeon River 300.15 3 50.3 83.03 16-Aug-05 09030006-610 05RN053 Hay Creek 68.61 4 52.4 85.63 16-Aug-05 09030006-676 10RN053 Unnamed creek 8.05 4 52.4 27.05 24-Aug-10 HUC 11: 09030006110 Lower Big Fork River Watershed 09030006-501 10RN050 Big Fork River 2055.64 1 51.3 74.39 8-Sep-10 09030006-502 10RN049 Big Fork River 1906.07 1 51.3 69.69 1-Sep-10 HUC 11: 09030006120 Bear River Watershed 09030006-516 10RN043 Bear Creek 40.08 4 52.4 51.83 4-Aug-10 09030006-516 10RN048 Bear Creek 97.41 4 52.4 76.9 3-Aug-10 09030006-609 05RN050 Unnamed creek 13.25 4 52.4 79.64 17-Aug-05 09030006-678 10RN047 Unnamed creek 11.34 4 52.4 74.94 5-Aug-10 09030006-679 10RN044 Hay Creek 12.89 4 52.4 13.17 5-Aug-10 09030006-681 10RN056 Unnamed ditch 2.64 4 52.4 31.31 2-Aug-11
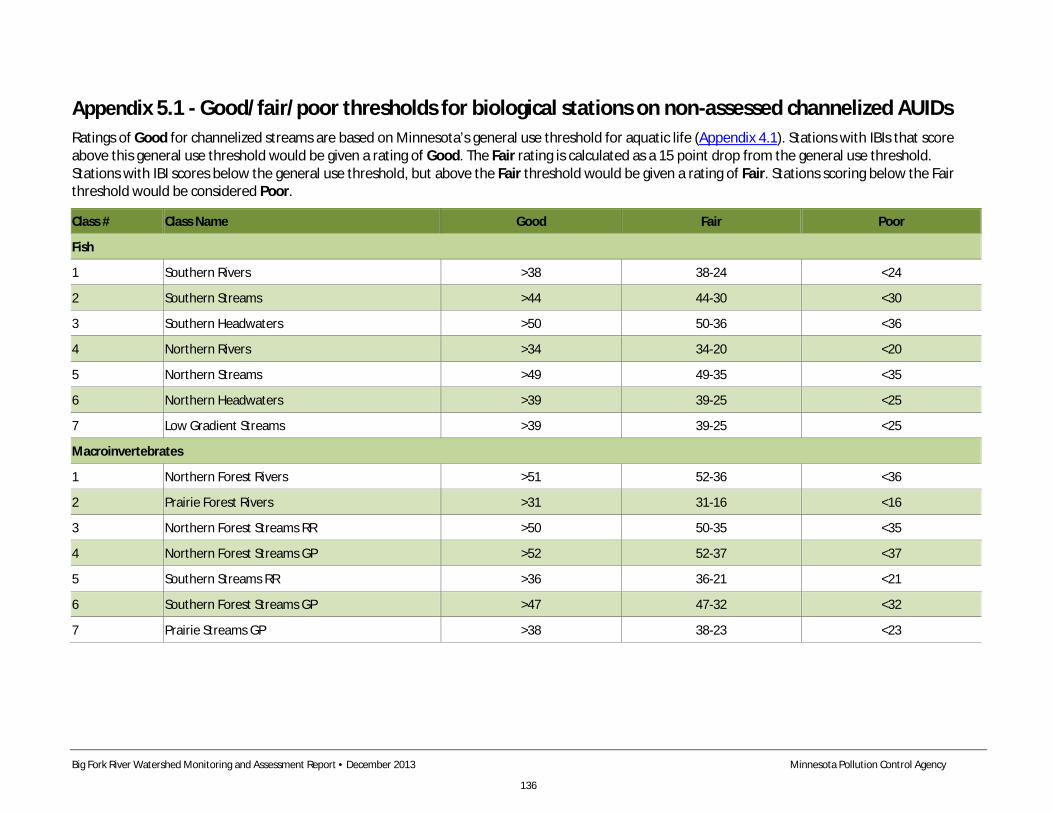
Big Fork River Watershed Monitoring and Assessment Report • December 2013 Minnesota Pollution Control Agency
136
Appendix 5.1 - Good/fair/poor thresholds for biological stations on non-assessed channelized AUIDs Ratings of Good for channelized streams are based on Minnesota’s general use threshold for aquatic life (Appendix 4.1). Stations with IBIs that score above this general use threshold would be given a rating of Good. The Fair rating is calculated as a 15 point drop from the general use threshold. Stations with IBI scores below the general use threshold, but above the Fair threshold would be given a rating of Fair. Stations scoring below the Fair threshold would be considered Poor.
Class # Class Name Good Fair Poor
Fish
1 Southern Rivers >38 38-24 <24
2 Southern Streams >44 44-30 <30
3 Southern Headwaters >50 50-36 <36
4 Northern Rivers >34 34-20 <20
5 Northern Streams >49 49-35 <35
6 Northern Headwaters >39 39-25 <25
7 Low Gradient Streams >39 39-25 <25
Macroinvertebrates
1 Northern Forest Rivers >51 52-36 <36
2 Prairie Forest Rivers >31 31-16 <16
3 Northern Forest Streams RR >50 50-35 <35
4 Northern Forest Streams GP >52 52-37 <37
5 Southern Streams RR >36 36-21 <21
6 Southern Forest Streams GP >47 47-32 <32
7 Prairie Streams GP >38 38-23 <23
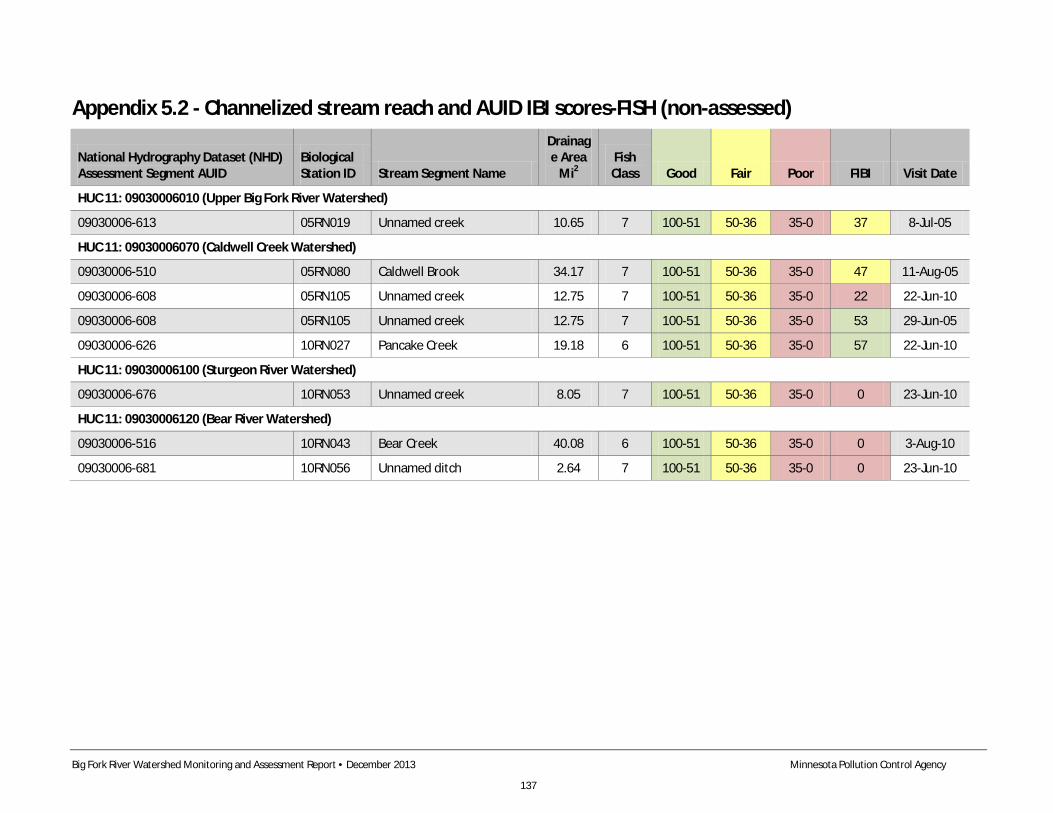
Big Fork River Watershed Monitoring and Assessment Report • December 2013 Minnesota Pollution Control Agency
137
Appendix 5.2 - Channelized stream reach and AUID IBI scores-FISH (non-assessed)
National Hydrography Dataset (NHD) Assessment Segment AUID
Biological Station ID Stream Segment Name
Drainage Area
Mi2 Fish Class Good Fair Poor FIBI Visit Date
HUC 11: 09030006010 (Upper Big Fork River Watershed)
09030006-613 05RN019 Unnamed creek 10.65 7 100-51 50-36 35-0 37 8-Jul-05
HUC 11: 09030006070 (Caldwell Creek Watershed)
09030006-510 05RN080 Caldwell Brook 34.17 7 100-51 50-36 35-0 47 11-Aug-05
09030006-608 05RN105 Unnamed creek 12.75 7 100-51 50-36 35-0 22 22-Jun-10
09030006-608 05RN105 Unnamed creek 12.75 7 100-51 50-36 35-0 53 29-Jun-05
09030006-626 10RN027 Pancake Creek 19.18 6 100-51 50-36 35-0 57 22-Jun-10
HUC 11: 09030006100 (Sturgeon River Watershed)
09030006-676 10RN053 Unnamed creek 8.05 7 100-51 50-36 35-0 0 23-Jun-10
HUC 11: 09030006120 (Bear River Watershed)
09030006-516 10RN043 Bear Creek 40.08 6 100-51 50-36 35-0 0 3-Aug-10
09030006-681 10RN056 Unnamed ditch 2.64 7 100-51 50-36 35-0 0 23-Jun-10
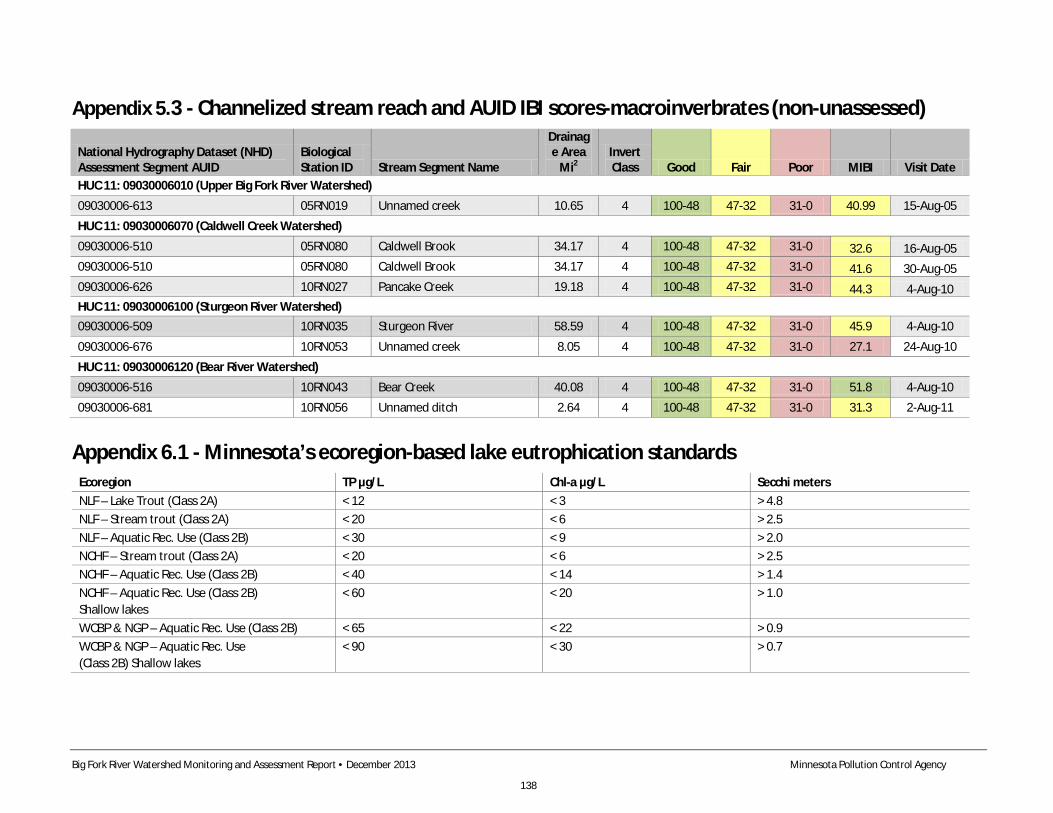
Big Fork River Watershed Monitoring and Assessment Report • December 2013 Minnesota Pollution Control Agency
138
Appendix 5.3 - Channelized stream reach and AUID IBI scores-macroinverbrates (non-unassessed)
National Hydrography Dataset (NHD) Assessment Segment AUID
Biological Station ID Stream Segment Name
Drainage Area
Mi2 Invert Class Good Fair Poor MIBI Visit Date
HUC 11: 09030006010 (Upper Big Fork River Watershed) 09030006-613 05RN019 Unnamed creek 10.65 4 100-48 47-32 31-0 40.99 15-Aug-05
HUC 11: 09030006070 (Caldwell Creek Watershed)
09030006-510 05RN080 Caldwell Brook 34.17 4 100-48 47-32 31-0 32.6 16-Aug-05 09030006-510 05RN080 Caldwell Brook 34.17 4 100-48 47-32 31-0 41.6 30-Aug-05 09030006-626 10RN027 Pancake Creek 19.18 4 100-48 47-32 31-0 44.3 4-Aug-10 HUC 11: 09030006100 (Sturgeon River Watershed) 09030006-509 10RN035 Sturgeon River 58.59 4 100-48 47-32 31-0 45.9 4-Aug-10
09030006-676 10RN053 Unnamed creek 8.05 4 100-48 47-32 31-0 27.1 24-Aug-10
HUC 11: 09030006120 (Bear River Watershed) 09030006-516 10RN043 Bear Creek 40.08 4 100-48 47-32 31-0 51.8 4-Aug-10
09030006-681 10RN056 Unnamed ditch 2.64 4 100-48 47-32 31-0 31.3 2-Aug-11
Appendix 6.1 - Minnesota’s ecoregion-based lake eutrophication standards Ecoregion TP µg/L Chl-a µg/L Secchi meters NLF – Lake Trout (Class 2A) < 12 < 3 > 4.8 NLF – Stream trout (Class 2A) < 20 < 6 > 2.5 NLF – Aquatic Rec. Use (Class 2B) < 30 < 9 > 2.0 NCHF – Stream trout (Class 2A) < 20 < 6 > 2.5 NCHF – Aquatic Rec. Use (Class 2B) < 40 < 14 > 1.4 NCHF – Aquatic Rec. Use (Class 2B) Shallow lakes
< 60 < 20 > 1.0
WCBP & NGP – Aquatic Rec. Use (Class 2B) < 65 < 22 > 0.9 WCBP & NGP – Aquatic Rec. Use (Class 2B) Shallow lakes
< 90 < 30 > 0.7
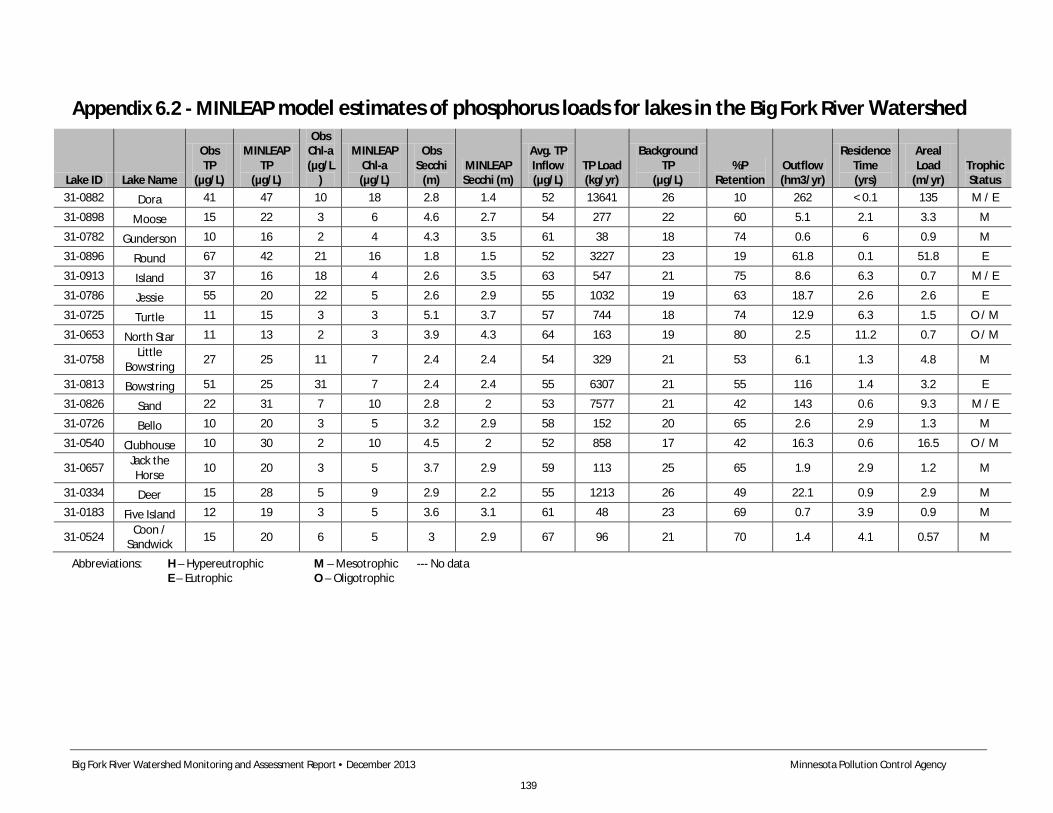
Big Fork River Watershed Monitoring and Assessment Report • December 2013 Minnesota Pollution Control Agency
139
Appendix 6.2 - MINLEAP model estimates of phosphorus loads for lakes in the Big Fork River Watershed
Lake ID Lake Name
Obs TP
(µg/L)
MINLEAP TP
(µg/L)
Obs Chl-a (µg/L
)
MINLEAP Chl-a (µg/L)
Obs Secchi
(m) MINLEAP Secchi (m)
Avg. TP Inflow (µg/L)
TP Load (kg/yr)
Background TP
(µg/L) %P
Retention Outflow (hm3/yr)
Residence Time (yrs)
Areal Load
(m/yr) Trophic Status
31-0882 Dora 41 47 10 18 2.8 1.4 52 13641 26 10 262 < 0.1 135 M / E
31-0898 Moose 15 22 3 6 4.6 2.7 54 277 22 60 5.1 2.1 3.3 M
31-0782 Gunderson 10 16 2 4 4.3 3.5 61 38 18 74 0.6 6 0.9 M
31-0896 Round 67 42 21 16 1.8 1.5 52 3227 23 19 61.8 0.1 51.8 E
31-0913 Island 37 16 18 4 2.6 3.5 63 547 21 75 8.6 6.3 0.7 M / E
31-0786 Jessie 55 20 22 5 2.6 2.9 55 1032 19 63 18.7 2.6 2.6 E
31-0725 Turtle 11 15 3 3 5.1 3.7 57 744 18 74 12.9 6.3 1.5 O / M
31-0653 North Star 11 13 2 3 3.9 4.3 64 163 19 80 2.5 11.2 0.7 O / M
31-0758 Little Bowstring 27 25 11 7 2.4 2.4 54 329 21 53 6.1 1.3 4.8 M
31-0813 Bowstring 51 25 31 7 2.4 2.4 55 6307 21 55 116 1.4 3.2 E
31-0826 Sand 22 31 7 10 2.8 2 53 7577 21 42 143 0.6 9.3 M / E
31-0726 Bello 10 20 3 5 3.2 2.9 58 152 20 65 2.6 2.9 1.3 M
31-0540 Clubhouse 10 30 2 10 4.5 2 52 858 17 42 16.3 0.6 16.5 O / M
31-0657 Jack the Horse 10 20 3 5 3.7 2.9 59 113 25 65 1.9 2.9 1.2 M
31-0334 Deer 15 28 5 9 2.9 2.2 55 1213 26 49 22.1 0.9 2.9 M
31-0183 Five Island 12 19 3 5 3.6 3.1 61 48 23 69 0.7 3.9 0.9 M
31-0524 Coon / Sandwick 15 20 6 5 3 2.9 67 96 21 70 1.4 4.1 0.57 M
Abbreviations: H – Hypereutrophic M – Mesotrophic --- No data E – Eutrophic O – Oligotrophic