South Fork Trinity River Supplemental Watershed...
61
South Fork Trinity River Supplemental Watershed Assessment
Transcript of South Fork Trinity River Supplemental Watershed...

South Fork Trinity RiverSupplemental
Watershed Assessment

i
South Fork Trinity River
Supplemental Watershed Assessment
Prepared by: The Watershed Research and Training Center
PO Box 356 Clinic Avenue Hayfork, CA 96041
Funded by:
California Department of Fish and Wildlife Fisheries Restoration Grant Program
FRGP Grant Number: P131 0304
Contributing authors: Joshua Smith, Cindy Buxton, Claudia Voigt and Marie Buell
The Watershed Research and Training Center
J. Eli Asarian-‐Riverbend Sciences, Weaverville, CA
Samantha Chilcote-‐Samantha Chilcote Consulting, Weaverville, CA
James Lee-‐James Lee Consulting, Weaverville, CA
June 30, 2016 Suggested Citation: Watershed Research and Training Center (WRTC). 2016. South Fork Trinity River Supplementary Watershed Assessment 2014-‐2016. Prepared by The Watershed Research and Training Center, Hayfork, CA for the California Department of Fish and Wildlife Fisheries Restoration Grant Program. 58p. + appendices.
ii
TABLE OF CONTENTS
Introduction ................................................................................................................................................................. 6
South Fork Trinity River Watershed Assessment – Project Overview ..................................................................... 6
Reporting Format – How to Use this Report ........................................................................................................... 6
Overview of the Watershed ........................................................................................................................................ 7
Location ................................................................................................................................................................... 7
Hydrology ................................................................................................................................................................ 9
Geology .................................................................................................................................................................... 9
Soils ........................................................................................................................................................................ 10
Vegetation ............................................................................................................................................................. 11
Climate ................................................................................................................................................................... 13
Fire ......................................................................................................................................................................... 13
Wildlife ................................................................................................................................................................... 14
Fisheries ................................................................................................................................................................. 15
Land Use ................................................................................................................................................................ 17
Population ............................................................................................................................................................. 19
History ................................................................................................................................................................... 20
Pertinent Attributes ................................................................................................................................................... 21
Water Quality ........................................................................................................................................................ 21
Temperature .......................................................................................................................................................... 21
Sediment ................................................................................................................................................................ 21
Past Studies and Projects ........................................................................................................................................... 22
Southern Oregon Northern California Coho Recovery Plan (SONCC) .................................................................... 22
PWA Action Plan .................................................................................................................................................... 22
Watershed Assessments ........................................................................................................................................ 22
Spring Chinook in the SFTR .................................................................................................................................... 23
California State Agencies ....................................................................................................................................... 23
Watershed Assessment Summary, Conclusions, and Discussion .............................................................................. 24
Water Conservation ............................................................................................................................................... 24
FRGP Task .......................................................................................................................................................... 24
Summary of Assessment .................................................................................................................................... 24
Data Gaps .......................................................................................................................................................... 29
Conclusions and Recommendations .................................................................................................................. 29
Stream Temperature Analysis ............................................................................................................................... 37
FRGP Task .......................................................................................................................................................... 37

iii
Summary ............................................................................................................................................................ 38
Data Gaps .......................................................................................................................................................... 38
Conclusions ........................................................................................................................................................ 39
Riparian Vegetation Assessment and Plan ............................................................................................................ 43
FRGP Task .......................................................................................................................................................... 43
Summary ............................................................................................................................................................ 43
Data Gaps .......................................................................................................................................................... 44
Conclusions ........................................................................................................................................................ 45
Other Considerations ......................................................................................................................................... 47
Fish Passage at Stream Diversion Assessment ...................................................................................................... 49
FRGP Task: ......................................................................................................................................................... 49
Summary ............................................................................................................................................................ 49
Data Gaps .......................................................................................................................................................... 50
Conclusions ........................................................................................................................................................ 50
Fish Passage at Stream Mouth Assessment ........................................................................................................... 51
FRGP Task: ......................................................................................................................................................... 51
Summary ............................................................................................................................................................ 51
Data Gaps .......................................................................................................................................................... 52
Conclusions ........................................................................................................................................................ 52
References ................................................................................................................................................................. 54
Appendixes: ............................................................................................................................................................... 60

iv
FIGURES
Figure 1: South Fork Trinity River Watershed and Major Subwatersheds. ................................................................. 8 Figure 2. Map of erosion potentials in the South Fork Trinity River Watershed. ...................................................... 10 Figure 3: Types of land ownership within the South Fork Trinity River watershed.Green shading indicates US Forest Service lands, pink indicates private timber lands, white/gray indicate private domestic and taupe indicate agricultural lands. ...................................................................................................................................................... 18 Figure 4: Estimated population per hydrologic unit code 7 (HUC 7) subwatershed. Methods for obtaining population numbers is detailed in Appendix 2. ......................................................................................................... 20 Figure 5: Trinity County Drought Impacts Map.Created by the Trinity County Resource Conservation District and the WRTC. .................................................................................................................................................................. 25 Figure 6: Total water use per subwatershed based on all potential anthropogenic diversion rates. ....................... 26 Figure 7. Estimated Water Use per HUC 7 Subwatershed. ........................................................................................ 28 Figure 8: Design from SHN Consulting Engineers & Geologists demonstrating that Ewing Dam was designed for an eventual 12-‐foot enlargement. ................................................................................................................................. 30 Figure 9: Potential Waterworks District expansion areas or altogether new water districts. ................................... 32 Figure 10. Comparison of NorWeST spatial stream network model predictions for mean August stream temperature in the South Fork Trinity River watershed for 1993-‐2013 and a future scenario based on global climate model ensemble averages that represents the A1B warming trajectory for 2080s (2070-‐2099). ............... 39 Figure 11: Map with all-‐year reach-‐level summary of Maximum Weekly Maximum Temperature (MWMT) within the South Fork Trinity River watershed. MWMT is the average daily temperature during the hottest seven-‐day period of the year. Mean reach MWMT values were calculated as the mean of all MWMTs across all years (1989-‐2015) and sites within a reach. Reaches are color-‐coded according to the MWMT salmonid suitability categories and labeled by stream name. .................................................................................................................................... 41 Figure 12: The Riparian Restoration Site Priorities in the Vicinity of Hayfork. The sites shown in this map are a subset of the full restoration site prioritization list for example purposes. .............................................................. 47 Figure 13. Beaver dam at Hayfork Creek ................................................................................................................... 48 Figure 14: Conceptual drawing of Madden Creek a. before handwork and b. after handwork. ............................... 53
TABLES
Table 1. U.S. Geologic Survey Hydrologic Unit Codes for the SFTR. ............................................................................ 7 Table 2. Plant species of concern in the SFTR watershed .......................................................................................... 11 Table 3. Plant species of concern in the SFTR Watershed that are endemic to serpentine soils .............................. 12 Table 4. Common wildlife present in the South Fork Trinity River Watershed. ........................................................ 14 Table 5. Federally listed threatened or endangered wildlife species known or suspected to occur in the SFTR. Data acquired and compiled from USFWS online Information for Planning and Conservation ........................................ 15 Table 6. Anadromous fish species present within the SFTR watershed.Data from CalFish.org (2016). .................... 16 Table 7. Resident fisheries present in the SFTR. ........................................................................................................ 17 Table 8: Selected Watershed Assessments Conducted in the South Fork Trinity River Watershed ......................... 23 Table 9: SONCC Action Item Steps to Improve Flow Timing or Volume.The following items we selected from Chapter 40 of the SONCC assessment. ...................................................................................................................... 24 Table 10: Potential New Water Districts by community/road, HUC 7 watershed, and anthropogenic water use. .. 33 Table 11. Subwatersheds suitable for forbearance, storage tanks, and trickle-‐fill systems. ..................................... 35 Table 12. Prioritization of Water Conservation Techniques ...................................................................................... 36

v
Table 13: The 50 riparian sites with highest restoration priority of 858 no cover sites in the SFTR watershed and associated prioritization metrics. .............................................................................................................................. 46 Table 14: Tributary mouths surveyed for fish passage. Restoration recommendations for each surveyed stream relative to the streamflow at the Hyampom gauge on the SFTR. Restoration recommendations were Not Necessary (NN), Not Applicable (NA), Not Sufficient (NS), or Restoration Priority (RP). ........................................... 52 Table 15: Tributary Mouths Surveyed. Restoration recommendations for each surveyed stream relative to the streamflow at the Hyampom gauge on the SFTR. Restoration recommendations were Not Necessary (NN), Not Applicable (NA), Not Sufficient (NS), or Restoration Priority (RP). ............................................................................ 52

6
INTRODUCTION
South Fork Trinity River Watershed Assessment – Project Overview
The Watershed Research and Training Center (WRTC) has received funding from the Fisheries Restoration Grant Program (FRGP) to conduct Watershed Evaluation, Assessment, and Planning on the South Fork Trinity River. This FRGP Grant (#P131 0304) was awarded on May 6, 2014 and is due May 31, 2016. This report is not an all-‐encompassing watershed assessment for the South Fork Trinity River Watershed, it is a gap analysis assessment that is focused on filling in some information gaps in previous watershed assessment documents such as the Action Plan for Restoration of the South Fork Trinity River Watershed and Its Fisheries prepared by Pacific Watershed Associates, numerous U.S. Forest Service Watershed Analyses, and the Southern Oregon and Northern California Coho Recovery Plan (SONCC) prepared by the National Marine Fisheries Service. The SONCC is the central guiding document for all analyses in this watershed assessment. The WRTC feels that the most pertinent information gaps in the SFTR watershed include water quantity and quality, riparian vegetation and specific fish passage and screening information thus these subjects will be the focal points of this watershed assessment. It should be noted that sediment is probably still the primary limiting factor for salmonids in the SFTR, but the WRTC chose not to address this topic in this assessment because it is significant enough an issue to warrant a standalone project. The WRTC has incorporated suggestions from SONCC that will provide analyses of the following: a water conservation program (improvements and education), stream temperature analysis, riparian vegetation assessment, and fish passage and screening assessments.
Reporting Format – How to Use this Report
This Watershed Assessment has been broken into multiple documents based upon individual topics for ease of use and sharing.
The main body of this report is the central document that provides a general overview of the South Fork Trinity River watershed, outlines the overall goals of the project, summarizes past studies, and the reviews major findings from each individual topic assessment. Each individual topic assessment has at least one appendix that includes the complete suite of analyses and data. The following is the general report layout:
• Watershed Assessment – Main Body of the project -‐ This Document • Appendix 1: Water Conservation Measures • Appendix 2: Stream Temperature Analysis • Appendix 3: Riparian Vegetation Assessment and Plan • Appendix 4: Fish Passage at Stream Diversion Assessment

7
• Appendix 5: Fish Passage at Stream Mouth Assessment We intend that this assessment will be used to identify and prioritize a suite of projects in the South Fork Trinity River Watershed that are essential to the recovery of its fisheries and overall watershed health.
OVERVIEW OF THE WATERSHED
Location
The South Fork Trinity River (SFTR) watershed is approximately 932 square miles (596,480 acres). It is the longest undammed, Wild and Scenic designated river remaining in California. The SFTR flows north for 90 miles from its headwaters in the Yolla Bolly Wilderness (elevation 7,800 feet above sea level (a.s.l.)) to its confluence with the Trinity River (elevation below 400 feet a.s.l.). West of the main stem SFTR, tributaries are short and of high gradient, originating on the unstable and steep slopes of South Fork Mountain. East of the main stem, the tributaries are longer, more stable and more complex, flowing through steep mountains and wide valleys. Hayfork Creek, the largest tributary (37% of SFTR watershed, 234,000 acres) flows north and then west to its confluence with the SFTR at the town of Hyampom. The US Geological Survey has assigned the SFTR a 4th level, or 8-‐digit hydrologic unit code (HUC) of 18010212. The SFTR is further divided into smaller 5th level, or 10-‐digit HUCs (Table 1).
Table 1. U.S. Geologic Survey Hydrologic Unit Codes for the SFTR.
Watershed Name HUC Level HUC Code South Fork Trinity River 4 18010212 Upper Hayfork Creek 5 1801021203 Lower Hayfork Creek 5 1801021204 Upper South Fork Trinity River 5 1801021201 Middle South Fork Trinity River 5 1801021202 Lower South Fork Trinity River 5 1801021205

8
Figure 1: South Fork Trinity River Watershed and Major Subwatersheds.

9
Hydrology
The hydrology of the SFTR is a winter rain driven system where the peak runoff occurs during the winter rainy season months. Elevations above 4,000 feet above sea level in the watershed experiences snowfall and rain on snow events have accounted for the majority of major floods on record. In the hot summer months (July-‐September), multiple tributaries to Hayfork Creek are known to go dry or sub-‐surface (Figure 5). The extent of streams that go dry has increased in the recent past (<10 years) due to a variety of factors including climate changes, ongoing drought, forest condition changes, and anthropogenic withdrawal. Gauging and flow information for the SFTR is very limited. The USGS has a gauging station located at Hyampom on the SFTR below the confluence with Hayfork Creek and has discharge records dating back to October 1965. Historically, the USGS gauged Big Creek (Hayfork Creel tributary) from 1961-‐1967 and Hayfork Creek from 1956-‐1965. Presently, extrapolating discharge from Hayfork Creek or other tributaries is difficult due to the large size of the watershed and various diversions and withdrawals. Limited gauging data has been collected from small monitoring projects within the watershed by the U.S. Forest Service (USFS), Trinity County Resource Conservation District (TCRCD), and the Watershed Research and Training Center (WRTC), however, these efforts have been short term or a one-‐time measure. Historic events of SFTR hydrology to note include: Late September 1964, the Hyampom gage recorded a 7-‐day mean flow of 25 cubic feet per second (CFS), the lowest in the record. Following this record low, a watershed altering flood in January 1965 was estimated at 88,000 CFS on basis of a USGS flood-‐routing study. During the 1965 flood, huge volumes of sediment filled pools and massively degraded the SFTR. More detailed analysis of hydrologic conditions can be found in Appendix 1: Water Conservation Measures.
Geology
The geology of the SFTR watershed is complex. As part of the Klamath Mountain Geologic province, the SFTR watershed contains two lithotectonic units called the Western Paleozoic and Triassic belt and the Western Jurassic belt (USFS 1994, URS 2000). The western slope of the SFTR is confined by South Fork Mountain, a straight ridge that runs north-‐south, consisting of faulted blocks of Cretaceous sediments and South Fork Mountain Schist which is highly erosive (Lanspa 1983). East of the river, the geology becomes a complex mosaic of meta-‐sediments, limestone, meta-‐volcanics, basltic intrustives, and granite intrusives (Lanspa 1984). The Hayfork watershed consists of predominately Rattlesnake and Hayfork Terranes. In general, the geology on the west side of the river are much more prone to erosion than the geology to the east of the river (Figure 2) thus the mainstem SFTR has much higher sediment loads than its main tributary Hayfork Creek.

10
Figure 2. Map of erosion potentials in the South Fork Trinity River Watershed. Department of Water Resources, 1979.
Soils
General soil types include soils that are shallow and on steep slopes. Some valley bottoms have colluvial and alluvial deposits (Lanspa 1983), such as:
• Typic Xerorthernts, Neuns family, Yolla Bolla family. Moderate to steep high elevation side slopes.

11
• Holland deep, Neuns-‐Hugo families. Gentle to steep unstable side slopes. • Rock outcrops. Moderate to very steep mountain side slopes. • Neuns-‐Deadwood-‐Marpa families. Topography is gentle to steep side slopes. • Rock outcrop-‐ lithic Xerumbrepts-‐stecum family. • Dubakella Weitchpec-‐Ishi-‐pishi families. Ishi-‐pishi depth to bedrock is 20-‐40 inches, 35-‐75% rock
fragments in soil.
Vegetation
Vegetation types in the South Fork Trinity River (SFTR) watershed include valley grassland, montane shrubland, scrub oak mixed chaparral, chamise chaparral, riparian woodland, subalpine, blue oak-‐digger pine, knobcone pine, Jeffrey pine, California black oak, Klamath mixed conifer, Douglas-‐fir, ponderosa pine, foxtail pine, gray pine, sugar pine, white fir, red fir, mountain hemlock, incense cedar and European annual grasslands habitats. These vegetation assemblage descriptions are based on the Society of American Forestry descriptions found in the Landfire existing vegetation type datasets. Conifers dominate a majority of the landscape and can be found mixed within hardwood forests.
A list of all woody plant species occurring in riparian areas in the SFTR watershed can be found in Appendix 3A.
Threatened, sensitive or at risk flowering plant species, which are currently managed/monitored in the SFTR watershed are included in Table 2. The additional California Native Plant Society listed species occurring within this basin are too numerous to list here:
Table 2. Plant species of concern in the SFTR watershed
Common Name Family Scientific Name Rarity List*
Klamath manzanita Ericaceae Arctostaphylos canescens var. sonomensis 1B.2
Shasta chaenactis Ericaceae Chaenactis suffrutescens 1B.3 clustered lady's slipper Orchidaceae Cypripedium fasciculatum 4.2 mountain lady slipper Orchidaceae Cypripedium montanum 4.2 Oregon fireweed Onagraceae Epilobium oreganum 1B.2 giant fawn lily Liliaceae Erythronium oregonum 2B.2 lemon colored fawn lily Liliaceae Erythronium citrinum ssp. citrinum 2B.2 Tracy eriastrum Polemoniaceae Eriastrum tracyi 3.2 California wild hollyhock Malvaceae Iliamna latibracteata 1B.2 Heckner's lewisia Montiaceae Lewisia cotyledon var. heckneri 1B.2 Yolla Bolly birdfoot treefoil Fabaceae Hosackia yollabolliensis 1B.2 South fork Mountain lupine Fabaceae Lupinus elmeri 1B.2 Canyon Creek stonecrop Crassulaceae Sedum paradisum 1B.2 checker lily Malvaceae Sidalcea oregana ssp. eximia 1B.2 Umpqua gentian Gentianaceae Frasera umpquaensis 2B.2
12
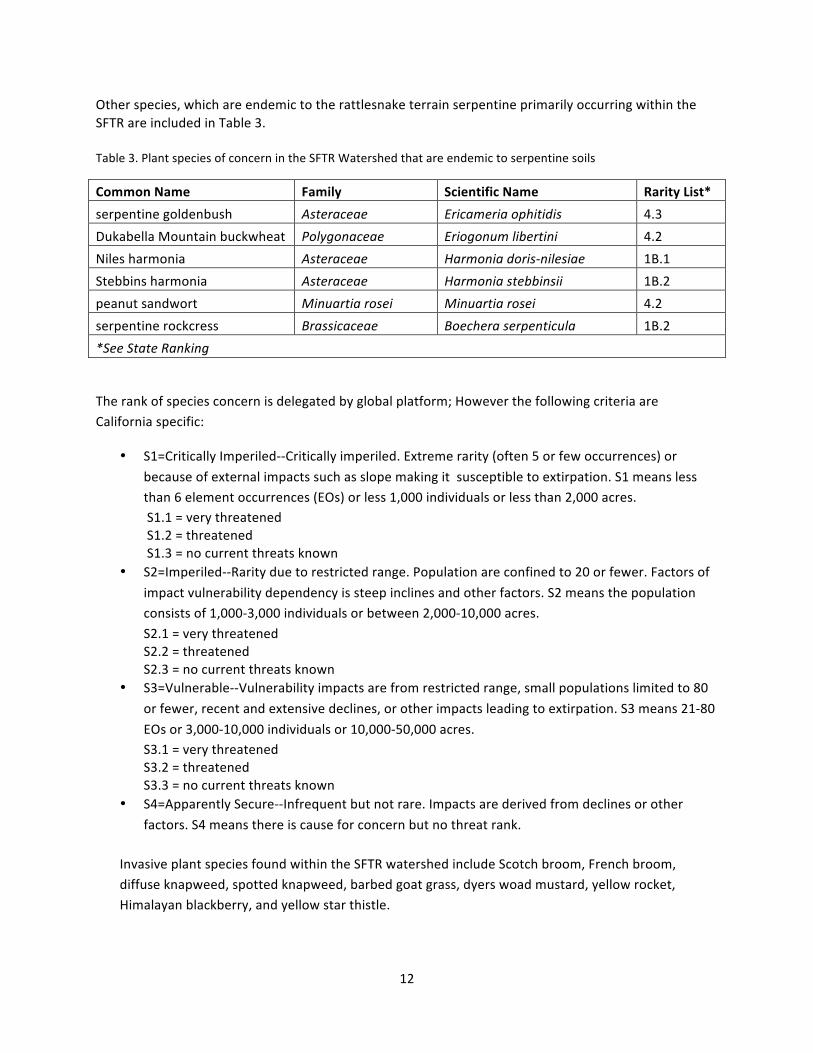
Other species, which are endemic to the rattlesnake terrain serpentine primarily occurring within the SFTR are included in Table 3.
Table 3. Plant species of concern in the SFTR Watershed that are endemic to serpentine soils
Common Name Family Scientific Name Rarity List* serpentine goldenbush Asteraceae Ericameria ophitidis 4.3 Dukabella Mountain buckwheat Polygonaceae Eriogonum libertini 4.2 Niles harmonia Asteraceae Harmonia doris-‐nilesiae 1B.1 Stebbins harmonia Asteraceae Harmonia stebbinsii 1B.2 peanut sandwort Minuartia rosei Minuartia rosei 4.2 serpentine rockcress Brassicaceae Boechera serpenticula 1B.2 *See State Ranking
The rank of species concern is delegated by global platform; However the following criteria are California specific:
• S1=Critically Imperiled-‐-‐Critically imperiled. Extreme rarity (often 5 or few occurrences) or because of external impacts such as slope making it susceptible to extirpation. S1 means less than 6 element occurrences (EOs) or less 1,000 individuals or less than 2,000 acres. S1.1 = very threatened S1.2 = threatened S1.3 = no current threats known
• S2=Imperiled-‐-‐Rarity due to restricted range. Population are confined to 20 or fewer. Factors of impact vulnerability dependency is steep inclines and other factors. S2 means the population consists of 1,000-‐3,000 individuals or between 2,000-‐10,000 acres. S2.1 = very threatened S2.2 = threatened S2.3 = no current threats known
• S3=Vulnerable-‐-‐Vulnerability impacts are from restricted range, small populations limited to 80 or fewer, recent and extensive declines, or other impacts leading to extirpation. S3 means 21-‐80 EOs or 3,000-‐10,000 individuals or 10,000-‐50,000 acres. S3.1 = very threatened S3.2 = threatened S3.3 = no current threats known
• S4=Apparently Secure-‐-‐Infrequent but not rare. Impacts are derived from declines or other factors. S4 means there is cause for concern but no threat rank.
Invasive plant species found within the SFTR watershed include Scotch broom, French broom, diffuse knapweed, spotted knapweed, barbed goat grass, dyers woad mustard, yellow rocket, Himalayan blackberry, and yellow star thistle.

13
Climate
Climate in the watershed is considered Mediterranean, with hot summer temperatures (100° days in summer months) and moderate winters (30° degree days) in the valleys. Precipitation varies greatly from 39 inches on the east side of the watershed to 78 inches on the west side, 80% of which occurs between November and March. The mountains can be snow covered from November to May (Lanspa 1983).
Fire
Fire is a significant ecological driver in the SFTR watershed. Prior to European settlement, frequent mixed and low intensity fires would occurred on 5 to 30 year return intervals across much of the landscape, with most caused by lightning (USFS 1999b). Native American burning for food, fiber and ceremonial purposes was also prevalent, occurring at specific sites across the landscape, sometimes as often as annually. Historically, indigenous peoples and lightning caused fires created diverse and resilient forest and woodland complexes across the watershed (PWA 1994, USFS 1994, URS 2000). Logging, fire suppression and grazing have had significant impacts on vegetative structure, thus affecting the frequency, spatial extent and effects of wildfire on SFTR ecological systems over the last several decades, including aquatic habitats and fisheries.
After highly effective fire suppression through much of the 20th century, large lightning complexes began escaping initial attack and expanding into long-‐burning widespread events beginning with the “Siege of ‘87”. Additional large lightning complexes have occurred in 2008, and 2015. Interestingly, the lightning complexes tend to be marked by fire severity patters within the historic range of variability (i.e. mostly low and moderate severity, with limited high-‐severity). However, researchers believe that their spatial extent generally exceeds historic trends, where fuels where limiting across the landscape due to widespread and frequent smaller fires burning every year. While a large fraction of these lightning fires are ecologically beneficial, they also include large patches of high-‐severity fire in already-‐impacted watersheds. Along with lightning caused fires, the SFTR watershed has also seen an increase in human-‐caused fires escaping initial attack. Most recently, the Sims (2004) and Stafford (2012) fires have burned at high severity over thousands of acres, contributing large pulses of sediment into critical salmon habitat.
High severity fire has always been a part of the fire regime in the SFTR watershed, including its contribution of spawning size sediments and large woody debris. However, increasing spatial extent and frequency of high severity fire is a primary threat to the SFTR fishery in the form of both large pulse and chronic sediment from both surface runoff and erosion from denuded hillsides, and associated with fire suppression activities (i.e. dozer lines, burnout operations, heavy road usage and degradation).
The loss of trees and riparian vegetation also contributes to the increased warming of instream water temperatures.
At the same time, wildfire is a natural and regenerative process in the watershed. Ash and sediment contribute key nutrients to the stream system, enriching macroinvertebrate populations. Fire-‐killed

14
trees become large wood that contributes to juvenile and adult salmonid habitat. And low and moderate severity fire reduces fuel loading, restoring structural diversity and resilience to overly-‐dense forests at scales and costs that could never be achieved through mechanical means. Finally, wildfire smoke in the heat of the summer helps to reduce solar heating and evapotranspiration, reducing stream temperatures and increasing summer base flows.
Thus, wildfire is both a threat and an asset in the SFTR watershed in relation to aquatic habitats and fisheries.
Wildlife
The SFTR watershed is home to many common wildlife species (Table 4Table 1). Over 300 species of birds utilize the area during migration, rearing, or are a year round presence.
Table 4. Common wildlife present in the South Fork Trinity River Watershed.
Common Name Scientific Name Black Bear Ursus americanus Columbian Blacktail Deer Odocoileus hemionus Ringtail or Miner’s Cat Bassariscus astutus Raccoon Procyon lotor Striped Skunk Mephitis mephitis Mountain Lion Felis concolor Bobcat Lynx rufus Coyote Canis latrans Gray Fox Urocyon cinereoargenteus River Otter Lutra canadensis Western Gray Squirrel Sciurus griseus Douglas Squirrel or Chickaree Tamiasciurus douglasi Northern Flying Squirrel Glaucomys sabrinus Chipmunks Eutamias spp. Golden Mantled Ground Squirrel Spermophilus lateralis Bushy Tailed Wood Rat Neotoma cinerea Marten Martes americana Black-‐tailed Jackrabbit Lepus californicus Bats Myotis spp. Wapiti or Elk Cervus elaphus Bald Eagle Haliaeetus leucocephalus Osprey Pandion haliaetus

15
Table 5. Federally listed threatened or endangered wildlife species known or suspected to occur in the SFTR. Data acquired and compiled from USFWS online Information for Planning and Conservation http://eco.fws.gov/ipac and various Shasta-‐Trinity National Forest Watershed Assessments.
Taxa Common Name Scientific Name ESA Status Amphibians and Reptiles
Northwestern pond turtle Clemmys marmorata marmorata R5S
Foothill yellow-‐legged frog Rana boylii R5S California Red-‐legged frog Rana draytonii Threatened Southern torrent salamander Rhyacotriton variegatus R5S Birds Marbled Murrelet Brachyramphus marmoratus Threatened Northern Spotted Owl Strix occidentalis caurina Threatened Western Snowy Plover Charadrius alexandrines nivosus Threatened Yellow-‐billed Cuckoo Coccyzus americanus Threatened Northern Goshawk Accipiter gentilis R5S Willow flycatcher Empidonax traillii R5S Mammals Fisher Mertes pennant Proposed
threatened Wolf Canis lupus Endangered Pallid bat Antrozous pallidus R5S Western Red Bat Lasiurus cinereus R5S American Martin Martes americana R5S California Wolverine Gulo gulo luteus R5S R5S= Region 5 Sensitive Species.
Fisheries
Anadromous fishes in the SFTR are Chinook salmon (spring and fall run), Coho salmon, and steelhead trout (summer and winter runs) (Table 6). Pacific lamprey also use the basin but abundance and life history is not well known. The California Water Boards have listed the SFTR for temperature impairment on the Section 303(d) List and sediment impairment for exceeded total maximum daily load (TMDL; US EPA 1998). Salmonid populations have been impacted by sediment loading, elevated temperatures, and migration barriers. Primary sources are these impacts are land management practices and water withdrawals. Activities such as mining, road construction, fire suppression, stream diversion, and timber harvest have modified streamflow and natural erosion processes and altered stream channels in the SFTR basin (USFS 1999).

16
Table 6. Anadromous fish species present within the SFTR watershed.Data from CalFish.org (2016). Common Name Scientific Name ESA Status
Steelhead Trout Oncorhynchus mykiss Not Warranted Chinook Salmon Oncorhynchus tshawytscha Not Warranted* Coho Salmon Oncorhynchus kisutch Threatened Pacific Lamprey Entosphenus tridentus Species of concern * indicates new information on ESA status. Little data exists, however the limited information indicates that steelhead (winter) run size is highly variable from year to year and the data gathered over the last 40 years in the Trinity basin shows the general trend that steelhead run sizes and natural production are diminishing (Garrison 2000).
National Marine Fisheries Service has determined that ESA listing of chinook salmon in the Upper Klamath and Trinity Rivers ESU was not warranted because the fall-‐run chinook populations are at relatively high abundances and generally stable. However, NMFS has substantial concern about the spring-‐run populations, which are at approximately 10% of their historical abundance (USFS 2000).
*At the time of writing this report, new unpublished genetic research from UC Davis Dan Prince and Michael Miller appears to contradict the NMFS determination as it proves there is a distinct genetic difference between spring and fall run chinook of the Upper Klamath and Trinity Rivers.
Coho salmon are historically present in the watershed and many of the tributaries have high “intrinsic potential”, 26% of the total river miles. Currently, coho salmon are at a high risk of extinction in the SFTR. Key limiting stresses are altered hydrologic function and impaired water quality. Key limiting threats are dams/diversions and roads (NMFS 2014).
Historically, Pacific lamprey were widely distributed. However, their populations have declined. Threats to Pacific lamprey include stream degradation, poor water quality, and climate change. Currently, the USFWS is developing a Pacific Lamprey Conservation Initiative to coordinate conservation efforts among state, tribal, and federal agencies. The goal of the initiative is to address threats, restore habitat, increase knowledge, and improve distribution and abundance of Pacific lamprey populations (CalFish 2016).
There are also resident fish populations in the SFTR (Table 7). The lower reaches of the SFTR are considerably warmer than the upper reaches, therefore, non-‐native warm water fish species present include sunfish, bluegill, and smallmouth bass. More detailed information on the Salmonids of the SFTR is present in Appendixes 4 and 5.
17
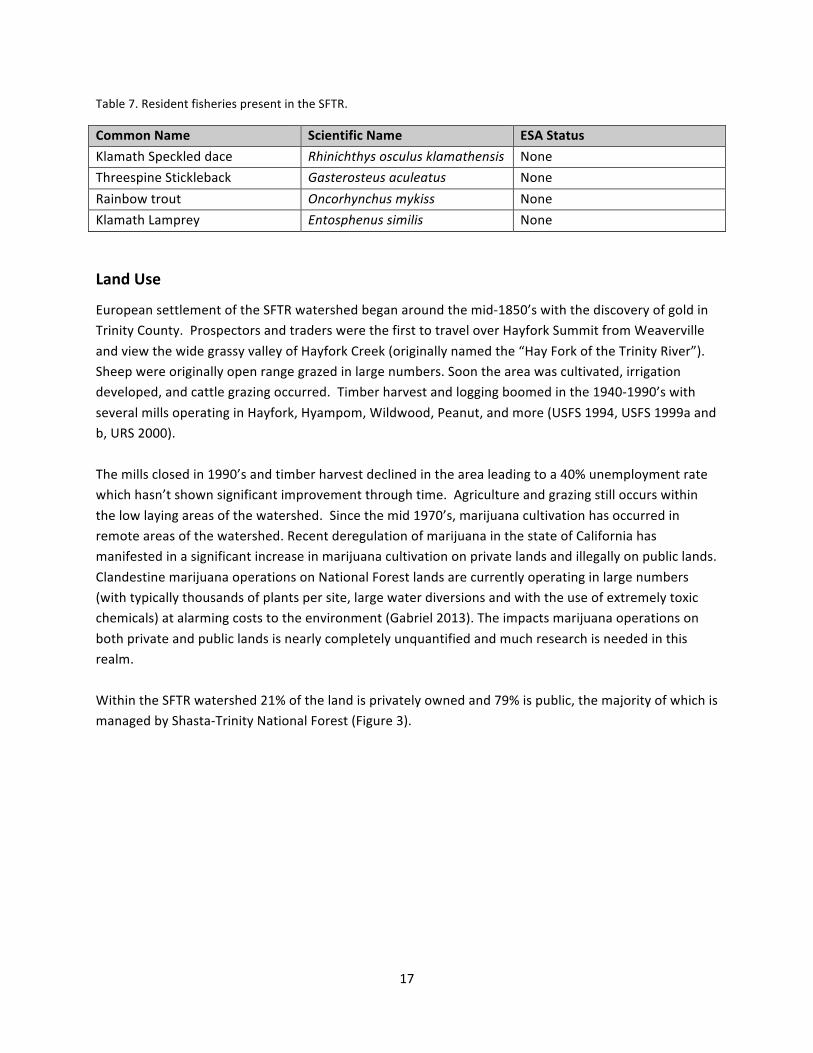
Table 7. Resident fisheries present in the SFTR.
Common Name Scientific Name ESA Status Klamath Speckled dace Rhinichthys osculus klamathensis None Threespine Stickleback Gasterosteus aculeatus None Rainbow trout Oncorhynchus mykiss None Klamath Lamprey Entosphenus similis None
Land Use
European settlement of the SFTR watershed began around the mid-‐1850’s with the discovery of gold in Trinity County. Prospectors and traders were the first to travel over Hayfork Summit from Weaverville and view the wide grassy valley of Hayfork Creek (originally named the “Hay Fork of the Trinity River”). Sheep were originally open range grazed in large numbers. Soon the area was cultivated, irrigation developed, and cattle grazing occurred. Timber harvest and logging boomed in the 1940-‐1990’s with several mills operating in Hayfork, Hyampom, Wildwood, Peanut, and more (USFS 1994, USFS 1999a and b, URS 2000). The mills closed in 1990’s and timber harvest declined in the area leading to a 40% unemployment rate which hasn’t shown significant improvement through time. Agriculture and grazing still occurs within the low laying areas of the watershed. Since the mid 1970’s, marijuana cultivation has occurred in remote areas of the watershed. Recent deregulation of marijuana in the state of California has manifested in a significant increase in marijuana cultivation on private lands and illegally on public lands. Clandestine marijuana operations on National Forest lands are currently operating in large numbers (with typically thousands of plants per site, large water diversions and with the use of extremely toxic chemicals) at alarming costs to the environment (Gabriel 2013). The impacts marijuana operations on both private and public lands is nearly completely unquantified and much research is needed in this realm. Within the SFTR watershed 21% of the land is privately owned and 79% is public, the majority of which is managed by Shasta-‐Trinity National Forest (Figure 3).

18
Figure 3: Types of land ownership within the South Fork Trinity River watershed.Green shading indicates US Forest Service lands, pink indicates private timber lands, white/gray indicate private domestic and taupe indicate agricultural lands.

19
Population
Located in the southwestern part of Trinity County, the SFTR watershed contains few towns and communities due to the rugged terrain. Figure 4 shows the population numbers per subwatershed, using the hydrologic unit code 7 (HUC7), which is breaking the subwatersheds into equally sized areas of approximately 7,000 acres. Hayfork, the largest town, has an approximate population of 2,500 and serves as the central area for business, commerce, education, and other services. The smaller towns of Wildwood, Forest Glen, Hyampom, and Peanut have a combined population of approximately 448 people (U.S. Census 2016).

20
Figure 4: Estimated population per hydrologic unit code 7 (HUC 7) subwatershed. Methods for obtaining population numbers is detailed in Appendix 2.
History
The Nor-‐Rel-‐Muk Wintu people have inhabited the area for over 5,000 years. They relied on the Chinook and steelhead fisheries (URS 2000).
In 1828 Jedediah Smith passed through the South Fork Trinity River on his way to the Pacific Ocean. In the mid 1800’s, during the gold rush years of California, settlers and prospectors from the east began to

21
inhabit the area, utilizing the rich natural resources and relatively flat lands. Placer, dragline and hardrock mining have occurred. Mining sites, lumber mills, and hay fields soon were developed around the growing town site of Hayfork. Cattle, sheep and horses grazed the lush fields and rolling hillsides. After the gold rush boom, the Hayfork Valley and other towns in the SFTR shrank as jobs were limited. In the mid-‐20th century, Hayfork and the SFTR watershed experienced a booming timber industry. Hayfork supported two large industrial mills and the surrounding areas a half dozen smaller mills. The mountainsides were covered with roads as loggers harvested large pine and fir trees. By the early 1980’s, the timber industry declined as environmental protections made timber harvest more prohibitive and costly on the remote lands of the SFTR watershed (URS 2000).
PERTINENT ATTRIBUTES
Water Quality
The South Fork Trinity River was 303 (d) listed as impaired from sediment and temperature in 1992 (EPA 1998). A TMDL for Sediment has been approved for the SFTR including Hayfork Creek (EPA 1998). No TMDL for temperature has been submitted for approval.
Temperature
Temperatures within the lower SFTR and lower Hayfork Creek have been measured as being too high to fully support aquatic habitat, mainly a salmonid/ trout fisheries. It is suggested that the high temperatures are a “result of natural conditions, water diversions, loss of riparian vegetation, and excess sedimentation that has resulted in channel widening and decreased water depths” (EPA 1998).
Permanent, long term temperature monitoring at specific sites has not occurred on the SFTR. In this assessment, we combine temperature data acquired from multiple agencies and organizations collected over the past 17 years. The assessment of this data is presented in Appendix 2: Stream Temperature Analysis of this report.
Sediment
Since the flood of 1965, the SFTR has suffered from high sediment loads. Majority of the sediment to the SFTR originates from west-‐side tributaries on South Fork Mountain (PWA 1994). Land use practices (logging and roads) and general unstable substrate combined leads to an elevated quantity of sediment loading to the river and its tributaries (PWA 1994). These elevated sediment loads exceed existing water quality standards and negatively impact the cold water fisheries habitat through eliminating deep pools of cold water refuge, reducing quality spawning gravels, and contributing to solar radiation of water (EPA 1998).
Other areas in the SFTR watershed which are not inherently unstable, have experienced significant erosion and sedimentation problems due largely to intensive land use activities. Major eastern tributaries which drain directly to the South Fork Trinity River, such as the East Fork of the South Fork,

22
Rattlesnake Creek and Butter Creek, have significant problems related to cumulative effects of intensive timber management over wide portions of the watersheds (PWA 1994).
Past placer mining in upper Hayfork Creek and the East Fork of Hayfork Creek has contributed to channel instability, broad, shallow channels, a lack of pools and poorly established riparian vegetation. Grazing has contributed to channel instability in Hayfork Valley, Salt Creek, Carr Creek and Barker Creek, and water drafting in Tule, Salt, Big and Hayfork Creeks has contributed to seasonal low flows and warming (PWA 1994).
PAST STUDIES AND PROJECTS
Southern Oregon Northern California Coho Recovery Plan (SONCC)
The SONCC Recovery Plan is the central guiding document for this Watershed Assessment. All action items listed are directly mandated in the National Marine Fisheries Service’s recovery plan.
PWA Action Plan
The Pacific Watershed Associates (PWA) Action Plan (1994) stated the ecological condition of the streams is negatively impacting salmonid populations within the SFTR watershed. The action plan is still the most comprehensive watershed assessment on the SFTR to date as it assessed sediment, temperature, alteration to stream and watershed morphology, and fisheries. It identified past land use practices that lead to the degradation of the SFTR and presented recommendations to improve water quality, temperatures, and fisheries habitat.
Watershed Assessments
USFS Shasta Trinity National Forest (STNF) has authored and contracted private consulting firms to write watershed assessments. Consulting firms contracted include URS Greiner Woodward Clyde (Oakland, CA) and Foster Wheeler Environmental Corporation (Clinton, NJ). The WRTC (Hayfork, CA) has authored watershed assessments for the STNF. The Six Rivers National Forest (SRNF) has authored watershed assessments, performed extensive monitoring studies on the lower SFTR including 1999-‐2008 long term monitoring of sediment transport in the SFTR, and documented the Lower SFTR Restoration History (Catalico 2011). The Trinity County Resource Conservation District (TCRCD) performed and authored a water quality monitoring project for the SFTR (2003).

23
Table 8: Selected Watershed Assessments Conducted in the South Fork Trinity River Watershed
Watershed Assessment Year Author Middle Hayfork and Salt Creek 2002 URS Hidden Valley Plummer Creek Rattlesnake Creek
2001 Foster Wheeler Environmental
Grouse Creek 1995 SRNF Lower Hayfork Creek 1996 STNF Butter Creek 1996 STNF East Fork and Smokey Creek 1998 STNF Upper SFTR Happy Camp Creek
1999 STNF
Lower SFTR 1999 SRNF Middle Hayfork Creek 1999 STNF Big Creek WRTC Miners Fire Recovery: Update to Lower Hayfork Creek Watershed Assessment
2011 WRTC
South Fork Trinity River Water Quality Monitoring Project
2003 TCRCD
Spring Chinook in the SFTR
A group of concerned scientists, land managers, and citizens combined their efforts to author a white paper assessment of Spring Chinook in the South Fork Trinity River (Chilcote et al. 2013). This white paper summarized the available literature on the SFTR and its tributaries in regards to Spring-‐run Chinook salmon. Recommendations for implementation of previously recommended management actions, future monitoring, and management responses to new threats land improvements were outlined as well as current data gaps were identified. This assessment found previous recommendations which are still relevant to reducing sedimentation are replacing undersized culverts, decommissioning roads, retaining riparian buffers, and implementing better logger practices. A comprehensive Spring Chinook monitoring program is needed to understand potential project benefits to different life history stages and habitat as well as project effectiveness. Lastly, potential management actions to the new threats of poaching, climate change, and water quantity/quality issues are suggested.
California State Agencies
The California Department of Fish and Wildlife has performed sediment sampling during 1988-‐1990 within the SFTR. The California Department of Water Resources Northern District authored a SFTR Watershed Erosion Investigation (1979) and a SFTR Salmonid Habitat Enhancement Study (1982).

24
WATERSHED ASSESSMENT SUMMARY, CONCLUSIONS, AND DISCUSSION
Water Conservation
FRGP Task Guided by the SONCC recommendations for the South Fork Trinity River, the WRTC has performed preliminary analyses towards fulfillment of action items to improve the timing and volume of flow within SFTR and its subwatersheds (Table 9).
Table 9: SONCC Action Item Steps to Improve Flow Timing or Volume.The following items we selected from Chapter 40 of the SONCC assessment.
SONCC section Action Item SONCC-‐SFTR.3.1.42.1 Increase storage capacity or delivery capability for Ewing Reservoir SONCC-‐SFTR.3.1.10.1 Assess agricultural lands and develop a plan for improving water delivery systems SONCC-‐SFTR.3.1.10.2 Improve water delivery systems, guided by the assessment SONCC-‐SFTR.3.1.7.1 Assess the utility of water storage tanks for private agricultural and domestic water uses
during periods of low flow SONCC-‐SFTR.3.1.7.2 Establish a forbearance program, using water storage tanks to decrease diversion during
periods of low flow SONCC-‐SFTR.3.1.47.1 Identify and cease unauthorized water diversions SONCC-‐SFTR.3.1.48.1 Assess cumulative effects (e.g., flow, water quality) of
marijuana cultivation SONCC-‐SFTR.3.1.3.1 Develop an educational program about water conservation programs and instream leasing
programs
Summary of Assessment The 2014 and 2015 droughts have resulted in numerous tributaries to the SFTR running dry in July-‐September, many of which are associated with human water withdrawals (Figure 5). To assess the impact of anthropogenic water diversions on streams in the SFTR watershed, the WRTC estimated the quantities of water diverted for domestic and marijuana uses and added these values to the legal diversions recorded at the SWRCB. Along with population data, these results were used to determine what type of water conservation measure would be applicable per subwatershed (see Appendix 1 for

25
the full Water Conservation Assessment).
Figure 5: Trinity County Drought Impacts Map.Created by the Trinity County Resource Conservation District and the WRTC.

26
Population: Major population centers and their associated HUC 7 watersheds (Figure 4): • Hayfork: Kingsburry Gulch-‐Kellog Gulch, Hayfork Valley, Lower Salt Creek-‐Hayfork Creek, and
portions of other nearby subwatersheds. • Post Mountain (Trinity Pines): Post Creek and Philpot Creek subwatersheds. • Hyampom: Hyampom Valley, Lower Hayfork Creek Canyon, Olsen Creek, Pelletreau Creek, and
Wintoon Flat-‐Deep Gulch subwatersheds. • Wildwood: Hall City Creek-‐Wilson Creek, Stringbean Creek-‐Goods Creek subwatersheds.
Diversion Types: The greatest diverter of water is the legal diversions, withdrawing 137 cfs of water throughout the SFTR watershed (Figure 6). The legal diversions typically are associated with agricultural uses such as irrigating pasture lands, irrigating crops (vineyards, orchards) and watering livestock. Not included in this estimate is the water diverted for the Hayfork Community Waterworks District. In this report “water district” is a term used to describe a regulated water utility such as a mutual water company, water association, water agency, or irrigation district. Marijuana gardens on private land were estimated at using 10 cfs throughout the SFTR watersheds. This estimate is most likely an underestimate as greenhouses and clandestine growing operations were not included in the calculations. Domestic water use estimates had the lowest rates of use at 0.5 cfs. This estimate does not include personal vegetable gardens or landscaping.
Figure 6: Total water use per subwatershed based on all potential anthropogenic diversion rates. Only subwatersheds with diversions greater than 0.1 cfs are included in this table.
Diversions by Subwatershed: Subwatersheds (HUC 7) with the greatest amounts of water diverted (>4 cfs) include Lower Big Creek-‐Hayfork Creek, Lower Hayfork Creek Canyon, Hyampom Valley, Kingsbury Gulch-‐Kellogg Gulch, Barker Creek, Lower Tule Creek, Upper East Fork Creek, Lower Salt Creek-‐Hayfork Creek, and Big Creek-‐ Hyampom (Figure 7). Subwatersheds with the greatest marijuana related
0 2 4 6 8 10
Lower Big Creek-‐Hayfork CreekLower Hayfork Creek Canyon
Hyampom ValleyKingsbury Gulch-‐Kellogg Gulch
Barker CreekPost Creek
Lower Tule CreekLower Salt Creek-‐Hayfork CreekUpper East Fork Hayfork Creek
Big Creek-‐HyampomHayfork Valley
Big Slide Creek-‐South Fork Trinity RiverCarr Creek
Upper Tule CreekRusch Creek
Summit CreekSilver Creek-‐South Fork Trinity River
Halls City Creek-‐Wilson CreekLittle Bear Wallow Creek-‐Hidden Valley
Duncan Gulch-‐Hayfork Creek
Cubic Feet per Second (cfs)
Marijuana
Domestic
Legal Diversion
192736

27
diversions (> 0.2 cfs) include Post Creek, Kingsbury Gulch-‐Kellogg Gulch, Carr Creek, Hyampom Valley, Duncan Creek, Barker Creek, Lower Salt Creek-‐Hayfork Creek, Dry-‐Mahala, Halls City Creek-‐Wilson Creek, and Hayfork Valley. Post Creek marijuana growers obtain their water from wells or truck delivery, thus the impact of marijuana cultivation related water diversions is spread throughout other subwatersheds, depending on where legally or illegally the water is obtained.

28
Figure 7. Estimated Water Use per HUC 7 Subwatershed.

29
Data Gaps Through the process of assessing the SFTR watershed water use, multiple data gaps were identified.
Ewing Reservoir was built to accommodate an increase in the dam height of 12 additional feet. To pursue increasing the storage capacity of the reservoir a feasibility study and safety analysis would need to be conducted, however the cost to perform these studies is exorbitant and beyond the fiscal capacity of the local waterworks. This limitation continues to impede serious contemplation of increasing the storage capacity of Ewing Reservoir.
The WRTC only recently learned of the Temporary Water Transaction forbearance tool. Unfortunately we have been unable to consolidate all of the necessary information necessary and have felt unprepared to have this discussion with water users in the SFTR watershed. We plan to continue to learn more about these programs and then develop partnerships with other agencies and landowners to provide progress towards keeping water in streams for instream benefits in the future.
A data gap identified during the study that would have been very beneficial in assessing water consumption is streamflow measurements. The only continuous discharge data is from a USGS gauge in Hyampom on the SFTR. The WRTC in coordination with the SWRCB has initiated a discharge monitoring program in 2016 on select streams to better assess the impacts of water diversions on flow.
Conclusions and Recommendations There are many ways to conserve water or make more water available to streams for salmonids. Increase storage or delivery capability of the Waterworks District: The Trinity County Waterworks District #1 (Waterworks District) utilizes an off channel reservoir and diverts water from Big Creek from November through February. Therefore, the existing Waterworks District’s water source and storage system is a very good system for fisheries and a large scale example of forbearance, because it takes and stores all of its 900 acre feet of water in winter and spring when streams have plentiful water and does not take a drop in mid-‐summer when the streams are vulnerable to take.
It should be noted that any recommendations on Waterworks District boundary expansion are derived from the WRTC watershed analysis and are not advocated for or against by the district board or staff.
Increase Storage Capacity of Ewing Reservoir: The SONCC coho recovery plan recommended increasing the storage capacity or delivery capability for Ewing Reservoir. The Ewing Dam was designed to accommodate an increase in height of about 12 feet (DWR 1965, Figure 8). Raising the reservoir by 12 feet would increase the reservoir surface area from 41 acres to 65 acres, triple the water holding capacity of the reservoir and even allow for increased recreation on the reservoir lake (Hair, Pers. Comm. 2015).While the cost of increasing Ewing Reservoir capacity would surely be too much to bear for the small community of Hayfork and the Waterworks District, it should be noted that increasing the storage capacity would be more of a fisheries restoration project than a water supply project. We believe that this project is worth looking into the full project because of its huge potential positive impact for fisheries.

30
Figure 8: Design from SHN Consulting Engineers & Geologists demonstrating that Ewing Dam was designed for an eventual 12-‐foot enlargement.
Utilizing Untreated and/or Reclaimed Water: If there are ways to make untreated and/or reclaimed water available for agriculture it could potentially further reduce demand on treated water and increase overall Waterworks District system efficiency thus benefiting salmonids of Hayfork Creek. A new untreated (raw) water line was created that has made large amounts of raw water available for irrigation purposes which makes more treated water available for Waterworks District users. There is potential for future expansion of untreated “raw water” from the new source line that was built in 2009 including industrial sites, agricultural sites, and a few unforeseen uses like wildfires. Further utilizing the raw water for irrigation purposes helps the Waterworks District meet peak summer water demands, and thus removing those irrigators from pulling water from the streams; effectively leaving more water in stream for salmonids.
Reclaimed wastewater can currently be utilized for compost creation, enhancing wetlands and/or riparian wildlife habitat, stream augmentation, recharging “non-‐potable” groundwater aquifers, surface irrigation of orchards and vineyards, non-‐food crop irrigation, and industrial cooling processes such as a biomass power plant. Currently the plant is running at 25% of capacity and is thus producing approximately 0.5 million gallons per day (0.9 CFS). Utilizing this water would allow for increases in industrial, irrigation use without taking water from streams.
Increasing Waterworks District Delivery Capacity through District Boundary Expansion:Expanding the delivery capacity of the Waterworks District to nearby neighborhoods would also benefit fisheries as it may eliminate illegal diversion from nearby creeks. From a practical perspective there are several areas that are too small to show up in this HUC 7 analysis but are still very worthy for potential future

31
expansions of the existing Waterworks District. The most practical areas to expand the Waterworks District boundary are the parcels of land directly adjacent to the existing system along major roads. Based on adjacency and estimated water usage per subwatershed, the priority areas for Waterworks District expansion are:
• Properties along Hyampom Road to the west and north. • Brady Road and North Vista Lane • Drinkwater Gulch and Doctor Lane • Tule Creek and McAlexander Roads • The Highway 3 corridor: Cedar Gulch Road, Big Creek Road, and Summit Creek Road.
The authors of this report believe that the Waterworks District should be allowed to provide the community that lives outside of the district boundaries with water because the actual result in the Waterworks District refusing to give water to outlying Hayfork Community is people illegally diverting water directly from streams which is a much worse negative impact.

32
Figure 9: Potential Waterworks District expansion areas or altogether new water districts.
Increasing Waterworks District Delivery Capacity by Creating Altogether New Water Districts: For those neighborhoods well outside of the Waterworks District boundaries, development of community based local water districts can be an option. The subwatersheds that may benefit from the development

33
of new local water districts (if utilizing off channel storage and forbearance systems) for current and/or future populations are listed inTable 10.
Table 10: Potential New Water Districts by community/road, HUC 7 watershed, and anthropogenic water use.
Community HUC 7 Subwatershed Population Anthropogenic Water Use (cfs)
Hyampom Hyampom Valley, Olsen Creek and Lower Hayfork Creek Canyon subwatersheds
440 0.541
Trinity Pines (Post Mountain)
Post Creek, and Upper Rattlesnake Creek subwatersheds
394 5.398
Highway 3 North Barker Creek, Carr Creek, Summit Creek, Duncan Creek, and Duncan Gulch-‐Hayfork Creek subwatersheds
577 1.679
Highway 3 South and 13 Dips Road
Lower Salt Creek-‐Hayfork, Philpot, and Salt Gulch Creek subwatersheds
250 0.519
Wildwood Stringbean-‐Goods and Halls City-‐Wilson Creek subwatersheds
159 0.311
McAlexander and Tule Creek Roads
Upper and Lower Tule Creek subwatersheds
110 0.064
Improve Water Delivery Systems on Agricultural Lands: Agriculture is the greatest user of water in the SFTR watershed and improvements in irrigation efficiency and water delivery could greatly benefit flow and fisheries in the tributaries. The SONCC recommended assessment of agricultural lands and improvements to water delivery systems. Numerous difficulties resulted in this task not being fully accomplished, however, NRCS is still happy to develop solutions to use water more efficiently and improve and sustain our working lands. The WRTC will continue to work with NRCS and directly with private landowners into the future to improve water efficiency on multiple ranches.
Improve Water Storage for Private Domestic and Agricultural Use: The SONCC recommended assessing the utility of water storage tanks for private agriculture and domestic water uses during periods of low flow along with establishing a forbearance program. Essentially, the more people we can help to utilize storage tanks, the better. Storage tanks not only help provide the streams with buffering of diversion impacts, but they also offer many practical benefits to landowners. We have conducted education workshops on storage tanks and provided multiple events to educate marijuana cultivators on water conservation and storage tanks and we will continue to develop several programs to expand the use of private domestic water storage tanks including outreach, education, grant applications, water storage regulation research, and discussions with landowners.
The WRTC is presently exploring larger agricultural off-‐channel pond storage locations and changes in agricultural practices (water use efficiency) for water conservation with several local ranchers.
In collaboration with the Five Counties Salmonid Conservation Program (5C) the WRTC has been awarded a grant to produce a pilot project that will provide incentives and assist citizens in selective

34
watersheds (i.e. Lower East Fork Hayfork Creek and subwatershed groups in the Forest Glen and Hidden Valley areas) with water tank installation, permitting, and technical assistance that can help keep water in streams to benefit coho salmon.
Establish a Forbearance Program: Forbearance refers to the practice of using stored water from an above-‐ground tank during the low flow season, as opposed to diverting water directly from a river or tributary.
Sanctuary Forest’s “Tanks and Forbearance” Program: The WRTC looked into the Sanctuary Forest’s Tanks and Forbearance program for guidance and reference. Unfortunately, the WRTC have concluded that the Sanctuary Forest program is not practical for the WRTC to administer in the SFTR watershed on the whole because it is too expensive, requires too much regulatory oversight and monitoring, and there are too many diverters in the SFTR watershed (Hayfork Valley in particular) to be feasible and economical. Still, Sanctuary Forest’s “Tanks and Forbearance” program could effectively be utilized within the SFTR in several key subwatersheds because areas with low human population density (less than 50 people per subwatershed) have the potential to maximize the investment and because all of that water saved would stay in the creek.
Five Counties’ “Trickle Fill” Forbearance: A simpler and less expensive system than Sanctuary Forest’s Tanks and Forbearance program for minimizing impacts to streams from water withdrawals is the 5 Counties Salmonid Conservation Program’s (5C) “Trickle Fill System”. This system essentially is designed to minimize the effect of high flow pumps on small streams. The WRTC and 5C have obtained a grant to implement these types of systems within subwatersheds of the SFTR and the Trinity River.
1707 Instream Water Right Dedication: Complimentary to Sanctuary Forest’s Tanks and Forbearance program is the use of 1707 instream dedications. This type of instream flow transaction involves dedicating existing water rights for instream use such as enhancement of fisheries habitat and stream flow. As a standalone technique, a 1707 instream dedication may not work in the SFTR area due to cumulative effects, however in combination with other instream flow transaction techniques it could be extremely effective. Partial dedications may be an option for some of the larger diverters.
Temporary Water Transactions: While 1707 dedications are a more permanent impact on a diverter’s water use, a Temporary Water Transaction is a forbearance agreement in which the water right holder may be financially compensated by a water trust, conservation organization, or agency for entering into a forbearance agreement. Streams that have the fewest number of diversions and low human population density, but have large amounts of water diverted have the greatest potential for water savings via temporary Water transaction forbearance. Streams within the study area that meet these criteria include: Lower Big Creek-‐Hayfork Creek, Hyampom Valley, Chanchelulla Gulch-‐Shiell Gulch, Lower Hayfork Creek Canyon, Lower Tule Creek, Lower Salt Creek-‐Hayfork Creek, Upper East Fork Hayfork Creek, Barker Creek, Carr Creek, Rusch Creek, and Big Creek-‐Hyampom.
The SONCC recommended developing educational programs about water conservation and instream leasing. The WRTC is active in developing and implementing community outreach programs directly presenting water conservation measures and options for domestic, marijuana, and agricultural uses.

35
These efforts have resulted in local growers contacting WRTC and other organizations to learn about and implement water conservation measures. While the numbers of participants is slowly increasing, it is hoped that the cumulative impacts from excessive diversions to the stream are reduced.
Table 11. Subwatersheds suitable for forbearance, storage tanks, and trickle-‐fill systems.
Area name Subwatershed Population Potential water savings (cfs)
Mainstem Upper SFTR
Bierce Creek-‐SFTR, Rough Gulch-‐Happy Camp Creek, Silver Creek, Cable Creek, Lower Rattlesnake Creek, Cave Creek-‐Swift Creek
53 2.63
Mainstem Middle SFTR
Little Bear Wallow Creek-‐Hidden Valley, Miller Springs, Lower Plummer Creek, McClellen-‐SFTR, Hitchcock Cr-‐Oak Flat
53 0.467
St John’s Road Wintoon Flat-‐Deep Gulch, Butter Creek Meadows 63 0.429
Corral Creek Lower Corral Creek, Middle Corral Creek, Upper Corral Creek
24 0.332
Mainstem Hayfork Cr near Wildwood
Chanchelulla Gulch-‐Shiell Gulch, Bridge Gulch-‐Hayfork Creek
12 0.039
East Fork Hayfork Creek
Lower and Upper EF Hayfork Creek 35 4.32
All subwatersheds would be improved by utilizing the following techniques:
• Unauthorized (illegal) Water Diversion Enforcement • Utilize Water Storage Tanks for Private Domestic and Agriculture • Improve Agricultural Water Delivery Systems (efficiency) • Instream Water Right Dedication • Tanks and Forbearance (including Five Counties’ Trickle Fill Forbearance)
The following techniques could be particularly useful in specific watersheds (Table 12):
• Develop New Water District • Develop Off Channel Pond Storage for Agriculture • Temporary Water Transaction • Waterworks District Boundary Expansion

36
Table 12. Prioritization of Water Conservation Techniques
Subwatershed Priority 1 Priority 2 Priority 3 Priority 4
Salt Creek (Lower Salt Creek-‐Hayfork Creek, Gulch-‐Salt Creek, and Upper Salt Creek-‐Hayfork Creek)
Develop New Water District
Develop Off-‐Channel Pond Storage for Agriculture
Waterworks District Boundary Expansion
Improve Agricultural Water Delivery Systems (efficiency)
Big Creek (Lower Big Creek-‐Hayfork Creek and Upper Big Creek-‐Hayfork Creek)
Instream Water Right Dedication
Temporary Water Transaction
Unauthorized (illegal) Water Diversion Enforcement
Improve Agricultural Water Delivery Systems (efficiency)
Tule Creek (Lower Tule and Upper Tule)
Instream Water Right Dedication
Develop off channel storage for ranches
Temporary Water Transaction
Improve Agricultural Water Delivery Systems (efficiency)
East Fork Hayfork Creek (Upper East Fork Hayfork and Lower East Fork Hayfork creeks)
Improve Agricultural Water Delivery Systems (efficiency)
Develop Off Channel Pond Storage for Agriculture
Temporary Water Transaction
Barker Creek Develop New Water District
Develop Off Channel Pond Storage for Agriculture
Unauthorized (illegal) Water Diversion Enforcement
Carr Creek (Carr Creek, Duncan Creek, and Summit Creek)
Develop New Water District
Develop Off Channel Pond Storage for Agriculture
Unauthorized (illegal) Water Diversion Enforcement
Hyampom Valley (Lower Hayfork Creek Canyon, Hyampom Valley and Wintoon Flat-‐Deep Gulch)
Develop New Water District
Develop Off Channel Pond Storage for Agriculture
Unauthorized (illegal) Water Diversion Enforcement
Improve Agricultural Water Delivery Systems (efficiency)
Olsen Creek Improve Agricultural Water Delivery Systems (efficiency)
Develop Off Channel Pond Storage for Agriculture
Tanks and Forbearance
Develop New Water District

37
Subwatershed Priority 1 Priority 2 Priority 3 Priority 4
Hayfork Valley (Hayfork Valley, Kingsbury Gulch-‐Kellogg Gulch, and Lower Salt Creek-‐Hayfork Creek)
Waterworks District Boundary Expansion
Improve Agricultural Water Delivery Systems (efficiency)
Develop Off Channel Pond Storage for Agriculture
Rattlesnake Creek (Post Creek, Upper Rattlesnake Creek)
Develop New Water District
Unauthorized (illegal) Water Diversion Enforcement
Utilize Water Storage Tanks for Private Domestic and Agriculture
Butter Creek (Butter Creek Meadows and Upper Indian Valley Creek)
Tanks and Forbearance
Develop Off Channel Pond Storage for Agriculture
Utilize Water Storage Tanks for Private Domestic and Agriculture
Chanchelula Gulch-‐Shiel Gulch
Instream Water Right Dedication
Improve Agricultural Water Delivery Systems (efficiency)
Develop Off Channel Pond Storage for Agriculture
Hayfork Creek near Wildwood (Stringbean Creek-‐Good Creek and Halls City Creek-‐Wilson Creek)
Instream Water Right Dedication
Temporary Water Transaction
Unauthorized (illegal) Water Diversion Enforcement
Improve Agricultural Water Delivery Systems (efficiency)
Stream Temperature Analysis
FRGP Task SONCC-‐SFTR.10.3.13.1: “Identify and prioritize cold water refugia areas currently or potentially supporting coho salmon and develop a plan to improve regulatory oversight.” (SONCC 2012)
WRTC FRGP Deliverables: • Analyze 24 years of stream temperature data collected by United States Forest Service and
Watershed Research and Training Center • Develop an analytical framework to correlate various temperature data such as thermal max,
seven-‐day-‐max and temperature refugia. • Use tasks completed in Stream Temperature Analysis in developing priority list of streams for
restoring thermal refugia for coho.

38
Summary Water temperature has long been identified as primary factor limiting production of salmon and steelhead in the South Fork Trinity River (SFTR) watershed. There have been some previous analyses evaluating temperature data for the SFTR watershed, but this project is by far the most comprehensive. The goal of this study is to 1) acquire, compile, and quality check all available water temperature data for the SFTR watershed, 2) calculate summary metrics for each site and year, 3) rate water temperature conditions according to suitability for coho salmon and steelhead trout, and 4) create tables and maps summarizing results. The results of this analysis will be used to develop of future projects to restore aquatic habitat and watersheds within the SFTR.
The compiled dataset spans the years 1989 through 2015. There are a total of 309 sites, 166 reaches, and 1840 unique site-‐year combinations. Data contributors include the U.S. Forest Service, Humboldt State University's Forest Science Project, The Watershed Research and Training Center, Green Diamond Resource Company, US Fish and Wildlife Service, California Department of Fish and Wildlife, Timber Products Corporation, and Graham Matthews and Associates.
See Appendix 2 for full Stream Temperature Analysis.
Data Gaps A review of data gaps recommends the following additional stream temperature data collection sites: 1. Lower SFTR subwatershed: Big Creek, Mill Creek, and Kerlin Creek near Hyampom. 2. Middle SFTR subwatershed: Little Rattlesnake, Jims, Glade, and an unnamed tributary to Rattlesnake
creeks 3. Upper SFTR subwatershed: Red Mountain, Happy Camp, Bierce creeks, an unnamed tributary
(between Smoky and Red Mountain Creek), andthe SFTR below its confluence with East Fork SFTR. 4. Lower Hayfork Creek subwatershed: West Fork Miners, Grassy Flat, and an unnamed tributary to
Bear creeks. 5. Middle Hayfork Creek subwatershed: West Fork Tule Creek, Kingsbury Gulch, and North Fork Philpot
Creek, Salt Creek headwaters, and lower Ditch Gulch. 6. Upper Hayfork Creek subwatershed: headwaters of Hayfork Creek and headwaters of East Fork
Hayfork Creek.
Stream Temperature Model’s Inaccurate Results: The U.S. Forest Service’s Rocky Mountain Research Lab’s (RMRL) NorWeST project completed a spatial stream network temperature model for Northwest California in 2015. Model scenarios included current conditions (1993-‐2013) as well as several climate change scenarios. The model results indicate that climate change will warm streams in the South Fork Trinity River watershed and reduce the area of coldwater refuge (Figure 10).
The NorWeST model appears to substantially underestimate temperatures in Hayfork Creek within the Hayfork Valley and therefore does not reproduce the complex longitudinal (i.e., upstream to downstream) pattern of temperatures within Hayfork Creek, where temperatures are cooler within the Hayfork Creek Canyon. The likely reasons for this are that the model does not account for water diversions, and the stream temperature data used for model calibration within the South Fork Trinity River watershed were almost solely from the USFS, which does not have any sites within Hayfork Valley.

39
Even without accounting for water diversions, if the model inputs had included temperature data from sites within Hayfork Valley, then the accuracy of predicted temperatures within the Hayfork Valley would likely have been improved due to the model’s unique feature of explicitly incorporating spatial auto-‐correlation.
The RMRL should re-‐run the NorWeST model in fall 2016 using a more complete dataset of stream temperature data for calibration, which should remedy the underestimation of temperatures in Hayfork Valley and provide a more accurate model overall.
Figure 10. Comparison of NorWeST spatial stream network model predictions for mean August stream temperature in the South Fork Trinity River watershed for 1993-‐2013 and a future scenario based on global climate model ensemble averages that represents the A1B warming trajectory for 2080s (2070-‐2099).
Conclusions Seasonal Patterns: Stream temperatures in the SFTR watershed typically peak in July or August. Averaged across all years and sites, the peak occurs in late July. On average, July is slightly warmer than August but much warmer than June. There is considerable year-‐to-‐year (and to a lesser extent, site-‐to-‐site) variation in the date that peak temperatures occur. MWMT temperatures occurred earlier in 2015 than in any other year.
Spatial Patterns: MWMT temperature is strongly correlated with drainage area, and most streams show the expected pattern of warming as water flows downstream from cold, well-‐shaded headwaters into wider alluvial channels which are more exposed to solar radiation (Figure 11). One exception is Hayfork
1993 -‐2011 2080’s A1B Prediction

40
Creek, which exhibits a more complex pattern where temperatures are highest in the creek’s middle reaches within the Hayfork Valley where riparian canopy is poor and streamflow is depleted due to water diversions. Temperatures are then cooler within the lower Hayfork Creek Canyon, likely due to topographic shade, lack of stream diversions and inflow from cooler tributaries. Hayfork Creek then warms again as it flows through Hyampom Valley before reaching its confluence with the South Fork Trinity River. MWMT temperatures <18 °C and <20 °C occur primarily at sites with drainage areas less than 100 km2. Listed by watershed, sites with abnormally cold water relative to the drainage area include:
- Lower Hayfork Creek subwatershed: Miners Creek (sites “miners1_H2O_Temp”, “Miners_H2O_temp”, and “6001”) and Bear Creek (“Bear_H2O_temp”)
- Middle Hayfork Creek subwatershed: Little Creek (site “Little_H2O_temp”), upper Barker Creek (site “Barker_062_H2O_Temp”), and upper Big Creek (sites “Big Cr at 324 Br”, “Big_H2O_temp”, and “7016”)
- Upper Hayfork Creek subwatershed: Goods Creek (site “GoodsCreek_H2O_Temp”) - Lower SFTR subwatershed: Madden Creek (sites “MADBRG_H2O_temp” and “Madden Cr at Br”), - Middle SFTR subwatershed: lower Butter Creek (sites “Lower_Butter_H20_temp” and
“ButterCr_at_McCaslin_H2O_Temp”), - Upper SFTR subwatershed: Cable Creek (“TCB1”) and Prospect Creek (“ProspectCr_H20_Temp”)

41
Figure 11: Map with all-‐year reach-‐level summary of Maximum Weekly Maximum Temperature (MWMT) within the South Fork Trinity River watershed. MWMT is the average daily temperature during the hottest seven-‐day period of the year. Mean reach MWMT values were calculated as the mean of all MWMTs across all years (1989-‐2015) and sites within a reach. Reaches are color-‐coded according to the MWMT salmonid suitability categories and labeled by stream name.Stream Temperature Results by Subwatershed (Figure 1):

42
LOWER SOUTH FORK TRINITY RIVER: Within the Lower SFTR subwatershed, temperature data are available for reaches of five tributaries (Madden/Old Campbell, Grouse, Underwood, Eltapom, and Pelletreau) accessible to anadromous fish, plus the mainstem SFTR. For sites with intrinsic potential for juvenile coho salmon, MWMT temperatures were likely suitable (16-‐18 °C) or possibly suitable (18-‐20 °C) for coho salmon within Madden/Old Campbell in all years, Eltapom Creek in nearly all years, Pelletreau Creek in a majority of years, but never in Grouse Creek or the SFTR. Of those four sites, only Madden/Old Campbell and Eltapom Creek have documented coho salmon presence in the past few decades, although coho salmon were observed in Pelletreau Creek in 1951 (Garwood 2012). MWMT temperatures were possibly suitable (18-‐20 °C) for coho salmon in Underwood Creek, but the stream is steep and lacks intrinsic potential.
MIDDLE SOUTH FORK TRINITY RIVER: Within the Middle SFTR subwatershed, temperature data are available for six tributaries (Butter, Plummer, Cave, Glen, Rattlesnake, and Post [tributary to Rattlesnake]) that are accessible to anadromous fish, plus the mainstem SFTR. The mainstem SFTR warms as it flows downstream and has consistently higher temperatures than its tributaries within the Middle SFTR subwatershed. The multiple sites on Rattlesnake Creek show substantial warming between upstream and downstream sites. MWMT temperatures were likely suitable (16-‐18 °C) in all years measured in Glen and Cave Creeks, but Cave Creek was not monitored in any of the five warmest years. Lower Post Creek shows exceptional inter-‐annual variability, with a 7 °C range, which does not appear to be due to inter-‐site differences because the two sites near its mouth are essentially the same location. MWMT at Plummer Creek is above 20 °C in most years.
UPPER SOUTH FORK TRINITY RIVER: Within the Upper SFTR subwatershed, temperature data are available for reaches of nine tributaries (Farley Creek, Cable Creek, Silver Creek, Smoky Creek, East Fork SFTR, Shell Mountain Creek, and un-‐named tributary at the headwaters of the SFTR, Prospect Creek [tributary to East Fork], and Dark Canyon Creek [tributary to East Fork]) that are accessible to anadromous fish, plus the mainstem SFTR. The mainstem SFTR warms as it flows downstream and its lower reaches have consistently higher temperatures than its tributaries within the Upper SFTR subwatershed, with the exception of Shell Mountain Creek. MWMT temperatures were all less than 20 °C in the Upper SFTR subwatershed for all sites in all years except the mainstem SFTR and Shell Mountain Creek.
LOWER HAYFORK CREEK: Within the Lower Hayfork Creek subwatershed, temperature data are available for reaches of six tributaries (Olsen, Corral [aka Corral Bottoms], Miners, Bear, Rusch, and Little Creeks) that are accessible to anadromous fish, plus the mainstem Hayfork Creek. The intrinsic potential for juvenile coho habitat is highest in Olsen Creek, intermediate in Little Creek, Rusch Creek, Bear Creek and Miners Creek, and lowest in Corral Creek. Little Creek had very low temperatures, where MWMT ranged from 15.5 to 16.1 °C in three years of monitoring which included two warm years and one cool year. MWMT temperatures were likely suitable (16-‐18 °C) for coho salmon within Bear Creek and Miners Creek in most years monitored, but there are no data for Miners Creek in the warmest years. MWMT temperatures in Corral and Olsen Creek, which are the only streams within the Lower Hayfork Creek subwatershed where coho salmon presence has been documented (Garwood 2012), were above 18 °C

43
except in the coolest years, exceeded possibly suitable (18-‐20 °C) in some warm years, and were not monitored during the warmest years (Figure 38, Figure 39 & Figure 40, Appendix 2).
MIDDLE HAYFORK CREEK: Within the Middle Hayfork Creek subwatershed, temperature data are available for reaches of seven tributaries (Tule, Salt, Big, Barker, Carr, Summit (tributary to Carr), and Philpot [trib to Salt]) that are accessible to anadromous fish, plus the mainstem Hayfork Creek. Upper Barker Creek had by far the lowest MWMT temperatures of any site accessible to anadromous fish (14.6 °C in both 2001 and 2002, which were both moderate years) in the watershed. The next coolest site was upper Big Creek, where MWMT temperatures did not exceed the upper limit for possibly suitable for coho salmon (20°C), but still exceeded the likely suitable limit (16-‐18 °C). Big Creek warms substantially (approximately 4 °C) between its upper and lower reaches, likely due in part to large quantities of water being diverted from the creek for agricultural irrigation and municipal water supplies. Other relative cool reaches included the uppermost reaches of Salt Creek and Philpot Creek.
UPPER HAYFORK CREEK: Within the Upper Hayfork Creek subwatershed, temperature data are available for reaches of ten tributaries (Bridge Gulch, East Fork Hayfork Creek, Potato Creek [tributary to East Fork Hayfork Creek], North Fork East Fork Hayfork Creek, Shiell Gulch, Wilson Creek, Hall City Creek, Goods Creek, Dubakella Creek, and West Fork Hayfork Creek) that are accessible to anadromous fish, plus the mainstem Hayfork Creek (Figure 44 & Figure 45, Appendix 2). Streams with temperatures not exceeding 18.0 °C include Wilson Creek, Hall City Creek, Goods Creek, Bridge Gulch, and West Fork Hayfork Creek (does not have a GNIS name, but is COMID 8235048), although some of those sites were not monitored in the warmest years. MWMT temperatures in Potato Creek were less than 18 in a few years, but typically ranged from 18-‐21 °C. Hayfork Creek warmed between its headwaters and Arnold Bridge, the most downstream site within the Upper Hayfork Creek subwatershed. Temperatures were generally lower in the East Fork of Hayfork Creek than in the mainstem of Hayfork Creek.
Riparian Vegetation Assessment and Plan
FRGP Task The following are recommendations for riparian management derived from the NMFS coho recovery plan: Developing appropriate silvicultural prescriptions for benefits to coho salmon habitat to “reduce water temperature and increase dissolved oxygen” (SFTR 10.1.11): Increase conifer riparian vegetation by determining appropriate silvicultural prescription for benefits to coho salmon habitat. Thinning, or releasing conifers, guided by prescription. Planting conifers, guided by prescription (NMFS 2012).
Planting vegetation in riparian areas to “reduce delivery of sediment” (SFTR 8.1.19) to streams and plant vegetation to stabilize stream bank (NMFS 2012).
Summary Visiting reference sites and assessing past riparian projects helped up us to develop a set of methods to prioritize which planting sites in the SFTR watershed would be most appropriate and practical to decrease stream temperatures. The methods included a “cover, no-‐cover” analysis of the whole

44
watershed to determine the riparian areas with little or no riparian vegetation, the coho habitat intrinsic potential modeling, a solar insolation model to determine ranges of average annual solar radiation at each site, and an evaluation of appropriate plant species. Last, we field verified model results in 10 randomly chosen and 10 known sites in need of restoration.
The main products created in this Riparian Assessment are:
• Evaluation of existing species composition o Surveyed and evaluated past revegetation projects to determine which species mix is most
appropriate and successful in producing shade and stabilizing stream banks. Product = Past Revegetation Projects
o Literature review and development of a table that lists appropriate plant species and their traits. Product = Evaluation of Appropriate Plant Species table Appendix 3A
o The evaluation resulted in the identification of the most suitable species for restoring riparian vegetation in 20 ground-‐truthed sites (see Field Verification Sites Visited)
• A suite of GIS models that assessed solar radiation potential which will help us determine the areas
where planting will be most effective for shade production (Solar Insolation Model). • An open future task is the evaluation of hydrologic conditions to determine viability of specific sites
in terms of streambank stabilization and elevations for maximum plant survival. This evaluation will be added to the GIS modeling to refine the prioritizing of future planting sites.
• Assessment of 20 priority coho streams for riparian vegetation. o The evaluation resulted in the identification of suitable species for restoring riparian vegetation in
20 ground-‐truthed sites and a preliminary site design. Product = Field Verification Sites Visited and Assessed and Preliminary Planting Design.
See Appendix 3 for full Riparian Vegetation Assessment.
Data Gaps 1. When creating the “cover, no-‐cover” polygons, we did not assess any streams that did not contain anadromous fish; we stopped analyzing above any point of anadromy. This may not have been the best option because there are numerous non-‐anadromous tributaries (for example Indian Valley and Cold Camp creeks) where planting riparian vegetation could contribute to large potential reductions in stream temperature in very high quality anadromous streams like Butter Creek. Essentially, even though these streams are not utilized by anadromous fish, we could still help reduce stream temperatures in downstream fish bearing streams through riparian planting projects there.
2. Due to the decision to map the 100m riparian buffer for “cover, no-‐cover”, a major inaccuracy in our modeling is that some areas listed as priority restoration sites actually do have good vegetative shading because the area mapped is located in the exterior of the riparian vegetation. Sometimes it was difficult to see the extent and quality of immediately adjacent riparian vegetation. See the Field Verification Sites Visited section for multiple examples of this inaccuracy.

45
3. When creating the Solar Insolation Model the “whole year” was specified for the time configuration. It might have been more appropriate to use July and August values instead as the critical stream temperatures occur during that timeframe. The winter months could potentially be skewing the data, overestimating the effect of topographic shading.
4. We were not able to thoroughly analyze the locations of major mining efforts within the SFTR watershed. We did not find any quality obtainable data on mining locations and we did not have the resources to map the locations ourselves in this analysis. In looking for degraded riparian sites it would be likely that mining areas would be the most degraded of all. While many of these mined sites did rise to the surface of the analysis, using the mining areas as a component of the prioritization could have been useful.
5. An open future task is the evaluation of hydrologic conditions to determine viability of specific sites in terms of streambank stabilization and groundwater level for maximum plant survival. We anticipate conducting this as is needed while creating final design plans and/or conducting restoration planting.
6. Missing groundwater connection to streams in the Hayfork Valley may be a major limiting factor in the current riparian vegetation condition. There is evidence that Hayfork Creek has incised significantly and because of local geology this has reduced the ability of surface water to connect with and recharge shallow groundwater aquifers and ultimately limits the area in which plants can establish and grow. Groundwater connections to stream temperature and riparian vegetation should be investigated further.
7. The WRTC has recently acquired a new aerial photograph set that has a much higher resolution (as small as 6 inch pixels in some cases) and we anticipate further refining the prioritized sites with this photo set.
Conclusions Utilizing the metrics listed in the section of this document we created a table of the top 50 riparian revegetation sites (Table 13). These sites are the hottest and most degraded sites that we believe have the ability to moderate stream temperatures in the SFTR if revegetated. Stream temperature was measured at 9 of the 50 sites, 8 of which were within the second highest of the six temperature classes (20-‐23°C, see Appendix 2 of this report "Stream Temperatures in the SFTR"). A detailed description of the site with priority 18 (Barker Cr: Cr Crossing) can be found below (Field Verification Sites Visited).

46
Table 13: The 50 riparian sites with highest restoration priority of 858 no cover sites in the SFTR watershed and associated prioritization metrics.
Planting Priority
Size (acre
s) SiteName Coho IP
Rating
Solar Rating
IP x Solar
CO IP CURV
Mean Solar Value (Watt hours/ meter2)
Latitude Longitude
1 4.5 Hayfork Cr upstream of
Goods Creek 1 3 6 18 0.89 805130 -123.066 40.3875
2 0.9 Little Barker Creek 3 6 18 0.69 803056 -123.109 40.5951 3 0.5 Hayfork Cr/ Wildwood 1 3 6 18 0.93 796205 -123.054 40.4183 4 0.4 Hayfork Cr/ Wildwood 2 3 6 18 0.75 796205 -123.052 40.4191 5 0.5 Hayfork Cr/ Wildwood 3 3 6 18 0.75 796205 -123.052 40.4199
6 11.7 Hayfork Cr upstream of
Goods Creek 2 3 6 18 0.89 795066 -123.065 40.3861
7 1.3 Hayfork Cr/ Wildwood 4 3 6 18 0.93 794510 -123.055 40.4155 8 1.2 Hayfork Cr: Wilson Creek 3 6 18 0.93 794385 -123.056 40.4144 9 4.4 Bridge at Barker Creek 3 6 18 0.87 792780 -123.114 40.5835
10 20.1 Barker North Meadow 1 3 6 18 0.87 792780 -123.115 40.5832 11 1.4 Barker Valley 1 3 6 18 0.84 792780 -123.115 40.5858 12 5.6 Barker Valley 2 3 6 18 0.81 792780 -123.115 40.5887 13 0.7 Barker North Meadow 2 3 6 18 0.80 792780 -123.117 40.5896 14 0.8 Duncan Gulch 1 3 6 18 0.97 792033 -123.141 40.5748 15 0.8 Salt Creek: 13 Dips 3 6 18 0.95 791963 -123.152 40.4510 16 12.0 Hayfork Cr: Canon Ball 3 6 18 0.93 791624 -123.058 40.4139 17 1.7 Duncan Gulch 2 3 6 18 0.81 790540 -123.133 40.5794 18 8.6 Barker Cr: Cr Crossing 3 6 18 0.89 790073 -123.112 40.5768 19 8.9 Barker Cr: Little Barker Cr 3 6 18 0.75 789921 -123.115 40.5941 20 13.6 Slat Cr x Ditch Gulch 1 3 6 18 0.95 789832 -123.154 40.4507
21 0.8 Barker Cr: Sunshine
Meadow Way 3 6 18 0.82 789294 -123.114 40.5935
22 4.5 Barker South Meadow 3 6 18 0.81 789221 -123.113 40.5753 23 1.0 Duncan Gulch 3 3 6 18 1.00 789091 -123.142 40.5735 24 2.5 East Fork Hayfork Cr 1 3 6 18 0.76 788817 -123.025 40.5002 25 2.7 East Fork Hayfork Cr 2 3 6 18 0.94 788817 -123.026 40.5013 26 3.5 Old Cold Creek Road 1 3 6 18 0.89 788256 -123.066 40.3859
27 6.9 East Fork Hayfork Cr: Rose
Gulch 3 5 15 0.87 788088 -123.021 40.5006
28 0.3 Hayfork Cr/ Wildwood 5 3 5 15 0.93 787898 -123.059 40.4091 29 1.0 Hayfork Cr/ Wildwood 6 3 5 15 0.93 787898 -123.059 40.4096 30 1.0 Hayfork Cr/ Wildwood 7 3 5 15 0.93 787898 -123.060 40.4067 31 1.4 Hayfork Cr/ Wildwood 8 3 5 15 0.93 787898 -123.059 40.4082 32 0.6 Hayfork Cr/ Wildwood 9 3 5 15 0.93 787898 -123.060 40.4076 33 6.5 Hayfork Cr: Hall City Cr 3 5 15 0.72 787825 -123.059 40.4015 34 7.0 Duncan Gulch 4 3 5 15 0.93 787630 -123.140 40.5745 35 1.6 Old Cold Creek Road 2 3 5 15 0.90 787501 -123.067 40.3838 36 25.5 Big Creek Ranch 1 3 5 15 0.86 787372 -123.152 40.5787 37 6.8 Big Creek Ranch 2 3 5 15 0.86 787372 -123.150 40.5832 38 8.7 Big Creek Ranch 3 3 5 15 0.88 787372 -123.151 40.5693 39 3.3 Big Creek Ranch 4 3 5 15 0.88 787372 -123.150 40.5691 40 1.7 Big Creek Ranch 5 3 5 15 0.87 787372 -123.151 40.5805 41 1.4 Big Creek Ranch 6 3 5 15 0.87 787372 -123.151 40.5783 42 2.8 Big Creek Ranch 7 3 5 15 0.76 787372 -123.150 40.5739 43 5.0 Big Creek Ranch 8 3 5 15 0.86 787372 -123.151 40.5716
44 5.0 East Fork Hayfork Cr: Sims
Creek 3 5 15 0.93 787051 -123.012 40.5040
45 0.7 Potato Creek 3 5 15 0.69 786518 -123.043 40.5036 46 2.9 Duncan Gulch 4 3 5 15 0.89 785679 -123.140 40.5704 47 5.9 Carr Creek 3 5 15 0.92 785609 -123.089 40.5752 48 4.3 East Fork Hayfork Cr 3 3 5 15 0.82 785549 -123.003 40.5068

47
49 8.6 Salt Cr: Ditch Gulch 2 3 5 15 0.82 785325 -123.157 40.4529 50 2.5 Duncan Gulch: Highway3 3 5 15 0.90 785271 -123.137 40.5572
Figure 12 shows some of the final products produced in this riparian assessment. It shows a subset of the full suite of data, this map is only focused on the Hayfork Valley itself, but data is available for the entire SFTR watershed.
Figure 12: The Riparian Restoration Site Priorities in the Vicinity of Hayfork. The sites shown in this map are a subset of the full restoration site prioritization list for example purposes.
Other Considerations Low cost, small footprint planting efforts: The WRTC has been fairly successful at very low cost, low impact, riparian revegetation efforts over the last four years, even as we are experiencing a severe drought. Volunteer planting efforts on selective sites have proven to be somewhat successful with a success rate ranging from 8-‐25%, while the only costs have been staff labor costs to organize volunteers, collect plants, and in some cases purchase plants. The Hayfork High School horticulture program has been extremely helpful in propagating and planting vegetation. It should be noted that rather than

48
conducting massive revegetation projects, sometimes it is appropriate to conduct small, low cost experiments to see which species establishes best in a particular zone and then return to that area with more intensive planting in future years.
Groundwater Connectivity: Another consideration is hydrologic connectivity. The Hayfork Valley is the location of the majority of loss of riparian vegetation from historic conditions (and the majority of top priority restoration sites) and it is likely that a large part of why that vegetation has been lost is due to the incision of Hayfork Creek and potential dewatering of the groundwater table throughout the valley. Beaver populations have been seen to be rebounding significantly in the last 4-‐5 years and their activities have been seen to increase groundwater connectivity with Hayfork Creek, dramatically increase riparian vegetation through raising the groundwater table (helping plants access water), and even potentially helping to aggrade the incised streambed (Figure 13) . If willow sticks used in their dams and lodges are not completely stripped of bark, they sprout. The authors of this report believe that groundwater connection may be tremendously important to stream temperatures in the Hayfork Valley. Interpretation of the aerial photos of the valley from 1944 suggest that the valley had significantly a higher groundwater table, crop fields appeared to have many more patches of lush vegetation than at the present.
Figure 13. Beaver dam at Hayfork Creek
Beaver Activity: While beavers seem to help overall riparian vegetation growth, they also use riparian vegetation as a primary food source. Another potential management tool that could be utilized to

49
promote and speed upstream shading is fencing to protect riparian trees. Allowing a selective alder and cottonwood trees to grow may contribute greatly to overall streamshade.
Riparian Fencing: Efforts in the 1990’s by NRCS and TCRCD promoted riparian exclusionary fencing and many of these sites now offer exemplary riparian corridor vegetation. One landowner with particularly impressive riparian vegetation (122cm DBH cottonwoods) utilizes what he calls “flash grazing” where he allows cows to graze the riparian corridor for short periods of time but does not allow them to stay for longer periods. Numerous other heavily grazed locations need riparian exclusionary fencing and additionally some areas that do have exclusionary fencing but do not use it should be provided education on the merits of proper riparian management.
Drought Mortality: The historic 2014-‐2015 drought has caused widespread mortality of riparian vegetation, particularly among alder species. Some of these sites will revegetate themselves rapidly, however many might not regenerate due to changes in water diversion rates and timber conversion activities.
Riparian Vegetation Education: common cultural beliefs may often negatively impact riparian vegetation. Many residents of this area believe that cutting riparian vegetation, especially alder and cottonwood, will increase the water availability in the streams. While there is some merit to thinning (see Effects of Changing Forest Age Structure and Density on a Forest's Water Yield), the overall long term impacts most certainly outweigh the short term benefits. There is also the misconception that all willows are invasive and therefore bad. Further education into properly functioning riparian corridors is needed for the residents of the SFTR watershed.
Fish Passage at Stream Diversion Assessment
FRGP Task: The SONCC identified “Barrier Modification for Fish Passage” (HB) and “Fish Screening of Diversions” (SC) as high priority projects for coho recovery on the SFTR. “Dams and diversions present a high threat to the population and affect multiple life stages. Although no major dams exist on the South Fork Trinity River, numerous wells and diversions for domestic and agricultural uses occur throughout the watershed and reduce streamflows during critical low-‐flow periods.” (SONCC 2012).
Summary The WRTC decided that fish passage at all major known stream diversions be assessed by a professional fish biologist and if possible, treatments prescribed to allow passage. The WRTC acquired a list of regulated diversions from the Water Board’s Division of Water Rights and hired PhD consultant Samantha Chilcote to conduct the assessments. The list of potential diversions included a total of approximately 217 individual regulated diversions. 63 were investigated in more closely and detailed site visit assessments of 9 were conducted.
The vast majority of the diversions in the SFTR are pumps in streams, not constructed diversion infrastructure that needs fish passage structures. Attempts to walk a range of streams with CDFW Wardens were made multiple times but scheduling conflicts arose often and in the end the Wardens

50
decided that they would conduct the surveys without a fish biologist due to the potentially dangerous nature of this effort.
The WRTC and consultant Samantha Chilcote considered approximately 217 individual diversions in the process of conducting the assessment. The WRTC and Samantha Chilcote worked closely with CDFW Fish Screen Shop to determine the priority diversions to assess. Nine diversion structures on eight streams were prioritized for surveys in the summer of 2014 and 2015 because they either are known to have had coho salmon or had very high intrinsic potential for coho and were known to be utilized by other salmonids.
See Appendix 4 for full Fish Passage at Water Diversions Assessment.
Data Gaps Very little is known about the locations, quantity, capacity, and impact of water being pumped directly from streams in the SFTR. The official regulated diversion data from the Division of Water Resources is likely a small subset of the number of actual diversions within the watershed. Additionally, the degree of implementation of Best Management Practices (BMPs), such as screening intakes for fish, on these instream pumps is unknown. It is recommended that in the future streams be surveyed for non-‐structural diversions and that their cumulative impacts on fish populations be assessed. It is also imperative that a complete survey of the type, screening, and diversion capacity of unrecorded structures be conducted on tributaries of the South Fork of the Trinity River. This will allow managers to understand potential impacts to anadromous fish populations and habitat within the watershed and respond accordingly.
Conclusions There are a minimum of six opportunities for improvement of fish passage at diversion structures in the South Fork of the Trinity River watershed.
Olsen Creek was identified as the highest restoration priority because it is known to have been historically occupied coho habitat. CDFW has previously retrofitted the fish passage structure at the diversion. Regular monitoring and maintenance of the structure by CDFW would allow improved passage by managing flows within the fish passage structure.
Silver Creek is the next highest restoration priority. There is a concrete dam impairing fish passage. This diversion is no longer used. Removal of the obsolete diversion structure would allow fish passage of all life history stages to high quality upstream habitat.
The upper diversion structure on Big Creek is trapping adult steelhead above the diversion due to creek flows being entirely diverted quickly into the diversion. A more gradual decrease of follows in the creek may provide the necessary hydrologic cue to adult individuals to outmigrate. Additionally, the maintenance of minimal flows through the fish passage structure would allow this to be utilized year round.

51
The lower diversion structure on Big Creek is no longer being utilized and should be removed to restore fish passage upstream.
The restoration recommendations for Upper Tule Creek diversion structure is similar to the upper diversion structure on Big Creek. Flow management would allow fish to potentially use the existing fish passage structure by maintaining minimal flows.
Lastly, West Tule Creek needs some sort of flow management, if possible, or a fish passage structure in the concrete apron. Specific actions were difficult to determine due to the extremely low flows in the creek.
The implementation of a few relatively low cost and opportunistic actions in these important tributaries to the South Fork of the Trinity River would greatly enhance fish passage for all life history stages to these vital cold water refugia area.
Fish Passage at Stream Mouth Assessment
FRGP Task: SONCC-‐SFTR.2.2.20.1 Identify potential sites to create refugia habitats. Prioritize sites and determine best means to create rearing habitat (SONCC 2012)
• The WRTC will assess numerous tributaries within the South Fork Trinity River to identify and manually treat chronic barriers to anadromous fish passage at the mouths of tributaries. Both summer and winter refugia associated with the lower reaches of tributaries are critical for the survival of juvenile salmonids. Fisheries surveys have identified consistently high numbers of juvenile salmonids in habitats that function both as summer and winter refugia. Natural barriers include aggraded stream mouths where streams will either run subsurface or become too shallow for fish to navigate because of large alluvial deltas. This problem has been exacerbated by past upslope disturbances such as wildfire, road failures, mining, and natural mass wasting due to erosive geology. Chronic low flows in the SFTR have increased the impact of seasonal barriers at the mouths of tributaries.
• WRTC assessments will include: low flow barriers, potential long-‐term solutions to historic problems, coho salmon presence/absence surveys, and assessments of qualitative features.
Summary Thirteen streams were quantitatively surveyed by Samantha Chilcote in the summer of 2014 and 2015. Two streams were found to be hydrologically connected to the SFTR and conditions at the mouth would allow passage of juvenile salmonids at or below historic base flow. One site was reported by local landowners to be a high value coldwater refugia, however, investigations of aerial imagery showed this to be an orthofluvial oxbow on the SFTR floodplain. See Table 14 for the full suite of restoration recommendations. Restoration of fish passage from handwork at the majority of these sites is either Not Necessary (NN) or Not Applicable (NA). Five sites were found to be disconnected at the mouth but handwork would Not be Sufficient (NS) to restore fish passage. Five sites were found to be Restoration Priorities (RP) for handwork to restore fish passage at the mouth.

52
See Appendix 5 for full Fish Passage at Stream Mouth Assessment.
Data Gaps More data can be collected for the following stream mouths in order to create better designs for the following streams: Rough Gulch, Little Bear Wallow, and Grouse creeks. Several tributaries upstream of Forest Glen not been surveyed in this project including Collins, Farley, Marie, Silver, Charlton, Cable, Happy Camp, Bierce, and several un-‐named creeks.
Conclusions Restoration recommendations for each surveyed stream relative to the streamflow at the Hyampom gauge on the SFTR (Table 14).
Table 14: Tributary mouths surveyed for fish passage. Restoration recommendations for each surveyed stream relative to the streamflow at the Hyampom gauge on the SFTR. Restoration recommendations were Not Necessary (NN), Not Applicable (NA), Not Sufficient (NS), or Restoration Priority (RP).Stream Flow during survey (cfs) Restoration Recommendation Big Creek (Hyampom) 14 NS Corral Creek 18 NN Crystal Creek 74 NA Eltapom Creek 18 RP EF Hayfork Creek 74 RP Kerlin Creek 74 NS Madden Creek 55 RP Mill Creek (Hyampom) 14 NS Olsen Creek 14 NS Pelletreau Creek 14 NS Potato Creek 70 RP Plummer Creek 66 RP Rattlesnake Creek 17 NN
Eleven streams were visually assessed by Josh Smith of the WRTC. Eight streams were found to be hydrologically connected to the SFTR and conditions at the mouth would allow passage of juvenile salmonids at the assessment flow. One site did not have sufficient fish passage at the mouth under observed flows at the mouth but handwork would Not be Sufficient (NS) to restore fish passage. Three sites was found to be a Restoration Priority (RP) at the observed flow for handwork to restore fish passage at the mouth.
Table 15: Tributary Mouths Surveyed. Restoration recommendations for each surveyed stream relative to the streamflow at the Hyampom gauge on the SFTR. Restoration recommendations were Not Necessary (NN), Not Applicable (NA), Not Sufficient (NS), or Restoration Priority (RP).Stream Flow during survey (cfs) Restoration Recommendation Duncan Gulch 535 NN Miner’s Creek 93 NN Red Mountain Creek 17 NN Rough Gulch 17 RP

53
Bear Creek (Hayfork Creek) 105 NN Big Creek 866 NN Carr Creek 830 NN Grouse Creek 17 RP Little Bear Wallow 600 RP Olsen Creek 14 NN Smokey Creek 830 NN
Rough Gulch, Little Bear Wallow, and Grouse Creek were the only sites determined to have Restoration Potential from the visual assessments at the observed flows.
Appendix 5 contains fish passage design details for potential manual modifications to the mouths of the following streams: Madden, Eltapom, Plummer, East Fork Hayfork, and Potato creeks. Figure 14 shows an example of one of the designs.
Figure 14: Conceptual drawing of Madden Creek a. before handwork and b. after handwork.

54
REFERENCES
Anderson, N.H., and J.R. Sedell. 1979. Detritus processing by macroinvertebrates in stream ecosystems. Annual review of entomology 24.1: 351-‐377.
Arkle, R. S., &D.S. Pilliod. 2010. Prescribed fires as ecological surrogates for wildfires: a stream and riparian perspective. Forest Ecology and Management, 259(5), 893-‐903.
Asarian, J.E and J.D. Walker. 2016. Long-‐Term Trends in Streamflow and Precipitation in Northwest California and Southwest Oregon, 1953-‐2012. Journal of the American Water Resources Association (JAWRA) 1-‐21.
Aussenac, G. and A. Granier. 1988. Effects of thinning on water stress and growth in Douglas-‐fir. Can. J. For. Res. 18:100-‐-‐105.
Bair, J. 2007. Field guide to the common riparian trees and shurbs of the lower Trinity River. McBain & Trush Inc., Arcata, California.
Baldwin, B.G., D.H. Goldman, D.J. Keil, R. Patterson, T.J. Rosatti, D.H. Wilken (Editors). 2012. The Jepson Manual Vascular Plants of California, Second Edition. University of California Press. Berkeley, CA.
Bates, C.G., and A.J. Henry. 1928. Forest and stream-‐flow experiment at Wagon Wheel Gap, Colorado. U.S. WeatherBureau Monthly Weather Review, Supplement: No. 30, 79.
Black, T.A., C.S. Tan and J.U. Nnyamah. 1980. Transpiration rate in Douglas-‐fir trees in thinned and unthinned stands. Can. J. Soil Sci. 60:625-‐-‐631.
Bêche, L. A., S.L. Stephens, &V.H.Resh. 2005. Effects of prescribed fire on a Sierra Nevada (California, USA) stream and its riparian zone. Forest Ecology and Management, 218(1), 37-‐59.
Bilby, R.E., and Bisson, P.A. 1992. Allochthonous versus autochthonous organic matter contributions to the trophic support of fish populations in clear-‐cut and old-‐growth forested streams. Can. J. Fish. Aquat. Sci. 49: 540–551.
Boisrame, G.F.S., M. Naranjo, S. Stephens, S.E. Thompson, and A. Wong, 2014. Seeing the Forest Without the Trees: Long-‐Term Influence of Wildfire on the Ecohydrology of a Mountain Watershed. AGU Fall Meeting Abstracts 54:05.
Bond, B. J., and K. L. Kavanagh. 1999. Stomatal behavior of four woody species in relation to leaf-‐specific hydraulic conductance and threshold water potential, Tree Physiol., 19, 503–510
Bosch, J. Mv, and J. D. Hewlett. 1982. A review of catchment experiments to determine the effect of vegetation changes on water yield and evapotranspiration. Journal of Hydrology 55.1: 3-‐23.
CalFish 2016. http://www.calfish.org/FisheriesManagement/SpeciesLists.aspx Accessed January 2016.

55
CalFlora: Information on California plants for education, research and conservation.2016. What Grows Here. Berkeley, California: The Calflora Database [a non-‐profit organization] http://www.calflora.org/entry/wgh.html, accessed on Apr, 20, 2016.
California Department of Water Resources (DWR). 1965. Ewing Project Feasibility Study, Bulletin No. 152. September 1965.
California Department of Water Resources (DWR). 1979. South Fork Trinity River watershed erosion investigation. Northern District, Red Bluff. 81 p.
California Department of Fish and Wildlife(CDFW) 1998 South Fork Sediment Sampling Notes1988.
California Department of Fish and Wildlife (CDFW) 1989 South Fork Sediment Sampling Notes.
California Department of Fish and Wildlife (CDFW) 1990 South Fork Sediment Sampling Notes.
California Department of Fish and Wildlife (CDFW).2003. California Salmonid Stream Habitat Restoration Manual, 3rd Edition Volume 2. California Department of Fish and Game, Sacramento, California.
Catalico, Nora. 2011. Lower South Fork Trinity Restoration History. Six Rivers National Forest. Chilcote, S., A. Cousins, N. Hemphill, A. Hill, D. Hillemeier, and J. Smith. 2013. Spring Chinook in the South Fork Trinity River: Recommended management actions and the status of their implementation. Prepared by the South Fork Trinity River Spring Chinook Sub-‐Group, Fish Work Group of the Trinity River Restoration Program, Weaverville, CA. 36 p.
CNPS. 2016. A Manual of California Vegetation, Online Edition. California Native Plant Society, Sacramento, CA. http://www.cnps.org/cnps/vegetation/,accessed on Apr, 20, 2016.
Devine, W.D. and C.A. Harrington. 2007. Release of Oregon White Oak from Overtopping Douglas-‐Fir: Effects on Soil Water and Microclimate. Northwest Science 81:112–124.
Dwire K.A., K.E. Meyer, S.E. Ryan, G. Riegel, T. Burton. 2011. A Guide to Fuels Management in Riparian Areas of the Interior West.Joint Fire Science Program Final Report 09-‐2-‐01-‐20
Gabriel M. 2013. Gabriel MW, Woods LW, Poppenga R, Sweitzer RA, Thompson C, Matthews SM, et al. (2012). Anticoagulant Rodenticides on our Public and Community Lands: Spatial Distribution of Exposure and Poisoning of a Rare Forest Carnivore. PLoS ONE 7(7): e40163. doi:10.1371/journal.pone.0040163
Garrison, P. 2000. Study 2d1 -‐ Steelhead Spawner Surveys in Trinity River tributaries, Prepared by Patrick Garrison, Biologist (Marine/Fisheries), Steelhead Research and Monitoring Program, Weaverville Remote Office.
Granier, A. 1987. Evaluation of transpiration in a Douglas-‐fir stand by means of sap flow measurements, Tree Physiol., 3, 309–320.

56
Halofsky, J. E., &D.E. Hibbs. 2008. Determinants of riparian fire severity in two Oregon fires, USA. Canadian Journal of Forest Research, 38(7), 1959-‐1973.
Harr, R. D., and F. M. McCorison. 1979. Initial effects of clear-‐cut logging on size and timing of peak flows in a small watershed in western Oregon. Water Resources Research 15.1: 90-‐94.
Harrison, N. M., A.P. Stubblefield, J.M.Varner, &E.E. Knapp. 2016. Finding balance between fire hazard reduction and erosion control in the Lake Tahoe Basin, California–Nevada. Forest Ecology and Management, 360, 40-‐51.
Hawkins, C.P., M.L.Murphy, N.H. Anderson, and M.A. Wilzbach. 1983. Density of fish and salamanders in relation to riparian canopy and physical habitat in streams of the northwestern United States. Can. J. Fish. Aquat. Sci. 40: 1173–1185.
Hibbert, A.R. 1967. Forest treatment effects on water yield. Sopper, W.E. and Lull, H.W. (editors). Forest Hydrology: Proceedings of a National Science Foundation Advanced Science Seminar, Forest Hydrology: August29-‐September1, 1965. The Pennsylvania Uni., University Park, PA. Pergamon Press, New York, 527-‐543.
Humphreys, E. R., T. A. Black, G. J. Ethier, G. B. Drewitt, D. L. Spittlehouse, E.-‐M. Jork, Z. Nesic, and N. J. Livingston .2003. Annual and seasonal variability of sensible and latent heat fluxes above a coastal Douglas-‐fir forest, British Columbia, Canada, Agric. For. Meteorol., 115,109–125.
Jassal, R. S., T. A. Black, D. L. Spittlehouse, C. Bruemmer, and Z. Nesic. 2009. Evapotranspiration and water use efficiency in different-‐aged Pacific Northwest Douglas-‐fir stands, Agric. For. Meteorol., 149, 1168–1178.
Johnson, S.L., and J.A. Jones. 2000. Stream temperature responses to forest harvest and debris flows in western Cascades, Oregon. Can. J. Fish. Aquat. Sci.57 (Suppl. 2): 30–39.
Link, P., K. Simonin, H. Maness, J.Oshun, T. Dawson, and I. Fung. 2014. Species differences in the seasonality of evergreen tree transpiration in a Mediterranean climate: Analysis of multiyear, half-‐hourly sap flow observations,WaterResour. Res., 50, 1869–1894
Marshall, J. D., and R. H. Waring. 1984. Conifers and broadleaf species: Stomatal sensitivity differs in western Oregon,Can. J. For. Res., 14(6), 905–908.
Martinez-‐Vilalta, J., A. Sala, and J. Pinol. 2004. The hydraulic architecture of Pinaceae—A review, Plant Ecol., 171, 3–13.
McDowell, N., W. T.Pockman, C. D. Allen, D. D. Breshears, N. Cobb, T. Kolb, ... &E. A. Yepez.2008. Mechanisms of plant survival and mortality during drought: why do some plants survive while others succumb to drought?. New Phytologist, 178(4), 719-‐739.

57
Moore, G.W., B.J. Bond, J.A. Jones, N. Phillips, and F.C. Meinzer. 2004. Structural and compositional controls on transpiration in 40-‐and 450-‐year-‐old riparian forests in western Oregon, USA. Tree physiology 24.5: 481-‐491.
Moore, R.D., D.L. Spittlehouse, and A. Story. 2005. RIPARIAN MICROCLIMATE AND STREAM TEMPERATURE RESPONSE TO FOREST HARVESTING: A REVIEW1. Journal of the American Water Resources Association 41.4: 813.
Murphy, M.L., and W.R. Meehan. 1991. Stream ecosystems. In Influencesof forest and rangeland management on salmonid fishes and their habitats. Edited by W.R. Meehan. Am. Fish. Soc. Spec. Publ. 19. American Fisheries Society, Bethesda, Md. pp. 17–46.
Murphy, K., T. Rich, and T. Sexton. 2007. An assessment of fuel treatment effects on fire behavior, suppression effectiveness, and structure ignition on the Angora Fire. USDA Forest Service. R5-‐TP-‐025.
National Research Council (NRC), 2008. Hydrologic Effects of a Changing Forest Landscape. National Academies Press, Washington, DC.
Oshun, J., D. Rempe, P. Link, K. A. Simonin, W. E. Dietrich, T. E. Dawson, and I. Fung. 2012. A look deep inside a hillslope reveals a structured heterogeneity of isotopic reservoirs and distinct water use strategies for adjacent trees, Abstract B33A-‐0498 presented at 2012 Fall Meeting, AGU, San Francisco, Calif.
Pacific Watershed Associates (PWA). 1994. Action Plan for Restoration of the South Fork 20 Trinity River Watershed and Its Fisheries (Part Two). U.S. Bureau of Reclamation, Trinity River Task Force.
Patrick Truman & Associates, Pacific Watershed Associates. 1996. Coordinated Resource Management Plan. Prepared for South Fork Trinity River Coordinated Resource Management Committee with assistance from the Trinity River Restoration Program.
Poole, G.C., and Berman, C.H. 2001. An ecological perspective on instream temperature: natural heat dynamics and mechanisms of human-‐caused thermal degradation. Environ. Manag.27: 787–802
Lanspa, Kenneth E 1983. Soil Survey of Shasta-‐Trinity National Forest Area, California. U.S. Department of Agriculture.
National Marine Fisheries Service (NMFS) 2014. Southern Oregon/Northern California Coast (SONCC) Coho Salmon Recovery Plan. Chapter 40: South Fork Trinity River. National Marine Fisheries Service, Arcata, California. 32 p.
Pacific Watershed Associates (PWA) 1994. Action Plan for Restoration of the South Fork Trinity Watershed and its Fisheries. Prepared for the Bureau of Reclamation and Trinity River Task Force by Pacific Watershed Associates, Arcata, CA. 408 p.

58
Rhodes, J.J., and C.A. Frissell. 2015. The High Costs and Low Benefits of Attempting to Increase Water Yield by Forest Removal in the Sierra Nevada. 108pp. Report prepared for Environment Now, 12400 Wilshire Blvd, Suite650, Los Angeles, CA 90025.
Sedell, J. R., Triska, F. J., Hall, J. D., Anderson, N. H., Lyford, J. H. 1974.Sources and fates of organic inputs in coniferous forest streams. In Integrated Research in the Coniferous Forest Biome, Conif: For. Biome, Ecosyst Anal. Stud., US/IBP, BulL No. 5, ed. R.H. Waring, R. L. Edmonds. pp. 57-‐69. Seattle: Univ. Washington
Short, R.A., S.P. Canton, and J.V. Ward. 1980. Detrital processing and associated macroinvertebrates in a Colorado mountain stream. Ecology (1980): 728-‐732.
Skinner, C.N. 2002. Fire history in riparian reserves of the Klamath Mountains. Association for Fire Ecology Miscellaneous Publication 1:164–169
Skinner, C.N. 2003. A tree-‐ring based fire history of riparian reserves in the Klamath Mountains. In California riparian systems: processes and floodplains management, ecology, and restoration. 2001 Riparian Habitat and Floodplains Conference Proceedings, March 12–15, 2001, Sacramento, CA, edited by P. M. Farber. Sacramento: Riparian Habitat Joint Venture
State of California Department of Water Resources Northern District 1982. SFTR Salmonid Habitat Enhancement Studies.
State of California Department of Water Resources Northern District. 1979. SFTR Watershed Erosion Investigation.
Stednick, J.D. 1996. Monitoring the effects of timber harvest on annual water yield. Journal of Hydrology 176: 79-‐95.
Stone, K. R., D.S. Pilliod, K.A. Dwire, C.C.Rhoades, S.P. Wollrab, &M.K. Young. 2010. Fuel reduction management practices in riparian areas of the western USA. Environmental management, 46(1), 91-‐100.
Stubblefield, A.P., M. Kaufman, G. Blomstrom, J. Rogers. 2012. Summer water use by mixed-‐age and young forest stands, Mattole River, Northern California, USA. United States Forest Service General Technical Report: Coast Redwoods in a Changing California, a Symposium for Scientists and Managers. PSW-‐GTR-‐238
Tetra Tech Inc. 2000.Watershed Analysis for the South Fork Trinity River. Prepared for the U.S. Forest Service, Shasta-‐Trinity National Forest, Redding, California. 102 p.
Trinity County Resource Conservation District. 2003. SFTR, Water Quality Monitoring Project. Prepared for the California Department of Fish and Game, Kevin Gale, Contract Manager, 601 Locust Street, Redding, CA 96001
United States Census, 2016. Quick Facts http://www.census.gov/quickfacts/ Accessed January 2016.

59
United States Environmental Protection Agency (US EPA) 1998. South Fork Trinity River and Hayfork Creek Sediment Total Daily Maximum Loads. U.S. Environmental Protection Agency, San Francisco California. 109 p.
United States Forest Service (USFS). 1996a. Lower Hayfork Creek watershed analysis. Report by the Shasta-‐Trinity National Forest, Hayfork Ranger District.
United States Forest Service (USFS). 1996b. Butter Creek watershed analysis. Report by the Shasta-‐Trinity National Forest, Hayfork Ranger District.
United States Forest Service (USFS). 1998. East Fork / Smoky Creek watershed analysis. Report by the Shasta-‐Trinity National Forest, Hayfork Ranger District.
United States Forest Service (USFS). 1999a. Upper SFTR -‐ Happy Camp Creek watershed analysis. Report by the Shasta-‐Trinity National Forest, Hayfork Ranger District.
United States Forest Service (USFS).1999b. Middle Hayfork Creek Watershed Analysis. Hayfork Ranger District, Shasta-‐Trinity National Forest,
United States Forest Service (USFS). 1999c. Lower South Fork Watershed Analysis. Lower Trinity Ranger District, Six Rivers National Forest, Eureka, CA. III-‐108
URS Greiner Woodward Clyde. 2000. Middle Hayfork Creek and Salt Creek Watershed Analysis. Oakland, CA. Van Kirk, R. and S. Naman. 2008. Relative effects of Climate and Water Use on Base-‐flow Trends in the Lower Klamath Basin. Journal of American Water Resources Association. August 2008. V 44, No. 4, 1034-‐1052.
Vinukollu, R. K., E. F. Wood, C. R. Ferguson, and J. B. Fisher. 2011. Global estimates of evapotranspiration for climate studies using multisensor remote sensing data: Evaluation of three process-‐based approaches, Remote Sens. Environ., 115, 801–823
Wilzbach, M.A., K.W. Cummins, and, J.D. Hall. 1986. Influence of habitat manipulations on interactions between cutthroat trout and invertebrate drift. Ecology, 67: 898–911.
Wilzbach, M. A., B. C. Harvey, J. L. White, and R. J. Nakamoto. 2005. Effects of riparian canopy opening and salmon carcass addition on the abundance and growth of resident salmonids. Canadian Journal of Fisheries and Aquatic Sciences, 62(1), 58-‐67.

60
APPENDIXES:
Appendix 1: Water Conservation Measures
Appendix 1A: Subwatershed Water Use Data
Appendix 2: Stream Temperature Analysis
Appendix 2A: Google Earth Sites, Reaches, and Graphs
Appendix 2B: Complete Hourly Dataset
Appendix 2C: Complete Daily Dataset
Appendix 2D: Complete Annual Dataset
Appendix 2E: Complete Site Location Attributes
Appendix 3: Riparian Vegetation Assessment and Plan
Appendix 3A: Riparian Woody Vegetation Table
Appendix 3B: Solar Insolation Model GIS Data
Appendix 3C: Example Site Design and Budget
Appendix 4: Fish Passage at Stream Diversion Assessment
Appendix 4A: Individual Water Diversion Assessment Reports
Appendix 4B: Water Board Water Diversion Data
Appendix 5: Fish Passage at Stream Mouth Assessment
Appendix 5A: Individual Stream Mouth Assessment Reports