Youth Action Research Noah Kirksey Jenna Jalbert Pierre Osias.
36
Youth Action Research Noah Noah Kirksey Kirksey Jenna Jenna Jalbert Jalbert Pierre Pierre Osias Osias
-
date post
21-Dec-2015 -
Category
Documents
-
view
214 -
download
0
Transcript of Youth Action Research Noah Kirksey Jenna Jalbert Pierre Osias.
Youth Action Research
Noah KirkseyNoah Kirksey
Jenna JalbertJenna Jalbert
Pierre OsiasPierre Osias
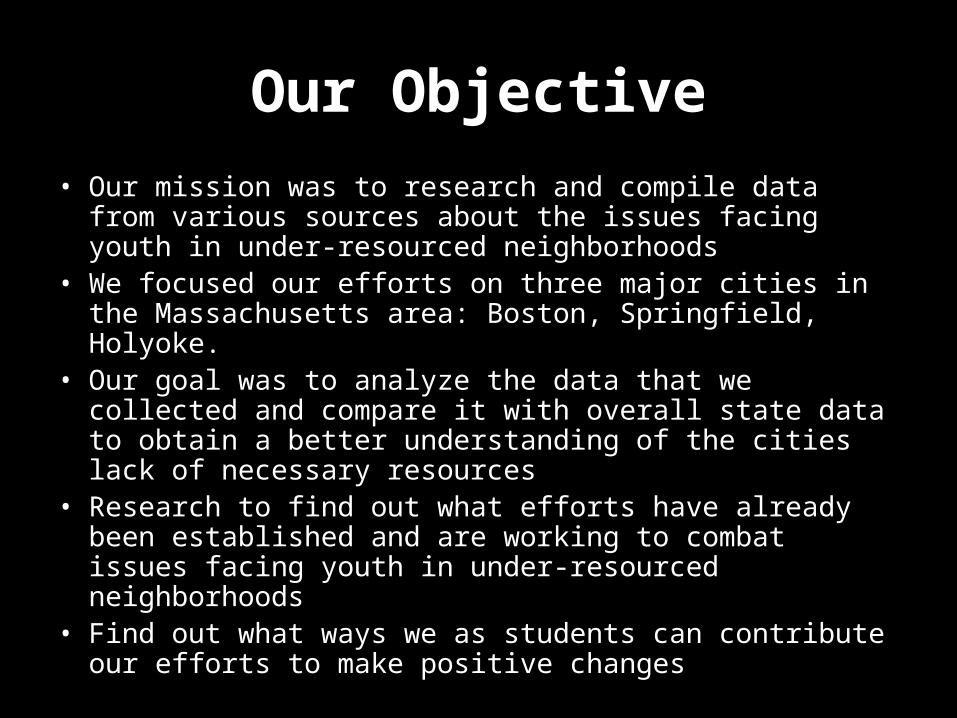
Our Objective
• Our mission was to research and compile data from various Our mission was to research and compile data from various sources about the issues facing youth in under-resourced sources about the issues facing youth in under-resourced neighborhoods neighborhoods
• We focused our efforts on three major cities in the We focused our efforts on three major cities in the Massachusetts area: Boston, Springfield, Holyoke.Massachusetts area: Boston, Springfield, Holyoke.
• Our goal was to analyze the data that we collected and Our goal was to analyze the data that we collected and compare it with overall state data to obtain a better compare it with overall state data to obtain a better understanding of the cities lack of necessary resources understanding of the cities lack of necessary resources
• Research to find out what efforts have already been Research to find out what efforts have already been established and are working to combat issues facing youth in established and are working to combat issues facing youth in under-resourced neighborhoodsunder-resourced neighborhoods
• Find out what ways we as students can contribute our efforts Find out what ways we as students can contribute our efforts to make positive changesto make positive changes
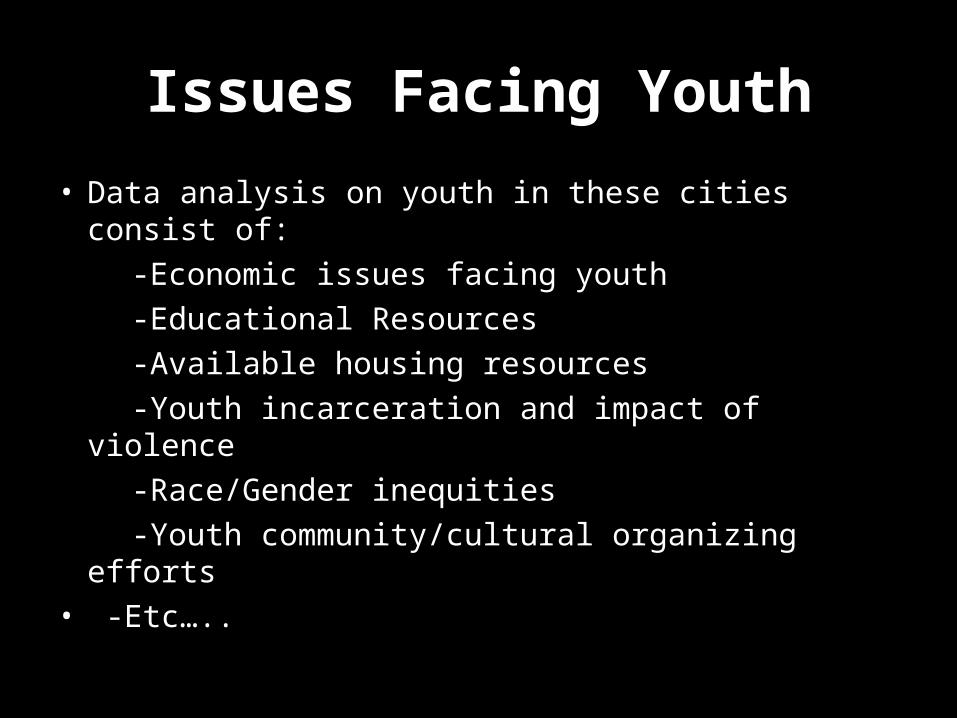
Issues Facing Youth
• Data analysis on youth in these cities consist of:Data analysis on youth in these cities consist of:
-Economic issues facing youth-Economic issues facing youth
-Educational Resources-Educational Resources
-Available housing resources -Available housing resources
-Youth incarceration and impact of violence-Youth incarceration and impact of violence
-Race/Gender inequities -Race/Gender inequities
-Youth community/cultural organizing efforts-Youth community/cultural organizing efforts• -Etc…..-Etc…..
Boston
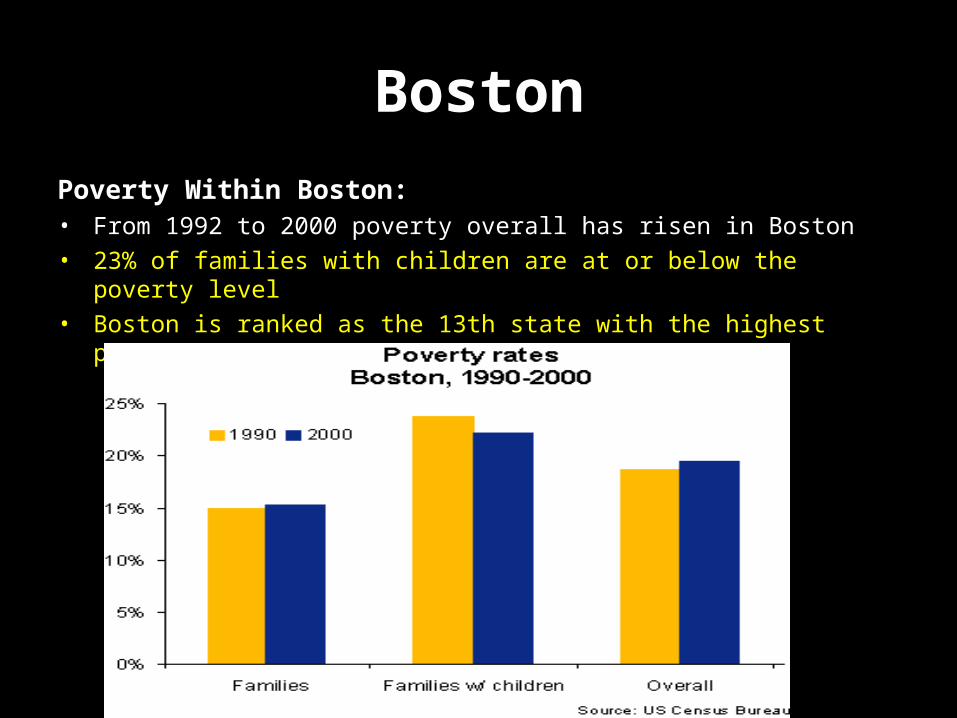
Poverty Within Boston:Poverty Within Boston:• From 1992 to 2000 poverty overall has risen in BostonFrom 1992 to 2000 poverty overall has risen in Boston
• 23% of families with children are at or below the poverty level23% of families with children are at or below the poverty level
• Boston is ranked as the 13th state with the highest poverty rateBoston is ranked as the 13th state with the highest poverty rate
Boston
• From 1999 to 2002, From 1999 to 2002, youth-gang related homicides in youth-gang related homicides in Massachusetts rose more than 50 percentMassachusetts rose more than 50 percent, ,
• From 1996 to 2003, Boston experienced a From 1996 to 2003, Boston experienced a dropdrop in in youth violence. youth violence. Then, the number of shootings started Then, the number of shootings started to climb: 268 in 2004 and 341 in 2005to climb: 268 in 2004 and 341 in 2005. The city is on . The city is on track for a projected number of 616 shootings in track for a projected number of 616 shootings in 2006.2006.
• Last year, Last year, high-school-age teens comprised 50 high-school-age teens comprised 50 percent of shooting victims. percent of shooting victims.
Youth Violence, 1996-2005
Boston
• 24% of high school students reported having been 24% of high school students reported having been bullied in school during the past year. bullied in school during the past year.
• 10% of high school students were involved in a 10% of high school students were involved in a gang in the year before the surveygang in the year before the survey. .
• Over one-fifth of high school students (22%) Over one-fifth of high school students (22%) reported having their property stolen or reported having their property stolen or deliberately damaged at school in the past year. deliberately damaged at school in the past year.
Massachusetts Youth Risk Behavior Survey, 2005:

MA Demographics • There were 1,251,263 youth and young adults ages 10 to 24 in There were 1,251,263 youth and young adults ages 10 to 24 in
Massachusetts in 2000, 19.7% of the Commonwealth’s Massachusetts in 2000, 19.7% of the Commonwealth’s populationpopulation

MassachusettsThe proportion of school age youth, (ages 10-17) is 10.6%, but varies The proportion of school age youth, (ages 10-17) is 10.6%, but varies throughout MA.throughout MA.

Boston
• While poverty rates continue to rise, While poverty rates continue to rise, youth funding is youth funding is being cutbeing cut
• In order to see a positive correlation between youth In order to see a positive correlation between youth and violence, and violence, the public must take actionthe public must take action
• An increase in youth programs will help eliminate the An increase in youth programs will help eliminate the rising levels of violence as a whole rising levels of violence as a whole
• We must provide Boston’s youth with We must provide Boston’s youth with positive positive organizations in order for them to succeed and not organizations in order for them to succeed and not end up as another statisticend up as another statistic
SpringfieldDemographics: Demographics:
In 2004, Springfield’s population was In 2004, Springfield’s population was • Was slightly less thanWas slightly less than 45 percent white, 45 percent white, • Little less than 20 percent of residents identifying as African Little less than 20 percent of residents identifying as African
American American • 30 percent identifying as Hispanic or Latino 30 percent identifying as Hispanic or Latino
Youth Demographics:Youth Demographics:
• One-fourth of Springfield’s population is under the age of 18One-fourth of Springfield’s population is under the age of 18,. ,.
• In 2004 Springfield’s population were between the age of 10 and In 2004 Springfield’s population were between the age of 10 and 14, compared to less than seven percent of Massachusetts’ 14, compared to less than seven percent of Massachusetts’ population population
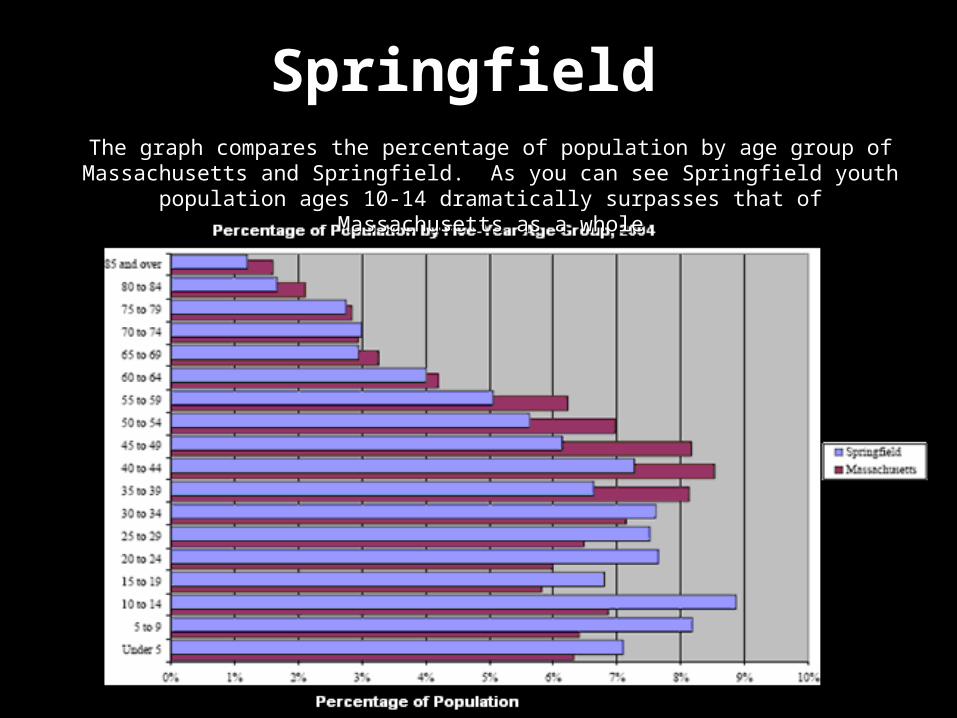
SpringfieldThe graph compares the percentage of population by age group of Massachusetts and Springfield. The graph compares the percentage of population by age group of Massachusetts and Springfield.
As you can see Springfield youth population ages 10-14 dramatically surpasses that of As you can see Springfield youth population ages 10-14 dramatically surpasses that of Massachusetts as a wholeMassachusetts as a whole
Springfield
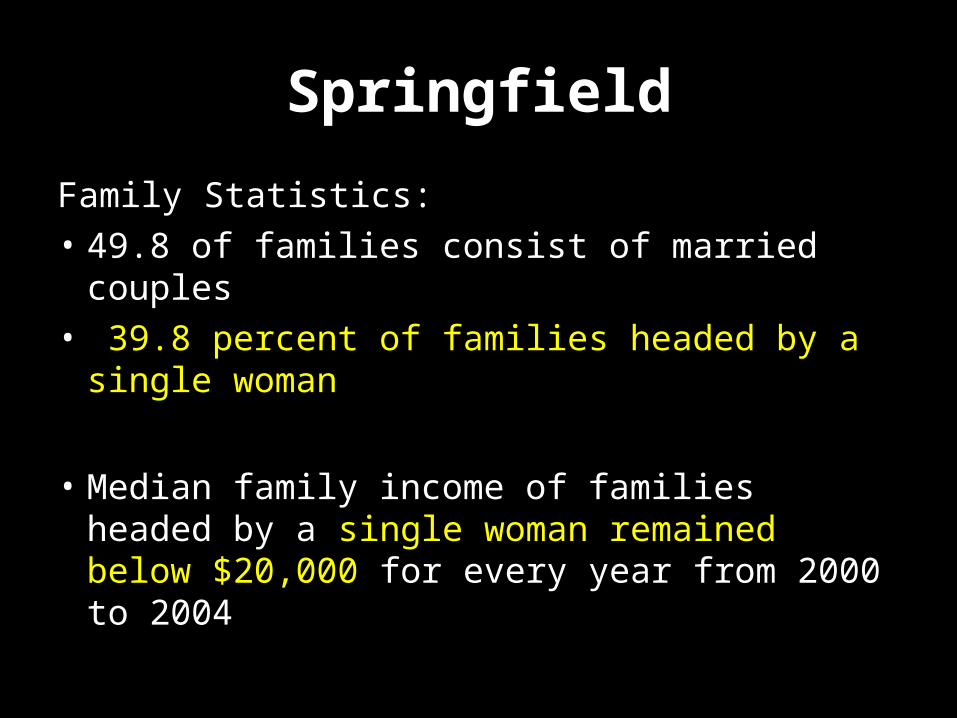
Family Statistics:Family Statistics:
• 49.8 of families consist of married couples 49.8 of families consist of married couples
• 39.8 percent of families headed by a single 39.8 percent of families headed by a single womanwoman
• Median family income of families headed by a Median family income of families headed by a single woman remained below $20,000single woman remained below $20,000 for for every year from 2000 to 2004 every year from 2000 to 2004
Springfield
Education Conditions:Education Conditions:
• The state’s average percentage of public The state’s average percentage of public school students considered low-income has school students considered low-income has hovered around one quarter, hovered around one quarter,
• However more than three-quarters of However more than three-quarters of Springfield students are considered low-Springfield students are considered low-incomeincome..
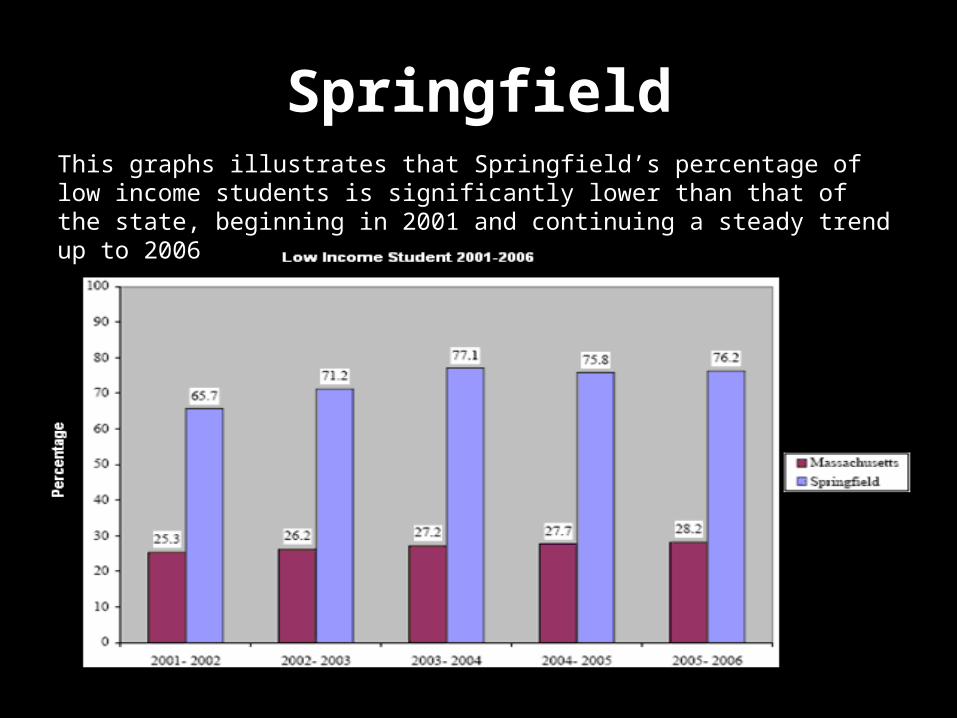
SpringfieldThis graphs illustrates that Springfield’s percentage of low income students is This graphs illustrates that Springfield’s percentage of low income students is significantly lower than that of the state, beginning in 2001 and continuing a steady significantly lower than that of the state, beginning in 2001 and continuing a steady trend up to 2006trend up to 2006

Springfield
Economic Conditions:Economic Conditions:
• Springfield’s poverty rate, at 23.1 percent Springfield’s poverty rate, at 23.1 percent
- - more than ten percentage points above that of more than ten percentage points above that of the nation. the nation.
• Child poverty rates, more than one in three Child poverty rates, more than one in three children live in povertychildren live in poverty
Holyoke
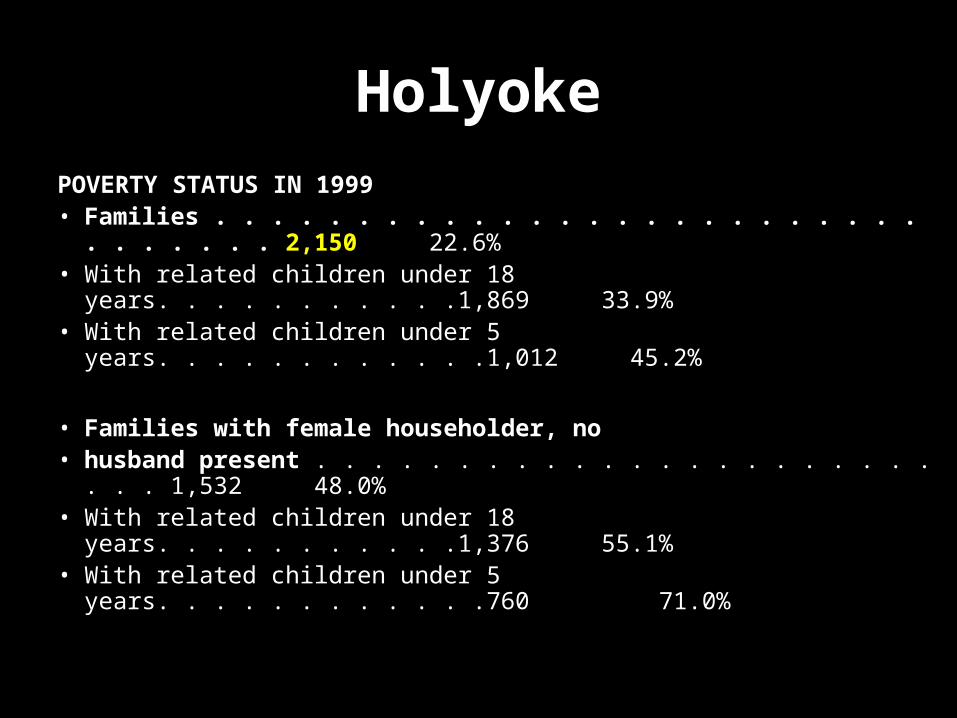
POVERTY STATUS IN 1999POVERTY STATUS IN 1999• Families . . . . . . . . . . . . . . . . . . . . . . . . . . . . . . . . Families . . . . . . . . . . . . . . . . . . . . . . . . . . . . . . . . 2,1502,150 22.6%22.6%• With related children under 18 years. . . . . . . . . . .1,869 33.9%With related children under 18 years. . . . . . . . . . .1,869 33.9%• With related children under 5 years. . . . . . . . . . . .1,012 45.2%With related children under 5 years. . . . . . . . . . . .1,012 45.2%
• Families with female householder, noFamilies with female householder, no• husband present husband present . . . . . . . . . . . . . . . . . . . . . . . . . 1,532 48.0%. . . . . . . . . . . . . . . . . . . . . . . . . 1,532 48.0%• With related children under 18 years. . . . . . . . . . .1,376 55.1%With related children under 18 years. . . . . . . . . . .1,376 55.1%• With related children under 5 years. . . . . . . . . . . .760 71.0%With related children under 5 years. . . . . . . . . . . .760 71.0%
Holyoke
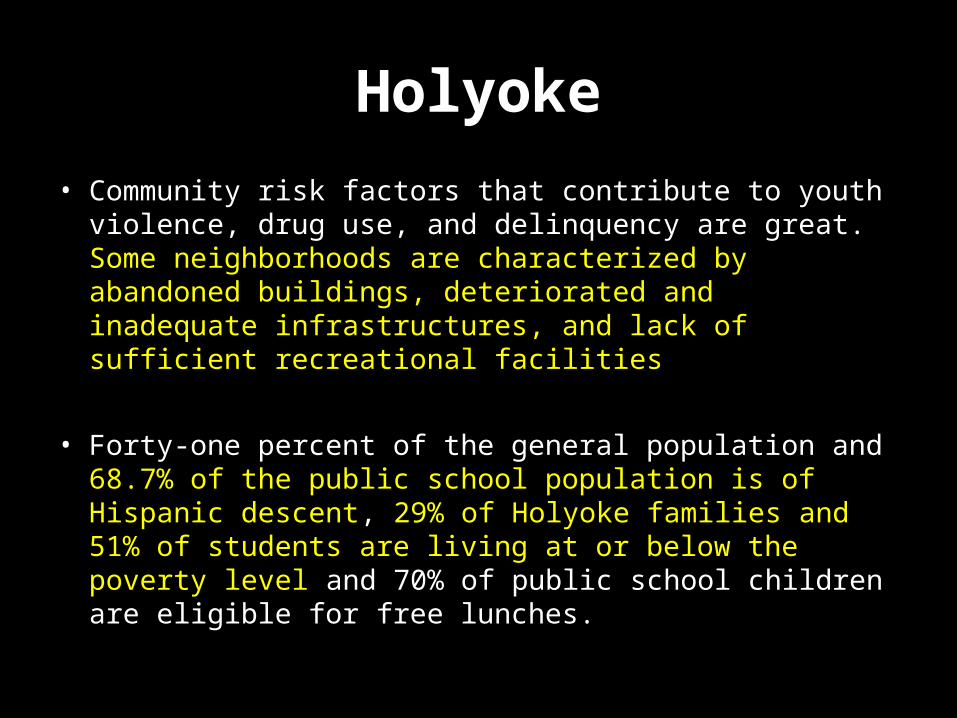
• Community risk factors that contribute to youth violence, drug Community risk factors that contribute to youth violence, drug use, and delinquency are great. use, and delinquency are great. Some neighborhoods are Some neighborhoods are characterized by abandoned buildings, deteriorated and characterized by abandoned buildings, deteriorated and inadequate infrastructures, and lack of sufficient recreational inadequate infrastructures, and lack of sufficient recreational facilities facilities
• Forty-one percent of the general population and Forty-one percent of the general population and 68.7% of the 68.7% of the public school population is of Hispanic descentpublic school population is of Hispanic descent, , 29% of 29% of Holyoke families and 51% of students are living at or below Holyoke families and 51% of students are living at or below the poverty levelthe poverty level and 70% of public school children are and 70% of public school children are eligible for free lunches.eligible for free lunches.
Holyoke
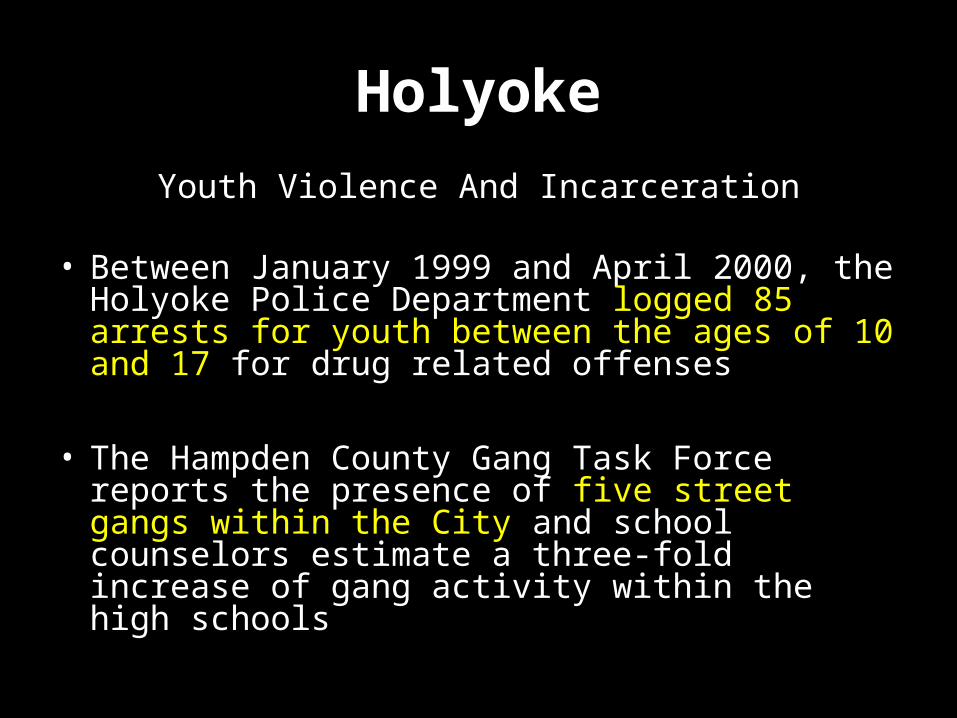
Youth Violence And IncarcerationYouth Violence And Incarceration
• Between January 1999 and April 2000, the Holyoke Between January 1999 and April 2000, the Holyoke Police Department Police Department logged 85 arrests for youth logged 85 arrests for youth between the ages of 10 and 17between the ages of 10 and 17 for drug related for drug related offenses offenses
• The Hampden County Gang Task Force reports the The Hampden County Gang Task Force reports the presence of presence of five street gangs within the Cityfive street gangs within the City and and school counselors estimate a three-fold increase of school counselors estimate a three-fold increase of gang activity within the high schools gang activity within the high schools

Holyoke
Education Conditions:Education Conditions:
Based on the MCAS testing, Holyoke's test Based on the MCAS testing, Holyoke's test results indicate a large percentage of students results indicate a large percentage of students are at risk of academic failure. Test scores are at risk of academic failure. Test scores from from 2000 showed 48% of students scoring in 2000 showed 48% of students scoring in the 'failing' and 39%the 'failing' and 39% in the 'needs in the 'needs improvement' categories improvement' categories
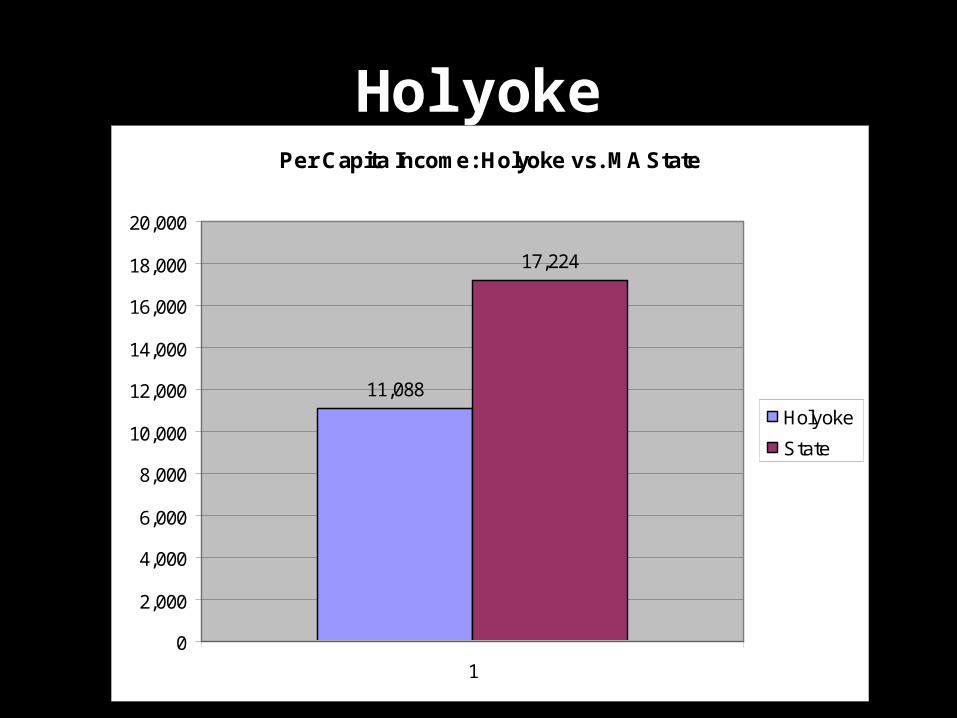
HolyokePer Capita Income: Holyoke vs. MA State
11,088
17,224
0
2,000
4,000
6,000
8,000
10,000
12,000
14,000
16,000
18,000
20,000
1
Holyoke
State
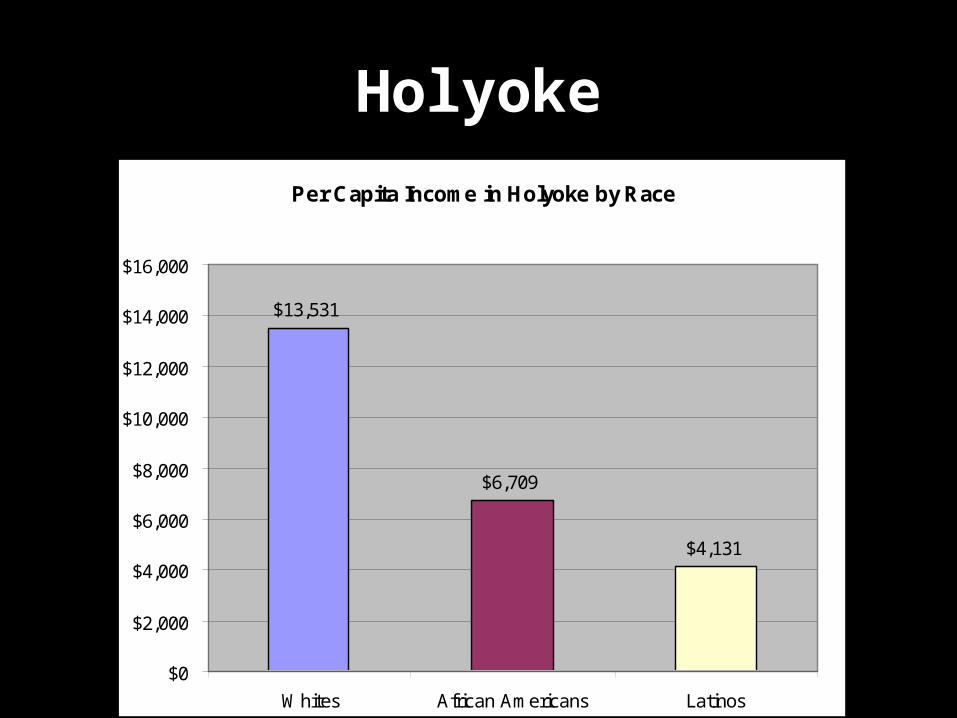
Holyoke
Per Capita Income in Holyoke by Race
$13,531
$6,709
$4,131
$0
$2,000
$4,000
$6,000
$8,000
$10,000
$12,000
$14,000
$16,000
Whites African Americans Latinos

HolyokePoverty Rate: Holyoke vs. MA State
25.70%
8.90%
0.00%
5.00%
10.00%
15.00%
20.00%
25.00%
30.00%
Holyoke MA State

HolyokePoverty Rate in Holyoke by Race
13.70%
42.80%
59.10%
0.00%
10.00%
20.00%
30.00%
40.00%
50.00%
60.00%
70.00%
Whites African-Americans
Latinos
Whites
African-Americans
Latinos
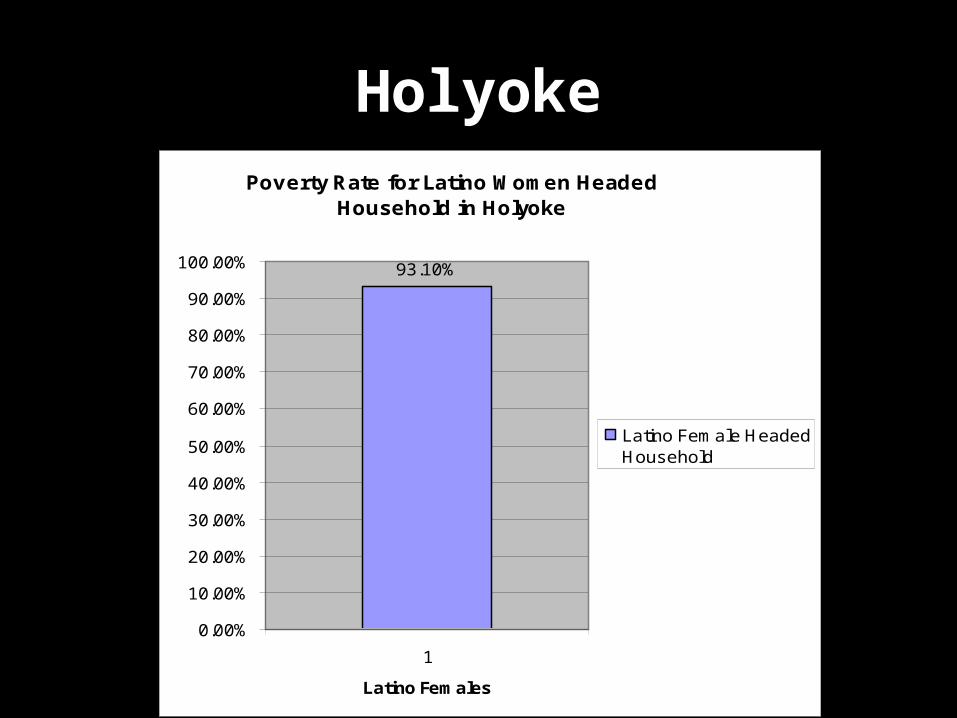
HolyokePoverty Rate for Latino Women Headed
Household in Holyoke
93.10%
0.00%
10.00%
20.00%
30.00%
40.00%
50.00%
60.00%
70.00%
80.00%
90.00%
100.00%
1
Latino Females
Latino Female HeadedHousehold


Analysis ComparisonA lower share of teens is giving birth in MassachusettsA lower share of teens is giving birth in Massachusetts• In 2003, In 2003, Massachusetts ranked third overall in the nation in teen birth Massachusetts ranked third overall in the nation in teen birth
rate at 23rate at 23 percent. More than percent. More than 4,600 teens gave birth in Massachusetts 4,600 teens gave birth in Massachusetts in 2004, compared with about 5,300 in 2000in 2004, compared with about 5,300 in 2000
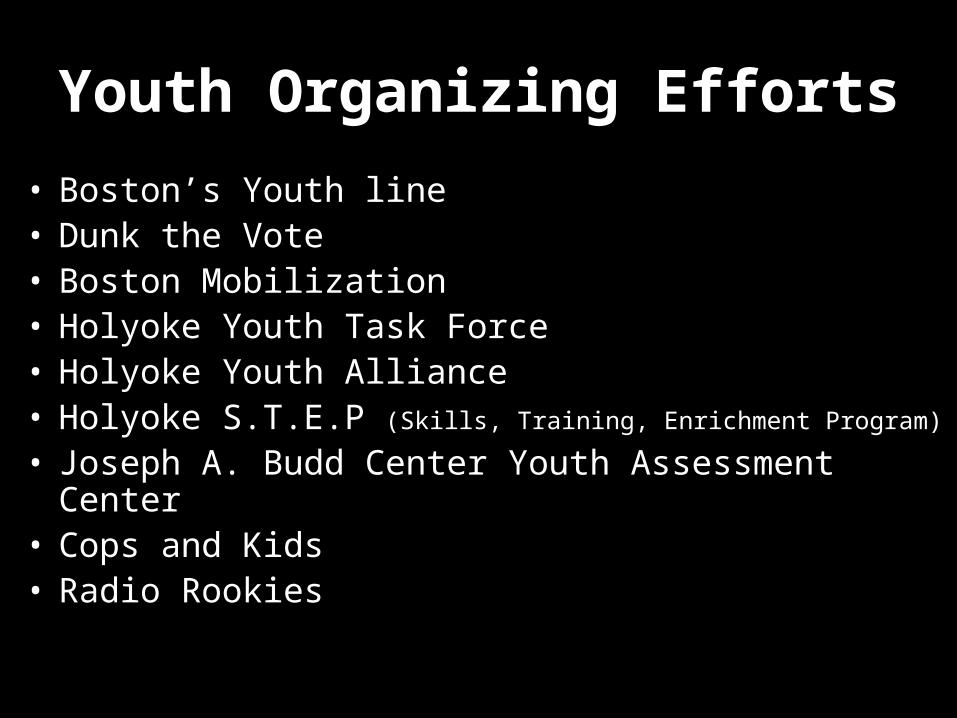
Youth Organizing Efforts
• Boston’s Youth lineBoston’s Youth line• Dunk the VoteDunk the Vote• Boston MobilizationBoston Mobilization• Holyoke Youth Task Force Holyoke Youth Task Force • Holyoke Youth AllianceHolyoke Youth Alliance• Holyoke S.T.E.P Holyoke S.T.E.P (Skills, Training, Enrichment Program)(Skills, Training, Enrichment Program) • Joseph A. Budd Center Youth Assessment CenterJoseph A. Budd Center Youth Assessment Center• Cops and KidsCops and Kids• Radio RookiesRadio Rookies
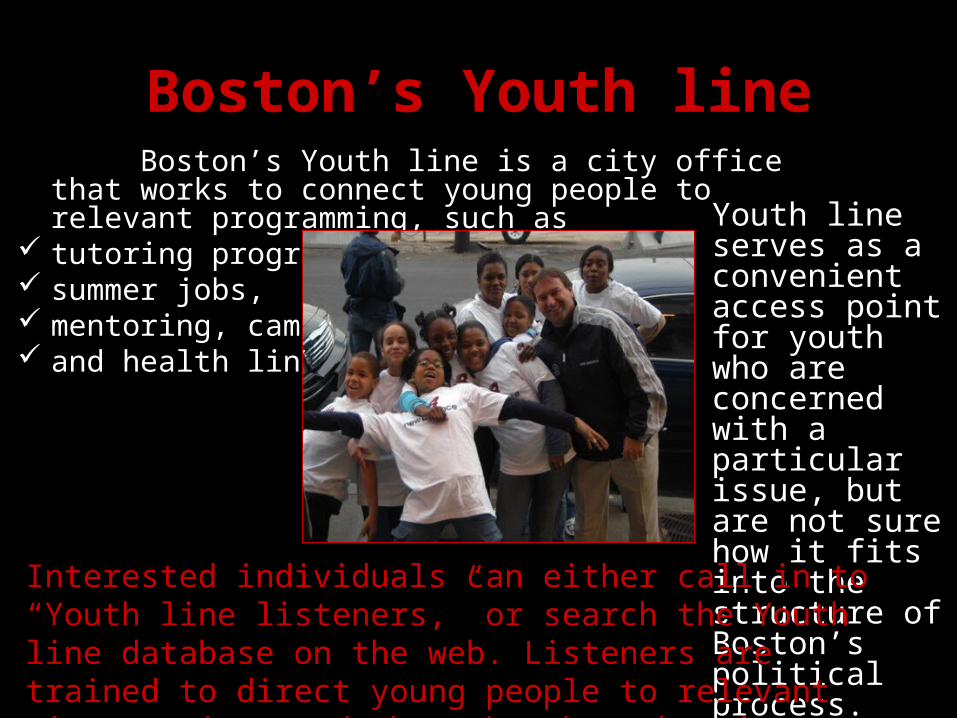
Boston’s Youth lineBoston’s Youth line Boston’s Youth line is a city office that works to connect Boston’s Youth line is a city office that works to connect
young people to relevant programming, such as young people to relevant programming, such as tutoring programs, tutoring programs, summer jobs, summer jobs, mentoring, camps, mentoring, camps, and health lines. and health lines.
Youth line serves Youth line serves as a convenient as a convenient access point for access point for youth who are youth who are concerned with a concerned with a particular issue, particular issue, but are not sure but are not sure how it fits into the how it fits into the structure of structure of Boston’s political Boston’s political process. process.
Interested individuals can either call in to “Youth line listeners,” or Interested individuals can either call in to “Youth line listeners,” or search the Youth line database on the web. Listeners are trained to search the Youth line database on the web. Listeners are trained to direct young people to relevant city services and show them how the direct young people to relevant city services and show them how the city can serve as a resource for themcity can serve as a resource for them
Dunk the VoteDunk the Vote
Dunk the VoteDunk the Vote
• Dunk the Vote, sponsored Dunk the Vote, sponsored by the Boston subsidiary of by the Boston subsidiary of the national Youth Vote the national Youth Vote Coalition,Coalition,
Combines a basketball tournament with voter registration. By Combines a basketball tournament with voter registration. By making voter information and registration available in a setting making voter information and registration available in a setting that appeals to youth, this event, and others like it, bring the that appeals to youth, this event, and others like it, bring the tools of government to those who might not otherwise be tools of government to those who might not otherwise be exposed to them.exposed to them.
Boston Boston Mobilization is Mobilization is a non-profit a non-profit community community organization organization that works to that works to engage young engage young people on people on different social different social issues. issues.
Since its founding in 1977, Mobe has worked Since its founding in 1977, Mobe has worked specifically with college students, empowering specifically with college students, empowering them to engage in their communities. Youth find them to engage in their communities. Youth find their voices as agents for constructive change, their voices as agents for constructive change, utilizing direct action, community education and utilizing direct action, community education and local legislative efforts to run grassroots local legislative efforts to run grassroots campaigns for peace, racial equality, economic campaigns for peace, racial equality, economic justice and genuine democracy justice and genuine democracy

MISSION:
The mission of the Holyoke Youth Task Force is to work collaboratively in order to strengthen the voice of youth in Holyoke, and advocate for sufficient resources to meet their needs
Highlights:In early 2005, the Task Force embarked on a strategic planning process to determine risk and protective factors that influence five problem behaviors
among youth: substance abuse, teen pregnancy, drop out, violence and delinquency.
The Holyoke Youth Task Force offers youth advocates:Networking AdvocacyProfessional DevelopmentResource Development
MISSION:
HYA recently received a grant from the Reproductive Rights and Organizing Fund of the Ms. Foundation for Women, launching our new project Rise Up Now (RUN).
HIGHLIGHTS:
RISE UP NOW
RUN is designed to mobilize the Latino community, empowering Latinas to take political power, to ensure reproductive services for underserved youth,
and to expand economic, educational, and political accessibility
HOLYOKE YOUTH ALLIANCEHOLYOKE YOUTH ALLIANCE
MISSION:
STEP is an academic support program for students from the 7th and 8th grades in Holyoke. The primary goal is to assist youth in obtaining skills and motivation to complete middle school and high school and to enroll in college. PROGRAM ACTIVITIES:
STEP offers after-school academic tutoring at Lynch, Magnet and Peck Middle Schools. Tutoring generally takes place Monday- Thursday from 2:30-4:00. STEP tutors are highly qualified high school students who are
graduates of STEP.
HOLYOKE STEPHOLYOKE STEP
Skills, Training and Enrichment Program Skills, Training and Enrichment Program
The The Joseph A. Budd CenterJoseph A. Budd Center is unique is unique to Western Massachusetts. It is a to Western Massachusetts. It is a collaboration of the SPD and other collaboration of the SPD and other major youth serving agencies. major youth serving agencies.
Partners include: Partners include:
Springfield Police Department Springfield Police Department
Youth Aid Bureau, Youth Aid Bureau,
Student Support Officers,Student Support Officers,
Gang Suppression Unit,Gang Suppression Unit,
Springfield School Department, Springfield School Department,
Department of Social Services, Department of Social Services,
Department of Youth Services,Department of Youth Services,
Center for Human DevelopmentCenter for Human Development
Cops and KidsCops and Kids
What is Cops and Kids?What is Cops and Kids?It is designed to promote drug and gang free It is designed to promote drug and gang free activities for at risk youth.. activities for at risk youth..
This after school program provides for This after school program provides for class room training giving an anti-drug , class room training giving an anti-drug , anti-smoking, anti-gang, and anti-alcohol anti-smoking, anti-gang, and anti-alcohol message loosely based on the national message loosely based on the national D.A.R.E. program. D.A.R.E. program.
Radio Rookies®• Radio Rookies® Radio Rookies®
is a New York is a New York Public Radio® Public Radio® initiative that initiative that provides provides teenagers with teenagers with the tools and the tools and training to create training to create radio stories radio stories about themselves, about themselves, their communities their communities and their world.and their world.
Radio Rookies typically runs one or two workshops a year, each lasting anywhere from four to eight months. During the workshops, Rookie Reporters learn everything about radio journalism: from how to conduct an interview and develop a story to how to craft a script and digitally edit their audio
http://www.wnyc.org/radiorookies/HuntsPoint/Pun.htmlhttp://www.wnyc.org/radiorookies/HuntsPoint/Eric.html
http://www.wnyc.org/radiorookies/Bushwick/Macho.html