
Types of Healthcare Analytics Indranil Bardhan, UT Dallas Kirk Kirksey, UTSW Medical Center.
29
Types of Healthcare Analytics Indranil Bardhan, UT Dallas Kirk Kirksey, UTSW Medical Center
-
Upload
darlene-skinner -
Category
Documents
-
view
227 -
download
0
Transcript of Types of Healthcare Analytics Indranil Bardhan, UT Dallas Kirk Kirksey, UTSW Medical Center.
Types of Healthcare Analytics
Indranil Bardhan, UT DallasKirk Kirksey, UTSW Medical Center

What is Healthcare Data Analytics?
• A collection of collection, cleaning, transforming, and modeling health data to derive meaningful and useful knowledge, and to support decision making.
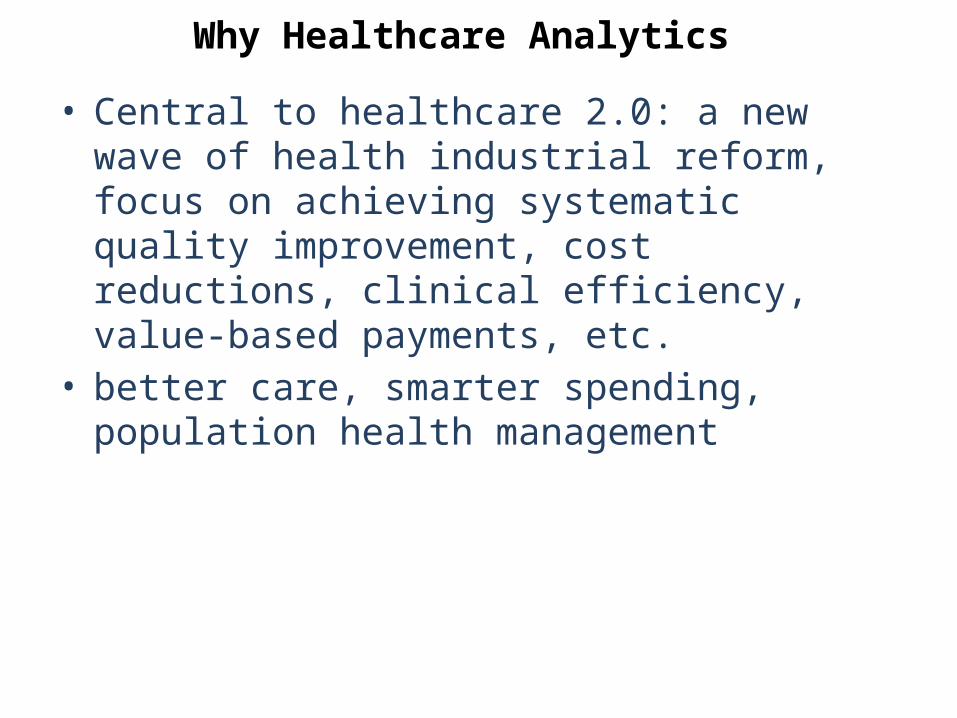
Why Healthcare Analytics
• Central to healthcare 2.0: a new wave of health industrial reform, focus on achieving systematic quality improvement, cost reductions, clinical efficiency, value-based payments, etc.
• better care, smarter spending, population health management
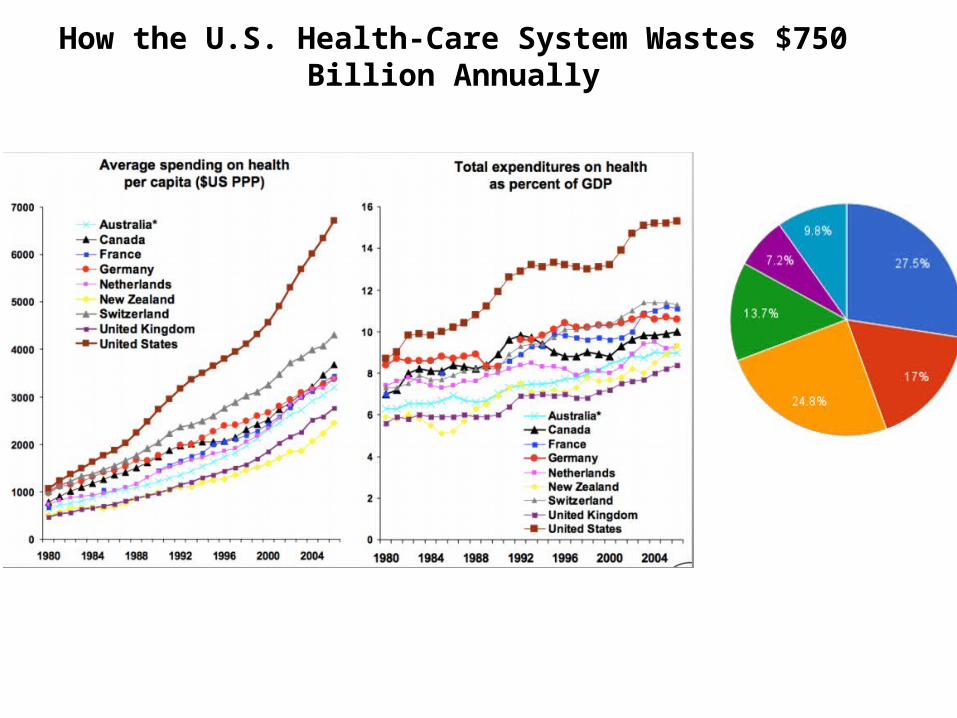
How the U.S. Health-Care System Wastes $750 Billion Annually
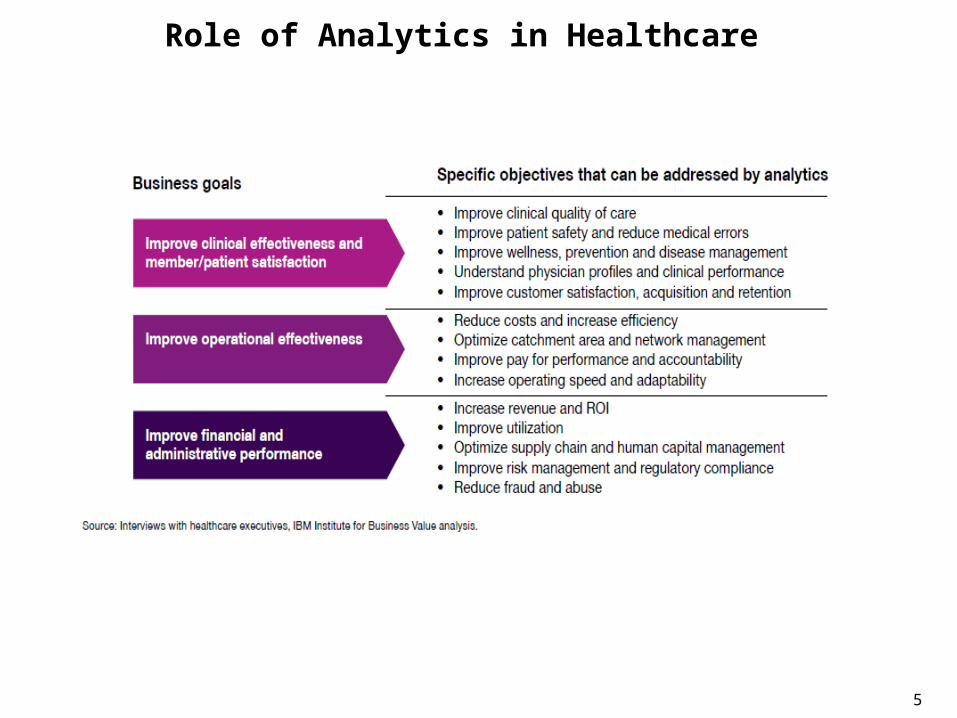
Role of Analytics in Healthcare
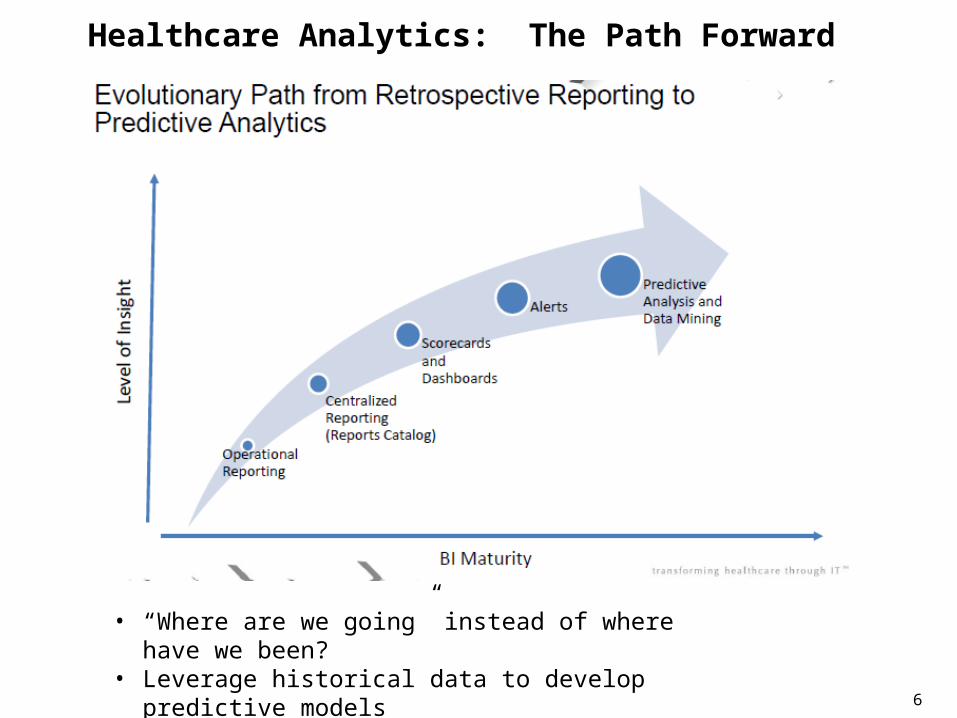
Healthcare Analytics: The Path Forward
• “Where are we going” instead of where have we been?• Leverage historical data to develop predictive models
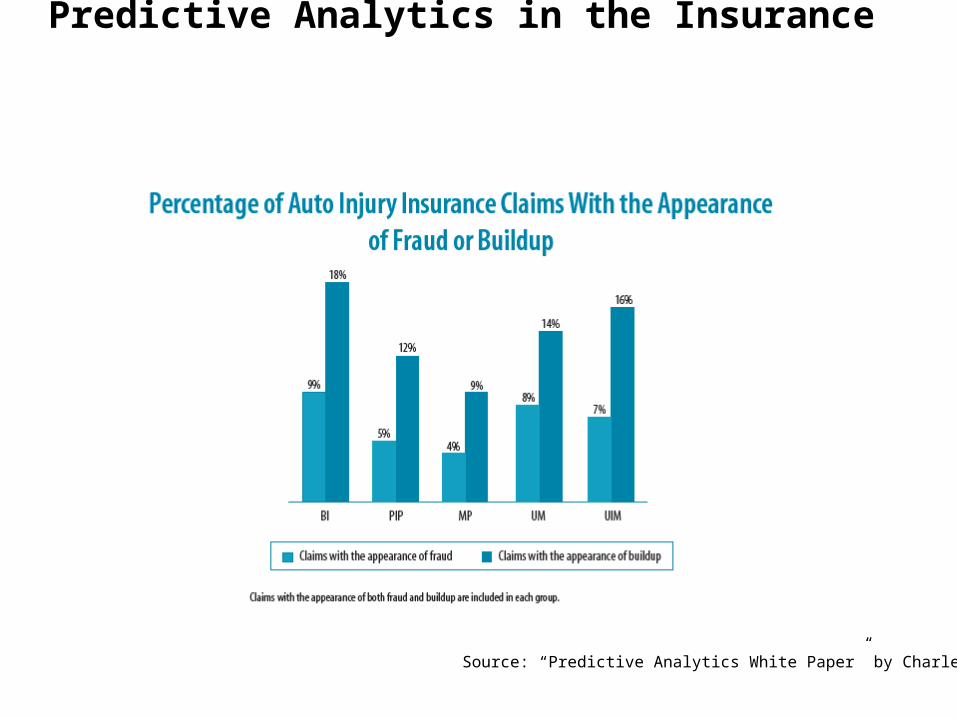
Predictive Analytics in the Insurance Industry
Source: “Predictive Analytics White Paper” by Charles Nyce
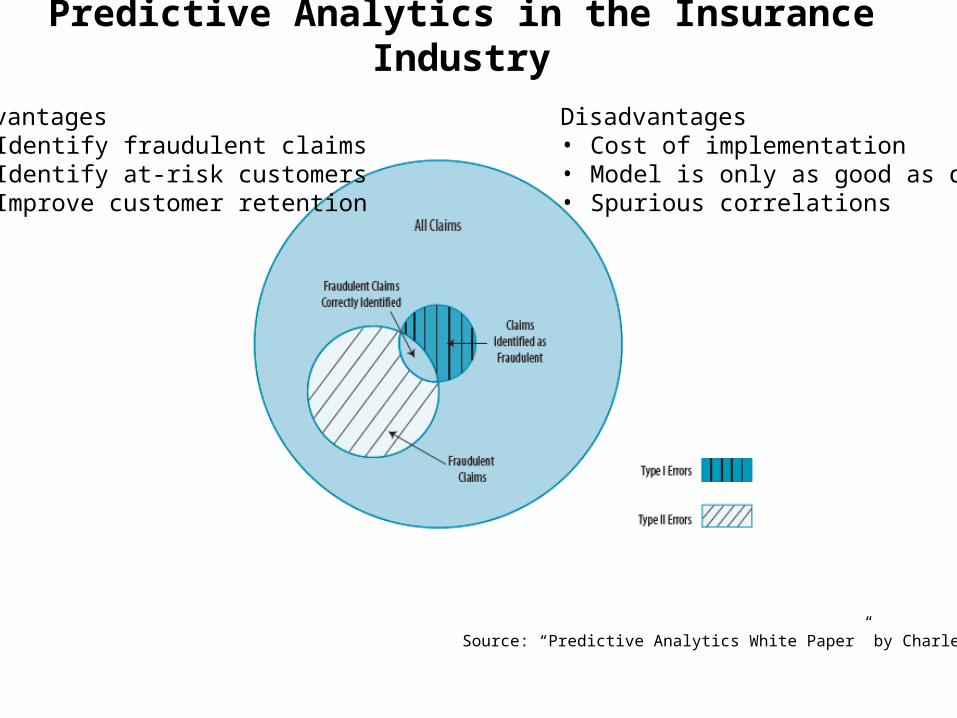
Predictive Analytics in the Insurance Industry
Source: “Predictive Analytics White Paper” by Charles Nyce
Advantages• Identify fraudulent claims• Identify at-risk customers• Improve customer retention
Disadvantages• Cost of implementation• Model is only as good as data• Spurious correlations
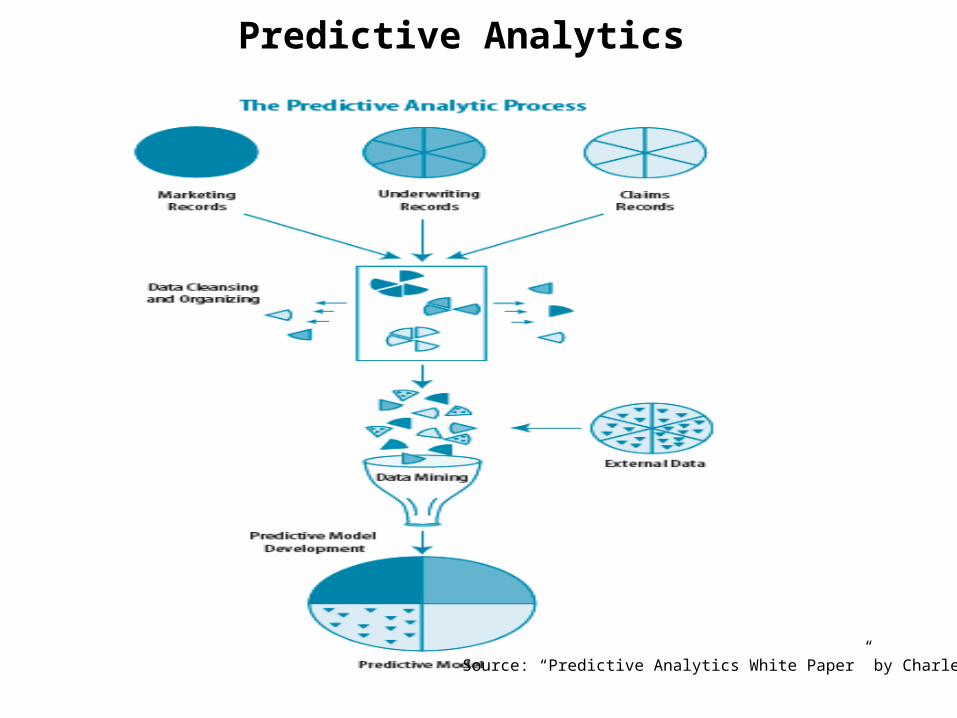
Predictive Analytics
Source: “Predictive Analytics White Paper” by Charles Nyce

Levels of Organizational Sophistication

Operationalization of Healthcare Analytics
• Real-time Health Care Analytics– Active knowledge system such as clinical decision support– Analyze clinical information at the point of care and support
health providers as they make prescriptive decisions– use existing patient data to generate case-specific advice in real
time
• Batch Health Care Analytics– Retrospectively evaluates population data sets. i.e. records of
patients in a large medical system, or claims data from an insured population
– Supplement disease management, population health management efforts
– secondary use of routinely collected data for research purposes
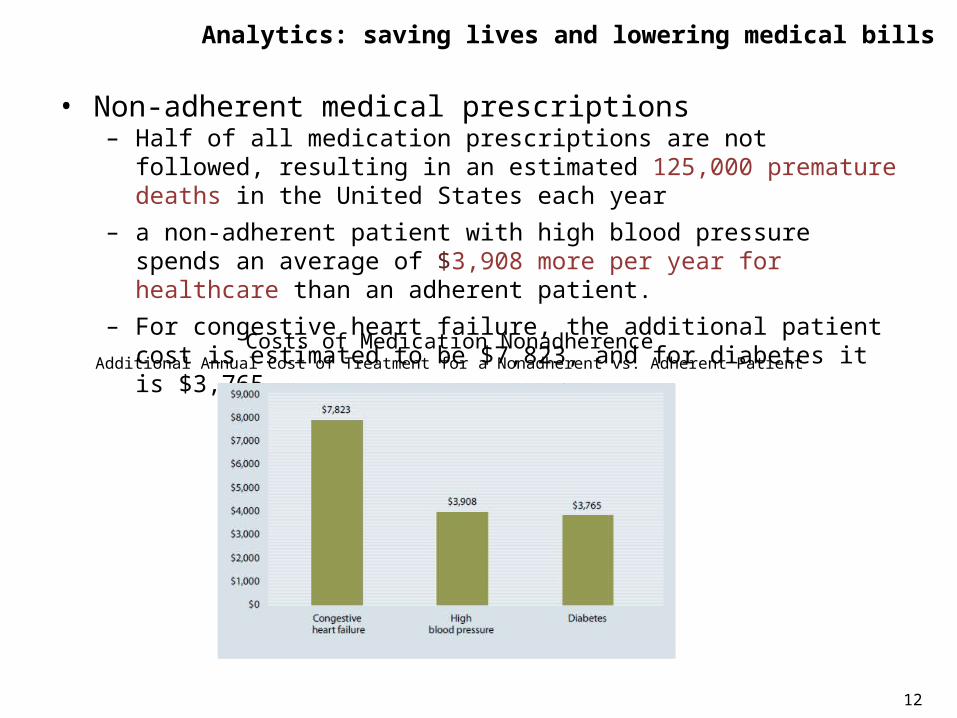
Predictive Analytics: saving lives and lowering medical bills
• Non-adherent medical prescriptions– Half of all medication prescriptions are not followed, resulting in an estimated
125,000 premature deaths in the United States each year– a non-adherent patient with high blood pressure spends an average of $3,908
more per year for healthcare than an adherent patient. – For congestive heart failure, the additional patient cost is estimated to be
$7,823, and for diabetes it is $3,765.
Costs of Medication NonadherenceAdditional Annual Cost of Treatment for a Nonadherent vs. Adherent Patient
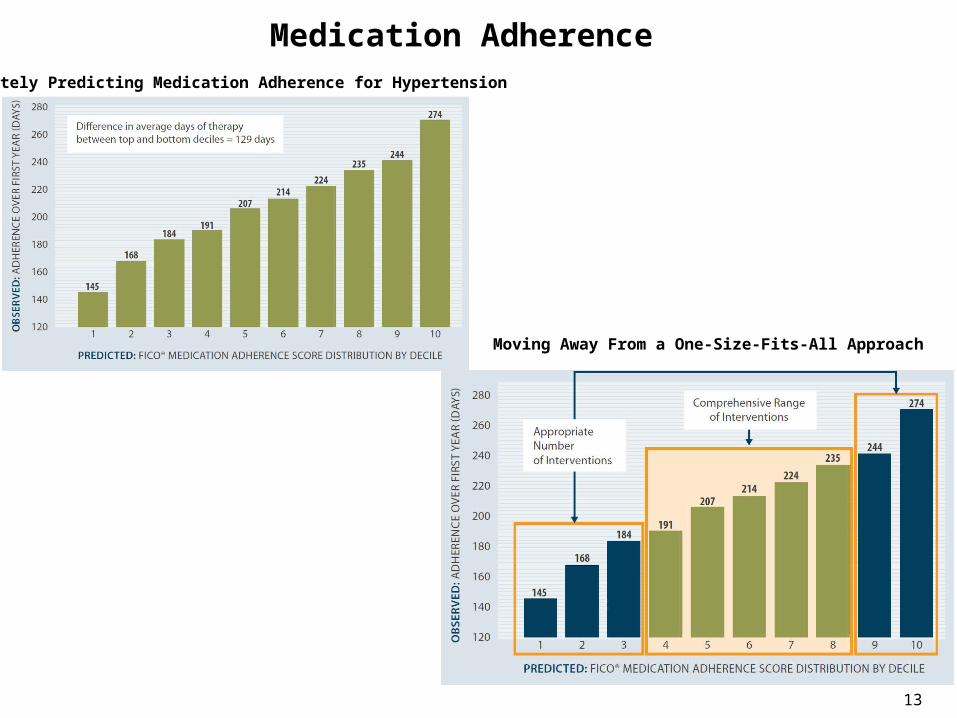
Medication AdherenceAccurately Predicting Medication Adherence for Hypertension
Moving Away From a One-Size-Fits-All Approach
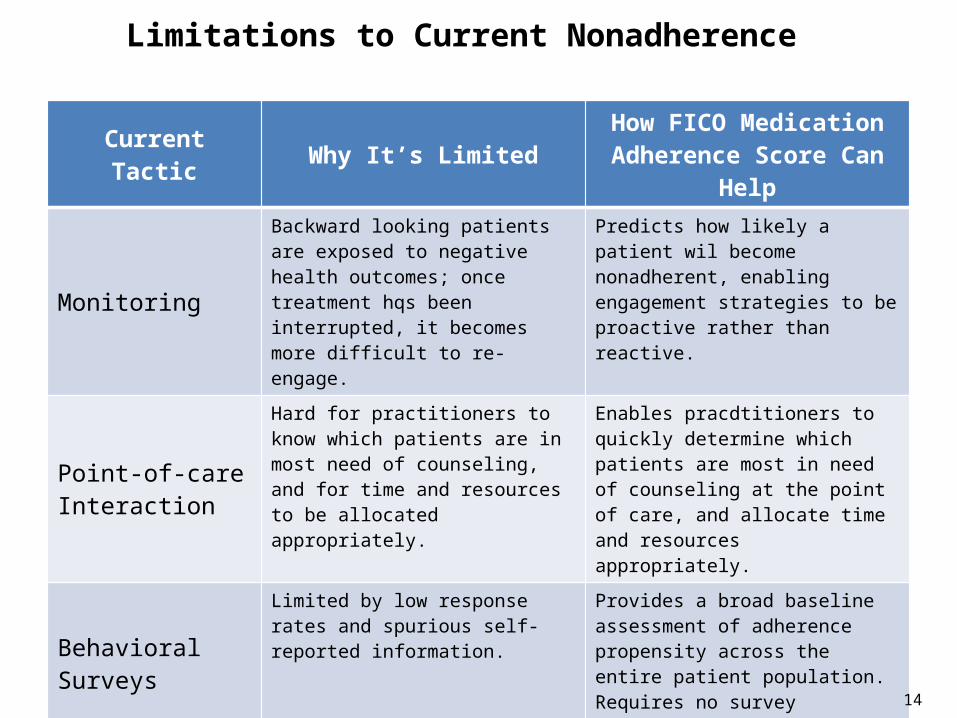
Limitations to Current Nonadherence
Current Tactic Why It’s Limited How FICO MedicationAdherence Score Can Help
MonitoringBackward looking patients are exposed to negative health outcomes; once treatment hqs been interrupted, it becomes more difficult to re-engage.
Predicts how likely a patient wil become nonadherent, enabling engagement strategies to be proactive rather than reactive.
Point-of-careInteraction
Hard for practitioners to know which patients are in most need of counseling, and for time and resources to be allocated appropriately.
Enables pracdtitioners to quickly determine which patients are most in need of counseling at the point of care, and allocate time and resources appropriately.
Behavioral SurveysLimited by low response rates and spurious self-reported information.
Provides a broad baseline assessment of adherence propensity across the entire patient population. Requires no survey particpation.
Patient EducationUsually conducted using a “one-size-fits-all approach, thus valuable resources are wasted on patients who take their medication on time and in full.
Ranks a patient population by probability of nonadherence, enabling more nuanced, segmented approach to patient engagement.
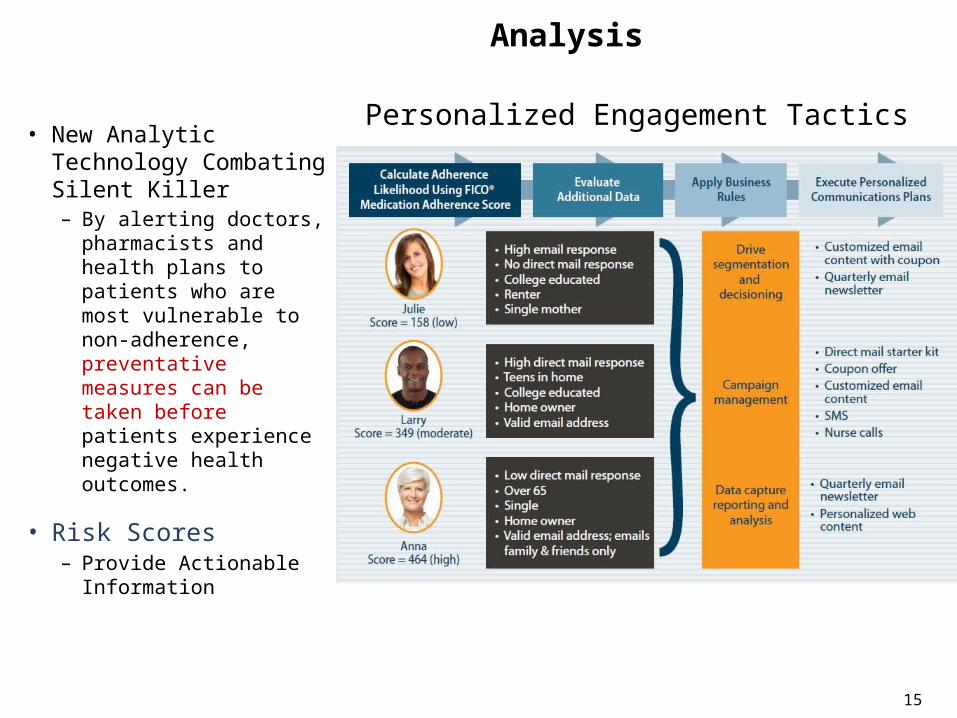
Predictive Analysis
• New Analytic Technology Combating Silent Killer– By alerting doctors,
pharmacists and health plans to patients who are most vulnerable to non-adherence, preventative measures can be taken before patients experience negative health outcomes.
• Risk Scores– Provide Actionable
Information
Personalized Engagement Tactics
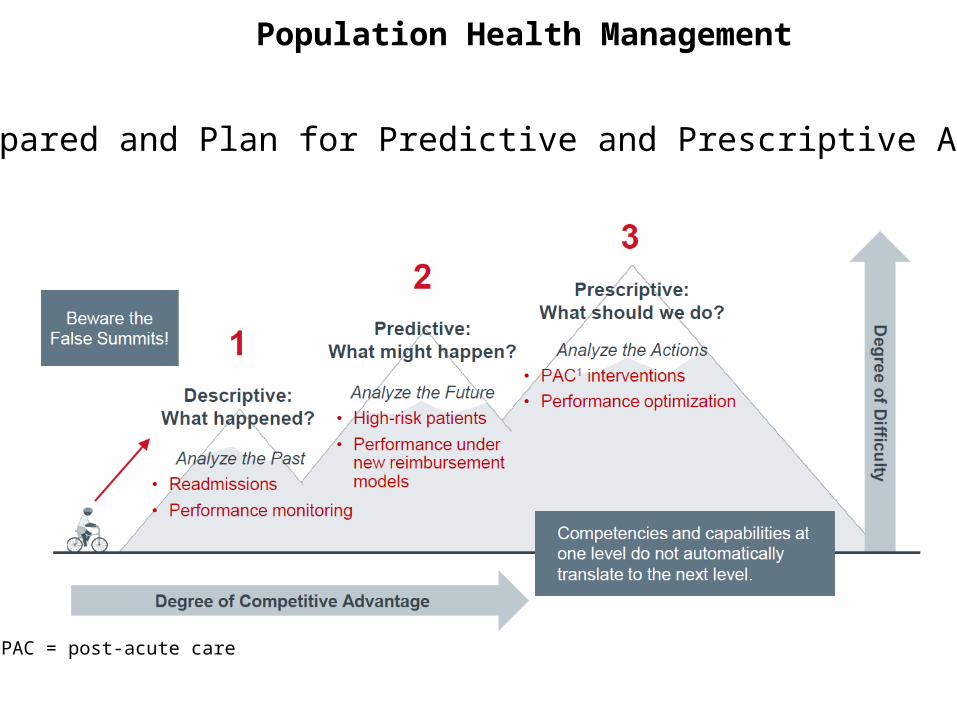
AnalytiPopulation Health Management
Be Prepared and Plan for Predictive and Prescriptive Analysis
PAC = post-acute care
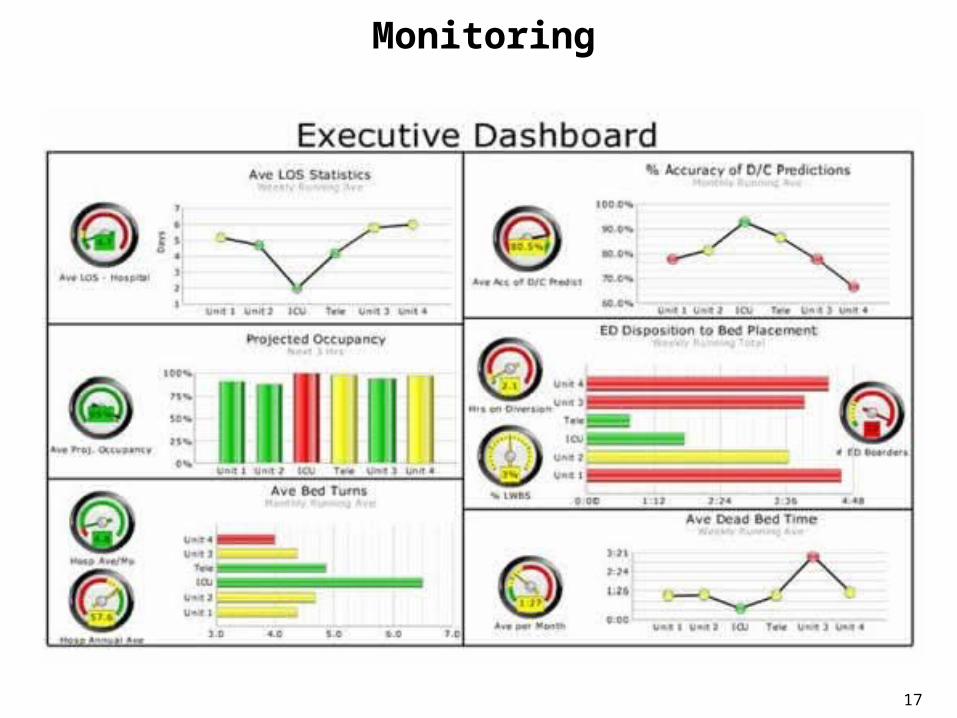
BuMonitoring
17
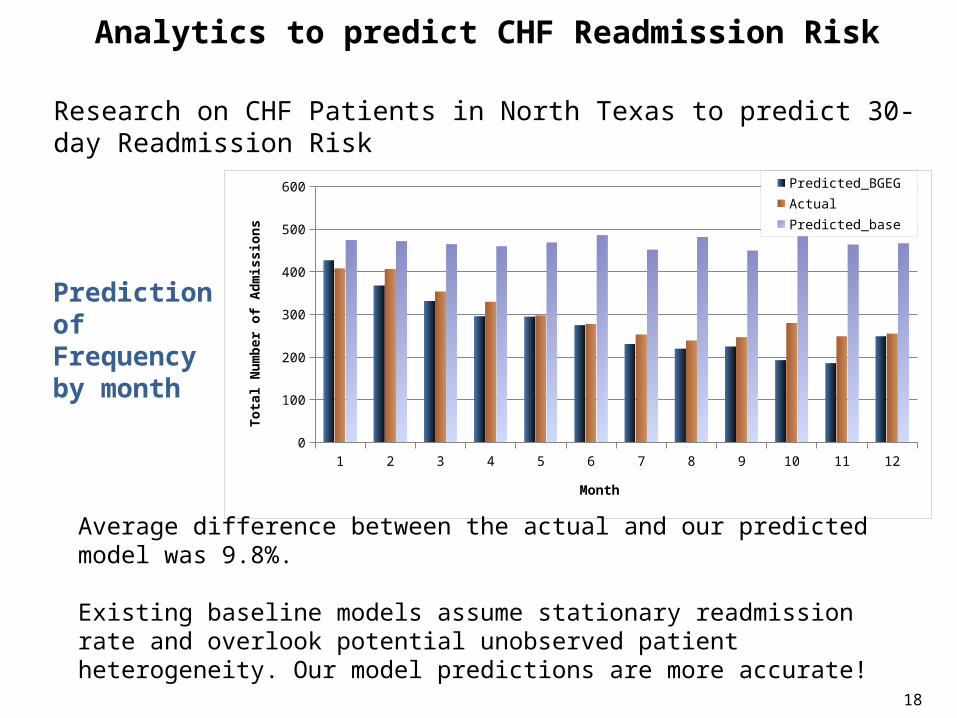
Analytics to predict CHF Readmission Risk
1 2 3 4 5 6 7 8 9 10 11 120
100
200
300
400
500
600 Predicted_BGEG Actual
Predicted_base
Month
Tota
l Num
ber o
f Adm
issio
ns
Prediction of Frequency by month
Research on CHF Patients in North Texas to predict 30-day Readmission Risk
Average difference between the actual and our predicted model was 9.8%.
Existing baseline models assume stationary readmission rate and overlook potential unobserved patient heterogeneity. Our model predictions are more accurate!
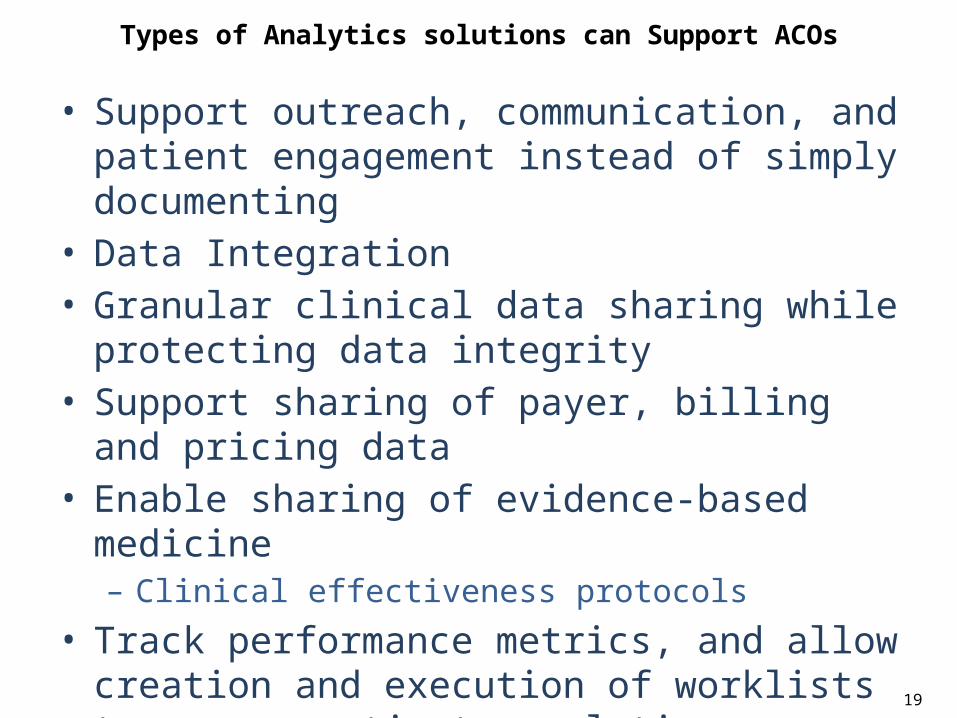
What Types of Analytics solutions can Support ACOs
• Support outreach, communication, and patient engagement instead of simply documenting
• Data Integration • Granular clinical data sharing while protecting data
integrity• Support sharing of payer, billing and pricing data• Enable sharing of evidence-based medicine– Clinical effectiveness protocols
• Track performance metrics, and allow creation and execution of worklists to manage patient populations– Identify patients who need special attention
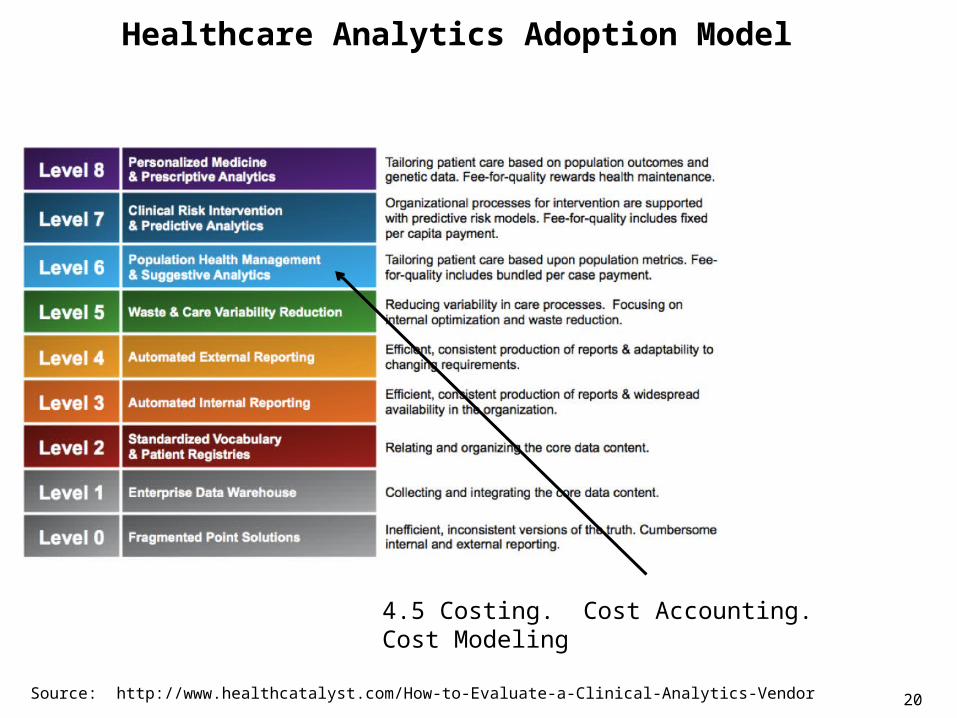
Source: http://www.healthcatalyst.com/How-to-Evaluate-a-Clinical-Analytics-Vendor
4.5 Costing. Cost Accounting. Cost Modeling
Healthcare Analytics Adoption Model
20
Managing Healthcare Operations
• Given variable patient volumes and service quality, how can hospital operations and planning issues be addressed?– Forecasting: How do you forecast the future patient demand or
transaction volumes?
– Capacity: How many beds, operating rooms or pieces of equipment are needed for different services?
– Staffing: How many nurses and other providers are needed for a particular shift in a unit?
– Scheduling: How to optimally schedule the minimally required staff for the particular shifts?
– Patient flow: What maximal patient delays are acceptable in order to achieve the system throughput goals?
– Resource allocation: What minimal amount of resources is required for different patient service lines?
• The MAYO Clinic is a leader in Process/Operations Analytics
Analytics for Business Activity Monitoring
• Business Activity Monitoring (BAM) is the continuous, real-time monitoring of business activity within an organization and the visualization of this activity in the form of electronic dashboards.
• BAM requires a critical mass of information technology driving foundational processes before it can be truly achieved.
• Business process maturity (including documentation) as well as standardization is also required.
• Business activity to be monitored:– Patient Wait Times– Test Result Turnaround Times– Patient Billing
• Bottom Line: Business Activity Monitoring will drive healthcare management and will be the primary tool for managers.
22
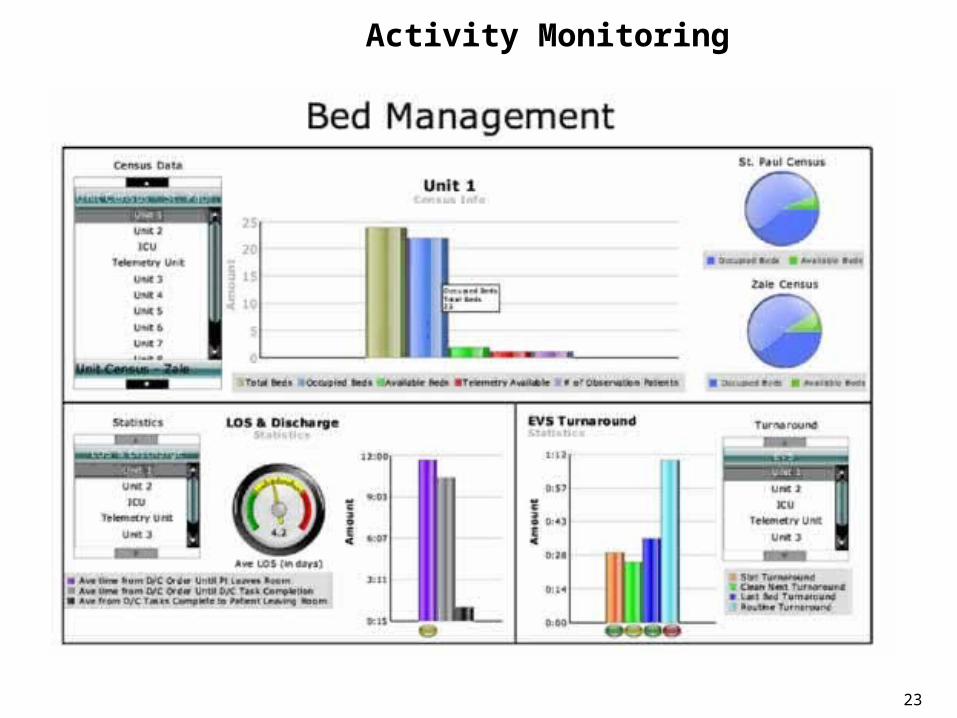
Business Activity Monitoring
23

Patient Care Analytics
• Patient care analytics are the application of business intelligence technologies to answer the questions of the effectiveness and cost of healthcare interventions as related to patient outcomes.
• The general analytics have always been available. The introduction of EMRs have created a wealth of data that was previously unavailable.
• The better data structure and consistency of use are making more of this vast EMR data accessible to business intelligence software.
• Healthcare reform will be accomplished one patient care analytic at a time.
• Bottom line: Patient Care analytics will drive changes in physician behavior and creation of healthcare processes that lead to improvement of patient outcomes.
24
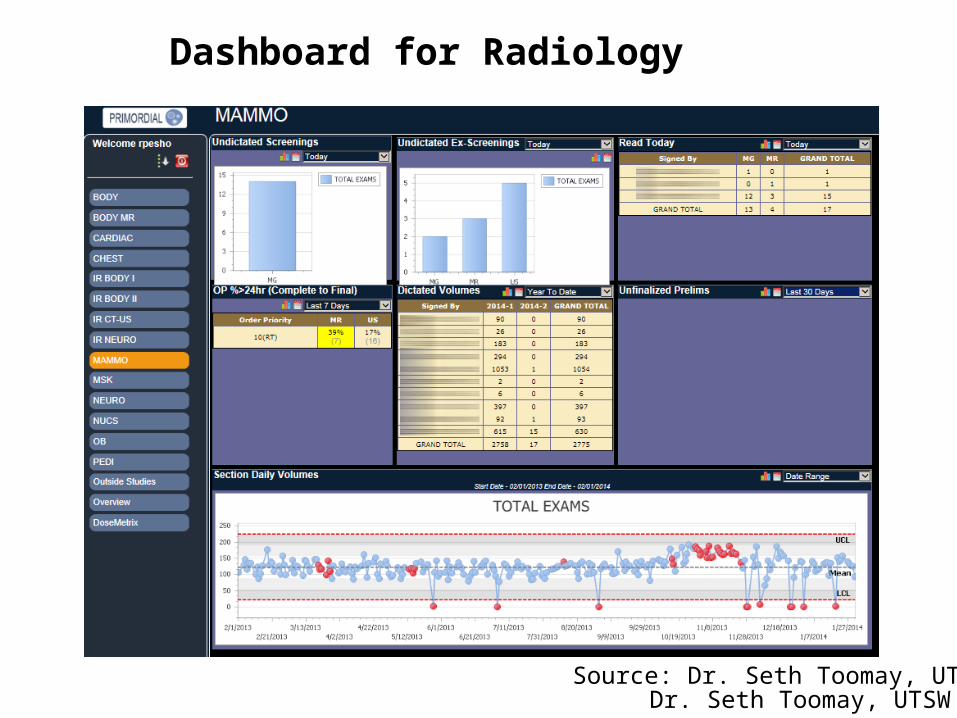
Dashboard for Radiology
Dr. Seth Toomay, UTSWSource: Dr. Seth Toomay, UTSW
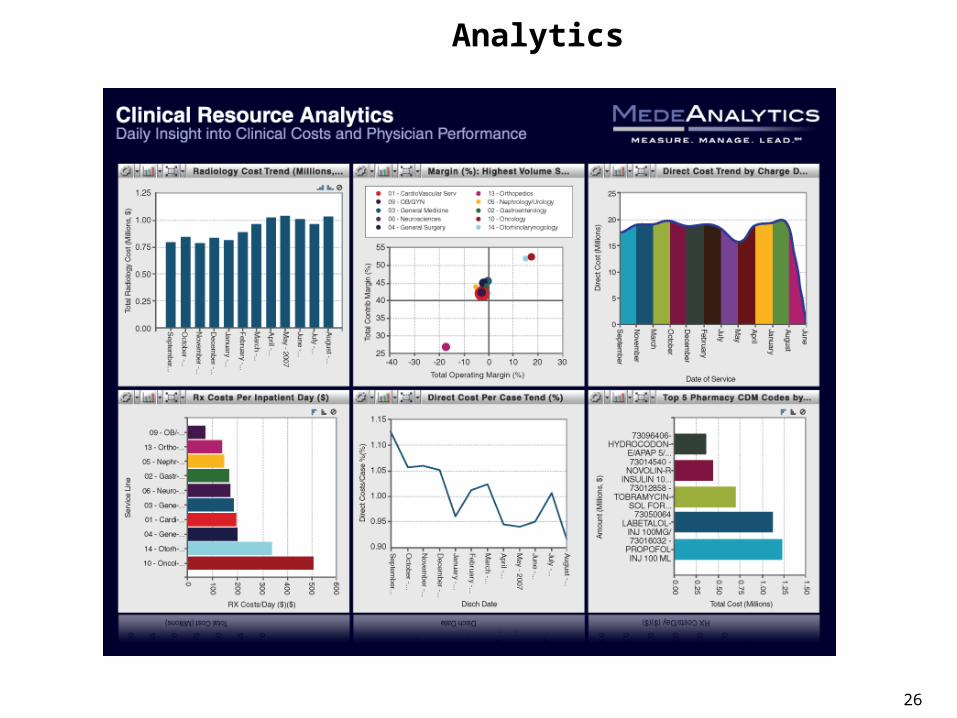
Patient Analytics
26
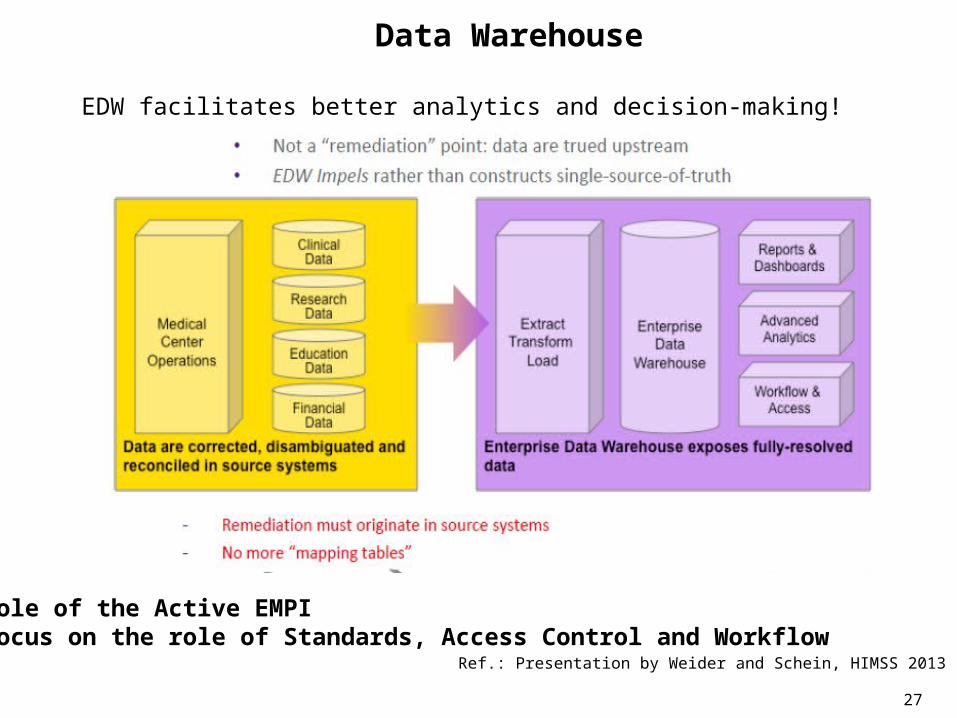
Role Data Warehouse
EDW facilitates better analytics and decision-making!
• Role of the Active EMPI• Focus on the role of Standards, Access Control and Workflow
Ref.: Presentation by Weider and Schein, HIMSS 2013
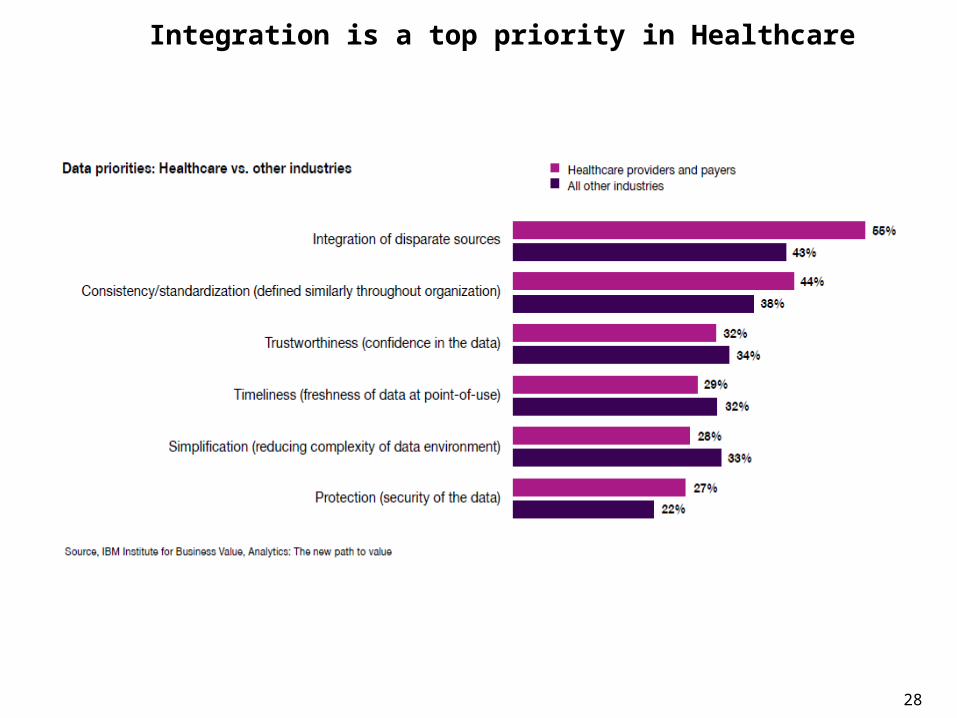
Data Integration is a top priority in Healthcare
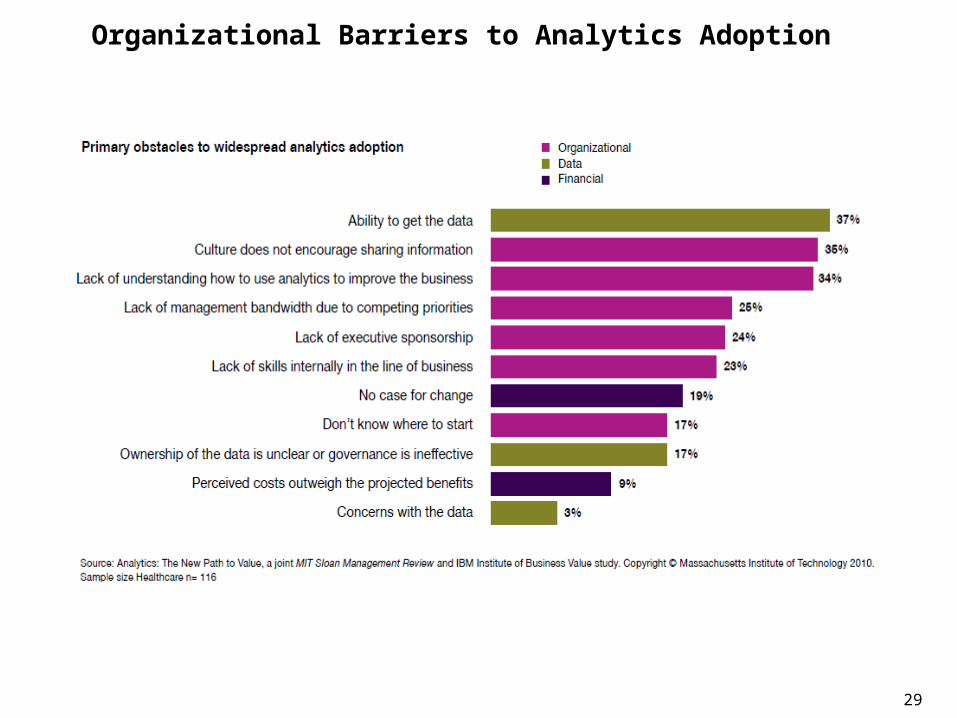
Organizational Barriers to Analytics Adoption