Yellow Social Media Report 2018. · Yellow Social Media Report 2018 – Businesses Nine in ten...
30
Yellow Social Media Report 2018. Part Two – Businesses.
Transcript of Yellow Social Media Report 2018. · Yellow Social Media Report 2018 – Businesses Nine in ten...
1 Yellow Social Media Report 2018 – Businesses.
Yellow Social Media Report 2018.Part Two – Businesses.
Yellow Social Media Report 2018 – Businesses.02
Table of Contents.
Executive Summary � � � � � � � � � � � � � � � � � � � � � � � � � � � � � � � � � � � � � � � � � � � � � � � � � � � � � � � 03
Methodology � � � � � � � � � � � � � � � � � � � � � � � � � � � � � � � � � � � � � � � � � � � � � � � � � � � � � � � � � � � � � � � � � � � � � � 05
Australian businesses and social media � � � � � � � � � � � � 06
Use of social media – summary � � � � � � � � � � � � � � � � � � � � � � � � � � � � � � � � � � � 08
Use of social media by industry sector
(small & medium businesses) � � � � � � � � � � � � � � � � � � � � � � � � � � � � � � � � � � � � � � � 10
Use of social media by location
(small & medium businesses) � � � � � � � � � � � � � � � � � � � � � � � � � � � � � � � � � � � � � � � 11
Main reason for using social media � � � � � � � � � � � � � � � � � � � � � � � � � � � � � 12
Most frustrating aspect of using social media � � � � � � � � � � 13
Social media uses � � � � � � � � � � � � � � � � � � � � � � � � � � � � � � � � � � � � � � � � � � � � � � � � � � � � � � � � � � � 14
Advertising on social media � � � � � � � � � � � � � � � � � � � � � � � � � � � � � � � � � � � � � � � � � � 16
Who is responsible for a business’
social media presence? � � � � � � � � � � � � � � � � � � � � � � � � � � � � � � � � � � � � � � � � � � � � � � � � � 17
How often do businesses update
their social media? � � � � � � � � � � � � � � � � � � � � � � � � � � � � � � � � � � � � � � � � � � � � � � � � � � � � � � � � � � 18
How is traffic driven to a business’
social media presence? � � � � � � � � � � � � � � � � � � � � � � � � � � � � � � � � � � � � � � � � � � � � � � � � � 19
Business investment in social media � � � � � � � � � � � � � � � � � � � � � � � � � � 20
Percentage of marketing budget
allocated to social media � � � � � � � � � � � � � � � � � � � � � � � � � � � � � � � � � � � � � � � � � � � � � � � 21
How businesses measure success
of their social media investment? � � � � � � � � � � � � � � � � � � � � � � � � � � � � � � � � 22
Do businesses have a strategic
plan for social media? � � � � � � � � � � � � � � � � � � � � � � � � � � � � � � � � � � � � � � � � � � � � � � � � � � � � 26
Expectations for the next 12 months � � � � � � � � � � � � � � � � � � � � � � � � � � 27
About Yellow � � � � � � � � � � � � � � � � � � � � � � � � � � � � � � � � � � � � � � � � � � � � � � � � � � � � � � � � � � � � � � � � 29
Yellow Social Media Report 2018 – Businesses.03
Executive summary.
About this Yellow Social Media Report – Business Survey.
The Yellow Social Media Report contains the results of research which commenced in 2011 surveying Australian consumers and businesses on how social media channels are being used�
These findings help Australian businesses stay connected with consumer social media trends� Yellow, as a market leader in providing social media services to Australian businesses large and small, is a part of the Sensis family and we have changed the name of the report in recognition of their expertise�
This year, the report has been released in two parts, with this edition focusing on the results of the business survey� Part One features the consumer survey results�
The business survey involves 1,100 telephone interviews with small, medium and large businesses across the nation� More details on the methodology are provided further on in this report�
For the purposes of this report, the term social media refers to:
• Social networking websites such as Facebook, Google+, LinkedIn, Twitter, Instagram
• Online blogs and online rating and review mechanisms
The findings detailed in this report aim to help Australian businesses to make more informed decisions about how to use these channels to engage with consumers�
Australian businesses and social media.
Sales and marketing purposes remain the key catalysts behind using social media for both SMBs and large businesses� Providing a line of contact is also influential�
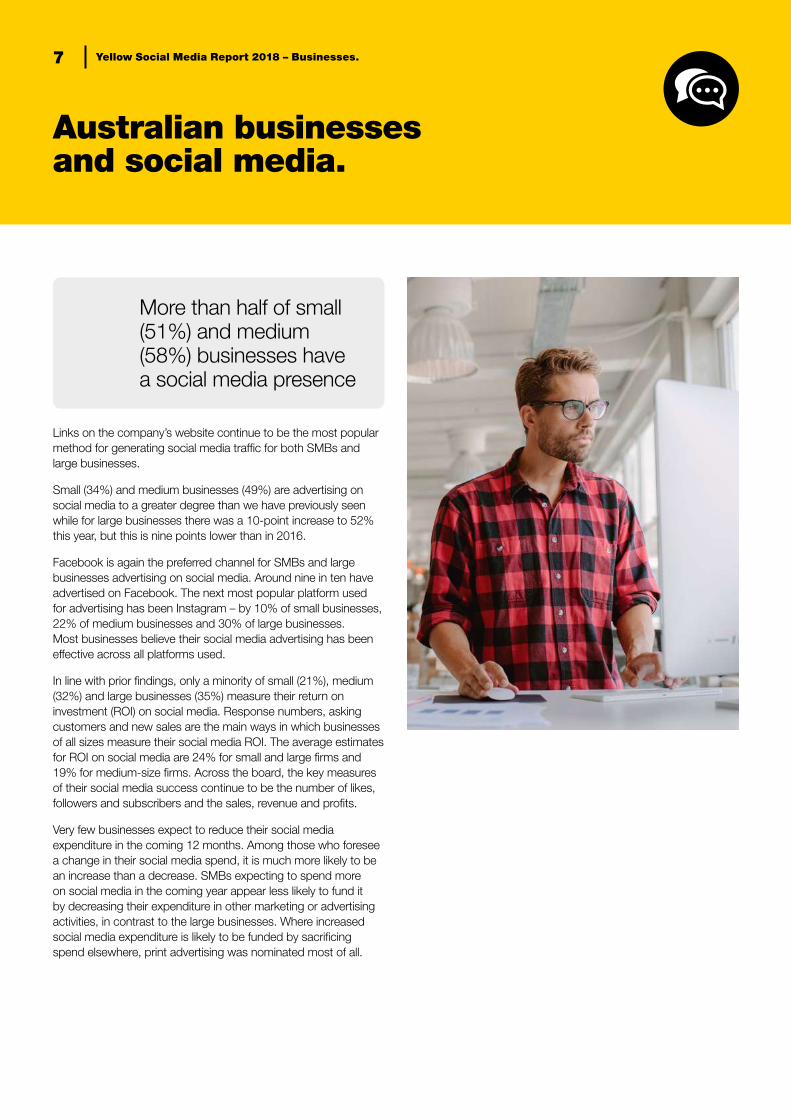
The proportion of businesses with a social media presence has reached the highest level recorded� More than half the small (51%) and medium businesses (58%) have a social media presence, while for large businesses the incidence is 85%�
Among SMBs without a social media presence, 12% of the small businesses and 5% of the medium businesses intend to obtain one in the next year� For those businesses reluctant to be on social media, the dominant barrier is a perceived lack of benefit�
Just over six in ten SMBs and large firms believe that social media will contribute to increased sales in the next year� The average expected sales increase is 11% for small firms, 15% for medium and 16% for large firms�
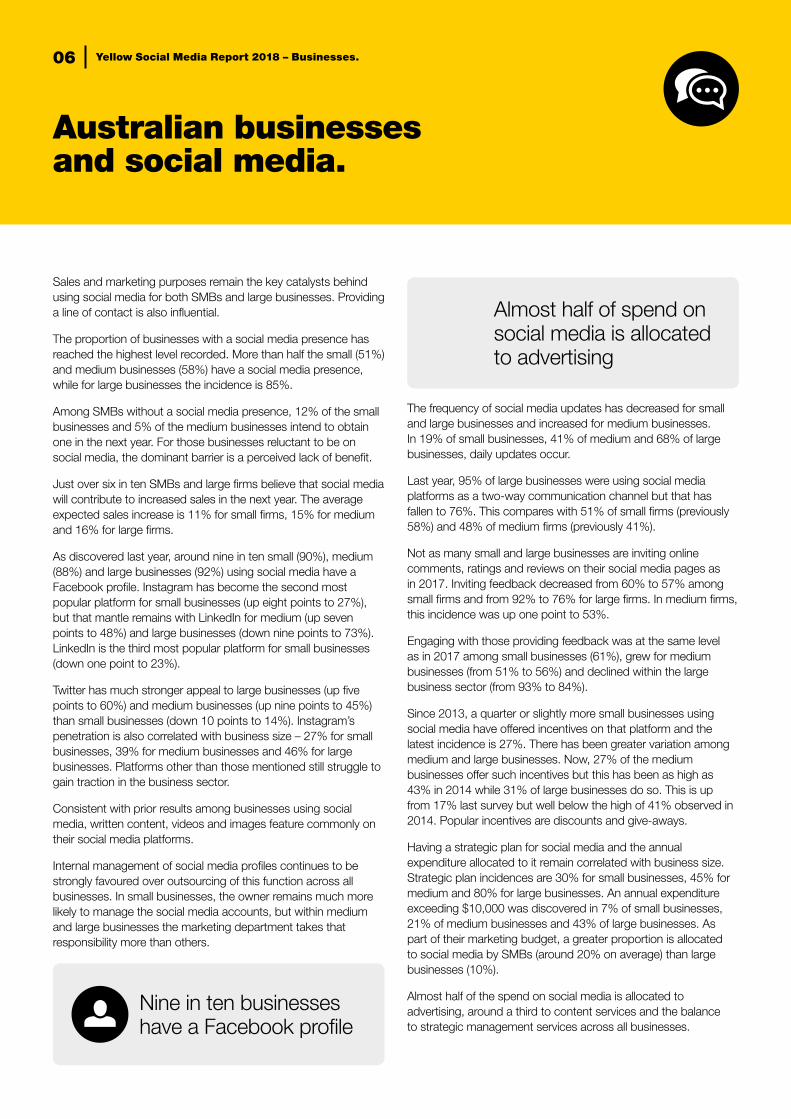
As discovered last year, around nine in ten small (90%), medium (88%) and large businesses (92%) using social media have a Facebook profile� Instagram has become the second most popular platform for small businesses (up eight points to 27%), but that mantle remains with LinkedIn for medium (up seven points to 48%) and large businesses (down nine points to 73%)� LinkedIn is the third most popular platform for small businesses (down one point to 23%)�
Twitter has much stronger appeal to large businesses (up five points to 60%) and medium businesses (up nine points to 45%) than small businesses (down 10 points to 14%)� Instagram’s penetration is also correlated with business size – 27% for small businesses, 39% for medium businesses and 46% for large businesses� Platforms other than those mentioned still struggle to gain traction in the business sector�
Consistent with prior results among businesses using social media, written content, videos and images feature commonly on their social media platforms�
Internal management of social media profiles continues to be favoured� In small businesses, the owner remains much more likely to manage the social media accounts, but within medium and large businesses the marketing department takes that responsibility more than others�
The frequency of social media updates has decreased for small and large businesses and increased for medium businesses� In 19% of small businesses, 41% of medium and 68% of large businesses, daily updates occur�
Last year, 95% of large businesses were using social media platforms as a two-way communication channel but that has fallen to 76%� This compares with 51% of small firms (previously 58%) and 48% of medium firms (previously 41%)�
Not as many small and large businesses are inviting online comments, ratings and reviews on their social media pages as in 2017� Inviting feedback decreased from 60% to 57% among small firms and from 92% to 76% for large firms� In medium firms, this incidence was up one point to 53%�
1,100 Australian businesses surveyed
Businesses with a social media presence has hit an all-time high
Yellow Social Media Report 2018 – Businesses.04
Executive summary.
Engaging with those providing feedback was at the same level as in 2017 among small businesses (61%), grew for medium businesses (from 51% to 56%) and declined within the large business sector (from 93% to 84%)�
Since 2013, a quarter or slightly more small businesses using social media have offered incentives on that platform and the latest incidence is 27%� There has been greater variation among medium and large businesses� Now, 27% of the medium businesses offer such incentives but this has been as high as 43% in 2014 while 31% of large businesses do so� This is up from 17% last survey but well below the high of 41% observed in 2014� Popular incentives are discounts and give-aways�
Having a strategic plan for social media and the annual expenditure allocated to it remain correlated with business size� Strategic plan incidences are 30% for small businesses, 45% for medium and 80% for large businesses� An annual expenditure exceeding $10,000 was discovered in 7% of small businesses, 21% of medium businesses and 43% of large businesses� As part of their marketing budget, a greater proportion is allocated to social media by SMBs (around 20% on average) than large businesses (10%)�
Almost half of the spend on social media is allocated to advertising, around a third to content services and the balance to strategic management services across all businesses�
Links on the company’s website continue to be the most popular method for generating social media traffic for both SMBs and large businesses�
Small (34%) and medium businesses (49%) are advertising on social media to a greater degree than we have previously seen while for large businesses there was a 10-point increase to 52% this year, but this is nine points lower than in 2016�
Facebook is again the preferred channel for SMBs and large businesses advertising on social media� Around nine in ten have advertised on Facebook� The next most popular platform used for advertising has been Instagram – by 10% of small businesses, 22% of medium businesses and 30% of large businesses� Most businesses believe their social media advertising has been effective across all platforms used�
In line with prior findings, only a minority of small (21%), medium (32%) and large businesses (35%) measure their return on investment (ROI) on social media� Response numbers, asking customers and new sales are the main ways in which businesses of all sizes measure their social media ROI� The average estimates for ROI on social media are 24% for small and large firms and 19% for medium-size firms� Across the board, the key measures of their social media success continue to be the number of likes, followers and subscribers and the sales, revenue and profits�
Very few businesses expect to reduce their social media expenditure in the coming 12 months� Among those who foresee a change in their social media spend, it is much more likely to be an increase than a decrease� SMBs expecting to spend more on social media in the coming year appear less likely to fund it by decreasing their expenditure in other marketing or advertising activities, in contrast to the large businesses� Where increased social media expenditure is likely to be funded by sacrificing spend elsewhere�
Facebook is businesses leading social media platform
Yellow Social Media Report 2018 – Businesses.05
Methodology.
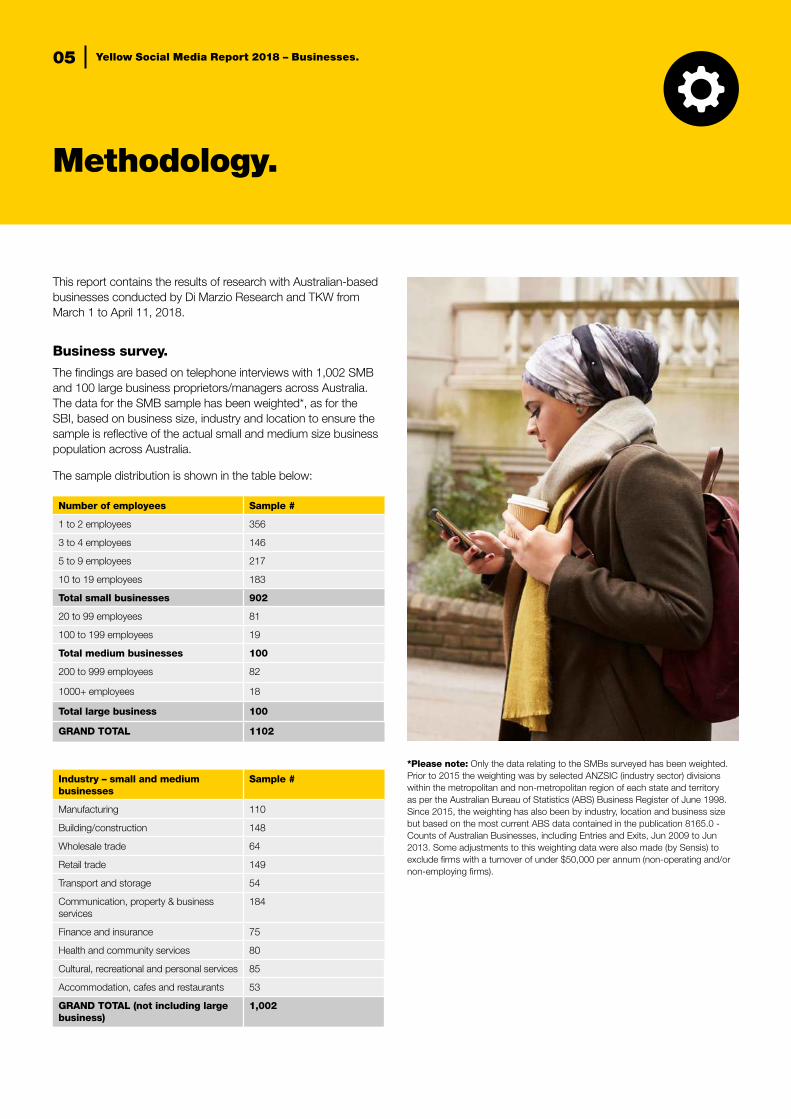
This report contains the results of research with Australian-based businesses conducted by Di Marzio Research and TKW from March 1 to April 11, 2018�
Business survey.
The findings are based on telephone interviews with 1,002 SMB and 100 large business proprietors/managers across Australia� The data for the SMB sample has been weighted*, as for the SBI, based on business size, industry and location to ensure the sample is reflective of the actual small and medium size business population across Australia�
The sample distribution is shown in the table below:
Number of employees Sample #
1 to 2 employees 356
3 to 4 employees 146
5 to 9 employees 217
10 to 19 employees 183
Total small businesses 902
20 to 99 employees 81
100 to 199 employees 19
Total medium businesses 100
200 to 999 employees 82
1000+ employees 18
Total large business 100
GRAND TOTAL 1102
Industry – small and medium businesses
Sample #
Manufacturing 110
Building/construction 148
Wholesale trade 64
Retail trade 149
Transport and storage 54
Communication, property & business services
184
Finance and insurance 75
Health and community services 80
Cultural, recreational and personal services 85
Accommodation, cafes and restaurants 53
GRAND TOTAL (not including large business)
1,002
*Please note: Only the data relating to the SMBs surveyed has been weighted� Prior to 2015 the weighting was by selected ANZSIC (industry sector) divisions within the metropolitan and non-metropolitan region of each state and territory as per the Australian Bureau of Statistics (ABS) Business Register of June 1998� Since 2015, the weighting has also been by industry, location and business size but based on the most current ABS data contained in the publication 8165�0 - Counts of Australian Businesses, including Entries and Exits, Jun 2009 to Jun 2013� Some adjustments to this weighting data were also made (by Sensis) to exclude firms with a turnover of under $50,000 per annum (non-operating and/or non-employing firms)�
Yellow Social Media Report 2018 – Businesses.
Nine in ten businesses have a Facebook profile
06
Australian businesses and social media.
Sales and marketing purposes remain the key catalysts behind using social media for both SMBs and large businesses� Providing a line of contact is also influential�
The proportion of businesses with a social media presence has reached the highest level recorded� More than half the small (51%) and medium businesses (58%) have a social media presence, while for large businesses the incidence is 85%�
Among SMBs without a social media presence, 12% of the small businesses and 5% of the medium businesses intend to obtain one in the next year� For those businesses reluctant to be on social media, the dominant barrier is a perceived lack of benefit�
Just over six in ten SMBs and large firms believe that social media will contribute to increased sales in the next year� The average expected sales increase is 11% for small firms, 15% for medium and 16% for large firms�
As discovered last year, around nine in ten small (90%), medium (88%) and large businesses (92%) using social media have a Facebook profile� Instagram has become the second most popular platform for small businesses (up eight points to 27%), but that mantle remains with LinkedIn for medium (up seven points to 48%) and large businesses (down nine points to 73%)� LinkedIn is the third most popular platform for small businesses (down one point to 23%)�
Twitter has much stronger appeal to large businesses (up five points to 60%) and medium businesses (up nine points to 45%) than small businesses (down 10 points to 14%)� Instagram’s penetration is also correlated with business size – 27% for small businesses, 39% for medium businesses and 46% for large businesses� Platforms other than those mentioned still struggle to gain traction in the business sector�
Consistent with prior results among businesses using social media, written content, videos and images feature commonly on their social media platforms�
Internal management of social media profiles continues to be strongly favoured over outsourcing of this function across all businesses� In small businesses, the owner remains much more likely to manage the social media accounts, but within medium and large businesses the marketing department takes that responsibility more than others�
The frequency of social media updates has decreased for small and large businesses and increased for medium businesses� In 19% of small businesses, 41% of medium and 68% of large businesses, daily updates occur�
Last year, 95% of large businesses were using social media platforms as a two-way communication channel but that has fallen to 76%� This compares with 51% of small firms (previously 58%) and 48% of medium firms (previously 41%)�
Not as many small and large businesses are inviting online comments, ratings and reviews on their social media pages as in 2017� Inviting feedback decreased from 60% to 57% among small firms and from 92% to 76% for large firms� In medium firms, this incidence was up one point to 53%�
Engaging with those providing feedback was at the same level as in 2017 among small businesses (61%), grew for medium businesses (from 51% to 56%) and declined within the large business sector (from 93% to 84%)�
Since 2013, a quarter or slightly more small businesses using social media have offered incentives on that platform and the latest incidence is 27%� There has been greater variation among medium and large businesses� Now, 27% of the medium businesses offer such incentives but this has been as high as 43% in 2014 while 31% of large businesses do so� This is up from 17% last survey but well below the high of 41% observed in 2014� Popular incentives are discounts and give-aways�
Having a strategic plan for social media and the annual expenditure allocated to it remain correlated with business size� Strategic plan incidences are 30% for small businesses, 45% for medium and 80% for large businesses� An annual expenditure exceeding $10,000 was discovered in 7% of small businesses, 21% of medium businesses and 43% of large businesses� As part of their marketing budget, a greater proportion is allocated to social media by SMBs (around 20% on average) than large businesses (10%)�
Almost half of the spend on social media is allocated to advertising, around a third to content services and the balance to strategic management services across all businesses�
Almost half of spend on social media is allocated to advertising
7 Yellow Social Media Report 2018 – Businesses.
Links on the company’s website continue to be the most popular method for generating social media traffic for both SMBs and large businesses�
Small (34%) and medium businesses (49%) are advertising on social media to a greater degree than we have previously seen while for large businesses there was a 10-point increase to 52% this year, but this is nine points lower than in 2016�
Facebook is again the preferred channel for SMBs and large businesses advertising on social media� Around nine in ten have advertised on Facebook� The next most popular platform used for advertising has been Instagram – by 10% of small businesses, 22% of medium businesses and 30% of large businesses� Most businesses believe their social media advertising has been effective across all platforms used�
In line with prior findings, only a minority of small (21%), medium (32%) and large businesses (35%) measure their return on investment (ROI) on social media� Response numbers, asking customers and new sales are the main ways in which businesses of all sizes measure their social media ROI� The average estimates for ROI on social media are 24% for small and large firms and 19% for medium-size firms� Across the board, the key measures of their social media success continue to be the number of likes, followers and subscribers and the sales, revenue and profits�
Very few businesses expect to reduce their social media expenditure in the coming 12 months� Among those who foresee a change in their social media spend, it is much more likely to be an increase than a decrease� SMBs expecting to spend more on social media in the coming year appear less likely to fund it by decreasing their expenditure in other marketing or advertising activities, in contrast to the large businesses� Where increased social media expenditure is likely to be funded by sacrificing spend elsewhere, print advertising was nominated most of all�
Australian businesses and social media.
More than half of small (51%) and medium (58%) businesses have a social media presence
Yellow Social Media Report 2018 – Businesses.08
Use of social media – summary.
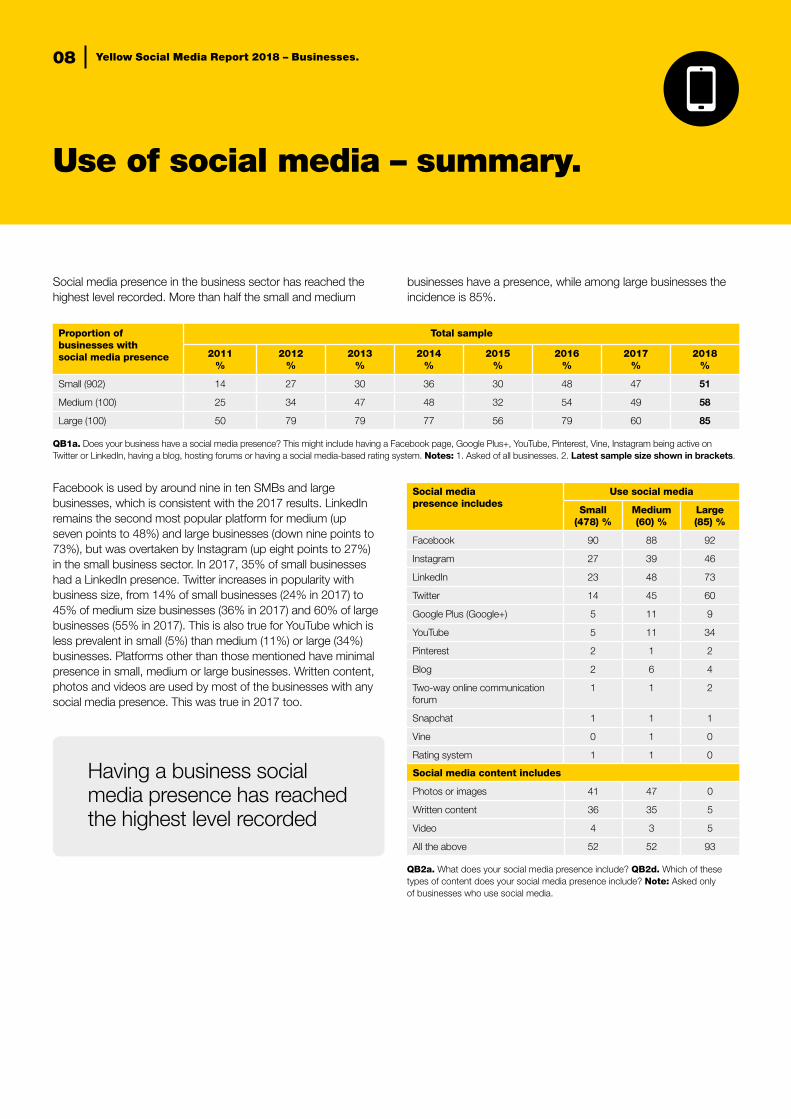
Social media presence in the business sector has reached the highest level recorded� More than half the small and medium
businesses have a presence, while among large businesses the incidence is 85%�
Facebook is used by around nine in ten SMBs and large businesses, which is consistent with the 2017 results� LinkedIn remains the second most popular platform for medium (up seven points to 48%) and large businesses (down nine points to 73%), but was overtaken by Instagram (up eight points to 27%) in the small business sector� In 2017, 35% of small businesses had a LinkedIn presence� Twitter increases in popularity with business size, from 14% of small businesses (24% in 2017) to 45% of medium size businesses (36% in 2017) and 60% of large businesses (55% in 2017)� This is also true for YouTube which is less prevalent in small (5%) than medium (11%) or large (34%) businesses� Platforms other than those mentioned have minimal presence in small, medium or large businesses� Written content, photos and videos are used by most of the businesses with any social media presence� This was true in 2017 too�
QB2a. What does your social media presence include? QB2d. Which of these types of content does your social media presence include? Note: Asked only of businesses who use social media�
Proportion of businesses with social media presence
Total sample
2011 %
2012 %
2013 %
2014 %
2015 %
2016 %
2017 %
2018 %
Small (902) 14 27 30 36 30 48 47 51
Medium (100) 25 34 47 48 32 54 49 58
Large (100) 50 79 79 77 56 79 60 85
QB1a. Does your business have a social media presence? This might include having a Facebook page, Google Plus+, YouTube, Pinterest, Vine, Instagram being active on Twitter or LinkedIn, having a blog, hosting forums or having a social media-based rating system� Notes: 1� Asked of all businesses� 2� Latest sample size shown in brackets�
Social media presence includes
Use social media
Small (478) %
Medium (60) %
Large (85) %
Facebook 90 88 92
Instagram 27 39 46
LinkedIn 23 48 73
Twitter 14 45 60
Google Plus (Google+) 5 11 9
YouTube 5 11 34
Pinterest 2 1 2
Blog 2 6 4
Two-way online communication forum
1 1 2
Snapchat 1 1 1
Vine 0 1 0
Rating system 1 1 0
Social media content includes
Photos or images 41 47 0
Written content 36 35 5
Video 4 3 5
All the above 52 52 93
Having a business social media presence has reached the highest level recorded
Yellow Social Media Report 2018 – Businesses.9
Use of social media – summary.
Among businesses not using social media� 3% of small businesses and 7% of medium businesses had a presence before� Among the small number able to answer this question, the key reason for removal is that social media took too much time to manage� Only three businesses were found to have any social media pages that are no longer updated�
Twelve percent of small businesses, 5% of medium businesses and 27% of the few large businesses not currently using social media expect to adopt it in the next year� Those without plans to take up social media do not see a benefit for their individual business�
QB1b. Has your business had a social media presence in the past? QB1d. Are you planning on getting a social media presence in the next 12 months? Notes: 1� Asked only of businesses who don’t use Social media� 2� *Caution – small sub-sample size�
QB1e. Why not? Notes: 1� Asked only of businesses who don’t intend to have a social media presence in the next year� 2� *Caution – small sub-sample size�
Proportion of businesses that…
Don’t use social media
Small (424) %
Medium (40) %
Large (15*) %
Have had a social media presence in the past
3 7 0
Intend to get a social media presence in the next year
12 5 27
Reasons not planning to have social media presence in next year
Don’t intend to use social media in next year
Small (381) %
Medium (38) %
Large (11*) %
Don’t see any benefit 59 39 73
Takes too much time 15 10 45
Don’t understand social media 5 6 9
Too expensive 1 0 0
Too risky 2 9 0
Other 27 45 9
Yellow Social Media Report 2018 – Businesses.10
Use of social media by industry sector (small & medium businesses).
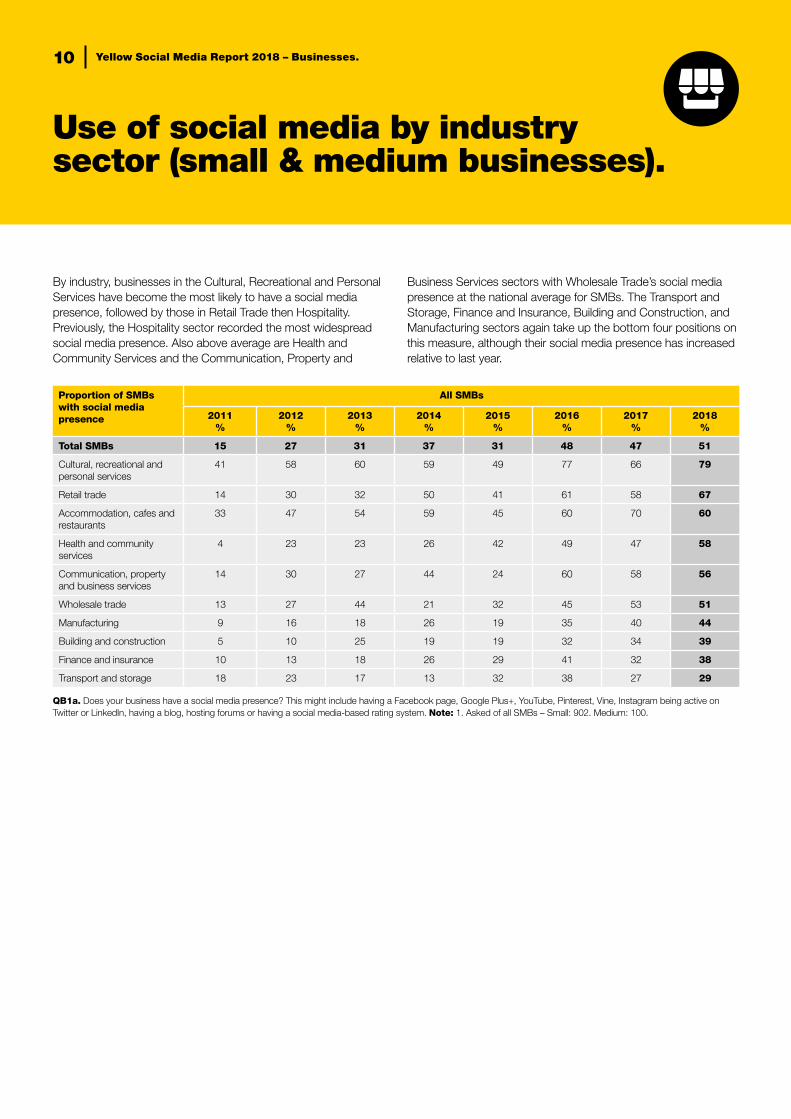
By industry, businesses in the Cultural, Recreational and Personal Services have become the most likely to have a social media presence, followed by those in Retail Trade then Hospitality� Previously, the Hospitality sector recorded the most widespread social media presence� Also above average are Health and Community Services and the Communication, Property and
Business Services sectors with Wholesale Trade’s social media presence at the national average for SMBs� The Transport and Storage, Finance and Insurance, Building and Construction, and Manufacturing sectors again take up the bottom four positions on this measure, although their social media presence has increased relative to last year�
Proportion of SMBs with social media presence
All SMBs
2011 %
2012 %
2013 %
2014 %
2015 %
2016 %
2017 %
2018 %
Total SMBs 15 27 31 37 31 48 47 51
Cultural, recreational and personal services
41 58 60 59 49 77 66 79
Retail trade 14 30 32 50 41 61 58 67
Accommodation, cafes and restaurants
33 47 54 59 45 60 70 60
Health and community services
4 23 23 26 42 49 47 58
Communication, property and business services
14 30 27 44 24 60 58 56
Wholesale trade 13 27 44 21 32 45 53 51
Manufacturing 9 16 18 26 19 35 40 44
Building and construction 5 10 25 19 19 32 34 39
Finance and insurance 10 13 18 26 29 41 32 38
Transport and storage 18 23 17 13 32 38 27 29
QB1a. Does your business have a social media presence? This might include having a Facebook page, Google Plus+, YouTube, Pinterest, Vine, Instagram being active on Twitter or LinkedIn, having a blog, hosting forums or having a social media-based rating system� Note: 1� Asked of all SMBs – Small: 902� Medium: 100�
Yellow Social Media Report 2018 – Businesses.11
Use of social media by location (small & medium businesses).
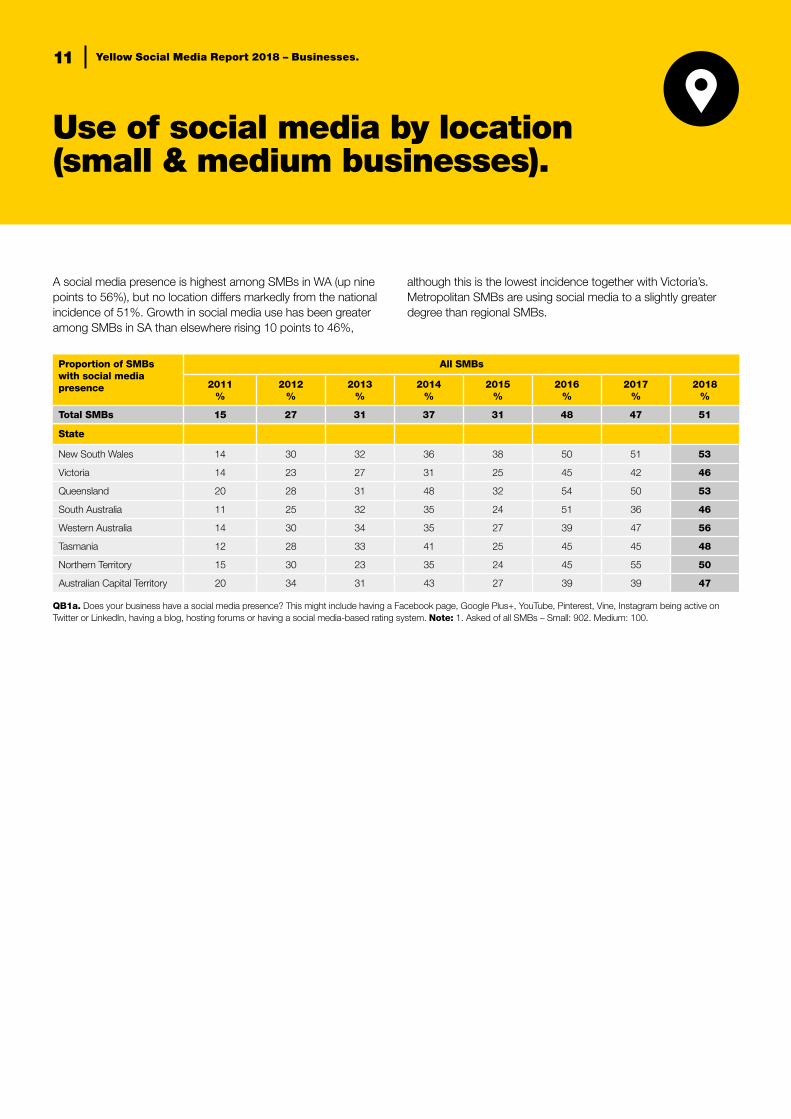
A social media presence is highest among SMBs in WA (up nine points to 56%), but no location differs markedly from the national incidence of 51%� Growth in social media use has been greater among SMBs in SA than elsewhere rising 10 points to 46%,
although this is the lowest incidence together with Victoria’s� Metropolitan SMBs are using social media to a slightly greater degree than regional SMBs�
Proportion of SMBs with social media presence
All SMBs
2011 %
2012 %
2013 %
2014 %
2015 %
2016 %
2017 %
2018 %
Total SMBs 15 27 31 37 31 48 47 51
State
New South Wales 14 30 32 36 38 50 51 53
Victoria 14 23 27 31 25 45 42 46
Queensland 20 28 31 48 32 54 50 53
South Australia 11 25 32 35 24 51 36 46
Western Australia 14 30 34 35 27 39 47 56
Tasmania 12 28 33 41 25 45 45 48
Northern Territory 15 30 23 35 24 45 55 50
Australian Capital Territory 20 34 31 43 27 39 39 47
QB1a. Does your business have a social media presence? This might include having a Facebook page, Google Plus+, YouTube, Pinterest, Vine, Instagram being active on Twitter or LinkedIn, having a blog, hosting forums or having a social media-based rating system� Note: 1� Asked of all SMBs – Small: 902� Medium: 100�
Yellow Social Media Report 2018 – Businesses.12
Main reason for using social media.
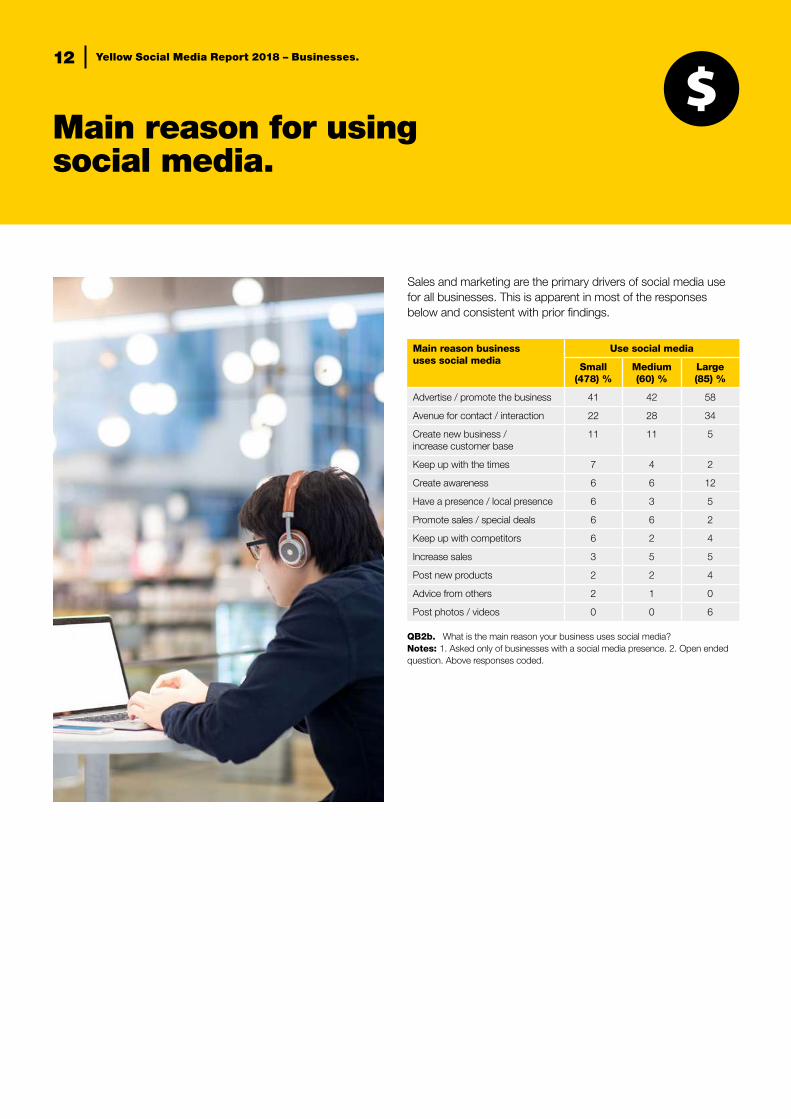
Sales and marketing are the primary drivers of social media use for all businesses� This is apparent in most of the responses below and consistent with prior findings�
QB2b. What is the main reason your business uses social media? Notes: 1� Asked only of businesses with a social media presence� 2� Open ended question� Above responses coded�
Main reason business uses social media
Use social media
Small (478) %
Medium (60) %
Large (85) %
Advertise / promote the business 41 42 58
Avenue for contact / interaction 22 28 34
Create new business / increase customer base
11 11 5
Keep up with the times 7 4 2
Create awareness 6 6 12
Have a presence / local presence 6 3 5
Promote sales / special deals 6 6 2
Keep up with competitors 6 2 4
Increase sales 3 5 5
Post new products 2 2 4
Advice from others 2 1 0
Post photos / videos 0 0 6
QB2b. What is the main reason your business uses social media? Notes: 1� Asked only of businesses with a social media presence� 2� Open ended question� Above responses coded�
Yellow Social Media Report 2018 – Businesses.13
Most frustrating aspect of using social media.
Among frustrations identified, the only double figure mentions among small, medium and large businesses are thinking of new content and constant changes� Thinking of new content was also the leading mention last year by small and medium size businesses (17% and 10% respectively in 2017 compared with 2% for large businesses)�
QB2c. And what is the most frustrating aspect of social media for your business?Notes: 1� Asked only of businesses with a social media presence� 2� Open ended question� Multiple responses allowed� Some very minor responses not shown�
Most frustrating aspect of using social media
Use social media
Small (478) %
Medium (60) %
Large (85) %
Nothing 11 8 13
Don’t know 32 29 39
Thinking of new ads / content 19 26 14
Constant changes 14 15 15
Not utilizing it to full capacity 5 0 0
Slow internet speed 4 0 1
Lack of leads / sales generated 3 2 1
Time wasters 3 0 7
Trying to reach the right people 2 1 1
Negative comments posted by others
1 9 5
Don’t understand it / how to use it 1 0 0
Yellow Social Media Report 2018 – Businesses.14
Social media uses.
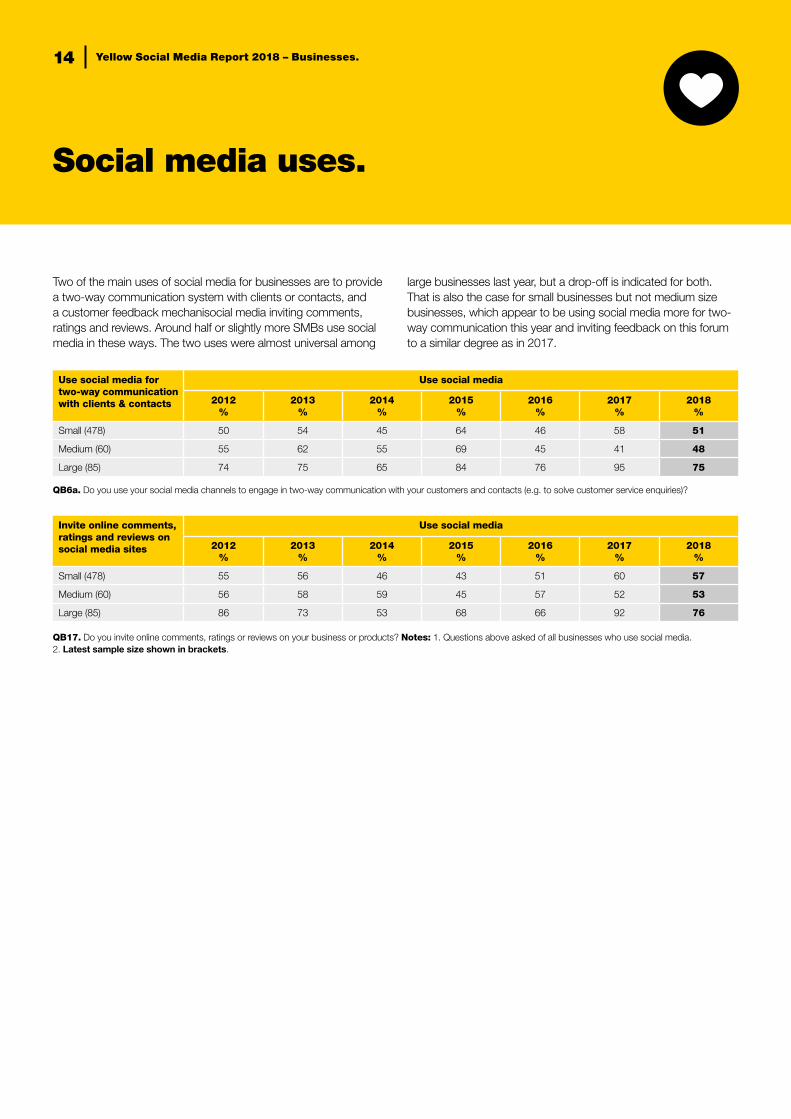
Two of the main uses of social media for businesses are to provide a two-way communication system with clients or contacts, and a customer feedback mechanisocial media inviting comments, ratings and reviews� Around half or slightly more SMBs use social media in these ways� The two uses were almost universal among
large businesses last year, but a drop-off is indicated for both� That is also the case for small businesses but not medium size businesses, which appear to be using social media more for two-way communication this year and inviting feedback on this forum to a similar degree as in 2017�
Use social media for two-way communication with clients & contacts
Use social media
2012 %
2013 %
2014 %
2015 %
2016 %
2017 %
2018 %
Small (478) 50 54 45 64 46 58 51
Medium (60) 55 62 55 69 45 41 48
Large (85) 74 75 65 84 76 95 75
Invite online comments, ratings and reviews on social media sites
Use social media
2012 %
2013 %
2014 %
2015 %
2016 %
2017 %
2018 %
Small (478) 55 56 46 43 51 60 57
Medium (60) 56 58 59 45 57 52 53
Large (85) 86 73 53 68 66 92 76
QB6a. Do you use your social media channels to engage in two-way communication with your customers and contacts (e�g� to solve customer service enquiries)?
QB17. Do you invite online comments, ratings or reviews on your business or products? Notes: 1� Questions above asked of all businesses who use social media� 2� Latest sample size shown in brackets�
Yellow Social Media Report 2018 – Businesses.15
Social media uses.
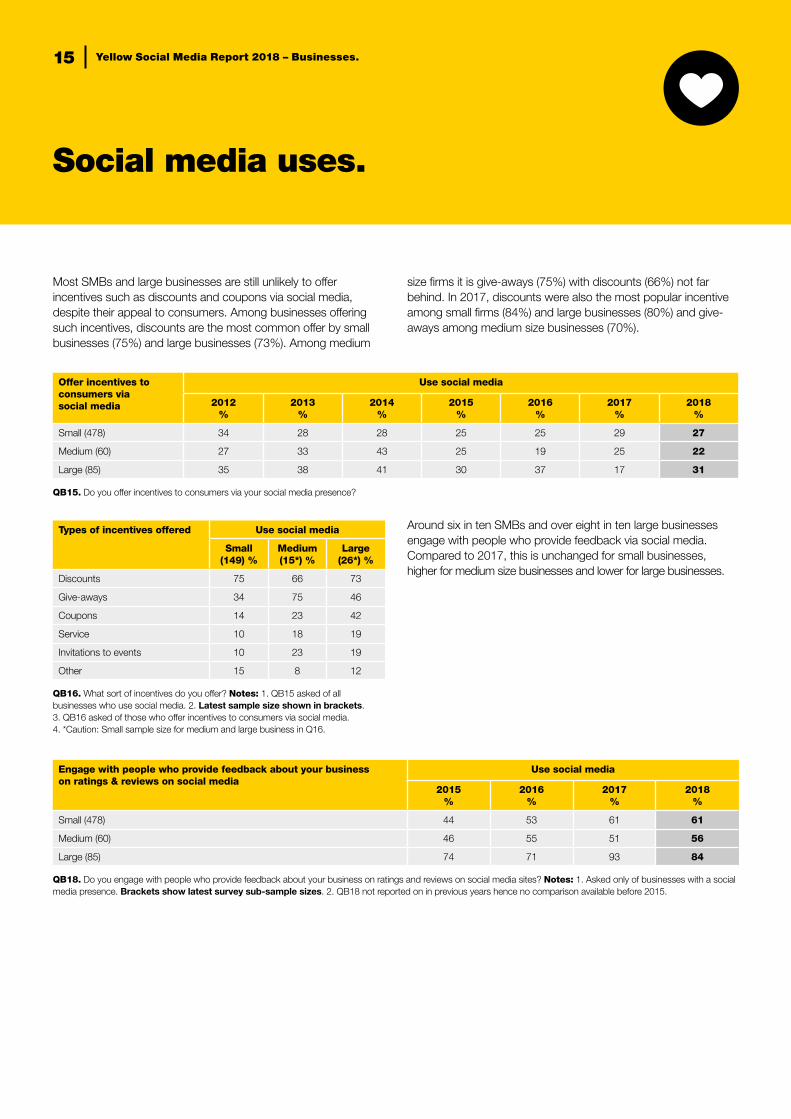
Most SMBs and large businesses are still unlikely to offer incentives such as discounts and coupons via social media, despite their appeal to consumers� Among businesses offering such incentives, discounts are the most common offer by small businesses (75%) and large businesses (73%)� Among medium
size firms it is give-aways (75%) with discounts (66%) not far behind� In 2017, discounts were also the most popular incentive among small firms (84%) and large businesses (80%) and give-aways among medium size businesses (70%)�
Around six in ten SMBs and over eight in ten large businesses engage with people who provide feedback via social media� Compared to 2017, this is unchanged for small businesses, higher for medium size businesses and lower for large businesses�
Offer incentives to consumers via social media
Use social media
2012 %
2013 %
2014 %
2015 %
2016 %
2017 %
2018 %
Small (478) 34 28 28 25 25 29 27
Medium (60) 27 33 43 25 19 25 22
Large (85) 35 38 41 30 37 17 31
Engage with people who provide feedback about your business on ratings & reviews on social media
Use social media
2015 %
2016 %
2017 %
2018 %
Small (478) 44 53 61 61
Medium (60) 46 55 51 56
Large (85) 74 71 93 84
QB15. Do you offer incentives to consumers via your social media presence?
QB18. Do you engage with people who provide feedback about your business on ratings and reviews on social media sites? Notes: 1� Asked only of businesses with a social media presence� Brackets show latest survey sub-sample sizes� 2� QB18 not reported on in previous years hence no comparison available before 2015�
QB16. What sort of incentives do you offer? Notes: 1� QB15 asked of all businesses who use social media� 2� Latest sample size shown in brackets�3� QB16 asked of those who offer incentives to consumers via social media�4� *Caution: Small sample size for medium and large business in Q16�
Types of incentives offered Use social media
Small (149) %
Medium (15*) %
Large (26*) %
Discounts 75 66 73
Give-aways 34 75 46
Coupons 14 23 42
Service 10 18 19
Invitations to events 10 23 19
Other 15 8 12
Yellow Social Media Report 2018 – Businesses.16
Advertising on social media.
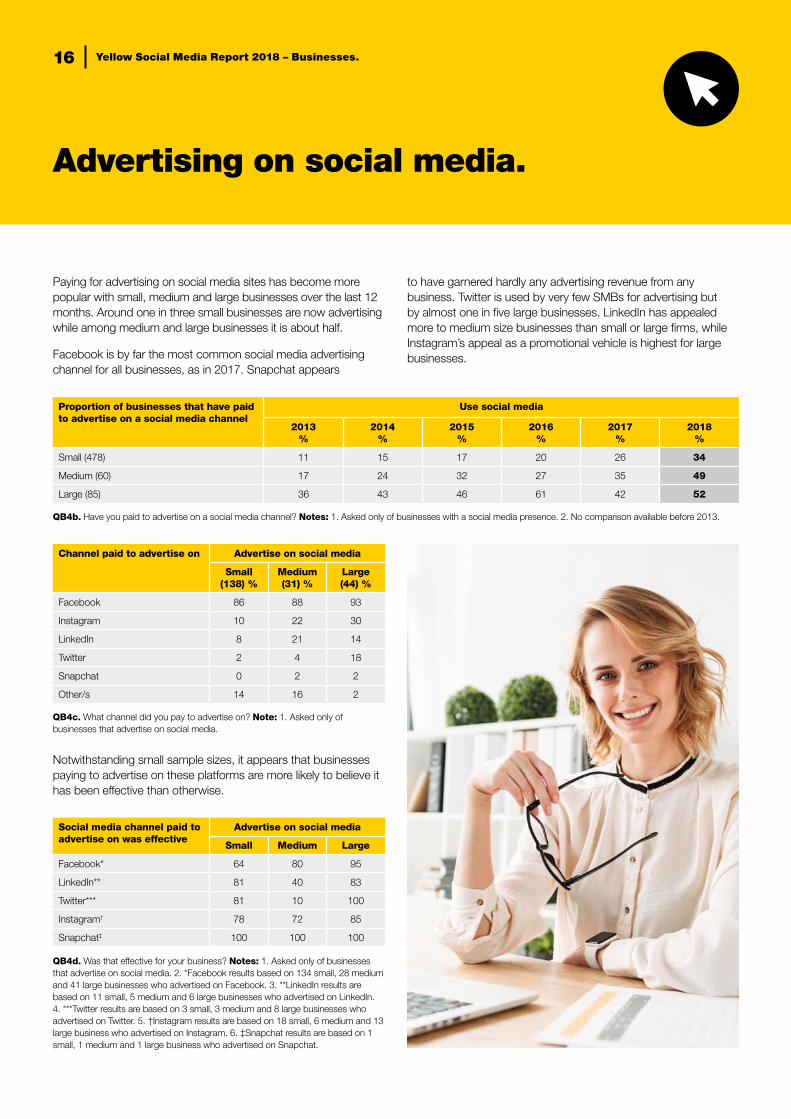
Paying for advertising on social media sites has become more popular with small, medium and large businesses over the last 12 months� Around one in three small businesses are now advertising while among medium and large businesses it is about half�
Facebook is by far the most common social media advertising channel for all businesses, as in 2017� Snapchat appears
to have garnered hardly any advertising revenue from any business� Twitter is used by very few SMBs for advertising but by almost one in five large businesses� LinkedIn has appealed more to medium size businesses than small or large firms, while Instagram’s appeal as a promotional vehicle is highest for large businesses�
Notwithstanding small sample sizes, it appears that businesses paying to advertise on these platforms are more likely to believe it has been effective than otherwise�
Proportion of businesses that have paid to advertise on a social media channel
Use social media
2013 %
2014 %
2015 %
2016 %
2017 %
2018 %
Small (478) 11 15 17 20 26 34
Medium (60) 17 24 32 27 35 49
Large (85) 36 43 46 61 42 52
QB4b. Have you paid to advertise on a social media channel? Notes: 1� Asked only of businesses with a social media presence� 2� No comparison available before 2013�
QB4c. What channel did you pay to advertise on? Note: 1� Asked only of businesses that advertise on social media�
QB4d. Was that effective for your business? Notes: 1� Asked only of businesses that advertise on social media� 2� *Facebook results based on 134 small, 28 medium and 41 large businesses who advertised on Facebook� 3� **LinkedIn results are based on 11 small, 5 medium and 6 large businesses who advertised on LinkedIn� 4� ***Twitter results are based on 3 small, 3 medium and 8 large businesses who advertised on Twitter� 5� †Instagram results are based on 18 small, 6 medium and 13 large business who advertised on Instagram� 6� ‡Snapchat results are based on 1 small, 1 medium and 1 large business who advertised on Snapchat�
Channel paid to advertise on Advertise on social media
Small (138) %
Medium (31) %
Large (44) %
Facebook 86 88 93
Instagram 10 22 30
LinkedIn 8 21 14
Twitter 2 4 18
Snapchat 0 2 2
Other/s 14 16 2
Social media channel paid to advertise on was effective
Advertise on social media
Small Medium Large
Facebook* 64 80 95
LinkedIn** 81 40 83
Twitter*** 81 10 100
Instagram† 78 72 85
Snapchat‡ 100 100 100

Yellow Social Media Report 2018 – Businesses.17
Who is responsible for a business’ social media presence?
More than 90% of SMBs and large businesses manage their social media internally, which was also the case last year� Outsourcing is used by 16% of small businesses, 9% of medium size businesses
and 11% of large firms� Where outsourcing of social media management occurs, businesses are most likely to engage specialists in the digital, social media or communications space�
In small businesses, the owner or manager remains far more likely to take responsibility for social media accounts than others� In medium and large businesses, the marketing department
continues to perform this role more than other units� However, in more than one third of medium size businesses the business owner or manager has responsibility for social media�
QB7a. Is your social media managed internally or outsourced? Notes: 1� Asked only of businesses with a social media presence�
QB8. Which area of your business has overall responsibility for your social media presence? Notes: 1� Asked only of businesses with a social media presence�
QB8. What type of external firm is it outsourced to? Notes: 1� Asked only of businesses who outsource their social media� 2� *Caution: Small sub-sample size�
Is your social media Use social media
Small (478) %
Medium (60) %
Large (85) %
Managed internally 84 91 89
Outsourced 9 2 1
A combination of internal and outsourced
7 7 10
Is your social media outsourced to
Outsource social media
Small (67) %
Medium (5*) %
Large (9*) %
Digital or web or internet agency 34 18 44
Specialist social media agency 31 0 22
PR or communications or media agency
11 60 22
Other 28 22 12
Responsible in small business
Use social media
2011 %
2012 %
2013 %
2014 %
2015 %
2016 %
2017 %
2018 %
Owner or manager 82 79 72 76 78 66 70 72
Marketing department 10 10 11 12 15 22 17 19
Communications dept� 2 3 4 4 2 5 3 4
IT department 2 5 10 6 3 5 7 3
External firm 4 3 3 2 2 3 2 1
Responsible in medium business
Marketing department 52 44 43 56 63 58 51 47
Owner or manager 36 36 40 25 23 18 24 38
Communications dept� 0 8 8 9 1 13 15 12
IT department 6 13 7 8 9 11 6 3
External firm 6 0 3 2 3 0 3 0
Responsible in large business
Marketing department 74 64 66 77 61 53 85 73
Owner or manager 17 10 8 4 7 8 10 16
Communications dept� 0 17 10 13 30 33 2 7
IT department 0 5 3 4 2 6 3 4
External firm 1 0 3 2 0 0 0 0
Yellow Social Media Report 2018 – Businesses.18
How often do businesses update their social media?
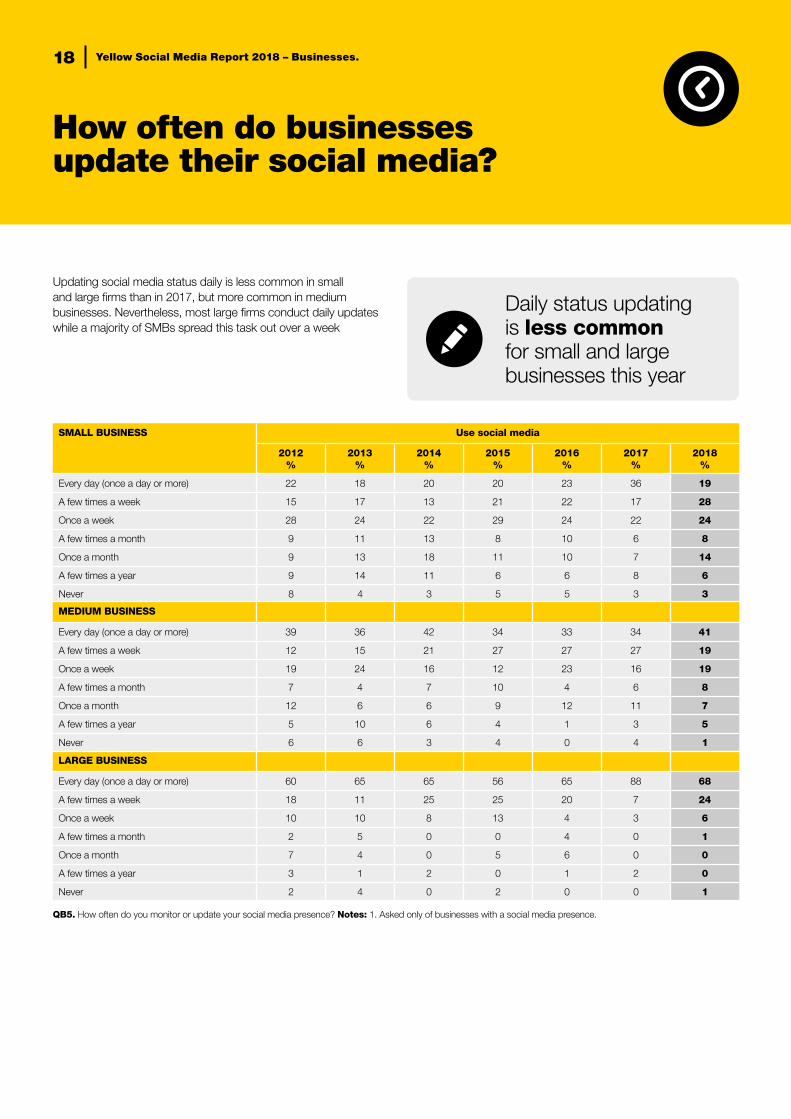
Updating social media status daily is less common in small and large firms than in 2017, but more common in medium businesses� Nevertheless, most large firms conduct daily updates while a majority of SMBs spread this task out over a week
QB5. How often do you monitor or update your social media presence? Notes: 1� Asked only of businesses with a social media presence�
SMALL BUSINESS Use social media
2012 %
2013 %
2014 %
2015 %
2016 %
2017 %
2018 %
Every day (once a day or more) 22 18 20 20 23 36 19
A few times a week 15 17 13 21 22 17 28
Once a week 28 24 22 29 24 22 24
A few times a month 9 11 13 8 10 6 8
Once a month 9 13 18 11 10 7 14
A few times a year 9 14 11 6 6 8 6
Never 8 4 3 5 5 3 3
MEDIUM BUSINESS
Every day (once a day or more) 39 36 42 34 33 34 41
A few times a week 12 15 21 27 27 27 19
Once a week 19 24 16 12 23 16 19
A few times a month 7 4 7 10 4 6 8
Once a month 12 6 6 9 12 11 7
A few times a year 5 10 6 4 1 3 5
Never 6 6 3 4 0 4 1
LARGE BUSINESS
Every day (once a day or more) 60 65 65 56 65 88 68
A few times a week 18 11 25 25 20 7 24
Once a week 10 10 8 13 4 3 6
A few times a month 2 5 0 0 4 0 1
Once a month 7 4 0 5 6 0 0
A few times a year 3 1 2 0 1 2 0
Never 2 4 0 2 0 0 1
Daily status updating is less common for small and large businesses this year
Yellow Social Media Report 2018 – Businesses.19
How is traffic driven to a business’ social media presence?
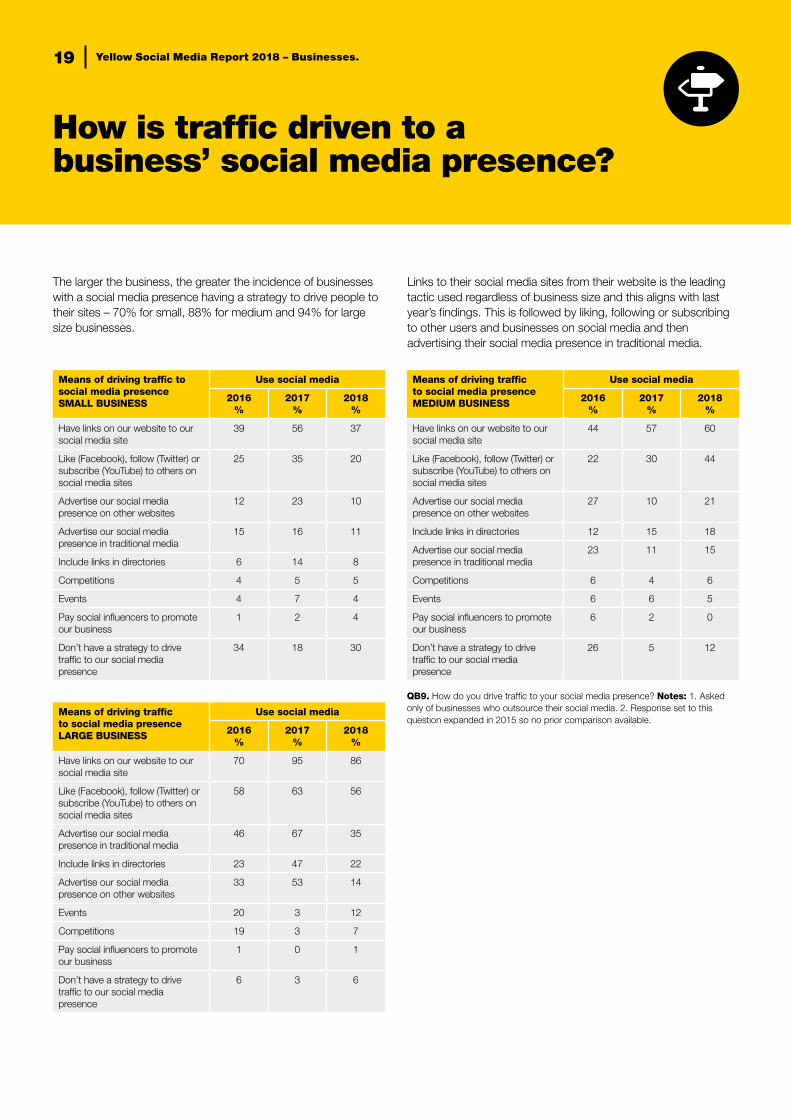
The larger the business, the greater the incidence of businesses with a social media presence having a strategy to drive people to their sites – 70% for small, 88% for medium and 94% for large size businesses�
Links to their social media sites from their website is the leading tactic used regardless of business size and this aligns with last year’s findings� This is followed by liking, following or subscribing to other users and businesses on social media and then advertising their social media presence in traditional media�
Means of driving traffic to social media presence SMALL BUSINESS
Use social media
2016 %
2017 %
2018 %
Have links on our website to our social media site
39 56 37
Like (Facebook), follow (Twitter) or subscribe (YouTube) to others on social media sites
25 35 20
Advertise our social media presence on other websites
12 23 10
Advertise our social media presence in traditional media
15 16 11
Include links in directories 6 14 8
Competitions 4 5 5
Events 4 7 4
Pay social influencers to promote our business
1 2 4
Don’t have a strategy to drive traffic to our social media presence
34 18 30
Means of driving traffic to social media presence LARGE BUSINESS
Use social media
2016 %
2017 %
2018 %
Have links on our website to our social media site
70 95 86
Like (Facebook), follow (Twitter) or subscribe (YouTube) to others on social media sites
58 63 56
Advertise our social media presence in traditional media
46 67 35
Include links in directories 23 47 22
Advertise our social media presence on other websites
33 53 14
Events 20 3 12
Competitions 19 3 7
Pay social influencers to promote our business
1 0 1
Don’t have a strategy to drive traffic to our social media presence
6 3 6
Means of driving traffic to social media presence MEDIUM BUSINESS
Use social media
2016 %
2017 %
2018 %
Have links on our website to our social media site
44 57 60
Like (Facebook), follow (Twitter) or subscribe (YouTube) to others on social media sites
22 30 44
Advertise our social media presence on other websites
27 10 21
Include links in directories 12 15 18
Advertise our social media presence in traditional media
23 11 15
Competitions 6 4 6
Events 6 6 5
Pay social influencers to promote our business
6 2 0
Don’t have a strategy to drive traffic to our social media presence
26 5 12
QB9. How do you drive traffic to your social media presence? Notes: 1� Asked only of businesses who outsource their social media� 2� Response set to this question expanded in 2015 so no prior comparison available�
Yellow Social Media Report 2018 – Businesses.20
Business investment in social media.
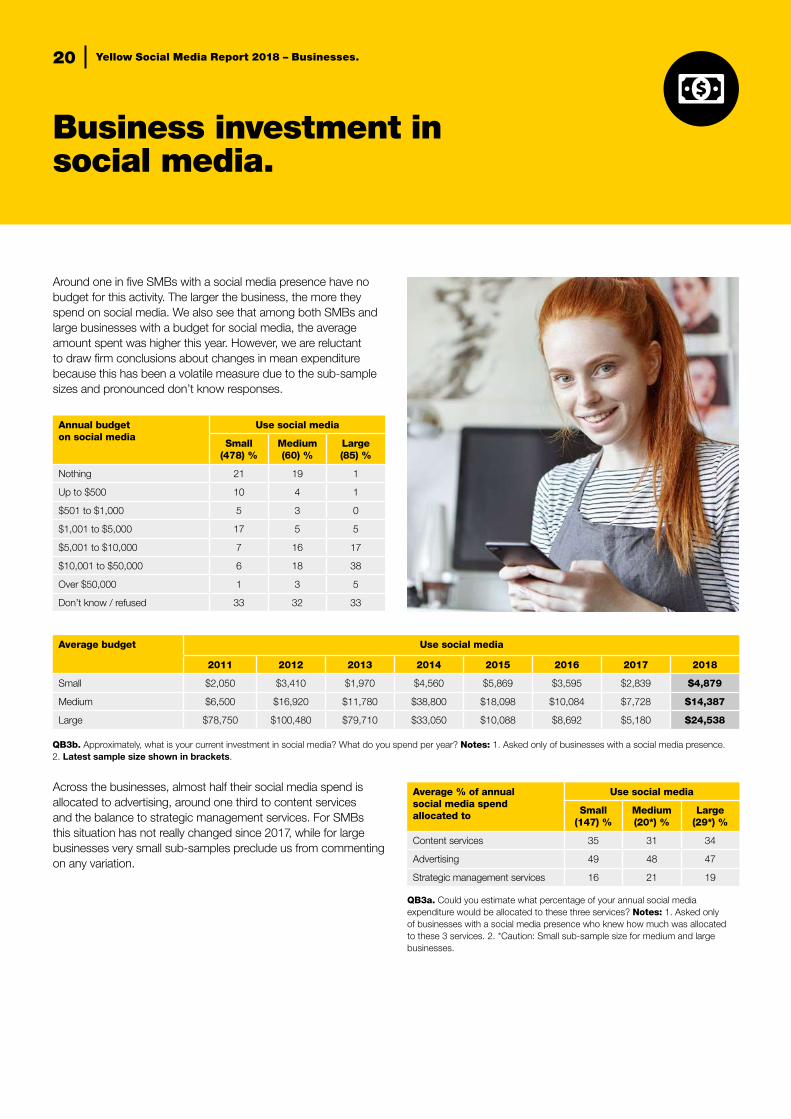
Around one in five SMBs with a social media presence have no budget for this activity� The larger the business, the more they spend on social media� We also see that among both SMBs and large businesses with a budget for social media, the average amount spent was higher this year� However, we are reluctant to draw firm conclusions about changes in mean expenditure because this has been a volatile measure due to the sub-sample sizes and pronounced don’t know responses�
Across the businesses, almost half their social media spend is allocated to advertising, around one third to content services and the balance to strategic management services� For SMBs this situation has not really changed since 2017, while for large businesses very small sub-samples preclude us from commenting on any variation�
Annual budget on social media
Use social media
Small (478) %
Medium (60) %
Large (85) %
Nothing 21 19 1
Up to $500 10 4 1
$501 to $1,000 5 3 0
$1,001 to $5,000 17 5 5
$5,001 to $10,000 7 16 17
$10,001 to $50,000 6 18 38
Over $50,000 1 3 5
Don’t know / refused 33 32 33
Average % of annual social media spend allocated to
Use social media
Small (147) %
Medium (20*) %
Large (29*) %
Content services 35 31 34
Advertising 49 48 47
Strategic management services 16 21 19
QB3a. Could you estimate what percentage of your annual social media expenditure would be allocated to these three services? Notes: 1� Asked only of businesses with a social media presence who knew how much was allocated to these 3 services� 2� *Caution: Small sub-sample size for medium and large businesses�
QB3b. Approximately, what is your current investment in social media? What do you spend per year? Notes: 1� Asked only of businesses with a social media presence� 2� Latest sample size shown in brackets�
Average budget Use social media
2011 2012 2013 2014 2015 2016 2017 2018
Small $2,050 $3,410 $1,970 $4,560 $5,869 $3,595 $2,839 $4,879
Medium $6,500 $16,920 $11,780 $38,800 $18,098 $10,084 $7,728 $14,387
Large $78,750 $100,480 $79,710 $33,050 $10,088 $8,692 $5,180 $24,538
Yellow Social Media Report 2018 – Businesses.21
Percentage of marketing budget allocated to social media.
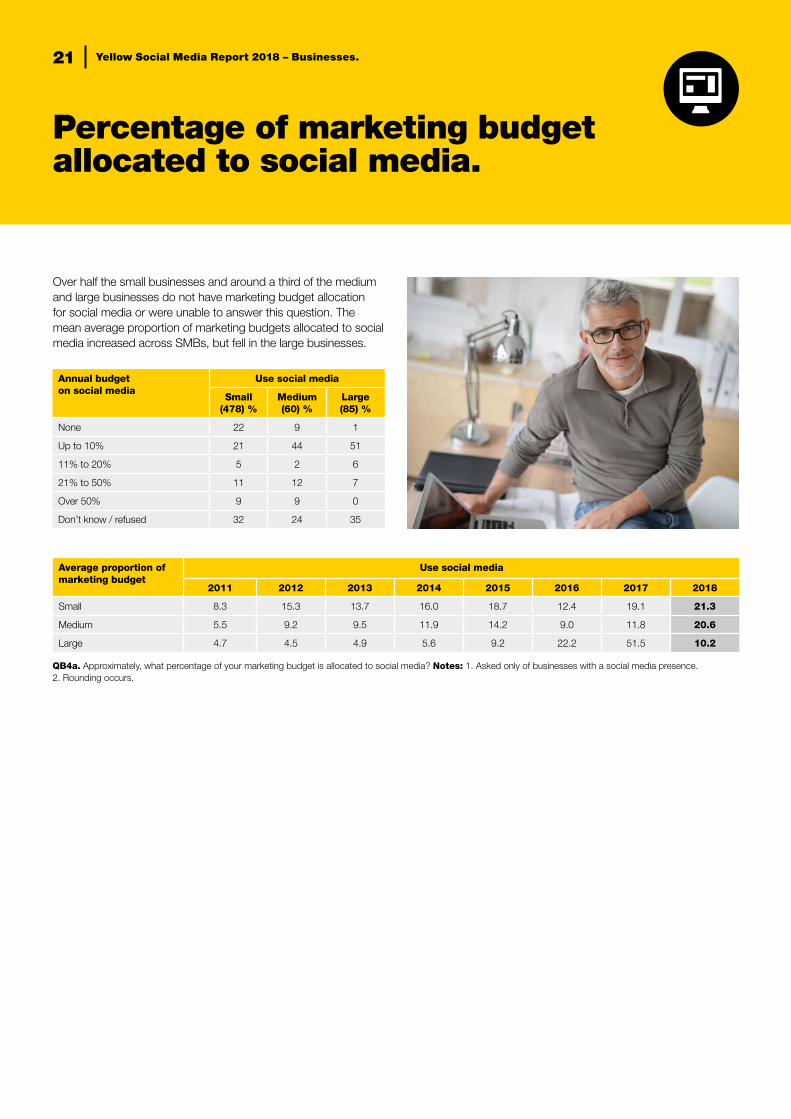
Over half the small businesses and around a third of the medium and large businesses do not have marketing budget allocation for social media or were unable to answer this question� The mean average proportion of marketing budgets allocated to social media increased across SMBs, but fell in the large businesses�
Annual budget on social media
Use social media
Small (478) %
Medium (60) %
Large (85) %
None 22 9 1
Up to 10% 21 44 51
11% to 20% 5 2 6
21% to 50% 11 12 7
Over 50% 9 9 0
Don’t know / refused 32 24 35
QB4a. Approximately, what percentage of your marketing budget is allocated to social media? Notes: 1� Asked only of businesses with a social media presence�2� Rounding occurs�
Average proportion of marketing budget
Use social media
2011 2012 2013 2014 2015 2016 2017 2018
Small 8�3 15�3 13�7 16�0 18�7 12�4 19�1 21.3
Medium 5�5 9�2 9�5 11�9 14�2 9�0 11�8 20.6
Large 4�7 4�5 4�9 5�6 9�2 22�2 51�5 10.2
Yellow Social Media Report 2018 – Businesses.22
How businesses measure success of their social media investment.
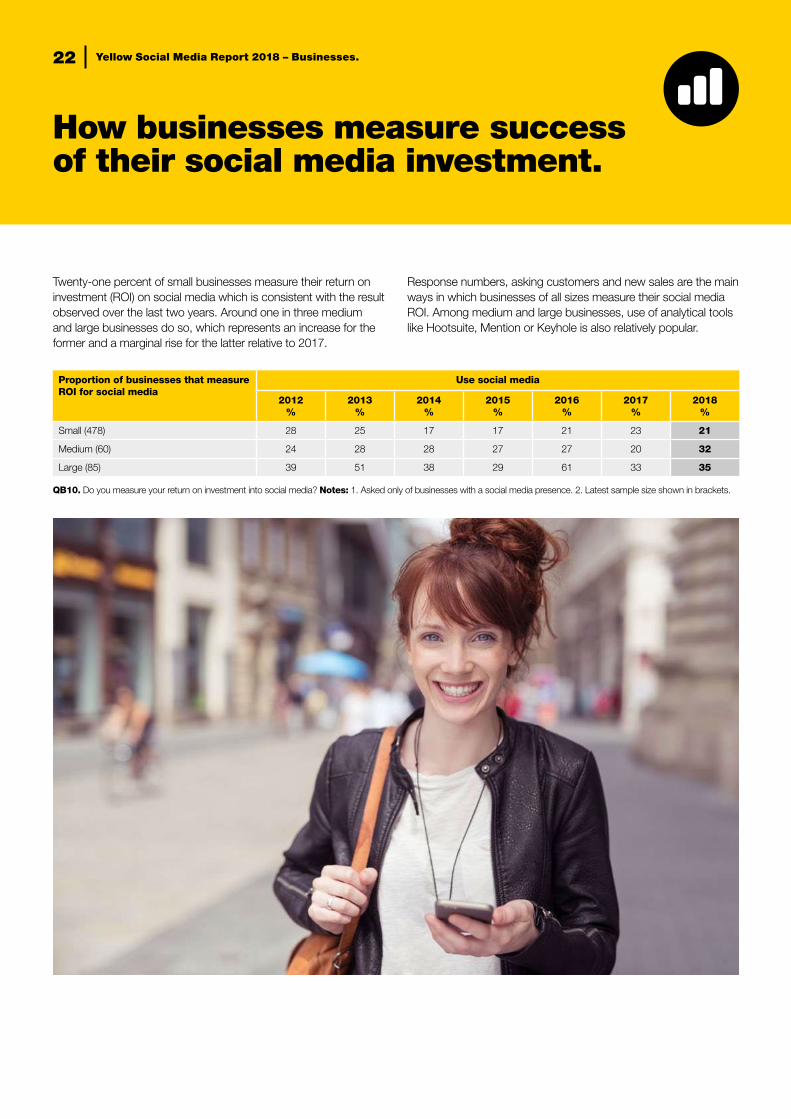
Twenty-one percent of small businesses measure their return on investment (ROI) on social media which is consistent with the result observed over the last two years� Around one in three medium and large businesses do so, which represents an increase for the former and a marginal rise for the latter relative to 2017�
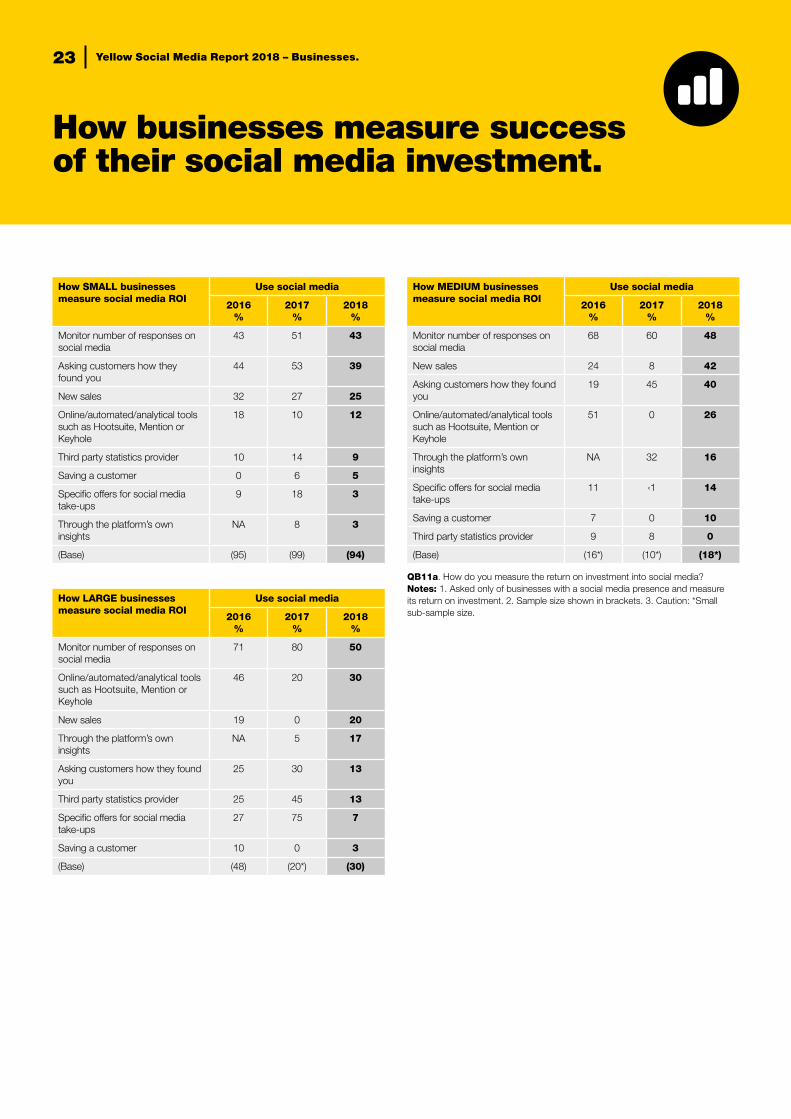
Response numbers, asking customers and new sales are the main ways in which businesses of all sizes measure their social media ROI� Among medium and large businesses, use of analytical tools like Hootsuite, Mention or Keyhole is also relatively popular�
Proportion of businesses that measure ROI for social media
Use social media
2012 %
2013 %
2014 %
2015 %
2016 %
2017 %
2018 %
Small (478) 28 25 17 17 21 23 21
Medium (60) 24 28 28 27 27 20 32
Large (85) 39 51 38 29 61 33 35
QB10. Do you measure your return on investment into social media? Notes: 1� Asked only of businesses with a social media presence� 2� Latest sample size shown in brackets�
Yellow Social Media Report 2018 – Businesses.23
How businesses measure success of their social media investment.
How SMALL businesses measure social media ROI
Use social media
2016 %
2017 %
2018 %
Monitor number of responses on social media
43 51 43
Asking customers how they found you
44 53 39
New sales 32 27 25
Online/automated/analytical tools such as Hootsuite, Mention or Keyhole
18 10 12
Third party statistics provider 10 14 9
Saving a customer 0 6 5
Specific offers for social media take-ups
9 18 3
Through the platform’s own insights
NA 8 3
(Base) (95) (99) (94)
How LARGE businesses measure social media ROI
Use social media
2016 %
2017 %
2018 %
Monitor number of responses on social media
71 80 50
Online/automated/analytical tools such as Hootsuite, Mention or Keyhole
46 20 30
New sales 19 0 20
Through the platform’s own insights
NA 5 17
Asking customers how they found you
25 30 13
Third party statistics provider 25 45 13
Specific offers for social media take-ups
27 75 7
Saving a customer 10 0 3
(Base) (48) (20*) (30)
How MEDIUM businesses measure social media ROI
Use social media
2016 %
2017 %
2018 %
Monitor number of responses on social media
68 60 48
New sales 24 8 42
Asking customers how they found you
19 45 40
Online/automated/analytical tools such as Hootsuite, Mention or Keyhole
51 0 26
Through the platform’s own insights
NA 32 16
Specific offers for social media take-ups
11 ‹1 14
Saving a customer 7 0 10
Third party statistics provider 9 8 0
(Base) (16*) (10*) (18*)
QB11a� How do you measure the return on investment into social media? Notes: 1� Asked only of businesses with a social media presence and measure its return on investment� 2� Sample size shown in brackets� 3� Caution: *Small sub-sample size�
Yellow Social Media Report 2018 – Businesses.24
How businesses measure success of their social media investment.
Return on social media investment – SMALL business
Measure social media ROI
2016 %
2017 %
2018 %
Have not yet recovered investment 24 22 13
Under 5% 11 10 8
6% to 10% 8 8 10
11% to 20% 4 14 17
21% to 50% 9 6 16
Over 50% 14 13 7
Don’t know 30 27 29
Mean 28 26 24
(Base) (95) (99) (94)
Return on social media investment – LARGE business*
Measure social media ROI
2016 %
2017 %
2018 %
Have not yet recovered investment 0 0 7
Under 5% 4 0 0
6% to 10% 8 10 10
11% to 20% 6 15 0
21% to 50% 13 10 3
Over 50% 31 0 3
Don’t know 38 65 77
Mean 40 19 24
(Base) (48) (20)* (30)
Return on social media investment – MEDIUM business*
Measure social media ROI
2016 %
2017 %
2018 %
Have not yet recovered investment 13 16 1
Under 5% 24 25 11
6% to 10% 8 8 0
11% to 20% 0 0 30
21% to 50% 0 13 17
Over 50% 7 0 0
Don’t know 48 38 41
Mean 13 13 19
(Base) (16)* (10)* (18)*
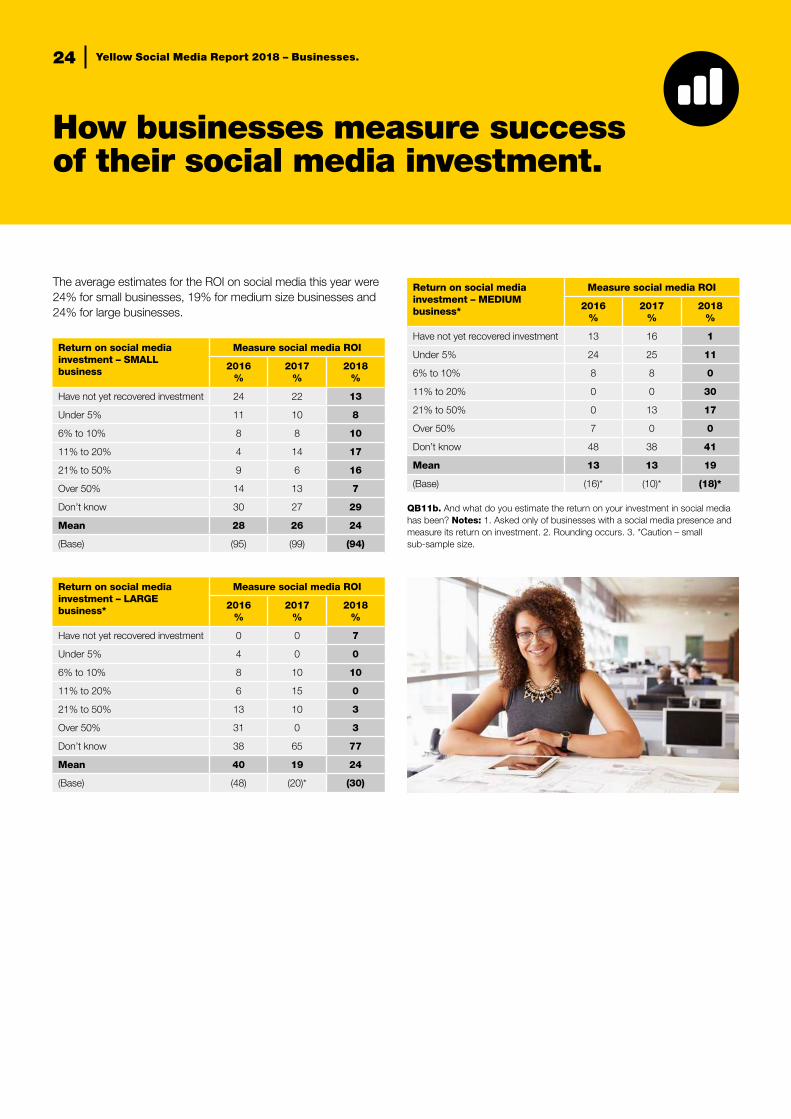
QB11b. And what do you estimate the return on your investment in social media has been? Notes: 1� Asked only of businesses with a social media presence and measure its return on investment� 2� Rounding occurs� 3� *Caution – small sub-sample size�
The average estimates for the ROI on social media this year were 24% for small businesses, 19% for medium size businesses and 24% for large businesses�
Yellow Social Media Report 2018 – Businesses.25
How businesses measure success of their social media investment.
How SMALL businesses measure the success of their social media
Measure social media ROI
2016 %
2017 %
2018 %
Number of likes, followers and subscribers
61 52 53
Sales, revenue and profits 42 61 36
Positive conversations on social media
19 17 7
Usage 4 17 6
Take up of incentives and offers 15 12 3
(Base) (95) (99) (94)
How MEDIUM business measure the success of their social media
Measure social media ROI
2016 %
2017 %
2018 %
Number of likes, followers and subscribers
52 43 45
Positive conversations on social media
2 0 40
Sales, revenue and profits 45 26 34
Usage 27 25 0
Take up of incentives and offers 20 3 0
(Base) (16*) (10*) (18*)
How LARGE businesses measure the success of their social media
Measure social media ROI
2016 %
2017 %
2018 %
Number of likes, followers and subscribers
75 95 47
Positive conversations on social media
33 0 30
Sales, revenue and profits 29 65 27
Usage 19 65 13
Brand sentiment 4 5 7
Klout score 4 0 3
Take up of incentives and offers 21 35 0
(Base) (48) (20*) (30)
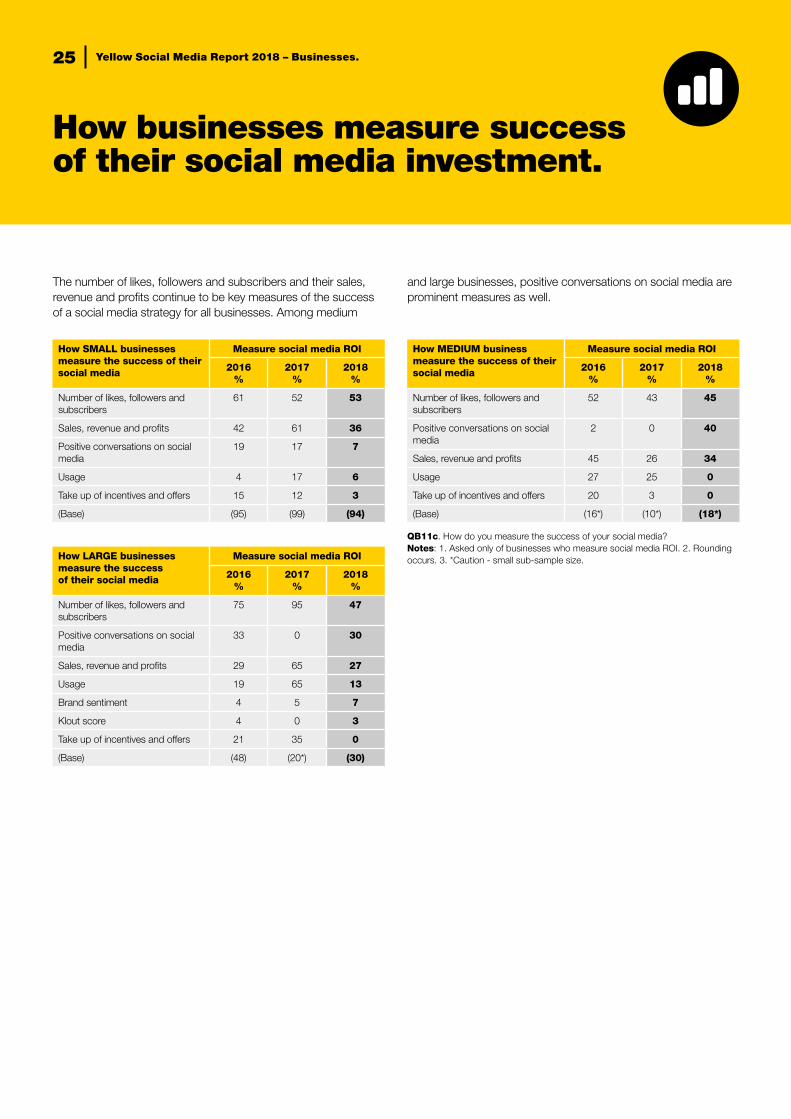
QB11c� How do you measure the success of your social media? Notes: 1� Asked only of businesses who measure social media ROI� 2� Rounding occurs� 3� *Caution - small sub-sample size�
The number of likes, followers and subscribers and their sales, revenue and profits continue to be key measures of the success of a social media strategy for all businesses� Among medium
and large businesses, positive conversations on social media are prominent measures as well�
Yellow Social Media Report 2018 – Businesses.26
Do businesses have a strategic plan for social media?
Developed strategic plan in your business for social media Use social media
2015 %
2016 %
2017 %
2018 %
Small (521) 19 31 40 30
Medium (62) 39 36 43 45
Large (89) 63 76 90 80
QB19. And have you developed a strategic plan in your business for your social media? Notes: 1� Asked only of businesses with a social media presence or planning to get one in next year� 2� Sample size for 2018 shown in brackets�
Having a social media strategy remains correlated with business size� We have observed over the past four years that a minority
of small businesses, a larger minority of medium businesses and most large firms have a social media strategy�
Yellow Social Media Report 2018 – Businesses.27
Expectations for the next 12 months.
As in 2016 and 2017, few businesses intend to spend less on social media in the year ahead�
Among SMBs expecting to spend more on social media in the coming year, most will not fund that by decreasing their expenditure in other marketing or advertising activities� Conversely, for those large businesses anticipating increased spend on social media, a majority stated that other forms of marketing and advertising would be sacrificed
Expectations for social media expenditure
Use social media
Small (478) %
Medium (60) %
Large (85) %
Spend more than last 12 months 25 35 28
Spend the same 53 41 51
Spend less 7 5 5
Net Balance* +18 +30 +23
Don’t know / refused 15 19 16
Extra social media spending likely to be funded by reduced spending on other marketing or advertising
Expect to spend more on Social media in next year
Small (112) %
Medium (20*) %
Large (24*) %
Yes 35 13 63
No 54 66 6
Don’t know 11 21 13
*Net balance of expectations for social media expenditure
Use social media
2016 2017 2018
Small +23 +18 +18
Medium +27 +37 +30
Large +48 +22 +23
QB12a. Thinking about your total planned investment in social media for the next 12 months, are you planning to…? Notes: 1� Asked only of businesses with a social media presence� 2� *Net balance = those expecting to spend more minus those expecting to spend less� 3� Question not reported on in previous years hence no comparison available prior to 2016�
QB12B. We note the intention to spend more on social media over the next year� Is that extra spending on social media next year likely to be funded by reducing any spending on other forms of marketing or advertising? Notes: 1� Asked only of businesses with a social media presence expecting to spend more on it in the next year� 2� New question asked in 2018 hence no comparison available� 3� *Caution – small sub-sample size�
Yellow Social Media Report 2018 – Businesses.28
Expectations for the next 12 months.
A reduction in print advertising expenditure appears to be the most likely means of funding increased social media spend in the coming year�
Just over six in ten SMBs and large businesses believe their social media investment will contribute to higher sales in the next year� The average expected increase is 11% for small businesses, 15% for medium businesses and 16% for large businesses� These expectations are lower for small and large businesses but higher for medium businesses relative to last year�
Areas expect to reduce spending over next 12 months to allow for increased spending on social media
Expect to spend more on social media in next year and funds sourced from marketing /ad
budgets
Small (38) %
Medium (4*) %
Large (15*) %
Print advertising 67 59 80
Digital display advertising 8 41 0
Google advertising 6 0 0
TV advertising 4 0 13
Radio advertising 3 0 20
SEO (Search Engine Optimisation) 0 0 7
Email marketing 0 0 0
Other areas 18 0 7
Don’t know 9 0 0
Yes, believe social media investment will contribute to increased sales?
Use social media
2017 %
2018 %
Small (521) 53 61
Medium (62) 73 64
Large (89) 40 61
QB12C� And in which area or areas do you expect to reduce spending over the next 12 months to allow for the increased spending on social media? Would you reduce spending on …? Notes: 1� Asked only of businesses with a social media presence expecting to spend more on it in the next year and those funds are sourced from other forms of marketing / advertising� 2� New question asked in 2018 hence no comparison available� 3� *Caution – small sub-sample�
QB13. Do you believe that your social media investment will contribute to an increase in sales in the next 12 months? QB14. By approximately how much?Notes: 1� Asked only of businesses with a social media presence or intending to get one in the next year� 2� Brackets show latest sub-sample sizes�
Average expected % increase Expect increased sales from social media
2012 %
2013 %
2014 %
2015 %
2016 %
2017 %
2018 %
Small (309) 17% 12% 18% 15% 16% 17% 11%
Medium (38) 6% 12% 6% 10% 9% 9% 15%
Large (54) 8% 9% 9% 9% 30% 30% 16%
29 Yellow Social Media Report 2018 – Businesses.
About Yellow.
Yellow is the champion of Australian small and medium businesses� Its brands include Yellow Pages, True Local, WhereIs, Found Digital, Bridge, and Pocket Office� Yellow also provides an extensive range of digital marketing services including search engine marketing, search engine optimisation, digital display, websites and social media services for all business types� Yellow is a division of Sensis – Australia’s leading marketing services company� Other Sensis brands include White Pages, Sensis Data Solutions and Skip�
This year, the Yellow Social Media Report has been released in two parts, with this edition focusing on the results of the business survey� Part One of the report features consumer survey results�
YellowTM 222 Lonsdale Street Melbourne Vic 3000 Ph: 1800 359 321yellow�com�au
A Sensis Company ABN: 30007423912
Published June 2018 See Part One of the Yellow Social Meda Report 2018 - Consumer